Embed Size (px)
Citation preview
Rototest Research Institute Public report, June 2009
Powertrain Performance Assessment, PPA
Porsche GT3 Cup 2009
Jonny Färnlund & Nils G Engström Rototest Researche Institute Salemsvägen 20 144 40 Rönninge Sverige tel +46 8 532 558 90 fax +46 8 532 527 40 [email protected], www.rri.se DokumentID RRI-rep-J09050601-PPA-Porsche.doc Free non-commercial downloads: Except otherwise indicated elsewhere on www.rri.se, any person is hereby authorised to view, copy, download, store, print or distribute anything on this site or obtained through it, but subject to the following conditions: The document may be used for informational purposes only. The document may only be used for non commercial, non profit purposes. The document may not be altered in any way, and must be complete. The document may not be copied to, or made available through, a web site. All other use is strictly prohibited.
®

Copyrights © Rototest Research Institute, 2009, all rights reserved, www.rri.se 2/21
Table of content
Table of content .............................................................................................................................. 2 Summary .......................................................................................................................................... 3 Background ...................................................................................................................................... 4 Powertrain specification ............................................................................................................... 5
Engine ........................................................................................................................................... 5 Transmission ................................................................................................................................ 5 Racing company and car owner ................................................................................................ 6 Driver ............................................................................................................................................ 6
Test equipment and test procedure ............................................................................................ 7 Test equipment overview ........................................................................................................... 7 Chassis dynamometer description ............................................................................................ 7 Special characteristics ................................................................................................................. 8 Data acquisition equipment ....................................................................................................... 8
Measurements ................................................................................................................................. 9 Results ............................................................................................................................................ 10
Steady State ................................................................................................................................ 10 Steady Rate ................................................................................................................................. 11 Powertrain Inertia and its effects ............................................................................................ 13 Acceleration Performance ........................................................................................................ 14
Appendix A – Fuel specification .......................................................................................... 1 page Appendix B – Steady State graphs ................................................................................... 2 pages Appendix C – Steady Rate graphs ..................................................................................... 3 pages

Copyrights © Rototest Research Institute, 2009, all rights reserved, www.rri.se 3/21
Summary
A Powertrain Performance Assessment, PPA, has been made on a Porsche 911 GT3 on behalf of Flash Engineering. The car is a 2009 model and recently delivered from Porsche. Tests were performed at 30 March 2009 on a ROTOTEST VPA-RX8 2WD chassis dynamometer which is of a hub-connected type. Compared to an engine dynamometer the engine performance is reduced with drivetrain losses. It is of course important to have a powerful engine but from the drivers’ point of view, it is the power available to the wheels that the driver can make use of. All tests have been run in 5th gear and started with a Steady State test at every 500 rpm beginning from 2000 rpm. Maximum performance numbers are 386.4 Nm of torque and 410.2 PS of power. Compared to the stated factory numbers of 410 Nm and 420 PS there is a difference of 5.8% and 2.3% respectively. The torque difference is in the expected range whereas the power difference indicates slightly more engine power than stated. The car has also been subjected to tests at Steady Rate. This means measurements during controlled accelerations. 4 rates have been tested; 300, 500, 700 and 1000 rpm/s. During accelerations some of the engine power is used solely to accelerate the inertia of the powertrain. This loss is increasing with the rate of acceleration. An estimation of the Powertrain Inertia shows a value of 0.16 kgm2 which equals having an extra weight of 222 kg in 1st gear. The actual value of Powertrain Inertia is relatively low considering the size of the engine. Compensating for the estimated inertia show that the engine is producing approximately 10 Nm and 5 PS more during acceleration compared to Steady State. This may be related to less tendency to knock during acceleration. In any case it clearly shows a performance potential that would have been missed if the mapping had only included static conditions. Especially for a race car the improvements can be considered to be large. From the drivers standpoint it can very well be the difference between winning or loosing.

Copyrights © Rototest Research Institute, 2009, all rights reserved, www.rri.se 4/21
Background
Quality assurance in racing is becoming more and more important for professional racing teams and demanding racing drivers. Hard facts and proof of the powertrain performance is today a must in the struggle for victories. With this report Rototest Research Institute hopes to explain some of the questions around "engine power" and show some examples of information a Powertrain Performance Assessment, PPA, can give. The traditionally used Steady State tests will only tell a small part of the race car performance. In some cases it may even lead to false assumptions.
Image Courtesy of Andretti Green Racing, ROTOTEST VPA-RX test set-up, Indianapolis USA 2009
Copyrights © Rototest Research Institute, 2009, all rights reserved, www.rri.se 5/21
Powertrain specification
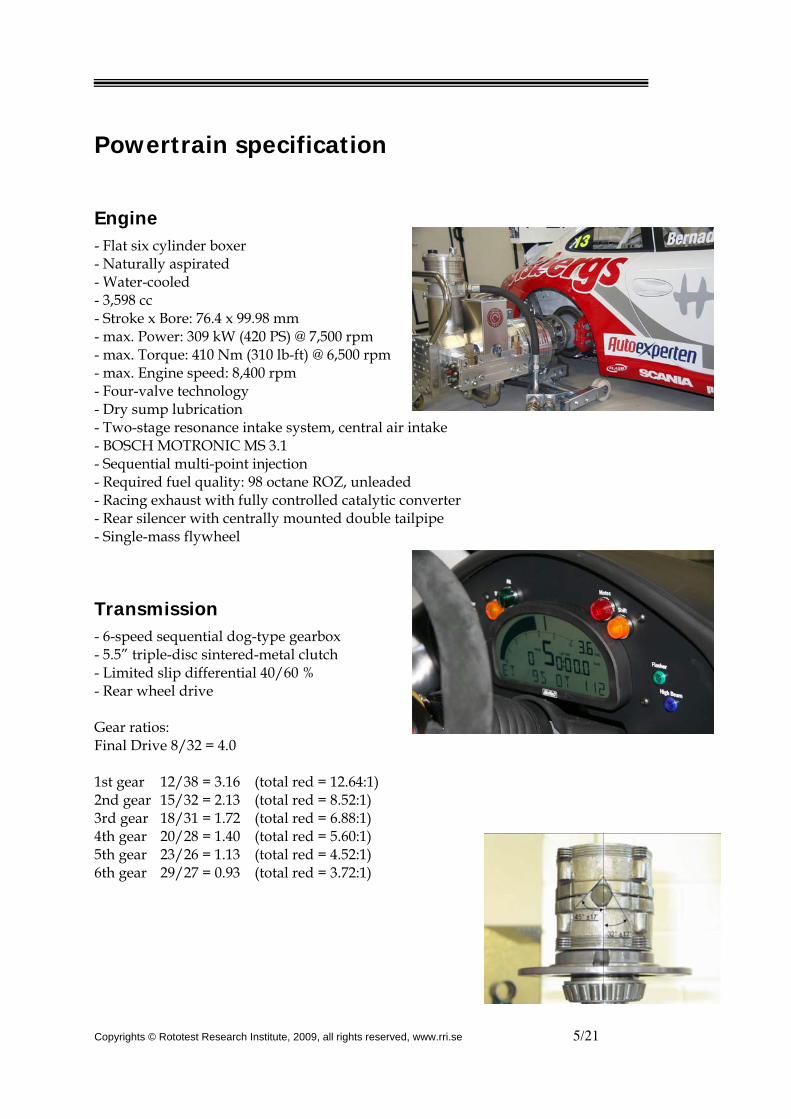
Engine - Flat six cylinder boxer - Naturally aspirated - Water-cooled - 3,598 cc - Stroke x Bore: 76.4 x 99.98 mm - max. Power: 309 kW (420 PS) @ 7,500 rpm - max. Torque: 410 Nm (310 lb-ft) @ 6,500 rpm - max. Engine speed: 8,400 rpm - Four-valve technology - Dry sump lubrication - Two-stage resonance intake system, central air intake - BOSCH MOTRONIC MS 3.1 - Sequential multi-point injection - Required fuel quality: 98 octane ROZ, unleaded - Racing exhaust with fully controlled catalytic converter - Rear silencer with centrally mounted double tailpipe - Single-mass flywheel
Transmission - 6-speed sequential dog-type gearbox - 5.5” triple-disc sintered-metal clutch - Limited slip differential 40/60 % - Rear wheel drive Gear ratios: Final Drive 8/32 = 4.0 1st gear 12/38 = 3.16 (total red = 12.64:1) 2nd gear 15/32 = 2.13 (total red = 8.52:1) 3rd gear 18/31 = 1.72 (total red = 6.88:1) 4th gear 20/28 = 1.40 (total red = 5.60:1) 5th gear 23/26 = 1.13 (total red = 4.52:1) 6th gear 29/27 = 0.93 (total red = 3.72:1)

Copyrights © Rototest Research Institute, 2009, all rights reserved, www.rri.se 6/21
Racing company and car owner Flash Engineering AB Frögatan 16 653 43 KARLSTAD SWEDEN Phone: +46 (0)54-770 44 40 Fax: +46 (0) 54-15 03 40 E-mail: [email protected] www.flashengineering.se
Driver H.R.H. Prince Carl Philip Bernadotte More info at: www.royalcourt.se www.carreracup.se
Photo: Flash Engineering AB / Johan Meissner 2009

Copyrights © Rototest Research Institute, 2009, all rights reserved, www.rri.se 7/21
Test equipment and test procedure
All tests have been performed on a ROTOTEST VPA-RX8, 2WD chassis dynamometer.
Test equipment overview The ROTOTEST VPA-RX chassis dynamometer is in reality a supreme engine dynamometer fitted to each drive wheel hub. The ROTOTEST VPA-RX chassis dynamometer revolutionizes the way complete vehicle testing is performed by allowing more to be done in less time and with less resources. But unlike traditional chassis dynamometers (roller type) the ROTOTEST VPA-RX (hub type) is also an advanced true measurement™ instrument. This is accomplished by a front-end mounted torque transducer, a high resolution speed sensor and direct-coupling to the vehicle’s hubs. The patented ROTOTEST VPA-RX (Vehicle Performance Analyser™) is comparable to a "rolling road", but is far superior in precision and test possibilities. Prominent features include: no slip between hubs and dynamometer (as normally experienced between wheels and rollers), negligible system inertia and an accurate measuring system that is independent of the absorption system. The ROTOTEST VPA-RX range is based on the technology of the industry recognized ROTOTEST VPA-R range of dynamometers.
Chassis dynamometer description The turn-key ROTOTEST VPA-RX8, 2WD chassis dynamometer System is a complete test system with dynamometer units, two Hurricane Cooling Units™ for dynamometer cooling and hurricane head wind, a control cabinet (SCU) with UPS, operator PC and real-time controller, and necessary cabling and hoses. The ROTOTEST VPA-RX8 is designed for testing of vehicles in the high performance class. The dynamometer is operated with the intuitive ROTOTEST DynoVision™ and measurement & reporting are conducted with the versatile and expandable ROTOTEST Datmon™. Both software applications are shared among all ROTOTEST dynamometer models. Data values are displayed in real-time as analogue and digital values and sweep charts. Reports are generated in tables or graphs with optional automatic correction to selectable performance standards.

Copyrights © Rototest Research Institute, 2009, all rights reserved, www.rri.se 8/21
Special characteristics As part of the ROTOTEST VPA-RX range of dynamometer models, some characteristics of the ROTOTEST VPA-RX8 model include: High level of continuous capacity Max axle power: 800 kW (1073 bhp/1088 PS) Max axle torque: 4200 Nm (3098 lb-ft) Powerful and with a capacity to meet even the most stringent requirements Calibrate able torque sensor High resolution encoder for speed Direct connection to wheel hubs Rich of options
Data acquisition equipment ROTOTEST DATACQ-R21 is a data acquisition system integrated with ROTOTEST chassis dynamometers, for measurement with external sensors, i.e. pressures, temperatures and ambient conditions. Thanks to Rototest's open-architecture and National Instrument's standardised measurement environment, the user has the flexibility to modify and expand the system to fit every particular need. To spare the user from having to worry about ground loops and signal noise all signal inputs are fully channel-to-channel isolated. This prevents the most common cause of measurement problems and damaged devices and ensures a stable and reliable operation.

Copyrights © Rototest Research Institute, 2009, all rights reserved, www.rri.se 9/21
Measurements
During all tests the measurements have included:
• Atmospheric pressure [mbar] • Relative humidity [%] • Ambient temperature [°C] • Temperature of inlet air [°C] • Torque and speed on the wheels [Nm] & [rpm]
The car uses a Motec Dash Logger. This was used to monitor the temperatures of engine water and gearbox oil. During the tests the engine water temperature has been ~95 °C and the gearbox temperature ~110 °C. The variation has been within a few degrees in both cases.

Copyrights © Rototest Research Institute, 2009, all rights reserved, www.rri.se 10/21
Results
Engine performance is normally measured in an engine dynamometer and the results referred to as “at the flywheel”. This is appropriate during the development phase of the engine. However at some point in time the engine is fitted in the vehicle. The installation itself can have a big impact on the final performance but there is also a new variable in the form of the transmission. It is of course important to have a powerful engine but from the drivers’ point of view, it is the power available to the wheels that the driver can make use of.
Engine performance measured at the flywheel at steady state conditions. This is engine performance certified by the auto manufacturer.
Powertrain Performancemeasured at the wheel hubs
during steady state or Steady Rate (constant acceleration)
Gear box losses
Propeller shaft losses
© Copyright Rototest Research Institute 2005-2009, all rights reserved; www.rototest.com; EDU-N05052501-EP-WP.PPT
Engine
Powertrain Performance measurements with ROTOTEST chassis dynamometers
Rear axleFinal drive
losses
Drive shaftlosses
Steady State The old traditional way of measuring engine performance has for a long time been to measure at steady state. This means the engine speed is kept at a constant speed for a period of time and the output torque and speed measured. Some of the advantages are a standardized way of testing and a test that is easy to reproduce. Also a certain degree of averaging will be made automatically since each test point is an average of several combustions.

Copyrights © Rototest Research Institute, 2009, all rights reserved, www.rri.se 11/21
Figure 1 – Steady State Performance, 5th gear
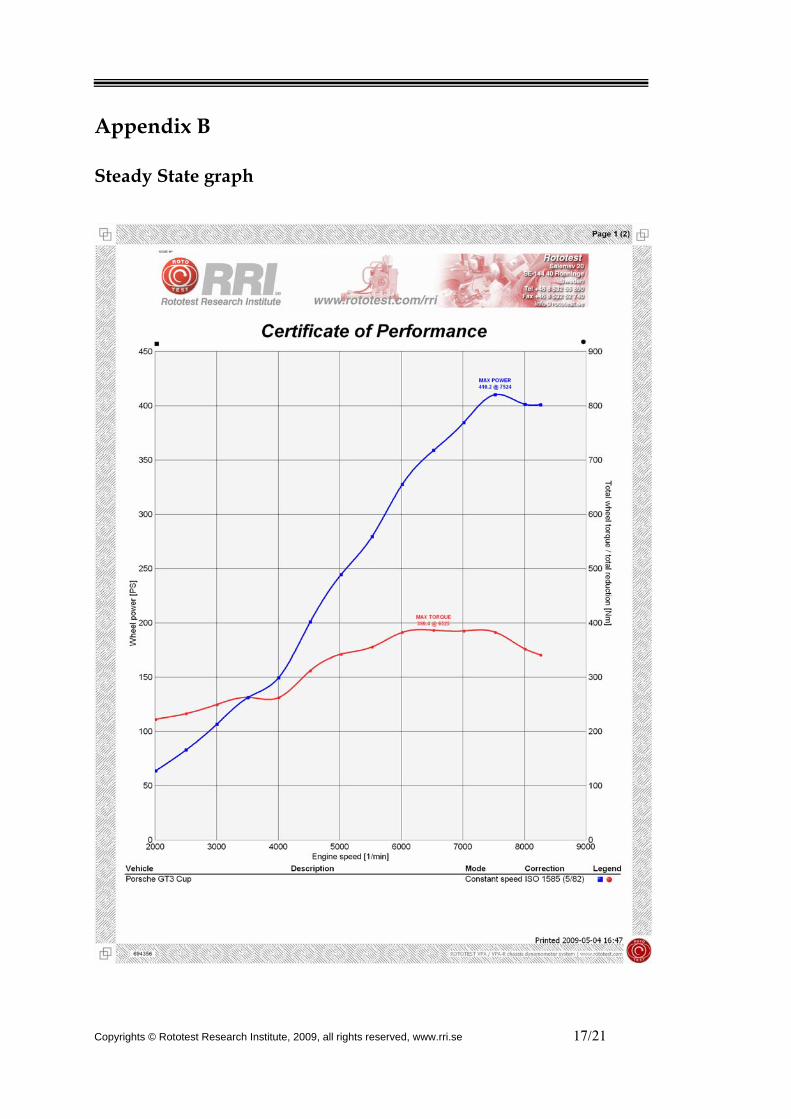
The car was tested at every 500 rpm and the result can be seen plotted in Fig 1. Stated numbers from Porsche are 420 PS and 410 Nm. Compared to the measured on the wheel hubs there is a difference of -2.3% in power and -5.8% in torque. The torque difference is in the expected range whereas the power difference indicates a slightly stronger engine than stated. It is correct to compare the official performance numbers in this way since they are produced in the same way. However there may be differences in the sample time and it is also common to have a separate cooling system in the engine test cell. In some specific cases this type of “unlimited cooling” can provide results that may be, more or less, unreachable in real use but that was obviously not the case here. Normally a check-up of this type could have ended here but there are some drawbacks in this type of tests where the most obvious one is the lack of representation especially in racing. The only time a race car is maintaining steady speed at WOT (Wide Open Throttle) is at top speed or close to it. In all other situations the car will accelerate.
Steady Rate An important compliment, to a Steady State test is to do measurements during acceleration. This will be a more representative load case for the engine. In real use the engine will see different accelerations mostly depending on which gear is used. Other variables affecting the acceleration rate are road resistance (i.e. tire, air drag, incline). One variable that is easily

Copyrights © Rototest Research Institute, 2009, all rights reserved, www.rri.se 12/21
forgotten is the inertia of the powertrain. The rate of the acceleration will have a direct effect on the powertrain performance, since some of the engine power will be used just to accelerate the powertrain. A higher acceleration will result in higher inertia losses. For comparisons it is therefore recommended to run the tests at Steady Rates. This will keep the inertia effect constant and also rule out different road conditions. For this comparison we have chosen to test at Steady Rates of 300, 500, 700 and 1000 rpm/s. For the engine ECU (Engine Control Unit) this will be a bit of a moving target. In normally aspirated engines, such as the tested Porsche engine, it is common to see small differences relating to mainly the inertia losses. However on turbocharged cars there can be substantial differences and therefore plenty of opportunities to improve the performance. For some it may be of interest that a Steady State test is difficult to run close to the engine speed limiter whereas a Steady Rate test can easily be run right into the limiter. Some of the graphs actually show this.
Figure 2 – Steady Rate Performance, 5th gear

Copyrights © Rototest Research Institute, 2009, all rights reserved, www.rri.se 13/21
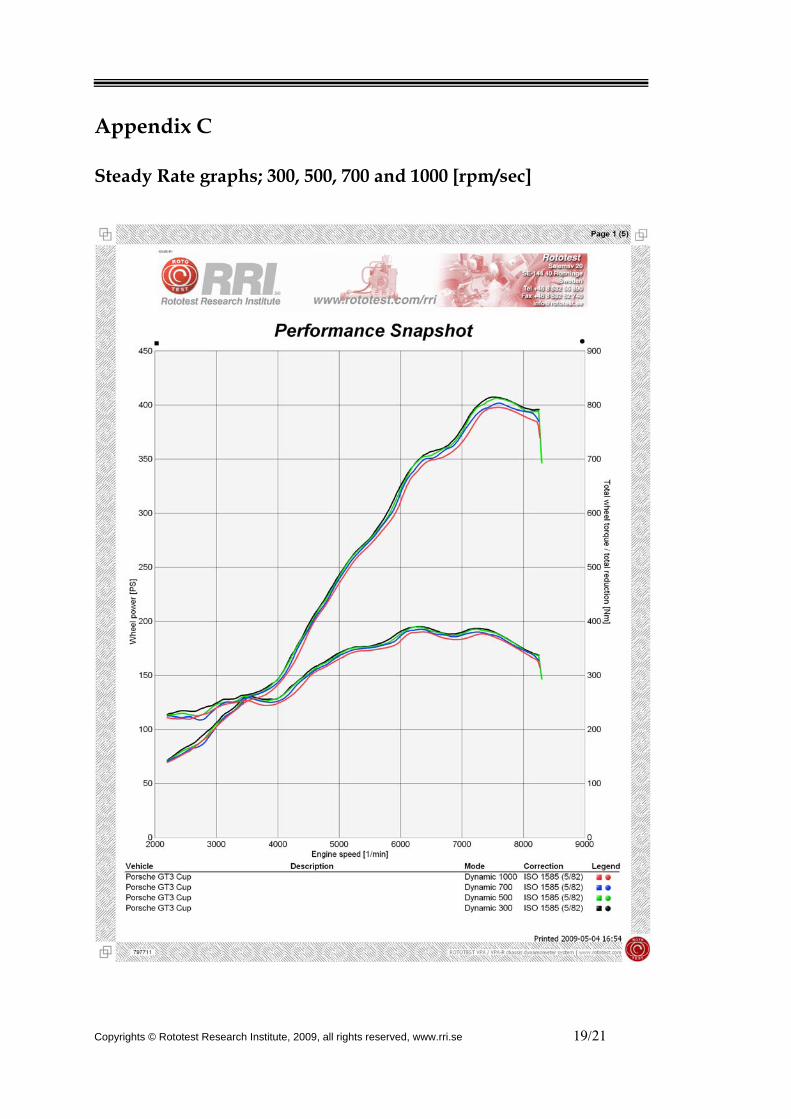
The results in Fig 2 show that there are small variations and differences between the different rates. This indicates good ECU mapping.
Steady Rate [rpm/sec] Max Torque [Nm @ rpm] Max Power [PS @ rpm] 300 390.0 @ 6290 (+0.9%) 407.4 @ 7520 (-0.7%) 500 389.2 @ 6240 (+0.7%) 406.2 @ 7560 (-1.0%) 700 385.0 @ 6340 (-0.4%) 401.6 @ 7600 (-2.1%)
1000 380.1 @ 6370 (-1.6%) 397.7 @ 7590 (-3.0%)
Table 1 – Max results during Steady Rate tests and compared to Steady State
A very interesting fact is that the maximum torque is actually higher at the two lower Steady Rate tests than at the Steady State test! This proves the importance of not relying only on a Steady State test.
Powertrain Inertia and its effects By analyzing the results of the Steady Rate tests it is possible to estimate the Powertrain Inertia. The value itself has to be referred to one specific component since engine, gears and wheels are not accelerating at the same rate and therefore have different influences. In general the inertia of the engine is by far the most important. The estimated Powertrain Inertia on this car is 0.16 kgm2 referring to the engine. It is a quite low value considering the size of the engine and largely a result of using a small clutch. Using the estimated value of the Powertrain Inertia makes it possible to calculate an amount of torque for accelerating the powertrain. Adding this to the actual measurements on the wheel hubs will create values that can be compared to the Steady State results.
Steady Rate [rpm/sec] Max Torque [Nm @ rpm] Max Power [PS @ rpm] 0 386.4 @ 6525 410.2 @ 7524
300 395.0 @ 6290 412.8 @ 7520 500 397.6 @ 6240 415.2 @ 7560 700 396.7 @ 6340 414.3 @ 7600
1000 396.9 @ 6370 415.9 @ 7590
Table 2 – Comparison of Steady State with Inertia-compensated Steady Rate results
During acceleration the engine is producing roughly 10 Nm and 5 PS more than at Steady State. This may be related to less tendency to knock during acceleration. In any case it shows clearly a performance potential that would have been missed if the mapping had only included static conditions. Especially for a race car the improvements can be considered to be large. From the drivers standpoint it can very well be the difference of winning or loosing. The importance of the Powertrain Inertia value itself is not easy to relate to. However it can be converted to an equivalent additional weight to the car on each gear. When it is described as an amount of extra weight it becomes very easy to realize the impact on performance, especially at lower gears. Gear 1 2 3 4 5 6 Eqv weight [kg] 222 101 66 43 28 19
Table 3 – Equivalent weight on different gears

Copyrights © Rototest Research Institute, 2009, all rights reserved, www.rri.se 14/21
Acceleration Performance With the estimated Powertrain Inertia and engine performance it is possible to create a graph describing the acceleration performance of the car on all gears.
0.00
0.20
0.40
0.60
0.80
1.00
1.20
0 50 100 150 200 250 300
Speed [km/h]
Acc
[g]
3000
4000
5000
6000
7000
8000
9000
Engi
ne S
peed
[rpm
]
Gear 1 2 3 4 5 6
Figure 3 – Acceleration performance on different gears
In first gear it is possible to reach an acceleration of almost 1 g. This is of course assuming that the traction is not limited. It also depends on the actual road resistance data. Simulation uses a flat road with no headwind. Weight [kg] 1265 Rolling Resistance coeff, Cr 0.015 Frontal Area [m2] 2.04 Drag coeff, Cd 0.40 Rear tire diameter [mm] 680
Table 4 – Road Resistance data
A detail worth noting is that the optimum shift point always is at maximum engine speed.
Copyrights © Rototest Research Institute, 2009, all rights reserved, www.rri.se 15/21
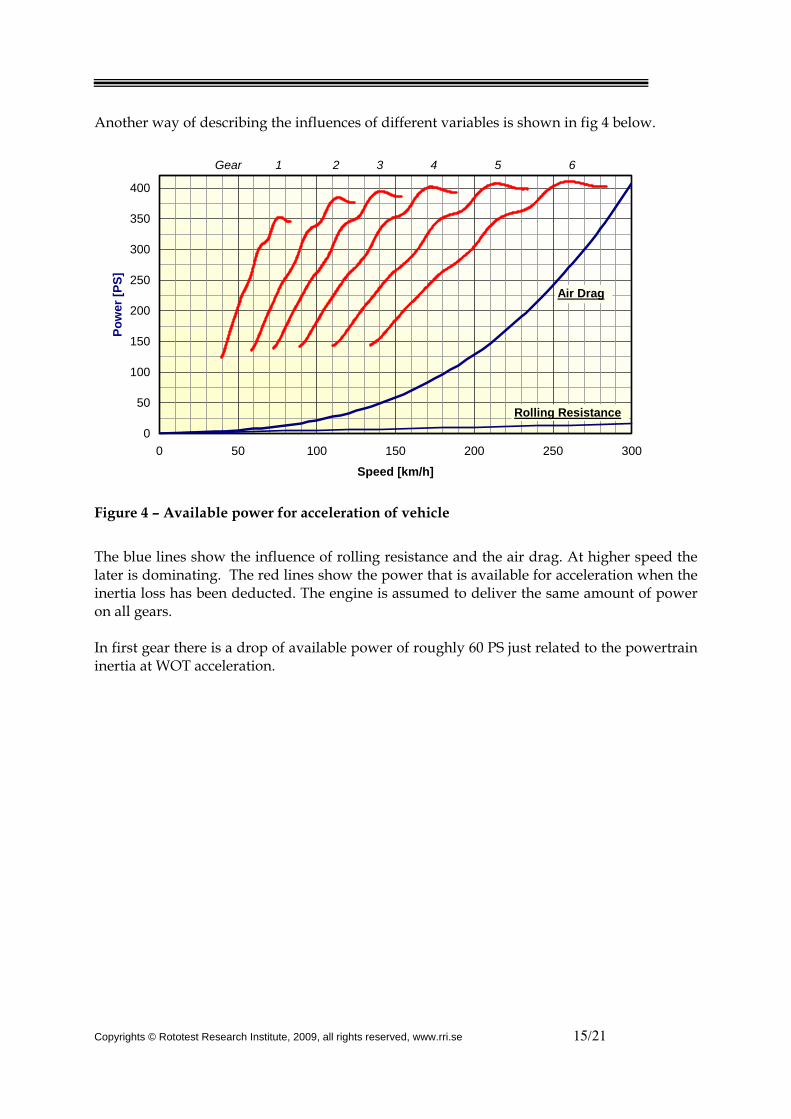
Another way of describing the influences of different variables is shown in fig 4 below.
0
50
100
150
200
250
300
350
400
0 50 100 150 200 250 300
Speed [km/h]
Pow
er [P
S]
Gear 1 2 3 4 5 6
Rolling Resistance
Air Drag
Figure 4 – Available power for acceleration of vehicle
The blue lines show the influence of rolling resistance and the air drag. At higher speed the later is dominating. The red lines show the power that is available for acceleration when the inertia loss has been deducted. The engine is assumed to deliver the same amount of power on all gears. In first gear there is a drop of available power of roughly 60 PS just related to the powertrain inertia at WOT acceleration.

Copyrights © Rototest Research Institute, 2009, all rights reserved, www.rri.se 16/21
Appendix A Test fuel from Aspen Petroleum AB, www.aspen.se
Fuel Specification Product: Plus High Performance / 19 May 2008, issue No: 9 Property Minimum Maximum Typical data Test Method RON 98 100 98.3 ASTM D2699 MON 92 94 92.2 ASTM D2700 Density kg/m3 680 720 700 ASTM D4052 Lead Content g/L - 0.002 <0.001 ASTM D3237 Benzene % wt - 0.1 <0.01 ASTM D3606 Aromatic Content% wt - 0.5 <0.1 ASTM D5443 Olefin Content % wt - 0.5 <0.1 ISO 3837 Oxygen Cont % wt 2.5 2.7 2.7 GC Sulphur ppm wt - 10 <1 ASTM D5453 Copper Corr. - 1 1A ISO 2160 Appearance Clear & Bright - Clear & Bright Dist E70 15 42 24 ASTM D86 Dist E100 47 55 54 ASTM D86 T50% °C 90 105 95 ASTM D86 Dist E 150 75 - 95,4 ASTM D86 FBP °C - 200 186,2 ASTM D86 Residue % - 1 1 ASTM D86 Vapour Pressure DVPE hPa 550 650 s:550 / w:650 ASTM D5191
Copyrights © Rototest Research Institute, 2009, all rights reserved, www.rri.se 17/21
Appendix B Steady State graph

Copyrights © Rototest Research Institute, 2009, all rights reserved, www.rri.se 18/21
Copyrights © Rototest Research Institute, 2009, all rights reserved, www.rri.se 19/21
Appendix C Steady Rate graphs; 300, 500, 700 and 1000 [rpm/sec]
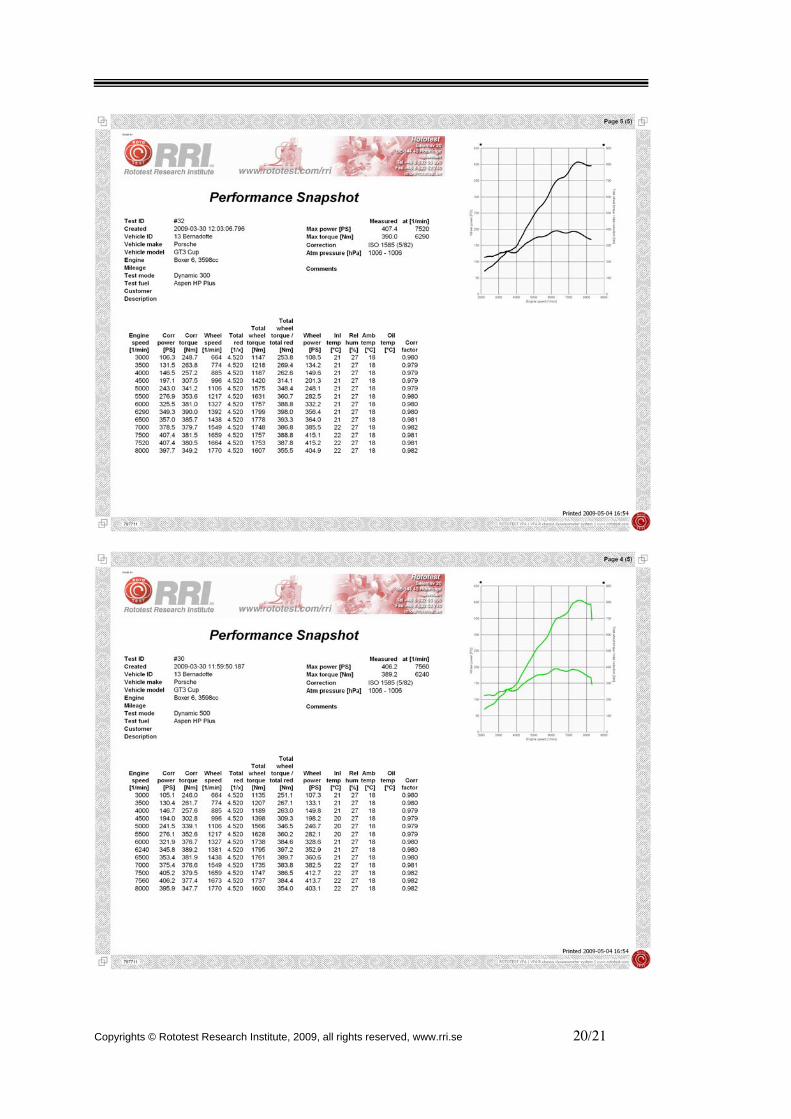
Copyrights © Rototest Research Institute, 2009, all rights reserved, www.rri.se 20/21

Copyrights © Rototest Research Institute, 2009, all rights reserved, www.rri.se 21/21