Embed Size (px)
Citation preview

Page 1
Public perceptions of crime – survey report
Report prepared for: Ministry of Justice
Date: October 2013
Level 1, 6‐10 The Strand
PO Box 33690 Takapuna, Auckland
Ph: 09 919 9200
Level 9, Sybase House, 101 Lambton Quay
PO Box 3622, Wellington
Ph: 04 913 3000
www.colmarbrunton.co.nz

Page 2
Table of Contents Summary of findings .................................................................................................................................... 4
Background and methodology ........................................................................................................................... 4
Contact with the criminal justice system ............................................................................................................ 4
Information about crime .................................................................................................................................... 4
Public perceptions about neighbourhood and national crime ........................................................................... 6
Perceived causes of crime and reasons why people are in prison ..................................................................... 7
Trust and confidence in the criminal justice system .......................................................................................... 8
Further analysis examining the relationship between perceptions of crime and trust and confidence .......... 11
Background and methodology .................................................................................................................... 12
Background ....................................................................................................................................................... 12
Methodology .................................................................................................................................................... 12
Contact with the Criminal Justice System ................................................................................................... 16
Information about crime ............................................................................................................................ 19
Main sources of information about crime in New Zealand .............................................................................. 19
Perceived reliability of different sources of information about crime ............................................................. 24
Perceived knowledge about crime and the criminal justice system ................................................................ 25
Public perceptions about crime in the local neighbourhood and crime at a national level ........................... 29
Crime problem in local neighbourhood ............................................................................................................ 29
Perceptions about the change in local neighbourhood crime over the past year ........................................... 30
Perceptions about the change in national crime over the past year................................................................ 32
Comparing perceptions about increases in local neighbourhood crime and increases in national crime ....... 35
Major causes of crime in New Zealand ............................................................................................................. 36
Reasons why most of those currently serving prison sentences are in prison ................................................. 38
Trust and confidence questions .................................................................................................................. 39
NZ Police ........................................................................................................................................................... 39
Criminal courts .................................................................................................................................................. 41
Prisons, community sentences, and parole ...................................................................................................... 43
Views on the overall effectiveness of the criminal justice system ................................................................... 46
What would increase confidence in the criminal justice system? .................................................................... 48
Further analysis examining the relationship between perceptions of crime and trust and confidence ......... 50
Relationships between the different perceptions‐of‐crime questions ............................................................ 50
Link between perceptions about crime levels and confidence in the criminal justice system ......................... 51
The relationship between confidence in the criminal justice system and other trust and confidence measures
.......................................................................................................................................................................... 51
Link between perceived knowledge of criminal justice agencies and trust and confidence in them .............. 53
Conclusions ....................................................................................................................................................... 56

Page 3
Appendix A – Sample profile ...................................................................................................................... 57
Appendix B ‐ Size of each perceived knowledge group ................................................................................ 59
Appendix C – Subgroup analysis of those who ‘disagree’ about various statements about the criminal justice
system ....................................................................................................................................................... 60
Appendix D – Questionnaire ....................................................................................................................... 64

Page 4
Summary of findings
Background and methodology
The Ministry of Justice (the Ministry) commissioned Colmar Brunton to undertake a survey to investigate public perceptions about crime and the criminal justice system. The survey is intended to provide a robust and nuanced measure of public opinion on crime and the criminal justice system.
The survey was conducted online using a representative sample from Colmar Brunton’s research panels.
The questionnaire took 15 minutes to complete (on average).
In total 2,001 New Zealanders were surveyed between 24 July and 15 August 2013. The maximum margin of error for a sample of 2,001 is +/‐2.2% (at the 95% confidence level).
Contact with the criminal justice system
In total 83% of respondents have interacted with the criminal justice system in the past two years.
48% of those who have had contact with the criminal justice system in the past two years say their overall
experience has been positive, 39% are neutral, and 9% are negative (with a further 4% saying that they ‘don’t
know’).
Information about crime
Main sources of information about crime
Respondents receive information about crime in New Zealand from a wide range of sources, the most common
are:
National television news broadcasts (86% say this is one of their main sources of information about crime).
Online news sources (63%)
National and provincial newspapers (63%)
Radio news (56%)
Current affairs television programmes (49%)
Local newspapers (47%).

Page 5
Perceived reliability of different sources of information about crime
Most respondents believe that key sources of information about crime are reliable. Almost 9 in 10 think that
television news is a reliable source. A lower proportion (around 7 in 10) say that crime statistics are reliable.
The proportions rating each source as either ‘completely reliable’ or ‘somewhat reliable’ are indicated below:
Television news (87% say this source is either completely reliable or somewhat reliable).
National and provincial newspapers (85%)
Radio news (82%)
Television documentaries (74%)
Local newspapers (74%)
Crime statistics (72%).
Perceived knowledge of crime and the criminal justice system
Respondents were asked how much they knew about various aspects of the criminal justice system and crime
in New Zealand. For each aspect they could choose from one of five answers: ‘know a lot’, ‘quite a lot’, ‘a
little’, ‘nothing at all’ or ‘don’t know’. Results to this question are described in this report as ‘perceived
knowledge’ because answers are based upon respondents ‘self‐reporting’ their own level of knowledge.
Most respondents say they only know ‘a little’ or ‘nothing at all’ about most aspects of the criminal justice
system and crime in New Zealand. This ranges from as high as 87% who know a little or nothing at all about
the parole system to 64% who know a little or nothing at all about NZ Police.
Respondents are more likely to say they know more about agencies that deal with the earlier stages of the
criminal justice system. 35% say they know a lot, or quite a lot, about the police. 22% say they know a lot, or
quite a lot, about the criminal court system. The equivalent proportion for fines and other monetary penalties
is 21%.
On the other hand, only 16% say they know a lot, or quite a lot, about the bail system, the equivalent
proportions are 15% for prisons and 11% for the parole system.
Around a third say they know ‘a lot’ or ‘quite a lot’ about the types of crime, and the volume of crime,
occurring in New Zealand.
Respondents from higher income households, or those with University qualifications, tend to say they know
more than other respondents.

Page 6
Public perceptions about neighbourhood and national crime
Perceptions about neighbourhood crime
Over a third (35%) of respondents who have lived in their local neighbourhood for the past year say there is a
crime problem in their local neighbourhood. 55% say there is not a crime problem and 11% do not know. The
following groups are more likely to believe there is a crime problem in their local neighbourhood:
Maori respondents (50%)
Those with a household income up to $30,000 (43%)
Those who would struggle to pay an unexpected expense of $500 (42%)
Those living in Hamilton (48%)
Those living in the Auckland region (40%).
Respondents were asked whether total neighbourhood crime had increased, decreased or stayed the same in
the past year. The largest proportion, 41%, say that the total amount of neighbourhood crime has remained
the same over the past year. 23% think that neighbourhood crime has increased, 12% think that
neighbourhood crime has decreased, and a further 23% do not know.
26% think that crime committed by young people in their neighbourhood had increased in the past year, 21%
think that burglary had increased, and only 12% think that violent crime in the neighbourhood had increased.
Perceptions about national crime
A large proportion, 60%, say that national crime has increased over the past year. 34% say it has stayed the
same and 12% say it has decreased. 10% say they do not know.
Almost two‐thirds think that, at a national level, violent crime and crime committed by young people has
increased in the past year (66% and 65% respectively believe these two types of crime have increased). Just
over half (54%) believe that burglary has increased at a national level.
The characteristics of those who believe total national crime has increased ‘a lot’ in the past year
26% of respondents believe that total national crime has increased ‘a lot’ in the past year. There are three
stand‐out characteristics that makes this group significantly different from norm:
1. They are more likely to be females aged 50+ (37% of those who believe crime is increasing a lot are females aged 50+ ‐ compared with 22% of all respondents).
2. They are more likely to have no qualification or have a school certificate as their highest qualification (35% of those who believe crime is increasing a lot, compared to 23% of all respondents).
3. Non‐city dwellers (55% of those who believe crime is increasing a lot say they live outside of cities – compared to 47% of all respondents).
This group has lower confidence in the effectiveness of the criminal justice system (19% of those who believe
crime is increasing a lot have confidence in the system vs. 31% of all respondents).

Page 7
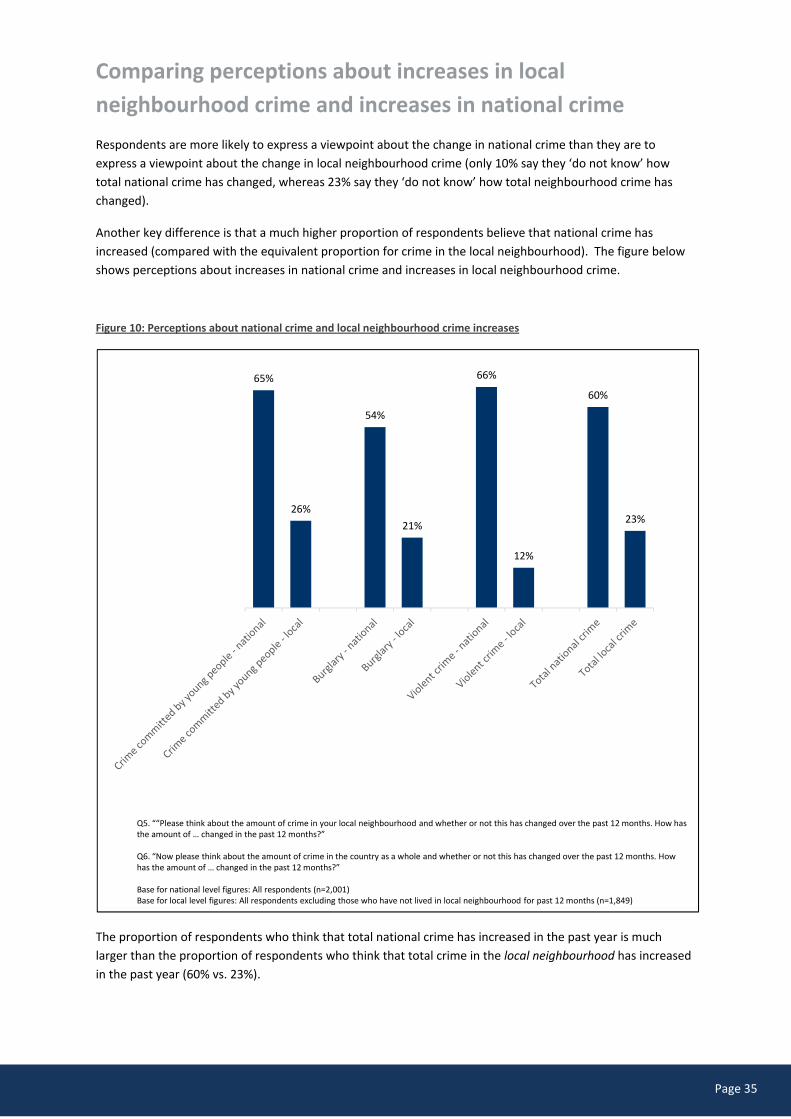
Comparing perceptions about national crime and crime in the local neighbourhood
The proportion of respondents who think that total national crime has increased in the past year is much
larger than the proportion of respondents who think that total crime in the local neighbourhood has increased
in the past year (60% vs. 23%).
65% say that the amount of crime committed by young people at a national level has increased, compared
with 26% at the neighbourhood level. The equivalent proportions for burglary are 54% and 21%. Views about
the increase in violent crime show the largest gap between perceptions about national crime and perceptions
about local neighbourhood crime. 66% say that violent crime has increased at a national level whereas only
12% say it has increased at the neighbourhood level.
Respondents are more likely to express a viewpoint on the change in national crime levels in the past year
(only 10% say they ‘do not know’ how national crime has changed, whereas 23% say they ‘do not know’ how
neighbourhood crime has changed).
Perceived causes of crime and reasons why people are in
prison
The major causes of crime in New Zealand
Respondents were asked for their views on the major causes of crime in New Zealand today. Respondents
could choose more than one answer. A high proportion say that drugs and alcohol are major causes of crime
(88% and 78% respectively believe these to be major causes of crime). 73% say poor parenting is a major
cause of crime, 66% say unemployment is a major cause, 58% say breakdown of family is a major cause, 57%
say poverty is a major cause, and 51% say poor education and poor schooling is a cause.
Reasons why most of those current serving prison sentences are in prison
Respondents were asked to think about people currently serving prison sentences in New Zealand.
Respondents were then asked “Do you think that most prisoners are there for violent and sex crimes, property
crimes, or drug‐related crimes?”
The Ministry of Justice estimate that approximately half of prisoners are in prison for assaults and intended
harm, homicide, other threatening behaviour, and sexual offences. This makes ‘violent and sex crimes’ the
most common reason that people are in prison (according to the 2011 Corrections Offenders Volume report).
However, only 29% of respondents knew that violent and sex crimes was the reason that most people are in
prison. 30% say that most are in prison for drug‐related crimes, 18% say ‘property crimes’ and 23% do not
know.
Page 8
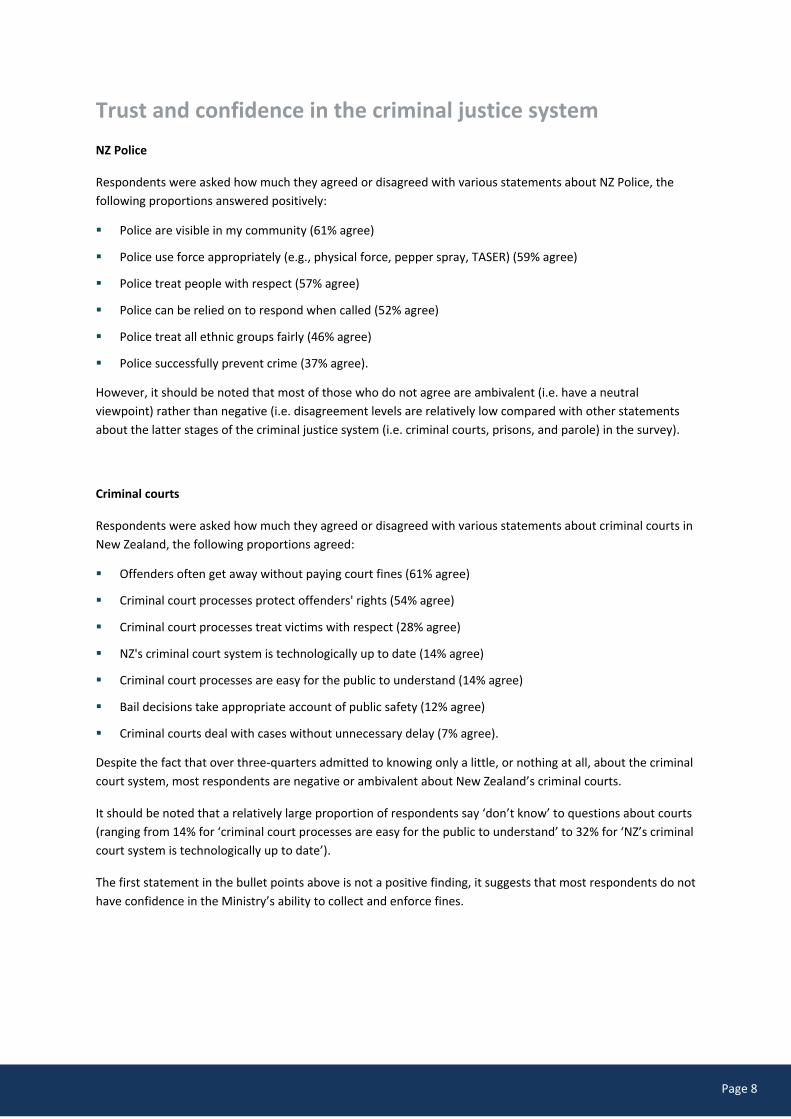
Trust and confidence in the criminal justice system
NZ Police
Respondents were asked how much they agreed or disagreed with various statements about NZ Police, the
following proportions answered positively:
Police are visible in my community (61% agree)
Police use force appropriately (e.g., physical force, pepper spray, TASER) (59% agree)
Police treat people with respect (57% agree)
Police can be relied on to respond when called (52% agree)
Police treat all ethnic groups fairly (46% agree)
Police successfully prevent crime (37% agree).
However, it should be noted that most of those who do not agree are ambivalent (i.e. have a neutral
viewpoint) rather than negative (i.e. disagreement levels are relatively low compared with other statements
about the latter stages of the criminal justice system (i.e. criminal courts, prisons, and parole) in the survey).
Criminal courts
Respondents were asked how much they agreed or disagreed with various statements about criminal courts in
New Zealand, the following proportions agreed:
Offenders often get away without paying court fines (61% agree)
Criminal court processes protect offenders' rights (54% agree)
Criminal court processes treat victims with respect (28% agree)
NZ's criminal court system is technologically up to date (14% agree)
Criminal court processes are easy for the public to understand (14% agree)
Bail decisions take appropriate account of public safety (12% agree)
Criminal courts deal with cases without unnecessary delay (7% agree).
Despite the fact that over three‐quarters admitted to knowing only a little, or nothing at all, about the criminal
court system, most respondents are negative or ambivalent about New Zealand’s criminal courts.
It should be noted that a relatively large proportion of respondents say ‘don’t know’ to questions about courts
(ranging from 14% for ‘criminal court processes are easy for the public to understand’ to 32% for ‘NZ’s criminal
court system is technologically up to date’).
The first statement in the bullet points above is not a positive finding, it suggests that most respondents do not
have confidence in the Ministry’s ability to collect and enforce fines.

Page 9
Prisons, community sentences and the parole system
Respondents were asked how much they agreed or disagreed with various statements about prisons,
community sentences and the parole system, the following proportions agreed:
Prisons keep the public safe by securely containing offenders (63% agree)
Most people who appear before the Parole Board are initially turned down (16% agree)
Prisons give offenders the help they need to stop offending (15% agree)
People on community sentences are well managed (12% agree)
The parole system can be relied upon to safely manage the release of offenders (9% agree)
Prison successfully deters people who have been to prison from committing crime in future (5% agree)
Apart from the statement about prisons keeping the public safe by securely containing offenders, the trust and
confidence measures for prisons, community sentences and the parole system are generally negative.
However, there are particularly high proportions of respondents that say ‘do not know’ to some questions.
For example, 44% do not know whether or not most people who appear before the Parole Board are initially
turned down, and 26% do not know whether or not people on community sentences are well managed.
Around 1 in 10 say ‘don’t know’ to the other four statements in this section.
It is worth noting that despite the fact over eight in ten claim to only know a little, or nothing at all, about
community sentences, prisons, and the parole system – respondents are generally negative in their views
about these aspects of the criminal justice system. A similar finding exists for the criminal court system (i.e.
low perceived knowledge but generally negative views).
Overall confidence in the effectiveness of the criminal justice system
Respondents were asked to think about all the different parts of the criminal justice system (the police, the
courts, the prison, probation and parole systems), and rate how confident they were in the effectiveness of
the criminal justice system as a whole.
In total 31% are either ‘completely confident’ or ‘fairly confident’ that the criminal justice system is effective.
43% are either ‘not very confident’ or ‘not at all confident’ that the criminal justice system is effective. A
notable proportion, 24%, are neutral.
The following groups are more likely than average to be either ‘completely confident’ or ‘fairly confident’:
Males (35%)
Those aged 70+ (41%)
Those with higher perceived knowledge of the criminal justice system (i.e. they know about 3 or more out of 10 different aspects of the criminal justice system and crime in New Zealand) (36%).
Those who use newspapers as their most common source of information about crime (39% ‐ compared to 29% of those who use TV and 33% of those who use radio as their most common source).
Those with a University qualification (37%).
Those who do not think there is a crime problem in their local neighbourhood (36%)
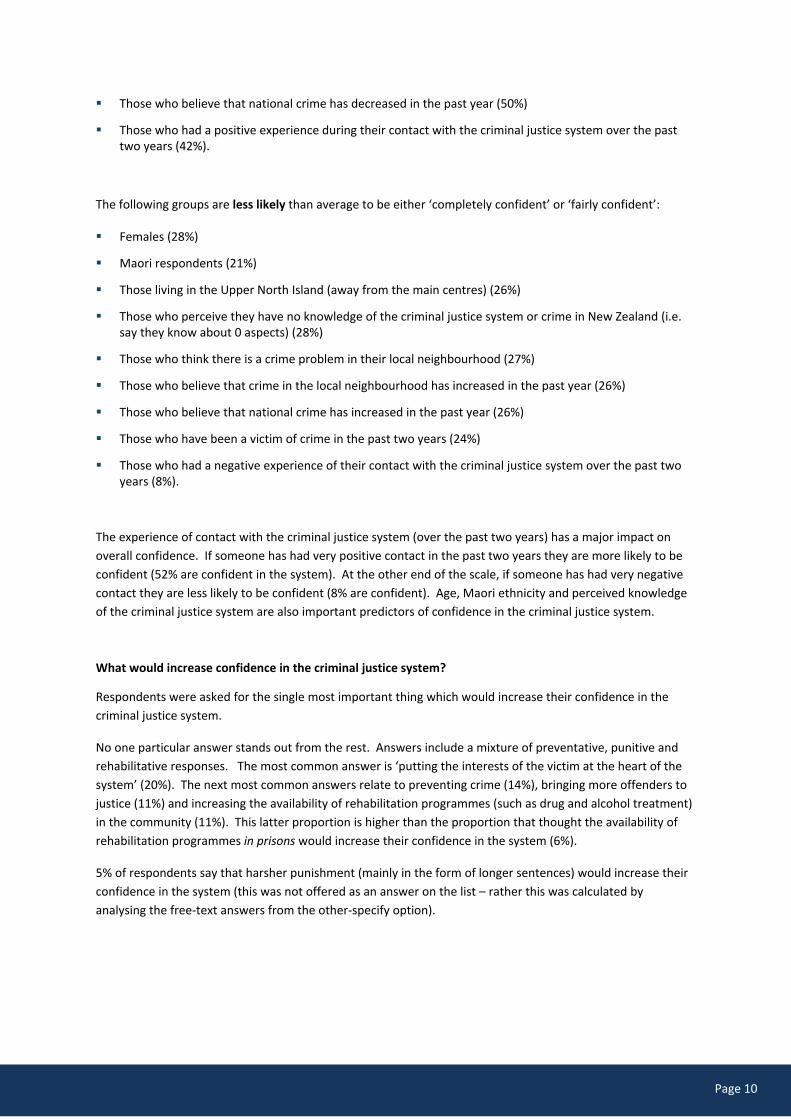
Page 10
Those who believe that national crime has decreased in the past year (50%)
Those who had a positive experience during their contact with the criminal justice system over the past two years (42%).
The following groups are less likely than average to be either ‘completely confident’ or ‘fairly confident’:
Females (28%)
Maori respondents (21%)
Those living in the Upper North Island (away from the main centres) (26%)
Those who perceive they have no knowledge of the criminal justice system or crime in New Zealand (i.e. say they know about 0 aspects) (28%)
Those who think there is a crime problem in their local neighbourhood (27%)
Those who believe that crime in the local neighbourhood has increased in the past year (26%)
Those who believe that national crime has increased in the past year (26%)
Those who have been a victim of crime in the past two years (24%)
Those who had a negative experience of their contact with the criminal justice system over the past two years (8%).
The experience of contact with the criminal justice system (over the past two years) has a major impact on
overall confidence. If someone has had very positive contact in the past two years they are more likely to be
confident (52% are confident in the system). At the other end of the scale, if someone has had very negative
contact they are less likely to be confident (8% are confident). Age, Maori ethnicity and perceived knowledge
of the criminal justice system are also important predictors of confidence in the criminal justice system.
What would increase confidence in the criminal justice system?
Respondents were asked for the single most important thing which would increase their confidence in the
criminal justice system.
No one particular answer stands out from the rest. Answers include a mixture of preventative, punitive and
rehabilitative responses. The most common answer is ‘putting the interests of the victim at the heart of the
system’ (20%). The next most common answers relate to preventing crime (14%), bringing more offenders to
justice (11%) and increasing the availability of rehabilitation programmes (such as drug and alcohol treatment)
in the community (11%). This latter proportion is higher than the proportion that thought the availability of
rehabilitation programmes in prisons would increase their confidence in the system (6%).
5% of respondents say that harsher punishment (mainly in the form of longer sentences) would increase their
confidence in the system (this was not offered as an answer on the list – rather this was calculated by
analysing the free‐text answers from the other‐specify option).

Page 11
Further analysis examining the relationship between
perceptions of crime and trust and confidence
Relationship between perceptions about crime and confidence in the criminal justice system
There is a link between perceptions about national crime increasing (in the past year) and confidence in the
effectiveness of the criminal justice system:
50% of those who believe national crime is decreasing are confident in the effectiveness of the criminal justice system (compared to 31% of all respondents). And only 26% are not confident (compared to 43% of all respondents).
Only 26% of those who believe national crime is increasing are confident in the effectiveness of the criminal justice system (compared to 31% of all respondents). And 52% are not confident (compared to 43% of all respondents).
Correlations between confidence in the criminal justice system and other measures of trust, confidence and
perceptions of crime
Colmar Brunton undertook statistical analysis to investigate how all of the trust, confidence and perceptions‐
of‐crime questions correlated with overall confidence in the effectiveness of the criminal justice system. The
five largest correlations are indicated below, if there are negative perceptions about one of these particular
variables, then there is also a tendency to have lower confidence in the criminal justice system overall (and
vice‐versa). However, it should be noted that these correlations are only moderate (ranging from 0.23 to 0.28)
‐ none of the relationships exhibit strong correlations.
Perception about the change in national crime levels in the past year (correlation of 0.28 with confidence in the criminal justice system).
Police successfully prevent crime (correlation of 0.26)
Perception about the change in violent crime at a national level (correlation of 0.25)
Perception about the change in crime committed by young people at a national level (correlation of 0.23)
Police can be relied upon to respond when called (correlation of 0.23)
There is not a strong link between perceptions about crime changes in the local neighbourhood and
confidence in the criminal justice system.
So views on national crime trends (particularly trends in violent crime) and the views of the police in New
Zealand (particularly their success at preventing crime and responding when called) are linked to overall
confidence in the criminal justice system. Views on the courts and prisons, community sentences and parole
do have some relationship with overall confidence, but the relationship is not strong enough to produce a
‘moderate correlation’ (and hence do not appear in the series of bullet points above).

Page 12
Background and methodology
Background
The Ministry of Justice (the Ministry) commissioned Colmar Brunton to undertake a survey to investigate
public perceptions about crime and the criminal justice system.
The survey is intended to provide a robust and nuanced measure of public opinion on crime and the criminal
justice system.
The survey will enable a better understanding to emerge about the relationship (or not) between public
perceptions of crime (at a neighbourhood level and at a national level) and confidence in the criminal justice
system.
It will also provide insights into the relationship between the level and source of public knowledge about crime
and the criminal justice system and confidence in the system.
Methodology
Questionnaire
A draft questionnaire for the survey was provided by the Ministry of Justice. The questionnaire covered:
Sources of information about crime
Knowledge of crime and the criminal justice system
Perceptions about crime in the local neighbourhood and national crime
Trust and confidence questions (regarding confidence in the criminal justice system)
Demographics
The questionnaire was refined by conducting eight cognitive interviews with members of the public
(participants were selected from a range of different age groups and different ethnic backgrounds).
Cognitive interviewing involves pre‐testing the questionnaire in a qualitative setting – it is a useful process for
testing the wording and order of questions. The diagram below illustrates the thought process a respondent
goes through when answering a question. Problems with a question may arise at any of these stages.
Comprehension Retrieval Judgment Formulation of response

Page 13
During cognitive interviews, Colmar Brunton researchers explored each area by asking respondents to discuss
how they arrived at their answers. Participants were asked to ‘think aloud’ as they completed the survey.
Cognitive interviewing focused on the following four areas:
Comprehension – did the respondent understand the question?
Retrieval – could the respondent retrieve an answer?
Judgement – what did the respondent include/exclude in their answer?
Formulation of response – how did the respondent format their answer, and did it fit with the response options provided?
Revisions to question wording and response options were made as a result of the cognitive interviews. Please
refer to Appendix D for a full copy of the final questionnaire used in survey fieldwork.
Sample source
An online survey was conducted using Colmar Brunton’s research panel. Colmar Brunton have access to a
research panel of 210,000 New Zealanders. Colmar Brunton follow ESOMAR guidance on panel quality and
panel maintenance which includes the following principles:
invalid email addresses/unsubscribes/repeat non‐replies removed
panellist satisfaction regularly monitored (taking action to maintain response rates)
panellists cannot be invited to take part in the same client’s surveys or tracking surveys
maximum number of 18 invites per year (most receive less than this)
panel demographic information is available to allow the identification of a broadly representative sample.
Sample management and weighting
A representative sample of New Zealanders were invited to take part in the survey. An initial sample
representative by age, gender, location and ethnicity was drawn from Colmar Brunton’s main consumer panel.
Respondents were rewarded with FlyBuys points when they completed the survey.
Fieldwork was carefully monitored through fieldwork monitoring quotas to ensure that the final sample was
broadly representative by age, gender, ethnicity and location. We also applied quotas by education to ensure
that the sample was broadly representative by educational attainment (defined through a simple quota target
which sought a representative spread of respondents with and without a University qualification). In addition,
Colmar Brunton monitored the sample by household income to ensure that the final sample was
representative by household income.
The following official data sources were used to set quotas and monitor fieldwork to ensure a representative
sample:
OECD Education at a Glance 2013 (to estimate the approximate proportion of the New Zealand public with a University qualification).
Household Economic Survey (Income): Year ended 30 June 2012 (to monitor household income).
Statistics New Zealand population estimates 30 June 2012 (to set quotas on age, gender, ethnicity and location).

Page 14
During fieldwork two corrective actions were required to ensure that quota targets were met:
Young men aged 18‐24 were under‐responding to the survey during the initial stages of fieldwork. Colmar Brunton addressed this by topping up the survey sample with an additional random selection of males aged 18‐24 sourced from Colmar Brunton’s specialist youth panel, called the ‘YouSay Youth Panel’. These respondents were incentivised to take part by being entered into a prize draw to win vouchers that were appropriate for the age‐category.
The quota target on respondents with a University qualification was met towards the latter stages of fieldwork. Colmar Brunton addressed this by inserting a screening question in the first part of the questionnaire. For the latter stages of fieldwork, panellists without a University qualification qualified for the survey, whereas panellists who did have a University qualification did not qualify for the survey (but were entered into a prize draw).
Due to strict sample management final survey weights were only required for age‐band within gender and the
weighting required was minimal (individual weighting adjustments range from a minimum of 0.9 to a
maximum of 1.2). The weighting specification used age and gender information given by respondents in the
questionnaire. The following weighting targets were applied to the unweighted sample profile (these
weighting targets are based upon Statistics New Zealand population estimates dated 30 June 2012).
Table 1: Weighting targets used
18‐24 25‐49 50‐69 70+ Males 7.1% 21.4% 14.5% 5.5%
Females 6.6% 22.8% 15.2% 6.9%
Detailed sample profiles are provided in Appendix A of this report.
Fieldwork
In total 2,001 New Zealanders were surveyed between 24 July and 15 August 2013. The maximum margin of
error for a sample of 2,001 is +/‐2.2% (at the 95% confidence level).
The questionnaire took 15 minutes to complete (on average).
The overall response rate was 33% (this is simply calculated as the number of completes divided by the
number of emails sent out). This response rate is standard for an online panel survey with the general public
involving a fifteen minute questionnaire.
Page 15
Significance testing
All reported differences between subgroups in the main report are statistically significant at the 95%
confidence level unless otherwise stated. The following factors are reported on for statistical significance:
Gender
Age
Ethnicity
Household income
Whether the respondent can pay an unexpected expense of $500 (which is a simple proxy for financial hardship).
Education (highest educational qualification obtained)
Urban/rural location
Regional location (Auckland, Wellington, Christchurch, etc).
Whether the respondent believes crime in New Zealand is increasing or decreasing
Contact with the criminal justice system in the past two years (or not) – and whether that contact is generally positive or negative.
Perceived knowledge level. This was obtained via Question 3 which involved a self‐reported knowledge question about ten different aspects of the criminal justice system and crime in New Zealand. The knowledge level was obtained by counting the number of statements where the respondent said they knew ‘quite a lot’ or ‘a lot’. The maximum score is 10 (because there are 10 statements) and the minimum score is 0. For analysis purposes we combined the scores as follows (sometimes two or more of following categories are grouped together in the report when required for analysis) :
o 0 (i.e. the respondent says they do not know about any aspects of the criminal justice system)
o 1 or 2
o 3 or 4
o 5+ (i.e. the respondent says they know about five or more aspects).
(Please refer to Appendix B for a table illustrating the size of each population group in the overall survey population).
Most commonly used source of information about crime (such as television, radio, etc.) is also used in subgroup analysis of trust and confidence questions included in the survey.

Page 16
Contact with the Criminal Justice System
Respondents were asked whether they had personally come into contact with the criminal justice system in
the past two years. The results are illustrated in Figure 1.
Figure 1: contact with the criminal justice system in the past two years
In total 83% of respondents have interacted with the criminal justice system in the past two years. The most
common interaction (by far) is being in a vehicle stopped by the Police (respondents were given the examples
of a traffic stop or alcohol check point). However, a notable proportion of respondents say they have been a
victim, or known someone who was a victim (19% and 36% respectively – in total 43% of respondents gave
either of these two answers and 11% answered that they were both a victim and knew a victim).
Among those who have had contact with the criminal justice system in the past two years, the average
respondent selected 2.2 answers to this question. 36% of those who have had contact have had only one type
of contact, 31% have had two, and 33% have had three or more different types of contact (up to a maximum
of 9 different types of contact). Those who say they have had a wider range of contacts with the criminal
justice system are more likely to view their contact with the criminal justice system negatively (please refer to
the findings under Figure 2 below for details).
Q23. “People come into contact with the criminal justice system for a variety of reasons. Thinking about the past 2 years, please indicate whether you have personally…”
Base: All respondents (n=2,001)
69%
36%
21%
19%
12%
7%
7%
5%
1%
3%
16%
1%
Been in a vehicle that was stopped by Police
Known a victim of a crime
Paid a fine or reparation
Been the victim of crime
Worked in system or known someone who does
Attended court as a witness or support person
Served on a jury
Been imprisoned or known someone imprisoned
Been arrested by Police
Other
Did not experience any of the above
Don't wish to answer

Page 17
Whether someone has interacted with the criminal justice system in the past two years is used throughout this
report in subgroup analysis. Given the relatively high proportion of respondents who have had contact, there
are not many significant differences – although those who have not had contact tend to be slightly more
negative about police being visible in the community and about prisons securely containing offenders (see the
trust and confidence section later in the report for the exact results ‐ found at pages 40 and 44).
Respondents who had contact with the criminal justice system were also asked whether their contact with the
criminal justice system was positive or negative (overall). Results are illustrated in the figure below.
Figure 2: rating the experience of contact with the criminal justice system
In total 48% of those who have had contact with the criminal justice system in the past two years say their
overall experience has been positive, 39% are neutral, and 9% are negative (with a further 4% saying that they
‘don’t know’).
As discussed later on page 47, a positive experience of contact is associated with confidence in the
effectiveness of the criminal justice system as a whole (and the opposite is true for those who say their contact
with the criminal justice system has been negative).
Positive ratings largely come from those who have been stopped by the Police or those who work in the
system (or know someone who works in the system).
13%
35%
39%
7%
2%4%
Very positive Quite positive Neither positivenor negative
Quite negative Very negative Don’t know
Q23B. “On the whole would you describe your contact(s) with the criminal justice system in the past 2 years as…?”
Base: All respondents who have had contact with the criminal justice system in the past two years (n=1,671)

Page 18
The following groups are generally more negative about their contact with the criminal justice system (the
results below should be compared against the average results for all respondents – which are 48% positive /
9% negative):
Those with a wider range of contacts with the criminal justice system (only 12% of those who have had five or more different types of contact with the criminal justice system in the past two years are positive and 62% are negative, compared with 29% who are positive and 49% who are negative among those who have had two different types of contact, and 33% who are positive and 41% who are negative among those who have had only one type of contact).
Those who have been a victim of a crime are less likely than average to be positive (41% are positive and 19% are negative). A similar finding exists for those who have known a crime victim (42% are positive and 12% are negative).
Those who paid a fine or reparation are more likely than average to be negative (38% are positive and 12% are negative).
Those who attended court as a witness or support person are more likely than average to be negative (40% are positive and 17% are negative).
Those who have been imprisoned (or known someone imprisoned) are more likely than average to be negative (34% are positive and 18% are negative).
There are no statistically significant differences in the proportion of respondents rating their experience
positively or negatively by demographic group.

Page 19
Information about crime
Main sources of information about crime in New Zealand
Respondents were asked where they mainly read or heard about crime in New Zealand. Respondents were
given examples for each media source, such as: Current affairs television programmes (e.g., Campbell Live,
Sunday, Inside NZ; Te Karere). Respondents could select more than one answer to the question. Figure 3
below shows the summary of responses.
Figure 3: Main sources of information about crime
Respondents get their information about crime from a wide range of sources. On average each respondent
mentioned six sources of information.
Almost 9 in 10 say national television news is one of their main sources of information about crime in New
Zealand. Almost two‐thirds say that that online news is a main source of information about crime, and the
same proportion say newspapers are a main source. Radio news is the fourth most common source of
information (just over half say radio is one of their main sources).
Not many respondents use government information, books or community meetings as sources of information
about crime.
Q1. “Where do you mainly hear or read about crime in New Zealand?”Base: All respondents (n=2,001)
86%
63%
63%
56%
49%
47%
45%
44%
43%
31%
25%
23%
19%
15%
9%
6%
6%
4%
2%
National television news broadcasts
Online news sources
National and provincial newspapers
Radio news
Current affairs television programmes
Local newspaper
Television documentaries
Reality TV shows
General word of mouth/information from other people
Experience of relatives, friends, neighbours, or other acquaintances
TV crime dramas
Social media
Personal experience
Talk back radio
Other online sources (not Social Media or News)
Government information/websites
Books
Community meetings/hui
Other (inc work, study and neighbourhood support)

Page 20
The questionnaire contained an instruction to respondents that if they read a national or provincial newspaper
online (such as NZ Herald online) then this counted towards reading a national or provincial newspaper. Other
alternative response options were provided for online sources (including ‘online news sources such as Stuff’,
‘Social Media such as Facebook, Twitter and YouTube’, and ‘other online sources’). However, it should be
noted that respondents may not be able to distinguish differences between ‘Online news, such as Stuff’ and ‘a
national/provincial newspaper online’ because both sources often share identical news stories (via the Fairfax
Media network). Therefore, there will be some overlap between the proportion saying they use online
sources and the proportion saying they use newspapers.
There are some significant differences in the main sources of information used by different demographic
subgroups (please refer to Table 2 overleaf for details). Generally speaking, age is the main determinant of
information sources used. Older respondents tend to hear or read about crime across a wider range of
sources including television, newspapers and radio, whereas younger respondents tend to read about crime
online.

Page 21
Table 2: Significant differences in main sources of information by demographic group
Groups significantly more likely than average to
use this information source:
Groups significantly less likely than average to use
this information source:
National television news broadcasts
(average of 86% use this source)
Those with a school certificate as their highest
qualification (92%).
Those aged 50‐69 (90%), and those aged 70+
(92%).
Pacific respondents (98%)
Those who believe that crime in New Zealand is
increasing (88%).
University graduates (79%).
Those aged under 25 (79%).
Asian respondents (78%)
Those living in the Wellington region (80%).
Online news sources
(average of 63% use this source)
Those aged under 25 (75%) or aged 25‐49 (72%).
Those with household incomes of $50,000‐
$150,000 (68%) or over $150,000 (77%).
University graduates (71%).
Those aged 50‐69 (56%), and those aged 70+
(37%).
Those with a household income under $50,000
(55%).
Other Upper North Island (away from main
centres) – 53%.
Those with no qualifications or a school
certificate as their highest qualification (51%).
National and provincial newspapers
(average of 63% use this source)
Those aged 50‐69 (67%), and those aged 70+
(69%).
Respondents living in Auckland, Wellington or
Christchurch (70%, 80%, and 71% respectively).
University graduates (68%).
Those aged under 25 (57%) or aged 25‐49 (60%).
Respondents living away from main centres
(53% of ‘other’ Upper North Island, 51% for
‘other’ Lower North Island, and 50% for ‘other’
South Island).
Radio news
(average of 56% use this source)
Pacific respondents (70%).
Those aged 50‐69 (65%), and those aged 70+
(62%).
Those aged under 25 (38%).
Current affairs television programmes
(average of 49% use this source)
Those aged 50‐69 (57%), and those aged 70+
(59%).
Pacific respondents (71%)
Those who believe that crime in New Zealand is
increasing (53%).
Those aged under 25 (38%), and those aged 25‐
49 (45%).
Local newspapers
(average of 47% use this source)
Those with a household income under $50,000
(53%).
Those aged 70+ (61%).
Respondents living away from main centres
(57% of ‘other’ Upper North Island, 54% for
‘other’ Lower North Island, and 63% for ‘other’
South Island).
Those with a household income of over
$150,000 (32%).
Those aged under 25 (34%).
Respondents living in ‘cities’ (42%).
Television documentaries
(average of 45% use this source)
Those aged 50‐69 (54%), and those aged 70+
(55%).
Those with a school certificate as their highest
qualification (54%).
Maori respondents (54%).
Pacific respondents (62%).
Those who believe that crime in New Zealand is
increasing (50%).
Those aged under 25 (31%) or aged 25‐49 (41%).
Asian respondents (33%).
University graduates (39%).
Reality TV shows
(average of 44% use this source)
Those with a school certificate as their highest
qualification (58%).
Maori respondents (55%).
Pacific respondents (63%).
Those who would struggle to pay an unexpected
expense of $500 (50%).
Those who believe that crime in New Zealand is
increasing (48%).
University graduates (33%).
Page 22
General word of mouth
(average of 43% use this source)
Those aged under 25 (54%).
Maori respondents (51%).
Those with a household income of over
$150,000 (31%).
Those who have not had any contact with the
criminal justice system in the past 2 years (32%).
Experience of relatives, friends, neighbours, or other acquaintances
(average of 31% use this source)
Maori respondents (42%).
Asian respondents (45%).
Those who would struggle to pay an unexpected
expense of $500 (39%).
Those aged 70+ (25%).
Those who have not had any contact with the
criminal justice system in the past 2 years (20%).
TV crime dramas
(average of 25% use this source)
Maori respondents (33%).
Pacific respondents (47%).
No significant differences by demographic group.
Social media sources
(average of 23% use this source)
Those aged under 25 (47%) or aged 25‐49 (28%).
Asian respondents (36%).
Those who would struggle to pay an unexpected
expense of $500 (34%).
Those aged 50‐69 (13%), and those aged 70+
(4%).
Those living in rural areas (17%).
Those with a school certificate as their highest
qualification (17%).
Talk back radio
(average of 15% use this source)
Pacific respondents (28%).
Those aged 50‐69 (18%), and those aged 70+
(20%).
Those living in Auckland (22%).
Those with a technical or trade qualification as
their highest qualification (21%).
Those aged under 25 (7%).
Government information/websites
(average of 6% use this source)
Those with a household income of $150,000 or
higher (11%)
Those living in Wellington (12%).
No significant differences by demographic group.
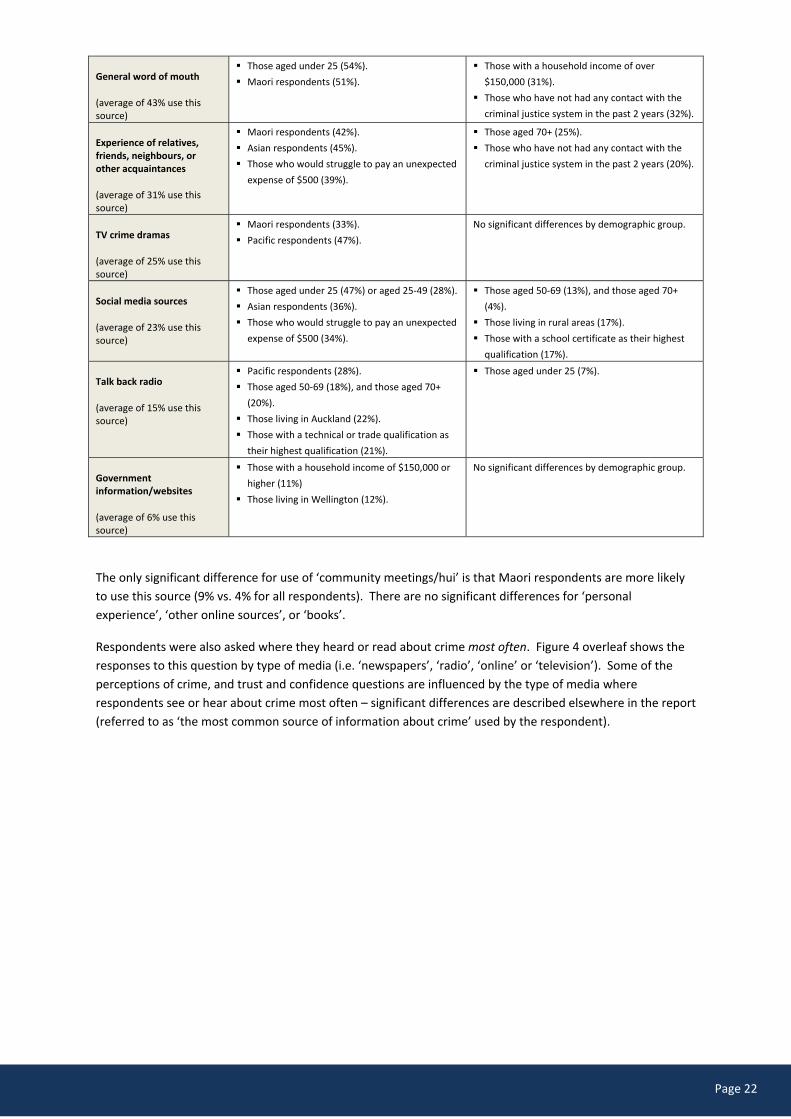
The only significant difference for use of ‘community meetings/hui’ is that Maori respondents are more likely
to use this source (9% vs. 4% for all respondents). There are no significant differences for ‘personal
experience’, ‘other online sources’, or ‘books’.
Respondents were also asked where they heard or read about crime most often. Figure 4 overleaf shows the
responses to this question by type of media (i.e. ‘newspapers’, ‘radio’, ‘online’ or ‘television’). Some of the
perceptions of crime, and trust and confidence questions are influenced by the type of media where
respondents see or hear about crime most often – significant differences are described elsewhere in the report
(referred to as ‘the most common source of information about crime’ used by the respondent).

Page 23
Figure 4: Most common media format used by respondents (to find out information about crime
Figure 4 shows that television is the most commonly used channel, closely followed by newspaper and online
sources. Less than one in ten say radio is their most common source of information about crime.
Q1B “And where do you hear or read about crime MOST OFTEN?”.
Base: All respondents (n=2,001)
37%
22%
23%
8%
3%
1%
6%
TV
Newspaper
Online
Radio
Experience of others or direct experience and word of mouth
Other
No single main source

Page 24
Perceived reliability of different sources of information
about crime
Respondents were asked about the reliability of six different information sources (regardless of whether or not
they used them).
The results are shown in Figure 5.
Figure 5: Reliability of information sources
29%
25%
23%
23%
17%
24%
58%
60%
59%
56%
57%
48%
7%
8%
9%
11%
12%
12%
4%
4%
4%
5%
4%
5%
1
1
1
1
1%
1%
1
3%
4%
4%
8%
9%
Television news
National/provincial newspapers
Radio news
Television documentaries
Local newspapers
Crime statistics
Completely reliable Somewhat reliable Neither Somewhat unreliable Not at all reliable Don’t know
87%
85%
82%
79%
74%
72%
% ‘somewhat’ or ‘completely’ reliable:
Q2. “How reliable or unreliable do you consider the following sources of information about crime?”
Base: All respondents (n=2,001)
87%
88%
86%
82%
81%
79%
% ‘somewhat’ or ‘completely’ reliable (after removing ‘DK’):

Page 25
Most information sources are viewed as reliable (although respondents are more likely to say sources are
‘somewhat reliable’ rather than ‘completely reliable’).
Almost nine in ten say that television news is reliable (either ‘somewhat’ or ‘completely reliable’). The
proportion rating crime statistics as reliable is lower (at just over seven in ten). Even when the findings are re‐
calculated by removing those who say ‘don’t know’ (i.e. focusing analysis on those who do know and provide
an answer) – crime statistics still rate lower than any other information source.
Those with University qualifications are more likely to say that crime statistics are reliable ‐ 77% compared
with 65% of those with a school qualification or no qualification. (There are no other significant variations in
how different groups rate the reliability of crime statistics).
Not surprisingly there is a link between ‘use’ and perceived ‘reliability’. For example, 90% of those who say
radio news is their most common source of information about crime, rate radio news as reliable (compared to
82% of all respondents). This finding applies to each of the information sources investigated.
Perceived knowledge about crime and the criminal justice
system
Respondents were asked how much they knew about various aspects of the criminal justice system and crime
in New Zealand. This was a straightforward self‐reported knowledge question (with the response categories:
‘know a lot’, ‘know quite a lot’, ‘know a little’, and ‘know nothing at all’).
The results are shown in Figure 6 overleaf.

Page 26
Figure 6: Knowledge about different aspects of crime and the criminal justice system
Most respondents say they only know ‘a little’ or ‘nothing at all’ about most aspects of the criminal justice
system and crime in New Zealand. This ranges from as high as 87% who know a little or nothing at all about
the parole system to 64% who know a little or nothing at all about NZ Police.
Respondents are more likely to say they know more about agencies that deal with the earlier stages of the
criminal justice system. 35% say they know a lot, or quite a lot, about the police. 22% say they know a lot, or
quite a lot, about the criminal court system. The equivalent proportion for fines and other monetary penalties
is 21%.
On the other hand, only 16% say they know a lot, or quite a lot, about the bail system, the equivalent
proportions are 15% for prisons and 11% for the parole system.
Around a third say they know about the types of crime, and the volume of crime, occurring in New Zealand.
Generally speaking respondents from higher income households, or those with University qualifications, know
more than others. In addition, males tend to say they know more than females.
Table 3 overleaf outlines the significant differences in knowledge for each aspect of crime and the criminal
justice system.
8%
7%
5%
6%
5%
4%
4%
5%
3%
3%
27%
28%
23%
16%
16%
14%
11%
10%
10%
8%
59%
60%
63%
59%
63%
62%
56%
59%
54%
55%
5%
4%
6%
17%
15%
18%
27%
24%
31%
32%
1
1
2%
1%
2%
1%
2%
2%
2%
2%
NZ Police
The types of crime happening in NZ
How much crime is happening in NZ
Criminal court system
Fines & other monetary penalties
Community based sentences
Bail system
Prisons
Support services for crime victims
Parole system
A lot Quite a lot A little Nothing at all Don’t know
35%
35%
28%
22%
21%
18%
16%
15%
13%
11%
% know ‘quite a lot’ or ‘a lot’:
Q3. “People have different levels of knowledge about crime and the criminal justice system. How much do you feel you know about the following?”
Base: All respondents (n=2,001)
64%
64%
69%
77%
78%
81%
83%
83%
85%
87%
% know ‘a little’ or ‘nothing at all’

Page 27
Table 3: Significant differences in perceived knowledge by demographic group
Groups significantly more likely than average to say they know ‘a lot’ or ‘quite a lot’:
Groups significantly less likely than average to say they know ‘a lot’ or ‘quite a lot’:
NZ Police
(average of 35% know ‘a lot’ or ‘quite a lot’)
Males (41%)
Those with a household income of over
$150,000 (45%).
Other European ethnicity (24%)
Females (30%)
Those aged 25‐49 (31%)
Those who have not encountered the criminal
justice system in the past 2 years (28%).
Types of crime happening
(average of 35% know ‘a lot’ or ‘quite a lot’)
No significant differences by demographic group. Those aged 25‐49 (31%)
Those who have not encountered the criminal
justice system in the past 2 years (27%).
How much crime is happening
(average of 28% know ‘a lot’ or ‘quite a lot’)
No significant differences by demographic group. Those aged 25‐49 (25%)
Those who have not encountered the criminal
justice system in the past 2 years (23%).
Criminal court system
(average of 22% know ‘a lot’ or ‘quite a lot’)
Those with a household income of over
$150,000 (34%)
Those living in the Wellington region (30%)
Those with a University qualification (29%).
Those who have not encountered the criminal
justice system in the past 2 years (16%).
Fines & monetary penalties
(average of 21% know ‘a lot’ or ‘quite a lot’)
Maori respondents (27%)
Those aged 18‐24 (28%).
Those aged 70+ (15%)
Those who have not encountered the criminal
justice system in the past 2 years (12%).
Community based sentences
(average of 18% know ‘a lot’ or ‘quite a lot’)
Maori respondents (24%).
Those who have not encountered the criminal
justice system in the past 2 years (11%).
Prisons
(average of 15% know ‘a lot’ or ‘quite a lot’)
Those with a household income of over
$150,000 (22%)
Those with a University qualification (18%).
Those who have not encountered the criminal
justice system in the past 2 years (10%).
Bail system
(average of 15% know ‘a lot’ or ‘quite a lot’)
Males (18%).
Those aged 18‐24 (20%).
Those with a University qualification (25%).
Females (13%)
Support services for victims
(average of 13% know ‘a lot’ or ‘quite a lot’)
Maori respondents (21%)
Pacific respondents (23%)
Those who have not encountered the criminal
justice system in the past 2 years (7%).
Parole system
(average of 11% know ‘a lot’ or ‘quite a lot’)
Those with a household income of over
$150,000 (21%)
No significant differences by demographic group.

Page 28
We counted the number of times a respondent gave an answer of ‘a lot’ or ‘quite a lot’ to these questions and
created four different ‘perceived knowledge groups’ (please refer to page 15 in the methodology section of
the report for details of how these groups were created). The size of each group is illustrated in a table in
Appendix B.
The four knowledge groups are used in subgroup analysis throughout this report. (It should be noted that the
knowledge level is only based on self‐reported knowledge, we did not include any ‘knowledge tests’ to
determine someone’s level of knowledge).
In some places in the report we merge together two of the four knowledge groups when required for analysis
(normally this is done to enlarge the sample sizes of knowledge categories in order to increase the robustness
of subgroup analysis).

Page 29
Public perceptions about crime in the local
neighbourhood and crime at a national level
Crime problem in local neighbourhood
Respondents were asked whether they thought there was a crime problem in their local neighbourhood.
(‘Local neighbourhood’ was defined as the area within 15 minutes’ walk of their home). 7% of respondents
have not lived in their local neighbourhood for the past twelve months – these respondents were removed
from the analysis of this question. The results are illustrated in Figure 7 below.
Figure 7: Perceptions about a crime problem in the local neighbourhood
In total 35% of respondents who have lived in their local neighbourhood for the past twelve months say there
is a crime problem in their local neighbourhood. 55% say there is not a crime problem, and 11% do not know.
35%
55%
11%
Yes No Don't know
Q4. “We’d like to ask you some questions about your local neighbourhood. (Your ‘local neighbourhood’ is the area within 15 minutes walk of your home). Do you think there is a crime problem in your local neighbourhood?”
Base: All respondents who have lived in local neighbourhood for the past 12 months (n=1,849)

Page 30
The following groups are more likely than average to believe there is a crime problem in their neighbourhood:
Maori respondents (50%)
Those with a household income up to $30,000 (43%)
Those who would struggle to pay an unexpected expense of $500 (42%)
Those living in Hamilton (48%)
Those living in the Auckland region (40%)
Those who say ‘word of mouth’ or ‘direct experience’ is their most commonly used source of information about crime (47%).
It should be noted that those living in the Wellington region are less likely to say there is a crime problem
(27%), as are those living in the South Island outside of Christchurch and Dunedin (25%).
Those living in rural areas are less likely to say there is a problem (21%, compared with 36% of those living in
cities and 37% of those living in towns).
Perceptions about the change in local neighbourhood crime
over the past year
Respondents who had lived in their local neighbourhood area for the past year were asked whether they felt
crime in their local neighbourhood has increased, decreased, or stayed the same over the past year (they were
asked about total levels of neighbourhood crime, as well as violent crime, burglary, and crime committed by
young people aged under 17). Results are illustrated in Figure 8 below.
Figure 8: Perceptions about crime increasing or reducing in the local neighbourhood
3%
2%
3%
4%
7%
6%
7%
9%
35%
47%
43%
41%
20%
16%
10%
20%
6%
5%
2%
4%
30%
24%
34%
23%
Crime committed by youngpeople (aged under 17)
Burglary
Violent crime
Total neighbourhood crime
Reduced a lot Reduced a little Stayed the same Increased a little Increased a lot Don’t know
9%
8%
11%
12%
% reduced ‘a lot’ or ‘a little’:
Q5. “Please think about the amount of crime in your local neighbourhood and whether or not this has changed over the past 12 months. How has the amount of … changed in the past 12 months?”
Base: All respondents excluding those who have not lived in local neighbourhood for past 12 months (n=1,849)
26%
21%
12%
23%
% increased ‘a lot’ or ‘a little’:

Page 31
The largest proportion of respondents, 41%, say that the total amount of crime in the local neighbourhood has
remained the same over the past year. 23% think that neighbourhood crime has increased, 12% think that
neighbourhood crime has decreased, and a further 23% do not know.
It should be noted that more respondents think that crime in the local neighbourhood is increasing rather than
decreasing (23% say it has increased and 12% say it has decreased).
26% think that crime committed by young people locally had increased in the past year, 21% think that
burglary had increased, and only 12% think that violent crime in the neighbourhood had increased.
Those who say that local newspapers are their most common source of information about crime are more
likely to say that burglary and violent crime has reduced in the past year (15% and 19% respectively, compared
to 8% and 11% among all respondents).
Whereas those who say their most common source of information about crime is either word or mouth, their
own experience, or the experience of others, are more likely to say that burglary, violent crime, and crime by
young people in the local neighbourhood has increased (34%, 22%, and 41% respectively, compared to 21%,
12% and 26% among all respondents).
The following groups are more likely to believe that total neighbourhood crime has increased:
Maori respondents (32%)
Those living in towns (29% ‐ compared with 21% of those living in cities and 18% of those living in rural areas).
Respondents aged 70+ are more likely to believe that total neighbourhood crime has decreased (21% ‐
compared to 12% among all respondents).

Page 32
Perceptions about the change in national crime over the
past year
Respondents were then asked whether they thought national crime had increased, decreased, or stayed the
same over the past year. Results are illustrated in Figure 9 below.
Figure 9: Perceptions about national crime increasing or reducing
A large proportion, 60%, say that total national crime has increased over the past year. 34% say it has stayed
the same and 12% say it has decreased. 10% say they do not know.
Almost two‐thirds think that, at a national level, violent crime and crime committed by young people has
increased in the past year (66% and 65% respectively believe these two types of crime have increased). Just
over half (54%) believe that burglary has increased at a national level.
There are a number of differences in perceptions about increases in national crime by demographic subgroup.
Table 4 overleaf outlines the significant differences in perceptions about national crime increasing. Generally
speaking older respondents are more likely to believe national crime is increasing, as are Maori respondents,
females, and those with no formal education qualification beyond school.
Because of the importance of media, we have also included analysis by the most common source of
information about crime. This analysis shows that those who use TV as their most common source of
information about crime are more likely to believe that national crime is increasing (there are no significant
differences by other common sources of information about crime).
1
1%
1%
1
5%
10%
8%
11%
17%
22%
15%
18%
36%
32%
34%
34%
28%
22%
32%
26%
12%
13%
10%
10%
Crime committed by youngpeople (aged under 17)
Burglary
Violent crime
Total national crime
Reduced a lot Reduced a little Stayed the same Increased a little Increased a lot Don’t know
5%
10%
9%
12%
% reduced ‘a lot’ or ‘a little’:
Q6. “Now please think about the amount of crime in the country as a whole and whether or not this has changed over the past 12 months. How has the amount of … changed in the past 12 months?”
Base: All respondents (n=2,001)
65%
54%
66%
60%
% increased ‘a lot’ or ‘a little’:

Page 33
Table 4: Significant differences in perceptions about national crime increases by demographic group
Groups significantly more likely than average to say this has
increased:
Groups significantly less likely than
average to say this has increased:
Total national crime
(average of 60% say this has increased ‘a lot’ or ‘a little’ over the past year)
Those who use TV as their most common source of
information about crime (64%)
Females (66%)
Maori respondents (69%)
Those aged 50‐69 (66%)
Those living in the Upper North Island outside of the main
centres (67%)
Those with no education qualification beyond school (72%).
Males (53%)
Those aged 18‐24 (47%)
Those with a household income over
$150,000 (49%)
Those living in Wellington (52%)
Those living in cities (55%)
Have a University qualification (52%).
Crime committed by young people
(average of 65% say this has increased ‘a lot’ or ‘a little’ over the past year)
Those who use TV as their most common source of
information about crime (69%)
Females (69%)
Maori respondents (75%)
Those aged 50‐69 (72%) or 70+ (72%)
Those living in the Upper North Island outside of the main
centres (73%)
Those with no education qualification beyond school (73%)
Lower perceived knowledge about the criminal justice
system (70%)*.
Those who use the Internet as their
most common source of information
about crime (59%)
Males (60%)
Those aged 18‐24 (52%)
Those living in Wellington (57%)
Higher perceived knowledge about the
criminal justice system (62%).*
Burglary
(average of 54% say this has increased ‘a lot’ or ‘a little’ over the past year)
Those who say word of mouth and the experience of
self/others is their most common source of information
about crime (68%)
Females (59%)
Maori respondents (64%)
Those aged 50‐69 (61%) or 70+ (61%)
Those living in the Upper North Island outside of the main
centres (62%)
Those living in the Lower North Island outside of the main
centres (62%)
Those living in rural areas (62%)
Those with no education qualification beyond school (66%).
Those who use Internet as their most
common source of information about
crime (47%)
Males (49%)
Those aged 18‐24 (45%) or 25‐49 (50%)
Those with a household income over
$150,000 (44%)
Those living in Wellington (42%)
Those with a University qualification
(47%).
Violent crime
(average of 66% say this has increased ‘a lot’ or ‘a little’ over the past year)
Those who use TV as their most common source of info
about crime (71%)
Females (71%)
Maori respondents (79%)
Those aged 50‐69 (76%) or 70+ (75%)
Living in Upper North Island outside of main centres (73%)
Those with no education qualification beyond school (79%)
Lower perceived knowledge about the criminal justice
system (71%)*.
Males (61%)
Asian respondents (54%)
Those aged 18‐24 (48%)
Household income over $150,000 (57%)
Those living in Wellington (58%)
Those living in cities (62%)
University qualification (57%)
Higher perceived knowledge about the
criminal justice system (64%).*
*In this analysis lower levels of knowledge about the crime and criminal justice system is defined in this table as claiming to know either ‘quite a lot’ or ‘a lot’ about up to two aspects of crime and the criminal justice system (out of 10), whereas a higher level of knowledge is claiming to know about three or more different aspects.

Page 34
Characteristics of those who believe total national crime has increased ‘a lot’ in the past year
26% of respondents believe that total national crime has increased ‘a lot’ in the past year. Their characteristics
are broadly the same as those outlined in the first column of the table above, however, there are three distinct
characteristics that particularly stand‐out (these three factors are identified by comparing the profile of
respondents that believe crime is increasing ‘a lot’ vs. the profile of all respondents surveyed – and identifying
the 3 largest differences):
1. They are more likely to be females aged 50+ (37% of those who believe crime is increasing a lot are females aged 50+ ‐ whereas 22% of all respondents surveyed are females aged 50+).
2. They are more likely to have no qualification or have a school certificate as their highest qualification (35% of those who believe crime is increasing a lot, compared to 23% of all respondents).
3. Non‐city dwellers (55% of those who believe crime is increasing a lot say they live outside of cities – compared to 47% of all respondents).
This group (i.e. those who believe total national crime has increased a lot) have lower than average confidence
in the effectiveness of the criminal justice system (19% are either completely confident or fairly confident in
the criminal justice system, this compares with 31% of all respondents).
Page 35
Comparing perceptions about increases in local
neighbourhood crime and increases in national crime
Respondents are more likely to express a viewpoint about the change in national crime than they are to
express a viewpoint about the change in local neighbourhood crime (only 10% say they ‘do not know’ how
total national crime has changed, whereas 23% say they ‘do not know’ how total neighbourhood crime has
changed).
Another key difference is that a much higher proportion of respondents believe that national crime has
increased (compared with the equivalent proportion for crime in the local neighbourhood). The figure below
shows perceptions about increases in national crime and increases in local neighbourhood crime.
Figure 10: Perceptions about national crime and local neighbourhood crime increases
The proportion of respondents who think that total national crime has increased in the past year is much
larger than the proportion of respondents who think that total crime in the local neighbourhood has increased
in the past year (60% vs. 23%).
65%
26%
54%
21%
66%
12%
60%
23%
Q5. ““Please think about the amount of crime in your local neighbourhood and whether or not this has changed over the past 12 months. How has the amount of … changed in the past 12 months?”
Q6. “Now please think about the amount of crime in the country as a whole and whether or not this has changed over the past 12 months. How has the amount of … changed in the past 12 months?”
Base for national level figures: All respondents (n=2,001)Base for local level figures: All respondents excluding those who have not lived in local neighbourhood for past 12 months (n=1,849)

Page 36
65% say that the amount of crime committed by young people at a national level has increased, compared
with 26% at the neighbourhood level. The equivalent proportions for burglary are 54% and 21%. Views about
the increase in violent crime show the largest gap between perceptions about national and local crime. 66%
say that violent crime has increased at a national level whereas only 12% say it has increased at the
neighbourhood level.
Major causes of crime in New Zealand
Respondents were asked for their views on the major causes of crime in New Zealand today. Respondents
could choose more than one answer. Respondents could also provide their own off‐list answers (via an ‘other‐
specify’ option). Results are illustrated in Figure 11 below.
Figure 11: Major causes of crime in New Zealand
Respondents selected a wide range of answers, on average each respondent chose 4.8 answers.
Q7. “In your view, what are the major causes of crime in New Zealand today?”
* Please note the two options highlighted with an asterisk were not offered in the original response list, but came from analysis of the free‐text information contained within the ‘other’ response option.
Base: All respondents (n=2,001)
88%
78%
73%
66%
58%
57%
51%
2%
1%
7%
Drugs
Alcohol
Poor parenting
Unemployment
Breakdown of family
Poverty
Poor education / poor schooling
Loss of values/respect/religion/discipline*
Not enough punishment*
Other

Page 37
A high proportion say that drugs and alcohol are major causes of crime (88% and 78% respectively believe
these to be major causes of crime). 73% say poor parenting is a major cause of crime, 66% say unemployment
is a major cause, 58% say breakdown of family is a major cause, 57% say poverty is a major cause, and 51% say
poor education and poor schooling is a cause.
A minority of respondents gave answers relating to a ‘loss of values’ or ‘lack of punishment’ but these options
were not given in the answer‐list shown to respondents – these answers came from analysis of free‐text given
by respondents in the ‘other‐specify’ answer category.
Some key differences in views exist within the survey population:
Maori and Pacific respondents are more likely than average to mention poverty (64% and 76% respectively).
Respondents aged up to 24 are more likely than average to mention poor education/schooling (58%), whereas older respondents (aged 50+) are more likely to choose all of the causes of crime (with the exception of poverty).
Those with no education qualification (beyond school) are more likely than average to mention drugs, alcohol and unemployment (94%, 84%, and 75% respectively).
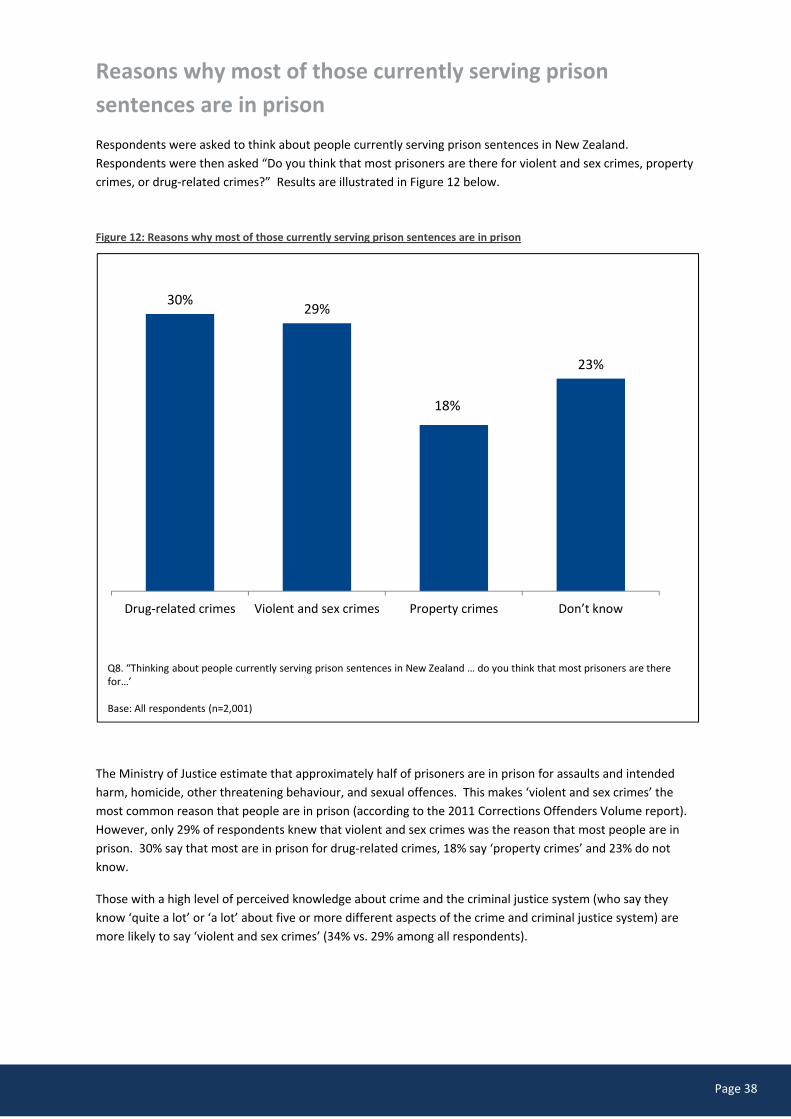
Page 38
Reasons why most of those currently serving prison
sentences are in prison
Respondents were asked to think about people currently serving prison sentences in New Zealand.
Respondents were then asked “Do you think that most prisoners are there for violent and sex crimes, property
crimes, or drug‐related crimes?” Results are illustrated in Figure 12 below.
Figure 12: Reasons why most of those currently serving prison sentences are in prison
The Ministry of Justice estimate that approximately half of prisoners are in prison for assaults and intended
harm, homicide, other threatening behaviour, and sexual offences. This makes ‘violent and sex crimes’ the
most common reason that people are in prison (according to the 2011 Corrections Offenders Volume report).
However, only 29% of respondents knew that violent and sex crimes was the reason that most people are in
prison. 30% say that most are in prison for drug‐related crimes, 18% say ‘property crimes’ and 23% do not
know.
Those with a high level of perceived knowledge about crime and the criminal justice system (who say they
know ‘quite a lot’ or ‘a lot’ about five or more different aspects of the crime and criminal justice system) are
more likely to say ‘violent and sex crimes’ (34% vs. 29% among all respondents).
30%29%
18%
23%
Drug‐related crimes Violent and sex crimes Property crimes Don’t know
Q8. “Thinking about people currently serving prison sentences in New Zealand … do you think that most prisoners are there for…’
Base: All respondents (n=2,001)

Page 39
Trust and confidence questions
NZ Police
Respondents were asked how much they agreed or disagreed with a range of statements describing views on
New Zealand Police. Results are illustrated in Figure 13 below.
Figure 13: Views on NZ Police
Around six in ten agree that NZ Police are visible in the community, use force appropriately and treat people
with respect. Around half agree that NZ Police can be relied upon to respond when called and treat all ethnic
groups fairly. Only 37% agree that NZ Police successfully prevent crime.
However, it should be noted that most of those who do not agree are ambivalent (i.e. have a neutral
viewpoint) rather than negative (i.e. disagreement levels are relatively low compared with other statements
about the latter stages of the criminal justice system (i.e. criminal courts, prisons, and parole) in the survey).
Views vary within the survey population. Table 5 shows significant differences in views by subgroup. Older
respondents are generally more positive than younger respondents about the police, and Maori respondents
are generally less positive than average.
9%
15%
9%
7%
7%
4%
51%
43%
48%
44%
39%
33%
19%
24%
28%
25%
29%
37%
16%
8%
10%
17%
15%
20%
3%
2%
3
4%
3%
4%
7%
2
3%
7%
2%
Police are visible in my community
Police use force appropriately
Police treat people with respect
Police can be relied upon to respond when called
Police treat all ethnic groups fairly
Police successfully prevent crime
Strongly agree Agree Neither agree nor disagree Disagree Strongly disagree Don’t know
61%
59%
57%
52%
46%
37%
% ‘strongly agree’ or ‘agree’:
Q9. “The following questions are about your views on NZ Police. To what extent do you either agree or disagree with the following statements… ?”
Base: All respondents (n=2,001)

Page 40
Table 5: Significant differences in views about NZ Police by demographic group
Groups significantly more likely than average to ‘strongly agree’ or ‘agree’
Groups significantly less likely than average to ‘strongly agree’ or ‘agree’:
Police are visible in community
(average of 61% ‘strongly agree’ or ‘agree’)
Aged 18‐24 (68%)
Those living in the Upper North Island away
from the main centres (67%) and those living in
the South Island away from the main centres
(70%)
Males (65%).
Aged 50‐69 (56%)
Those who have not had contact with the
criminal justice system in the past 2 years (54%).
Females (57%).
Police use force appropriately
(average of 59% ‘strongly agree’ or ‘agree’)
NZ European (62%)
Aged 70+ (68%)
Those with a high level of perceived knowledge
about crime and the criminal justice system (i.e.
they say they know 5 or more aspects) (65%).
Maori respondents (47%)
Pacific respondents (44%)
Asian respondents (48%)
Aged 18‐24 (52%).
Police treat people with respect
(average of 57% ‘strongly agree’ or ‘agree’)
Aged 70+ (69%)
Those with a University qualification (63%).
Maori respondents (42%)
Those who would struggle to pay an unexpected
bill of $500 (49%).
Police can be relied upon to respond when called
(average of 52% ‘strongly agree’ or ‘agree’)
Aged 18‐24 (59%)
Those living in the Wellington region (61%)
Those with a University qualification (58%).
No significant differences in this cell of the table.
Police treat all ethnic groups fairly
(average of 46% ‘strongly agree’ or ‘agree’)
Aged 70+ (54%).
Maori respondents (32%)
Those with no perceived knowledge of crime
and the criminal justice system (42%).
Police successfully prevent crime
(average of 37% ‘strongly agree’ or ‘agree’)
Aged 70+ (45%)
Those living in the Wellington region (44%).
Maori respondents (28%)
Those who would struggle to pay an unexpected
bill of $500 (28%).
Appendix C contains analysis investigating significant differences among demographic subgroups regarding the
proportion that are more or less likely to disagree (either ‘disagree’ or ‘strongly disagree’).

Page 41
Criminal courts
Respondents were asked how much they agreed or disagreed with a range of statements describing views on
New Zealand’s criminal courts. Results are illustrated in the figure below.
Figure 14: Views on criminal courts
Despite the fact that over three‐quarters admitted to knowing only a little, or nothing at all, about the criminal
court system, most respondents are negative or ambivalent about New Zealand’s criminal courts.
It should be noted that a relatively large proportion of respondents say ‘don’t know’ to questions about courts
(ranging from 14% for ‘criminal court processes are easy for the public to understand’ to 32% for ‘NZ’s criminal
court system is technologically up to date’).
The first statement in the figure above is not a positive finding, as 61% agree that ‘offenders often get away
without paying court fines’ suggesting that most respondents do not have confidence in the ability to collect
and enforce fines.
Although just over half (52%) agree that criminal courts protect offenders’ rights, a much lower proportion
(28%) agree that court processes treat victims with respect.
Only 7% agree that criminal courts deal with cases without unnecessary delay.
Those who have served on a jury in the past two years are more positive than average about some aspects of
the criminal court system, including: being technologically up to date (22%), having processes that are easy for
the public to understand (24%), and protecting offenders rights (64%). This is not the case with those who
22%
10%
2
1
1
1
39%
44%
26%
13%
13%
11%
6%
14%
26%
32%
31%
30%
21%
21%
5%
3
17%
17%
34%
36%
40%
2%
1
5%
5%
8%
16%
15%
18%
16%
17%
32%
14%
15%
17%
Offenders often get away without paying court fines
Criminal court processes protect offenders' rights
Criminal court processes treat victims with respect
NZ's criminal court system is technologically up to date
Criminal court processes are easy for the public tounderstand
Bail decisions take appropriate account of public safety
Criminal courts deal with cases without unnecessary delay
Strongly agree Agree Neither agree nor disagree Disagree Strongly disagree Don’t know
61%
54%
28%
14%
14%
12%
7%
% ‘strongly agree’ or ‘agree’:
Q10. “The questions below are about your views on New Zealand’s criminal courts. How much do you agree or disagree with the following statements… ?”
Base: All respondents (n=2,001)

Page 42
have attended court as a witness or support person (the views of witnesses and support persons do not
significantly vary from the general population of respondents).
Views about criminal courts vary by different demographic groups as described in table 6 below.
Table 6: Significant differences in views of criminal court by demographic group
Groups significantly more likely than average to ‘strongly agree’ or ‘agree’
Groups significantly less likely thanaverage to ‘strongly agree’ or ‘agree’:
Offenders often get away without paying court fines (average of 61% ‘strongly agree’ or ‘agree’)
Those aged 50‐69 (72%) Those aged 70+ (83%) Those with no qualification beyond school
(70%) Those who say newspapers are their most
commonly used source of information about crime (67%).
Those aged up to 24 (36%) Those aged 25‐49 (55%) Asian respondents (45%) Pacific respondents (42%) Those living in the Wellington region (54%) Those living in Dunedin (50%) Those who would struggle to pay an unexpected
expense of $500 (54%) Those who say the Internet is their most
commonly used source of information about crime (54%).
Criminal court processes protect offenders’ rights (average of 54% ‘strongly agree’ or ‘agree’)
Those aged 50‐69 (62%) Those aged 70+ (63%) Those with high perceived knowledge of the
criminal justice system (62% for those who say they know 3 or 4 aspects and 68% for those who say they know 5 or more aspects)
Those who say newspapers are their most commonly used source of information about crime (62%).
Those aged up to 24 (47%) Those aged 25‐49 (48%) Those living in Dunedin (42%) Those who would struggle to pay an unexpected
expense of $500 (48%) Those who say they do not know anything about
the criminal justice system (i.e. know about 0 aspects) (44%)
Those who say the Internet is their most commonly used source of information about crime (48%).
Criminal court processes treat victims with respect (average of 28% ‘strongly agree’ or ‘agree’)
Aged 70+ (35%) Asian respondents (38%) Those with high perceived knowledge of the
criminal justice system (36% for those who say they know 3 or 4 aspects and 35% for those who say they know 5 or more aspects).
Maori respondents (17%) Those living in rural areas (21%) Those who say they do not know anything about
the criminal justice system (i.e. know about 0 aspects) (22%).
NZ’s criminal court system is technologically up to date (average of 14% ‘strongly agree’ or ‘agree’)
Those aged 70+ (25%) Asian respondents (26%) Those with high perceived knowledge of the
criminal justice system (20% for those who say they know 3 or 4 aspects and 21% for those who say they know 5 or more aspects).
Those aged 25‐49 (11%).
Criminal court processes are easy for the public to understand (average of 14% ‘strongly agree’ or ‘agree’)
Asian respondents (21%) Those living in the Wellington region (20%). Those with high perceived knowledge of the
criminal justice system (18% for those who say they know 3 or 4 aspects and 20% for those who say they know 5 or more aspects).
Those living in the Upper North Island (away from the main centres) – 9%
Those who say they do not know anything about the criminal justice system (i.e. know about 0 aspects) (10%).
Bail decisions take appropriate account of public safety (average of 12% ‘strongly agree’ or ‘agree’)
Asian respondents (23%) Those living in Christchurch (18%) Those who say direct experience or word of
mouth is their most commonly used source of information about crime (21%).
No significant differences in this cell of the table.
Criminal courts deal with cases without unnecessary delay (average of 7% ‘strongly agree’ or ‘agree’)
Aged up to 24 (15%) Asian respondents (24%) Those who say direct experience or word of
mouth is their most commonly used source of information about crime (19%).
No significant differences in this cell of the table.

Page 43
Appendix C contains analysis investigating significant differences among demographic subgroups regarding the
proportion that are more or less likely to disagree (either ‘disagree’ or ‘strongly disagree’).
Prisons, community sentences, and parole
Respondents were asked how much they agreed or disagreed about a range of statements describing views on
prisons, community sentences and the parole system. Results are illustrated in Figure 15 below.
Figure 15: Views on prisons, community sentences and the parole system
Almost two‐thirds (62%) of respondents agree that prisons keep the public safe by securely containing
offenders. However, views on the other questions in this section are not so positive. For example, less than
one in ten agree that the parole system can be relied upon to safely manage the release of offenders (0.4%
‘strongly agree’ and 8% ‘agree’).
Only 5% agree that prison deters people who have been to prison from re‐offending.
There are particularly high proportions of respondents that say they ‘do not know’ to questions about
community sentences, prisons, and the parole system. For example, 44% do not know whether or not most
people who appear before the Parole Board are initially turned down, and 26% do not know whether or not
people on community sentences are well managed.
11%
1
1
1
0.4%
1
51%
15%
14%
12%
8%
5%
21%
29%
28%
28%
23%
18%
9%
9%
30%
26%
39%
45%
2%
1%
10%
7%
17%
22%
5%
44%
16%
26%
12%
8%
Strongly agree Agree Neither agree nor disagree Disagree Strongly disagree Don’t know
63%
16%
15%
12%
9%
5%
% ‘strongly agree’ or ‘agree’:
Q11. “The following questions are about your views on prisons, community sentences and the parole system. How much do you agree or disagree with the following statements… ?”
Base: All respondents (n=2,001)
Prisons keep the public safe by securely containing offenders
Most people who appear before the Parole Board are initially turned down
Prisons give offenders the help they need to stop offending
People on community sentences are well managed
The parole system can be relied upon to safely manage the release of offenders
Prison successfully deters people who have been to prison from committing crime in
future

Page 44
It is worth noting that despite the fact over eight in ten claim to only know a little, or nothing at all, about
community sentences, prisons, and the parole system – respondents are generally negative in their views
about these aspects of the criminal justice system. A similar finding exists for the criminal court system (i.e.
low perceived knowledge but generally negative views).
Those who have been imprisoned, or know someone who has been imprisoned are more likely than average to
agree that people on community sentences are well managed (22%). Respondents who work in the criminal
justice system (or know someone who does) are also more likely to say this (19%), they are also more likely
than average to agree that most people who appear before the Parole Board are initially turned down (25%).
Views about prison, community sentences and parole vary by different demographic groups as described in
table 7 below. On the whole those who say they know more about the criminal justice system and crime in
New Zealand are more likely than average to agree with more of the statements. Females are less likely than
males to agree with most of the statements.
Table 7: Significant differences in views of prisons, community sentences, and parole by demographic group
Groups significantly more likely than average to ‘strongly agree’ or ‘agree’
Groups significantly less likely than average to ‘strongly agree’ or ‘agree’:
Prisons keep the public safe by securely containing offenders
(average of 63% ‘strongly agree’ or ‘agree’)
Those who have had contact with the criminal
justice system in the past 2 years (64%)
Males (65%)
Those with the highest level of perceived
knowledge about the criminal justice system*
(71%).
Maori respondents (54%)
Those with no qualification beyond school (55%)
Those who have not had contact with the
criminal justice system in the past 2 years (57%)
Females (60%).
Most people who appear before the Parole Board are initially turned down
(average of 16% ‘strongly agree’ or ‘agree’)
Those aged 70+ (23%)
Those with a household income of up to $30,000
(23%)
Those with the highest level of perceived
knowledge about the criminal justice system*
(31%).
Those aged 25‐49 (12%)
Those with the lowest level of perceived
knowledge about the criminal justice system*
(10%).
Prisons give offenders the help they need to stop offending
(average of 15% ‘strongly agree’ or ‘agree’)
Asian respondents (30%)
Those living in Christchurch (21%)
Males (17%)
Those with the highest level of perceived
knowledge about the criminal justice system*
(20%).
Females (14%)
Those with the lowest level of perceived
knowledge about the criminal justice system*
(12%).
People on community sentences are well managed
(average of 12% ‘strongly agree’ or ‘agree’)
Those aged up to 24 (19%)
Those with a household income of up to $30,000
(18%)
Those with the highest level of perceived
knowledge about the criminal justice system*
(19%).
Those with the lowest level of perceived
knowledge about the criminal justice system*
(9%).
The parole system can be relied upon to safely manage the release of offenders
(average of 9% ‘strongly agree’ or ‘agree’)
Asian respondents (21%)
Those aged up to 24 (15%)
Those living in cities (11%)
Males (10%)
Those with the highest level of perceived
knowledge about the criminal justice system*
(15%).
Those aged 70+ (4%)
Those living in rural areas (3%)
Females (7%)
Those with the lowest level of perceived
knowledge about the criminal justice system*
(6%).

Page 45
Prison successfully deters people who have been to prison from committing crime in future
(average of 5% ‘strongly agree’ or ‘agree’)
Asian respondents (16%)
Those aged up to 24 (11%)
Males (8%)
Those with the highest level of perceived
knowledge about the criminal justice system*
(9%).
Those aged 70+ (1%)
Those with no qualification beyond school (2%)
Females (4%)
Those with the lowest level of perceived
knowledge about the criminal justice system*
(3%).
* The highest level of perceived knowledge is defined as the respondent saying they know about five or more different aspects of the criminal justice system and crime in New Zealand (from a total of 10 different aspects). Whereas, the lowest level of perceived knowledge is defined as the respondent saying they know about none of the aspects.
Appendix C contains analysis investigating significant differences among demographic subgroups regarding the
proportion that are more or less likely to disagree (either ‘disagree’ or ‘strongly disagree’).

Page 46
Views on the overall effectiveness of the criminal justice
system
Respondents were asked to think about all the different parts of the criminal justice system (the police, the
courts, the prison, probation and parole systems), and rate how confident they were in the effectiveness of
the criminal justice system as a whole. Results are illustrated in Figure 16 below.
Figure 16: Views on the confidence in effectiveness of the criminal justice system as a whole
In total 31% are either ‘completely confident’ or ‘fairly confident’ that the criminal justice system is effective.
43% are either ‘not very confident’ or ‘not at all confident’ that the criminal justice system is effective. A
notable proportion, 24%, are neutral.
The following groups are more likely than average to be either ‘completely confident’ or ‘fairly confident’
Males (35%)
Those aged 70+ (41%)
Those with higher perceived knowledge of the criminal justice system (i.e. they say they know about 3 or more aspects of crime and the criminal justice system) (36%).
Those who use newspapers as their most common source of information about crime (39% ‐ compared to 29% of those who use TV and 33% of those who use radio as their most common source).
Those with a University qualification (37%).
Those who do not think there is a crime problem in their local neighbourhood (36%)
1%
30%
24%
34%
9%
2%
Completelyconfident
Fairlyconfident
Neutral Not veryconfident
Not at allconfident
Don’t know
Q12. “Thinking about all the different parts of the criminal justice system (the police, the courts, the prison, probation and parole systems), how confident are you that the criminal justice system as a whole is effective?”
Base: All respondents (n=2,001)

Page 47
Those who believe that national crime has decreased in the past year (50%)
Those who have had positive contact with the criminal justice system over the past two years (42%).
The following groups are less likely than average to be either ‘completely confident’ or ‘fairly confident’:
Females (28%)
Maori respondents (21%)
Those living in the Upper North Island (away from the main centres) (26%)
Those with no perceived knowledge of crime or the criminal justice system (i.e. they say they know about 0 aspects) (28%)
Those who believe that crime statistics are unreliable (21%)
Those who think there is a crime problem in their local neighbourhood (27%)
Those who believe that local neighbourhood crime has increased in the past year (26%)
Those who believe that national crime has increased in the past year (26%)
Those who have been a victim of crime in the past two years (24%)
Those who had negative contact with the criminal justice system over the past two years (8%).

Page 48
What would increase confidence in the criminal justice
system?
Respondents were asked for the single most important thing which would increase their confidence in the
criminal justice system. Respondents could only choose one answer, or write in an answer at the other‐specify
option. Results are illustrated in Figure 17 below.
Figure 17: Views on what would increase confidence in the criminal justice system
No one particular answer stands out as the most popular choice. The results include a mixture of preventative,
process‐orientated, rehabilitative and, to a lesser degree, more punitive responses.
Although the most common answer is ‘putting the interests of the victim at the heart of the system’ this was
only selected by a fifth of respondents (20%).
The next most common answers relate to preventing crime (14%), bringing more offenders to justice (11%)
and increasing the availability of rehabilitation programmes (such as drug and alcohol treatment) in the
community (11%). This latter proportion is higher than the proportion that thought the availability of
rehabilitation programmes in prisons would increase their confidence in the system (6%). In total 16% say that
increased availability of rehabilitation programmes would increase their confidence in the system.
Q13. “Looking at the list below, what is the single most important thing that could be done to improve your confidence in New Zealand’s criminal justice system?”
* The response highlighted with an asterisk (‘harsher punishment’) was not offered in the original response list, but came from analysis of the free‐text information contained within the ‘other’ response option.
Base: All respondents (n=2,001)
20%
14%
11%
11%
10%
7%
6%
5%
5%
4%
3%
5%
Put the interests of victims at the heart of the system
Prevent more crime
Bring more offenders to justice
Increase availability of community based rehabilitation programmes
Speed up the delivery of justice
Respond to what matters most to local communities
Increase the availability of rehabilitation programmes in prisons
Harsher punishment*
Provide better opportunities for people being released from prison
Use the latest technology to help tackle crime
Send more people to prison
Something else

Page 49
5% of respondents say that harsher punishment (mainly in the form of longer sentences) would increase their
confidence in the system (but it should be noted that this option was not offered as an answer on the original
response list – rather this was calculated by analysing the free‐text answers from the other‐specify option).
The table below shows how views vary by demographic subgroup. There is a notable divide between young
and old when it comes to ‘putting victims at the heart of the system’ (with older respondents choosing this
option more often than younger respondents).
Table 9: Significant differences in views of measures to increase confidence in the criminal justice system
Groups significantly more likely than average to give this answer:
Groups significantly less likely than average to give this answer:
Put victims at heart of system
(average of 20% selected this answer)
Those aged 50‐69 (27%)
Those aged 70+ (28%)
Those with no qualification beyond school or
a school certificate (26%)
Those living in the Lower North Island away
from the main centres (27%).
Those aged 18‐24 (8%)
Those aged 25‐49 (16%)
Those who have not encountered the
criminal justice system in the past 2 years
(28%).
Prevent more crime
(average of 14% selected this answer)
Asian respondents (24%)
Those living in the Auckland region (17%)
Those with a University qualification (19%).
Those aged 70+ (9%)
Those with a household income of up to
$30,000 (9%).
Bring more offenders to justice
(average of 11% selected this answer)
No significant differences in this cell of the table. Those aged 70+ (5%)
Those with a household income of up to
$30,000 (7%).
Community rehabilitation programmes
(average of 11% selected this answer)
Those aged 18‐24 (15%).
Asian respondents (5%).
Speed up justice
(average of 10% selected this answer)
Those aged 70+ (19%)
Those with no qualification beyond school
(16%).
Those with a University qualification (7%)
Those living in Christchurch (6%).
Respond to local communities
(average of 7% selected this answer)
Maori respondents (11%)
Pacific respondents (21%).
Those aged 70+ (3%).
Rehabilitation programmes in prisons
(average of 6% selected this answer)
No significant differences in the proportions of different subgroups choosing this answer.
Harsher punishment
(average of 5% selected this answer)
Maori respondents (9%)
Those aged 25‐49 (7%).
Those with a household income over
$150,000 (1%).
Opportunities for people released from prison
(average of 5% selected this answer)
No significant differences in the proportions of different subgroups choosing this answer.
Latest technology
(average of 4% selected this answer)
Asian respondents (12%)
Those who have had very positive contact
with the criminal justice system in the past 2
years (7%).
Those with a University qualification (2%)
Send more people to prison
(average of 3% selected this answer)
Those living in Hamilton (10%)
Those living in Christchurch (7%).
No significant differences by demographic
group in this cell of the table.

Page 50
Further analysis examining the relationship between
perceptions of crime and trust and confidence
This chapter investigates how various survey measures interact with each other, such as the relationship
between overall confidence in the criminal justice system and views on individual aspects of the system and
perceptions about crime levels. We also examine the link between perceived knowledge of the criminal justice
agencies and trust and confidence in them.
First of all we explore relationships between the various individual questions about perceptions of crime.
Relationships between the different perceptions‐of‐crime
questions
Link between perceptions about different types of crime and total crime
The following analysis shows that most people who believe that individual types of crime are increasing, also
believe that total crime is increasing (and vice‐versa). At a national level, there is a particularly strong link
between perceptions about changes in the level of violent crime and changes in the total level of crime.
Views about different types of crime at a national level (burglary, violent crime and youth crime) correlate
strongly with views about total national crime. The three correlations are ‘the change in violent crime at a
national level’ (correlation of 0.78 with ‘the change in total crime at a national level’), ‘the change in burglary
at a national level’ (0.75), and ‘the change in youth crime at a national level’ (0.74). This suggests that those
who believe that different aspects of national crime are increasing also believe that total national crime is
increasing and vice‐versa – this is particularly the case for violent crime.
A strong relationship between perceptions about different types of local neighbourhood crime and total crime
in the neighbourhood also exists. The three correlations are ‘the change in violent crime at a local level’
(correlation of 0.73 with ‘the change in total crime at a local level’), ‘the change in burglary at a local level’
(0.76), and ‘the change in youth crime at a local level’ (0.76).
Link between perceptions about local neighbourhood crime and total national crime
There is a correlation between views on changes in total neighbourhood crime and views on changes in total
national crime, but the strength of the relationship is only moderate (0.29). This suggests that, more often
than not, people who believe local crime is increasing also believe national crime is increasing (and vice‐versa).
However, there are mixed views, with some individuals believing crime trends are very different in their local
neighbourhood compared with crime trends at the national level. (This is reflected in the fact that half of
respondents who believe local neighbourhood crime is decreasing believe that national crime is increasing).

Page 51
Link between perceptions about crime levels and
confidence in the criminal justice system
There is a link between perceptions about change in national crime levels and overall confidence in the
criminal justice system, this is reflected in the following two proportions:
50% of those who believe national crime is decreasing are confident in the effectiveness of the criminal justice system (compared to 31% of all respondents). And only 26% are not confident (compared to 43% of all respondents).
26% of those who believe national crime is increasing are confident in the effectiveness of the criminal justice system (compared to 31% of all respondents). And 52% are not confident (compared to 43% of all respondents).
(The exact correlation score between the two measures is described in table 10 overleaf).
There is not a strong link between perceptions about change in local neighbourhood crime levels and
confidence in the criminal justice system.
It should also be noted that there are no moderate or strong correlations between views on national crime
levels and views on individual aspects of the criminal justice system. For example, views on the success of
police in preventing crime do not correlate very highly with views about whether or not total national crime is
increasing or decreasing.
However, there are some moderate correlations between overall confidence in the effectiveness of the
criminal justice system and views on individual aspects of the criminal justice system (described below).
The relationship between confidence in the criminal justice
system and other trust and confidence measures
We conducted further analysis investigating how confidence in the effectiveness of the criminal justice system
relates to confidence in various individual aspects of the criminal justice system (i.e. the trust and confidence
questions about police, the courts, the parole system, prison and community sentences) and also overall
perceptions about crime (i.e. whether crime is increasing or decreasing).
The correlation analysis aims to identify common concerns that relate to confidence in the criminal justice
system. The five largest correlations are indicated in the table overleaf, if there are negative perceptions
about one of these particular variables, then there is also a tendency to have lower confidence in the criminal
justice system overall (and vice‐versa). It should be noted that these correlations are only moderate (ranging
from 0.23 to 0.28) and so are not strong correlations.

Page 52
Table 10: Correlations between public perception rating statements and confidence in the criminal justice
system
Views on crime or attitude towards the criminal justice system Correlation against confidence in the
criminal justice system
Perception about the change in national crime levels (Q6_4) 0.28
Police successfully prevent crime (Q9_2) 0.26
Perception about the change in violent crime at a national level (Q6_2)
0.25
Perception about the change in crime committed by young people at a national level (Q6_3)
0.23
Police can be relied upon to respond when called (Q9_5) 0.23
As stated previously, there is a link between views on national crime trends and confidence in the criminal
justice system. Views about rends in violent crime and the views of the police in New Zealand (particularly
their success at preventing crime and responding when called) are also linked to overall confidence in the
criminal justice system. Views on the courts and prisons, community sentences and parole do have some
relationship with overall confidence, but the relationship is not strong enough to produce a ‘moderate
correlation’ (and hence do not appear in the table above).

Page 53
Link between perceived knowledge of criminal justice
agencies and trust and confidence in them
Earlier in the report we discussed self‐reported knowledge of the criminal justice agencies.
In this section we examine the link between perceived knowledge and trust and confidence. For five different
parts of the criminal justice system we calculated a ‘knowledge’ score and a ‘trust and confidence’ score. The
method is outlined below.
Method used to calculate knowledge scores and trust and confidence scores
Knowledge scores were calculated by examining Question 3 (about perceived level knowledge) and
determining an average score based upon the following:
If an individual respondent answered that they ‘know a lot’ this was given a score of 4
‘Know quite a lot’ was given a score of 3
‘Know a little’ was given a score of 2
‘Know nothing at all’ or ‘don’t know’ was given a score of 1.
The resulting knowledge score for five different parts of the criminal justice system are:
NZ Police – 2.37 average score across all respondents
Criminal court system – 2.09
Prisons – 1.94
The bail system – 1.91
The parole system – 1.81
We then calculated an average ‘trust and confidence’ score based on the following questions:
NZ Police – a trust and confidence score was calculated based on the average finding from the following questions: ‘Police treat all ethnic groups fairly’, ‘Police successfully prevent crime’, ‘Police are visible in my community’, ‘Police treat people with respect’, ‘Police can be relied on to respond when called’ and ‘Police use force appropriately (e.g., physical force, pepper spray, TASER)’.
Criminal court system ‐ a trust and confidence score was calculated based on the average finding from the following questions: ‘NZ’s criminal court system is technologically up to date’, ‘Criminal court processes are easy for the public to understand’, ‘Criminal courts deal with cases without unnecessary delay’, ‘Criminal court processes treat victims with respect’, ‘Criminal court processes protect offenders’ rights’.
Prisons – a trust and confidence score was calculated based on the average finding from the following questions: ‘Prison successfully deters people who have been to prison from committing crime in future’, ‘Prisons give offenders the help they need to stop offending’ and ‘Prisons keep the public safe by securely containing offenders’.
The bail system – a trust and confidence score was calculated based on the average answer given to this question: ‘Bail decisions take appropriate account of public safety (bail is when people are released before their trial)’.
The parole system – a trust and confidence score was calculated based on the average answer given to this question: ‘The parole system can be relied upon to safely manage the release of offenders’.

Page 54
Trust and confidence scores were based on how much each respondent agreed or disagreed as follows:
‘Strongly agree’ was given a score of 5
‘Agree’ was given a score of 4
‘Neither agree nor disagree’ was given a score of 3
‘Disagree’ was given a score of 2
‘Strongly disagree’ was given a score of 1
‘Don’t know’ was removed from the calculation (i.e. does not impact the average trust and confidence score).
The resulting average trust and confidence scores for five different parts of the criminal justice system are:
NZ Police – 3.5
Criminal court system – 3.48
Prisons – 3.1
The bail system – 2.89
The parole system – 2.73
Results of knowledge scores and trust and confidence scores across five different aspects of the criminal
justice system
The results of analysis are charted in figure below.
Figure 18: Perceived Knowledge vs. Trust and confidence:
1.70
1.80
1.90
2.00
2.10
2.20
2.30
2.40
2.7 2.8 2.9 3 3.1 3.2 3.3 3.4 3.5 3.6
Perceived
Knowledge
Trust and confidence
Parole system
Bail system
Prisons
Police
Criminal courts

Page 55
Figure 18 shows that there is a link between perceived knowledge and trust and confidence. The police are
the most well‐known part of the criminal justice system and they also receive relatively positive trust and
confidence ratings from respondents. At the other end of the scale, the parole system is not well known, and
receives low trust and confidence ratings. A trend‐line in the graph illustrates the relationship between
perceived knowledge and trust and confidence.
Page 56
Conclusions
The survey investigated a wide range of perceptions about the criminal justice system and crime in New
Zealand. Below we draw some key conclusions about the overall themes emerging from the report.
People use a wide variety of sources of information about crime in New Zealand and most people rate key information sources as reliable.
Most people say they only know a little bit or nothing at all about the criminal justice system and crime in New Zealand. People are more likely to say they know more about agencies that deal with the earlier, more visible, stages of the criminal justice system – such as police, and to a lesser extent courts and fines. Not many claim to know about the parole system, prison or community sentences.
Despite this low level of perceived knowledge, many still express negative or ambivalent views about the different parts of the criminal justice system. In fact people reserve their most negative views for those parts of the system they know least about. For example, only 11% say they know quite a lot, or a lot, about the Parole system but only 9% agree that the Parole system can be relied upon to safely manage the release of offenders (56% disagree). A similar finding exists for the criminal court system (i.e. low perceived knowledge but generally negative views). At the other end of the scale, the Police are more well‐known and they also tend to receive relatively positive trust and confidence ratings.
There is a large gap between perceptions about national crime trends and local crime trends. Around two‐thirds of people believe that national crime has increased over the past year, but only a quarter of people believe that local crime has increased over the past year. Views about violent crime show the largest gap between perceptions at a national and local level – 66% say that violent crime has increased at a national level, whereas only 12% say it has increased at a local level.
Confidence in the effectiveness of the criminal justice system is not particularly high (just under a third are confident). There is no one particular course of action which would increase peoples’ confidence. This is because there are a variety of viewpoints about what would increase confidence. Suggested measures include a mixture of preventative, process‐orientated, rehabilitative and, to a lesser degree, more punitive responses.
There is a link between perceptions about national crime trends and confidence in the criminal justice system. However, there is no noticeable link between perceptions about local crime trends and confidence in the criminal justice system.
Views on national crime trends (particularly trends in levels of violent crime) and views about the success of the police (particularly their success at preventing crime and responding when called) are linked to overall confidence in the criminal justice system. (Trust and confidence measures about other parts of the criminal justice system, such as courts and parole, are not strongly linked to overall confidence). This means that those who think that national crime is increasing, and those who have negative views of the police, tend to have lower confidence in the effectiveness of the criminal justice system.
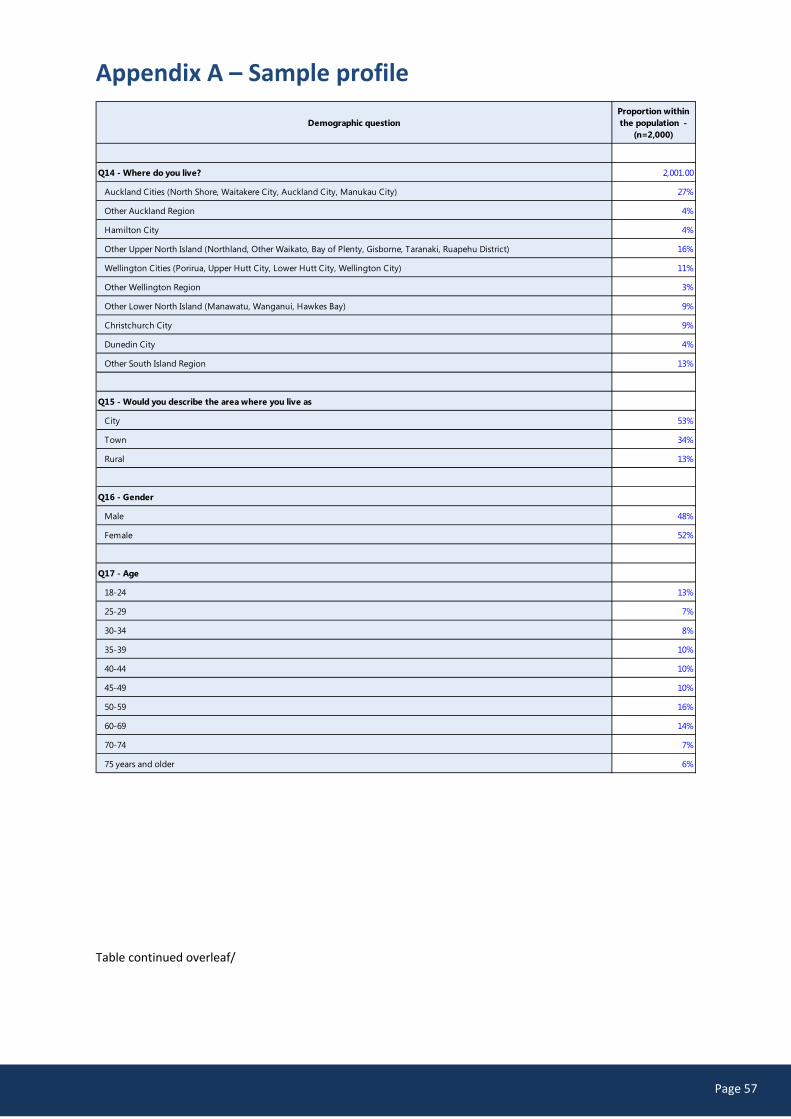
Page 57
Appendix A – Sample profile
Table continued overleaf/
Demographic questionProportion within the population -
(n=2,000)
Q14 - Where do you live? 2,001.00
Auckland Cities (North Shore, Waitakere City, Auckland City, Manukau City) 27%
Other Auckland Region 4%
Hamilton City 4%
Other Upper North Island (Northland, Other Waikato, Bay of Plenty, Gisborne, Taranaki, Ruapehu District) 16%
Wellington Cities (Porirua, Upper Hutt City, Lower Hutt City, Wellington City) 11%
Other Wellington Region 3%
Other Lower North Island (Manawatu, Wanganui, Hawkes Bay) 9%
Christchurch City 9%
Dunedin City 4%
Other South Island Region 13%
Q15 - Would you describe the area where you live as
City 53%
Town 34%
Rural 13%
Q16 - Gender
Male 48%
Female 52%
Q17 - Age
18-24 13%
25-29 7%
30-34 8%
35-39 10%
40-44 10%
45-49 10%
50-59 16%
60-69 14%
70-74 7%
75 years and older 6%

Page 58
Demographic questionProportion within the population -
(n=2,000)
Q18 - Ethinic group
New Zealand European 81%
Maori 11%
Samoan 1%
Cook Island Maori 1%
Tongan 0.2%
Niuean 1%
Chinese 3%
Indian 2%
Other European 4%
Other Pacific 0.4%
Other Asian 1%
Other 0.3%
Don't wish to answer 2%
Q20B - If you had an unexpected expense of $500, could you pay it within a month without borrowing?
Yes 76%
No 19%
Don't know 5%
Q20 - Annual household income
$0/ none/ loss 0.2%
$1 -$10,000 2%
$10,001- $20,000 5%
$20,001- $30,000 9%
$30,001- $40,000 8%
$40,001- $50,000 8%
$50,001- $60,000 7%
$60,001- $70,000 7%
$70,001- $100,000 16%
$100,001-$150,000 14%
More than 150000 6%
Don't know 3%
Don't wish to answer 15%
Q21 - The last level you completed in formal education 2,001.00
(1) Primary School 0.4%
(2) Secondary School/no School Certificate 13%
(3) School Certificate/NCEA Level 1 10%
(4) University Entrance/6th Form Cert/Bursary/NCEA Level2/3 16%
(5) Technical or Trade Qualification 13%
(6) University Graduate or postgraduate qualification (Honours, Masters, Doctorate) 27%
(7) Other Tertiary Qualification 15%
(8) Attended University, but did not graduate 3%
Don't wish to answer 2%

Page 59
Appendix B ‐ Size of each perceived knowledge group
Perceived knowledge was used in subgroup analysis throughout the report. This was based on the responses
to ten statements about the criminal justice system and crime in New Zealand. We counted the number of
occasions that an individual respondent said ‘a lot’ or ‘quite a lot’ about each statement. This was then used
to create four different knowledge groups used for subgroup analysis throughout the report. The proportion
falling in each category is described in the table below.
Knowledge levels of respondents
Number of items (from ten) that the respondent knows ‘a lot’ or ‘quite a lot’ about
Proportion of respondents in this category
Knowledge groups used for subgroup analysis in the report.
Proportion of respondents in each group.
0 46% 46% (low knowledge) 1 12%
23% 2 10%3 7%
12% 4 6%5 5%
19% (high knowledge)
6 4%
7 3%8 2%9 2%10 4%

Page 60
Appendix C – Subgroup analysis of those who
‘disagree’ about various statements about the
criminal justice system
The following three tables show significant differences in the proportions of various demographic subgroups
that ‘disagree’ with statements about difference aspects of the criminal justice system.
Significant differences in views about NZ Police by demographic group
Groups significantly more likely than average to ‘strongly disagree’ or ‘disagree’
Groups significantly less likely than average to ‘strongly disagree’ or ‘disagree’:
Police are visible in community
(average of 20% ‘strongly disagree’ or ‘disagree’)
Those who believe that total national crime has
increased in the past year (23%).
Aged 18‐24 (14%)
Those living in the Upper North Island away
from the main centres (15%).
Police use force appropriately
(average of 11% ‘strongly disagree’ or ‘disagree’)
Maori respondents (18%)
Those with a household income of up to $30,000
(15%)
Those with a University qualification (20%).
Those who use experience and word‐of‐mouth
as their most common source of information
about crime (19%).
Aged 70+ (4%).
Police treat people with respect
(average of 13% ‘strongly disagree’ or ‘disagree’)
Maori respondents (20%). Aged 70+ (6%).
Police can be relied upon to respond when called
(average of 21% ‘strongly disagree’ or ‘disagree’)
Maori respondents (28%)
Those aged 50‐69 (28%)
Those who believe that total national crime has
increased in the past year (25%).
Aged 18‐24 (16%)
Those who believe that total national crime has
decreased in the past year (13%).
Police treat all ethnic groups fairly
(average of 18% ‘strongly disagree’ or ‘disagree’)
Maori respondents (31%)
Pacific respondents (34%)
Asian respondents (25%)
Those with a household income over $150,000
(27%)
Those with a high level of perceived knowledge
about the criminal justice system (claiming to
know 5 or more different aspects) (23%).
NZ European respondents (15%)
Aged 70+ (9%).
Those living in an ‘other’ South Island location
away from the main centres (12%).
Those with no qualification beyond school
(11%).
Police successfully prevent crime
(average of 23% ‘strongly disagree’ or ‘disagree’)
Maori respondents (31%)
Those living in Hamilton (35%)
Those who believe that total national crime has
increased in the past year (28%).
Aged 70+ (12%)
Those who believe that total national crime has
decreased in the past year (16%).

Page 61
Significant differences in views of criminal court by demographic group
Groups significantly more likely than average to ‘strongly disagree’ or ‘disagree’
Groups significantly less likely than average to ‘strongly disagree’ or ‘disagree’:
Offenders often get away without paying court fines
(average of 7% ‘strongly disagree’ or ‘disagree’)
Pacific respondents (16%)
Those aged up to 24 (14%)
Those with a household income up to $30,000
(11%)
Those living in the Wellington region (12%)
Those with a high level of perceived knowledge
about the criminal justice system (claiming to
know 5 or more different aspects) (13%).
Those who believe national crime has decreased
over the past year (14%).
Those whose highest qualification is a School
Certificate (2%).
Those who say they do not know anything about
the criminal justice system (i.e. know about 0
aspects) (5%).
Criminal court processes protect offenders’ rights
(average of 4% ‘strongly disagree’ or ‘disagree’)
Those living in the Upper North Island away
from the main centres (7%).
No significant differences in this cell of the table.
Criminal court processes treat victims with respect
(average of 23% ‘strongly disagree’ or ‘disagree’)
Maori respondents (30%)
Those aged up to 24 (14%)
Those with a technical or trade qualification as
their highest qualification (28%)
Those with a high level of perceived knowledge
about the criminal justice system (claiming to
know 5 or more different aspects) (29%).
Asian respondents (14%)
Those aged 50‐69 (27%).
NZ’s criminal court system is technologically up to date
(average of 22% ‘strongly disagree’ or ‘disagree’)
Those who would struggle to pay an unexpected
expense of $500 (27%)
Those with a high level of perceived knowledge
about the criminal justice system (claiming to
know 5 or more different aspects) (34%)
Those who believe national crime has increased
over the past year (26%).
Those living in the South Island away from the
main centres (15%).
Those who have not had any contact with the
criminal justice system in the past two years
(16%).
Those who say they do not know anything about
the criminal justice system (i.e. know about 0
aspects) (17%).
Criminal court processes are easy for the public to understand
(average of 42% ‘strongly disagree’ or ‘disagree’)
Those aged 50‐69 (48%)
Those with a household income of $150,000 or
higher (52%)
Those living in Hamilton (61%)
Those with a high level of perceived knowledge
about the criminal justice system (claiming to
know 5 or more different aspects) (47%)
Those who believe national crime has increased
over the past year (47%).
Asian respondents (30%)
Those who say they do not know anything about
the criminal justice system (i.e. know about 0
aspects) (38%).
Bail decisions take appropriate account of public safety
(average of 52% ‘strongly disagree’ or ‘disagree’)
Those aged 50‐69 (66%) or 70+ (67%)
Those living in Auckland outside of the main
Auckland cities (72%)
Those with no qualification beyond school (64%)
Those with a high level of perceived knowledge
about the criminal justice system (claiming to
know 5 or more different aspects) (61%)
Those who believe national crime has increased
over the past year (58%).
Those aged up to 24 (33%) and those aged 25‐49
(45%)
Asian respondents (30%)
Those living in Dunedin (40%)
University graduates (45%)
Those who use the Internet as their most
common source of information about crime
(47%)
Those who say they do not know anything about
the criminal justice system (i.e. know about 0
aspects) (47%).

Page 62
Criminal courts deal with cases without unnecessary delay
(average of 55% ‘strongly disagree’ or ‘disagree’)
Aged 50‐69 (66%) or 70+ (72%)
Those with no qualification beyond school (62%)
Those with a high level of perceived knowledge
about the criminal justice system (claiming to
know 5 or more different aspects) (71%)
Those who believe national crime has increased
over the past year (60%).
Aged up to 24 (40%) or 25‐49 (49%)
Asian respondents (33%)
Other European respondents (39%)
Those who say they do not know anything about
the criminal justice system (i.e. know about 0
aspects) (46%).

Page 63
Significant differences in views of prisons, community sentences, and parole by demographic group
Groups significantly more likely than average to ‘strongly disagree’ or ‘disagree’
Groups significantly less likely than average to ‘strongly disagree’ or ‘disagree’:
Prisons keep the public safe by securely containing offenders
(average of 11% ‘strongly disagree’ or ‘disagree’)
Maori (20%)
Those with no qualification beyond school (18%)
Those who believe national crime is increasing
(14%).
Those who believe national crime is decreasing
(7%).
Most people who appear before the Parole Board are initially turned down
(average of 10% ‘strongly disagree’ or ‘disagree’)
Those with a household income over $30,000 up
to $50,000 (15%).
Those with a high level of perceived knowledge
about the criminal justice system (claiming to
know 5 or more different aspects) (14%).
Those aged up to 24 (7%).
Those with a household income of up to $30,000
(6%)
Those with the lowest level of perceived
knowledge about the criminal justice system (i.e.
claim to know about no aspects) (8%).
Prisons give offenders the help they need to stop offending
(average of 40% ‘strongly disagree’ or ‘disagree’)
University graduates (45%)
Those with a high level of perceived knowledge
about the criminal justice system (claiming to
know 5 or more different aspects) (48%).
Those who believe national crime is increasing
(44%).
Asian respondents (29%)
Those with the lowest level of perceived
knowledge about the criminal justice system (i.e.
claim to know about no aspects) (35%).
People on community sentences are well managed
(average of 33% ‘strongly disagree’ or ‘disagree’)
Those with a high level of perceived knowledge
about the criminal justice system (claiming to
know 5 or more different aspects) (45%).
Those who believe national crime is increasing
(40%).
Those aged up to 24 (27%)
Those who have not had any contact with the
criminal justice system in the past two years
(27%)
Those who believe national crime is decreasing
(23%).
The parole system can be relied upon to safely manage the release of offenders
(average of 56% ‘strongly disagree’ or ‘disagree’)
Those aged 50‐69 (67%) or 70+ (70%).
Those with no qualification beyond school (63%)
Those with a technical or trade qualification
(66%)
Those with a high level of perceived knowledge
about the criminal justice system (claiming to
know 5 or more different aspects) (62%).
Those who believe national crime is increasing
(64%).
Asian respondents (33%)
Those aged up to 24 (35%) or 25‐49 (51%)
Those who use word of mouth or direct
experience as their most common source of
information about crime (43%)
Those with the lowest level of perceived
knowledge about the criminal justice system (i.e.
claim to know about no aspects) (51%).
Those who believe national crime is decreasing
(48%).
Prison successfully deters people who have been to prison from committing crime in future
(average of 68% ‘strongly disagree’ or ‘disagree’)
Maori respondents (75%)
Those aged 50‐69 (73%) or 70+ (70%).
Those with a household income of $150,000 or
more (77%)
Those living in the Lower North Island away
from the main centres (78%)
Those who believe that national crime has
increased (75%).
Asian respondents (40%)
Those aged up to 24 (55%)
Those who have not had any contact with the
criminal justice system in the past two years
(61%).
Those who believe that national crime has
decreased (59%).

Page 64
Appendix D – Questionnaire
Section 1: Knowledge questions Q1
People get their information about crime from many different sources.
Where do you mainly hear or read about crime in New Zealand?
Please select all that apply.
Personal experience 1
Experience of relatives, friends, neighbours, or other acquaintances
2
General word of mouth/information from other people
3
Community meetings/hui 4
Newspapers 5 Ensure Q1a1 is asked
The Internet 6 Ensure Q1a2 is asked
Television 7 Ensure Q1a3 is asked
Radio 8 Ensure Q1a4 is asked
Government information/websites 9
Books 10
School/university courses 11
Somewhere else (please specify) 12
Q1A1: ANSWER IF Q1=NEWSPAPERS (CODE 5)
You mentioned that you read about crime in newspapers, is that mainly…
Please select all that apply.
…National and provincial newspapers (e.g., The Dominion Post, NZ Herald, The Press, – including online versions), or
1
Your local newspaper (e.g., The Aucklander, The Wellingtonian) 2
Q1A2: ANSWER IF Q1=INTERNET (CODE 6)
You mentioned that you read about crime on the Internet is that mainly…
Please select all that apply.
…Online news sources (e.g., Stuff) 2
Social media sources (e.g., Facebook, Twitter, YouTube) 1
Other online sources 3

Page 65
Q1A3: ANSWER IF Q1=TELEVISION (CODE 7)
You mentioned that you hear about crime on the television, is that mainly…
Please select all that apply.
…National television news broadcasts (Breakfast, One News, TV 3 news, Prime News, Nightline)
1
Current affairs television programmes (e.g., Campbell Live, Sunday, Inside NZ; Te Karere)
2
Reality TV shows (e.g., Police Ten 7, Motorway Patrol, etc.) 3
Television documentaries (e.g., 20/20, Sunday) 4
TV crime dramas (e.g., CSI, Criminal Minds, etc.) 5
Q1A4: ANSWER IF Q1=RADIO (CODE 8)
You mentioned that you hear about crime on the radio, is that mainly…
Please select all that apply.
Radio news, or 1
Talk back radio 2
Q1B
And where do you hear or read about crime MOST OFTEN?
Please select one only. PROG: DISPLAY LIST OF OPTIONS SELECTED AT Q1 (1‐4 and 9‐12 if selected) AND ANY CODES SELECTED ACROSS Q1A1‐Q1A4.
Personal experience 1
Experience of relatives, friends, neighbours, or other acquaintances 2
General word of mouth/information from other people 3
Community meetings/hui 4
Newspapers 5
The Internet 6
Television 7
Radio 8
Government information/websites 9
Books 10
PROG: List other specify (FROM Q1) 11
No one main source of information 12

Page 66
Q2
How reliable or unreliable do you consider the following sources of information about crime…
Please select one only for each statement
ROTATE ORDER Not at
all
reliable
Somewhat
unreliable
Neither
reliable
nor
unreliable
Somewhat
reliable
Completely
reliable
Don’t
know
Crime statistics 1 2 3 4 5 6
Television news 1 2 3 4 5 6
Television documentaries (e.g., Sunday, 20/20)
1 2 3 4 5 6
National and provincial newspapers (e.g., The Dominion Post, NZ Herald, The Press)
1 2 3 4 5
6
Your local newspaper (e.g., The Aucklander, Wellingtonian)
1 2 3 4 5
6
Radio news 1 2 3 4 5 6
QUESTION 3
People have different levels of knowledge about crime and the criminal justice system. How much do you feel you know about the following:
Please select one only for each statement. PROG: ROTATE STATEMENTS – APART FROM LAST TWO
Know
nothing at
all
Know a
little
Know quite
a lot Know a lot Don’t know
NZ Police 1 2 3 4 5
The criminal court system 1 2 3 4 5
The bail system (i.e. when people are released before their trial).
1 2 3 4 5
Fines and other monetary penalties
1 2 3 4 5
Community‐based sentences (e.g. Home Detention, Supervision, Community Work)
1 2 3 4 5
Prisons 1 2 3 4 5
Support services for crime victims
1 2 3 4 5
The parole system 1 2 3 4 5
The types of crime
happening in New Zealand 1 2 3 4 5
How much crime is happening in New Zealand
1 2 3 4 5
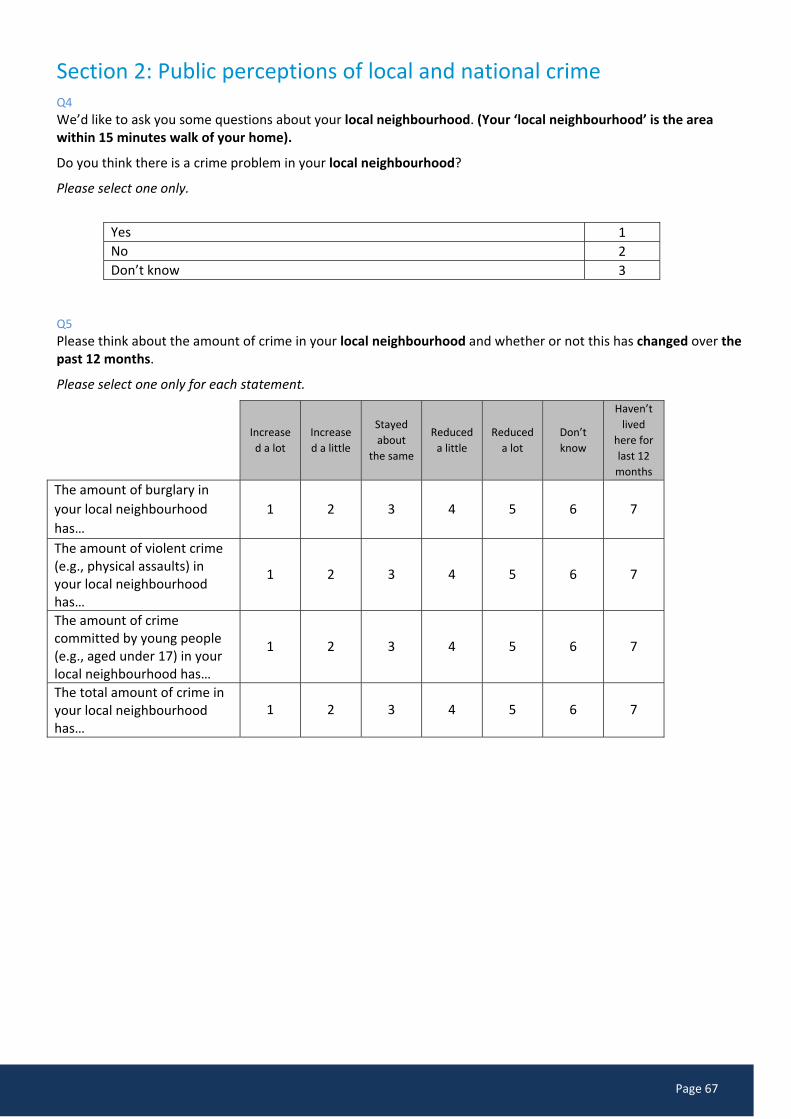
Page 67
Section 2: Public perceptions of local and national crime Q4
We’d like to ask you some questions about your local neighbourhood. (Your ‘local neighbourhood’ is the area within 15 minutes walk of your home).
Do you think there is a crime problem in your local neighbourhood?
Please select one only.
Yes 1
No 2
Don’t know 3
Q5
Please think about the amount of crime in your local neighbourhood and whether or not this has changed over the past 12 months.
Please select one only for each statement.
Increase
d a lot
Increase
d a little
Stayed
about
the same
Reduced
a little
Reduced
a lot
Don’t
know
Haven’t
lived
here for
last 12
months
The amount of burglary in
your local neighbourhood
has…
1 2 3 4 5 6 7
The amount of violent crime (e.g., physical assaults) in your local neighbourhood has…
1 2 3 4 5 6 7
The amount of crime committed by young people (e.g., aged under 17) in your local neighbourhood has…
1 2 3 4 5 6 7
The total amount of crime in your local neighbourhood has…
1 2 3 4 5 6 7
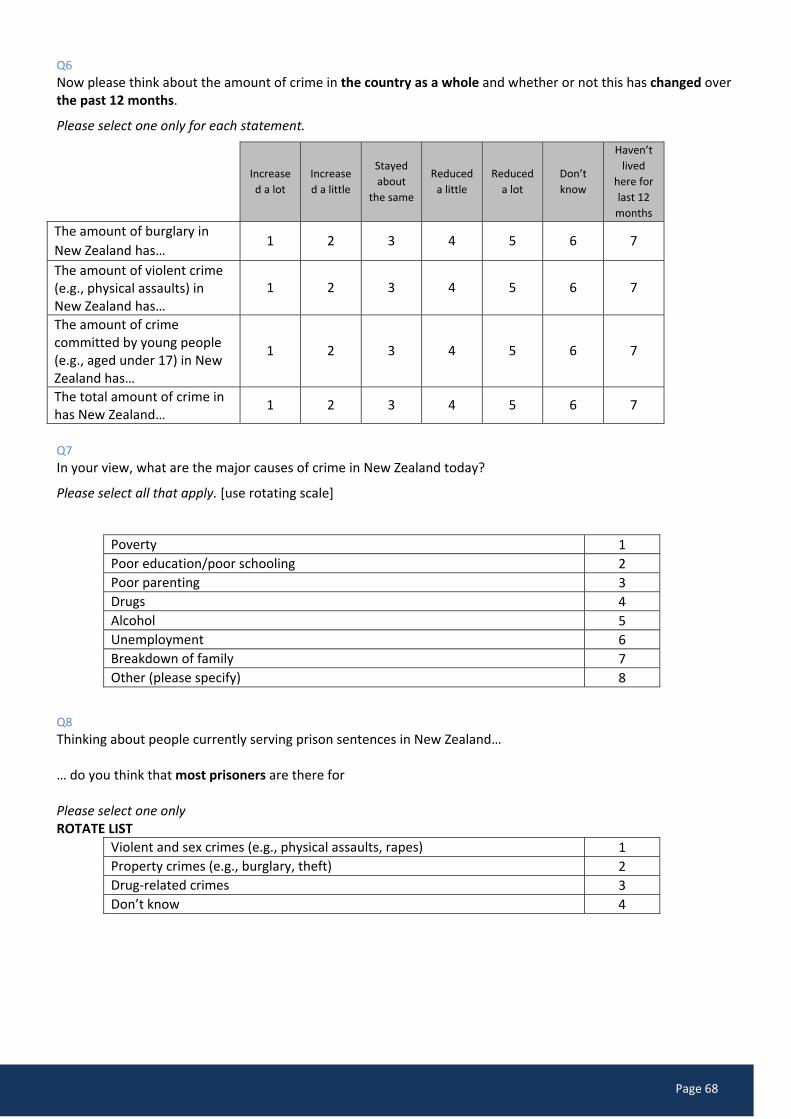
Page 68
Q6
Now please think about the amount of crime in the country as a whole and whether or not this has changed over the past 12 months.
Please select one only for each statement.
Increase
d a lot
Increase
d a little
Stayed
about
the same
Reduced
a little
Reduced
a lot
Don’t
know
Haven’t
lived
here for
last 12
months
The amount of burglary in
New Zealand has… 1 2 3 4 5 6 7
The amount of violent crime (e.g., physical assaults) in New Zealand has…
1 2 3 4 5 6 7
The amount of crime committed by young people (e.g., aged under 17) in New Zealand has…
1 2 3 4 5 6 7
The total amount of crime in has New Zealand…
1 2 3 4 5 6 7
Q7
In your view, what are the major causes of crime in New Zealand today?
Please select all that apply. [use rotating scale]
Poverty 1
Poor education/poor schooling 2
Poor parenting 3
Drugs 4
Alcohol 5
Unemployment 6
Breakdown of family 7
Other (please specify) 8
Q8
Thinking about people currently serving prison sentences in New Zealand… … do you think that most prisoners are there for Please select one only ROTATE LIST
Violent and sex crimes (e.g., physical assaults, rapes) 1
Property crimes (e.g., burglary, theft) 2
Drug‐related crimes 3
Don’t know 4

Page 69
Section 3: Trust and confidence questions [RANDOM TRIAL – WHEREBY 50% OF THE SAMPLE ARE ASKED THE SCALE FROM STRONGLY AGREE (ON THE LEFT) TO STRONGLY
DISAGREE (ON THE RIGHT) – THIS APPLIES TO Q9, Q10 AND Q11 ONLY]
Q9
The following questions are about your views on NZ Police. To what extent do you either agree or disagree with the following statements…
Please select one only for each statement. PROG: ROTATE STATEMENTS APART FROM FINAL ITEM WHICH IS TO STAY AT BOTTOM OF LIST
Strongly
agree Agree
Neither
agree nor
disagree
Disagree Strongly
disagree Don’t know
Police treat all ethnic
groups fairly 5 4 3 2 1 6
Police successfully prevent crime
5 4 3 2 1 6
Police are visible in my community
5 4 3 2 1 6
Police treat people with respect
5 4 3 2 1 6
Police can be relied on to respond when called
5 4 3 2 1 6
Police use force appropriately (e.g., physical force, pepper spray, TASER)
5 4 3 2 1 6

Page 70
Q10
The questions below are about your views on New Zealand’s criminal courts. How much do you agree or disagree with the following statements…
Please select one only for each statement. PROG: RANDOMISE STATEMENTS
Strongly
agree Agree
Neither
agree nor
disagree
Disagree Strongly
disagree Don’t know
NZ’s criminal court
system is
technologically up to
date
5 4 3 2 1 6
Criminal court processes are easy for the public to understand
5 4 3 2 1 6
Criminal courts deal with cases without unnecessary delay
5 4 3 2 1 6
Criminal court processes treat victims with respect
5 4 3 2 1 6
Criminal court processes protect offenders’ rights [ENSURE THIS ALWAYS APPEARS AFTER ITEM ABOVE – AND IS NOT BROKEN UP BY ROTATION]
5 4 3 2 1 6
Bail decisions take appropriate account of public safety (bail is when people are released before their trial).
5 4 3 2 1 6
Offenders often get away without paying court fines
5 4 3 2 1 6

Page 71
Q11 The following questions are about your views on prisons, community sentences and the parole system. How much do you agree or disagree with the following statements…
Please select one only for each statement. PROG: ROTATE STATEMENTS
Strongly
agree Agree
Neither
agree nor
disagree
Disagree Strongly
disagree Don’t know
People on community
sentences (home
detention, supervision
and community work)
are well managed
5 4 3 2 1 6
Prison successfully deters people who have been to prison from committing crime in future
5 4 3 2 1 6
Prisons give offenders the help they need to stop offending
5 4 3 2 1 6
Prisons keep the public safe by securely containing offenders
5 4 3 2 1 6
The parole system can be relied upon to safely manage the release of offenders
5 4 3 2 1 6
Most people who appear before the Parole Board are initially turned down
5 4 3 2 1 6

Page 72
Q12
Thinking about all the different parts of the criminal justice system (the police, the courts, the prison, probation and parole systems), how confident are you that the criminal justice system as a whole is effective?
Please select one only.
Completely confident 5
Fairly confident 4
Neutral 3
Not very confident 2
Not at all confident 1
Don’t know 6
Q13
Looking at the list below, what is the single most important thing that could be done to improve your confidence in New Zealand’s criminal justice system? Please select one only. PROG: RANDOMISE STATMEENTS BUT KEEP CODES 7 & 8 TOGETHER
Prevent more crime 1
Put the interests of victims at the heart of the system 2
Speed up the delivery of justice 3
Respond to what matters most to local communities 4
Bring more offenders to justice 5
Send more people to prison 6
Increase the availability of rehabilitation programmes in prisons, e.g., drug and alcohol programmes
7
Increase the availability of rehabilitation programmes in the community, e.g., drug and alcohol programmes
8
Provide better opportunities for people being released from prison
9
Use the latest technology to help tackle crime 10
Something else (please specify) 11

Page 73
Section 4: Demographics Now for a few quick questions about you…
Q14
Where do you live?
Please select one only.
Auckland Cities (North Shore, Waitakere City, Auckland City, Manukau City) 1
Other Auckland Region 2
Hamilton City 3
Other Upper North Island (Northland, Other Waikato, Bay of Plenty, Gisborne, Taranaki, Ruapehu District)
4
Wellington Cities (Porirua, Upper Hutt City, Lower Hutt City, Wellington City) 5
Other Wellington Region 6
Other Lower North Island (Manawatu, Wanganui, Hawkes Bay) 7
Christchurch City 8
Dunedin City 9
Other South Island Region 10
Don’t wish to answer 11
Q15
Would you describe the area where you live as…
Please select one only.
City 1
Town 2
Rural 3
Q16
Are you…
Please select one only.
Male 1
Female 2
Don’t wish to answer 3

Page 74
Q17
Please tell us which age range you fall into…
Please select one only.
18 – 24 1
25 – 29 2
30 – 34 3
35 – 39 4
40 – 44 5
45 – 49 6
50 – 59 7
60 – 69 8
70 – 74 9
75 years and older 10
Don’t wish to answer 11
Q18
Which ethnic group do you belong to?
Please select all that apply.
New Zealand European 1
Maori 2
Samoan 3
Cook Island Maori 4
Tongan 5
Niuean 6
Chinese 7
Indian 8
Other (such as Dutch, Japanese, Tokelauan) – please specify 9
Don’t wish to answer 10
Q20B
If you had an unexpected expense of $500, could you pay it within a month without borrowing?
In answering this question, please note that paying by credit card or hire purchase is borrowing unless you pay the credit card or hire purchase off within the month.
Please select one only.
Yes 1
No 2
Don’t know 3

Page 75
Q20
Which of these groups does your annual household income fall into? Please include all earnings including employment, money from the government, and income from other sources. Please tell us the rough income before tax.
Please select one only.
$0/ none/ loss 1
$1 ‐ $10,000 2
$10,001 ‐ $20,000 3
$20,001 ‐ $30,000 4
$30,001 ‐ $40,000 5
$40,001 ‐ $50,000 6
$50,001 ‐ $60,000 7
$60,001 ‐ $70,000 8
$70,001 ‐ $100,000 9
$100,001 ‐ $150,000 10
More than $150,000 11
Don’t know 12
Don’t wish to answer 13
Q21
What was the last level you completed in formal education?
Please select one only.
Primary School 1
Secondary School/no School Certificate 2
School Certificate/NCEA Level 1 3
University Entrance/6th Form Cert/Bursary/NCEA Level2/3 4
Technical or Trade Qualification 5
University Graduate or postgraduate qualification (Honours, Masters, Doctorate)
6
Other Tertiary Qualification (e.g., Polytechnic, Wananga) 7
Attended University, but did not graduate 8
Don’t wish to answer 9

Page 76
Q23:
People come into contact with the criminal justice system for a variety of reasons. Thinking about the past 2 years, please indicate whether you have personally :
Please select all that apply.
Been in a vehicle that was stopped by Police (e.g., traffic stops or alcohol check points)
1
Been the victim of crime 2
Known someone well who was the victim of a crime 3
Paid a fine or reparation 4
Attended court as a witness or support person 5
Served on a jury 6
Been arrested by Police 7
Been imprisoned or known someone who was imprisoned 8
Worked in the system or known someone who does 9
Other (please specify) 10
Did not experience any of the above 11
Don’t wish to answer 12
Q23: ANSWER IF Q23 = HAD CONTACT WITH CRIMINAL JUSTICE SYSTEM (CODES 1 TO 10)
On the whole would you describe your contact(s) with the criminal justice system in the past 2 years as…
Please select one only.
Very positive 5
Quite positive 4
Neither positive nor negative 3
Quite negative 2
Very negative 1
Don’t know 6
END OF SURVEY