Embed Size (px)
Citation preview

Public Management and Organizational Performance:
The Impact of Managerial Quality*
Kenneth J. MeierDepartment of Political Science and George Bush School of Government
4348 TAMUSTexas A&M University
College Station, TX [email protected]
and
Laurence J. O'Toole, Jr.School of Public and International Affairs
Baldwin HallUniversity of Georgia
Athens, GA [email protected]
Forthcoming Journal of Policy Analysis and Management 21 (Fall 2002).
*This paper is part of an ongoing research agenda on the role of public management in complexpolicy settings. We have benefitted from the helpful comments of Stuart Bretschneider, AmyKneedler Donahue, H. George Frederickson, Carolyn Heinrich, Patricia Ingraham, J. EdwardKellough, Laurence E. Lynn, Jr., H. Brinton Milward, Sean Nicholson-Crotty, David Peterson,and Hal G. Rainey on various aspects of this research program. Needless to say, this paper is theresponsibility of the authors only. All data and documentation necessary to replicate this analysiscan be found at the National Public Management Research Archive[http://bush.tamu.edu/pubman/]

Abstract
This paper presents the first large N study of public management quality and its impact on
program performance. Using five years of data from over 1000 Texas school districts, we
measure quality as the additional salary paid to school superintendents over and above the normal
determinants of salary. This measure of managerial quality is positively correlated with ten of
eleven performance indicators covering a wide range of organizational goals, everything from
standardized tests to school attendance. These relationships hold even in the presence of controls
for other determinants of program success. The measure has the potential to be used in tests of
existing management theories, thus moving the literature beyond case studies to more systematic
large N research.

1
Public Management and Organizational Performance:
The Impact of Managerial Quality
A basic tenet of public administration is that public management can make the difference
between success and failure in the delivery of public policy results (Lynn, 1984). Despite this
widespread belief, this notion has rarely been carefully tested. In this study, we develop a
measure of managerial quality suitable for certain kinds of empirical settings and then test
whether quality management contributes positively to public program performance. Public
education, an important policy field, provides the context for the investigation.
This relatively straightforward test of the management-quality hypothesis confronts a
number of challenges. The notion of managerial quality itself, although often used in teaching,
research, and practice, is seldom clarified in a way that facilitates systematic investigation.
Difficulties of measurement on this score have also impeded research. In addition, many other
influences shape what happens via public programs, so the research design needs to take into
account these realities. The next sections of this article treat these challenges systematically, then
our research on the management-quality hypothesis is presented and discussed.
The Gordian Concept of Public Management Quality
As we have indicated in earlier work (O’Toole and Meier, 1999; 2000), the proposition
that public management contributes to the performance of government is at the core of a great
deal of scholarship; but few systematic efforts have tested for the relationship empirically. The
case-study and qualitative literature, on the other hand, indicates that good management can be a
2
particularly critical contributor to program success (Ban, 1995; Behn, 1991; Cohen and Eimicke,
1995; Doig and Hargrove, 1987; Hargrove and Glidewell, 1990; Holzer and Callahan, 1998;
Riccucci, 1995; Thompson and Jones, 1994). Indeed, this body of work suggests multiple and
complex channels of managerial influence.
Still, the conceptual issues are immense. A consideration of management’s hypothesized
impact on program performance, for instance, must incorporate some attention to the notion of
leadership, clearly a theme of substantial importance among researchers. But the literature on
leadership is huge and complex (see Rainey, 1997). Rainey and Steinbauer’s (1999) succinct
characterization serves as a daunting reminder of the difficulties of capturing this key notion in a
satisfactory and easily measurable form: “[T]he topic of leadership is vast, richly elaborated, and
inconclusive . . . . Enough listings of desirable leadership skills and qualities could be gathered
to build another great pyramid. They vary widely, and none of them can claim conclusive
validation” (pp. 18-19).
The growing emphasis on quality and quality management in recent years (see Beam,
2001) overlaps the attention to leadership in public programs. Interestingly, an examination of
this theme also reveals an unresolved tension as to what kinds of broad managerial efforts are
likely to be most critical for delivering performance. Much of the attention to quality or
excellence in recent years, in the U.S. and elsewhere, has focused on the value of
“entrepreneurial” management for achieving results. Certainly, the popularity of Osborne and
Gaebler’s (1992) volume illustrates this point, and the National Performance Review of the
Clinton years — a reform effort with direct intellectual ties to the same perspective — reflected
a similar emphasis (Gore, 1993; see Rainey, 1997, pp. 366-68). The New Public Management,

3
more broadly, emphasizes these themes. And yet some analysts have seen in these approaches a
diminished view of management (Lynn, 2001) or one, they argue, likely to limit what public
agencies can deliver (see Goodsell, 1993; Moe, 1994). Terry (1995) in particular contends that
administrators perform a key function by executing “conservatorship”: preserving established
institutional forms and activities that have developed over time and would be difficult to
reestablish.
Indeed, while risk-taking, entrepreneurial activities can sometimes bring benefits,
protective, conserving efforts can be especially valuable under other circumstances. As we have
argued elsewhere, the multiple managerial functions, which likely work through different causal
pathways, should all be considered by those who desire to probe the connection between
management and performance (O’Toole and Meier, 1999). While this general point may be
valid, any systematic effort to explore the link between management and performance across a
large number of cases must confront a nearly intractable measurement challenge. If quality
public management embraces a multitude of difficult-to-define dimensions and if different
strategic approaches and managerial orientations might be appropriate under different difficult-
to-specify conditions, how can one test the proposition that good management contributes to
good performance across the spectra of cases and circumstances?
The conceptual complexity thus fuels a serious measurement challenge. Recently, the
Government Performance Project has developed comprehensive measures of government
management systems via a criteria-based approach. Most of this research effort has been devoted
to measures of management itself, and management capacity, rather than managerial impacts,
although recently some relationships between these measures and managerial (intermediate)

4
outcomes have been demonstrated (Donahue, Selden, and Ingraham, 2000).
A few additional notes of progress have been sounded in the effort to probe with
systematic empirical work the link between elements of public management and ultimate
program performance. Wolf (1993) examined subjective assessments of agency leadership and
found that these helped explain agency effectiveness. Hennessey (1998) suggested a relationship
between public-organizational performance and leadership, defined in terms of Bennis’s (1993)
four competencies, on the basis of data from nine offices in two federal agencies. His core
argument is that leaders help shape organizational culture and, thereby, performance. Attention,
however, is directed primarily to reinvention efforts, only secondarily to performance itself.
Further, the small number of cases, subjective measurement of leadership features, and lack of
controls attenuate the conclusiveness of the work.
Recently, Rainey and Steinbauer (1999) have proposed a “theory of effective government
organizations” incorporating a number of features that might explain effectiveness. Several
characteristics they analyze are part of, or at minimum closely related to, public management –
including the development of human resources, various elements of task design, and — in
particular — leadership characterized by certain attributes. Rainey and Steinbauer craft their
argument based on a review of existing literature on the likely determinants of effectiveness.
While they do no testing, they do “posit” that leadership is likely to “emerge as” among the most
important drivers of effectiveness in governmental organizations (p. 28).
Brewer and Selden (2000) recently report a systematic empirical project based on Rainey
and Steinbauer’s theoretical argument. They explain a large portion of the variance in federal
employee perceptions of organizational performance, as interpreted in rather broad terms, across

5
23 agencies. The model they develop and test includes a leadership and supervision measure,
which is positively related to perceptions of performance, although its predictive power is
relatively slight. The measure is limited to employee perceptions of how their immediate
supervisors rate; and, as Brewer and Selden note, “leadership and supervision may contribute to
organizational performance indirectly” (p. 704, emphasis in original). Indeed, several other
variables they analyze that contribute more to explaining the variance in performance are likely
influenced by management as well.
These findings and arguments are provocative, but they are limited in a number of ways
and clearly not definitive. Most of the empirical work is cross-sectional, and it is important to
test for the impact of public management by incorporating a longitudinal dimension as well.
Most of the measures of performance are perceptual and/or intermediate. In addition, the
measurements developed thus far capture only a limited part of the concept of quality
management as it has been understood by scholars.
If characterizing and measuring managerial quality is challenging, even more demanding
is the task of doing so for individuals in specific managerial positions. The general task of
individual performance appraisal in the public sector has been notoriously difficult to conduct
(Kellough, 2002; see also Murphy and Cleveland, 1995). The approach adopted in the present
investigation does not resolve the host of issues under dispute, but it does rely on decisionmaking
by knowledgeable political principals in contact with the particular managers whose impact is
being analyzed here. To be precise, the method relies on assessments revealed in salary
determinations. This approach might seem ironic, since when individual performance appraisals
are used in public agencies to determine pay — so-called pay-for-performance systems —

1 Or tautological: Good management is whatever seems retrospectively to have producedgood results, a special problem when perceptual measures of both management and performanceare used (see Wolf, 1993).
6
researchers have consistently noted serious flaws (Ingraham, 1993; Rainey, 1997). Under certain
conditions and with certain caveats, we argue below, decisions about pay can provide a
defensible indirect measure of management quality, particularly given the conceptual and
measurement difficulties associated with developing a more direct yet still feasible alternative.
In the next section, we sketch our general approach to measuring managerial quality in
the kinds of settings that will be analyzed later: public education in a large, diverse U.S. state.
Our focus is on the top managers of public school districts in Texas, school superintendents. We
propose an aspect of managerial salary as a reasonable proxy measure for testing the management
quality hypothesis. We then note the units of analysis examined, develop the specifics of our
empirical measure, and finally model our tests of school-system performance.
Measuring Superintendent Quality
As outlined above, what is needed from public managers seems to vary by program,
agency, time, and context. Any simple measure of the quality of management, therefore, is likely
to be biased.1 Those in the best position to know and evaluate what and how managers are doing
are knowledgeable observers in the local setting at the time, particularly those with access to
information about managerial behavior, organizational morale, environmental demands, and
performance results. The strategy in this study is to tap into the judgments of just such a set of
individuals who observe the managers -- school system superintendents -- on a day-to-day basis:
members of the school board.

7
Rather than seeking attitudinal judgements by the school board on management quality
(thus merely moving the problems of definition from researchers to practitioners), we assume
that actions reveal preferences. Each school board makes an annual assessment of the
superintendent’s performance and then sets his or her salary for the following year. In that
determination, we think that management quality plays a role – not an exclusive role, but a role
nonetheless. Similarly, deciding the compensation to offer a new superintendent contains an
inherent quality assessment.
Quite clearly political principals face limitations in judging managerial quality – in
particular, limitations in access to relevant information. For governmental jurisdictions that
perform only one policy function, these limits are less severe. To the extent that principals in
such situations are interested in attending to the quality of management in their jurisdictions, they
know where to look and are undistracted by competing or overlapping responsibilities. School
districts are among the governmental jurisdictions fitting this stipulation.
Furthermore, isolating on the managerial-quality aspect of a superintendent’s salary is
facilitated by several characteristics of the market for superintendents. That market can be
characterized as competitive with substantial information. School-district managerial talent is
mobile within the state (and somewhat mobile across states). While some superintendents
remain for extended periods in one locale, most individuals typically move among several
districts as they pursue their careers. With few exceptions, positions are filled after open
searches that are often conducted with the assistance of a search firm. Superintendents seeking
to move (the average tenure in Texas is approximately 5.3 years) will know the salary paid the
previous superintendent and can access an extensive state data base on the district and its

8
characteristics. Similarly, the hiring district will have extensive information about how the
candidate’s current district (or school if they decide to hire a principal) has performed, and
assessments of an individual superintendent candidate’s management ability are relatively easy to
get via the established network of school board members. In short, a manager with a good track
record is likely to have several options so that a school district seeking to hire such a manager
will need to offer a premium, all other things being equal. There are no regulatory floors or
ceilings regarding compensation. The sheer range of salaries in the study ($35,000 to $205,228
in 1999 [mean = $74,400; standard deviation = $24,087]) supports the notion that market
dynamics are at work.
Salary premiums, however, operate within a salary structure that recognizes basic
understandings about the job (see Ehrenberg, Chaykowski and Ehrenberg, 1988a;1988b). First,
the most significant determinant of salaries, both normatively and empirically, is the size of the
district; as the size of the job expands, salaries increase proportionately. Second, human-capital
factors such as education, experience and training will result in additional adjustments to salaries.
Third, personal characteristics of the individual are likely to affect salaries. Particularly relevant
are such factors as race, ethnicity and gender. Although discrimination might play a role here,
some districts, such as large inner-city districts, will prefer a minority superintendent for political
reasons. Fourth, because the relationship between salaries and performance can be expected to
be reciprocal — that is, superintendents could also be rewarded for performance in the past — a
control for prior school-district outputs is needed.
Our strategy of analysis is to take variables measuring each of the factors that should
influence the manager’s salary and use them to predict the manager’s actual salary. The residual
2“Independent” in the case of school districts means that the district selects its owngoverning board (as opposed to having another jurisdiction appoint the board) and it possessesindependent taxing power. One district in Texas is a municipal school district; taxing authorityin that district rests with the city council.
9
from this equation – that is, the portion of the variance in salary not accounted for by job size,
human capital, personal characteristics, and past performance – will contain the assessment of
managerial quality (for a similar residuals-based measure in a different context see Palmer and
Whitten, 1999, p. 629). This measure is quite clearly a messy one since the residual contains all
those factors not included in the model such as the ability to sell oneself, experience and renown
as a football coach, physical characteristics and other irrelevant factors, as well as the assessment
of quality. The impact of this measurement error, however, will attenuate any relationships
between a quality measure and organizational outputs (Carmines and Zeller, 1979; Bollen, 1989,
pp. 159-167). The measurement error, as a result, creates a bias in favor of null findings.
The Units of Analysis
Our data on public management and performance are for all Texas school districts. U.S.
school districts generally, and all districts in this study but one, are independent local
governments with their own taxing powers.2 While each district determines its own curriculum,
policy, and personnel, all districts are subject to both state and federal regulations and receive
funds from both sources. The amount of state funding and state control varies from state to state.
The state of Texas pays for about 50 percent of education costs, but its oversight focuses on
issues of accountability (time in class, testing, attendance, number of courses, and so forth).
Although school districts are the most common public organizations in the United States,
they have some distinct characteristics. They are highly professionalized organizations with
10
elaborate certification processes for various occupations. The organizations themselves tend to
be decentralized with a great deal of street-level (classroom) discretion. As explained earlier, the
compensation scheme for top administrators is relatively distinctive among governmental units.
If the findings here are generalizable, they would be applicable to similar types of organizations.
How might a superintendent, a single manager at the top of the hierarchy, actually affect
student performance? Our interactions with superintendents, administrators, and teachers
suggest several ways. First, superintendents can recruit, train, and reward talented mid-level
administrators (school principals) and in some cases teachers. Of particular importance is
recruiting individuals who share organizational goals in regard to student standards and
approaches to education. Second, superintendents, like all organizational leaders, can motivate
employees to invest greater effort in the organization. Superintendents do so by providing and
communicating a vision for the organization. They can also generate greater commitment by
handling the inevitable problems that arise in the environment; in particular, they can provide
political cover for teachers and administrators. Third, superintendents can affect the student
learning environment by mandating the adoption of specific educational reforms. The list of
possible reforms is endless, and reforms need to be matched to the specific needs of the students
and the skills of teaching faculty. Part of this matching process relies on the management ability
of the superintendent. Fourth, superintendents can contribute to the predictability and reliability
of the system for those who operate within it. They can provide stable processes and avoid the
disruptions of policy churn (Hess, 1999) and other activities that interfere with the process of
educating children. Finally, superintendents can acquire more resources for the organization.
While most of these will then appear in the district’s budget, some may be intangible – for

11
instance, the good will of local business leaders or the support of parent groups.
Measuring Managerial Quality
To generate the residuals-based measure of managerial quality, we use a relatively
common salary model from the literature (see Ehrenberg, Chaykowski and Ehrenberg, 1988b).
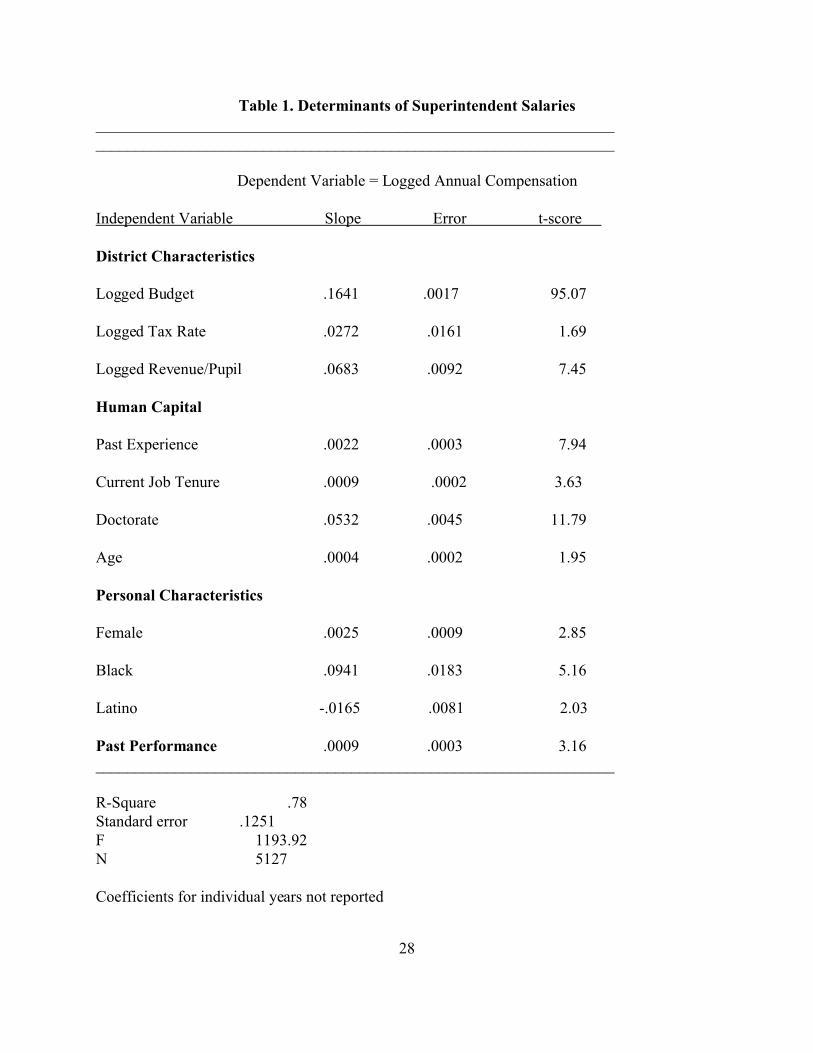
The dependent variable is the logged annual compensation for the superintendent. The log
transformation is used to ease the problem of skewed data resulting from the large salaries
associated with Texas’ megadistricts. The log transformation also permits interpreting the
relationships as elasticities. This salary figure only includes the official base salary; it omits the
perks some districts offer, such as club memberships, cell phones, and transportation benefits that
are not reported to the state of Texas.
Three district characteristics are included as independent variables – the district’s total
budget, tax rate, and average revenue per student; all three variables are logged. Total district
budget is our measure of district size, which should be the strongest predictor in the model. The
tax rate is included because some earlier work contends that superintendents are rewarded for
keeping taxes low (Ehrenberg, Chaykowski and Ehrenberg, 1988b). Revenue per pupil is a
measure of wealth; certain districts will pay higher salaries simply because they can afford to do
so. For some districts this decision is a matter of civic pride.
Four human-capital characteristics are included – experience as a superintendent, tenure
in the current job, age, and the possession of a doctorate. The first three variables are measured
in years; salaries should increase both with total experience as a superintendent (most of this
experience will have been in other districts) and time in the current job. Age is commonly

3The two are moderately correlated, but the relationship is not strong enough to pose acollinearity problem.
12
included in models such as these, even though it is considered a surrogate for experience which is
already in the model.3 In terms of education, virtually all superintendents have a masters degree
(98%), so the most salient distinction is the possession of a doctorate, which should be positively
related to salary.
Three personal characteristics are included – whether the superintendent is female, black,
or Latino. The predicted signs for these variables are ambiguous, depending on whether a district
might see it as an advantage to hire a superintendent with a given demographic. Data on salaries,
district characteristics, human capital, and personal characteristics were provided by the Texas
Education Agency from their administrative data base.
Finally, we include the prior year’s test scores in the model. Because we think
managerial quality is affected by prior performance, and because quality then affects future
performance; over time, there is reciprocal correlation. We cannot control for prior test scores
without adjusting for this endogeneity, or the quality measure’s impact will be biased downward.
The appropriate method is to purge the reciprocal causation via an instrumental variables
technique. We do this using six student characteristics and district resources (percent black,
Latino, and low income students, teacher’s salaries, class size and instructional funding) as
instruments; the purged measure of prior performance is then included in the model. Five years
(1995-99) of data are used in the model, and dummy variables for individual years are included
to account for the general increase in salaries over this time period.
The results of the salary model appear in Table 1. The predictive ability of the model

13
(78%) compares favorably to other models in the literature; and with one exception, all variables
are in the predicted direction. That exception is the tax rate, which has a slight positive
association with salary rather than a negative relationship, thus indicating that superintendents
are not systematically rewarded for keeping taxes low. While the relationships in the model are
interesting in terms of both personnel management and educational policy, discussion of them is
beyond the scope of the present study. The objective of this part of the analysis is merely to
remove as many “non-quality” factors from the superintendent’s salary as possible. The
regression residuals are then standardized (converted to a mean of 0 and a standard deviation of
1) for use in the subsequent analysis. Because salaries are set before the school year begins, the
quality measure has a natural one-year lag in its relationship to current organizational
performance. As a consequence, any relationships that are found can be attributed to quality
influencing performance rather than district performance influencing boards’ decisions about
superintendent compensation.
[Table 1 about here]
Modeling Performance
Our measure of management quality can now be related to educational performance.
Given the preliminary nature of such a measure in public management, this effort might be
viewed as an attempt to determine if the measure has external validity – since managerial quality
should affect organizational performance when one controls for the resources and constraints on
the core organization. The section first introduces the control variables in the model and then
discusses the measures of organizational performance.

4The number of candidates for inclusion in education production functions is virtuallylimitless. Because many of the variables measure the same thing or relatively similar things,collinearity in these models is a problem. As a result, some variables may have an inappropriatesign. Because our concern is with having sufficient controls in the model rather than estimatingthe precise impact of each control variable, we are less concerned with collinearity.
14
Control Variables
Any assessment of organizational performance must control for both the difficulty of the
job faced by the organization and the resources in its possession. Fortunately, a well-developed
literature on educational production functions (Hanushek, 1996; Hedges and Greenwald, 1996)
can be used for guidance. Eight variables, all commonly used in education production functions,
are included – three measures of task difficulty and five measures of resources.4 These are used
strictly as controls to make sure that any findings we have relative to management quality are
robust to the inclusion of factors normally linked to educational performance.
School districts clearly vary in how difficult it is to educate their students. Some districts
have homogeneous student populations from upper middle-class backgrounds. Students such as
these are quite likely to do well in school regardless of what the school does (see Burtless, 1996).
Other districts with a large number of poor students and a highly diverse student body will find it
more difficult to attain high levels of performance because the schools will have to make up for a
less supportive home environment and deal with more complex and more varied learning
problems (Jencks and Phillips, 1998). Our three measures of task difficulty are the percentages
of students who are black, Latino, and poor (measured as the percentage eligible for free or
reduced-price school lunch). All three measures should be negatively related to performance.
A basic principle of organization theory is that resources matter. While the linkage
between resources and performance in schools has been controversial (see Hanushek, 1996;

5In a separate survey of superintendents by the authors, 45.5% of superintendent’s ratedTAAS scores as their top priority; no other goal was endorsed by more than 13% of
15
Hedges and Greenwald, 1996), a growing literature of well-designed, longitudinal studies
confirms that like other organizations, schools with more resources generally fare better
(Wenglinsky, 1997). Five measures of resources are included. The average teacher salary, the
average instructional expenditures per student, and class size are directly tied to monetary
resources. The average years of teaching experience and the percentage of teachers who are not
certified are related to the human resources of the school district. Class size and noncertified
teachers should be negatively related to student performance; teacher experience, teacher salaries,
and average instructional expenditures should be positively related to performance.
Performance Measures
Performance measures are highly salient in educational policy circles these days.
Generalizing from his experience in Texas, President George W. Bush advocates standardized
testing as the measure of educational performance, despite the controversy surrounding such
measures (see McNeil, 2000). Although virtually all organizations have multiple goals and thus
are subject to multiple performance indicators, some objectives are defined as more important
than others by the organization’s political environment. This study incorporates eleven different
performance indicators in an effort to determine if management quality affects a variety of
organizational outputs.
Although each of the different performance indicators is salient to some portion of the
educational environment, the first among equals is the student pass rate on the Texas Assessment
of Academic Skills (TAAS).5 The TAAS is a criterion-based test that all students in grades 3

superintendents. An additional 46.8% of superintendents rated TAAS scores as “veryimportant.”
6The various pass rates do not correlate as highly as one might imagine. Theintercorrelations between the Anglo, black and Latino pass rates are all in the neighborhood of .6,thus suggesting the overlap is only a bit more than one-third.
16
through 8 and 10 must take. The grade 10 exam is a high-stakes test, and students must pass it to
receive a regular diploma from the state of Texas. TAAS scores are used to rank districts, and it
is without question the most visible indicator of performance used to assess the quality of
schools. Our measure is the percentage of students in a district who pass all (reading, writing,
and math) sections of the TAAS.
Four other TAAS measures are also useful as performance indicators. The state
accountability system assesses performance of subgroups of students, and districts must perform
well on all these indicators to attain various state rankings. TAAS scores for Anglo, black,
Latino and low-income students are included as measures of performance indicators.6
TAAS scores are linked most directly to basic skills and performance levels for all
students. Many parents and policymakers are also concerned with the performance of school
districts regarding college-bound students. Four measures of college-bound student performance
are used – the average ACT score, the average SAT score, the percentage of students who score
above 1110 on the SAT (or its ACT equivalent), and the percentage of students who take either
test. Texas is one of a few states where both the ACT and the SAT are taken by sufficient
numbers to provide reliable indicators of both. As with statewide samples where there is no
correlation between these scores and the number of students taking them if the proportion of
tested students is more than 30 percent of the total eligible to be tested, Texas scores are

7School districts often have annual student turnover of 20% or greater. School districtsdo not necessarily know where students have gone unless they receive a request for a transcript. In addition, school districts have few incentives to find out why any given student has notreturned for a new academic year.
17
uncorrelated with the percentage of students taking the exams.
The final two measures of performance might be termed bottom-end indicators —
attendance rates and dropout rates. High attendance rates are valued for two reasons. Students
are unlikely to learn if they are not in class, and state aid is allocated to the school district based
on average daily attendance. Attendance, as a result, is a good indicator of low-end performance
by these organizations; the measure is simply the average percentage of students who are not
absent. Dropout rates, while conceded to contain a great deal of error, are frequently also used to
evaluate the performance of school districts.7 The official state measure of dropouts is the annual
percentage of students who leave school from eighth grade onward.
Findings
The first school-district performance measure assessed is the overall TAAS score; those
results are presented in the first two columns of Table 2. The proposed measure of managerial
quality is positively and significantly related to school-district performance. Since the measure is
standardized and thus ranges between approximately -3 and plus 3, these equations suggest that
the maximum impact of quality management is approximately 5.3 points on the TAAS.
Although management quality is clearly not the most important factor in determining test scores,
in substantive terms 5.3 points is a meaningful amount of change (the standard deviation of
TAAS scores is approximately 12.5). The control variables in Table 2 are all generally
consistent with the hypothesized relationships, with the exception of instructional spending,

8The specific question asked the superintendent to rate parental involvement andcommunity support on five-point scales that ranged from excellent to inadequate. This surveyhad a 57% response rate, thus reducing the total number of cases for analysis.
9A path analysis of the results of this second analysis shows that 72% of the impact ofmanagement quality is direct with the other 28% indirect through community and school boardsupport.
10Note that we are limiting our analyses to linear specifications in this paper. Werecognize that our measure of managerial quality is likely to be controversial. To provide focuson the management quality measure, therefore, we have opted for relatively simple models of
18
which is negative and insignificant. To check for omitted variables bias, we ran regressions with
41 additional variables without affecting the findings here. These variables included additional
student characteristics, budget expenditures in various categories, teacher assignments, and
additional measures of district wealth.
[Table 2 about here]
To explore a bit more how management quality might work through other factors known
to influence performance, a second regression in Table 2 adds three variables – parental
involvement, community support, and student attendance. Parental involvement and community
support were assessed via a superintendents’ survey; and because they reflect the impressions of
the superintendents, these measures might contain some bias.8 All three new measures are
positively associated with organizational performance; in the case of student attendance, the
relationship is a strong one. Including these factors in the model reduces the size of the
management coefficient. These relationships suggest that some of the impact of quality
management operates through increasing community support and parental involvement.9 Even
with the addition of the attendance and support scores, however, management quality as defined
in this study has a significant and positive effect on the overall performance of the organization.10

management. We believe that management operates in a contingent and nonlinear mannerconditioned by structural context (see O’Toole and Meier, 1999). More complex models ofmanagement will be pursued in subsequent research.
11When one includes community and school board support in the equations, the results aresimilar except the impact of management on black TAAS scores is no longer significant.
12The n-size varies for these equations because the state reports results only when five ormore students per district meet the category. Some districts, for example, do not have sufficientminority students to generate results.
19
A measure of managerial quality should be general; it should be related to a wide variety
of organizational outputs. The relationship should, of course, vary across different measures of
outputs because some problems are likely to be more sensitive to the quality of management in
the organization. As problems become more intractable, for example, one would expect that
management would matter less simply because what the organization could do to solve such
problems is more limited.
Table 3 presents the regression coefficients for management quality and the ten additional
performance indicators. Each equation also controls for all the variables included in the first
regression in Table 2.11 The performance of the managerial quality variable can be appropriately
characterized as stunning. For nine of the ten additional performance indicators, management
quality is significantly related to performance in the predicted direction (the exception is the
percentage of students who take college boards). This pattern of relationships along with those
in Table 2 amounts to strong evidence that the residual-based measure of managerial quality is
tapping at least in part some aspects of how well superintendents manage their districts.12
[Table 3 about here]
Conclusions

13We believe this approach will work for other management positions subject tocompetitive markets where measures of program performance are available. Municipal agencyheads such fire chiefs, police chiefs, and public works heads may fit these conditions in somejurisdictions.
20
This study offers two principal contributions. First, we develop and apply an uncommon
measure of public management quality. The application of the measure relies on avoiding an
underspecified model for explaining salary variations, as well as on the notion that the mobility,
information, and compensation for managers in the empirical setting approximate the labor-
market assumptions of neoclassical economics. We have argued that both conditions hold here.
To the extent that these conditions do not hold, in fact, we would expect null results. This
article, therefore, offers an innovative, albeit indirect, overall measure of public management
quality. The most important limitation here has to do with the specialized nature of the measure,
or at least its restricted applicability. Most settings of interest do not approximate the required
conditions, although investigations of some other situations – certain additional educational
systems, some public authorities or quasigovernmental entities, for instance – might be able to
use and perhaps improve on the approach taken here.13 Tapping public management quality in
many other circumstances, however, will require tackling more directly some of the tough issues
about what quality means, how it is related to leadership, and from what sources the requisite
quality judgments can be derived.
Second, this research offers the fullest rigorous test to date of the proposition that
management quality contributes positively to performance. The results are clear and convincing.
If one assumes that the measure of quality is valid, then the almost completely consistent results

14Alternatively, if one views this empirical study as a check on external validity, asexplained earlier, the results are highly encouraging.
21
across eleven measures of performance are firm evidence indeed.14 That these results obtain
despite a likely measurement error for management quality creating a bias toward null findings is
particularly striking. With all the appropriate controls for the educational setting, the quality of
superintendents’ management makes a difference. Whether the focus is on pass rates, dropout
rate, or the performance of specialized groups of students, like those from low-income families
or those aiming to attend college, management matters. This set of results is even more striking
given that the focus here is on only one managerial position — that of superintendent — at the
top of the district. Since almost all school systems include additional managerial layers — at a
minimum, school principals — the overall impact of management is probably even higher.
Management’s relationship to performance is also likely to be complex. The impact of
management quality appears to be partially channeled through the mobilization of parental and
community support. In addition to contributing directly to operations, then, and to dealing with
political principals and external regulatory authorities, managers appear to contribute to
performance by mobilizing the efforts of others who have allied interests in delivering results at
the local level.
All these findings are consistent with themes developed by astute observers and analysts
of public management (see also Meier and O’Toole, 2001; 2002). That public management
quality matters, of course, is hardly news to specialists in public management and public policy.
The field of public administration has developed a rich literature arguing for this notion and
supporting it with careful case studies. But to find management quality influencing performance

22
directly, and consistently, in a data set spanning hundreds of governments over a several-year
period is particularly persuasive evidence. While this study reports on only one set of
administrative units — and in one policy field, at one level of government and, in fact, at only
one level of management within that set — it indicates clear support for theoretical arguments
that have been articulated for years by scholars and practitioners in the field. And any who doubt
the importance of management and managerial quality for what can be delivered by public
education in the U.S. should note the implications of this analysis for identifying a critically
important point of leverage: in Texas, at a minimum, public management quality itself, not
simply influences like district spending or students’ home circumstances, makes a difference.
In many respects, therefore, the results of this investigation are suggestive. Considerable
additional work is warranted. The links between public management in its various guises and the
results of interest to multiple stakeholders need to be explored more thoroughly, and in settings
beyond those of public education. Considering the issues in the broadest possible context will
require additional conceptual, theoretical, and measurement advances. More complex models
need to be considered, as a part of this agenda (see Meier and O’Toole, 2001, 2002). And the
implications for public managers themselves need to be unpacked more fully. In short, even if it
can now be argued with persuasive evidence that the quality of public management shapes policy
outputs, most of the important challenges remain.

23
References
Ban, C. (1995). How Do Public Managers Manage? San Francisco: Jossey-Bass.
Beam, G. (2001). Quality Public Management: What It Is and How It Can Be Improved and
Adapted. Chicago: Burnham, Inc.
Behn, R. (1991). Leadership Counts. Cambridge: Harvard University Press.
Bennis, W. (1993). An Invented Life: Reflections on Leadership and Change. Reading, MA:
Addison-Wesley.
Bollen, K. (1989). Structural Equations with Latent Variables. New York: John Wiley and
Sons.
Brewer, G., & Selden, S.C. (2000). Why elephants gallop: assessing and predicting
organizational performance in federal agencies. Journal of Public Administrative Research and
Theory 10: 685-711.
Burtless, G. (1996). Does Money Matter? Washington: Brookings.
Carmines, E., & Zeller, R. (1979). Reliability and Validity Assessment. Newbury Park, CA:
Sage Publications.
Cohen, S., & Eimicke, W. (1995). The New Effective Public Manager. San Francisco: Jossey-
Bass.
Doig, J.W., & Hargrove, E.C. (1987). Leadership and Innovation: A Biographical Perspective on
Entrepreneurs in Government. Baltimore: Johns Hopkins University Press.
Donahue, A.K., Selden, S.C., & Ingraham, P.W. (2000). Measuring government management
capacity: a comparative analysis of city human resources management systems. Journal of Public
Administration Research and Theory 10: 381-411.

24
Ehrenberg, R.G., Chaykowski, R.P., & Ehrenberg, R.A. (1988a). Determinants of the
compensation and mobility of school superintendents. Industrial and Labor Relations Review 41:
386-401.
Ehrenberg, R.G., Chaykowski, R.P., & Ehrenberg, R.A. (1988b). Are school superintendents
rewarded for performance? Pp. 337-364 in D.H. Monk (Ed.), Micro-Level School Finance:
Issues and Implications for Policy. Cambridge MA: Ballinger.
Goodsell, C. (1993). Reinventing government or rediscovering it? Public Administration
Review 53: 85-86.
Gore, A. (1993). From Red Tape to Results: Creating a Government That Works Better and
Costs Less. Report of the National Performance Review. Washington, DC: Government
Printing Office.
Hanushek, E. (1996). School resources and student performance. Pp. 43-73 in G. Burtless (Ed.),
Does Money Matter? Washington, D.C.: Brookings Institution.
Hargrove, E.C., & Glidewell, J.C. (1990). Impossible Jobs in Public Management. Lawrence,
KS: University of Kansas Press.
Hedges, L.V., & Greenwald, R. (1996). Have times changed? The relation between school
resources and student performance. Pp. 74-92 in G. Burtless (Ed.), Does Money Matter?
Washington, D.C.: Brookings.
Hennessey, J.T. (1998). ‘Reinventing’ government: does leadership make the difference? Public
Administration Review 58: 522-32.
Hess, F.M. (1999). Spinning Wheels: The Politics of Urban School Reform. Washington:
Brookings.

25
Holzer, M., & Callahan, K. (1998). Government at Work: Best Practices and Model Programs.
Thousand Oaks, CA.: Sage.
Ingraham, P.W. (1993). Of pigs in pokes and policy diffusion: another look at pay for
performance. Public Administration Review 23: 348-56.
Jencks, C., & Phillips, M. (1998). The Black-White Test Score Gap. Washington, D.C.: The
Brookings Institution.
Kellough, J.E. (in press). Employee performance appraisal and pay for performance in the
public sector: a critical examination. In C. Ban & N.M. Riccucci (Eds.), Public Personnel
Management: Current Concerns, Future Challenges. 3d ed. New York: Longman.
Lynn, L.E. (1984). The Reagan administration and the renitent bureaucracy. Pp. 339-370 in
L.M. Salamon, (Ed.), The Reagan Presidency and the Governing of America. Washington, DC:
The Urban Institute.
Lynn, L.E., (2001). The myth of the bureaucratic paradigm: What traditional public
administration really stood for. Public Administration Review 61:144-60.
McNeil, L.M. (2000). Contradictions of School Reform: Educational Costs of Standardized
Testing. New York: Routledge.
Meier, K.J., & O’Toole, L.J. (2001). Managerial strategies and behavior in networks: a model
with evidence from U.S. public education. Journal of Public Administration Research and
Theory 11: 271-293.
Meier, K.J., & O’Toole, L.J. (in press 2002). Public management and educational performance:
the impact of managerial networking. Public Administration Review (forthcoming).
Moe, R.C. (1994). The ‘reinventing government’ exercise: misinterpreting the problem,

26
misjudging the consequences. Public Administration Review 54: 111-22.
Murphy, K.R., & Cleveland, J. (1995). Understanding Performance Appraisal: Social,
Organizational, and Goal-Based Perspectives. Thousand Oaks, CA: Sage.
O’Toole, L.J., & Meier, K.J. (1999). Modeling the impact of public management: the
implications of structural context. Journal of Public Administration Research and Theory 9: 505-
526.
O’Toole, L.J., & Meier, K.J. (2000). Networks, hierarchies, and public management: modeling
the nonlinearities. Pp. 263-291 in C.J. Heinrich & L.E. Lynn (Eds.), Governance and
Performance: New Perspectives. Washington, DC: Georgetown University Press.
Osborne, D., & Gaebler, T. (1992). Reinventing Government. Reading, MA: Addison-Wesley.
Palmer, H.D., & Whitten, G.D. (1999). The electoral impact of unexpected inflation and
economic growth. British Journal of Political Science 29:623-39.
Rainey, H.G. (1997). Understanding and Managing Public Organizations 2d ed. San Francisco:
Jossey-Bass.
Rainey, H.G., & Steinbauer, P. (1999). Galloping elephants: developing elements of a theory of
effective government organizations. Journal of Public Administration Research and Theory 9:1-
32.
Riccucci, N.M. (1995). Unsung Heroes: Federal Executives Making a Difference. Washington,
DC: Georgetown University Press.
Terry, L.D. (1995). Leadership of Public Bureaucracies: The Administrator as Conservator.
Thousand Oaks, CA: Sage Publications.
Thompson, F., & Jones, L.R. (1994). Reinventing the Pentagon. San Francisco: Jossey-Bass.

27
Wenglinsky, H. (1997). How Educational Expenditures Improve Student Performance and How
They Don’t. Princeton, NJ: Educational Testing Service.
Wolf, P.J. (1993). A case survey of bureaucratic effectiveness in U.S. cabinet agencies:
preliminary results. Journal of Public Administration Research and Theory 3: 161-81.
28
Table 1. Determinants of Superintendent Salaries__________________________________________________________________________________________________________________________________
Dependent Variable = Logged Annual Compensation
Independent Variable Slope Error t-score
District Characteristics
Logged Budget .1641 .0017 95.07
Logged Tax Rate .0272 .0161 1.69
Logged Revenue/Pupil .0683 .0092 7.45
Human Capital
Past Experience .0022 .0003 7.94
Current Job Tenure .0009 .0002 3.63
Doctorate .0532 .0045 11.79
Age .0004 .0002 1.95
Personal Characteristics
Female .0025 .0009 2.85
Black .0941 .0183 5.16
Latino -.0165 .0081 2.03
Past Performance .0009 .0003 3.16_________________________________________________________________
R-Square .78Standard error .1251F 1193.92N 5127
Coefficients for individual years not reported

29
Table 2. The Impact of Management on Performance: Standardized Tests__________________________________________________________________________________________________________________________________
Dependent Variable = TAAS Pass Rate
Independent Variable Slope t-score Slope t-score
Management Quality .8866 7.76 .4888 3.23
Controls
Teachers Salaries (K) .7150 9.07 .6243 6.20
Instruction Spending (K) -.4040 1.72* -.8770 2.46
Black Students % -.2624 23.40 -.1560 10.53
Latino Students % -.1171 15.69 -.1034 10.80
Low Income Students % -.1804 17.87 -.1214 8.79
Class Size -.5718 7.30 -.1825 1.88*
Teacher Experience .1165 1.68* .1437 1.61*
Non Certified Teachers -.1773 7.31 -.1389 4.19
Parental Support ---- .3984 2.01
Community Support ---- .9572 4.51
Student Attendance ---- 3.7705 20.90_________________________________________________________________
R-Square .59 .67Standard Error 8.00 6.78 F 574.29 298.36N of cases 5126 2498 Coefficients for annual dummy variables omitted.*not significant, p < .05

30
Table 3. Management Quality and Other Measures of Performance__________________________________________________________________________________________________________________________________
Performance Measure Slope t-score R2 N Latino Pass % .4832 2.53 .38 4243
Black Pass % .7014 2.68 .38 2965
Anglo Pass % .8700 7.60 .41 5053
Low Income Pass % .8998 6.17 .50 5093
Average ACT Score .0817 3.94 .36 4248
Average SAT Score 3.1534 2.85 .50 3516
Percent Above 1100 .6535 4.23 .29 4682
Percent Tested .0113 .05* .12 4601
Dropout % -.1241 8.21 .16 5026
Class Attendance .0866 7.49 .24 5126_________________________________________________________________
All equations control for teacher’s salaries, instructional expenditures per student, class size,teacher experience, percent of teachers not certified, percentage of black, Latino and low incomestudents and yearly dummy variables. * not significant p < .05