Embed Size (px)
Citation preview
BUREAUCRACY AND ORGANIZATIONAL PERFORMANCE:
CAUSALITY ARGUMENTS ABOUT PUBLIC SCHOOLS
Kenneth J. Meier
Dept. of Political ScienceTexas A&M University
College Station, TX 77843409-845-4232
409-847-8924 [email protected]
J. L. PolinardProfessor of Political Science
University of Texas-Pan American
Robert D. WrinkleProfessor of Political Science
University of Texas-Pan American
American Journal of Political Science, July 2000
An earlier version of this paper was presented at the 1999 Annual Meeting ofthe Midwest Political Science Association, Chicago. We would like to thankPaul Teske, LeeAnn Krause, B. Dan Wood, and the anonymous reviewers forhelpful comments on earlier drafts.
Bureaucracy and Organizational Performance:
Causality Arguments About Public Schools
Abstract
One key policy dispute in the school choice debate concerns whether the
education bureaucracy is a cause or a consequence of poor performance. This
dispute is striking because both sides accept the same neo-institutionalist
organization theory. This paper uses a large panel of school districts to
address the dispute. The evidence suggests that poor performance results in a
growing bureaucracy not vice versa. Further evidence then shows that the
growth in bureaucracy is associated in an increase in teachers and smaller
class sizes; in short, bureaucracy increases as schools take actions that are
linked to improved performance.
Bureaucracy and Organizational Performance:
Causality Arguments About Public Schools
Few contemporary public policies are as controversial as school choice.
School privatization advocates argue that market-based school systems can
educate students better than public schools. Chubb and Moe (1988; 1990), for
example, contend that the institutional features of the public school system--
particularly its bureaucratic structure and democratic governance--make it an
ineffective organization that depresses student performance. Their remedy is
to convert schools into more market-based institutions with less bureaucracy
and less democratic control (Chubb and Moe 1988; 1990). Opponents of school
choice contend the proponents' arguments lack empirical support, fail to
consider the multiple goals of public education, and support policies that
generate more costs than benefits (Henig 1994; Paris 1995; Witte 1992; Smith
and Meier 1995).
Lost in the public debate is the realization that some points of dispute
are important theoretical questions in their own right. Both Chubb and Moe
(1990) and their harshest and somewhat intemperate critics (Smith and Meier
1994) use neo-institutional arguments derived from organization theory. Some
issues at dispute, as a result, are relevant not only to public policy debates
but are also testable propositions that promise theoretical insight into how
institutions respond to and influence their environments (Thompson 1967; March
and Olsen 1989).
This research examines one small, but crucial, empirical question in the
school choice debate--what is the relationship between levels of bureaucracy
and organizational performance? Chubb and Moe (1990) contend that bureaucracy
leads to poor performance on the part of public schools. Smith and Meier
(1994), in contrast, argue that bureaucracy is an adaptation to poor
performance, that when organizations recognize their failures, they often take
actions that, at least in the short run, generate more bureaucracy.
Our research strategy addresses the link between bureaucracy and
2
performance in five steps. First, we outline the institutional theory of
Chubb and Moe (1990) as it relates to bureaucracy. Second, using a unique
panel data set of over 1000 school districts for a seven year period, we
empirically test this key relationship in both organization theory and the
real world of education policy. Third, we address the politics of
responsiveness by assessing how these organizations respond to different types
of students. Fourth, we continue the logic of the institutional theory to
determine if the bureaucratic growth that does occur could affect future
student performance. Finally, we note the implications of our findings for
both organization theory and education policy.
Institutional Theory and School Choice
Often lost in the highly contentious debate over school choice is the
theoretical contribution made by Chubb and Moe (1990). They ground their
advocacy of competition as a solution to the ills of public schools in a well
developed neo-institutional theory of the policy process. Public schools are
open systems with overhead democratic control. Because they are so open to
the environment, a wide variety of demands are pressed on schools by teachers,
unions, citizens, legislators, parents, employers, and countless others.
These democratic processes by themselves might even result in the design of
ineffective organizations (Moe and Wilson 1994).
In the case of schools, ineffectiveness might not be conscious.
Consistent with the basic principal-agent model, each interest seeks to
institutionalize its demands on the school system by establishing rules,
designing procedures that permit monitoring, and restricting discretion in the
school system. Thus, democracy produces rules and leads to rigidity. Faced
with multiple demands and a plethora of restrictions, public schools become
too bureaucratic to respond to parents' demands for quality education.
Bureaucracy, thus, leads to poor performance. As Brown (1992,288) contends,
"The reason bad schools are bad include poor management....In some popular
critiques of public schools this kind of inefficiency is blamed on the
3
presence of bureaucracy."
Chubb and Moe (1990) further argue that private schools, and some public
schools in relatively homogeneous environments, are leaner and more agile in
their response to demands for quality education. Such schools, they contend,
outperform over-bureaucratized public schools that face heterogeneous demands.
Their solution is to create market incentives and permit competition to
generate an education system more responsive to parental demands.
Although the bureaucracy argument is only one part of Chubb and Moe's
proposal, it is a crucial element because it reinforces the notion that public
sector organizations are less likely to respond to their environments (read
consumer demands) than private sector organizations (see Savas 1987). Smith
and Meier (1994) concede that bureaucracy is correlated with lower performance
by schools but argue that bureaucracy should be viewed as an effort to respond
to environmental demands. They assert that public schools are more
bureaucratic because they are faced with more complex task environments.
Rather than indicating an unresponsive organization, a larger bureaucracy
component, in Smith and Meier's (1995) view, is a sign of a responsive
organization that is trying to meet environmental demands by designing new
programs and policies to deal with its problems. Their argument is similar to
Simon’s (1947) notion that organizations take complex tasks, break them into
smaller components, and process these tasks in a parallel mode (assuming that
the tasks can be isolated from each other; see O'Toole 1996). Bureaucracy is
essential to coordinate parallel-processed tasks. Public schools, according
to Smith and Meier (1995), have larger bureaucracies because they are trying
to solve more difficult problems.
This alternative hypothesis--that poorly performing schools produce more
bureaucracy in an effort to solve problems--is rarely entertained by the
school privatization movement. In fact, many poorly performing schools are
located in areas of poverty and non-English speaking communities. These
conditions often require special efforts such as Communities in Schools,
4
bilingual education, and other compensatory programs. Additional programs
require additional administrators. Schools with problems such as these often
need more teacher time per student to be effective; in such cases bureaucrats
are needed a) to free teachers of administrative tasks so that they can spend
their time teaching or b) to coordinate the larger number teachers. In effect,
the alternative hypothesis suggests that a greater number of bureaucrats is a
response to need.
The empirical analysis of Smith and Meier (1994) does not directly
address this question (see Bohte 2000; Smith 1994). They find that
bureaucracy (measured as central bureaucracy relative to the overall
organization) is associated with more complex demands, yet their own models
that incorporate these demands fail to eliminate the negative relationship
between bureaucracy and organizational performance. They fall back on the
notion that bureaucracy is related negatively to performance simply because
negative performance generates an organizational response (see Downs 1967) and
that response is quite likely to require additional bureaucrats to organize,
coordinate, and implement.
The alternative hypothesis of Smith and Meier (1994) is more that just
an assertion that other factors determine bureaucracy. The key point of
contention between Chubb and Moe (1990) and Smith and Meier (1994) is at its
core an argument about causality. Does bureaucracy cause low performance or
does low performance create pressures for new programs and thus for additional
bureaucrats to administer them? If bureaucracy is a response to, rather than a
cause of, poor performance, the growth in bureaucracy is really the result of
an organization trying to reform itself. Resolving this "which came first"
dispute, therefore, has major implications for public administration.
Quasi-markets and the Marginal Consumer
Both Chubb and Moe (1990) and Smith and Meier (1994) agree that public
schools are open systems and, thus, responsive to environmental demands.
Chubb and Moe contend, however, that public schools have responded to so many
1This argument should also hold for central city school systems given
that a quasi-market exists between city schools, private schools, and suburban
schools.
2Schneider et al. (1998) argue that this elite marginal consumer, by
getting the public organization to respond, will generate better education for
all students. This assumes that schools will not engage in tracking and other
methods to create tiered systems of education (see Oakes 1985).
5
demands, that they are no longer capable of competing for students in an
education market where quality concerns are paramount. The recent work of
Mark Schneider and colleagues (Schneider et al. 1998; 1997; Teske et al. 1993)
uses public school choice programs to provide insight about how education
markets are likely to work. Given the low level of information possessed by
parents, Schneider et al.(1998) contend that competitive, market-like behavior
will exist even if only a small subset of parents act as rational consumers.
These "marginal" consumers, they contend, are more involved and of higher
socio-economic status. As such they are highly desirable parents in the eyes
of school officials, and schools will compete to attract them.1
The work of Schneider has implications quite similar to other work on
education and urban politics (see Meier and Stewart 1991). If public schools
respond to demands for quality with additional programs and teacher time, and
thus additional bureaucracy, that response is likely to biased toward a select
group of parents. These might either be Schneider's marginal consumers or
those individuals with the political efficacy and the knowledge to put
effective pressure on the school system (who might well be the same as the
marginal consumers). In multi-racial school districts, the implication of
both arguments is that poor performance by Anglo students is more likely to
trigger a response from public schools than is poor performance by minority
students.2 Anglos have higher rates of political participation (see Leighley
and Vedlitz 1999), and Schneider et al.'s (1998) marginal consumer is also
3 If bureaucracy is really a response to organizational needs, then we
will learn little by examining organizations with few environmental demands
(that is, predominantly white middle-class suburban districts). Districts
that face a wide variety of different environments provide a much better set
of organizations for such a study.
4Serial correlation is a significant problem. After a large drop in
standardized test scores for these districts in 1992 (reflecting changes in
the test), they generally followed an upward trend. The use of dummy
variables to correct for such problems is the traditional correction for short
pools such as this one (Stimson 1985). The lagged dependent variable will not
necessarily correct serial correlation problems if the serial correlation does
not fit a first order autoregressive process. At times people use dummy
variables for the individual units to deal with heteroscedasticity. We do not
use fixed effects in this model for three reasons. First we have over 1000
6
more likely to be Anglo.
Data and Methodology
An ideal environment to examine this question is Texas school districts.
Texas school districts have substantial enrollments of Anglo, African-American
and Latino students in their 1,000+ school districts.3 Our school district
data come from two main sources: The Texas Education Agency and the School
District Data Book, 1990 Census School District Special Tabulation, Summary
File Set 1 Extract. Our units of analysis are the universe of school
districts in Texas. Data are available for eight years from 1991 through 1998;
we pool these data and use a lagged dependent variable, resulting in a total
of 7301 cases and seven years. Missing data on specific items reduces this
number, especially when analysis is run for schools with minority populations.
Pooled models frequently are affected by problems of serial correlation
and heteroscedasticity. To control for serial correlation, we include a set
of six dummy variables in the model.4 With 7301 cases, even a slight degree
school districts making the process itself extremely cumbersome. Adding 1000
additional independent variables would generate a great deal of collinearity
with the present set of variables. Given that the dummy variables themselves
have little theoretical import, the cost of this approach greatly exceeds the
benefits. Second, the inclusion of a lagged dependent variable adjusts for
the possibility that each district has a unique intercept by incorporating it
via last year's value. Third, using both a lagged dependent variable and
fixed effects is likely to generate biased coefficients (Hsiao 1986, 73-5).
5We used the White test for heteroscedasticity on each of the cross-
sections and then averaging these results for the seven years. This procedure
considers the panel nature of the data. An average coefficient of
determination of only .015 for each year generates a significant test (for the
entire pool the standard is only .003).
6To verify our concerns, we also calculated panel corrected standard
errors as suggested by Beck and Katz (1995). These standard errors were
virtually identical with the ordinary least squares standard errors. This
also supports our conclusion that the degree of heteroscedasticity was
statistically significant but substantively trivial. In assessing other work
with essentially the same characteristics as this data set but far fewer
cases, Beck and Katz (1996: 28-9) conclude that ordinary least squares
standard errors serve relatively well.
7
of heteroscedasticity will generate a statistically significant test result
even if assessed within the framework of the pool.5 Residual scatter plots
revealed a generally homoscedastic pattern relative to each independent
variable.6 The modest existing heteroscedasticity was related to our
bureaucracy measure. When the models were reestimated with weighted least
squares to correct for this heteroscedasticity, the results in Tables 1 and 2
7Results are available from the authors. Given the robustness of the
findings to different estimation techniques and different specifications (see
below), heteroscedasticity is unlikely to be a major problem.
8Critics of bureaucracy rarely provide specific empirical measures of the
term. The term itself is value-laden (see Goodsell 1983) and generally lacks
precision. A precise definition, such as ours, is required for the concept to
have value in empirical research.
8
were similar, albeit with slightly larger t-scores.7
Dependent Variables: Student Performance and Bureaucracy
Texas uses an annual standardized test called the Texas Assessment of
Academic Skills [TAAS]. TAAS test measures the mastery of basic skills.
While basic skills are not the only educational objective of public schools,
they are a crucial element and thus a reasonable measure of performance. The
percentage of students who pass these tests in each school district is one of
the dependent variables in our model.
The second dependent variable is our measure of bureaucracy. We use the
total number of full-time administrators per 100 students as our measure of
bureaucracy. This ratio specifically adjusts for organizational size by
considering bureaucracy in relation to the number of students (or task size).
The ratio is a better measure than just the percentage of administrators
employed (see Smith and Meier 1994; Bohte 2000) because well-funded districts
are likely to have both more teachers and more bureaucrats.
Bureaucracy, is without question, a multidimensional concept that
includes not just administrative personnel but also redtape, restrictive
rules, and procedural constraints (Downs 1967). While our measure only taps
one dimension of the concept, we believe the measure has substantial face
validity.8
Independent Variables: Controls
We include several control variables found to influence education
9
performance in other studies; all are frequently used in education production
functions. The typical production function includes student characteristics,
measures of resources applied to the process and district policies designed to
improve performance (for a review of literature see Burtless 1996).
In education policy, a strong, consistent relationship has been found
between poverty and student performance. Poverty generally means students
lack access to learning tools in the home (computers, pre-K programs, etc.)
and also correlates with a less stable and less supportive home environment
(e.g., single parent households, high rates of teen pregnancy, and low
educational expectations; Necochea and Cune, 1996; Fuller, et. al., 1996).
Our measure of poverty is the percent of students eligible for free or reduced
price school lunches. The relationship to performance should be negative.
Resources in education include money and human capital. While a long-
standing debate disputes the relationship between expenditures and student
achievement (Hanushek 1996, 1989), more recent longitudinal studies have found
that money does matter. Murray (1995) and Evans, Murray and Schwab (1997)
found that districts that increased expenditures subsequently improved
performance. We use three expenditure measures in our analysis: per pupil
expenditures for instruction, the average teacher salary, and the percentage
of money each district receives from state funds. The per-pupil instructional
measure is used to focus on classroom education, not football fields or
capital investment. Education is personnel intensive; most expenditures pay
the salaries of teachers and other staff. In general, economic theory
suggests that higher salaries should attract better qualified persons to a
profession (Hanushek and Pace 1995); thus, we use the average teacher salary
measure. Not all districts are created equal in terms of wealth. State aid
can compensate for inequities in local tax bases. Given the large variations
in wealth of Texas school districts, and the long history of the state in both
federal and state courts on this issue (San Antonio Independent School
District v. Rodriguez, 1973; Edgewood Independent School District v. Kirby,
10
1987; See also Weiher 1988), recent decisions to provide more state funds to
poor school districts could also affect student performance. We expect all
three relationships to be linked positively to test scores.
Our human capital measure involves teachers. Teachers are exceedingly
important to the educational success of students. We expect that the greater
the experience of teachers, the better the learning environment for students.
Our measure is the average years of teacher experience, which we expect to
relate positively to student performance.
We include two policy measures: class size and gifted classes. We
expect schools with smaller class sizes to have an advantage, if only at the
margin (see Pate-Bain et al. 1992; Nye et al. 1992; Hedges and Greenwald 1996;
Hanushek 1996, 54). A well-designed policy experiment with several thousand
students recently confirmed this relationship (Wenglinsky 1997). Our measure
is the number of students per teacher in the district. Gifted classes are
generally conceded to be the best education that a school system offers (See
DeHaan 1963). We expect the percent of students in gifted classes to be
related positively to performance and class size to be related negatively to
student achievement.
Findings
The hypotheses suggest that bureaucracy could lead to poor performance
or that poor performance can lead to greater bureaucracy. These two
hypotheses cannot be disentangled with ordinary linear regression on a cross-
section of organizations. Using the panel nature of the data set, however, we
can address the question with a panel analysis form of Granger causality
(Granger 1969; Durrat 1988). The Granger causality approach tests two
contrasting hypotheses. If bureaucracy is a cause of poor performance, then
bureaucracy at time 1 should be negatively correlated with performance at time
2 even when controlling for performance at time 1. If bureaucracy is not a
cause of performance, we would expect performance from time 1 to time 2 to
change randomly with respect to bureaucracy. Similarly, if poor performance
9A Granger analysis within the context of pooled data presents no unique
problems. For examples of using a panel in this manner see Durrat (1988),
Meier and Smith (1994), and Wood (1992).
10Specification error is always a possibility although the inclusion of
the lagged dependent variable makes it less likely. Few variables change
quickly enough to influence the dependent variable without having its effect
incorporated in the lagged variable on the right hand side of the equation.
11
causes the expansion of bureaucracy, then performance at time 1 should be
negatively correlated with bureaucracy at time 2 controlling for bureaucracy
at time 1.9 The null hypotheses, which are those actually tested, hold that
bureaucracy at time 1 is not correlated with performance at time 2 and
performance at time 1 is not correlated with bureaucracy at time 2. This set
of tests is conducted controlling for other relevant variables that might also
affect either bureaucracy or student performance.10
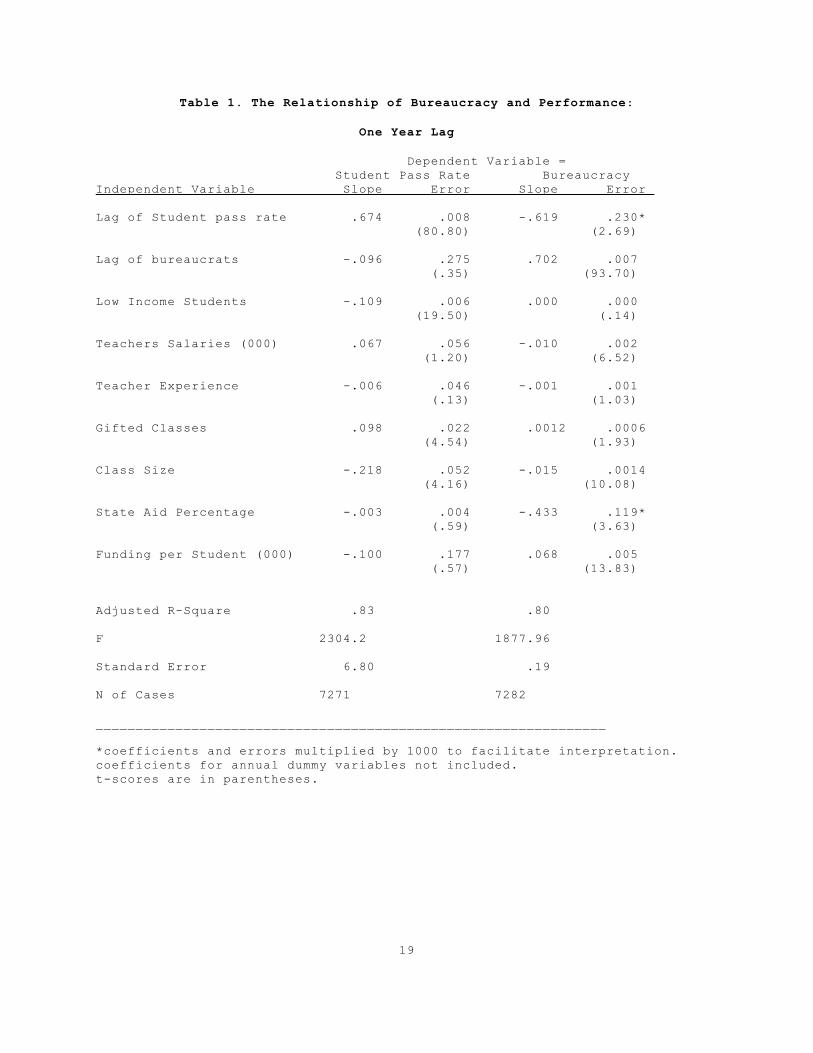
The hypotheses about bureaucracy and student performance are tested in
Table 1. In the first regression, the student pass rate on the mandatory
state exam is regressed on the lagged student pass rate (one year lag), the
lagged number of bureaucrats (one year lag), and our control variables. In
terms of the choice hypothesis, the number of bureaucrats does not
significantly affect future student pass rates.
[Table 1 About Here]
The alternative hypothesis--that the size of the bureaucracy is a
response to poorly performing schools--is tested in the second regression in
Table 1. As before, the equation contains both a lagged form of the dependent
variable as a right-hand side variable and a lagged term of the student
achievement measure along with the set of control variables. As can be seen
in the table, we can reject the null hypothesis. Poor performing schools
11The impact, however, is not trivial. Because the lagged dependent
variable distributes the impact of changes over a period of time, a one
percentage point change in test scores is associated with about a .3 percent
change in bureaucrats per 100 students. Given the standard deviation of test
scores is about 16, the potential growth in bureaucracy could be substantial.
12
subsequently hire more bureaucrats. Although the size of the coefficient is
not large, it indicates an effort by the school system to respond to low
student achievement.11
Table 1 assumes a causal lag of one year. The results of panel analysis
are often ambiguous if the panel timing is longer or shorter than the causal
lag. Bureaucratic institutions contain an element of inertia; rapid change is
not only unlikely but in some cases might even be harmful if change is too
frequent (Hess 1999). Because test scores are released in late spring, a one
year lag gives a district only a few months to respond before plans for the
next school year must be finalized. A school district faced with poor test
scores is likely to study the problem for a while and seek alternative
solutions. Even a satisficing search procedure (Simon 1947) might well take
longer than a few months. To allow more time for remedial action, Table 2
replicates the analysis in Tables 1 but increases the time lag to two years.
[Tables 2 About Here]
The results using the two year lag are also unambiguous. The
coefficient for bureaucracy in Table 2 is smaller than its standard error,
resulting in the failure to reject the null hypothesis that bureaucracy does
not cause lower student performance. The coefficient for student performance
in Table 2, however, has confidence limits bounded well away from zero,
leading us to reject the null hypothesis. Low student test scores are
associated with an increase in bureaucracy in subsequent years, a relationship
consistent with the arguments that school systems respond to poor performance
by increasing programs and thus adding bureaucrats to oversee these new
12These alternative estimations can be obtained directly from the
author. Data and documentation to replicate all analysis can be found at the
National Public Management Research Archive on the web at
[http://www-bushschool.tamu.edu/pubman/].
13
programs.
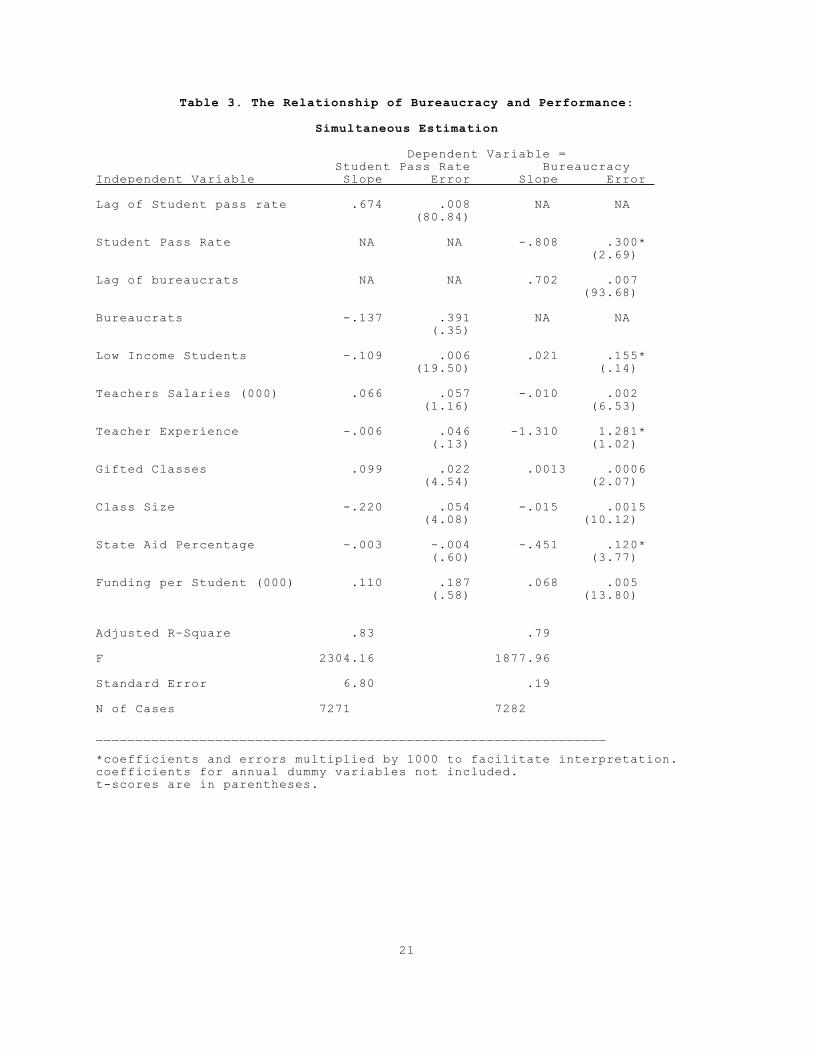
Although panel analysis techniques generally use a causal lag, they are
not required to if the relationship between the variables is shorter than any
feasible lag length. To allow for this possibility, we assumed that the
relationships between the key variables did not occur over a time lag and
estimated the relationships simultaneously with two-stage least squares using
all control variables and lagged dependent variable as instruments. In that
case, the coefficient associated with bureaucracy "causing" poor performance
was not distinguishable from zero (see table 3). The hypothesis that poor
performance resulted in an increased bureaucracy, however, was again supported
by the results.
[Table 3 About Here]
Regardless of the assumptions regarding the temporal relationships
between bureaucracy and student performance, the results are always consistent
with the contention that poor student performance results in the creation of
more bureaucracy. The results are robust to specification or method. We re-
estimated these equations including only those school districts with more than
500 students (data reporting problems are more frequent in smaller school
districts); the results were identical to those presented here. We included
other control variables, most prominently the percentage of black and Latino
students and school size (enrollment). Again our conclusions remained the
same. We also estimated the equations without the gifted class variable which
might not be completely endogenous. Again there was no difference.12
The Nature of the Organizational Response
14
A theoretically interesting question is whether school districts respond
to all students or only those with parents capable of exerting political
pressure. Meier and Stewart (1991), for example, argue that politics in
multi-racial situations is highly competitive with one ethnic group seeking to
gain benefits at the expense of other groups (but see McClain and Karnig
1990). In such circumstances, school districts often distribute educational
benefits according to the degree of political influence (Meier and Stewart
1991). Schneider et al.'s (1998) marginal consumer also supports the
hypothesis of differential responsiveness. Both arguments imply that
disaggregating student test scores by race and ethnicity has important policy
and theoretical ramifications.
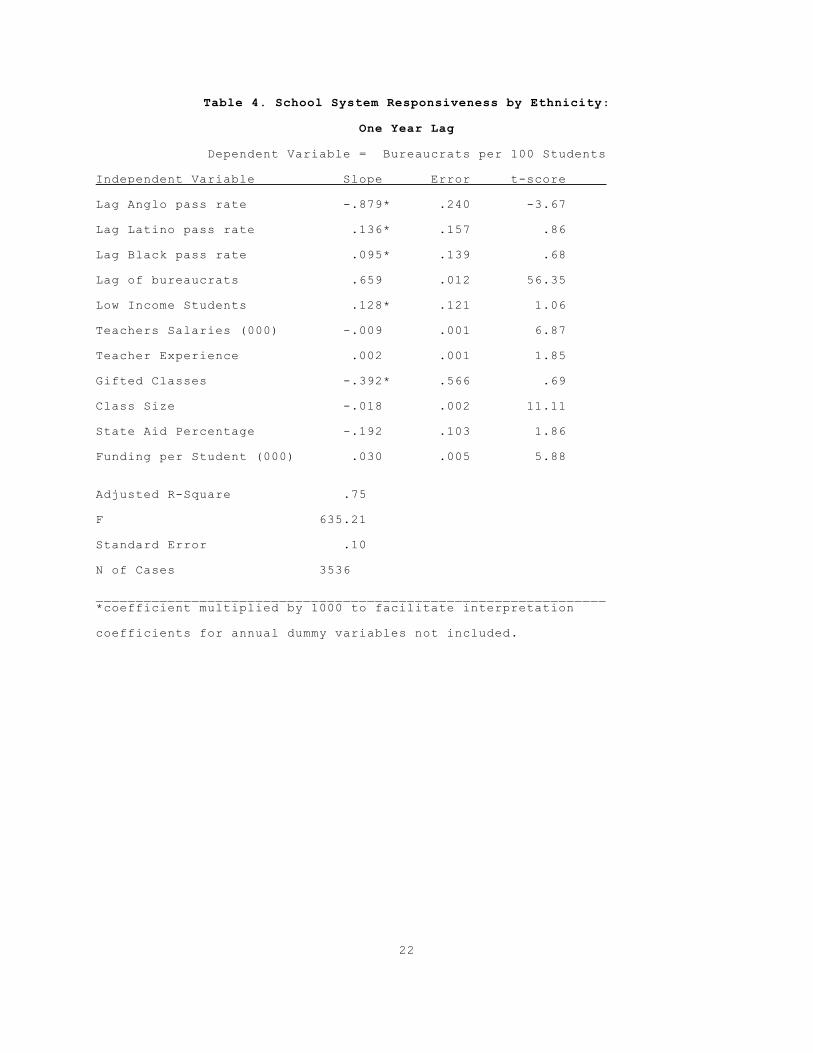
To investigate the question of to whom public schools are responsive, we
took the reported pass rates by race/ethnicity and entered all three variables
into the base equation from table 1. As Table 4 reveals, consistent with our
arguments, school districts appear to respond only to low test scores for
Anglo students. Test scores for both Latinos and blacks are not correlated
with subsequent increases in bureaucracy.
[Table 4 About Here]
The analysis in Table 4 was limited to only those districts with
sufficient minority and Anglo students to have test scores reported by the
state of Texas. Not all districts are multi-racial, and so our conclusions
only apply to a subset of school systems. The marginal consumer argument of
Schneider et al. (1998) and the competition hypothesis of minority group
politics, however, suggest that the dynamics of response might well be
different in school districts where the student population is not tri-racial.
In such circumstances, low pass rates for any large group of students should
trigger a response. As the composition of the student body changes, the
political balance of power in the district and the composition of the marginal
consumer are also likely to change.
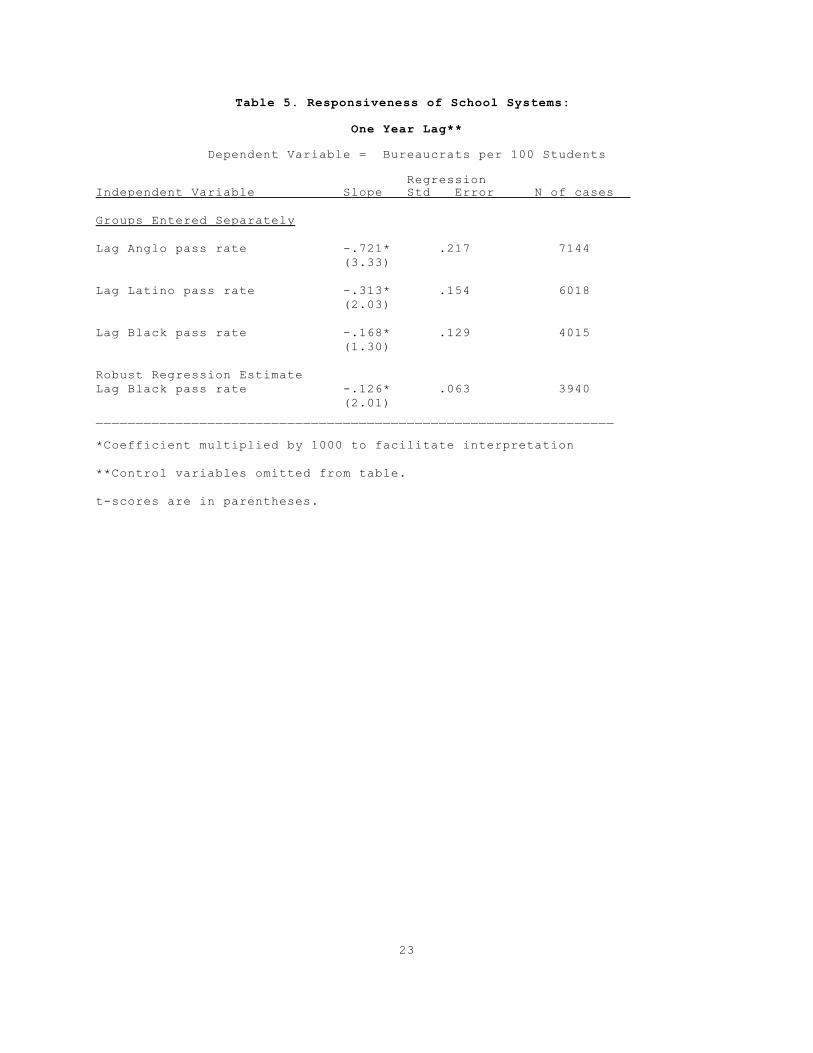
Table 5 reports the individual test score coefficients for each racial
13The type of robust regression used was Andrews' sine weights with a
single iteration.
15
group when entered as the sole pass rate in our general equation. The
findings confirm our hypotheses. Bureaucracy grows in response to Anglo pass
rates in districts with Anglo students, and it grows in response to Latino
pass rates in districts with Latino students. The black relationship is an
anomaly in its insignificance; however, that lack of significance is directly
attributable to a few districts distorting the regression line. When that
equation is reestimated with robust regression, bureaucracy is significantly
related to black student pass rates.13
[Table 5 About Here]
The relative size of the regression coefficients is also informative.
The largest response appears for Anglo students, the next largest for Latino
students, and the smallest for black students. These response patterns may be
linked to the political skills and participation levels of the various groups
in these districts (see Leighley and Vedlitz, 1999). The results may also
reflect the politics of coalition building in multi-racial jurisdictions
(Meier and Stewart 1991). A full examination of the reasons for the relative
size of these relationships, however, is beyond the scope of this paper, but
could provide insight into racial politics in the United States.
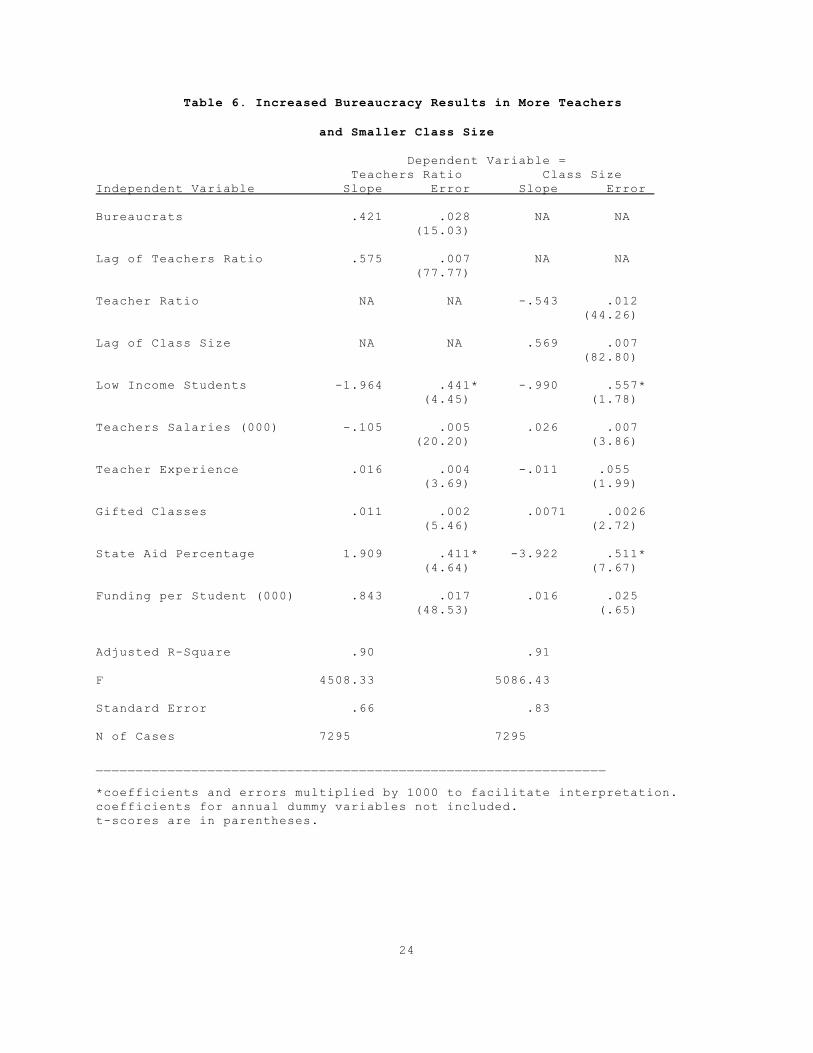
Thus far, we have demonstrated that school districts respond to low
student test scores with subsequent increases in bureaucracy. Is there any
evidence that this growth in bureaucrats is related to actual efforts to
improve student performance? Some indirect evidence on this position can be
found. If poor performance triggers an effort to improve, then increases in
bureaucrats should be correlated with other factors linked to performance.
One likely relationship is that between bureaucracy and teachers. A school
system seeking to correct problems by investing in special programs would also
increase its investment in teachers. Special programs often have smaller
16
class sizes, and even decreasing regular classes is associated with better
performance in rigorous experimental studies (Wenglinsky 1997). More
bureaucrats are then needed not only to supervise the increase in teachers but
also to absorb administrative burdens so that teachers can spend their time
actually teaching.
The first regression in Table 6 sets up a panel test of the bureaucracy-
teacher relationship (the test does not contain a lag for bureaucracy but
running the same equation with a lag produces even stronger results). Even
controlling for the number of teachers last year, the number of bureaucrats
per 100 students is positively associated with the number of teachers per 100
students. Much of this relationship, we feel, comes from an effort to reduce
class size. The second regression in table 6 shows the strong linkage between
an increase in teachers and a resulting decrease in class size. Even though
such actions might not produce the positive results these school districts
seek (and many reforms do fail, see Hess 1999), the pattern of results is
consistent with the Smith and Meier (1995) theory about organizational
responsiveness. Poor performance spawns efforts to change the organization.
This change results in more bureaucrats in the school system; more
bureaucrats, however, are also associated with a growth in teachers and
subsequently a reduction in class size. The negative relationship between
large classes and student performance in tables 1, 2, and 3 implies that these
reforms may have future positive impacts on student performance.
[Table 6 About Here]
Conclusions
Understanding the relationship between bureaucracy and academic
performance in the school choice policy debate is, at its core, a dispute
about causality. Chubb and Moe (1990) make an institutional argument that
bureaucratic organizations cannot respond to parental demands and thus,
bureaucracy "causes" low student performance. Smith and Meier (1995) counter
that poorly performing schools are likely to respond with new programs, and
17
these efforts will generate more bureaucracy to coordinate the reforms.
Bureaucratic growth, in other words, signals that the school system is
responding to environmental demands. This dispute can only be resolved with
panel data that assess how changes in one variable result or do not result in
subsequent changes in the other.
Using seven years of panel data from over 1000 school districts, we find
that bureaucracy has little impact on student performance in future years.
Poor performance by students, however, did result in bureaucratic growth in
subsequent years. Although we cannot determine from the data whether the
bureaucratic growth was reform-oriented, the growth following poor performance
was consistent with the reform hypothesis specified by Smith and Meier (1995).
Additional analysis revealed that the growth in bureaucrats was also
associated with a growth in teachers relative to students and smaller classes.
This analysis also examines arguments from the urban education
literature on the type of students that will generate an organizational
response. Both the marginal consumer hypothesis of Schneider and the racial
differences in political efficacy suggest that school districts, all other
things being equal, will respond to low test scores for Anglo students, but
not low test scores for minority students. Regression results confirm this
hypothesis in multiracial school districts. In school districts that were not
tri-racial, however, the school districts responded to low performance by any
substantial subset of students--Anglo, African-American, or Latino. This
pattern suggests some interesting questions about equity in multiracial school
districts that have ramifications for theories of minority politics.
This study also contributes to the literature on organization theory.
Chubb and Moe (1990) essentially make an organizational overload argument,
that organizations are pulled in so many directions that they lack the ability
to respond to environmental demands. Their hypothesis is especially important
because it implies that reform requires the simplification of the
organization's environment. Choice is one possible institutional structure to
14Organizations, of course, need resources to be able to respond. If
the organizations do not have the resources to hire more teachers and
bureaucrats, then responsiveness as outlined here is not possible.
18
simplify environments by letting schools select specialized niches.
Smith and Meier (1995) present a view of organizations from traditional
open systems theory. They expect schools to respond to all environmental
demands, including those demands for higher quality education (whether from
parents or from politicians). Low test scores are likely to generate
environmental pressure, especially if comparisons can be made to other
schools. Competing goals might limit the response, but organization theory
holds that open systems respond to environmental demands.14 This research
does not mean that Chubb and Moe's organization theory is wrong in all
circumstances, only that a large number of public school districts do not fit
their hypothesis. In many cases, a growth in bureaucracy is a sign that the
school system is trying to respond to low levels of performance.
19
Table 1. The Relationship of Bureaucracy and Performance:
One Year Lag
Dependent Variable = Student Pass Rate BureaucracyIndependent Variable Slope Error Slope Error
Lag of Student pass rate .674 .008 -.619 .230* (80.80) (2.69)
Lag of bureaucrats -.096 .275 .702 .007 (.35) (93.70)
Low Income Students -.109 .006 .000 .000 (19.50) (.14)
Teachers Salaries (000) .067 .056 -.010 .002 (1.20) (6.52)
Teacher Experience -.006 .046 -.001 .001 (.13) (1.03)
Gifted Classes .098 .022 .0012 .0006 (4.54) (1.93)
Class Size -.218 .052 -.015 .0014 (4.16) (10.08)
State Aid Percentage -.003 .004 -.433 .119* (.59) (3.63)
Funding per Student (000) -.100 .177 .068 .005 (.57) (13.83)
Adjusted R-Square .83 .80
F 2304.2 1877.96
Standard Error 6.80 .19
N of Cases 7271 7282
________________________________________________________________
*coefficients and errors multiplied by 1000 to facilitate interpretation.coefficients for annual dummy variables not included.t-scores are in parentheses.

20
Table 2. The Relationship of Bureaucracy and Performance:
Two Year Lag
Dependent Variable = Student Pass Rate BureaucracyIndependent Variable Slope Error Slope Error
Lag of Student pass rate .577 .010 -.867 .278* (60.32) (3.12)
Lag of bureaucrats .250 .314 .574 .009 (.80) (64.17)
Low Income Students -.137 .007 .192 .191* (20.97) (1.01)
Teachers Salaries (000) .141 .065 -.016 .002 (2.18) (8.23)
Teacher Experience -.064 .054 -.905 1.577* (1.18) (.57)
Gifted Classes .134 .026 .0021 .0007 (5.21) (2.87)
Class Size -.288 .060 -.021 .0017 (4.80) (12.09)
State Aid Percentage .002 .005 -.679 .147* (.42) (4.64)
Funding per Student (000) .081 .202 .094 .006 (.40) (16.01)
Adjusted R-Square .76 .73
F 1399.46 1202.36
Standard Error 7.39 .22
N of Cases 6231 6240
________________________________________________________________
*coefficients and errors multiplied by 1000 to facilitate interpretation.coefficients for annual dummy variables not included.t-scores are in parentheses.
21
Table 3. The Relationship of Bureaucracy and Performance:
Simultaneous Estimation
Dependent Variable = Student Pass Rate BureaucracyIndependent Variable Slope Error Slope Error
Lag of Student pass rate .674 .008 NA NA (80.84)
Student Pass Rate NA NA -.808 .300* (2.69)
Lag of bureaucrats NA NA .702 .007 (93.68)
Bureaucrats -.137 .391 NA NA (.35)
Low Income Students -.109 .006 .021 .155* (19.50) (.14)
Teachers Salaries (000) .066 .057 -.010 .002 (1.16) (6.53)
Teacher Experience -.006 .046 -1.310 1.281* (.13) (1.02)
Gifted Classes .099 .022 .0013 .0006 (4.54) (2.07)
Class Size -.220 .054 -.015 .0015 (4.08) (10.12)
State Aid Percentage -.003 -.004 -.451 .120* (.60) (3.77)
Funding per Student (000) .110 .187 .068 .005 (.58) (13.80)
Adjusted R-Square .83 .79
F 2304.16 1877.96
Standard Error 6.80 .19
N of Cases 7271 7282
________________________________________________________________
*coefficients and errors multiplied by 1000 to facilitate interpretation.coefficients for annual dummy variables not included.t-scores are in parentheses.
22
Table 4. School System Responsiveness by Ethnicity:
One Year Lag
Dependent Variable = Bureaucrats per 100 Students
Independent Variable Slope Error t-score
Lag Anglo pass rate -.879* .240 -3.67
Lag Latino pass rate .136* .157 .86
Lag Black pass rate .095* .139 .68
Lag of bureaucrats .659 .012 56.35
Low Income Students .128* .121 1.06
Teachers Salaries (000) -.009 .001 6.87
Teacher Experience .002 .001 1.85
Gifted Classes -.392* .566 .69
Class Size -.018 .002 11.11
State Aid Percentage -.192 .103 1.86
Funding per Student (000) .030 .005 5.88
Adjusted R-Square .75
F 635.21
Standard Error .10
N of Cases 3536
________________________________________________________________*coefficient multiplied by 1000 to facilitate interpretation
coefficients for annual dummy variables not included.
23
Table 5. Responsiveness of School Systems:
One Year Lag**
Dependent Variable = Bureaucrats per 100 Students
RegressionIndependent Variable Slope Std Error N of cases
Groups Entered Separately
Lag Anglo pass rate -.721* .217 7144 (3.33)
Lag Latino pass rate -.313* .154 6018 (2.03)
Lag Black pass rate -.168* .129 4015 (1.30)
Robust Regression Estimate Lag Black pass rate -.126* .063 3940 (2.01)_________________________________________________________________
*Coefficient multiplied by 1000 to facilitate interpretation
**Control variables omitted from table.
t-scores are in parentheses.
24
Table 6. Increased Bureaucracy Results in More Teachers
and Smaller Class Size
Dependent Variable = Teachers Ratio Class Size Independent Variable Slope Error Slope Error
Bureaucrats .421 .028 NA NA (15.03)
Lag of Teachers Ratio .575 .007 NA NA (77.77)
Teacher Ratio NA NA -.543 .012 (44.26)
Lag of Class Size NA NA .569 .007 (82.80)
Low Income Students -1.964 .441* -.990 .557* (4.45) (1.78)
Teachers Salaries (000) -.105 .005 .026 .007 (20.20) (3.86)
Teacher Experience .016 .004 -.011 .055 (3.69) (1.99)
Gifted Classes .011 .002 .0071 .0026 (5.46) (2.72)
State Aid Percentage 1.909 .411* -3.922 .511* (4.64) (7.67)
Funding per Student (000) .843 .017 .016 .025 (48.53) (.65)
Adjusted R-Square .90 .91
F 4508.33 5086.43
Standard Error .66 .83
N of Cases 7295 7295
________________________________________________________________
*coefficients and errors multiplied by 1000 to facilitate interpretation.coefficients for annual dummy variables not included.t-scores are in parentheses.
25
References
Beck, Nathaniel and Jonathan N. Katz. 1996. "Nuisance vs. Substance:
Specifying and Estimating Time-Series-Cross-Section Models." Political
Analysis 6: 1-36.
Beck, Nathaniel and Jonathan N. Katz. 1995. "What to Do (and Not to Do) with
Time-Series-Cross-Section Data." American Political Science Review 89
(September): 634-647.
Bohte, John. 2000. "School Bureaucracy and Student Performance at the Local
Level." Public Administration Review (forthcoming).
Brown, Bryon W. 1992. "Why Governments Run Schools." Economics of Education
Review, 11 (4): 287-300.
Burtless, Gary. 1996. Does Money Matter? The Effect of School Resources on
Student Achievement and Adult Success. Washington: Brookings.
Chubb, John E. and Terry Moe. 1988. "Politics, Markets and the Organization
of Schools." American Political Science Review 82 (December): 1065-
1089.
Chubb, John E. and Terry Moe. 1990. Politics, Markets and America's Schools.
Washington, DC: The Brookings Institution.
DeHaan, Robert F. 1963. Accelerated Learning Programs. Washington, DC: Center
for Applied Research in Education, Inc.
Downs, Anthony. 1967. Inside Bureaucracy. Boston: Little, Brown.
Durrat, Ali F. 1988. “Have Large Budget Deficits Caused Rising Trade
Deficits?” Southern Economic Journal 54:879-87.
Edgewood Independent School District v. Kirby. Texas SupCt, No. C-8353,
(1989).
Evans, William N., Shelia E. Murray, and Robert M. Schwab. 1997.
"Schoolhouses, Courthouses, and Statehouses After Serrano." Journal of
Policy Analysis and Management 16 (Winter): 10-31.
Fuller, Bruce, Costanza Eggers-Pierola, Susan D. Holloway, Xiaoyam Liang and
26
Marylee F. Rambaud. 1996. "Rich Culture, Poor Markets: Why do Latino
Parents Forego Preschooling?" Teachers College Record 97: 400-418.
Goodsell, Charles. 1983. The Case for Bureaucracy. Chatham, NJ: Chatham
House Publishers.
Granger, C. W. J. 1969. “Investigation of Causal Relations by Econometric
Methods.” Econometrica 37:424-38.
Hanushek, Eric A. 1996. "School Resources and Student Performance." In Does
Money Matter? The Effect of School Resources on Student Achievement and
Adult Success, Gary Burtless ed., Washington: Brookings.
Hanushek, Eric A. 1989. "Expenditures, Efficiency, and Equity in Education:
the Federal Government's Role." American Economic Review 79:46-51.
Hanushek, Eric A. and Richard R. Pace. 1995. "Who Chooses to Teach (and
Why)?" Economics of Education Review 14:107-117.
Hedges, Larry V. and Rob Greenwald. 1996. "Have Times Changed? The Relation
between School Resources and Student Performance." In Does Money Matter?
The Effect of School Resources on Student Achievement and Adult Success,
Gary Burtless ed., Washington: Brookings.
Henig, Jeffrey. 1994. Rethinking School Choice. Princeton: Princeton
University Press.
Hess, Frederick M. 1999. Spinning Wheels. Washington, DC: The Brookings
Institution.
Hsiao, Cheng. 1986. Analysis of Panel Data. New York: Cambridge University
Press.
Leighley, Jan and Arnold Vedlitz. 1999. "Race, Ethnicity, and Political
Participation." Journal of Politics 61 (November forthcoming).
March, James G. and Johan P. Olsen. 1989. Rediscovering Institutions. New
York: The Free Press.
McClain, Paula D. and Albert Karnig. 1990. "Black and Hispanic Socioeconomic
and Political Competition." American Political Science Review 84 (June):
27
535-45.
Meier, Kenneth J. and Kevin B. Smith. 1994. “Representative Democracy and
Representative Bureaucracy.” Social Science Quarterly 75 (December):
798-803.
Meier, Kenneth J. and Joseph Stewart. 1991. The Politics of Hispanic
Education. Albany: SUNY Press.
Moe, Terry M. and Scott A. Wilson. 1994. "Presidents and the Politics of
Structure." Law and Contemporary Problems 57 (Winter/Spring), 1-44.
Murray, Sheila E. 1995. "Two Essays on the Distribution of Education Resources
and Outcomes." Unpublished PhD. dissertation, Department of Economics,
University of Maryland.
National Education Goals Panel. 1996. The National Education Goals Report:
Building A Nation of Learners. Washington, DC: U.S. Government Printing
Office.
Necochea, Juan and Zullmara Cune. 1996. "A Case Study of Within District
School Funding Inequities." Equity & Excellence in Education 29: 69-77.
Nye, B.A., J. Boyd-Zacharias, B.D. Fulton, and M.P. Wallenhorst. 1992.
"Smaller Classes Really are Better." American School Board Journal May:
31-33.
Oakes, Jeannie. 1985. Keeping Track: How Schools Structure Inequality. New
Haven: Yale University Press.
O'Toole, Laurence J. 1996. "Rational Choice and the Public Management of
Interorganizational Networks." in The State of Public Management, Donald
F. Kettl and H. Brinton Milward eds. Baltimore: Johns Hopkins University
Press, 241-266.
Paris, David. 1995. Ideology and Education Reform. Boulder, CO: Westview
Press.
Pate-Bain, H., C.M. Achilles, J. Boyd-Zacharias, and B. McKenna. 1992. "Class
Size Does Make a Difference." Phi Delta Kappan November: 253-56.
28
San Antonio Independent School District v. Rodriguez. 411 U.S. 1 (1973).
Savas, E.S. 1987. Privatization. Chatham, NJ: Chatham House.
Schneider, Mark, Paul Teske, Melissa Marschall, and Christine Roch. 1998.
"Shopping for Schools: In the Land of the Blind, The One-Eyed Parent May
Be Enough." American Journal of Political Science 42 (July): 769-793.
Schneider, Mark, Paul Teske, Christine Roch and Melissa Marschall. 1997.
"Networks to Nowhere: Segregation and Stratification in Networks of
Information About Schools." American Journal of Political Science 41
(December): 1201-23.
Simon, Herbert A. 1947. Administrative Behavior. New York: The Free Press.
Smith, Kevin B. 1994. "Politics, Markets and Bureaucracy: Reexamining School
Choice." Journal of Politics 56 (May): 475-491.
Smith, Kevin B. and Kenneth J. Meier. 1994. "Politics, Bureaucrats and
Schools." Public Administration Review 54 (November): 551-558.
Smith, Kevin B. and Kenneth J. Meier. 1995. The Case Against School Choice:
Politics, Markets and Fools. Armonk, New York: M. E. Sharpe.
Stimson, James. 1985. "Regression in Time and Space: A Statistical Essay."
American Journal of Political Science 29 (November): 914-947.
Teske, Paul, Mark Schneider, Michael Mintrom, and Samuel Best. 1993.
"Establishing the Macro Foundations of a Micro Theory." American
Political Science Review 87 (September): 702-713.
Thompson, James D. 1967. Organizations in Action. New York: McGraw-Hill.
Wenglinsky, Harold. 1997. How Education Expenditures Improve Student
Performance and How They Don't. Princeton: Educational Testing Service.
Weiher, Gregory R. 1988. "Why Redistribution Doesn't Work: State Educational
Reform Policy and Governmental Decentralization in Texas." American
Politics Quarterly 16 (April): 193-210.
Witte, John F. 1992. "Private School Versus Public School Achievement: Are
There Findings That Should Affect the Educational Choice Debate?"
29
Economics of Education Review 11 (4): 371-394.
Wood, B. Dan. 1992. "Modeling Federal Implementation as a System." American
Journal of Political Science 36 (February): 40-67.