Embed Size (px)
Citation preview
Public Health ReportsVol. 66 * JUNE 1, 1951 * No. 22
lTuberculosis Studies in Muscogee County, Georgia
III. Tuberculosis Mortality Following a Community-Wide X-raySurvey
By GEORGE WCOMSTOCK, M.D., and MARY H BURKE, M.A.*
As the mortality rate for tuberculosis continues its downward trend,hopes for eventual elimination of the disease are reflected in the chang-ing emphasis placed on various tuberculosis control measures. In theUnited States in recent years, considerable stress has been placed onphotofluorographic chest X-ray surveys of entire communities, andit is probably true that X-ray surveys are more widely advocated andused than any other single tuberculosis control measure. The basicconcept of the community-wide X-ray survey is simple, rational, andnot radically different from other case-finding procedures long usedin tuberculosis prevention programs. The reasoning underlying theuse of such procedures is still essentially empirical and largely withoutspecific scientific evidence of immediate or long-range influence ontuberculosis morbidity and mortality.In an ideal or "perfect" community-wide survey, chest X-ray films
of all persons in a community would be made and examined for thepurpose of separating the total population into two groups, those whohave and those who do not have pulmonary tuberculosis.Two distinctly different benefits may be expected to accrue from
these procedures, both due entirely to the advantages that comebecause the disease is discovered earlier than it would have beenwvithout the survey. First, there is the gain to the newly discoveredcases due to the medical supervision and treatment given. Clearly,the value of the survey for the newly found cases depends on the factthat therapeutic procedures appear to be more effective early in thedisease in ameliorating the extent of morbidity and in reducing ordelaying tuberculosis mortality. Definitive evidence of the extent of*Surgeon and Biometrician, respectively, Field Research Branch, Division of Chronic Disease and
Tuberculosis.This is the sixty-fourth of a series of special issues of PUBLic HzALTH REPORTS devoted exclusively to
tuberculosis control, The special issues began March 1,1946, and appear the first week of each month.The articles are reprinted as extracts. Effective with the July 5, 1946, issue, these extracts may be pur-chased from the Superintendent of Documents. Government Printing Office, Washington, D. C. for 10cents a single copy. Subscriptions are obtainable at $1.00 per year, $1.25 foreign.
695
this effect is exceedingly difficult if not impossible to obtain and it ismore or less necessary to assume, on the basis of general experience inthe treatment of tuberculosis, that the earlier treatment is begun themore effective it is.The second and empirically the most important value of mass case-
finding procedures should accrue because the newly discoveredpatients may be prevented at an earlier time from further spreadingthe disease to others. Present knowledge of the contagiousness ofhuman tuberculosis indicates that effective isolation of known casesshould be of great importance in reducing morbidity and mortality.Few would question that this should be a major influence in decreasingthe rate of infection and subsequently of disease among infants,children, and young adults. However, because a high proportion ofthe older members of the population have already had a tuberculousinfection, we are uncertain what proportion of new disease arisingamong them could be prevented by the effective isolation of knowncases. This uncertainty is rooted in our lack of knowledge of theproportions of apparently new cases of the disease that arise as primaryinfection, as exogenous reinfection or endogenously. Until thefrequency of endogenous tuberculous disease- that which arises fromwithin an individual as a reactivation of a previous infection-isdetermined, the value of mass X-ray surveys cannot be fully demon-strated nor the problems of the eventual eradication of tuberculosisaccurately appraised.There are many ways in which present day community-wide X-ray
surveys fall substantially short of the ideal. In most programsX-ray films are obtained for only a part of the population and it mustbe granted that there may be relatively fewer cases, as many, orperhaps even more, among those not X-rayed. Additional cases oftuberculosis must be expected in the population that is continuouslymoving into most communities in this country. Thus, no surveycan claim to have identified every person in a community who mightbenefit by treatment and every individual capable of spreading thedisease. Other practical difficulties further reduce the effectiveness ofsurveys. Few communities can provide all of the tuberculosisservices considered desirable and, in addition, some patients fail totake advantage of what is offered. Isolation of all patients knownto be infectious is extremely difficult to attain and even then isolationis rarely complete. Not the least of other practical problems arisesbecause the interpretatioD of X-ray films, the critical and mosttechnical aspect of X-ray surveys, is subject to large variations (1, 2, 3).
If both practical and theoretical limitations of community-wideX-ray surveys are considered, it should not be surprising that so littlescientific knowledge is yet available of the effects of such surveys ontuberculosis morbidity and mortality.
June 1, .1951696
This paper represents an attempt to estimate the significance ofsurvey case finding in Muscogee County, Ga., a community of about100,000 persons, by a study of the tuberculosis deaths during a periodof 3Y years following a mass X-ray survey in 1946. The number oftuberculosis deaths in this period is too small to allow extensiveanalyses or definitive conclusions. Nevertheless the data presenteddo provoke speculation on the reasons for the continued developmentof fatal tuberculosis among various groups of the population.Deaths due to tuberculosis are classified according to the major
categories into which the survey subdivided the population. Ingeneral, this means a separation of persons dying of tuberculosis intothose known to have had the disease before the survey, those diagnosedas tuberculous as a result of the survey, those with negative surveychest films, and those not participating in the program. As could beexpected, a substantial proportion of the deaths occurred amongpreviously known patients and those first identified as cases in thesurvey. The most striking result of the study was the estimate,assuming the survey to have been complete, that more than one-thirdof all fatal tuberculosis in the 33-year period would not have beendetected by the mass survey technique. There was a marked differ-ence in this estimate for whites and Negroes; in the former less thanone-fifth and in the latter almost half of the dead would have hadnegative survey fims. In terms of average annual mortality ratesper 100,000 persons, 3 whites, and 39 Negroes with negative surveyfilms died of tuberculosis. These and other results reported in thepaper, while obviously not constituting a scientific evaluation of theeffects of a community-wide survey, furnish useful information oncertain aspects of the problems of tuberculosis control.
Description of Study ProgramA research program to study the circumstances associated with the
occurrence and spread of tuberculosis in a community was establishedin Muscogee County, Ga., in 1946, supported by the MuscogeeCounty Health Department, the Georgia State Department of Healthand the Division of Chronic Disease and Tuberculosis, Public HealthService. The applicability of this study to a wide variety of problemshas been explored in a previous paper (4).
Public healt.h tuberculosis work in Muscogee County is unique inthat the program represents a cooperative effort to combine an oper-ating tuberculosis service with an extensive investigation of funda-mental problems of tuberculosis epidemiology. Service activitiesof the health department include very careful examination and follow-up of cases and suspected cases; extensive X-ray screening servicefor the general population; and, most importantly for theresearch program, a relationship with hospitals and private physicianslune 1, 1951 697
which insures that almost 100 percent of even suspected cases oftuberculosis in the conmunity come to the attention of the healthdepartment. Special tuberculosis programs for the community haveincluded: the mass X-ray survey and a special census of the populationin 1946; tuberculin testing and BCG vaccination of the school-agepopulation in the Spring of 1947; and, in 1950, a combined X-ray,tuberculin testing, and BCG vaccination program for the entirepopulation. Records from all of these activities are currently organ-ized in a master filing system which is the basic tool for both servicesand investigations. All available information bearing on tubercu-losis-the results of chest X-rays, bacteriological exaaminations andskin tests and data on contacts, morbidity and mortality-is broughttogether both for the individual and the household.In 1946, the year of the first mass X-ray survey, a special census
showed that Muscogee County had a population of 95,638, of whichabout 30 percent were Negro. Approximately 57,000 persons livedin Columbus, the only city in the county, but the entire county canbe considered essentially urban.The survey, one of the first large community-wide surveys in this
country, was a joint venereal disease-tuberculosis program in whicheach person over 12 years of age was offered a blood test and a 70-mm.chest X-ray. It was carried out during a period of 6 weeks in Mayand June 1946. The response of the community to the survey andthe initial findings of the program have been described in an earlierpaper (5). Roughly, of the population over 15 years of age, 50percent of the whites, 90 percent of the Negroes or 60 percent of bothraces obtained an X-ray during the survey. The response waspoorest in the group 20-34 years of age and in those over 60, andrelatively poorer for the higher economic groups. All films were readindependently by two physicians, one a certified radiologist with longexperience in reading chest films, the other an experienced surveyfilm reader. As a result of these two interpretations of the surveyfilms, 461 white persons and 251 Negroes were judged by one or bothreaders to have sufficient evidence on their X-ray films to warrantsystematic follow-up observations for tuberculosis. Of these numbers5 percent of the whites and 6 percent of the Negroes could be identifiedas previously known cases of tuberculosis in the case register of thecounty health department.From the beginning of the cooperative research program in 1946,
careful attention has been directed to checking and verifying alldeaths which are or might be due to tuberculosis. This has involvedthe routine matching of all death certificates of Muscogee Countyresidents with the master tuberculosis index and an investigation ofall deaths reported as tuberculosis for which full details are not avail-able in the records of the health department.698 June 1, 1951
As a result of this work it is possible to state, with considerableconfidence in the accuracy and completeness of reporting, that 125deaths from tuberculosis- 45 whites and 80 Negroes-occurred amongMuscogee County residents between July 1, 1946, and December 31,1949. Four deaths officially reported as being due to tuberculosisare not included among the 125, while 6 deaths, not originally reportedas tuberculosis, are included. In the total there is only one death,reported as miliary tuberculosis, for which there is some question asto the correctness of the cause of death. Since the number of deathsincorrectly certified as tuberculosis is almost balanced by those whichshould have been certified as tuberculosis it would appear that theofficially reported death rate is reasonably accurate.
Results
Presurvey and postsurvey mortality ratesTuberculosis mortality in Muscogee County is compared for 3%-
year periods, before and after the survey, to determine if the surveyand the subsequent study program might have caused a significantdecrease. Although a population of only 100,000 may be relativelysmall as a basis for calculating mortality rates, periods of 3% yearsmay be sufficiently long to give fairly reliable average annual rates.Such rates for Muscogee County for the periods immediately preced-ing and following the community-wide survey should be reasonablyaccurate. A census of the population was made immediately afterthe survey in 1946, and the interpolations between that census andthe 1940 and 1950 official censuses give satisfactory populationestimates. A good deal of reliance can be placed on the count oftuberculosis deaths in the period following the survey. Actually theonly uncertain figure used for calculating the rates is the number oftuberculosis deaths in the presurvey period. But since the study ofcertification of tuberculosis deaths in the postsurvey period resultedin relatively few individual changes and almost no change in the totalcount, the officially reported figure for the earlier period is probablysatisfactory. It is possible, however, that as a result of the surveyand the study program, the emphasis on tuberculosis may have in-creased the reporting of tuberculosis as a cause of death and thus mayhave modified a decrease which might have occurred under circum-stances of consistent reporting.Table 1 indicates that tuberculosis mortality in Muscogee County
dropped from 21 to 18 per 100,000 for whites and from 83 to 72 forNegroes, decreases of about 15 percent between the 2 periods. Com-parable national averages for the same periods of time dropped from33 to 25 for whites and from 105 to 81 for nonwhites, a decrease ofabout 23 percent for each racial group. It is of interest in this con-June 1, 1951 699
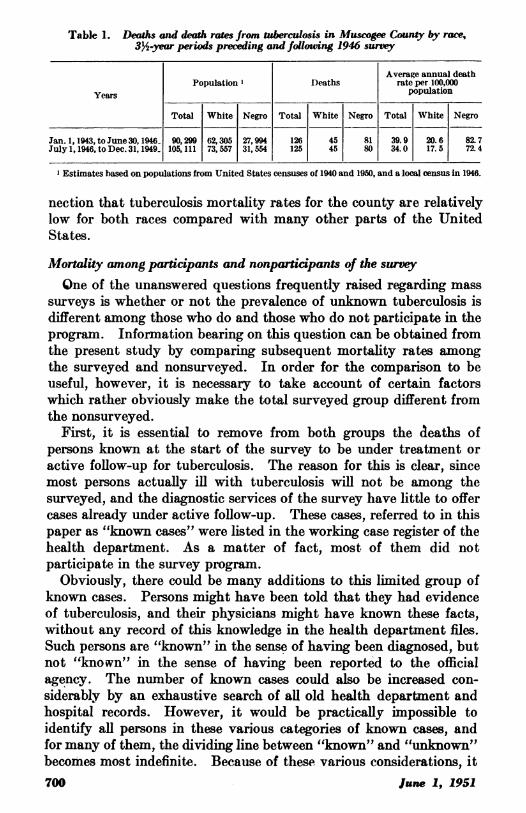
Table 1. Deaths and death rates from tuberculosis in Muscogee County by race,3%4-year periods preceding and follouing 1946 survey
Average annual deathPopulation X Deaths rate per 100,000
Years population
Total White Negro Total White Negro Total White Negro
Jan.1,1943,toJune30,1946 90,299 62,305 27,994 126 45 81 39.9 20.6 82.7Julyl,1946,toDec.31,1949 105,111 73,557 31,554 125 45 80 34.0 17.5 72.4
l Estimates based on populations from United States censuses of 1940 and 1950, and a local census in 1946.
nection that tuberculosis mortality rates for the county are relativelylow for both races compared with many other parts of the UnitedStates.
Mortality among participants and nonparticipants of the surveyOne of the unanswered questions frequently raised regarding mass
surveys is whether or not the prevalence of unknown tuberculosis isdifferent among those who do and those who do not participate in theprogram. Information bearing on this question can be obtained fromthe present study by comparing subsequent mortality rates amongthe surveyed and nonsurveyed. In order for the comparison to beuseful, however, it is necessary to take account of certain factorswhich rather obviously make the total surveyed group different fromthe nonsurveyed.
First, it is essential to remove from both groups the aeaths ofpersons known at the start of the survey to be under treatment oractive follow-up for tuberculosis. The reason for this is clear, sincemost persons actually ill with tuberculosis will not be among thesurveyed, and the diagnostic services of the survey have little to offercases already under active follow-up. These cases, referred to in thispaper as "known cases" were listed in the working case register of thehealth department. As a matter of fact, most of them did notparticipate in the survey program.
Obviously, there could be many additions to this limited group ofknown cases. Persons might have been told that they had evidenceof tuberculosis, and their physicians might have known these facts,without any record of this knowledge in the health department files.Such persons are "known" in the sense of having been diagnosed, butnot "known" in the sense of having been reported to the officialagency. The number of known cases could also be increased con-siderably by an exhaustive search of all old health department andhospital records. However, it would be practically impossible toidentify all persons in these various categories of known cases, andfor many of them, the dividing line between "known" and "unknkown"becomes most indefinite. Because of these various considerations, it700 June 1, 1951
appeared that the most practical correction would be to exclude fromboth the surveyed and nonsurveyed only those persons listed in thehealth department case register.
Second, survey X-ray films were offered only to persons over 12years of age. In order to take account of this factor it becomesnecessary, therefore, to base the mortality rate for the nonsurveyedgroup on the population and the deaths of nonsurveyed persons whowere over 12 years of age in 1946.The third factor which interferes with a useful comparison of the
surveyed and nonsurveyed groups arises because the age, race, andsex distributions of the two populations differ very markedly (5).Since the number of deaths is relatively small, it is not practical toattempt a detailed correction for all of these variables. We have hadto be content, therefore, with mortality rates for the surveyedand nonsurveyed groups, adjusted only to the race distribution ofthe total population.A fourth and most troublesome source of uncertainty in the com-
parison of the two groups arises because deaths occurring among per-sons who have moved from the county since the 1946 census un-doubtedly are unknown for all practical purposes. There is very littlethat can be done about this, and it has been necessary simply to assumethat they occurred proportionately in both the surveyed and non-surveyed populations.The pertinent data from the present study for estimating the differ-
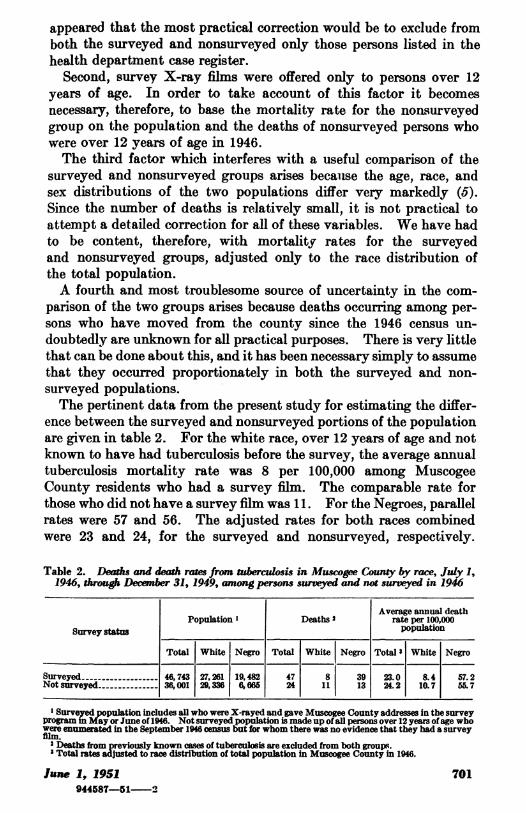
ence between the surveyed and nonsurveyed portions of the populationare given in table 2. For the white race, over 12 years of age and notknown to have had tuberculosis before the survey, the average annualtuberculosis mortality rate was 8 per 100,000 among MuscogeeCounty residents who had a survey film. The comparable rate forthose who did not have a survey film was 11. For the Negroes, parallelrates were 57 and 56. The adjusted rates for both races combinedwere 23 and 24, for the surveyed and nonsurveyed, respectively.
Table 2. Deaths and death rates from tiberculosis in Muscogee County by race, July 1,1946, through December 31, 1949, among persons surveyed and not surveyed in 1946
Average annual deathPopulation Deaths2 rate per 100,000
Survey status population
Total White Negro Total White Negro Total 3 White Negro
Surveyed - ---------- 46,743 27,261 19,482 47 8 39 23.0 8.4 57.2Not surveyed - - 36,001 29,336 6,666 24 11 13 24.2 10.7 55.7
XSurveyed population includes all who were X-rayed and gave Muscogee County addresses in the surveyprogram in May or June of 1946. Not surveyed population is made up of all persons over 12 years ofage whowere enumerated in the September 1946 census but for whom there was no evidence that they had a surveyfilm.2Deaths from previously known cases of tuberculosis are excluded from both groups.3Total rates adjustd to race distribution of total population in Muscogee County in 1946.
June 1, 1951 701944587-51-2
It appears that the chance of dying from tuberculosis was not differentamong the surveyed and the nonsurveyed. More accurate ratesmight have been obtained for the group not surveyed if it had beenipossible to match all records for each individual completely and cor-rectly. Undoubtedly, the nonsurveyed population includes somepeople who had survey films but whose X-ray records could not bematched to their census records. Likewise, death records for thenonsurveyed who were members of the community in 1946 did notall match with the census file. A correction for the latter woulddecrease the mortality among the nonsurveyed from that shown intable 2.
If one accepts the thesis that the surveyed and the nonsurveyed werenot dissimilar in respect to tuberculosis mortality, this conclusion hasan important implication with respect to a difference in the prevalenceof tuberculous disease among the surveyed and nonsurveyed. Thus itmay be argued that since the unknown cases of tuberculosis detectedin the survey received medical care more promptly than otherwisewould have happened, some of them at least, were prevented fromdying from the disease. Comparable cases among the nonsurveyed,since they were not detected and given medical attention as promptly,may have had a higher fatality rate than their counterparts whoparticipated in the survey. Since, in spite of this postulated differencein fatality rates in the two groups, the total mortality rate amongsurveyed and nonsurveyed was essentially the same, it may then bededuced that the prevalence of the disease was greater among theformer than the latter.
Further speculation as to the interpretation of these findings couldinclude the discussion of a wide range of important factors whichmay have influenced the mortality of the two groups. However, thenumber of deaths in this study is too limited to allow analyses of theeffects of other variables.
Proportional Distribution of Tuberculosis Deaths
The most significant findings of the present study are obtainedbecause it is possible to subdivide total tuberculosis mortality accord-ing to the four major groups of the population from which the deathscame. These were:
1. Previously known tuberculous patients. This group comprisesthe persons who were listed in the tuberculosis case register before thesurvey. It includes a few persons who had survey films.
2. Surveyed persons, further subdivided as: (a) "Positives," and(b) "negatives." The group as a whole excludes only previouslyknown cases. "Positives" in this group were those who, on the basisof their 70-mm. survey films, 14" x 17" follow-up film and clinic ex-amination were regarded as having either evidence of pulmonary702 June 1, 1951

tuberculosis or sufficient suspicion of it, to warrant systematic ob-servation for tuberculosis. "Negatives" were all others among thesuirveyed.
3. Nonsurveye(d persons, further subdivided as: (a) iMembers ofcommunity during survey, and (b) newcomers to community. Thegroup consists of adults not known to have the disease but who pre-sumably could have had a survey film, plus those who could haveparticipated had they been in the community at the time of the survey.
4. Ineligible persons. This is a relatively small group. It includesall persons who were less than 12 years old in 1946, and therebyineligible for the survey, plus a group of Muscogee Couinty resi(lentswho were inmates of the State Mfental Hospital at Mlilledgeville, Ga.
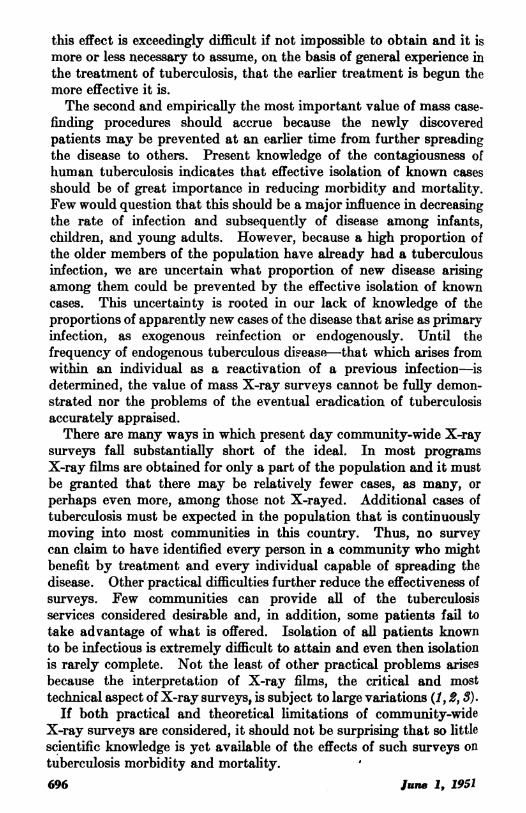
Contributions from each of the above four groups to the totaltuberculosis mortality cannot be determined as precisely as would bedesirable. The principal reason for this is the practical difficulty oftaking account of migration into and out of the county during the32-year observation period. For example, some Muscogee Countyresidents undoubtedly moved away and died of the disease and inorder to compensate for the loss of such deaths, it was finally con-sidered necessary simply to include the deaths of new residents of thecounty as a separate subdivision of the group designated as non-surveyed.A fairly detailed allocation of the 125 tuberculosis deaths is given in
table 3 according to the origin of the deaths from the above groupsof the population. About one-fourth of the deaths occurred amongcases known before the survey and about one-seventh among personsfirst discovered as tuberculous through the survey. These twoproportions, while informative of the local situation, are dependenton the extent of previous case-finding procedures and the completeness
Table 3. Observed distribution of deaths from tuberculosis in Muscogee County, by surveystatus and race, July 1, 1946, through Dec. 31, 1949
Total White Negro
Survey status Total TotalNum- Per- Ml Fe- MaeFe-ber eent Num- Per- Malemale Num- Per- M ale
ber cent ber cent
Total -125 100 45 100 20 25 80 100 43 37
Known cases------------ 29 23 12 27 5 7 17 21 10 7Surveyed -- -------- - 47 38 8 18 2 6 39 49 21 18
Positive X-ray -18 15 5 11 1 4 13 16 5 8Negative X-ray-29 23 3 7 1 2 26 33 16 10
Not surveyed ---------- 34 27 15 33 9 6 19 24 10 9Members of community-. 24 19 11 24 7 4 13 16 6 7New to community- 10 8 4 9 2 2 6 8 4 2
Ineligible ------------- 15 12 10 22 4 6 5 6 2 3Under 12 years of age 8 6 5 11 1 4 3 4 1 2Hospitalized in mentalinstitutions ------------ 7 6 5 11 3 2 2 2 1 1
June 1, 1951 703~~~~~~~~~~~~~~~~~~~~~~~~~~~~~~~~~~~~~~~~~~~~~~~~~~~~~~~~~~~~~~~~~~~~~~~~~~~~~~~~~~~~~~~~~~~~~~~~~~~~~~~~~~~~~~~~~~~~~~~~~~~~~~lune 1,, 1951 703
of the survey. They must not be viewed as being representative ofsurveys in general. For example, if case finding in a community isvery extensive before a survey, proportionately fewer cases would beavailable for discovery by the community-wide program, and it wouldbe expected that the contribution of known cases to subsequentmortality would be larger. If, on the other hand, only a small propor-tion of the cases in a community are known before the survey, deathsamong survey-discovered cases might be expected to be a largerproportion of all tuberculosis deaths. Another important factorwhich would influence the proportion of deaths among survey-discovered cases is, of course, the completeness of the survey.
Deaths among persons classified as nonsurveyed, either becausethey did not choose to have a survey film or were newcomers to thecommunity, totaled one-quarter of all tuberculosis deaths. Again,this proportion is applicable to the Muscogee County program andmight differ markedly in other communities.About one-eighth of the deaths came from segments of the popula-
tion which are more or less outside the scope of survey activities.Thus, 6 percent of the tuberculosis deaths were in the unsurveyedchild population and an additional 6 percent in the special smallgroup institutionalized for mental illness. To some extent it may bereasonable to view this proportion of tuberculosis mortality as anestimate of what might be found generally in other community groups.The last, and perhaps the most significant finding presented in
table 3, is that 29 or one-fourth of all tuberculosis deaths occurredamong persons who actually had a survey X-ray film but were advisedthat they were free of the disease. A very marked difference betweenwhites and Negroes is apparent: less than one-tenth of the whitedeaths, but one-third of the Negro deaths occurred in the populationactually surveyed and reported as having negative films. Part of thisapparent difference is obviously created by the fact that a much higherproportion of the Negro than the white population had survey films.The question may be raised as to whether inaccuracies in the inter-
pretation of the 70-mm. survey films might account for the finding ofsuch a large number of deaths so soon after the survey, among thosereported as having negative films. This question was investigatedby a careful review of the 70-mm. survey films of the 29 cases. For25 films, retrospective study, even with the knowledge of the locationof the lesions which appeared on later films, failed to reveal any evi-dence of abnormality. In 4 of the 29 survey films, however, lesionssuggestive of tuberculosis were observed, 2 of which were quitedefinite. It must be admitted that these 4 films represent positivecases which were missed by two experienced film readers.The significance of reporting these 4 films as negative should be
judged in terms of the number of fatal cases found among those with704 June 1, 1951

positive films. As shown in table 3, 18 of that group died of tuber-culosis and, together with the 4 missed cases, make a total of 22 deathsamong actually positive survey cases. Obviously, this is not a largeexperience from which to draw general conclusions, but in this instanceat least, about 20 percent of disease serious enough to be fatal in arelatively short time was missed on two independent readings of thesurvey films.
Contributions to mortality of potential survey positives and negativesAs indicated in previous sections of the paper, contributions to
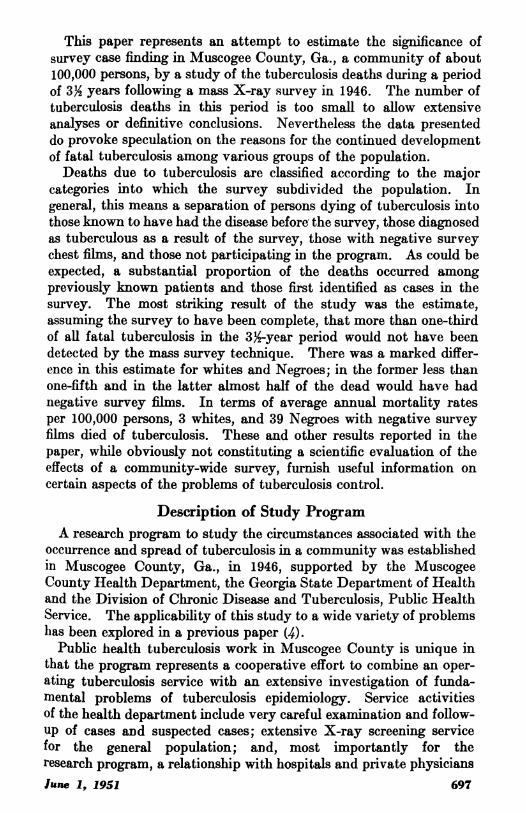
tuberculosis mortality of the various component parts of the observe(dsurveyed and nonsurveyed groups are highly interrelated and furnishifindings which primarily apply only to the particular situation andsurvey in Muscogee County. By making certain assumptions, how-ever, it is possible to rearrange and summarize these findings in sucha way as to furnish a very much more generalized evaluation of theeffects of the community-wide survey technique. The essence of thisgeneralization is to estimate the potential amount of tuberculosismortality that might have been included in survey positive cases andsurvey negative cases had the entire adult population of the com-munity been surveyed. To express it somewhat differently, an at-tempt is made to estimate the amount of fatal tuberculosis in thefollowing 33 years, that would, and would not, have been identifiedby a complete community-wide survey. From the data already pre-sented it would appear that there might be a very significant differencebetween whites and Negroes in this respect, pointing to a markeddifference for the two races in the efficiency of the community-widesurvey in detecting rapidly fatal tuberculosis.Table 4 presents. a hypothetical distribution of tuberculosis mor-
tality into three component parts according to the population fromwhich it arises-persons regarded as ineligible for the survey, "poten-tial positives" and "potential negatives." The "potential positives"include cases known before the survey, positives observed among thesurveyed, and an estimate of the positives among the nonsurveyed.
Table 4. Theoretical distributions of deaths from tuberculosis in Muscogee County, bysurvey status and race, July 1, 1946, through Dec. 31, 1949, assuming 100 percent par-ticipation of the eligible population
Total White NegroSurvey status
Number Percent Number Percent Number Percent
Total---- ------ --- 125 100 45 100 80 100
Ineligible for X-ray------------------ 1510 5 6Eligible for X-ray ----------------- 110 883578 75 94
Potential positives -64 51 27 60 37 46Potential negatives -46 37 8 18 38 48
June I., 1951 705
"6Potential negatives" then become those found to be negative whensurveyed plus the estimated number of negatives among the non-surveyed. The critical problem in obtaining these numbers is, ofcourse, the subdivision of deaths among the nonsurveyed into thosewho would be expected to have positive and negative films had theybeen surveyed. We have done this by assuming that deaths amongthe nonsurveyed would have been divided between "positives" and"negatives" in the same proportion as was observed in the surveyedgroup. This assumption is strengthened by the fact that mortalitywas essentially the same among the surveyed and the nonsurveye(l.Actually, 62 percent of the deaths among the surveyed whites andl 33percent of tlhose among the surveyed Negroes had positive films inthe survey, and these were the proportions applied to the nonsurveyedpopulation to estimate the "positives."The resulting theoretical distribution brings out the potentialities
of locating subsequently fatal tuberculosis by a complete X-ray surveyof a community. Approximately 12 percent of the deaths, as pre-viously shown, occurred in that part of the population which wasineligible for the mass program. Just over half of the deaths wouldbe expected among persons defined as having positive survey filmswhile 37 percent would have been judged to be free of the disease.
Table 4 also shows a marked difference between whites and Negroesin the proportion of deaths occurring among potentially negativecases. Assuming complete examination of both races, about one-fifth of all white tuberculosis deaths can be expected to come fromthe group of persons with negative chest X-rays. Among Negroes,however, one-half of all of those who died of tuberculosis would havehad negative survey films.
Special Tuberculosis Death RatesIn the previous sections of this paper, tuberculosis mortality has
been presented in terms of the proportion of deaths that arise fromdifferent subgroups of the population. This method of analysis wasadopted, rather than the more usual one of determining group-specificmortality rates, because of the difficulty of obtaining populationcounts for the different subgroups. Reasonably satisfactory popula-tion figures are available, however, for the groups designated as sur-vey positives and negatives. Table 5 provides the data for a com-parison of whites and Negroes. The deaths recorded there excludecases known before the survey. Populations for the survey negativesare simply the counts of persons whose films were interpreted asnegative. Populations for the survey positives include those personsconsidered to be in need of observation for definite or suspected tuber-culosis, based on the findings of the initial clinic examination. Nocases have been discharged from follow-up except for definite evi-706 June 1, 1951

dence on subsequent examinations that the initially observed abnor-mality was not tuberculous. Such persons as have been dischargedduring the 33-year post survey period have also been excluded fromthe survey positive population as given in table 5.
Table 5. Deaths and death rates from tuberculosis in Muscogee County by race, July 1,1946, through Dec. 31, 1949, in selected groups of the surveyed population
AveragePopula ~~annual
Survey status and race Ponpla Deaths death ratetion ~~~per 100,000
population
Survw ositive:Wrhiptoesi ----- ---------- ----- ---- 3775 380
Negro -189 13 1,970Survey negative:
White -------------------------------------------------- 26,86033Negro -19,277 26 39
As might be expected, the death rates for survey positive cases arevery high-almost 400 per 100,000 for whites and nearly 2,000 forNegroes. In one sense, these are crude tuberculosis fatality rates and,although based on very small numbers of deaths, give some indica-tion of the effectiveness of the services rendered survey-discoveredcases. While it is not possible to determine how much larger therates might have been without the survey, it is obvious that not allcases can be prevented from dying.The mortality rate among survey negative cases is very low for
whites-3 per 100,000 persons per year. This finding certainly indi-cates that rapidly fatal tuberculosis very rarely occurs among thosewho have a survey film that is reported as being negative. In strik-ing contrast, the Negro rate is 39, 13 times that for the whites. Forboth the presurvey and the postsurvey periods, the total Negro deathrate from tuberculosis is only 4 times that for the whites; for thepopulations not surveyed, and for the survey positives, the Negrodeath rate is only 5 times greater. Because of the small number ofdeaths occurring in some of these groups, it is not possible to demon-strate statistically significant differences. It would appear, however,that it is in the negative group that Negro tuberculosis mortalitycompares least favorably with the white.The fatal cases among the persons with negative films must have
resulted from tuberculous disease arising either from within an indi-vidual as endogenous disease, from outside sources, resulting inexogenuous reinfection or progressive primary disease. One wouldnot expect the Negroes with negative films to have been exposedto any more infectious cases than the whites, since the survey pro-gram of identification and isolation appeared to have been moreeffective for the Negroes. Three-quarters of the adult Negroes butonly half of the whites were surveyed. It may be assumed then that,June 1, 1951 707
of the contagious cases, more Negroes than whites were identified.The achievement of complete isolation of all infectious cases is apractical problem in most large communities because of the reluctanceof patients to accept medical recommendations and treatment. Forabout two-thirds of the cases in this county, hospitalization was pro-vided, a record that probably compares favorably with most otherlarge communities. This proportion of known infectious cases hos-pitalized and consequently fairly well isolated has been maintainedthroughout the postsurvey period. Estimates would indicate that ahigher proportion of Negro than white contagious cases was isolated.Although the white cases left in the community could expose someNegroes, and vice versa, yet for practical purposes the contagiouscases are most likely to expose members of their own race. Conse-quently, it is difficult to see how there could be more unisolatedsources to infect Negroes than the whites.
There are other possible explanations for this situation. It maybe that the contacts of the unisolated Negro cases had more intenseinfection, and because of this greater dosage of infection, thev weremore prone to develop fatal disease. It is also possible that the Negrocontacts who did develop the disease ran a much more rapid clinicalcourse, and that insufficient time has elapsed for more chronic casesto appear in the mortality statistics. General clinical experienceindicates that whites are more likely to have slowly progressive tuber-culosis than Negroes, and because of this it may be that 3Y years isinsufficient time to demonstrate fatal disease among the whites. Or,finally, it may well be that endogenous tuberculosis is of greatersignificance among Negroes than whites. Further studies, more ex-tensive in both numbers and time, will be required to elucidate whythe Negroes with previously negative films appear to compare lessfavorably with their white counterparts than do those with X-rayevidence of tuberculosis.
If future experience should demonstrate that the marked race differ-ence in mortality among persons with negative survey films is not dueto the relatively short period of observation, these findings will haveenormously important implications for tuberculosis control, as Davies(6) and his coworkers (7) have pointed out. For whites, a singlecomplete survey of the entire population might possibly reducetuberculosis control for a considerable period of time almost entirelyto the task of providing adequate medical care and follow-up servicefor cases that can be identified by the mass survey procedure. ForNegroes, such a program as carried out at the present time wouldapparently not be sufficient. But whether improvements could beeffected through much more prompt and effective isolation for Negroes,through more extensive and frequent postsurvey case finding, orthrough measures designed to decrease the likelihood of endogenous
708 .tune 1, 1951
disease, cannot be answered at this time. However, by means ofsuch intensive studies as are being continued in Muscogee County ofthe conditions under which persons with negative survey films acquirerapidly fatal disease, it may be possible to discover the critical ele-ments that are still lacking in our understanding of the naturalhistory of tuberculosis, and through this knowledge to suggest moreeffective methods of its control.
Summary
In 1946, a co munity-wide chest X-ray survey was carried out inMuscogee County, Ga., in which 60 percent of the population over12 years of age was examined. On the basis of a census taken shortlyafter the survey and a careful study of tuberculosis in the county sincethe survey, it has been possible to allocate tuberculosis deaths whichoccurred in a 334-year postsurvey period into three major groups-those among cases known prior to the survey, those examined in thesurvey, and those not examined in the survey. Although the numberof tuberculosis deaths in this period is too small to allow extensiveanalyses, or conclusions which are as definitive as might be desirable,the results would appear to warrant careful consideration. Amongthese results are the following:
1. Tuberculosis mortality rates for the county decreased slightly inthe 3Y2-year period following the survey.
2. Tuberculosis mortality among the surveyed and nonsurveyedpopulations is not significantly different. Since part of the surveyedcases had treatment earlier in their disease than the nonsurveyed cases,their fatality may have been somewhat decreased. This suggests thatthe nonsurveyed population had proportionately fewer cases of tuber-culosis than the surveyed; and the fact that the death rate was notmore markedly decreased cannot be explained on the basis of undis-covered cases alone.
3. If one assumes that all eligible persons in the community wereX-rayed in the survey, it can be estimated that three-eighths of alldeaths would have occurred among persons with negative surveyfilms. One-fifth of all white deaths and one-half of Negro deathswould not have shown X-ray evidence of tuberculosis at the time ofthe survey.
4. Crude fatality rates for the survey positive cases are rather high,averaging annually to almost 400 per 100,000 for the whites, andslightly less than 2,000 for the Negroes.
5. Mortality rates among survey negatives show even more strikingrace differences. The white rate is only 3 per 100,000; the Negro rateis 39, or 13 times as large. However, Negro mortality among thosewith evidence of disease on the survey film and among the generalJune 1, 1951 709
944587-51-3

population is only 4 to 5 times as great as the white. The reasons forthe greater difference between races in mortality among those with noevidence of tuberculosis at the time of the survey are unknown.Since a larger proportion of the Negroes were X-rayed in the surveyand thereby more cases were identified and isolated it seems unlikelythat more contagious cases were left as sources of infection among theNegroes than the whites.
If future studies confirm these findings, it appears that a completesurvey in a white population followed by adequate isolation might beso effective that for some time the tuberculosis control program in thecommunity would consist chiefly of the provision of medical care andfollow-up services to persons identified as tuberculous in the survey.For Negroes, it would seem that this would not be sufficient. Studiesare being continued to ascertain the reasons for the striking differencein mortality between the two races, to improve our understaDding ofthis disease, and to increase thereby the effectiveness of tuberculosiscontrol.ACKNOWLEDGMENT
The authors are indebted to Dr. C. E. Palmer, Chief, Field Research Branch,Division of Chronic Disease and Tuberculosis, Public Health Service, for hisinvaluable guidance and assistance in the preparation of the manuscript.
REFERENCES
(1) Birkelo, C. C., et al.: Tuberculosis case finding. A comparison of the effec-tiveness of various roentgenographic and photofluorographic methods.J. A. M. A. 133: 359-365 (1947).
(2) Cochrane, Archibald L., Campbell, Harold W., and Stein, Samuel C.: Thevalue of roentgenology in the prognosis of minimal tuberculosis. Am. J.Roentgenol. 61: 153-165 (1949).
(3) Garland, L. H.: On the scientific evaluation of diagnostic procedures. Radiol.52: 309-328 (1949).
(4) Comstock, G. W.: Tuberculosis studies in Muscogee County, Georgia. I.Community-wide tuberculosis research. Pub. Health Rep. 64: 259-263(1949).
(5) Burke, M. H., Schenck, H. C., and Thrash, J. A.: Tuberculosis studies inMuscogee County, Georgia. II. X-ray findings in a community-wide sur-vey and its coverage as determined by a population census. Pub. HealthRep. 64: 263-290 (1949).
(6) Davies, R.: The effect on tuberculosis morbidity of a complete communitysurvey with hospitalization of all active cases. Am. Rev. Tuberc. 54:254-260 (1946).
(7) Davies, R., Hedberg, G. A., and Fischer, M.: A complete community surveyfor tuberculosis. A second report on the effectiveness of the procedure asa method of tuberculosis control. Am. Rev. Tuberc. 58: 77-84 (1948).
710 June 1, 1951
APPENDIX
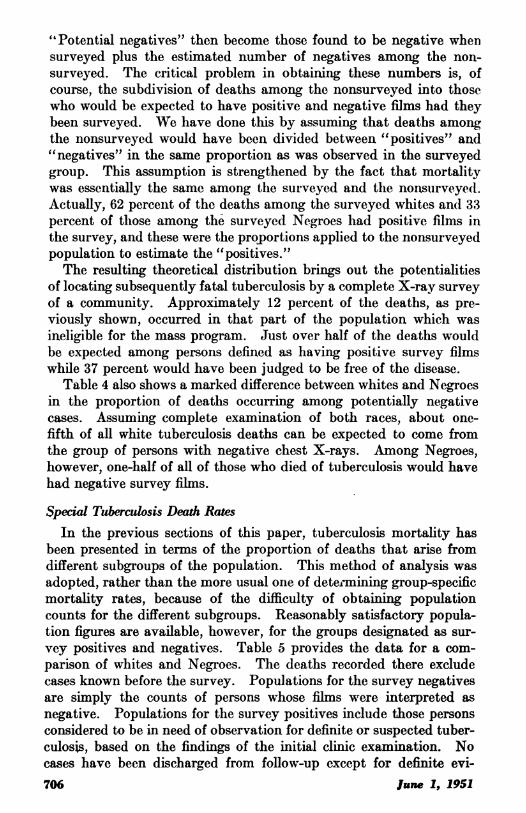
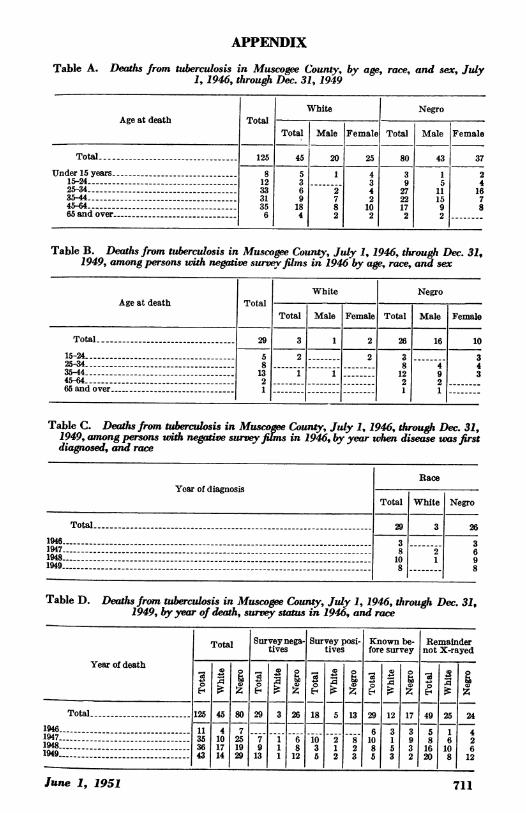
Table A. Deaths from tuberculosis in Muscogee County, by age, race, and sex, July1, 1946, through Dec. 31, 1949
White NegroAge at death Total
Total Male Female Total Male Female
Total -125 45 20 25 80 43 37
Under 15 years-8 5 1 4 3 1 215-24-------------------- 12 3 31 9 5 425-34 -33 6 2 4 27 11 1635-44 -31 9 7 2 22 15 7
45-64 -35 18 8 10 17 9 865 and over----------- ----- 6 4 2 2 2 2
Table B. Deaths from tuberculosis in Muscogee County, July 1, 1946, through Dec. 31,1949, among persons with negative survey films in 1946 by age, race, and sex
White NegroAge at death Total _
Total Male Female Total Male Female
Total -29 3 1 2 26 16 1015-24 ----------------------------- 5 2 2 3 325-34--------- 8 - - - 8 4 435-44--------- 13 1 1 12 9 345-64------------------- 2-------------- 2 2.65 and over- 1 --- 1
Table C. Deaths from tubeculosis in Muscoe County, July 1, 1946, through Dec. 31,1949, among persons uih negative surveyfims in 1946, by year when disease was firstdiagnosed, and race
RaceYear of diagnosis
Total White Negro
Total -29 3 261946--- 3 31947 -8 2 61948 ---------- 10 1 91949- 8 8
Table D. Deaths from tuberculosis in Muscogee County, July 1, 1946, through Dec. 31,1949, by year of death, survey status in 1946, and race
Total Survey nega- Survey posi- Known be- Remaindertives tives fore survey not X-rayedYear of death
-~~~0 0~: E- :z0E-
Total ------ 125 45 80 29 3 26 18 5 13 29 12 17 49 25 241946 - -------------- 11 4 7-6 3 3 5 1 41947 -35 10 25 7 1 6 10 2 8 10 1 9 8 6 21948--------------- --36 17 19 9 1 8 3 1 2 8 5 3 16 110 1 61949 -43 14 29 13 1 12 5 2 3 5 3 2 20 8 12
June_ 1_1711June 1., 1951
(Secondary Radiation Limits in Photofluorography
By WVIuRD W.ENALLiN, B. Sc.*
In establishing standards for the protection of personnel subjectedto general X-radiation, the National Advisory Committee on X-rayand Radium Protection, National Bureau of Standards, in 1949 recom-mended a maximum tolerance dosage of 0.3 roentgen (300 milliroent-gens) per week (1). Although this standard is generally observed atthe present time, there are many who feel that the recommendedradiation dosage limit is too high, especially under operating conditionswhere particularly susceptible parts of a technician's body may beexposed to X-rays. Several generations must elapse before this limit,or any other for that matter, can be proved entirely safe. Therefore,in the absence of definite proof of safety, it must be the aim of all con-cerned with radiation protection not merely to keep the personneldosage rate below the arbitrary level of 300 mr. per week, but rather,to keep it as low as possible.
It should follow, therefore, that there can be no justification foroperatingan X-ray unit at higher personnelradiation dosage levels thanthose encountered on other similar installations, even though alldosages are within the 300 mr. per week limit. In other words, thecriterion for radiation safety should be represented by the radiationdosage conditions encountered in the installation affording the mostnearly complete protection. Thus, if a photofluorographic unit canoperate at a personnel exposure level of 40 mr. per 1,000 exposures,any other unit which may be operating at twice this dosage level canjustifiably be criticized for its inadequate protection of personnel,even with a total weekly dosage under existing load conditions of lessthan 300 mr.What, therefore, are realistic limits for radiation exposure dosage
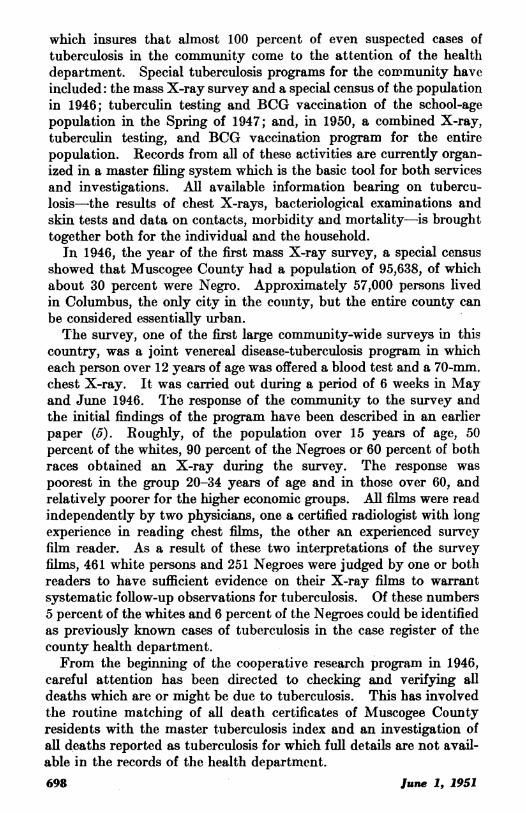
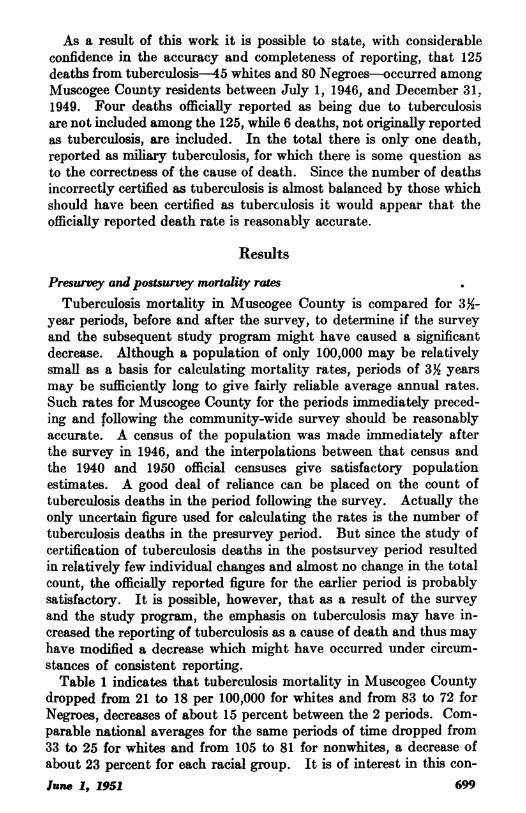
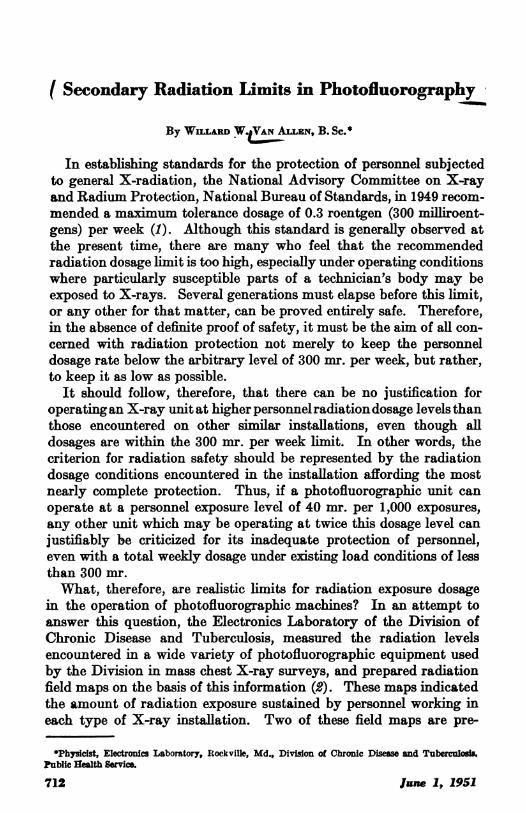
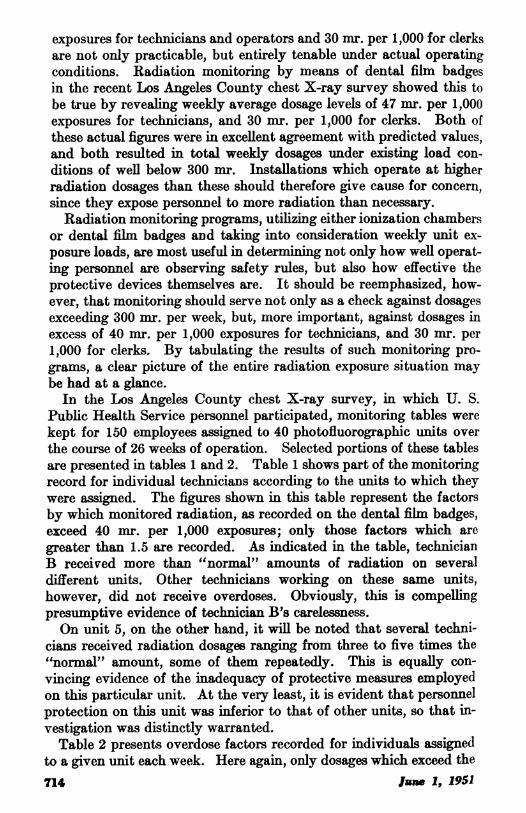
in the operation of photofluorographic machines? In an attempt toanswer this question, the Electronics Laboratory of the Division ofChronic Disease and Tuberculosis, measured the radiation levelsencountered in a wide variety of photofluorographic equipment usedby the Division in mass chest X-ray surveys, and prepared radiationfield maps on the basis of this information (2). These maps indicatedthe amount of radiation exposure sustained by personnel working ineach type of X-ray installation. Two of these field maps are pre-
*Physicist, Electronics Laboratory, Rockville, Md., Division of Chronic Disse and Tuberculods.Public Iealth Sevice.
712 June 1, 1951

sented in figures 1 and 2. The former shows the radiation intensityin the various regions surrounding a typical portable photofluorograph,while the latter gives the same information for a typical mobile installa-tion. These two examples ha-ve been chosen not because they neces-sarily represent ideal protective conditions, but rather the best condi-tions found in the study. At the same time, they are the mostcommonly used installation plans.In each of these typical installations, a technician should be able
to limit his radiation dosage to approximately 40 mr. per 1,000 expo-sures. Clerks in the mobile installation (fig. 2) should receive no morethan 30 mr. per 1,000 exposures, while those in the portable unit(fig. 1), should receive even less than this dosage if reasonable care istaken to locate them at positions affording maximum protection.In the experience of the Division of Chronic Disease and Tuber-
culosis, these radiation exposure dosage limits of 40 mr. per 1,000
\200
\ \ 1500~~~~~~~~0
10 )20 )30 940>
SCALE
F 3 FEET
Figure 1. Radiation intensities (in milliroentgens per 1,000 exposures) surround.ing a typical portable photofluorograph.
Figure 2. Radiation intensities (in milliroentgens per 1,000 exposures) surround.ing a typical mobile photofluorograph.
-lane .1, .1951 713
exposures for technicians and operators and 30 mr. per 1,000 for clerksare not only practicable, but entirely tenable under actual operatingconditions. Radiation monitoring by means of dental film badgesin the recent Los Angeles County chest X-ray survey showed this tobe true by revealing weekly average dosage levels of 47 mr. per 1,000exposures for technicians, and 30 mr. per 1,000 for clerks. Both ofthese actual figures were in excellent agreement with predicted values,and both resulted in total weekly dosages under esisting load con-ditions of well below 300 mr. Installations which operate at higherradiation dosages than these should therefore give cause for concern,since they expose personnel to more radiation than necessary.
Radiation monitoring programs, utilizing either ionization chambersor dental film badges and taking into consideration weekly unit ex-posure loads, axe most useful in determining not only how well operat-ing personnel are observing safety rules, but also how effective theprotective devices themselves are. It should be reemphasized, how-ever, that monitoring should serve not only as a check against dosagesexceeding 300 mr. per week, but, more important, against dosages inexcess of 40 mr. per 1,000 exposures for technicians, and 30 mr. per1,000 for clerks. By tabulating the results of such monitoring pro-grams, a clear picture of the entire radiation exposure situation maybe had at a glance.
In the Los Angeles County chest X-ray survey, in which U. S.Public Health Service personnel participated, monitoring tables werekept for 150 employees assigned to 40 photofluorographic units overthe course of 26 weeks of operation. Selected portions of these tablesare presented in tables 1 and 2. Table 1 shows part of the monitoringrecord for individual technicians according to the units to which theywere assigned. The figures shown in this table represent the factorsby which monitored radiation, as recorded on the dental film badges,exceed 40 mr. per 1,000 exposures; only those factors which aregreater than 1.5 are recorded. As indicated in the table, technicianB received more than "normal" amounts of radiation on severaldifferent units. Other technicians working on these same units,however, did not receive overdoses. Obviously, this is compellingpresumptive evidence of technician B's carelessness.On unit 5, on the other hand, it will be noted that several techni-
cians received radiation dosages ranging from three to five times the"normal" amount, some of them repeatedly. This is equally con-vincing evidence of the inadequacy of protective measures employedon this particular unit. At the very least, it is evident that personnelprotection on this unit was inferior to that of other units, so that in-vestigation was distinctly warranted.
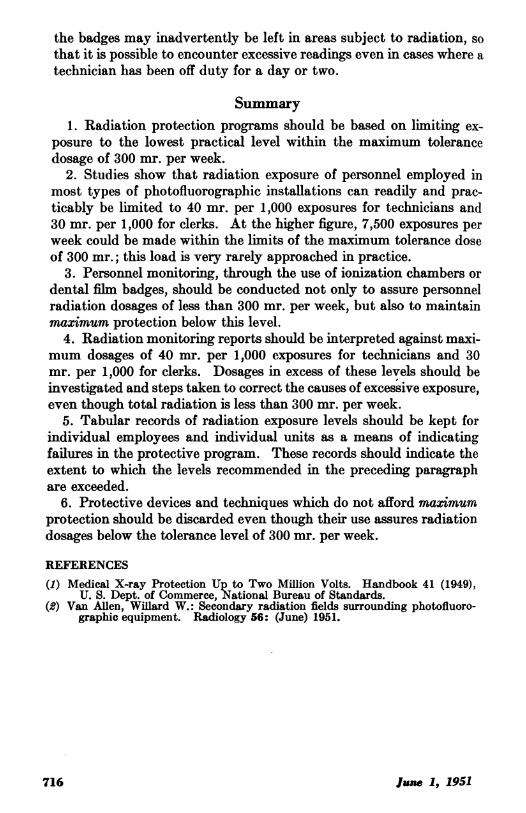
Table 2 presents overdose factors recorded for individuals assignedto a given unit each week. Here again, only dosages which exceed the714 lune 1, 1951
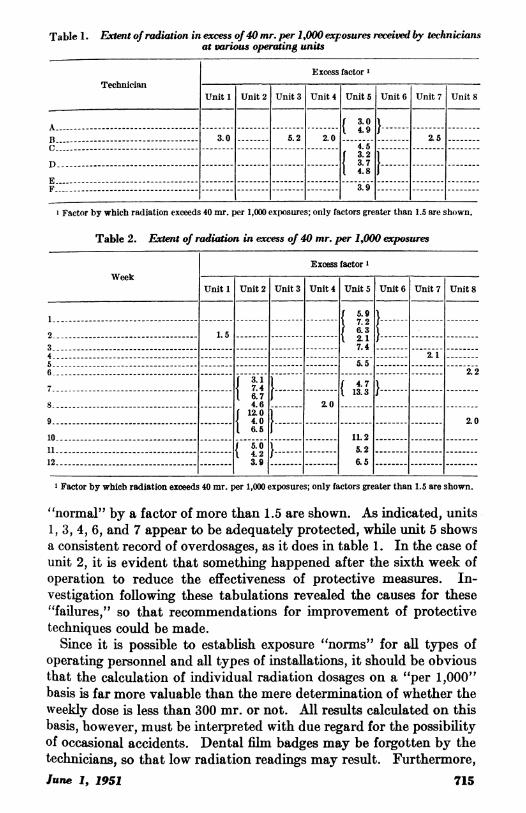
Table 1. Extent of radiation in excess of40 mr. per 1,000 exposures eivedb techniciansat various operating units
Excess factorTechnician
Unit 1 Unit 2 Unit 3 Unit 4 Unit 5 Unit 6 Unit 7 Unit 8
AC- 4.95B 3.0 5.2 2.0 5
D-{3.9}E-~~~~~~~~~~~~~~~~~~~~~~~~~~~~~~~~~~~~~~~~~~~~~~~~~~~~~~~~~~
1 Factor by which radliation exceeds 40 mr. per 1,000 exposures; only factors greater than 1.5 are shown.
Table 2. Extent of radiation in excess of 40 mr. per 1,000 exposures
Excess factor IWeek
Unit 1 Unit 2 Unit 3 Unit 4 Unit 5 Unit 6 Unit 7 Unit 8
1-{ -7-22 1.5 - - 74
4 -----.- 2.1i6 - ---2.2------- -------- l ----
8 -- 4.6 - 2.109 - 4.0 --- 2.0
10 ---- 11.2
41-{2}-5.212- 3.9 -- 6.5
1 Factor by which radiation exceeds 40 mr. per 1,000 exposures; only factors greater than 1.5 are shown.
"normal" by a factor of more than 1.5 are shown. As indicated, units1, 3, 4, 6, and 7 appear to be adequately protected, while unit 5 showsa consistent record of overdosages, as it does in table 1. In the case ofunit 2, it is evident that something happened after the sixth week ofoperation to reduce the effectiveness of protective measures. In-vestigation following these tabulations revealed the causes for these"failures," so that recommendations for improvement of protectivetechniques could be made.Since it is possible to establish exposure "norms" for all types of
operating personnel and all types of installations, it should be obviousthat the calculation of individual radiation dosages on a "per 1,000"basis is far more valuable than the mere determination of whether theweekly dose is less than 300 mr. or not. All results calculated on thisbasis, however, must be interpreted with due regard for the possibilityof occasional accidents. Dental film badges may be forgotten by thetechnicians, so that low radiation readings may result. Furthermore,fune 1, 1951 715
the badges may inadvertently be left in areas subject to radiation, sothat it is possible to encounter excessive readings even in cases where atechnician has been off duty for a day or two.
Summary1. Radiation protection programs should be based on limiting ex-
posure to the lowest practical level within the maximum tolerancedosage of 300 mr. per week.
2. Studies show that radiation exposure of personnel employed inmost types of photofluorographic installations can readily and prac-ticably be limited to 40 mr. per 1,000 exposures for technicians and30 mr. per 1,000 for clerks. At the higher figure, 7,500 exposures perweek could be made within the limits of the maximum tolerance doseof 300 mr.; this load is very rarely approached in practice.
3. Personnel monitoring, through the use of ionization chambers ordental film badges, should be conducted not only to assure personnelradiation dosages of less than 300 mr. per week, but also to maintainmaximum protection below this level.
4. Radiation monitoring reports should be interpreted against maxi-mum dosages of 40 mr. per 1,000 exposures for technicians and 30mr. per 1,000 for clerks. Dosages in excess of these levels should beinvestigated and steps taken to correct the causes of excessive exposure,even though total radiation is less than 300 mr. per week.
5. Tabular records of radiation exposure levels should be kept forindividual employees and individual units as a means of indicatingfailures in the protective program. These records should indicate theextent to which the levels recommended in the preceding paragraphare exceeded.
6. Protective devices and techniques which do not afford Maximumprotection should be discarded even thouigh their use assures radiationdosages below the tolerance level of 300 mr. per week.
REFERENCES(1) Medical X-ray Protection Up to Two Million Volts. Handbook 41 (1949),
U. S. Dept. of Commerce, National Bureau of Standards.(2) Van Allen, Willard W.: Secondary radiation fields surrounding photofluoro-
graphic equipment. Radiology 56: (June) 1951.
716 June 1, 1951
I Incidence of DiseaseNo health department, State or local, can effectively prevent or control disease without
knowledge of when, where, and under what conditions cases are occurring
UNITED STATES,Reports From States for Week Ended May 12, 1951
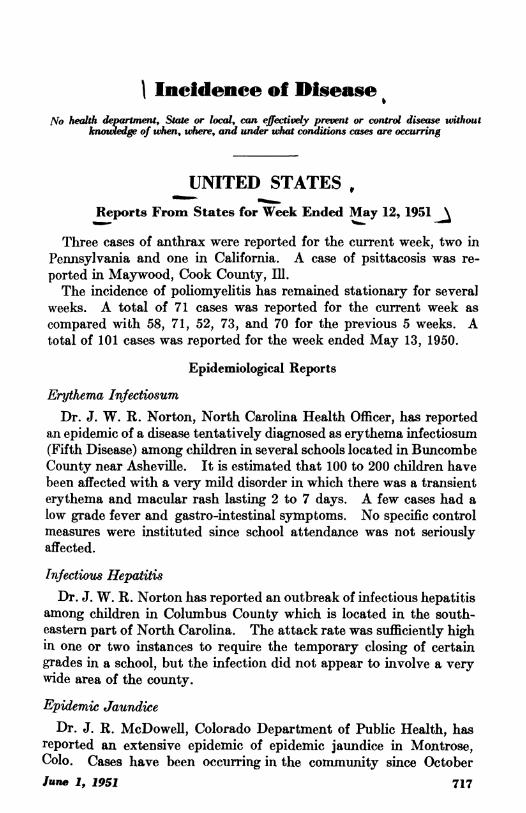
Three cases of anthrax were reported for the current week, two inPennsylvania and one in California. A case of psittacosis was re-ported in Maywood, Cook County, Ill.The incidence of poliomyelitis has remained stationary for several
weeks. A total of 71 cases was reported for the current week ascompared with 58, 71, 52, 73, and 70 for the previous 5 weeks. Atotal of 101 cases was reported for the week ended May 13, 1950.
Epidemiological Reports
Erythema InfectiosumDr. J. W. R. Norton, North Carolina Health Officer, has reported
an epidemic of a disease tentatively diagnosed as erythema infectiosum(Fifth Disease) among children in several schools located in BuncombeCounty near Asheville. It is estimated that 100 to 200 children havebeen affected with a very mild disorder in which there was a transienterythema and macular rash lasting 2 to 7 days. A few cases had alow grade fever and gastro-intestinal symnptoms. No specific controlmeasures were instituted since school attendance was not seriouslyaffected.
Infectious HepatitisDr. J. W. R. Norton has reported an outbreak of infectious hepatitis
among children in Columbus County which is located in the south-eastern part of North Carolina. The attack rate was sufficiently highin one or two instances to require the temporary closing of certaingrades in a school, but the infection did not appear to involve a verywide area of the county.
Epidemic JaundiceDr. J. R. McDowell, Colorado Department of Public Health, has
reported an extensive epidemic of epidemic jaundice in Montrose,Colo. Cases have been occurring in the community since OctoberJune 1, 1951 717
1950. The illness has been characterized by fever (1020 to 1040),abdominal pain, and jaundice. Some of the clinical as well as epi-demiological findings suggest the possibility of leptospirosis. Onegroup of multiple cases in a family was reported to have followed thedeath of a dog that had jaundice.
TularemiaDr. R. M. Albrecht, New York State Department of Health, has
reported three cases of tularemia in Cayuga County. In the investi-gation conducted by Dr. Walter Levy, it was found that two caseswere in a man and his wife who were engaged in skinning muskrats.Both had the ulceroglandular type of infection. The third case wasin a muskrat trapper in an adjoining area. Three previous cases inpersons trapping and skinning muskrats were reported from nearbyWayne County in 1942 and two in Oswego County in 1930.
AnthraxDr. W. L. Halverson, California Director of Public Health, has
reported a fatal case of anthrax in an 1 -year-old boy who left MissouriApril 25 by automobile with his parents to visit in California. Thefirst night of the trip was spent in Oklahoma at which time the boywas scratched or bitten on the hip by an insect. It was not brought
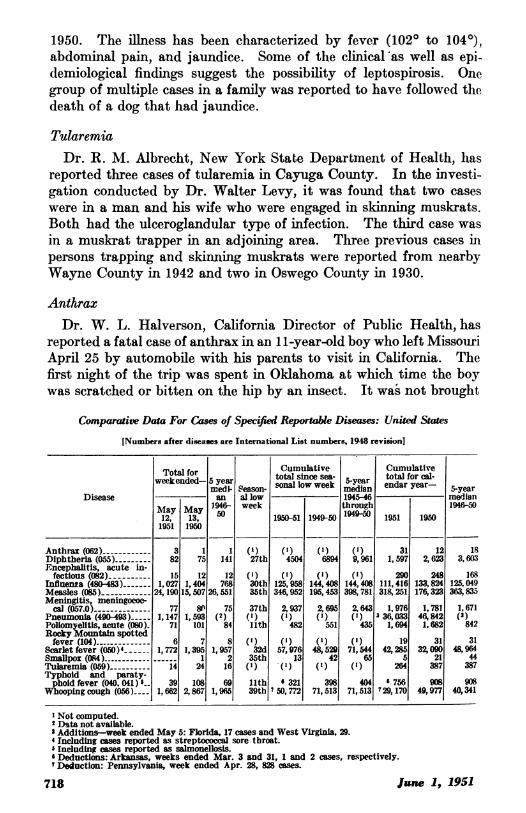
Comparative Data For Cases of Specified Reportable Diseases: United States
[Numbers after diseases are International List numbers, 1948 revision]
Total for Cumulative Cumulativeweekended- 5 year sonal lowsweek 5-year total for cal-
medi- 8eason- soa o ekmedian endar year- 5-yearDisease an al low 194546 median
May May 1946- week through 1946-501a2 a3y 50 1950-51 1949-50 1949-50 1951 19501951 1950
Anthrax (062) -3 1 1 (1) (1) (1) (1) 31 12 18Diphtheria (055)-82 75 141 27th 4504 6894 9,961 1,597 2,623 3,603Encephalitis, acute in-
fectious (082)- 15 12 12 (1) (1) () 290 248 168Influenza (480-483)- 1,027 1,404 768 30th 125,958 144,408 144,408 111,416 133,824 125,049Measles (085)- 24, 190 15,507 26,551 35th 346,952 195,453 398,781 318,251 176,323 363,835Meningitis, meningococ-
cal (057.0) -77 81 75 37th 2, 937 2 695 2, 643 1,976 1,781 1,671Pneumonia (490-493)- 1,147 1,593 (2) (1) (1) (1) (1) 336,033 46,842 (X)Pollomyelltis, acute (080). 71 101 84 11th 482 551 435 1,694 1,682 842Rocky Mountain spottedfever (104) -6 7 8 (1) (1) (1) (1) 19 31 31
Scarlet fever (050) 4 1,772 1,395 1,957 32d 57,976 48,529 71,544 42,285 32,090 48,964Smallpox (084) --1 2 35th 13 42 65 5 21 44Tularemia (059) -14 24 16 (1) (1) (X) (X) 264 387 387Typhoid and paraty-phoid fever (040, 041) s_ 39 108 69 11th 6 321 398 404 6 756 908 908
Whooping cough (056)---- 1,662 2,867 1,965 39th 7 50,772 71,513 71,513 729, 170 49,977 40,341
'Not computed.2 Data not available.a Additions-week ended May 5: Florida, 17 cases and West Virginia, 29.4 Including cases reported as streptococcal sore throat.' Including cases reported as salmonellosis.' Deductions: Arkansas, weeks ended Mar. 3 and 31, 1 and 2 cases, respectively.' Deduction: Pennsylvania, week ended Apr. 28, 828 cases.
717Jn11815June .1, 1951718

to the attention of the parents until 4 days later when they arrivedin California. A large ulcerated area on the thigh and meningitiswere noted when he was hospitalized on May 2. He died May 3.Anthrax bacilli were cultured from spinal fluid and confirmed byanimal inoculation.
Rabies in AnimalsDr. A. L. Gray, Mississippi Board of Health, has reported an out-
break of rabies in wild foxes, cattle, and dogs in the northern part ofSmith County and the southern part of Scott County, which areadjoining areas. The outbreak apparently started in wild foxes ofwhich 12 have died or have been killed and were suspected of havingrabies. One fox head was confirmed by laboratory examination.Eighteen cattle and two dogs have died of rabies. Another smalloutbreak has occurred in the city of Natchez in Adams County,consisting of four rabid dogs.
Dr. E. A. Belden, Missouri Division of Health, has reported thatthe rapid rise in the number of cases of rabies in animals in recentweeks has been due to the existence of a rabies epidemic in the cityand county of St. Louis, and also to accumulated reports which hadnot previously been made.In Iowa, Minnesota, Nebraska, North Dakota, and South Dakota,
rabies in skunks, or civet cats, is a current problem.
lune 1, 1951 719

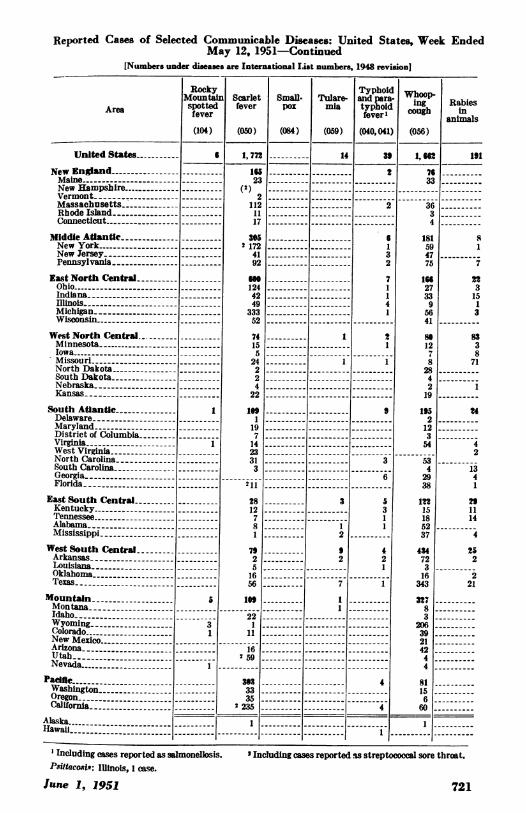
Reported Cases of Selected Communicable Diseases: United States, Week EndedMay 12, 1951
[Numbers under diseases are International List numbers, 1948 revision]
Area
United States
New EnglandMaine-New Hampshire-VermontMassachusettsRhode IslandConnecticut
Mlddle Atlantlc.New YorkNew JerseyPennsylvania-
East North CentralOhio ------------------IndianaIllinoisMichiganWisconsin-
West North CentralMinnesota-IowaMissouriNorth Dakota-South Dakota .Nebraska _Kansas
South AtfanticDelawareMaryland-District of ColumbiaVirginia-------West Virginia-North Carolina-South CarolinaGeorgiaFlorida --------------
East South CentralKentuckyTennesseeAlabamaMississippi-
West South Central-ArkansasLouisianaOklahomaTexas-
MountainMontanaIdahoWyoming
Colorado
New MexicoArizonaUtahNevada
PadcieWashingtonOregonCalifornia
Diph- Infits- Pneu-~~~~~~~~~~~~~~~~~~~~~~~~~~~~~~~~~~
Diph-tberia
(055)
82
21
61
14
12
47
1
2
Encepha-litis, in-fectious
(082)
iS
4
6
1
23
1.;
Influ-enza
(480-483)
1,@27
9
8
111 56
27
5n.1
422
139
24
594
2
51211
10
37
13
11
8
26
Alaska ------------------Hawaii
397
33
317
4232
4
3 45
1
9293236
453
158
17
152
124
6
1614
Measles
(085)
24,190
&16
47976
4595
240
4, W11, 733
7041,624
4,089685255630655
1,864
1,4W104290221642841
652
1, 8S17
2216375616817247
226186
74631611528134
4,04333350
4773,183
1.48972145308253144510543
5,6701,258585
3,827
22 -------------------4 12
Menin-gitis,menin-
(057.0)
77
5
6
3
2
18
6
7
4
82
3
3
14
4
2
Ii
2
3
5
Pneu-monia
(490-493)
1,147
2972
119
16942.5572
119
11fi246
15
761
139
2442
146
3
27
366
.534124
248
7.1
241528
69
12840
Polio-myelitis
(080)
71
9
8
3
2
3
1--
1--
10
~i
2
2
2
26
6
2
--i----
I
3
10
3
7--
' New York City only. Anthrax: Calfornia, 1 case; Pennsylvanta, 2 cases.
.;
-----3-
720 June 1, 1951
Reported Cases of Selected Communicable Diseases: United States, Week EndedMay 12, 1951-Continued
[Numbers under dieases are International List numbers, 1948 revision]
Rocky Typhoid WopMountain Scarlet Small- Tulare- andpars- Wing RabiesArea ~~spotted fever POX mi typhoid cub iArea fever feverpos mia tfyePsebrOild oou*ll animals
(104) (050) (084) (059) (040,041) (056)
United States
New EnglandMaineNew HampshireVermont .MassachusettsRhode Island ---Connecticut
Middle AtlantleNew YorkNew JerseyPennsylvania-
East North CentralObio .IndianaIllinois-MichiganWisconsin
West North Central.MinnesotaIowaMissouriNortb DakotaSouth DakotaNebraska _Kansas
South AtlantieDelawareMaryland - ----District of ColumbiaVirginiaWest Virginia-North CarolinaSouth CarolinaGeorgia ---------Florida -------
East South Central---Kentucky ------Tennessee -----------Alabama - ----Mississippi ---------
West South Central ----Arkansas ------Louisiana ---------Oklahoma -- --------Texas ----
Mountain -------Montana ----------Idaho
Wyoming ------------Colorado ----------------New Mexico .-------------Arizona ---- ---------UJtab-NevadaNevadaf--------------------Pacific-Washington - ---------Oregon ---------------California ------------------
I
1
.--
.--
.--
1--
1,772
10523
(2)2
1121117
-2 1724192
SW1244249
33352
74155
24224
22
197.
142331-3
28127-8.1.
7'
5-16-56.
221
11
2 59_ _ _ __ _ _
3.33335
2 235
I
3
12
92
1
31
6132
71141
2
1
531I
42
4
1, 657633
36.3
4
181594775
I"s27339
5641
8.1288284219
195212354
534
2938
12215185237
43472316
343
32783
206-39-21-4244
8115660.
191
81
2231513
8338
71
24
2
1341
1114
252
221
Alaska 11Havsiii--------------- ----~~~~~~|~~~~~~ | 1-------------------- ------- --| i -------- -------- -----
' Including cases reported as salmonellosis. I Including cases reported w streptococcal sore throat.Psiltacos: IUinois, 1 case.
June 1, 1951 721
__1b.----
--------
2_ I IIIAI
---------
IrA
---------
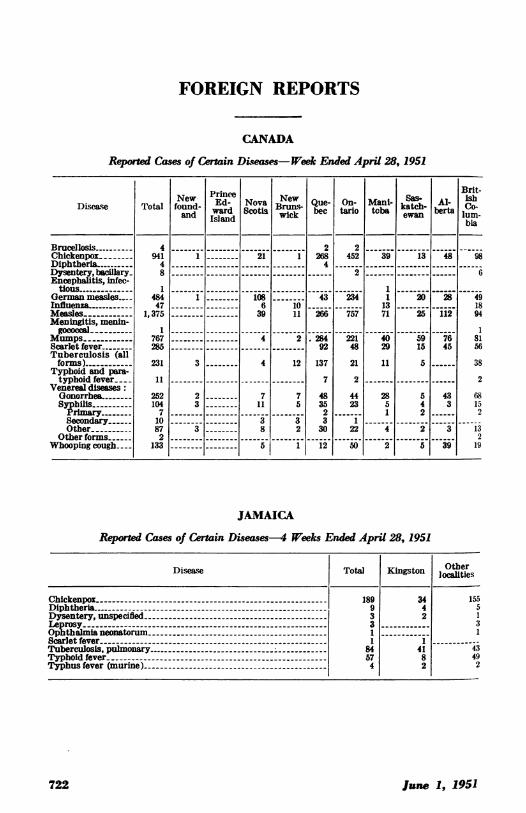
FOREIGN REPORTS
CANADA
Reported Cases of Certain Diseases- Week Ended April 28, 1951
NNe w ewIX sas- ris-Disease Total found- Ed- Nova B UIew Que- On- Mani- katch-Alcoward Scotia ruk beCe tario toba berta
and Island wc ewan luin-bia
Brucellosis 4 ---- 2 2ChickenpoL_ 941 1- 21 1 268 452 39 13 48-98Diphtheria- 4 ----4Dysentery, bacllary 8----- 2 ---- 6Encephalitis, infec-
tious-1 ------1German measles.. 484 1- 108-- 43 234 1 20 28 49Influenza.--------- 47 -- 6 10 --- 13 --- 18Measles- 1,375 -- 39 11 266 757 71 25 112 94Meningitis, menin-
o 1 ---------1Mumps------------ 767 -4 2 284 221 40 59 7681Scarlet fever- 285 ---- 92 48 29 15 45 56Tuberculosis (allforms) ------ 231 3 4 12 137 21 115 38
Typhoid and para-typhoid fever-- 11 ---- 7 2 ---- 2
Venereal diseases:Gonorrhea- 252 2 7 7 48 44 28 5 43 68Syphilis - 104 3-------- 11 5 35 23 5 4 3 15Primary----- 7 ------------ - - 2 ---- 1 2 2Secondary 10 -- 3 3 3 1Other- 87 3 8 2 30 22 4 2 3 13
Other forms 2 ---------2Whooping cough...-- 133 -- 5 1 12 50 2 5 39 19
JAMAICA
Reported Cases of Certain Diseases-4 Weeks Ended April 28, 1951
Disease Total Kingston Olter
Chickenpox- 189 34 155Diphtheria - -9 4 5Dysentery, unspecified - -3 2 1Leprosy- 3 3Ophthalmia neonatorum - -1 1Scarlet fever--1 1Tuberculosis, pulmonary -- - 84 41 43Typhoid fever - -57 8 49Typhus fever (murine) - -4 2 2
June 1, 1951722
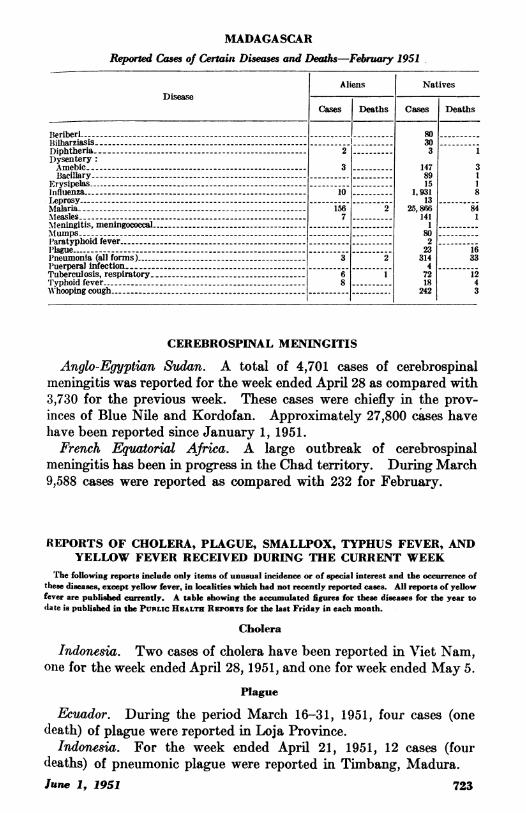
MADAGASCAR
Reported Cases of Certain Diseases and Deaths-February 1951.
Aliens NativesDisease -
Cases Deaths Cases Deaths
Beriberi -80.Bilharziasis - - - 30Diphtheria -2 3 1Dysentery:Amebic- 3 --147 3Bacillary - - - 89 1
Erysipelas - - -15 1influenza -10 -- 1,931 8Leprosy - - -13 --
Malaria -156 2 25,866 84measles- 7 --141 1Mleningitis, meningococcal -1Mlumps ---80Ilaratyphoid fever- - - 2 --
P'lague - - -23 16Pneumonia (all forms) -3 2 314 33Puerperal infection- - - 4 --Tuberculosis, respiratory -6 1 7212Typhoid fever -8 18 4lWhooping cough - - - 242 3
CEREBROSPINAL MENINGITIS
Anglo-Egyptian Sudan. A total of 4,701 cases of cerebrospinalmeningitis was reported for the week ended April 28 as compared with3,730 for the previous week. These cases were chiefly in the prov-inces of Blue Nile and Kordofan. Approximately 27,800 cases havehave been reported since January 1, 1951.French Equatorial Africa. A large outbreak of cerebrospinal
meningitis has been in progress in the Chad territory. During March9,588 cases were reported as compared with 232 for February.
REPORTS OF CHOLERA, PLAGUE, SMALLPOX, TYPHUS FEVER, ANDYELLOW FEVER RECEIVED DURING THE CURRENT WEEK
The following reports include only items of unusual incidence or of special interest and the occurrence ofthese diseases, except yellow fever, in localities which had not recently reported cases. All reports of yellowfever are published currently. A table showing the accumulated figures for these diseases for the year todate is published in the PUBLIc HEALTH REPORTS for the last Friday in each month.
Cholera
Indonesia. Two cases of cholera have been reported in Viet Nam,one for the week ended April 28, 1951, and one for week ended May 5.
Plague
Ecuador. During the period March 16-31, 1951, four cases (onedeath) of plague were reported in Loja Province.
Indonesia. For the week ended April 21, 1951, 12 cases (fourdeaths) of pneumonic plague were reported in Timbang, Madura.
lane 1,.1951 723
Smallpox
Burma. During the week ended May 5, 1951, smallpox wasreported in ports as follows: Akyab, one case; Moulmein, one; andRangoon, seven.
Indochina. During the week ended May 5, 1951, smallpox wasreported in Viet Nam as follows: Haiphong 72 cases, Hanoi 30,and Saigon 1.
Korea. During February, 156 cases (33 deaths) of smallpox werereported compared with 39 (4 deaths) for January.
Typhus Fever
Korea. Typhus fever has been reported in Korea as follows:For February-Pusan, 18 cases and Kunsan, 5; for January-Pusan,4 cases.Jamaica. For the week ended April 28, 1951, two cases of murine
typhus fever were reported in Kingston.
Yellow Fever
Gold Coast. During the week ended April 28, 1951, suspected casesof yellow fever were reported as follows: Aboadzi, Sekondi, andTarkwa, one case each.
Plague in Wild Rodents in Santa Fe County, N. Mex.
Dr. V. B. Link, Western Communicable Disease Center Laboratory,San Francisco, reports that the specimen N. M. 6140-6141, consistingof 8 fleas, MonopsyUus wagneri, from 2 white-footed mice, Peromyscustruei, trapped 14 miles southeast of Santa Fe City limits on U. S.Highway 85 on April 18, 1951, was positive for plague. This is thefirst time that wild rodent plague has been demonstrated in SantaFe County, New Mexico. The only previous indication of plaguein this county was July 1950, when a resident of Glorieta died ofplague. The rodents being reported upon were trapped about 3miles from the residence of the 1950 victim.
724 June 1, 1951