Embed Size (px)
Citation preview

Public Health Assessment
Kalamazoo River/Enbridge Spill: Evaluation of people’s risk for health effects from contact with the submerged oil in the sediment of the Kalamazoo River
Prepared by the
Michigan Department of Community Health
MAY 23, 2012
Prepared under a Cooperative Agreement with the U.S. DEPARTMENT OF HEALTH AND HUMAN SERVICES
Agency for Toxic Substances and Disease Registry Division of Community Health Investigations
Atlanta, Georgia 30333
Final Release

THE ATSDR PUBLIC HEALTH ASSESSMENT: A NOTE OF EXPLANATION
This Public Health Assessment was prepared by ATSDR’s Cooperative Agreement Partner pursuant to the Comprehensive Environmental Response, Compensation, and Liability Act (CERCLA or Superfund) section 104 (i)(6) (42 U.S.C. 9604 (i)(6)), and in accordance with our implementing regulations (42 C.F.R. Part 90). In preparing this document, ATSDR’s Cooperative Agreement Partner has collected relevant health data, environmental data, and community health concerns from the Environmental Protection Agency (EPA), state and local health and environmental agencies, the community, and potentially responsible parties, where appropriate. In addition, this document has previously been provided to EPA and the affected states in an initial release, as required by CERCLA section 104 (i)(6)(H) for their information and review. The revised document was released for a 30-day public comment period. Subsequent to the public comment period, ATSDR’s Cooperative Agreement Partner addressed all public comments and revised or appended the document as appropriate. The public health assessment has now been reissued. This concludes the public health assessment process for this site, unless additional information is obtained by ATSDR’s Cooperative Agreement Partner which, in the agency’s opinion, indicates a need to revise or append the conclusions previously issued. Use of trade names is for identification only and does not constitute endorsement by the U.S. Department of Health and Human Services. Additional copies of this report are available from:
National Technical Information Service, Springfield, Virginia (703) 605-6000
You May Contact ATSDR Toll Free at 1-800-CDC-INFO
or Visit our Home Page at: http://www.atsdr.cdc.gov

Kalamazoo River/Enbridge Spill Final Release
PUBLIC HEALTH ASSESSMENT
Kalamazoo River/Enbridge Spill: Evaluation of people’s risk for health effects from contact with the submerged oil in the sediment of the Kalamazoo River
Prepared by:
Michigan Department of Community Health Under Cooperative Agreement with the
U.S. Department of Health and Human Services Agency for Toxic Substances and Disease Registry


iv
Foreword The Michigan Department of Community Health (MDCH) conducted this evaluation under a cooperative agreement with the federal Agency for Toxic Substances and Disease Registry (ATSDR). ATSDR conducts public health activities (assessments/consultations, advisories, education) at sites of environmental contamination. The purpose of this document is to identify potentially harmful exposures and actions that would minimize those exposures. This is not a regulatory document and does not evaluate or confirm compliance with laws. This is a publicly available document that is provided to the appropriate regulatory agencies for their consideration. The following steps are necessary to conduct public health assessments/consultations:
Evaluating exposure: MDCH toxicologists begin by reviewing available information about environmental conditions at the site: how much contamination is present, where it is found on the site, and how people might be exposed to it. This process requires the measurement of chemicals in air, water, soil, or animals. Usually, MDCH does not collect its own environmental sampling data. We rely on information provided by the Michigan Department of Environmental Quality (MDEQ), U.S. Environmental Protection Agency (EPA), and other government agencies, businesses, and the general public.
Evaluating health effects: If there is evidence that people are being exposed – or could be
exposed – to hazardous substances, MDCH toxicologists then determine whether that exposure could be harmful to human health, using existing scientific information. The report focuses on public health – the health impact on the community as a whole.
Developing recommendations: In its report, MDCH outlines conclusions regarding any
potential health threat posed by a site, and offers recommendations for reducing or eliminating human exposure to contaminants. If there is an immediate health threat, MDCH will issue a public health advisory warning people of the danger, and will work with the appropriate agencies to resolve the problem.
Soliciting community input: The evaluation process is interactive. MDCH solicits and
considers information from various government agencies, parties responsible for the site, and the community. If you have any questions or comments about this report, we encourage you to contact us.
Please write to: Toxicology and Response Section
Division of Environmental Health Michigan Department of Community Health PO Box 30195 Lansing, MI 48909
Or call us at: 1-800-648-6942 (toll free) For more information, please visit: www.michigan.gov/mdch-toxics

v
Acronyms and Abbreviations ADAF Age-Dependent Adjustment Factor AEd Dermal Absorbance AEi Gastrointestinal Absorbance AF Adherence Factor AT Averaging Time ATSDR Agency for Toxic Substances and Disease Registry BW Body Weight CF Conversion Factor cm2 Square centimeters ED Exposure Duration EF Exposure Frequency EPA United States Environmental Protection Agency EV Event Frequency Fi Fraction of area impacted with submerged oil Foil Fraction of petroleum residue that is oil IRS Sediment Ingestion kg Kilograms LT Lifetime MDCH Michigan Department of Community Health MDEQ Michigan Department of Environmental Quality mg Milligrams ND Not detected PAHs Polycyclic Aromatic Hydrocarbons PHA Public Health Assessment RfD Reference Dose SA Skin Surface Area SF Slope Factor VOCs Volatile Organic Chemicals
6
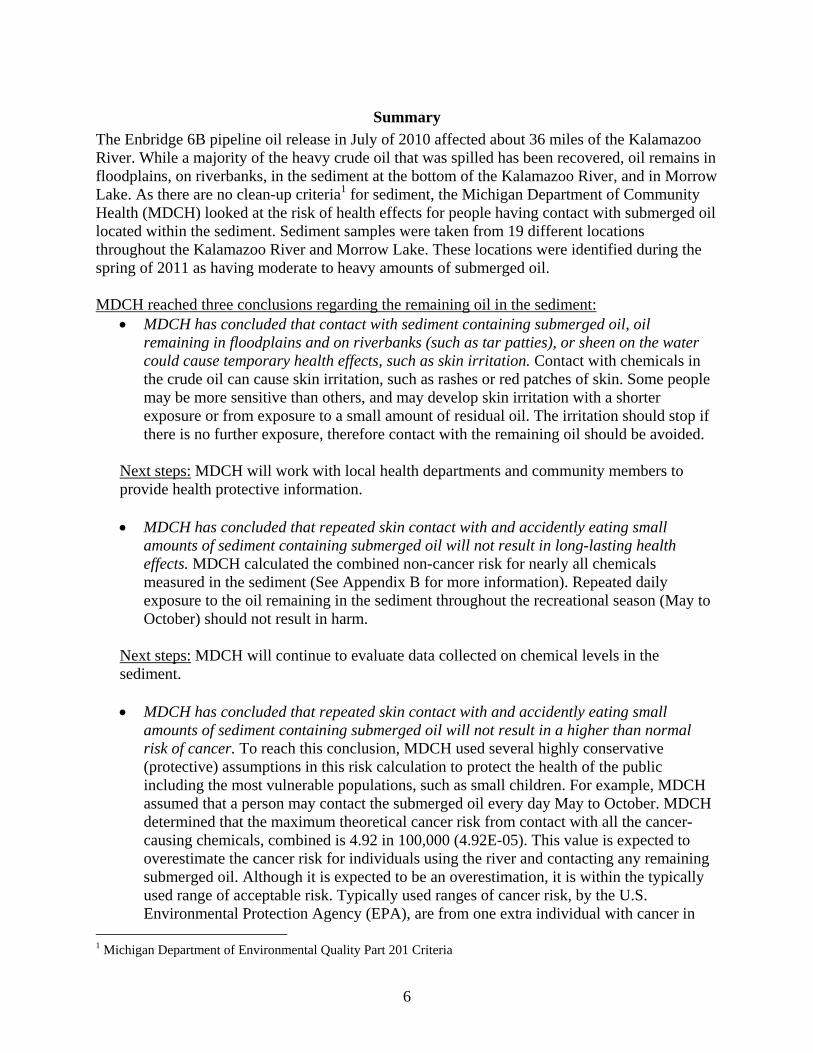
Summary
The Enbridge 6B pipeline oil release in July of 2010 affected about 36 miles of the Kalamazoo River. While a majority of the heavy crude oil that was spilled has been recovered, oil remains in floodplains, on riverbanks, in the sediment at the bottom of the Kalamazoo River, and in Morrow Lake. As there are no clean-up criteria1 for sediment, the Michigan Department of Community Health (MDCH) looked at the risk of health effects for people having contact with submerged oil located within the sediment. Sediment samples were taken from 19 different locations throughout the Kalamazoo River and Morrow Lake. These locations were identified during the spring of 2011 as having moderate to heavy amounts of submerged oil. MDCH reached three conclusions regarding the remaining oil in the sediment:
MDCH has concluded that contact with sediment containing submerged oil, oil remaining in floodplains and on riverbanks (such as tar patties), or sheen on the water could cause temporary health effects, such as skin irritation. Contact with chemicals in the crude oil can cause skin irritation, such as rashes or red patches of skin. Some people may be more sensitive than others, and may develop skin irritation with a shorter exposure or from exposure to a small amount of residual oil. The irritation should stop if there is no further exposure, therefore contact with the remaining oil should be avoided.
Next steps: MDCH will work with local health departments and community members to provide health protective information.
MDCH has concluded that repeated skin contact with and accidently eating small
amounts of sediment containing submerged oil will not result in long-lasting health effects. MDCH calculated the combined non-cancer risk for nearly all chemicals measured in the sediment (See Appendix B for more information). Repeated daily exposure to the oil remaining in the sediment throughout the recreational season (May to October) should not result in harm.
Next steps: MDCH will continue to evaluate data collected on chemical levels in the sediment. MDCH has concluded that repeated skin contact with and accidently eating small
amounts of sediment containing submerged oil will not result in a higher than normal risk of cancer. To reach this conclusion, MDCH used several highly conservative (protective) assumptions in this risk calculation to protect the health of the public including the most vulnerable populations, such as small children. For example, MDCH assumed that a person may contact the submerged oil every day May to October. MDCH determined that the maximum theoretical cancer risk from contact with all the cancer-causing chemicals, combined is 4.92 in 100,000 (4.92E-05). This value is expected to overestimate the cancer risk for individuals using the river and contacting any remaining submerged oil. Although it is expected to be an overestimation, it is within the typically used range of acceptable risk. Typically used ranges of cancer risk, by the U.S. Environmental Protection Agency (EPA), are from one extra individual with cancer in
1 Michigan Department of Environmental Quality Part 201 Criteria

7
10,000 (1E-04) to one extra individual in 1,000,000 (1E-06). (Michigan’s 2007 cancer rate is roughly 50 individuals in 10,000.)
Next steps: MDCH will continue to evaluate data collected on chemical levels in the sediment.
Purpose and Health Issues
The recovery and clean-up of crude oil has been on-going since the 2010 Enbridge Energy Partners, LLP (Enbridge) pipeline release. A majority of the oil that was floating on the surface of the water and on riverbanks has been collected. Some oil still remains in overbank (riverbank and flood plain) areas and submerged in sediment at the bottom of the Kalamazoo River and Morrow Lake. Current oil collection efforts are focused on removing this remaining oil. The U.S. Environmental Protection Agency (EPA) and the Calhoun County Public Health Department have asked that MDCH review the possible health risks for people touching or accidentally eating the remaining oil. A person could accidentally eat the oil if they don’t wash their hands well enough before eating or preparing food, or by not thoroughly cleaning food taken from their gardens2. MDCH calculated the non-cancer and theoretical cancer risk from contact with the submerged oil in the sediment. The results and conclusions in this health assessment are for public health purposes only and do not show compliance with, or satisfy, EPA or Michigan Department of Environmental Quality (MDEQ) regulations or requirements. This evaluation does not include any evaluation of the possible health risks for people who may have touched or otherwise come into direct contact with the oil at the time of the spill or in the days and weeks just after the spill. The Kalamazoo River has remained closed under local authority for all public activities since the time of the oil spill. The results review the theoretical risk to humans only and do not look at the risk to wildlife or provide any ecological assessment. This evaluation does not include any discussion of breathing the chemicals from the residual material, eating fish from the Kalamazoo River, contact with surface water, or using groundwater as drinking water (private residential drinking water wells). These topics will be evaluated in separate health assessments or consultations.
Background
On July 26, 2010, more than 800,000 gallons of crude oil flowed into Talmadge Creek, a tributary of the Kalamazoo River. The oil was from a 30-inch pipeline near the city of Marshall, Calhoun County, Michigan, operated by Enbridge. Enbridge reported the spill to the National Response Center, which notified the EPA, among other agencies. The EPA was the lead agency for response to this spill and on July 27, the Federal On-Scene Coordinator and Incident Commander issued the EPA Removal Order. Using guidelines of the Incident Command System3, a Unified Command was established later that week. Members of the Unified Command included federal, state and local agencies, along with Enbridge
2 Residents who live along the river may irrigate their garden with water from the river. Sediment from the river could end up in their garden. 3 The Incident Command System is a management system for incidents of all sizes and types. This system is used when one agency is responding to an incident and can be scaled up for when many agencies are responding to an incident.

8
Figure 1: Overview of the areas of Talmadge Creek and the Kalamazoo River impacted by the July 2010 oil spill (Calhoun and Kalamazoo Counties, Michigan). Divisions A through E are arbitrary divisions created to assist with the response to the spill. Map
was taken from the EPA’s Response to the Enbridge Oil Spill website (http://www.epa.gov/enbridgespill/images/enbridge_overview_map_20100806.pdf).

9
representatives. At the request of the EPA Incident Commander, MDCH staff deployed to the Command Center to provide public health support. The spilled oil was eventually contained at Morrow Lake, which is more than 30 miles downstream from the spill. (See Figure 1 for a map of the oil spill.) At the time of the spill, Talmadge Creek and the Kalamazoo River were between 25- and 50-year flood levels due to the rain that had fallen during the previous days. Because the river and creek were at high water levels, oil flowed into floodplains, riverbanks (overbank areas), and wetlands. Oil can still be found in the floodplains, riverbanks, and on the bottom of the river. Some of the oil in the floodplains and riverbank areas weathered and became asphalt-like tiles on the soil. These asphalt-like tiles, also called “tar patties,” range from being soft and clay-like to hard, similar to an asphalt parking lot. It is possible that oil may leak out from these tar patties and could get on the skin of people handling them. Oil that remains on the bottom of the river and lake, also called submerged oil, may rise to the surface when the sediment is disturbed. This results in oil sheen and tar balls on the surface of the water. Oil recovery efforts are focusing on removal of the submerged oil and tar patties throughout the impacted areas of the Kalamazoo River and Morrow Lake. The areas with tar patties and submerged oil were identified during the spring 2011 reassessment of the impacted areas. Teams of people walked the floodplains and riverbanks to identify any sheen or remaining oil, such as tar patties. Other teams used a method called poling to search for oil on the bottom of the Kalamazoo River and Morrow Lake. Poling is a method where long poles are used to stir up the sediment on the bottom of the river. Locations where submerged oil remained were identified if oil sheen or tar globules floated to the surface. Areas were identified as having no, light, moderate, or heavy submerged oil amounts. Areas with moderate to heavy submerged oil are areas that have the greatest amounts of remaining oil. Higher levels of oil-related chemicals are located in these areas. Sediment samples were collected from areas identified as having moderate to heavy amounts of submerged oil to provide information on the maximum levels of chemicals present.
Discussion
As no sediment cleanup criteria have been set by the State of Michigan, non-cancer (hazard quotient) and cancer risk calculations were done to assess the potential health effects for people having contact with the submerged oil in the sediment. Non-cancer risk was calculated for chemicals that are not considered cancer-causing (carcinogens) or do not have a cancer toxicity value (slope factor). Non-cancer risk evaluates the potential of other health effects, but not cancer, from exposure to a chemical. This evaluation does not include effects such as skin irritation that could happen after touching the residual oil materials. Theoretical cancer risks were calculated for chemicals that have a cancer toxicity value. Cancer risks are estimates of a population’s risk of developing cancer following exposure to the chemical. Typically used ranges of cancer risk are from one extra individual with cancer in 10,000 (1E-04) to one extra individual in 1,000,000 (1E-06). When we estimate more than one

10
person developing cancer out of 10,000 people exposed, this signals that there may be a problem necessitating further evaluation and possible actions to stop or reduce harmful exposures. (Michigan’s 2007 age-adjusted cancer rate is about one individual in 2004.)
Environmental Contamination
Sediment samples (34 total) from 19 areas with moderate to heavy amounts of submerged oil were collected throughout the Kalamazoo River and the Morrow Lake delta (between mile post 4.50 and 37.25)5. Samples were tested for the following crude oil related chemicals: volatile organic compounds (VOCs), polycyclic aromatic hydrocarbons (PAHs), four metals (beryllium, vanadium, nickel, and molybdenum), and total petroleum hydrocarbons (gasoline range organics, diesel range organics, and oil range organics). Table 1 shows the levels of chemicals measured in those sediment samples. Some chemicals were not detected above their reporting limit6. For example, beryllium was not detected, but it could be present at concentrations below this level. In this case, the maximum level shown in Table 1 is the highest reporting limit (1 milligram per kilogram [mg/kg]) for all of the samples of beryllium. Chemical levels in Table 1 were used in the calculation of non-cancer and cancer risk for people that may have contact with submerged oil in the sediment. If the chemical was detected in a sample, that result was used for the sample. If the chemical was not detected in the sample, half of the reporting limit (the lowest level of the chemical that could be detected in the sample) was used. For example, toluene was not detected in any sample. The maximum (1.5 mg/kg) level for toluene in Table 1 was the reporting limit for an individual sample. Half of that value (0.75 mg/kg) was used in the calculation. The use of half of the reporting limit is recommended when the chemical may be found at the site (EPA 1989). Eight of the chemicals in Table 1 (p-isopropyl toluene, cyclohexane, 1,2,3-trimethylbenzene, m & p-xylene, o-xylene, diesel range organics [C10-C20], gasoline range organics [C6-C10], and oil range organics [C20-C34]) were not included in the calculations. Appendix B provides general information about these chemicals. Several of the chemicals did not have toxicity values (necessary information for the calculations) available. Individual calculations for m- & p- and o-xylene were not done because all the xylenes concentrations were added and evaluated together. The diesel range organics (C10-C20), gasoline range organics (C6-C10), and oil range organics (C20-C34) are groups of chemicals. They were not included in the calculations as there are no toxicity values for weathered mixtures of hydrocarbons (Edwards et al. 1997) and chemicals that are indicators of these groups were measured individually.
4 This cancer rate of 1 in 200 (489.1 in 100,000 on the website) was from 2007 data and can be found at http://www.mdch.state.mi.us/pha/osr/Cancer/stateinc.asp?CDxID=IncTrendsTotal. 5 No samples were collected from sediment in Talmadge Creek. Excavation is currently (November 2011) on-going in the impacted areas of the creek and contaminated sediment and the bank of the creek are being removed. 6 The reporting limit is the lowest level of a chemical that can accurately be measured in a sample.

11
Table 1: Chemicals measured in the 34 sediment samples (in milligrams per kilogram [mg/kg]) from the Kalamazoo River (Calhoun and Kalamazoo Counties, Michigan) (AECOM 2011a)
Chemical Maximum levela (mg/kg)
1,2,3-Trimethylbenzeneb 1.5c 1,2,4-Trimethylbenzene 1.5c 1,3,5-Trimethylbenzene 1.5c
2-Methylnaphthalene 0.42c Acenaphthene 0.33c
Acenaphthylene 0.33c Anthracene 0.33c
Benzene 1.5c Benzo(a)anthracene 0.51
Benzo(a)pyrene 0.52 Benzo(b)fluoranthene 0.56 Benzo(g,h,i)perylene 0.33c Benzo(k)fluoranthene 0.37
Beryllium 1c Chrysene 0.46
Cyclohexaneb 1.5c Dibenzo(a,h)anthracene 0.33c
Diesel Range Organics (C10-C20)b 440 Ethylbenzene 1.5c Fluoranthene 0.97
Fluorene 0.33c Gasoline Range Organics (C6-C10)b 10c
Indeno(1,2,3-c,d)pyrene 0.33c Isopropyl benzene 1.5c
m & p-Xyleneb 3c Molybdenum 2.4 Naphthalene 0.33c
Nickel 36 n-Propylbenzene 1.7
Oil Range Organics (C20-C34)b 1,900 o-Xyleneb 1.5c
Phenanthrene 0.48 p-Isopropyl toluene (p-Cymene)b 1.5c
Pyrene 0.78 sec-Butylbenzene 1.5c
Toluene 1.5c Vanadium 42 Xylenes 1.6c
a = The maximum for a chemical may be the reporting limit (the lowest value the instrument could detect for that sample) or the highest amount detected in a sample. b = The chemical was not included in the calculations. c = The chemical was not detected above the reporting limit in any of the samples.

12
Exposure Pathways Analysis
There are five things to consider when deciding if a person may be exposed to a chemical, also known as an exposure pathway: (1) where is the chemical coming from, (2) what in a person’s environment has been contaminated, (3) is there a way a person might come into contact with the chemical, (4) how they might come into contact with the chemical, and (5) who might be exposed to it. An exposure pathway is complete if it is expected or there is proof that all five elements are present. Table 2 describes human exposure to chemicals in the Kalamazoo River and Morrow Lake (Calhoun and Kalamazoo Counties), from recreational use of the river. The breathing in of chemicals from the remaining oil was not included in this health assessment. People may still smell odors from the remaining oil and that route of exposure (inhalation) will be addressed in a separate health assessment. Eating fish from the Kalamazoo River, contact with surface water, and using groundwater as drinking water (private residential drinking water wells)will also be addressed in a separate documents.
Table 2: Exposure pathway for residents of and visitors to the areas of the Kalamazoo River and Morrow Lake (Calhoun and Kalamazoo Counties), Michigan, impacted by the July 2010
Enbridge pipeline release of heavy crude oil.
Source Environmental
Medium Exposure Point
Exposure Route
Exposed Population
Time Frame
Exposure
Enbridge pipeline
release of heavy crude
oil
Submerged oil in the sediment
Sediment under water or on
banks or flood plains
Ingestion, dermal
contact, and inhalation
Residents along and Visitors to the Kalamazoo River and Morrow Lake
Past Present Future
Eliminated Potential Potential
Oil in the soil (weathered or free product)
Soil with residual oil, such as “tar
patties” or any remaining oil
Dermal contact,
incidental ingestion, and
inhalation
Residents along and Visitors to the Kalamazoo River and Morrow Lake
Past Present Future
Eliminated Potential Potential
Submerged oil in the sediment
Oil sheen and tar balls in
surface water
Dermal contact,
incidental ingestion, and
inhalation
Residents along and Visitors to the Kalamazoo River and Morrow Lake
Past Present Future
Eliminated Potential Potential
If a person were to wade through areas with submerged oil, such as the Morrow Lake delta, oil sheen or tar balls may occur around that person from suspension of the submerged oil. In some cases, clothing or jewelry could keep oil in contact with the skin. This could increase a person’s exposure to the chemicals in the remaining oil.
Exposure scenario
MDEQ and MDCH toxicologists looked at ways people use the river and the lake. People who use the river and lake the most would be expected to come into contact with the oil most often. This scenario considers people who live along the Kalamazoo River and Morrow Lake and may use the river or lake a lot. People who live along the river or lake may have sediment in their yards from recreational river activities or flooding. They could also touch or accidentally eat the dirt daily throughout the spring and summer seasons. They may also go canoeing, kayaking, or do other recreational activities along and in the river and lake.

13
The exposure scenario used in this health assessment represented season-long daily use of the Kalamazoo River by people that live along the river. The values were selected to represent the greatest amount of exposure that residents along the river might have. Individuals that use the river less often would have a lower exposure and lower risk than the people who live on the bank or shores and use the river or lake daily. The exposure scenario includes:
the number of days people are using the Kalamazoo River (150 days were selected as representing May through October, which are the most likely months that people would have contact with the sediment),
the amount of submerged oil that is present in the impacted area of the Kalamazoo River sediment (the quarter mile of the Morrow Lake delta with the heaviest submerged oil was used to represent the entire river),
the number of years an individual may be exposed to the chemicals in the sediment (the number of years within the age range were included),
the entire amount of sediment or soil material (sediment on the banks or in a person’s yard) that a person may accidentally eat in a day, and
the amount of sediment or soil material (sediment on the banks or in a person’s yard) that a person may have stuck to his or her skin after touching it (values for children playing in wet soil or adults gardening were used).
Toxicological Evaluation
Non-cancer and cancer risk was calculated using the chemical levels from the sediment samples.
Non-cancer risk (hazard quotients)
Non-cancer risk (hazard quotient) was calculated for twenty-two chemicals. A hazard quotient is the amount of a chemical a person is exposed to, divided by the amount of the chemical that is not expected to cause health effects (non-cancer toxicity values). Examples of non-cancer toxicity values are minimal risk levels or reference doses. These values are amounts of chemical that are not expected to cause health effects for anyone, even if they are exposed to that chemical daily for a lifetime.
If the non-cancer risk is less than 1.0, a person is exposed to less than the non-cancer toxicity value. No further evaluation of this exposure is needed.
If the non-cancer risk is 1.0, a person is exposed to the non-cancer toxicity value. No further evaluation of this exposure is needed.
If the non-cancer risk is greater than 1.0, a person is exposed to more than the non-cancer toxicity value. This does not automatically mean that people will have health effects, but that the exposure should be reviewed further as exposure to a larger amount of chemical is occurring.
The equation to calculate non-cancer risk includes both touching and accidently eating the oil. The assumption is that people are repeatedly doing these activities. The equations and variables used for these calculations are shown in Appendix A. Table 3 shows the non-cancer risk for children, ages 1-6. Children were selected as the most sensitive group for exposure to these chemicals. Children are more sensitive to chemicals due to

14
their greater exposures (based on both size and activities) and the fact that their bodies are still developing. The maximum hazard quotients for each chemical are approximately 50 or more times less than 1.0. Even if the hazard quotient for each chemical in a sample is added up, the maximum value is more than 25 times lower than 1.07. This shows that small children are not expected to get sick from the chemicals in the oil at these levels.
Table 3: Non-cancer risk for a child, ages 1-6, with frequent exposure to chemicals in the sediment in the Kalamazoo River (Calhoun and Kalamazoo Counties, Michigan).
Chemical Maximum Hazard Quotient 1,2,4-Trimethylbenzene 0.00006 1,3,5-Trimethylbenzene 0.0008
2-Methylnaphthalene 0.00005a Acenaphthene 0.00003
Acenaphthylene 0.0002 Anthracene 0.000006
Benzo(g,h,i)perylene 0.0003 Beryllium 0.0005
Ethylbenzene 0.00008 Fluoranthene 0.0003
Fluorene 0.00004 Isopropyl benzene 0.00007
Molybdenum 0.001 Naphthalene 0.00009
Nickel 0.01 n-Propylbenzene 0.002
Phenanthrene 0.0007 Pyrene 0.0003
sec-Butylbenzene 0.0007 Toluene 0.0001
Vanadium 0.02 Xylenes 0.00004
Hazard Index (all chemicals in a sample)b
0.04
a = Using the reference dose of 0.004 milligrams/kilogram-day, the risk would be 0.0005. This would not change the Hazard Index. b = This value assumes that all of the chemicals cause the same health effects (have the same toxicity endpoint), which is not necessarily the case.
7 Adding the hazard quotients (non-cancer risk) for all chemicals in a sample assumes that all chemicals cause the same health effects. This is not necessarily the case. These summaries are provided to give a conservative presentation of exposure to all of the non-carcinogenic chemicals measured in the sample.

15
Cancer risk for benzene
The theoretical cancer risk was calculated for benzene8. The equation and specific variables used in the calculations are shown in Appendix A. Cancer risk values represent the theoretical number of people that may develop cancer from exposure to these chemicals. A higher than normal risk of cancer is a theoretical cancer risk greater than the typically used range of one individual in 10,000 to one individual in 1,000,000. MDCH used many protective assumptions in the risk evaluation. These include the exposure scenario, which assumes that adults and children who use the river daily from May to October also have a residential yard along the river where they also are exposed to sediment. Also to be protective, it was assumed that 38% of the river has the maximum level of the chemicals, which is an overestimate of the levels of chemicals present. The cancer risk equations include exposure from both touching and accidentally eating the oil. Additionally, the maximum amount of sediment that people might touch or accidently eat were used. Table 3 presents the cancer risk for adults and children, ages 1-6, exposed to benzene from the submerged oil. As this calculation was for cancer risk, adults were included in the calculation. Children, ages 1-6, were included as the most sensitive age range expected to potentially have contact with the submerged oil. The theoretical cancer risk for exposure to benzene was found to be much less than the upper range of acceptable risk (1 in 1,000,000). See Table 4.
Table 4: Theoretical cancer risk from benzene for adults and children, ages 1-6, with frequent exposure to chemicals in the sediment in the Kalamazoo River (Calhoun and Kalamazoo
Counties, Michigan).
Benzene Maximum Theoretical Cancer
Risk
Adult cancer risk 8.6 in 1,000,000,000
(8.6E-09)
Child (ages 1-6) cancer risk 3.4 in 100,000,000
(3.4E-08)
Total cancer risk a 4.3 in 100,000,000
(4.3E-08) a = The adult and child cancer risk are added together.
Cancer risk for Polycyclic Aromatic Hydrocarbons (PAHs)
The theoretical cancer risk was calculated for seven PAHs. An additional variable is included in the calculations for children ages 0 to 2, 2-6, and 6-16. The exposure scenario included the protective assumptions described above. The exposure assumptions used for the 0 to 2 year olds are expected to overestimate the cancer risk. For example, children less than 2 years old are not walking into sediment in the river and may not even be outside in the yard daily.
8 The EPA has not yet included benzene on its list of chemicals recommending use of Age-Dependent Adjustment Factors for cancer risk calculations (as of July 29, 2011). See http://www.epa.gov/oswer/riskassessment/sghandbook/chemicals.htm for the list.

16
The equation and specific variables used in the calculations are in Appendix A. Table 5 presents the theoretical cancer risk for adults and three child age groups (0-2, 2-6, and 6-16) from exposure to PAHs. The cancer risks for these four groups were added together for each chemical in a sample. These cancer risks are expected to be overestimations as the maximum values for each chemical were used whether or not the levels were from the same samples. Maximum cancer risks for each chemical were lower than one case of cancer in a population of 10,000 (1E-04) similarly exposed. These chemicals are considered to act the same in the body. Because of this, the cancer risk for each of the chemicals in a sample can be added together. The maximum total cancer risk (the maximum for each chemical added together) was lower than one individual with cancer in 10,000 (1E-04). (Without the 0-2 year old children’s theoretical cancer risk included, the total theoretical cancer risk is 1.7 in 100,000 [1.7E-05]).
Table 5: Theoretical cancer risk for Polycyclic Aromatic Hydrocarbons (PAHs) calculated for adults and children, ages 0-2, 2-6, and 6-16, with frequent exposure to chemicals in the sediment
in the Kalamazoo River (Calhoun and Kalamazoo Counties, Michigan).
Chemical Maximum Theoretical Cancer Risk Benzo(a)anthracenea 3.09 in 1,000,000 (3.09E-06)
Benzo(a)pyrenea 3.15 in 100,000 (3.15E-05) Benzo(b)fluoranthenea 3.29 in 1,000,000 (3.39E-06) Benzo(k)fluoranthenea 2.24 in 10,000,000 (2.24E-07)
Chrysenea 2.78 in 100,000,000 (2.78E-08) Dibenzo(a,h)anthracenea 1.0 in 100,000 (1.0E-05) Indeno(1,2,3-c,d)pyrenea 1.0 in 1,000,000 (1.0E-06)
Total cancer risk b 4.92 in 100,000 (4.92E-05) a = Calculated cancer risks for adults and the three child age groups were added together for each chemical. b = This value represents the risk from all of these chemicals.
The levels of many of the PAHs included in Table 5 are similar to those found in inland lakes scattered throughout the Michigan’s lower peninsula (Kannan et al. 2005). The authors linked the PAH levels with the amount of people living around the lake (the watershed). The more people that were living in the watershed the higher the levels of PAHs present. People are not expected to have a higher than normal risk of cancer from contact with sediment containing submerged oil. However, touching the submerged oil, tar patties, and oil sheen may cause skin irritation. Contact with the remaining oil should be avoided when possible.
Children’s Health Considerations
Children may be at greater risk than adults when exposed to certain hazardous substances. Children play outdoors and are more likely to put their hands in their mouths or touch their faces. Doing so increases their chance of exposure. A child’s lower body weight and higher intake rate result in a greater dose of hazardous chemicals compared to their weight. If toxic exposure levels

17
are high enough during critical growth stages, the developing body systems of children may be damaged. The remaining oil might be of interest to children. The tar patties are like tiles on the soil and some are pliable and clay-like. If children play with the patties, skin irritation could occur. Oil sheen on the water is shiny and could be rainbow-colored. This sheen may also be of interest to children and may also result in skin irritation. Children should not touch the remaining oil.
Conclusions
MDCH has concluded that contact with sediment containing submerged oil, oil remaining in floodplains and on riverbanks (such as tar patties), or sheen on the water could cause temporary health effects, such as skin irritation. Contact with chemicals in the crude oil can cause skin irritation, such as rashes or red patches of skin. Some people may be more sensitive than others, and may develop skin irritation with a shorter exposure or from exposure to a small amount of residual oil. The irritation should stop if there is no further exposure, therefore contact with the remaining oil should be avoided.
MDCH has concluded that repeated skin contact with and accidently eating small
amounts of sediment containing submerged oil will not result in long-lasting health effects. MDCH calculated the combined non-cancer risk for nearly all chemicals measured in the sediment (See Appendix B for more information). Repeated daily exposure to the oil remaining in the sediment throughout the recreational season (May to October) should not result in harm.
MDCH has concluded that repeated skin contact with and accidently eating small
amounts of sediment containing submerged oil will not result in a higher than normal risk of cancer. To reach this conclusion, MDCH used several highly conservative (protective) assumptions in this risk calculation to protect the health of the public including the most vulnerable populations, such as small children. For example, MDCH assumed that a person may contact the submerged oil every day May to October. MDCH determined that the maximum theoretical cancer risk from contact with all the cancer-causing chemicals, combined is 4.92 in 100,000 (4.92E-05). This value is expected to overestimate the cancer risk for individuals using the river and contacting any remaining submerged oil. Although it is expected to be an overestimation, it is within the typically used range of acceptable risk. Typically used ranges of cancer risk, by the U.S. Environmental Protection Agency (EPA), are from one extra individual with cancer in 10,000 (1E-04) to one extra individual in 1,000,000 (1E-06). (Michigan’s 2007 cancer rate is roughly 50 individuals in 10,000.)
Recommendations
People should avoid contact with residual oil from the July 2010 Enbridge pipeline release. If people get oil on their skin, they should wash with soap and water. There is no need to use strong or harsh soaps or detergents.

18
Public Health Action Plan
MDCH will work with local health departments and community members to provide information on ways to avoid or reduce exposure and is in the process of evaluating other ways people may be exposed to the chemicals in the remaining crude oil.
This PHA was released for Public Comment from August 11, 2011 to October 18, 2011. Comments received were compiled and addressed in Appendix C.

19
Report Preparation
This Public Health Assessment for the Kalamazoo River/Enbridge Spill Site was prepared by the Michigan Department of Community Health under a cooperative agreement with the federal Agency for Toxic Substances and Disease Registry (ATSDR). It is in accordance with the approved agency methods, policies, procedures existing at the date of publication. Editorial review was completed by the cooperative agreement partner. ATSDR has reviewed this document and concurs with its findings based on the information presented.
Michigan Department of Community Health Division of Environmental Health
Jennifer Gray, Ph.D. Toxicologist
Toxicology and Response Section
Linda D Dykema, Ph.D. Toxicologist, Principal Investigator Toxicology and Response Section
ATSDR Region 5 Office
Mark Johnson, Ph.D. Office of Regional Operations
ATSDR Division of Health Assessment and Consultation
Trent LeCoultre, MSEH, REHS, Technical Project Officer Cooperative Agreement Program Evaluation Branch
20
References
Agency for Toxic Substances and Disease Registry (ATSDR). 2007. Toxicological profile for Benzene. Atlanta, GA: U.S. Department of Health and Human Services, Public Health Service. AECOM. 2011a. Enbridge Line 6B MP 608 Marshall, MI Pipeline Release: Report of Findings for Sediment Direct Contact Sampling. AECOM. 2011b. Enbridge Line 6B MP 608 Marshall, MI Pipeline Release: Report of Findings for Residual Oil Sampling. Edwards D, et al. 1997. Development of fraction specific (RFDs) and (RFCs) for total petroleum hydrocarbons. Amherst, Mass.: Amherst Scientific Publishers. Florida Department of Health (FDOH). 2010. Framework for Data Organization, Review, Analysis, and Interpretation for Oil Impacted Gulf Beaches. Michigan Department of Environmental Quality (MDEQ). 2001. Soil Dermal Adherence Factor (AF) and Skin Surface Area (SA) Default Values For Part 201 Soil Direct Contact Criteria Technical Support Document (previously Attachment A of the January 5, 2001 Direct Contact Criteria Technical Support Document). Michigan Department of Environmental Quality (MDEQ). 2005. Remediation and Redevelopment Division Operational Memorandum No. 1, Technical Support Document - Attachment 6. Part 201 Soil Direct Contact Criteria, Part 213 Tier I Soil Direct Contact Risk-Based Screening Levels. http://www.michigan.gov/documents/deq/deq-rrd-OpMemo_1-Attachment6_285488_7.pdf. Michigan Department of Environmental Quality (MDEQ). 2011. Remediation and Redevelopment Division Operational Memorandum No. 1, Attachment 1, Table 4. Toxicological and Chemical-Physical Data Part 201 Generic Cleanup Criteria and Screening Levels; Part 213 Tier 1 Risk-Based Screening Levels (RBSLs). http://www.michigan.gov/documents/deq/deq-rrd-OpMemo_1-Attachment1Table4ChemicalPhysical_283555_7.pdf. Operational Science Advisory Team-2 (OSAT-2). 2011. Annex F: Human Health Considerations. http://www.restorethegulf.gov/sites/default/files/documents/pdf/Annex%20F%20Human%20Health.pdf. U.S. Environmental Protection Agency (EPA). 1989. Risk Assessment Guidance for Superfund Volume I Human Health Evaluation Manual (Part A). Washington, DC: Report No.: EPA/540/1-89/002. http://www.epa.gov/oswer/riskassessment/ragsa/pdf/rags-vol1-pta_complete.pdf. U.S. Environmental Protection Agency (EPA). 2004. Risk Assessment Guidance for Superfund Volume I: Human Health Evaluation Manual (Part E, Supplemental Guidance for Dermal Risk

21
Assessment). Washington, DC: Report No.: EPA/540/R/99/005. http://www.epa.gov/oswer/riskassessment/ragse/index.htm. U.S. Environmental Protection Agency (EPA). 2005. Supplemental Guidance for Assessing Susceptibility from Early-Life Exposure to Carcinogens. Washington, DC: Report No.: EPA/630/R-03/003F. http://www.epa.gov/raf/publications/pdfs/childrens_supplement_final.pdf. U.S. Environmental Protection Agency (EPA). 2008. Child-Specific Exposure Factors Handbook (Final Report) 2008. Washington, DC: Report No.: EPA/600/R-06/096F. http://cfpub.epa.gov/ncea/cfm/recordisplay.cfm?deid=199243.

A-1
Appendix A : Sediment risk assessment calculations
Equations in Annex F: Human Health Considerations (OSAT-2 2011) were used to calculate the non-cancer risk (hazard quotient) and theoretical cancer risk from people in direct contact with and ingesting submerged oil in the sediment (dermal and oral exposure dose). The equations in Annex F were based on the Florida Department of Health’s Human Health-Based Screening Levels for Petroleum Products Impacting Gulf Coastal Waters and Beach Sediments (FDOH 2010). One equation was for the hazard quotient and two equations were for cancer risk. One of the cancer risk equations included Age-Dependent Adjustment Factors (ADAFs) in the calculations. The EPA has a list of 16 chemicals, including PAHs9, for which ADAFs are recommend for inclusion in the cancer risk calculations (EPA 2005). Unrestricted exposure scenario An unrestricted exposure scenario was used for these equations. Exposure parameters represented season-long daily use of the Kalamazoo River by residents that live along the river. The exposure parameters were selected to represent the most conservative exposure (the greatest exposure that is reasonably expected to occur) that residents along the river are expected to have. These exposure parameters include:
the number of days people are using the Kalamazoo River (Exposure Frequency), the amount of submerged oil that is present in the impacted area of the Kalamazoo River
sediment (Fraction of the area impacted), the number of years an individual may be exposed to the chemicals in the sediment, the amount of sediment or soil material that a person may ingest for the day (Sediment
ingestion), and the amount of sediment or soil material that may adhere to a person’s skin (Adherence
factor). Hazard Quotient (Non-Cancer Risk) The hazard quotient is a ratio of the amount of a chemical that a person is exposed to a non-cancer toxicity value (either a minimal risk level [MRL] or reference dose [RfD]). A non-cancer toxicity value is the amount of a chemical people can be exposed to daily that is not expected to cause health effects for a lifetime of exposure (these health effects do not include cancer).
If the hazard quotient is less than 1.0, people’s exposure is less than the non-cancer toxicity value.
If the hazard quotient is equal to 1.0, people’s exposure is the same as the non-cancer toxicity value.
If the hazard quotient is greater than 1.0, people’s exposure is greater than the non-cancer toxicity value.
The hazard quotient was calculated for children, ages 1-6, using Equation 1. Children are more sensitive to chemicals due to their greater exposures (based on both size and activities that may
9 Guidance for these carcinogens can be found at http://www.epa.gov/oswer/riskassessment/sghandbook/chemicals.htm.

A-2
cause them to ingest more or have more soil adhered to their skin) and the fact that their bodies are still developing.
Equation 1: Hazard Quotient (non-cancer risk) - Ingestion and dermal risk equation10
BWEDAT
CFRfD
AEAE
AFSAIRSEDEFFFionConcentrat
HQd
i
ioil
1)]
1([
A hazard quotient was calculated for these chemicals: Metals: Organic chemicals:
Beryllium 2-Methylnaphthalene Pyrene Molybdenum Acenaphthene 1,2,4-Trimethylbenzene Nickel Acenaphthylene 1,3,5-Trimethylbenzene Vanadium Anthracene Ethylbenzene
Benzo(g,h,i)perylene Isopropyl benzene Fluoranthene n-Propylbenzene Fluorene sec-Butylbenzene Naphthalene Toluene Phenanthrene Xylenes
The variables used in Equation 1 are presented in Table A-1 and described below. These variables are either an exposure parameters or are chemical-specific values necessary to evaluate the chemical in the sample.
10 For the result to be unitless, skin surface area (SA) units need to cm2/event and a variable for 1 event/day need to be included.

A-3
Table A-1: Variables for calculation of the Hazard Quotient for children, ages 1-6, and an unrestricted exposure scenario.
Variable Unit for the variable Value for the variablea
Concentration milligram per kilogram
(mg/kg) Sample and chemical-
specific Fraction of petroleum residue
that is oil (Foil) Unitless 1
Fraction of area impacted with submerged oil (Fi)
Unitless 0.38
Exposure Frequency (EF) days/year 150 Exposure Duration (ED) -
child years 6
Sediment Ingestion (IRS) - child
milligram per day (mg/day)
200
Skin surface area (SA) - child square centimeters (cm2) 2,670
Adherence Factor (AF) - child milligram per square centimeter (mg/cm2)
2.98
Gastrointestinal absorbance (AEi)
Unitless chemical-specific
Dermal absorbance (AEd) Unitless chemical-specific Minimal Risk Level or Reference dose (RfD)
milligram per kilogram-day (mg/kg-day)
chemical-specific
Conversion factor (CF) kilogram per milligram
(kg/mg) 1/1,000,000
Averaging Time (AT) days/year 365 Body weight (BW) - child kilograms (kg) 15
a = See the text description below for descriptions and sources of the variables.
Variable descriptions are below: Concentration refers to the levels of the chemicals measured in each of the sediment
samples. Concentration of each chemical is specific to the sample. If a chemical was detected above the reporting limit, that value was used in the calculations. If a chemical was not detected above the reporting limit, one-half of the reporting limit for that sample was used for the calculations.
The fraction of the petroleum residue that is oil (Foil) was used in the Gulf of Mexico oil spill to compensate for having analytical data on the oil and not the levels of chemicals present in the material on the beaches (OSAT-2 2011). Chemical levels were measured in sediment samples from the Kalamazoo River so the value was set at 1, indicating that 100% of the chemical was present in the sediment sample.
The fraction of the area impacted with submerged oil (Fi) is the amount of the river with submerged oil. This value was 0.38, indicating that 38% of the river bottom had submerged oil. The 0.38 represents a quarter mile stretch in the Morrow Lake delta with the heaviest submerged oil footprint. Use of this value in the calculations provides the most conservative amount of oil that people may encounter (a worst-case scenario for exposure).
The exposure frequency (EF) is the number of days per year a person is exposed to the chemicals in the sediment. To use the most conservative exposure scenario, 150 days were selected. This represents a daily exposure from May to October (spring to fall).

A-4
The exposure duration (ED) is the number of years that residents may encounter these chemicals. To present the most conservative exposure scenario, all of the years within an age range were included.
Sediment ingestion (IRS) refers to the amount of sediment that could be swallowed by children and adults. This includes accidental ingestion, such as hand-to-mouth behaviors or eating without washing hands, and incidental ingestion of any sediment tracked in the house or yard. The MDEQ default value of 200 milligrams per day (mg/day) for children was used in the calculations (MDEQ 2005).
Skin surface area (SA) refers to the amount of skin that is exposed that could have sediment sticking to it. The MDEQ default value of 2,670 square centimeters (cm2) for children was used in the calculations (MDEQ 2005). This value represents children in shorts and a t-shirt, leaving the lower legs, feet, forearms, hands, and head exposed.
Adherence factor (AF) refers to the amount of sediment that will adhere to a child’s skin. The child value, 2.98 mg/cm2, was calculated from a study of children playing in tidal flats. The sediment that adhered to various body parts (face, forearms, hands, lower legs, and feet) of the children was measured (EPA 2008). This value assumes that children wading in the river or walking through damp shoreline or wetlands would not have the sediment washed off from contact with the water.
The conversion factor (CF) is a value that accounts for differences in the units used for the variables.
Ingestion absorption efficiency (AEi) is the amount of chemical that will be absorbed by the gastrointestinal tract after ingesting the chemical. This value was either a chemical-specific or default value (EPA 2004). The values for each chemical are in Table A-2.
Dermal absorption efficiency (AEd) is the amount of the chemical that can be absorbed through the skin. This value was either a chemical-specific or default value (MDEQ 2011). The values for each chemical are in Table A-2.
The minimal risk level (MRL) or reference dose (RfD) are chemical-specific values that are a conservative estimate of the daily intake that a human can have with minimal risk of adverse effects over a lifetime of exposure. The values for each chemical are in Table A-2. ATSDR chronic oral MRLs were selected first, when available.
The averaging time is one year (365 days). This indicates that exposure is averaged over the whole year.
Body weight is 15 kilograms (kg). This is the default MDEQ value for a child, ages 1-6 (MDEQ 2005).

A-5
Table A-2: Chemical-specific values for the hazard quotient calculation.
Chemical
Chronic oral Minimal Risk Levels
(MRLs) in milligrams/kilogram-
day (mg/kg-day)a
Reference Dose (RfD) in
milligrams/kilogram-day (mg/kg-day)
Gastrointestinal absorbance (AEi)
b
(unitless)
Dermal absorbance
(AEd)c
(unitless)
1,2,4-Trimethylbenzene NA 1.40E-01c 1 0.1
1,3,5-Trimethylbenzene NA 1.0E-02d 1 0.1
2-Methylnaphthalene 4.00E-02 4.00E-03d 1 0.1
Acenaphthene NA 6.00E-02d 1 0.1
Acenaphthylene NA 7.10E-03c 1 0.1
Anthracene NA 3.00E-01d 1 0.1
Benzo(g,h,i)perylene NA 7.10E-03c 1 0.13
Beryllium 2.00E-03 2.00E-03d 0.007 0
Ethylbenzene NA 1.00E-01d 1 0.1
Fluoranthene NA 4.00E-02d 1 0.1
Fluorene NA 4.00E-02d 1 0.1
Isopropyl benzene NA 1.10E-01c 1 0.1
Molybdenum NA 5.00E-03d 1 0.01
Naphthalene NA 2.00E-02d 1 0.1
Nickel NA 7.60E-02c 0.04 0.01
n-Propylbenzene NA 1.10E-02c 1 0.1
Phenanthrene NA 7.10E-03c 1 0.1
Pyrene NA 3.00E-02d 1 0.1
sec-Butylbenzene NA 1.10E-02c 1 0.1
Toluene NA 8.00E-02d 1 0.1
Vanadium NA 5.00E-03d 1 0.01
Xylenes 2.00E-01 2.00E-01d 1 0.1 a = These values are from ATSDR (http://www.atsdr.cdc.gov/mrls/mrllist.asp; accessed March 2012). b = These values are from EPA (2004). c = These values are from MDEQ (2011). d = These RfDs are from the EPA Regional Screening Levels Summary Table (http://www.epa.gov/reg3hwmd/risk/human/rb-concentration_table/Generic_Tables/pdf/master_sl_table_run_NOV2011.pdf; accessed March 2012). Cancer risk Theoretical cancer risk was calculated for the chemicals that are considered carcinogens and that have a slope factor (also called cancer potency factor). Two different types of carcinogens were included, those with an ADAF included in the cancer risk calculation and those without (EPA 2005). Theoretical lifetime excess cancer risk estimates are the probability of one additional case of cancer in an exposed population. For instance, a cancer risk may be one extra cancer in a population of 100,000 (1E-05)11. This extra cancer is in addition to the background cancer rates. This theoretical population risk estimate is not an actuarial risk that can be measured (e.g. annual deaths from motor vehicle accidents), but a probability estimate typically used by regulatory
11 The MDEQ has a required cancer risk of no greater than one extra individual in 100,000 over the background incidence of cancer (MDEQ 2005) for regulatory purposes.

A-6
agencies and to support decision-making about when specific exposure reduction efforts are warranted. Typically, cancer risk estimates greater than one additional cancer in a population of 10,00012 are used as a guideline to determine when intervention is needed. Cancer risk for benzene Benzene cancer risk was calculated for adults and children, ages 1-6, using Equation 2. Table A-3 and A-4 presents the variables for the benzene cancer risk calculation for an adult and child, respectively. Adult and child cancer risks for each sample were added together.
Equation 2: Benzene cancer risk - Ingestion and dermal risk equation13
BWLTAT
CFSFAEAE
AFSAIRSEDEFFFionConcentrat
Riskd
iioil
)]1
([
Table A-3: Variables used for calculation of benzene cancer risk for an adult with an unrestricted exposure scenario.
Variable Unit for the variable Value for the variablea Concentration milligram per kilogram (mg/kg) Sample and chemical-specific
Fraction of petroleum residue that is oil (Foil)
Unitless 1
Fraction of area impacted with submerged oil (Fi)
Unitless 0.38
Exposure Frequency (EF) days/year 150 Exposure Duration (ED) - adult years 24 Sediment Ingestion (IRS) - adult milligram per day (mg/day) 100
Skin surface area (SA) - adult square centimeters (cm2) 5,800
Adherence Factor (AF) - adult milligram per square centimeter
(mg/cm2) 0.3
Gastrointestinal absorbance (AEi) Unitless chemical-specific Dermal absorbance (AEd) Unitless chemical-specific
Slope Factor (SF) per milligram per kilogram-day
([mg/kg-day]-1) chemical-specific
Conversion factor (CF) kilogram per milligram (kg/mg) 1/1,000,000 Averaging Time (AT) days/year 365
Lifetime (LT) years 70 Body weight (BW) - adult kilograms (kg) 70
a = See the text description below for descriptions and sources of the variables.
12 Typically used ranges of cancer risk are from one extra cancer in 10,000 (1E-04) to one in 1,000,000 (1E-06). 13 For the result to be unitless, skin surface area (SA) units need to cm2/event and a variable for 1 event/day need to be included.

A-7
Table A-4: Variables used for calculation of benzene cancer risk for a child, ages 1-6, with an unrestricted exposure scenario.
Variable Unit for the variable Value for the variablea Concentration milligram per kilogram (mg/kg) Sample and chemical-specific
Fraction of petroleum residue that is oil (Foil)
Unitless 1
Fraction of area impacted with submerged oil (Fi)
Unitless 0.38
Exposure Frequency (EF) days/year 150 Exposure Duration (ED) - child years 6 Sediment Ingestion (IRS) - child milligram per day (mg/day) 200
Skin surface area (SA) - child square centimeters (cm2) 2,670
Adherence Factor (AF) - child milligram per square centimeter
(mg/cm2) 2.98
Gastrointestinal absorbance (AEi) Unitless chemical-specific Dermal absorbance (AEd) Unitless chemical-specific
Slope Factor (SF) per milligram per kilogram-day
([mg/kg-day]-1) chemical-specific
Conversion factor (CF) kilogram per milligram (kg/mg) 1/1,000,000 Averaging Time (AT) days/year 365
Lifetime (LT) years 70 Body weight (BW) - child kilograms (kg) 15
a = See the text description below for descriptions and sources of the variables.
Variable descriptions are below:
Concentration refers to the levels of the chemicals measured in each of the sediment samples. Concentration of each chemical is specific to the sample. If a chemical was detected above the reporting limit, that value was used in the calculations. If a chemical was not detected above the reporting limit, one-half of the reporting limit for that sample was used for the calculations.
The fraction of the petroleum residue that is oil (Foil) was used in the Gulf of Mexico oil spill to compensate for having analytical data on the oil and not the levels of chemicals present in the material on the beaches (OSAT-2 2011). Chemical levels were measured in sediment samples from the Kalamazoo River so the value was set at 1, indicating that 100% of the chemical was present in the sediment sample.
The fraction of the area impacted with submerged oil (Fi) is the amount of the river with submerged oil. This value was 0.38, indicating that 38% of the river bottom had submerged oil. The 0.38 represents a quarter mile stretch in the Morrow Lake delta with the heaviest submerged oil footprint. Use of this value in the calculations provides the most conservative amount of oil that people may encounter (a worst-case scenario for exposure).
The exposure frequency (EF) is the number of days per year a person is exposed to the chemicals in the sediment. To use the most conservative exposure scenario, 150 days were selected. This represents a daily exposure from May to October (spring to fall).

A-8
The exposure duration (ED) is the number of years that residents may encounter these chemicals. To present the most conservative exposure scenario, all of the years within an age range were included.
Sediment ingestion (IRS) refers to the amount of sediment that could be swallowed by children and adults. This includes accidental ingestion, such as hand-to-mouth behaviors or eating without washing hands, and incidental ingestion of any sediment tracked in the house or yard. The MDEQ default values of 200 milligrams per day (mg/day) for children and 100 mg/day for adults were used in the calculations (MDEQ 2005).
Skin surface area (SA) refers to the amount of skin that is exposed that could have sediment sticking to it. The MDEQ default values of 2,670 square centimeters (cm2) for children and 5,800 cm2 for adults were used in the calculations (MDEQ 2005). These values represent children and adults in shorts and a t-shirt, leaving the lower legs (and feet for children), forearms, hands, and head exposed.
Adherence factor (AF) refers to the amount of sediment that will adhere to a child’s or adult’s skin. The child value, 2.98 mg/cm2, was calculated from a study of children playing in tidal flats. The sediment that adhered to various body parts (face, forearms, hands, lower legs, and feet) of the children was measured (EPA 2008). The adult value, 0.3 mg/cm2 represents adults working in the garden (MDEQ 2001). These values assume that children or adults wading in the river or moving through damp shoreline or wetlands would not have the sediment washed off from contact with the water.
The conversion factor (CF) is a value that accounts for differences in the units used for the variables.
Ingestion absorption efficiency (AEi) is the amount of chemical that will be absorbed by the gastrointestinal tract after ingesting the chemical. This value was either a chemical-specific or default value (EPA 2004). The values for each chemical are in Table A-5.
Dermal absorption efficiency (AEd) is the amount of the chemical that can be absorbed through the skin. This value was either a chemical-specific or default value (MDEQ 2011). The values for each chemical are in Table A-5.
The averaging time is one year (365 days). This indicates that exposure is averaged over the whole year.
The slope factor (SF) is a chemical-specific value calculated by the EPA or the MDEQ to indicate the risk of cancer associated with exposure to a specific substance. The values for each chemical are in Table A-5.
The lifetime (LT) value, 70 years, indicates that exposure to a chemical may impact a person over their lifespan.
Body weight is 15 kg for children (ages 1-6) and 70 kg for an adult. These are the default MDEQ values (MDEQ 2005).
Table A-5: Chemical-specific values for the benzene cancer risk calculation.
Chemical
Slope factor (SF) in per milligram per
kilogram-day ([mg/kg-day]-1)
Gastrointestinal absorbance (AEi)
a
(unitless)
Dermal absorbance (AEd)
b (unitless)
Benzene 2.90E-02b 1 0.1 a = These values are from EPA (2004). b = These values are from MDEQ (2011).
A-9
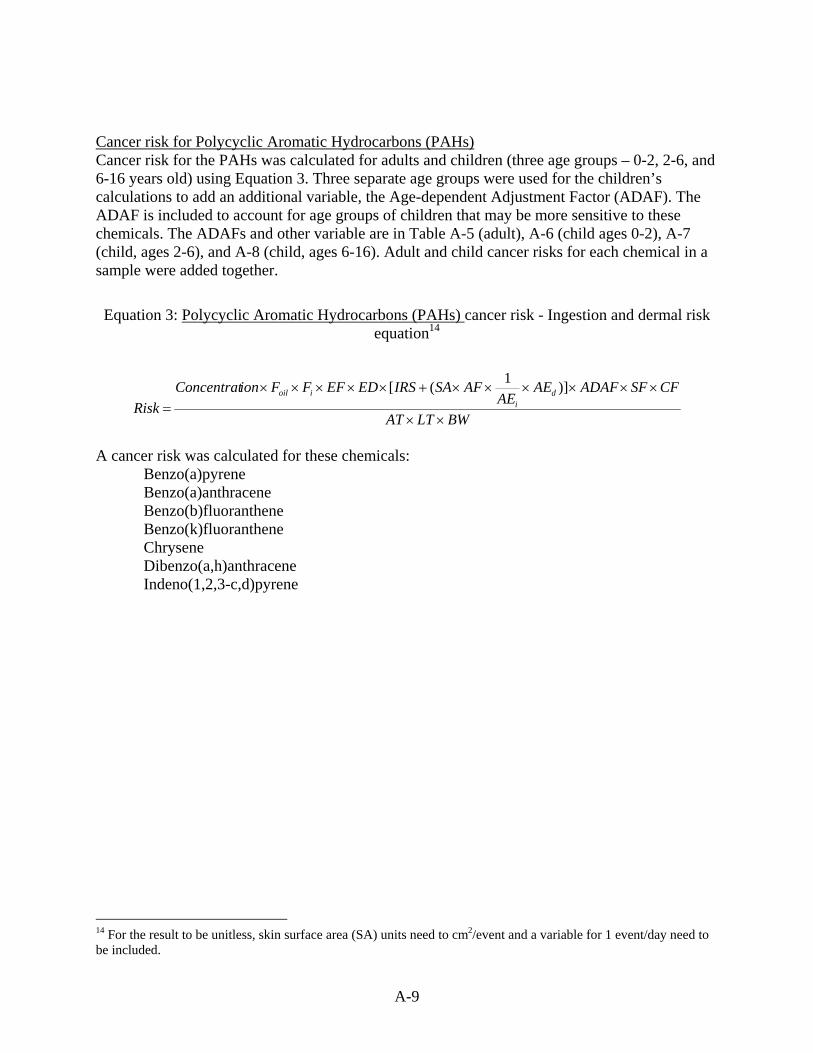
Cancer risk for Polycyclic Aromatic Hydrocarbons (PAHs) Cancer risk for the PAHs was calculated for adults and children (three age groups – 0-2, 2-6, and 6-16 years old) using Equation 3. Three separate age groups were used for the children’s calculations to add an additional variable, the Age-dependent Adjustment Factor (ADAF). The ADAF is included to account for age groups of children that may be more sensitive to these chemicals. The ADAFs and other variable are in Table A-5 (adult), A-6 (child ages 0-2), A-7 (child, ages 2-6), and A-8 (child, ages 6-16). Adult and child cancer risks for each chemical in a sample were added together.
Equation 3: Polycyclic Aromatic Hydrocarbons (PAHs) cancer risk - Ingestion and dermal risk equation14
BWLTAT
CFSFADAFAEAE
AFSAIRSEDEFFFionConcentrat
Riskd
iioil
)]1
([
A cancer risk was calculated for these chemicals:
Benzo(a)pyrene Benzo(a)anthracene Benzo(b)fluoranthene Benzo(k)fluoranthene Chrysene Dibenzo(a,h)anthracene Indeno(1,2,3-c,d)pyrene
14 For the result to be unitless, skin surface area (SA) units need to cm2/event and a variable for 1 event/day need to be included.

A-10
Table A-6: Variables used for calculation of Polycyclic Aromatic Hydrocarbons (PAHs) cancer risk for an adult with an unrestricted exposure scenario.
Variable Unit for the variable Value for the variablea Concentration milligram per kilogram (mg/kg) Sample and chemical-specific
Fraction of petroleum residue that is oil (Foil)
Unitless 1
Fraction of area impacted with submerged oil (Fi)
Unitless 0.38
Exposure Frequency (EF) days/year 150 Exposure Duration (ED) - adult years 14 Sediment Ingestion (IRS) - adult milligram per day (mg/day) 100
Skin surface area (SA) - adult square centimeters (cm2) 5,800
Adherence Factor (AF) - adult milligram per square centimeter
(mg/cm2) 0.3
Gastrointestinal absorbance (AEi) Unitless chemical-specific Dermal absorbance (AEd) Unitless chemical-specific
Age-dependent adjustment factor (ADAF) - adult
Unitless 1
Slope Factor (SF) per milligram per kilogram-day
([mg/kg-day]-1) chemical-specific
Conversion factor (CF) kilogram per milligram (kg/mg) 1/1,000,000 Averaging Time (AT) days/year 365
Lifetime (LT) years 70 Body weight (BW) - adult kilograms (kg) 70
a = See the text description below for descriptions and sources of the variables.
Table A-7: Variables used for calculation of Polycyclic Aromatic Hydrocarbons (PAHs) cancer risk for a child, age 0-2, with an unrestricted exposure scenario.
Variable Unit for the variable Value for the variablea Concentration milligram per kilogram (mg/kg) Sample and chemical-specific
Fraction of petroleum residue that is oil (Foil)
Unitless 1
Fraction of area impacted with submerged oil (Fi)
Unitless 0.38
Exposure Frequency (EF) days/year 150 Exposure Duration (ED) - child years 2 Sediment Ingestion (IRS) - child milligram per day (mg/day) 200
Skin surface area (SA) - child square centimeters (cm2) 2,670
Adherence Factor (AF) - child milligram per square centimeter
(mg/cm2) 2.98
Gastrointestinal absorbance (AEi) Unitless chemical-specific Dermal absorbance (AEd) Unitless chemical-specific
Age-dependent adjustment factor (ADAF) - child
Unitless 10
Slope Factor (SF) per milligram per kilogram-day
([mg/kg-day]-1) chemical-specific
Conversion factor (CF) kilogram per milligram (kg/mg) 1/1,000,000 Averaging Time (AT) days/year 365
Lifetime (LT) years 70 Body weight (BW) - child kilograms (kg) 10
a = See the text description below for descriptions and sources of the variables.

A-11
Table A-8: Variables used for calculation of Polycyclic Aromatic Hydrocarbons (PAHs) cancer risk for a child, age 2-6, with an unrestricted exposure scenario.
Variable Unit for the variable Value for the variablea Concentration milligram per kilogram (mg/kg) Sample and chemical-specific
Fraction of petroleum residue that is oil (Foil)
Unitless 1
Fraction of area impacted with submerged oil (Fi)
Unitless 0.38
Exposure Frequency (EF) days/year 150 Exposure Duration (ED) - child years 4 Sediment Ingestion (IRS) - child milligram per day (mg/day) 200
Skin surface area (SA) - child square centimeters (cm2) 2,670
Adherence Factor (AF) - child milligram per square centimeter
(mg/cm2) 2.98
Gastrointestinal absorbance (AEi) Unitless chemical-specific Dermal absorbance (AEd) Unitless chemical-specific
Age-dependent adjustment factor (ADAF) - child
Unitless 3
Slope Factor (SF) per milligram per kilogram-day
([mg/kg-day]-1) chemical-specific
Conversion factor (CF) kilogram per milligram (kg/mg) 1/1,000,000 Averaging Time (AT) days/year 365
Lifetime (LT) years 70 Body weight (BW) - child kilograms (kg) 15
a = See the text description below for descriptions and sources of the variables.
Table A-9: Variables used for calculation of Polycyclic Aromatic Hydrocarbons (PAHs) cancer risk for a child, age 6-16, with an unrestricted exposure scenario.
Variable Unit for the variable Value for the variable Concentration milligram per kilogram (mg/kg) Sample and chemical-specific
Fraction of petroleum residue that is oil (Foil)
Unitless 1
Fraction of area impacted with submerged oil (Fi)
Unitless 0.38
Exposure Frequency (EF) days/year 150 Exposure Duration (ED) - child years 10 Sediment Ingestion (IRS) - adult milligram per day (mg/day) 100
Skin surface area (SA) - adult square centimeters (cm2) 5,800
Adherence Factor (AF) - adult milligram per square centimeter
(mg/cm2) 0.3
Gastrointestinal absorbance (AEi) Unitless chemical-specific Dermal absorbance (AEd) Unitless chemical-specific
Age-dependent adjustment factor (ADAF) - child
Unitless 3
Slope Factor (SF) per milligram per kilogram-day
([mg/kg-day]-1) chemical-specific
Conversion factor (CF) kilogram per milligram (kg/mg) 1/1,000,000 Averaging Time (AT) days/year 365
Lifetime (LT) years 70 Body weight (BW) - child kilograms (kg) 50
a = See the text description below for descriptions and sources of the variables.

A-12
Variables descriptions are below: Concentration refers to the levels of the chemicals measured in each of the sediment
samples. Concentration of each chemical is specific to the sample. If a chemical was detected above the reporting limit, that value was used in the calculations. If a chemical was not detected above the reporting limit, one-half of the reporting limit for that sample was used for the calculations.
The fraction of the petroleum residue that is oil (Foil) was used in the Gulf of Mexico oil spill to compensate for having analytical data on the oil and not the levels of chemicals present in the material on the beaches (OSAT-2 2011). Chemical levels were measured in sediment samples from the Kalamazoo River so the value was set at 1, indicating that 100% of the chemical was present in the sediment sample.
The fraction of the area impacted with submerged oil (Fi) is the amount of the river with submerged oil. This value was 0.38, indicating that 38% of the river bottom had submerged oil. The 0.38 represents a quarter mile stretch in the Morrow Lake delta with the heaviest submerged oil footprint. Use of this value in the calculations provides the most conservative amount of oil that people may encounter (a worst-case scenario for exposure).
The exposure frequency (EF) is the number of days per year a person is exposed to the chemicals in the sediment. To use the most conservative exposure scenario, 150 days were selected. This represents a daily exposure from May to October (spring to fall).
The exposure duration (ED) is the number of years that residents may encounter these chemicals. To present the most conservative exposure scenario, all of the years within an age range were included.
Sediment ingestion (IRS) refers to the amount of sediment that could be swallowed by children and adults. This includes accidental ingestion, such as hand-to-mouth behaviors or eating without washing hands, and incidental ingestion of any sediment tracked in the house or yard. The MDEQ default values of 200 milligrams per day (mg/day) for children and 100 mg/day for adults were used in the calculations (MDEQ 2005).
Skin surface area (SA) refers to the amount of skin that is exposed that could have sediment sticking to it. The MDEQ default values of 2,670 square centimeters (cm2) for children and 5,800 cm2 for adults were used in the calculations (MDEQ 2005). These values represent children and adults in shorts and a t-shirt, leaving the lower legs (and feet for children), forearms, hands, and head exposed.
Adherence factor (AF) refers to the amount of sediment that will adhere to a child’s or adult’s skin. The child value, 2.98 mg/cm2, was calculated from a study of children playing in tidal flats. The sediment that adhered to various body parts (face, forearms, hands, lower legs, and feet) of the children was measured (EPA 2008). The adult value, 0.3 mg/cm2 represents adults working in the garden (MDEQ 2001). These values assume that children or adults wading in the river or moving through damp shoreline or wetlands would not have the sediment washed off from contact with the water.
The conversion factor (CF) is a value that accounts for differences in the units used for the variables.
Ingestion absorption efficiency (AEi) is the amount of chemical that will be absorbed by the gastrointestinal tract after ingesting the chemical. This value was either a chemical-specific or default value (EPA 2004). The values for each chemical are in Table A-10.

A-13
Dermal absorption efficiency (AEd) is the amount of the chemical that can be absorbed through the skin. This value was either a chemical-specific or default value (MDEQ 2011). The values for each chemical are in Table A-10.
The averaging time is one year (365 days). This indicates that exposure is averaged over the whole year.
The age-dependent adjustment factor (ADAF) is additional safety factor included in the calculations to account for children’s increased sensitivity to effects from these carcinogens.
The slope factor (SF) is a chemical-specific value calculated by the EPA or the MDEQ to indicate the risk of cancer associated with exposure to a specific substance. The values for each chemical are in Table A-10.
The lifetime (LT) value, 70 years, indicates that exposure to a chemical may impact a person over their lifespan.
Body weight is 15 kg for children (ages 2-6) and 70 kg for an adult. These are the default MDEQ values (MDEQ 2005). Body weight for children ages 0-2 is 10 kg and 50 kg for children ages 6-16. These body weights are based on the body weight averages (EPA 2008).
Table A-10: Chemical-specific values for the Polycyclic Aromatic Hydrocarbons (PAHs) cancer risk calculation.
Analyte
Slope factor (SF) in per
milligram per kilogram-day
([mg/kg-day]-1)
Gastrointestinal absorbance
(AEi)a (unitless)
Dermal absorbance
(AEd) b
(unitless)
Benzo(a)pyrene 7.30E+00 1 0.13
Benzo(a)anthracene 7.30E-01 1 0.13
Benzo(b)fluoranthene 7.30E-01 1 0.13
Benzo(k)fluoranthene 7.30E-02 1 0.13
Chrysene 7.30E-03 1 0.13
Indeno(1,2,3-c,d)pyrene 7.30E-01 1 0.13
Dibenzo(a,h)anthracene 7.30E+00 1 0.13 a = These values are from EPA (2004). b = These values are from MDEQ (2011). c = The benzo(a)pyrene slope factor is from the EPA Integrated Risk Information System (IRIS) database (http://www.epa.gov/iris/index.html; accessed June 2011). Slope factors for other PAHs are based on the benzo(a)pyrene relative potencies (http://www.epa.gov/oswer/riskassessment/sghandbook/pdfs/pah-rpfs.pdf).

B-1
Appendix B : Additional information on the chemicals not included in this assessment
Several questions have been asked about the paragraph on page 10 (quoted below).
Eight of the chemicals in Table 1 (p-isopropyl toluene, cyclohexane, 1,2,3-trimethylbenzene, m & p-xylene, o-xylene, diesel range organics [C10-C20], gasoline range organics [C6-C10], and oil range organics [C20-C34]) were not included in the risk calculations. Several of the chemicals did not have toxicity values (necessary information for the risk calculations) available. Calculations for m- & p- and o-xylene were not done individually as xylenes were evaluated together. The diesel range organics (C10-C20), gasoline range organics (C6-C10), and oil range organics (C20-C34) were not included in the calculations as there are no toxicity values for weathered mixtures of hydrocarbons (Edwards et al. 1997).
A better explanation of the eight chemicals listed and why they were not included in the evaluation is below. This evaluation included skin contact and accidental eating of small amount of sediment containing submerged oil. 2-Methylnaphthalene (no longer listed) This chemical was accidently included in the list from the public comment version. As presented in Table 3 (page 14), 2-methylnaphthlene was included in the non-cancer risk evaluation. p-Isopropyl Toluene No toxicity values are available to evaluate this chemical. Skin irritation (a rash) could develop if a person touches this chemical. There is no way to determine how much of this chemical may cause skin irritation. This chemical is also known as p-cymene. The United States Food and Drug Administration (FDA) allows this chemical to be added to foods as a flavoring. p-Isopropyl toluene was not found in any of the sediment samples in amounts that could be measured. Because of problems with measuring any specific chemical when working with samples from a spill such as this, the amount of chemical measured will vary from sample to sample. The smallest amount that can be measured in one sample, also known as reporting limit, will depend on what other chemicals are present that may affect the analysis. The largest reporting limit measured for all of the samples is listed, under the heading maximum reporting limit, on page 11. (See Table 1, page 11.) Even if p-Isopropyl toluene is present in the sediment samples at the maximum reporting limit of 0.75 mg/kg, the amount of this chemical that could be accidently eaten is expected to be very small (one-half of the maximum reporting limit [1.5/2 = 0.75 mg/kg] times the amount of sediment that could be accidently eaten in a day [0.2 kg], which is 0.15 mg). Cyclohexane No toxicity values for skin contact with and accidental eating of this chemical are available. Most of the available health effects information is about breathing in (inhaling) cyclohexane. However, skin contact with this chemical can cause skin irritation. There is no way to determine how much of this chemical may cause skin irritation.

B-2
Cyclohexane was not found in any of the samples in amounts that could be accurately measured. The amount in Table 1, page 11, is the maximum reporting limit. The amount of this chemical that could be accidently eaten is expected to be very small (one-half of the maximum reporting limit [1.5/2 = 0.75 mg/kg] times the amount of sediment that could be accidently eaten in a day [0.2 kg], which is 0.15 mg). 1,2,3-Trimethylbenzene No toxicity values were available for the exposures expected to this chemical. Most of the information is about breathing in 1,2,3-trimethylbenzene. However, skin contact with this chemical can cause skin irritation. There is no way to determine how much of this chemical may cause skin irritation. 1,2,3-Trimethylbenzene was not found in any of the sediment samples in amounts that could be measured. The amount of this chemical that could be accidently eaten is expected to be very small (one-half of the maximum reporting limit [1.5/2 = 0.75 mg/kg] times the amount of sediment that could be accidently eaten in a day [0.2 kg] which is 0.15 mg). m & p-Xylene and o-Xylene These chemicals were not evaluated individually. These chemicals were evaluated together, as xylenes. The Michigan Department of Environmental Quality has a toxicity value (a reference dose) that was used to evaluate the non-cancer risk of these chemicals. The Hazard Quotient for xylenes is 0.0000046 (Table 3, page 14). Even if these chemicals had been evaluated separately, the non-cancer risk value would have still been far below 1.0. Diesel Range Organics (C10-C20) The diesel range organics (DRO) are a group of chemicals that have 10 to 20 carbons in their structure. To evaluate this group, the toxicity value from one of the chemicals in the group is selected. The toxicity value may be from the chemical that is considered the most toxic or just the one that has a toxicity value. This chemical and its toxicity are then considered as a surrogate for all the chemicals in the group. The toxicity value most commonly used for this group is based on a combined assessment of the chemicals isopropyl benzene, naphthalene, fluorene, and fluoranthene, with consideration given to acenaphthene, biphenyl, anthracene, and pyrene. All of the chemicals, except for biphenyl, were measured individually in the oil and the health risks of exposure to these chemicals were individually evaluated. Therefore, to evaluate them again as a group and add the DRO group Hazard Quotient to the total Hazard Index would overestimate the risk of exposure to Kalamazoo River sediments. Gasoline Range Organics (C6-C10) The gasoline range organics are a group of chemicals that have 6 to 10 carbons in their structure. To evaluate this group, the toxicity value from one of the chemicals in the group is selected. The toxicity value may be from the chemical that is considered the most toxic or just the one that has a toxicity value. The toxicity value most commonly used for this group is based on toluene, ethylbenzene, styrene, and xylenes. All chemicals, except for styrene, were measured individually in the samples. Styrene was not found in samples of the oil taken in August 2010.

B-3
Gasoline range organics were not detected in any of the samples above the reporting limit and the value of 10 mg/kg is larger than the individual chemicals that were measured (See Table 1, page 11). Oil Range Organics (C20-C34) The oil range organics are a group of chemicals that have 20 to 34 carbons. To evaluate this group, the toxicity value from one of the chemicals in the group is selected. The toxicity value may be from the chemical that is considered the most toxic or just the one that has a toxicity value. The toxicity value most commonly used for this group is based pyrene. Pyrene was measured individually in the samples and the maximum level (0.78 mg/kg) is more than 2,000 times below the oil range organics maximum value of 1,900 mg/kg (See Table 1, page 11). Use of a toxicity value based on pyrene would be a misrepresentation of the non-cancer risk. Diesel Range Organics (C10-C20), Gasoline Range Organics (C6-C10), and Oil Range Organics (C20-C34) These chemical groups also include chemicals that are straight lines of carbons (aliphatic hydrocarbons). If the toxicity values for the aliphatic hydrocarbons in the diesel range organics, gasoline range organics, and oil range organics were used, it would increase the total Hazard Index from 0.04 to 0.09. (See Table 3, page 14 for the source of the 0.04.) This number is still far below 1.0.

C-1
Appendix C : Response to comments and questions Several individuals and groups provided comments on this Public Health Assessment (PHA). Thank you to all who submitted comments and questions. Comments and questions were paraphrased and combined if similar. Responses to comments and questions are below. If comments and questions prompted changes to the PHA, the page number for the changes was noted. General comments and questions:
1. Several comments mentioned other ways that people may be exposed to oil-related chemicals from the July 2010 heavy crude oil spill. (Other routes of exposure that were mentioned were inhalation, ingestion of drinking water or fish, and contact with the surface water.)
This PHA only addresses people having contact (dermal contact [skin] or incidental ingestion [accidently eating]) with oil-related chemicals from submerged oil in the sediment. Additional ways that people could have exposure to oil-related chemicals will be discussed in future PHAs. Surface water, fish, groundwater, and air data will be considered in those PHAs. The release of these PHAs will be announced as they become available.
2. There were concerns regarding how the exposure discussed in this assessment related to people’s health concerns and that this document does not address individual’s illnesses.
Individuals should see a medical doctor if they have illnesses or specific health concerns. PHAs address community health concerns from exposure to chemicals and do not provide medical advice to individuals. As stated above, this PHA’s purpose was to answer whether people could have health effects from contact with chemicals in the submerged oil in the Kalamazoo River. If people had no contact with sediment containing submerged oil, they were not exposed to oil-related chemicals and therefore, no health effects would occur from this route of exposure. People that may have had contact with the sediment containing submerged oil will not have long-term health effects as there is no increased risk of cancer or other long-term health effects from the levels of oil-related chemicals present in the sediment. Future PHAs will address other ways that people may have been exposed to oil-related chemicals. (These routes of exposure are inhalation, ingestion of drinking water and fish, and contact with the surface water.)
3. The exposure discussed in this PHA is more of a high-end or worst-case exposure (for example repeated contact with the sediments would be unlikely in a boat).
The exposure scenario discussed in the PHA is the largest exposure that is reasonably expected to occur. Even using this protective exposure scenario, people are not expected to develop long-term health effects. By using the largest exposure reasonably expected, this evaluation was protective for those with less of an exposure, including those that may only occasionally use the river.

C-2
4. There was one request to include the full sediment data set in the PHA.
The full sediment data set was not included in the PHA as only the non-cancer and cancer risks from the maximum chemical values were discussed. The risks from the maximum chemical levels are the highest risks possible from chemical levels in the entire sediment data set. Since those highest non-cancer and cancer risks are below risk a hazard quotient of 1.0 or a theoretical cancer risk of one in 10,000, risk from lower chemical levels would also be below these levels.
5. How could there be conclusions if no cleanup criteria/screening levels are available for sediment?
The MDEQ’s Part 201 program does not have cleanup criteria for sediment. As no criteria are available to be used as screening levels, this approach was not used for sediment in the Kalamazoo River. Criteria and screening levels are based on reference doses or cancer slope factors (toxicity values) and information about potential exposures (such as the amount of soil people may accidently eat, and how many days people may be exposed to the soil). Development of cleanup criteria/screening levels also includes the amount of risk considered acceptable for the exposure (such as a hazard quotient of 1.0 or less or a theoretical cancer risk less than one case in 10,000 people). The equations used in this PHA use the same information about potential exposures and toxicity values, but use the levels of chemicals measured to calculate risk. This is what is reported in this PHA.
6. How can portions of the river be opened if the PHA recommends avoiding contact
with the submerged oil and because the submerged oil continually moves? How can poling techniques be used if the submerged oil keeps moving?
This PHA does not discuss opening of the river. The purpose was to answer the question of whether or not the oil-related chemicals in the submerged oil would harm people’s health if they had contact with the remaining oil. Poling techniques were used to identify areas that had submerged oil along with information about the flow of the river and areas where submerged oil may deposit. These techniques were solely used to confirm that submerged oil was in the sample location. Concerns regarding techniques used to assess or remove the oil can be submitted by email or phone to the EPA ([email protected] or EPA Region 5 public hotline: 800-306-6837).
The conclusions of this PHA are still relevant even if the submerged oil moves to different areas of the river. There are several reasons for this. First, the potential exposure discussed in the PHA was a larger exposure than adults and children would have (most people, especially occasional recreational users of the river would have a much smaller exposure). If no long-term health effects would occur from this exposure, people with smaller exposures would not have long-term health effects. Second, chemical levels throughout the river sediment will not become higher without a new source of chemicals. Different areas may have different chemicals or variability in the amount of different chemicals, but overall levels in the river sediment will not increase unless there is new source of chemicals released to the river.

C-3
7. If short-term health effects (skin irritation or rashes) are possible from contact with the sediment containing oil-related chemicals, why is there no expectation of long-term health effects?
Just because short-term health effects (skin irritation or rashes) are possible does not automatically mean that long-term health effects will occur. The short-term health effects discussed in the PHA are a local reaction to the chemicals, meaning that only skin coated with or in contact with the chemicals would react. (Different individuals may develop different amounts of skin irritation or may not develop any skin irritation at all. It depends on the person.) For these short-term health effects, the chemical does not need to be distributed throughout the body and different individuals may react to higher or lower amounts of the chemicals than other people. In general, for long-term health effects from chemical exposure to be possible, people need to have high enough chemical levels in their body for a long enough time. People’s bodies process many different chemicals every day, and it is only when the chemical levels are too high for too long that health effects develop. For the assessment in this PHA, the chemical levels that people could have were not high enough to expect long-term health effects to occur.
8. How can community members become involved? This question pertains to the
statement, “MDCH will work with local health departments and community members to provide health protective information and is in the process of evaluating other ways people may be exposed to the chemicals in the remaining crude oil.”
MDCH is working with local and federal agencies on community outreach to address health concerns. Additional information will be released early in 2012. MDCH is also in the process of developing PHAs that address other ways people may have or could be exposed to oil-related chemicals. These documents will be released as they become available.

C-4
Specific comments: 1. A suggestion to replace “of people's risk” with “potential for adverse risk” in the
title of the PHA. The suggestion was considered and “of people’s risk” was changed to “of people’s risk for health effects.”
2. There were a couple of comments on the “Note of Explanation” and “Foreword” sections. These comments pertained to the data included and the sources of information.
These sections are intended to describe the process common to all PHAs (applicable for all sites) and provide that description with very general language. For specific details on the data and process used this specific PHAs, please review the Discussion sections and the references. Individual health information was not included in this assessment.
3. There was no mention of Talmadge Creek in the PHA. Why was Talmadge Creek not addressed and won’t contaminated sediment flow into the Kalamazoo River from the creek? Doesn’t the 40 miles referred to on page 6 include Talmadge Creek?
Sediment from Talmadge Creek was not collected as part of the data used in this PHA. Samples were taken in the Kalamazoo River, starting at mile post 2.75. There is significant remediation work currently on-going along the impacted area of Talmadge Creek. The impacted areas of the creek have been removed. The creek bed and banks will be restored with clean soil and sediment. A footnote was added with this information on page 10. Approximately 36 miles of the Kalamazoo River were impacted by the oil spill. This number was rounded up to 40 and was not intended to include Talmadge Creek. The 40 miles was replaced with 36 miles on page 6.
4. Explain the statement that, “The results and conclusions in this health assessment
are for public health purposes only and do not show compliance with, or satisfy, EPA or Michigan Department of Environmental Quality (MDEQ) regulations or requirements.” Provide the MDEQ and EPA regulations and requirements in writing.
This statement was intended to address the difference between public health conclusions and the requirements a responsible party has under state and federal law. Although there is not increased risk of long-term health effects, MDEQ and EPA regulations and requirements need to be followed regarding the cleanup of the impacted area. The MDEQ and EPA regulations and requirements will not be provided in this PHA. Please contact the MDEQ Environmental Assistance Center at 1-800-662-9278 or [email protected] and the EPA at [email protected] or EPA Region 5 public hotline: 800-306-6837 for that information. The EPA’s and MDEQ’s orders can be found at:

C-5
http://www.epa.gov/enbridgespill/documents.html#epadocs and http://www.michigan.gov/deq/0,1607,7-135-3313_56784---,00.html.
5. Include information on whether tar sands oil and the diluent used in the heavy crude oil that spill naturally degrade.
This information is not necessary to answer the question being addressed by the PHA. However, some references that address this issue are below. The diluent used for the heavy crude oil that spilled was also petroleum, but a lighter crude oil. Aitken, C. M., Jones, D. M. and Larter, S. R. 2004. Anaerobic hydrocarbon biodegradation in deep subsurface oil reservoirs. Nature 431(7006): 291-294. Gray, N. D., Sherry, A., Hubert, C., et al. 2010. Methanogenic degradation of petroleum hydrocarbons in subsurface environments remediation, heavy oil formation, and energy recovery. Adv Appl Microbiol 72:137-161. Hubert, C. R., Oldenburg, T. B., Fustic, M., et al. 2011. Massive dominance of Epsilonproteobacteria in formation waters from a Canadian oil sands reservoir containing severely biodegraded oil. Environ Microbiol. Epublished ahead of print. Lee, E. H., Cho, K. S. and Kim, J. 2010. Comparative study of rhizobacterial community structure of plant species in oil-contaminated soil. J Microbiol Biotechnol 20(9): 1339-1347. Siddique, T., Penner, T., Semple, K., et al. 2011. Anaerobic biodegradation of longer-chain n-alkanes coupled to methane production in oil sands tailings. Environ Sci Technol 45(13): 5892-5899. Vila, J., Maria Nieto, J., Mertens, J., et al. 2010. Microbial community structure of a heavy fuel oil-degrading marine consortium: linking microbial dynamics with polycyclic aromatic hydrocarbon utilization. FEMS Microbiol Ecol 73(2): 349-362.
6. Several comments were given on the chemicals that were not included in the evaluation. (See page 10.)
Additional explanation of these chemicals was added in Appendix B.
7. The first bullet point sentence in the Non-cancer risk (hazard quotient) section is not
clearly written. Should the word “not” in italics be removed? The sentence referred to (page 13) is correct as it is written (“If the non-cancer risk is less than 1.0, a person is exposed to the amount of the chemical that is less than the amount that is not expected to cause health effects.”) Changes were made to that section to state the information more clearly.

C-6
8. It might provide clarity to add the word ‘repeatedly’ to the first sentence in the last paragraph on page 13. Specifically, “The equation to calculate non-cancer risk includes both repeatedly touching and repeatedly accidentally eating the oil.”
Language was added to address this comment. See page 14.
9. There was a concern regarding the “if possible” in the sentence recommending the recovery of the oil.
The “if possible” was added to that sentence because all remaining oil may not have been identified. Part of the MDEQ purpose is to protect sensitive plants, animals, and ecosystems. In order to prevent destruction of sensitive ecosystems, some oil may be allowed to remain.