Embed Size (px)
Citation preview

Public Health Assessment
Evaluation of Air Contamination
KALAMAZOO RIVER ENBRIDGE OIL SPILL
CALHOUN AND KALAMAZOO COUNTIES, MICHIGAN
Prepared by the Michigan Department of Community Health
SEPTEMBER 30, 2015
Prepared under a Cooperative Agreement with the U.S. DEPARTMENT OF HEALTH AND HUMAN SERVICES
Agency for Toxic Substances and Disease Registry Division of Community Health Investigations
Atlanta, Georgia 30333
Final Release
THE ATSDR PUBLIC HEALTH ASSESSMENT: A NOTE OF EXPLANATION
This Public Health Assessment was prepared by ATSDR’s Cooperative Agreement Partner pursuant to the Comprehensive Environmental Response, Compensation, and Liability Act (CERCLA or Superfund) section 104 (i)(6) (42 U.S.C. 9604 (i)(6)), and in accordance with our implementing regulations (42 C.F.R. Part 90). In preparing this document, ATSDR’s Cooperative Agreement Partner has collected relevant health data, environmental data, and community health concerns from the Environmental Protection Agency (EPA), state and local health and environmental agencies, the community, and potentially responsible parties, where appropriate. In addition, this document has previously been provided to EPA and the affected states in an initial release, as required by CERCLA section 104 (i)(6)(H) for their information and review. The revised document was released for a 60-day public comment period. Subsequent to the public comment period, ATSDR’s Cooperative Agreement Partner addressed all public comments and revised or appended the document as appropriate. The public health assessment has now been reissued. This concludes the public health assessment process for this site, unless additional information is obtained by ATSDR’s Cooperative Agreement Partner which, in the agency’s opinion, indicates a need to revise or append the conclusions previously issued. Use of trade names is for identification only and does not constitute endorsement by the U.S. Department of Health and Human Services. Additional copies of this report are available from:
National Technical Information Service, Springfield, Virginia (703) 605-6000
You May Contact ATSDR Toll Free at 1-800-CDC-INFO
or Visit our Home Page at: http://www.atsdr.cdc.gov

Kalamazoo River Enbridge Oil Spill
Final Release
PUBLIC HEALTH ASSESSMENT
Evaluation of Air Contamination
KALAMAZOO RIVER ENBRIDGE OIL SPILL
CALHOUN AND KALAMAZOO COUNTIES, MICHIGAN
Prepared by:
Michigan Department of Community Health Under Cooperative Agreement with the
U.S. Department of Health and Human Services Agency for Toxic Substances and Disease Registry

i
Table of Contents Summary........................................................................................................................................ 1
Purpose and Health Issues ........................................................................................................... 2
Background ................................................................................................................................... 2
Characterization and Composition of the Spilled Oil ................................................................. 4 Air Monitoring and Sampling Methods ...................................................................................... 4 Human Health Screening Levels................................................................................................. 6
Community Health Concerns .................................................................................................... 10
Discussion..................................................................................................................................... 11
Environmental Contamination .................................................................................................. 11 Air Monitoring and Sampling Results .................................................................................. 13
Total Volatile Organic Compounds (VOCs) .................................................................... 13 Hydrogen Sulfide (H2S) .................................................................................................... 13 Benzene ............................................................................................................................. 14
Colorimetric Instruments .............................................................................................. 14 Real-Time Monitoring for Benzene .............................................................................. 14 Air Sampling for Benzene............................................................................................. 16
Individual VOCs Measured in Air Samples ..................................................................... 16 Exposure Pathways Analysis .................................................................................................... 17 Toxicological Evaluation .......................................................................................................... 17
VOCs..................................................................................................................................... 18 Hydrogen Sulfide .................................................................................................................. 18 Benzene ................................................................................................................................. 18 Odors ..................................................................................................................................... 21
Children’s Health Considerations ............................................................................................. 22
Limitations ................................................................................................................................... 22
Conclusions .................................................................................................................................. 23
Recommendations ....................................................................................................................... 23
Public Health Action Plan .......................................................................................................... 23
Report Preparation ..................................................................................................................... 24
References .................................................................................................................................... 25
List of Figures Figure 1. Overview of the areas of Talmadge Creek and the Kalamazoo River impacted by the
July 2010 oil spill, Calhoun and Kalamazoo Counties, Michigan (EPA 2014). ......................... 3 Figure 2. Decision tree for evacuation decisions based on benzene levels, Kalamazoo River oil
spill, July 2010, Calhoun County, Michigan. .............................................................................. 8 Figure 3. Decision tree for re-occupancy decisions based on benzene levels, Kalamazoo River oil
spill, July 2010, Calhoun County, Michigan. .............................................................................. 9

ii
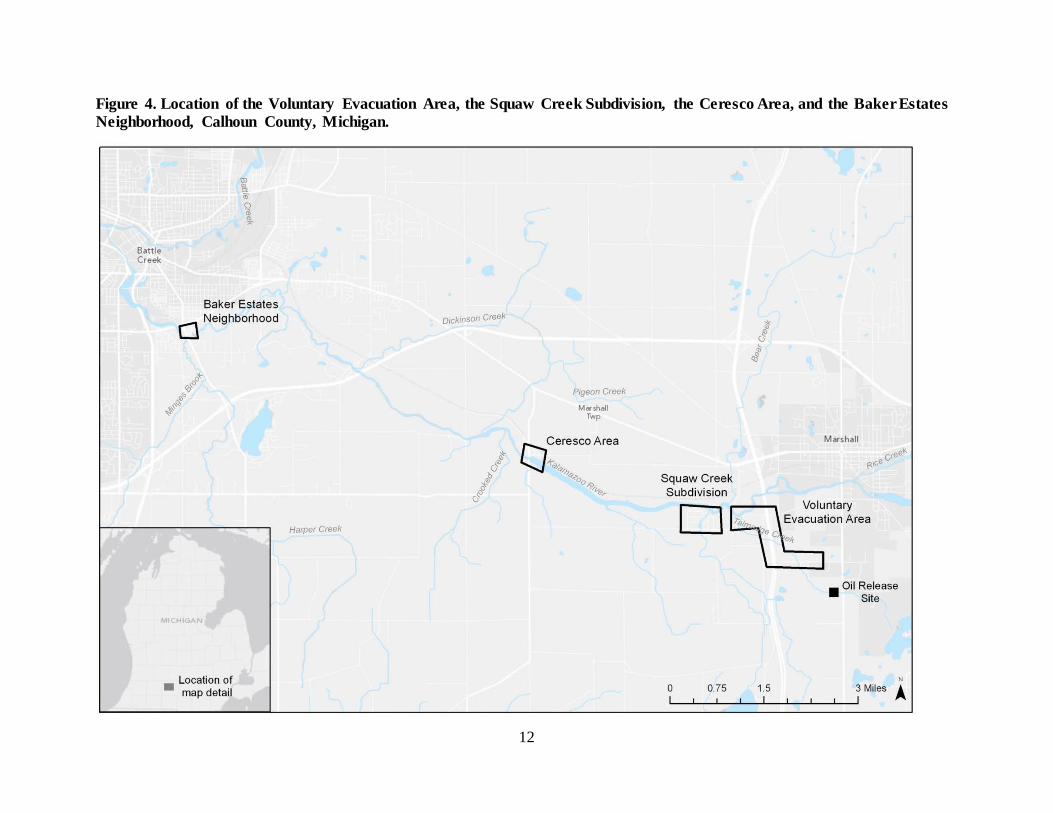
Figure 4. Location of the Voluntary Evacuation Area, the Squaw Creek Subdivision, the Ceresco Area, and the Baker Estates Neighborhood, Calhoun County, Michigan. ................................ 12
List of Tables
Table 1. United States Environmental Protection Agency Acute Exposure Guideline Levels (AEGLs) for benzene in parts per billion (ppb). ......................................................................... 6
Table 2. Exposure pathway for oil-related air contaminants for people visiting, living in, or working in the Enbridge Oil Spill Area, Calhoun County, Michigan. ...................................... 17
Table A-1. 2010 Enbridge Oil Spill Human Health Air Screening Levels August 13, 2010 ..... A-1 Table A-2. 2011 Enbridge Oil Spill Human Health Air Screening Levels August 31, 2011 ..... A-3 Table B-1. Total volatile organic compound (VOC) concentrations in parts per billion (ppb)
measured in 2010 and 2011 with real-time monitors (Calhoun County, Michigan). .............. B-1 Table B-2. Total volatile organic compounds (VOCs) concentrations measured with unidentified
instruments from July 26, 2010 to December 31, 2011 (Calhoun County, Michigan). .......... B-2 Table B-3. Hydrogen sulfide (H2S) concentrations in parts per billion (ppb) measured in 2010
and 2011 with real-time monitors (Calhoun County, Michigan). ........................................... B-3 Table B-4. Hydrogen sulfide (H2S) concentrations measured with unidentified instruments from
July 26, 2010 to December 31, 2011, (Calhoun County, Michigan)....................................... B-4 Table B-5. Benzene air concentrations in parts per billion (ppb) measured in 2010 with Draeger
and GASTEC instruments (Calhoun County, Michigan). ...................................................... B-5 Table B-6. Benzene concentrations in parts per billion (ppb) measured in 2010 with UltraRAE
and Hazardous Air Pollutants on Site (HAPSITE) monitors (Calhoun County, Michigan). .. B-6 Table B-7. Benzene concentrations in parts per billion (ppb) measured with unidentified
instruments from July 26, 2010 to December 31, 2011 (Calhoun County, Michigan). .......... B-7 Table B-8. Benzene concentrations in parts per billion (ppb) in “grab” air samples (Calhoun
County, Michigan)................................................................................................................... B-8 Table B-9. Benzene concentrations in parts per billion (ppb) in time-integrated air samples
(Calhoun County, Michigan). .................................................................................................. B-9 Table B-10. Volatile organic compound (VOC) concentrations in parts per billion (ppb) in
“grab” air samples collected from July 26 through July 28, 2010, in the Voluntary Evacuation Area (Calhoun County, Michigan). ....................................................................................... B-10
Table B-11. Volatile organic compound (VOC) concentrations in parts per billion (ppb) in “grab” air samples in the Voluntary Evacuation Period (July 29 through August 17, 2010), Calhoun County, Michigan. .................................................................................................. B-11
Table B-12. Volatile organic compound (VOC) concentrations in parts per billion (ppb) in time-integrated air samples in the Voluntary Evacuation Period (July 29 through August 17, 2010), Calhoun County, Michigan. .................................................................................................. B-12
Table B-13. Volatile organic compound (VOC) concentrations in parts per billion (ppb) in “grab” air samples collected in the Post Evacuation period (Aug 18 to Dec 31, 2010), Calhoun County, Michigan. ................................................................................................................. B-14
Table B-14. Volatile organic compound (VOC) concentrations in parts per billion (ppb) in time-integrated air samples in the Post Evacuation period (Aug 18 to Dec 31, 2010), Calhoun County, Michigan. ................................................................................................................. B-15
Table B-15. Volatile organic compound (VOC) concentrations in parts per billion (ppb) in “grab” air samples collected in 2011, Calhoun County, Michigan. ...................................... B-16

iii
Table B-16. Volatile organic compound (VOC) concentrations in parts per billion (ppb) in time-integrated air samples in 2011, Calhoun County, Michigan. ................................................ B-17
Table B-17. Volatile organic compound (VOC) concentrations in parts per billion (ppb) in time-integrated air samples in 2012, Calhoun County, Michigan. ................................................ B-19
List of Appendices
Appendix A: Human Health Screening Levels........................................................................... A-1 Appendix B: Air Monitoring and Sampling Data ....................................................................... B-1 Appendix C: Public Comment Responsiveness Summary ......................................................... C-1

iv
Foreword The Michigan Department of Community Health (MDCH) conducted this evaluation under a cooperative agreement with the federal Agency for Toxic Substances and Disease Registry (ATSDR). ATSDR conducts public health activities (assessments/consultations, advisories, education) at sites of environmental contamination. The purpose of this document is to identify potentially harmful exposures and actions to minimize those exposures. This is not a regulatory document and does not evaluate or confirm compliance with laws. This is a publicly available document that is provided to the appropriate regulatory agencies for their consideration. The following steps are necessary to conduct public health assessments/consultations:
• Evaluating exposure: MDCH toxicologists begin by reviewing available information about environmental conditions at the site: how much contamination is present, where it is found on the site, and how people might be exposed to it. This process requires the measurement of chemicals in air, water, soil, or animals. Usually, MDCH does not collect its own environmental sampling data. We rely on information provided by the Michigan Department of Environmental Quality (MDEQ), U.S. Environmental Protection Agency (EPA), and other government agencies, businesses, and the general public.
• Evaluating health effects: If there is evidence that people have been or are being exposed – or could be exposed – to hazardous substances, MDCH toxicologists then determine whether that exposure could be harmful to human health, using existing scientific information. The report focuses on public health – the health impact on the community as a whole.
• Developing recommendations: In its report, MDCH outlines conclusions regarding any potential health threat posed by a site, and offers recommendations for reducing or eliminating human exposure to contaminants. If there is an immediate health threat, MDCH will issue a public health advisory warning people of the danger, and will work with the appropriate agencies to resolve the problem.
• Soliciting community input: The evaluation process is interactive. MDCH solicits and considers information from various government agencies, parties responsible for the site, and the community. If you have any questions or comments about this report, we encourage you to contact us.
Please write to: Toxicology and Response Section Division of Environmental Health Michigan Department of Community Health PO Box 30195 Lansing, MI 48909
Or call us at: 1-800-648-6942 (toll free) For more information, please visit: www.michigan.gov/mdch-toxics

v
Acronyms and Abbreviations AEGL Acute Exposure Guideline Levels ATSDR Agency for Toxic Substances and Disease Registry CCPHD Calhoun County Public Health Department CNS central nervous system CO carbon monoxide CREG Cancer Risk Evaluation Guide CST National Guard 51st Civil Support Team CTEH Center for Toxicology and Environmental Health, L.L.C. Enbridge Enbridge Incorporated EPA United States Environmental Protection Agency ERT EPA Environmental Response Team GASTEC Gas Detector Tube HAPSITE Hazardous Air Pollutants on Site H2S hydrogen sulfide ICS Incident Command System KCHCS Kalamazoo County Health and Community Services Department kg kilograms LEL Lower Explosive Limit MDCH Michigan Department of Community Health MDEQ Michigan Department of Environmental Quality MDNRE Michigan Department of Natural Resources and Environment MRL Minimal Risk Level mg milligrams ND not detected PCC Michigan Poison Control Center PHA Public Health Assessment ppb parts per billion RfC Reference Concentration RSL EPA Regional Screening Level START Superfund Technical Assessment and Response Team US DOT United States Department of Transportation VOCs volatile organic compounds WESTON Weston Solutions, Inc.

1
Summary
In response to the July 2010 Enbridge oil spill to the Kalamazoo River, government agencies and environmental contractors conducted air monitoring and sampling to evaluate the public health hazards of breathing the air near the spill. Hand-held monitors were used to give real-time information about levels of contaminants in the air, including benzene. Air samples were collected and analyzed for a wide range of oil-related chemicals. The Michigan Department of Community Health (MDCH)1 evaluated the air data during the emergency response to the spill and continues to evaluate additional data collected during the on-going cleanup of the spilled oil. This public health assessment summarizes the results of the air monitoring and sampling efforts conducted from July 2010 through 2012. Air monitoring and sampling continues where cleanup work is on-going to ensure that people are protected. MDCH has reached the following conclusions about chemical levels in air following the July 2010 Enbridge oil spill:
1: People in the spill area who breathed oil-related chemicals in the air from the time of the spill to August 18, 2010, reported short term (temporary) health effects including: headaches, nausea, respiratory discomfort, and eye irritation. These short term effects diminished or stopped when people were no longer breathing air containing oil-related chemicals. Some individuals may have experienced anxiety related to the event, regardless of their exposure.
2. People are not expected to have long term, more serious health effects as a result of breathing the oil-related chemicals. By August 18, 2010, air concentrations of oil-related chemicals fell below human health screening levels that protect everyone from long term health effects including sensitive people such as children, the elderly, and those with pre-existing illnesses. Therefore, people living in the spill area did not breathe oil-related chemicals long enough or at levels high enough to cause long term health effects. 3. People are not expected to have health effects as a result of breathing the air near the work areas where oil recovery and cleanup activities were ongoing in 2011 and 2012. Air concentrations of benzene in 2011 and 2012 did not exceed the health-based screening level. No other oil-related chemical was consistently found in 2011 or 2012 at concentrations exceeding the human health screening levels.
MDCH’s conclusions do not apply to workers who took part in the oil recovery and cleanup activities. The data that MDCH reviewed to reach these conclusions was gathered to evaluate the levels of oil-related chemicals that people living in the spill area might have breathed. These data may not represent the air levels of oil-related chemicals inside the work areas.
Next steps: As cleanup of the spill area continues, MDCH will evaluate air monitoring and sampling data to ensure that chemical levels in air do not cause a risk to public health. 1 Note as of April 2015, MDCH merged with the Michigan Department of Human Service to become the Michigan Department of Health and Human Services. This document was prepared before that merger and will retain use of MDCH as the agency name.

2
Purpose and Health Issues
Beginning on July 26, 2010, federal and state agencies and environmental contractors conducted air monitoring and sampling to evaluate the public health hazards of breathing the air near the Enbridge oil spill to the Kalamazoo River. This Draft Public Health Assessment for Public Comment summarizes the air monitoring and sampling data gathered to evaluate the public health hazards of breathing the chemicals emitted from the spilled oil. This document does not address the risks to workers who took part in oil recovery and cleanup activities.
Background
On the evening of July 25, 2010, a section of a 30-inch-diameter pipeline owned and operated by Enbridge Incorporated (Enbridge) broke in a wetland adjacent to Talmadge Creek in Marshall (Calhoun County), Michigan. The break resulted in the spill of an estimated 843,000 gallons of a crude oil mixture into Talmadge Creek and the Kalamazoo River (NTSB 2012). The United States Environmental Protection Agency (EPA) assumed the leadership of the response to the spill and a Command Center was established in Calhoun County using guidelines of the Incident Command System (ICS). Members of the ICS Unified Command included Enbridge, the EPA, the Michigan Department of Natural Resources and Environment2 (MDNRE), the Michigan State Police Emergency Management Division, the Calhoun County Public Health Department (CCPHD), Calhoun County Emergency Management, the Kalamazoo County Sheriff, and the city of Battle Creek. At the request of the EPA Incident Commander and the Calhoun County Health Officer, MDCH staff deployed to the Command Center on July 27, 2010, to provide public health support. Agency for Toxic Substances and Disease Registry (ATSDR) Region 5 staff joined MDCH at the Command Center later that week. At the time of the spill, Talmadge Creek and the Kalamazoo River were between 25- and 50-year flood levels due to the heavy rain that had fallen in the previous days. Because the river and creek were at high water levels, oil flowed into floodplains, riverbanks (overbank areas), and wetlands. The oil was eventually contained nearly 40 miles downriver from the spill site at Morrow Lake in nearby Kalamazoo County, about 80 miles east from where the Kalamazoo River flows into Lake Michigan. In the emergency response that followed the spill, the affected areas of the creek and river were divided into five segments designated by the letters A through E as shown in Figure 1. As the response changed over time to longer term cleanup activities, quarter-mile markers were used to identify work areas beginning at the spill area and continuing down Talmadge Creek and the Kalamazoo River. Mile markers are used in this document to identify areas under discussion. The Kalamazoo River is bordered by a variety of land uses including marshland and farmland, as well as residential and commercial properties. The river passes through several residential communities, the city of Battle Creek and many smaller towns before reaching Morrow Lake. Approximately 41,500 people are estimated to live within one mile of the nearly 40-mile affected stretch of the Kalamazoo River. 2 Effective March 13, 2011, the MDNRE was split into two state agencies. The Michigan Department of Environmental Quality (MDEQ) assumed responsibility for the continued response to the Kalamazoo River oil spill.

3
Figure 1. Overview of the areas of Talmadge Creek and the Kalamazoo River impacted by the July 2010 oil spill, Calhoun and Kalamazoo Counties, Michigan (EPA 2014).

4
Characterization and Composition of the Spilled Oil The broken pipeline was part of Line 6B of Enbridge’s Lakehead System that transports both heavy and medium crude oil from Griffith, Indiana to Sarnia, Ontario (Enbridge 2011). Crude oil is a complex mix of hydrocarbons, which are organic molecules made of hydrogen and carbon atoms. It may also contain small amounts of nitrogen, oxygen, and sulfur compounds and trace amounts of metals. At the time of the spill, the pipeline was carrying a mixture of 50 to 70 percent heavy crude oil, and 30 to 50 percent hydrocarbon diluent that was estimated to contain up to one percent benzene and less than 0.5 percent hydrogen sulfide (NTSB 2012). The diluent is added to the heavy crude to allow it to flow through the pipeline. The mixture is sometimes called diluted bitumen. Two kinds of oil were in the pipeline when it broke: Western Canadian Select crude and Cold Lake Blend crude (NTSB 2012). Samples of the oil/diluent mixture taken from the pipeline and analyzed at the MDNRE Environmental Laboratory confirmed the chemical composition of the oil and diluent mixture. Only chemicals expected to be in petroleum were found in the samples (MDNRE 2010). The United Nations’ Committee of Experts on the Transport of Dangerous Goods identification number for Western Canadian Select and Cold Lake Blend crude oils is 1267: a generic identification number for petroleum crude oil. The United States Department of Transportation (US DOT) Emergency Response Guidebook recommendations for handling spills of products with this identification number are provided in Guide 128 for Flammable Liquids (Non-Polar/Water-Immiscible) and include isolation of the spill or leak area for at least 50 meters (150 feet) in all directions and elimination of any ignition sources. Following a large spill, Guide 128 suggests that emergency response personnel, “Consider initial downwind evacuation for at least 300 meters (1000 feet)” (US DOT 2008). There is no requirement for an immediate mandatory evacuation.
Air Monitoring and Sampling Methods At the request of the EPA, the Weston Solutions, Inc. (WESTON) Superfund Technical Assessment and Response Team (START) began air monitoring and sampling activities in the area of the spill on July 26, 2010. Initial efforts were focused in the vicinity of the city of Marshall and the village of Ceresco (approximately six miles downstream from the spill site) and were rapidly expanded to include other populated areas further downstream including the city of Battle Creek. In emergency situations, air monitoring is conducted with hand-held instruments that give an immediate or “real-time” reading of the level of contaminants in the air. Each of the instruments currently available has its own advantages and limitations. The greatest advantage of all these instruments is that they provide immediate information about the level of hazardous contaminants in air. Monitoring data collected with real-time instruments are only brief snapshots in time and do not represent the levels of contaminants that people could have breathed throughout a day or longer time period. Initially, START used MultiRAE five-gas meters that measure total volatile organic compounds (VOCs), hydrogen sulfide (H2S), carbon monoxide (CO), percent oxygen, and combustible gas

5
as the percent of the lower explosive limit (Weston 2011). The lower explosive limit (LEL) is the air level below which chemical vapors are not likely to explode. Ten percent (10 %) of the LEL is typically used as a protective screening level. START did not detect combustible gas at air concentrations above or approaching the LEL screening level. All measured oxygen and carbon monoxide concentrations were within normal limits. EPA also instructed START to specifically monitor the air for the chemical benzene because it is the most toxic of the VOCs that could be released from the oil that was spilled from the Enbridge pipeline. START initially measured benzene in air using colorimetric instruments such as Draeger tubes or the Draeger Chip Measurement System, which can detect benzene beginning at 50 to 500 parts per billion (ppb) depending on which tube or chip is used. GASTEC Color Dosimeter Tubes, which are similar to Draeger tubes and can detect benzene as low as 500 ppb, were used by Enbridge contractors to provide instantaneous measurements of benzene. START also used UltraRAE hand-held monitors to measure levels of benzene in air (as low as 100 ppb) and began collecting Summa and Tedlar bag air samples for laboratory analysis (Weston 2011). On July 27, 2010, the State of Michigan requested that the National Guard 51st Civil Support Team (CST), located at Fort Custer, Kalamazoo County, be deployed to provide resources and instrumentation to support air monitoring and sampling efforts. The CST used mobile field gas chromatograph monitors called HAPSITEs (Hazardous Air Pollutants on Site) that provide very accurate real-time measurements of benzene levels in air. On July 27, 2010, the Center for Toxicology and Environmental Health, L.L.C. (CTEH) arrived under contract with Enbridge to conduct air monitoring and sampling activities in response to the spill. Air samples, collected into Summa canisters, mini-cans or Tedlar bags, provide more accurate measurements of the levels of contaminants in air than can be obtained with real-time hand-held monitors. Air samples collected over several hours in stainless steel Summa canisters are called “time-integrated” samples. The canisters are processed to be chemically inert and the air is evacuated so that the canister is under vacuum. A regulator is attached that allows air to slowly collect in the canister over time, usually a 24- or 8-hour period. The canisters are then sent to a laboratory for chemical analysis3, which provides the average air contaminant concentration over the sample time. In emergencies like the Kalamazoo River oil spill, Summa canister results can be available in as little as 24 hours after collection of the sample. Tedlar bags and mini-cans can be used to collect a representative “grab” sample of air that is then analyzed with laboratory equipment. The EPA Environmental Response Team (ERT) mobile laboratory was mobilized to Marshall following the oil spill to analyze Tedlar bag samples and was functional by August 2, 2010. The laboratory consisted of a gas chromatograph capable of measuring benzene in air samples at levels as low as one ppb.
3 Air samples were collected and analyzed following EPA Method TO-15 for volatile organic compounds available at http://www.epa.gov/ttnamti1/files/ambient/airtox/to-15r.pdf.

6
Human Health Screening Levels The risk of health effects from chemicals in air depends on who is breathing that chemical and for how long, as well as the toxicity of the chemical. MDCH considered all these factors in choosing health protective screening levels to evaluate the risk of harm to people breathing the chemicals coming from the oil spilled from the Enbridge pipeline. The spilled oil contained many VOCs, including up to one percent benzene. Because benzene is the most toxic of the VOCs that could have been released to the air, monitoring efforts were focused on this chemical in the emergency response to the spill. MDCH first compared levels of benzene in the air to the Acute Exposure Guideline Levels (AEGLs) developed by the EPA (EPA 2009). AEGLs are used to evaluate the human health hazards of breathing chemicals for short periods of time ranging from 10 minutes to eight hours. As the exposure time increases from minutes to hours, the chance of harm also increases; therefore the acceptable level in air is lower for longer time periods. AEGLs are developed to be protective for most people including sensitive sub-populations such as children, the elderly, or those with existing health conditions. AEGLs for benzene are available for three categories of health hazards: AEGL-1: the benzene level above which most people have discomfort, irritation, or mild
central nervous system (CNS) effects such as headaches, dizziness and nausea. These effects are not disabling and cease when a person is no longer breathing benzene.
AEGL-2: the benzene level at which people could have serious, long-lasting adverse health effects or an impaired ability to escape. The AEGL-2 for benzene is based on serious CNS effects that could make someone unconsciousness and prevent escape.
AEGL-3: the benzene level at which people could have immediate life-threatening health effects or death.
Table 1. United States Environmental Protection Agency Acute Exposure Guideline Levels (AEGLs) for benzene in parts per billion (ppb) (EPA 2009).
10 minutes 30 minutes 60 minutes 4 hours 8 hours AEGL 1 130,000 73,000 52,000 18,000 9,000 AEGL 2 2,000,000* 1,100,000 800,000 400,000 200,000 AEGL 3 ** 5,600,000* 4,000,000* 2,000,000* 990,000
Available at http://www.epa.gov/oppt/aegl/pubs/results72.htm *AEGL is greater than 10 percent of the Lower Explosive Limit (LEL) of 14,000,000 ppb. **AEGL for 3 to 10 minutes is 9,700,000 ppb.
The chance of explosion must be considered when a calculated health-based screening level is higher than the LEL. Benzene was not measured by air monitoring equipment or in any air sample at levels above 10% of its LEL. Benzene was measured only twice at concentrations exceeding the 8-hour AEGL-1. Since it appeared likely that people could be exposed to benzene in air for more than just 8 hours, MDCH and ATSDR identified health-based screening levels for benzene protective of longer periods of time. MDCH, ATSDR and the CCPHD used these screening levels to develop decision trees to

7
determine when to recommend that people evacuate residential neighborhoods and when people could safely return to their homes. The Evacuation Decision Tree, shown in Figure 2, is divided into three sections that represent high, medium, and low levels of benzene monitored in air. Low levels (6.1 to 60 ppb): These levels require no immediate action beyond continued
monitoring for benzene. Medium levels (61 to 199 ppb): Areas with results within this range were more closely
monitored to determine whether the area should be evacuated. High levels (200 ppb and greater): Monitoring results that showed high levels were
verified by a second test. If the second result was also high, evacuation was recommended. If the second sample result was lower, more monitoring was done before a decision on whether to evacuate was made.
The decision tree also considers the instrument used for air monitoring and recommends additional monitoring if elevated levels are found with less accurate instruments. MDCH and ATSDR identified 60 ppb as an initial screening level below which most people are not harmed by breathing benzene for a short time. MDCH identified 200 ppb as a benzene level at which evacuation should be recommended. This value was based on the Michigan Occupational Safety and Health Administration level of 500 ppb at which workers are required to wear breathing protection (i.e., respirators) (MDLRA 2003). MDCH adjusted the occupational level to 200 ppb to provide added protection for non-workers, including sensitive groups such as children and people with existing medical conditions. MDCH and ATSDR also identified human health screening levels for other VOCs in addition to benzene that are protective for people breathing these chemicals for up to one year (i.e., intermediate or sub-chronic exposure). Appendix A, Table A-1, provides the 2010 Human Health Screening Levels used to evaluate levels of VOCs found in “grab” or time-integrated air samples. MDCH and ATSDR identified screening levels from several sources and used the hierarchy below to choose the most appropriate value for each chemical. The ATSDR Intermediate MRL is the preferred screening level. The Intermediate MRL
is protective of daily human inhalation exposure for up to a year, and is protective for sensitive individuals such as children, the elderly, and those with pre-existing illnesses.
If no Intermediate MRL was available, the screening level is the ATSDR Chronic MRL or the EPA Reference Concentration (RfC). The chronic MRL and the RfC are protective of daily human inhalation exposure over a lifetime, including sensitive individuals.
If none of the above were available, the EPA Regional Screening Level (RSL) is the screening level. The RSLs are protective of daily human inhalation exposure over a lifetime, including sensitive individuals.
If none of the above were available, the MDNRE Air Quality Division, Air Toxics Screening Level is the screening level. The MDNRE screening levels are protective of daily human inhalation exposure over a lifetime, including sensitive individuals.

8
Benzene levels greater than or
equal to 200 ppb (all monitors)
Benzene levels less than 200 ppbv and greater
than 60 ppb (all monitors)
Less than 200 ppb and greater than 60 ppb
Less than or equal to 60 ppb
Verify with HAPSITE analysis if measurement is with Ultra RAE or
GASTEC, if HAPSITE unavailable take 2nd Ultra RAE 1 hour apart.
3 Tedlar bag samples taken approx 12 hours apart
(0, 12, 24hrs)
No immediate action; but continued monitoring is needed
Average of 3 samples greater than 60 ppb
Average of 3 samples less than or equal to 60 ppb
Recommend evacuation
No evacuation; but continued monitoring is needed
Benzene levels less than or equal
to 60 ppb (all monitors)
No immediate action
Greater than or equal to 200 ppb
Recommend evacuation
Any single sample greater than 200 ppb
ppb = parts per billion HAPSITE = Hazardous Air Pollutants on Site (field portable gas chromatograph/mass spectrometer) UltraRAE = a benzene-specific photoionization detector made by RAE Systems
GASTEC = Gas Detector Tubes Tedlar = Tedlar Gas Sampling Bags
Figure 2. Decision tree for evacuation decisions based on benzene levels, Kalamazoo River oil spill, July 2010, Calhoun County, Michigan.

9
In 2011, MDCH further revised the human health screening levels for VOCs to include air screening levels that are protective of people breathing these chemicals for a lifetime (i.e., chronic exposure). The 2011 Human Health Air Screening Levels, provided in Appendix A, Table A-2, were selected using a hierarchy similar to the one above. Figure 3 provides the Re-Occupancy Decision Tree used to evaluate concentrations of benzene in air to determine when people could return to their homes after an evacuation. Re-occupancy was acceptable when levels of benzene in air were below the ATSDR intermediate MRL of 6 ppb. Figure 3. Decision tree for re-occupancy decisions based on benzene levels, Kalamazoo River oil spill, July 2010, Calhoun County, Michigan.
Any reading greater than 6 ppb, restart two days of real-time sampling
2 consecutive days of real-time air monitoring or sampling with Tedlar, HAPSITE, or Summa.
8 hour-24 hour sample (time weighted average)
Greater than 6 ppb, restart 2 days of real-time monitoring
All samples are less than or equal to 6 ppb
Less than or equal to 6 ppb residents can reoccupy
(additional cleanup work in area may result in
recommendation of evacuation)
ppb = parts per billion HAPSITE = Hazardous Air Pollutants on Site (field portable gas chromatograph mass spectrometer) Tedlar = Tedlar Gas Sampling Bags Summa = Summa Canister Samples

10
Community Health Concerns
Beginning at 9:25 pm on July 25, 2010, the Calhoun County 911 dispatch center began receiving numerous calls about strong “natural gas or crude oil” odors. City of Marshall fire department personnel as were sent to investigate, but were not initially able to locate the source of the odors (NTSB 2012). Individuals near Talmadge Creek and the Kalamazoo River also began reporting strong, noxious odors and associated health symptoms in calls to CCPHD and the Michigan Poison Control Center (PCC). Subsequently, citizen calls were routed to a phone hotline provided by Enbridge. Callers reported respiratory, gastrointestinal, and neurological symptoms, predominantly headache and nausea. In response to community concerns, MDCH, CCPHD, and the Kalamazoo County Health and Community Services Department (KCHCS) implemented a public health surveillance system to collect information about the health effects experienced by people who were exposed to the spilled oil and the air contaminants coming from it. The goal of the system was to describe the magnitude and distribution of health effects, so that decision-makers could make informed decisions about actions needed to protect the public. The surveillance system included four parts:
• Under the authority of the Michigan Public Health Code, health care providers were asked to provide reports of patients who were seen due to illness or symptoms associated with oil spill exposure.
• A door-to-door health survey was conducted in August 2010 in four communities along the Talmadge Creek and Kalamazoo River and in one small workplace.
• MDCH received daily counts of self-reported illnesses from the PCC. • MDCH also used its syndromic surveillance system to track the incidence of illnesses in
the affected communities The surveillance system received 147 health care provider reports on 145 patients, identified 320 (58%) of 550 individuals with adverse health effects from four community surveys along the impacted waterways, and tracked 41 calls that were placed to the PCC by the public. Headache, gastrointestinal complaints (e.g., nausea and vomiting), and respiratory symptoms (e.g., breathing difficulty, cough) were the most often reported health symptoms (MDCH 2010). These symptoms are consistent with the published literature regarding the potential health effects of acute exposure to crude oil (Solomon 2010). Some people also reported effects on their skin and eyes, anxiety, and other symptoms such as dizziness, fatigue, and chest pain. Just over 12 percent of people surveyed had seen their doctor because of these effects (MDCH 2010). MDCH provided information to area health care providers to help them recognize symptoms of oil exposure and to provide resources to assist them in caring for their patients. Additional materials were developed by state and local health agencies in cooperation with the EPA. These materials were provided to community members through a variety of means including the internet, public meetings, and local media sources. Health officials also visited the homes of people in some affected neighborhoods to ensure that residents there were kept informed.

11
Discussion
Environmental Contamination The database of information gathered to evaluate the public health hazards of breathing chemicals emitted from the spilled oil includes more than 900,000 individual air contaminant measurements. Real-time monitoring instruments were used to evaluate 19 air parameters, and over 350 different chemicals were measured in the laboratory analysis of air samples. Air monitoring and sampling began on July 26, 2010 and has continued throughout the on-going response to the spill. To better understand how air contaminant concentrations changed over time, MDCH grouped air monitoring and sampling data into five response time frames;
• The Initial Response from July 26 through July 28, 2010 • The Voluntary Evacuation Period from July 29 to August 17, 2010 • The Post Evacuation Period from August 18 to December 31, 2010 • All of 2011 • All of 2012
Some of the monitoring data represent measured concentrations of contaminants in air immediately above pools of spilled oil. No homes were located in Division A (Oil Release Site), where the highest air concentrations were measured. With the exception of the response workers, it is not likely that people breathed these concentrations of air contaminants. Further, many of the air measurements were taken at some distance from the Kalamazoo River to define how far the air contamination had traveled from the spill. These data are also not representative of the levels of contaminants in residential areas closer to the spill. To better understand the levels of air contaminants that people may have breathed following the oil spill, MDCH identified four residential areas closest to the creek and river (Figure 4). The residential area closest to the Oil Release Site is the Voluntary Evacuation Area. This area roughly follows the course of Talmadge Creek to the bridge at 15 Mile Road, just before mile marker 2.25. It includes approximately 60 homes on Division Drive, 16 Mile Road, 15 ½ Mile Road and A Drive North. The other areas selected include: the Squaw Creek Subdivision, which lies between mile marker 2.5 and 3.25 and includes at least 120 homes; the village of Ceresco Area beginning at about mile marker 5.75, which includes more than 80 homes; and the Baker Estates Neighborhood in the city of Battle Creek that lies between mile markers 13.5 and 13.75, and includes about 75 homes (MDCH 2010). It is also important to identify and consider the response activities that were on-going when evaluating whether measured air contaminant levels could have affected people’s health. Active oil recovery and excavation work continued in both the Voluntary Evacuation Area and the Ceresco Area for much of 2010, and periodically in 2011 and 2012. Elevated air contaminant concentrations were sometimes found by work-site and work area-perimeter sampling and monitoring that was conducted to ensure the safety of both workers and nearby neighborhoods. MDCH further evaluated these data to determine if air concentrations during response activities posed a health hazard to people living or working nearby (other than the cleanup response workers).
12
Figure 4. Location of the Voluntary Evacuation Area, the Squaw Creek Subdivision, the Ceresco Area, and the Baker Estates Neighborhood, Calhoun County, Michigan.
13
Air Monitoring and Sampling Results
Total Volatile Organic Compounds (VOCs) There are no human health screening levels for total VOCs because the mixtures (and resulting health effects) of these chemicals in air vary depending on the source and the nature of the release. However, VOC concentrations above 1,000 ppb are an indication of the need for chemical-specific monitoring (NJDHSS 2003). Tables B-1 and B-2 in Appendix B provide the results of air monitoring for total VOCs in response to the Enbridge oil spill. During the Initial Response Period (July 26 to 28, 2010), VOCs air concentrations were highest in the Voluntary Evacuation Area ranging from not detectable up to 120,000 ppb, with about half the measured concentrations higher than 1,000 ppb. VOCs in the Squaw Creek Subdivision and the Ceresco Area were also elevated up to 71,600 ppb and 6,000 ppb respectively, with again about half the measured concentrations higher than 1,000 ppb. No VOCs were detected in the Baker Estates Neighborhood during this time period. During the Evacuation Period (July 29 to August 17, 2010), the highest levels of VOCs increased in the Voluntary Evacuation Area, however only 84 of more than 2,200 measurements were higher than 1,000 ppb. This increase is likely a result of the oil recovery activities that were happening along Talmadge Creek during this time. The highest level of VOCs dropped in the Squaw Creek Subdivision during the Evacuation Period, with just eight of 658 measurements higher than 1,000 ppb. VOC levels in the Ceresco Area also dropped with only two of 467 measurements higher than 1,000 ppb. Levels of VOCs measured in the Baker Estates Neighborhood ranged from not detected to a high of 266,000 ppb, but only three of 556 measurements were higher than 1,000 ppb. In the Post-Evacuation Period (August 18 to December 31, 2010), the highest VOC air concentrations fell to 9,000 ppb in the Voluntary Evacuation Area, with only 18 of 4,277 measurements higher than 1,000 ppb. VOCs were slightly over 1,000 ppb only once in the Squaw Creek Subdivision (of 1,059 measurements) and only once in the Baker Estates Neighborhood (of 767 measurements). Air monitoring in the Ceresco Area was intensive because of oil removal activities taking place there during this time period. Just five VOC concentrations out of 5,149 measured in that area were higher than 1,000 ppb. Total VOCs were not detectable in any of these areas in more than 3,000 measurements taken in 2011. Air monitoring and sampling in 2012 was focused on specific chemicals, rather than monitoring for total VOCs.
Hydrogen Sulfide (H2S) Hydrogen sulfide (H2S) is a natural component of crude oil and natural gas, and can also come from bacterial breakdown of organic matter such as rotting vegetation or animal wastes. The crude oil spilled from the pipeline contained less than 0.5 percent hydrogen sulfide (Cenovus Energy Inc. 2008). Because H2S can cause immediate health effects at low levels, both START and CTEH monitored for this gas throughout the response to the spill. Tables B-3 and B-4 in Appendix B presents measured levels of H2S in the four target areas.

14
On August 8, 2010, START accompanied CTEH to a storage barn near Talmadge Creek. The Enbridge supervisor in charge of oil recovery work at 15 ½ Mile Road and the creek had concerns about his workers’ safety in regards to the contents of the barn, which included many containers (both open and covered) with liquid contents, old vehicles, a tractor and other machinery. Inside the barn, START and CTEH monitored low concentrations of benzene from not detectable to 50 ppb and moderately elevated concentrations of total VOCs (1,300 to 4,200 ppb). Both START and CTEH measured the concentration of H2S inside the pole barn at 5,000 ppb. However, H2S was not detected in air outside the building. Elevated H2S levels were therefore attributed to the contents of the barn, which have since been removed. Table B-3 does not include these data. Levels of H2S slightly above 100 ppb were measured in work zones located in the Voluntary Evacuation Zone during the Evacuation Period. However, these measurements were fleeting. Air temperatures were elevated at the time, with daily readings consistently exceeding 90 degrees Fahrenheit. The monitored levels of H2S may have resulted from disturbed and rotting vegetation along the creek bank.
Benzene Colorimetric Instruments - Table B-5 in Appendix B presents the benzene levels measured using colorimetric instruments. START measured benzene on July 27, 2010, at 3,000 ppb at the confluence of the Talmadge Creek and the Kalamazoo River. The people living in the homes nearest the confluence had already relocated due to the odors from the spilled oil and the general disruption and noise created by the spill response. Benzene was again measured on July 28, 2010, at 9,750 and 10,000 ppb near where Division Drive crosses the Talmadge Creek. However, lower benzene measurements taken at that location or nearby on the same day and in the days after indicated that these high benzene air concentrations were not sustained over time. No-one was living in the immediate vicinity of this monitoring location. START, using colorimetric instruments, measured benzene at 500 ppb once in the Squaw Creek Subdivision and at 250 ppb once in the Ceresco Area during the Initial Response Period and again at 100 ppb in the Ceresco Area during the Voluntary Evacuation Period. Benzene was not detected by colorimetric instruments in any area after August 18, 2010. Real-Time Monitoring for Benzene - Several different hand-held monitors s were used during the oil spill response to monitor benzene levels in air. For this document, MDCH used only benzene levels measured with HAPSITE and UltraRAE monitors because these provide the most accurate and dependable benzene data. Table B-6 in Appendix B presents the benzene concentrations measured using real-time UltraRAE and HAPSITE monitors. Table B-7 presents the benzene concentrations measured with instruments that were not specifically identified. On July 28, 2010, benzene was measured with UltraRAE4 monitors in the Voluntary Evacuation Area at concentrations exceeding the 200 ppb screening level for evacuation. Benzene measurements were highest near containment and collection booms laid across the creek and 4 UltraRAEs measure benzene levels by filtering out other chemicals. Other RAE monitors measure multiple chemicals, and should not be compared to UltraRAE measurements.
15
river as well as near vacuum trucks collecting oil, but were lower away from the river. START, using the Evacuation Decision Tree guidance, collected additional real-time data where initial measurements were high. Most of the benzene concentrations in these additional measurements on July 28, 2010, were between 60 and 200 ppb. Because the capacity to measure benzene in real-time at concentrations less than 60 ppb was not yet available, MDCH advised START to continue UltraRAE monitoring in this area. In addition, START collected a “grab” air sample in a Summa canister placed near where Division Drive crosses the Talmadge Creek. However, the results from this sample were not immediately available because about 24 hours are needed to run the laboratory analysis after the sample is collected. On July 29, 2010, benzene was again measured with UltraRAE monitors in the Voluntary Evacuation Area at concentrations exceeding the screening level for evacuation of 200 ppb. In addition, 200 ppb of benzene was confirmed in the “grab” air sample taken the previous day. Eight of 13 monitoring measurements taken with an UltraRAE in this area in the first three days following the spill were higher than the 60 ppb initial screening level, with benzene concentrations ranging up to 6,250 ppb. This information prompted local and state health officials to recommend that people living in this area leave their homes until it could be determined that air concentrations of benzene were at safe levels. UltraRAE monitors continued to measure benzene at levels up to 2,200 ppb throughout the Evacuation Period, which ended on August 17, 2010. However, benzene measurements taken with the HAPSITEs did not exceed the initial screening level and were far lower than those taken with UltraRAE monitors. All HAPSITE measurements were below the benzene screening level of 60 ppb. Benzene concentrations measured by real-time monitors in the Squaw Creek Subdivision were not greater than the 60 ppb screening level at any time in 2010. However, many people chose to leave because of the strong petroleum odors coming from the spilled oil. From July 26 through August 17, 2010, benzene concentrations of 200 to 500 ppb were measured with real-time monitors in the Ceresco Area in three of 278 measurements. However, additional monitoring on the same days suggested that these concentrations were not sustained and all other benzene measurements were below the initial screening level of 60 ppb. Therefore, no evacuation was recommended for the Ceresco Area. Benzene concentrations were higher than 6 ppb in 10 of the 3,704 real-time measurements taken in the Ceresco Area after August 18, 2010. MDCH evaluated each of these measurements separately to better understand the surrounding circumstances. Each elevated benzene concentration was measured by monitors located either in a work area or at the perimeter of a work area. Benzene concentrations measured by monitors located away from work areas and closer to residential homes were lower than 6 ppb. Benzene concentrations monitored at the Baker Estates Neighborhood were higher than the initial screening level of 60 ppb in only one of 265 measurements taken before August 18, 2010, and were not detectable in 304 additional measurements that year. Therefore, no evacuation was recommended for the Baker Estates Neighborhood.

16
Air Sampling for Benzene – Air samples, including Summa canister, mini can, and Tedlar bag samples, were collected for laboratory analysis beginning on July 28, 2010. Air samples were collected over varying time periods, ranging from a “grab” sample of just a few minutes up to a time-integrated sample of 24 hours. Table B-8 in Appendix B presents the benzene levels measured in “grab” air samples. Of the approximately 1,200 “grab” air samples collected, benzene was detected in just 29 and only 11 showed concentrations above the intermediate human health screening level of 6 ppb that is protective of up to one year of exposure. Benzene was measured above the screening level for evacuation of 200 ppb in the Voluntary Evacuation Area once during the Initial Response (July 28, 2010) and once during the Evacuation Period (August 4, 2010). Benzene concentrations above 6 ppb were measured in four “grab” air samples collected during the Post Evacuation Period as described below:
• The benzene concentration was 190 ppb in one sample collected on October 15, 2010, in a work area near Talmadge Creek adjacent to the Voluntary Evacuation Area. The other 18 air samples collected there on the same day did not detect benzene over the screening level.
• The benzene concentration was 8.4 ppb in one sample collected on October 4, 2010, from
the Squaw Creek Subdivision. Benzene was not detected in a second sample collected from the same location on the same day. Additionally, benzene was not detected in the three samples collected from that location on the next day (October 5, 2010).
• The benzene concentration was 20 ppb in two “grab” samples collected from the Baker Estates Neighborhood on two days: August 26, 2010 and October 7, 2010. No benzene was detected in time-integrated samples collected on the same day and location as the “grab” samples. Also, benzene was not detected in samples collected before (August 25 and October 6, 2010) and after (August 27 and October 8, 2010) these days.
Table B-9 in Appendix B presents the benzene concentrations in time-integrated air samples. No time-integrated air samples were collected during the Initial Response from July 26 through July 28, 2010. Of the 181 time-integrated samples collected from July 29 to August 17, 2010, benzene was detected in 14 samples from the Voluntary Evacuation Zone, with three sample concentrations exceeding the screening level of 6 ppb. Benzene concentrations did not exceed the screening level in any other time-integrated sample collected in 2010. Benzene was detected in three of 483 time-integrated samples collected in the Ceresco Area in 2011, but measured concentrations did not exceed 6 ppb. Benzene was not detected in any time-integrated air sample collected in this area in 2012.
Individual VOCs Measured in Air Samples In addition to benzene, many individual VOCs were measured in both “grab” air samples and time-integrated air samples. Tables B-10 through B-17 in Appendix B present the VOC concentrations in air samples collected in the four study areas from July 26, 2010, through the end of 2012. Other than benzene, 12 VOCs were measured at concentrations over their

17
respective screening levels in air samples collected in 2010 and 2011, and most of these were found in the Voluntary Evacuation Area before August 18, 2010. Chemical concentrations higher than screening levels were found in only 31 out of 120,166 separate laboratory analyses. No measured VOC concentration was greater than its chemical-specific screening level in any air sample collected in 2012. Exposure Pathways Analysis There are five parts or elements of an exposure pathway to consider when deciding if a person may be exposed to a chemical: (1) where is the chemical coming from (the source), (2) what in the environment has been contaminated (environmental medium), (3) is there a place where people might come into contact with the chemical (exposure point), (4) how might people come into contact with the chemical (exposure route), and (5) who might be exposed (exposed population). An exposure pathway is complete if it is expected or there is proof that all five of these elements are present. Table 2 describes the exposure pathway for human exposure to chemicals in air as a result of the Enbridge oil spill.
Table 2. Exposure pathway for oil-related air contaminants for people visiting, living in, or working in the Enbridge Oil Spill Area, Calhoun and Kalamazoo Counties, Michigan.
Source Environmental Medium Exposure Point Exposure
Route Exposed
Population Time
Frame Exposure Pathway
Enbridge crude oil
spill. Air
Talmadge Creek and the
Kalamazoo River Vicinity
Inhalation
People visiting, living in and
working in the target areas.
Past
Complete
Present
Incomplete
Future
Incomplete
Toxicological Evaluation
Chemical contaminants in the air can cause harm directly to respiratory tissues or the chemicals may be absorbed through the lungs and cause harm in other body tissues. Direct harm to respiratory tissues, such as irritation and burning of the nose and lungs, is mostly dependent on the characteristics of the chemical and how much of it is in the air. For chemicals that are absorbed through the lungs and cause harm in other parts of the body, the degree of harm is also determined by how the chemical interacts with the respiratory tissues. Animal studies are useful to identify levels of air contaminants that may cause health effects, but how a chemical interacts with respiratory tissues is often different in people compared to test animals. Air concentrations identified as being without health effects in animal studies must therefore be adjusted to a human equivalent concentration that is unlikely to cause health effects in people. The human equivalent concentration is then divided by uncertainty factors to lower it to a level that is protective of all people, including sensitive groups such as children, the elderly, and people with existing medical conditions.

18
VOCs Air monitoring conducted after the Enbridge oil spill found elevated concentrations of total VOCs. There are no health-based air screening levels for total VOCs or for many of the individual VOCs that could be emitted from the complex mixture of hydrocarbons in crude oil. Air monitoring for total VOCs following the Enbridge oil spill indicated that concentrations were elevated and, therefore, chemical-specific monitoring and sampling was conducted. People who breathe air that contains VOCs for a short time may have eye and respiratory tract irritation, headaches, dizziness, visual disorders, fatigue, loss of coordination, allergic skin reactions, nausea, and memory impairment. These effects stop when a person is no longer breathing the contaminated air. People who have existing health problems like asthma, children and the elderly may be more sensitive to the effects of breathing VOCs (EPA 2013). Between July 26 and September 4, 2010, people who breathed the VOCs in the air following the Enbridge oil spill reported headache, gastrointestinal complaints, respiratory symptoms, effects on their skin and eyes, anxiety, and other symptoms such as dizziness, fatigue, and chest pain (MDCH 2010). No clear relationship has been defined for total VOCs air concentrations and health effects. Most people’s perception of odors, and the related discomfort, increases as the concentration of total VOCs increase. From July 26th to the end of 2010, concentrations of VOCs fluctuated from undetectable to 568,000 ppb, with the highest levels in the Initial Response and the Evacuation Period that ended on August 17, 2010. VOC concentrations in the air likely increased during and in the vicinity of oil recovery activities such as vacuuming oil from the surface of the river or excavation of oil-contaminated soil and sediment. However, after August 18, 2010, VOC concentrations fell dramatically (Tables B-1 and B-2 in Appendix B) and no individual VOC was consistently found at concentrations exceeding the human health-based screening levels (Tables B-10 through B-17 in Appendix B).
Hydrogen Sulfide Hydrogen sulfide has the characteristic odor of rotten eggs and most people can smell it at very low levels in air. Hydrogen sulfide in air is irritating to the membranes of the eye and respiratory tract and can cause pulmonary edema and nasal lesions if people breathe in high levels over time. At very high air levels, hydrogen sulfide causes “olfactory fatigue,” meaning people stop smelling it and do not realize they are breathing levels that can cause asphyxiation. Hydrogen sulfide does not build up in the body (ATSDR 2006). Hydrogen sulfide concentrations slightly above the detection limit of 100 ppb were measured in work zones located in the Voluntary Evacuation Area during the Voluntary Evacuation Period (Tables B-3 and B-4 in Appendix B). However, these were fleeting and there were no reported effects to workers. People living or working in the vicinity of the oil spill, other than response workers, were not likely to have health effects from breathing H2S in air as a result of the oil spill.
Benzene Benzene is emitted to the air from burning coal and oil, gasoline vapors at gasoline service stations, motor vehicle exhaust, cigarette smoke, wood-burning fires, and spills of gasoline or
19
other petroleum-based products. Pure benzene is a clear, colorless, flammable liquid with a gasoline- like odor. Most people cannot smell benzene until it reaches concentrations of 60,000 ppb or more. Benzene evaporates very quickly into air, where it can react with other chemicals and break down within a few days (ATSDR 2007). People breathe small amounts of benzene every day, mostly in areas with heavy traffic and around gas stations. Urban and industrial areas generally have higher levels of benzene in the outdoor air than rural areas. In 2010, the MDEQ reported average outdoor air levels of benzene in the Michigan cities of Dearborn and Detroit of 0.29 to 0.36 ppb respectively, with maximum values of 0.80 to 1.44 ppb (MDEQ 2010). People can be exposed to higher than background levels of benzene if they live near manufacturing or waste sites, or near leaking gasoline storage tanks (ATSDR 2007). Benzene is also a common indoor air pollutant and levels indoors can be higher than in outdoor air (ATSDR 2007). Sources include cigarette smoke; exhaust from motor vehicles or products stored in attached garages; smoke from wood burning fires; and some household products that contain petroleum-based chemicals such as glues, paints, furniture wax, and lubricants. Levels of benzene measured in the air of homes where no one smoked have been reported to average from 1 to 2 ppb. Benzene levels in the air of homes with smokers averaged 1.7 to 3.3 ppb with a maximum level measured at 8.4 ppb (ATSDR 2007). When people breathe benzene, it passes through the lining of the lungs into the bloodstream. Benzene is metabolized in the liver and bone marrow, and may be temporarily stored in bone marrow or fat. Benzene is mostly excreted in urine within 48 hours of exposure, therefore it is not likely to accumulate (build up) in the body (ATSDR 2007). People who breathe high levels of benzene for a short time can have effects such as sleepiness, dizziness, headaches, vertigo (a feeling of movement when one is actually still), tremor, nausea, delirium and loss of consciousness. These effects disappear when the exposure to benzene stops (ATSDR 2007). The air concentrations of benzene measured with Draeger and GASTEC instruments on July 28, 2010, in the Voluntary Evacuation Zone were higher than the EPA (8-hour) AEGL-1 of 9,000 ppb. The AEGL-1 is a benzene level above which most people have discomfort, irritation, or mild central nervous system (CNS) effects such as headaches, dizziness and nausea. These effects stop when a person is no longer breathing benzene. Benzene concentrations in air did not exceed the EPA AEGL-2 and AEGL-3 levels protective of more serious health effects. People who breathe lower concentrations of benzene for a longer time can have harmful effects to their ability to fight infection and make blood cells, which may cause excessive bleeding and anemia. Depending on the concentration and how long a person breathes the benzene, these effects are likely reversible when the exposure stops. People who work at jobs that make or use benzene or products that contain benzene may consistently breathe elevated levels of benzene for many months or years. Workplace exposure has been shown to reduce the numbers of blood cells (red, white and platelets) made in the blood-forming (hematopoietic) cells in red bone marrow in the vertebrae, sternum, ribs and pelvis. Aplastic anemia is a more severe effect of breathing high
20
levels of benzene and happens when the red bone marrow stops making any blood cells. People exposed to benzene at their jobs have also had adverse effects to their immune system that harmed their ability to fight disease (ATSDR 2007). The ATSDR used a well-conducted study of workers to identify an MRL for chronic (lifetime) exposure to benzene in air. In this study, benzene was measured using personal vapor monitors. The workers had been employed at their jobs for an average of more than six years. The workers were grouped as controls (<40 ppb), low level exposure (570 ppb plus or minus 240 ppb), mid-level exposure (2,850 ppb plus or minus 2,110 ppb) and high level exposure (28,730 ppb plus or minus 20,740 ppb). Levels of blood cells in the low level exposure group were eight to 15 percent lower than those measured in the control group (Lan et al. 2004a, 2004b). After adjusting from a workplace 8-hour exposure to continuous exposure and adding an uncertainty factor to protect sensitive people (such as children and the elderly), ATSDR selected a chronic MRL of 3 ppb (ATSDR 2007). There are no well-conducted studies in people of the effects of breathing benzene for shorter times; therefore ATSDR used animal studies to evaluate these exposures. Mice used in these studies breathed benzene for a few hours per day for 6 to 20 days. ATSDR adjusted benzene levels to continuous exposure and considered the differences between the human respiratory system and that of mice to calculate a human equivalent concentration in air, which was further reduced by dividing by a 300-fold uncertainty factor that protects sensitive people such as children, the elderly and those with pre-existing medical conditions. Using this approach, ATSDR selected 9 ppb as the benzene acute MRL for one to 14 days of exposure, and 6 ppb as the intermediate MRL for greater than 14 days to one year of exposure (ATSDR 2007). The U.S. EPA classifies benzene as a known human carcinogen based on studies in people that breathed high levels of benzene for a long time (months to years) at their jobs. Workers who breathed benzene in air at 100,000 ppb and above developed leukemia, a type of cancer of the blood or bone marrow. This evidence in people is supported by studies in which both breathing and eating benzene caused cancer at multiple sites in animals (EPA 1998). No association between breathing benzene and cancer was found in studies of workers exposed to up to 9,600 ppb of benzene in air for more than four years (ATSDR 2007). ATSDR has developed a Cancer Risk Evaluation Guide (CREG) for benzene in air of 0.04 ppb (ATSDR 2013) for lifetime exposure. Breathing levels of benzene higher than the CREG does not mean that a person will develop cancer and does not predict an individual’s likelihood of developing cancer. The CREG assumes a theoretical risk of one more cancer in one million exposed people. As a comparison, the American Cancer Society estimates that men in the United States have slightly less than a 1 in 2 lifetime risk of developing cancer; for women, the risk is a little more than 1 in 3 (American Cancer Society 2012). On July 29, 2010, elevated air concentrations of benzene prompted the CCPHD Health Officer, in consultation with MDCH and ATSDR, to recommend that people living in the Voluntary Evacuation Area leave their homes. About half the families chose to leave, while others remained, citing concerns over the safety of their property. The evacuation recommendation was

21
lifted on August 18, 2010, when additional air sampling demonstrated that benzene concentrations in air were consistently less than the intermediate MRL of 6 ppb. Benzene concentrations were higher than the intermediate MRL in only seven “grab” and three time-integrated air samples collected from July 26 to December 31, 2010. While people likely breathed benzene in the air, concentrations above the intermediate MRL were not sustained over this entire time and were mostly found in work areas where oil-recovery activity was taking place. Measured benzene concentrations were not higher than the chronic MRL of 3 ppb for lifetime exposure in any air sample collected in 2011 or 2012. Many people living and working in the area of the Enbridge oil spill reported the short term health effects of breathing benzene including; headache, gastrointestinal complaints, respiratory symptoms, effects on their skin and eyes, anxiety, and other symptoms such as dizziness, fatigue, and chest pain. However, high benzene concentrations in the air were not sustained and it is unlikely that anyone will experience the more serious long term effects seen in studies of workers who breathed high levels of benzene on their jobs for many years.
Odors People can smell most chemicals in petroleum products at air concentrations far below levels that may cause respiratory irritation or chemical-specific health effects. A person’s ability to detect an odor, and whether or not it makes them feel sick, may be influenced by age, gender, pre-existing illness or other underlying chemical sensitivity (Shusterman 1999). In the days following the spill, air concentrations of total VOCs ranged up to several hundred parts per billion and were highest near the creek and river, particularly near cleanup work sites. Many people with homes or businesses in the area of the spill reported the short term health effects caused by breathing these chemicals including; headaches, nausea, respiratory discomfort, and eye irritation (MDCH 2010). These health effects are consistent with those expected from breathing the total VOCs measured in the air following the oil spill. Some people may have experienced health effects from smelling the odors coming from the spilled oil, even where measured VOC concentrations were below those expected to cause respiratory irritation or other short-term health effects. People who have asthma may be particularly sensitive to odors and respiratory irritants. Others without underlying medical conditions may just be more inherently sensitive and respond to odors with respiratory symptoms like eye irritation, nasal congestion, coughing and headache (Shusterman 1999). Some people, such as pregnant women, are also more likely to experience nausea from smelling unpleasant odors even at low chemical concentrations. Some people may have experienced anxiety related to the event, regardless of their exposure. People who have experienced health effects from breathing high levels of odor-causing chemicals in the air may subsequently feel sick when they breathe even very low concentrations. This is especially true for people who are very sensitive to chemical odors and their effects (Greenberg et al. 2013; Shusterman 1999; van Thriel et al. 2008, Zibrowski and Robertson 2006). The personal and community stress and disruption that followed the spill may have contributed to people’s aversion to the oil odors and the illness they felt.

22
Children’s Health Considerations Children may be at greater risk than adults when exposed to certain hazardous substances. Children play outdoors and are more likely to put their hands in their mouths or touch their faces, which increases their chance of exposure. Young children are also shorter than adults; they breathe dust, soil, and vapors close to the ground. A child’s lower body weight and higher intake rate result in a greater dose of hazardous chemicals compared to their weight. If toxic exposure levels are high enough during critical growth stages, the developing body systems of children may be damaged. ATSDR considered children’s health when developing the screening levels used by MDCH to identify when air contaminants coming from the spilled oil posed a human health risk. Children may have a more heightened sense of smell than adults and may be more likely to experience short term health effects as a result. In addition, children with pre-existing health problems such asthma could have more respiratory symptoms while they breathed the air that contained the oil-related chemicals.
Limitations
MDCH identified some limitations in the air monitoring and sampling data collected to evaluate the chemicals coming from the spilled oil.
• The real-time UltraRAE and other RAE system monitors used in the Initial Response from July 26 through July 28, 2010 are not capable of measuring benzene below 60 ppb. The ability to measure levels of benzene below the initial screening level of 60 ppb was not available until the National Guard 51st CST deployed to the spill on July 28, 2010, and the ERT mobile laboratory was fully functional on August 2, 2010.
• The UltraRAE and HAPSITE monitors sometimes provided very different measurements
of benzene concentrations: HAPSITE monitors consistently measured benzene at far lower air concentrations than UltraRAE monitors. The public health agencies considered these differences in deciding where to recommend voluntary evacuations and used the most health protective information to recommend that people living in the Voluntary Evacuation Area leave their homes until laboratory analysis of air samples could demonstrate that benzene concentrations were below the intermediate MRL of 6 ppb.
• Human Health Screening Levels are not available for many of the individual VOCs in the
crude oil mixture. In addition, no air screening levels are available for the mixture of total VOCs in the spilled oil.
23
Conclusions
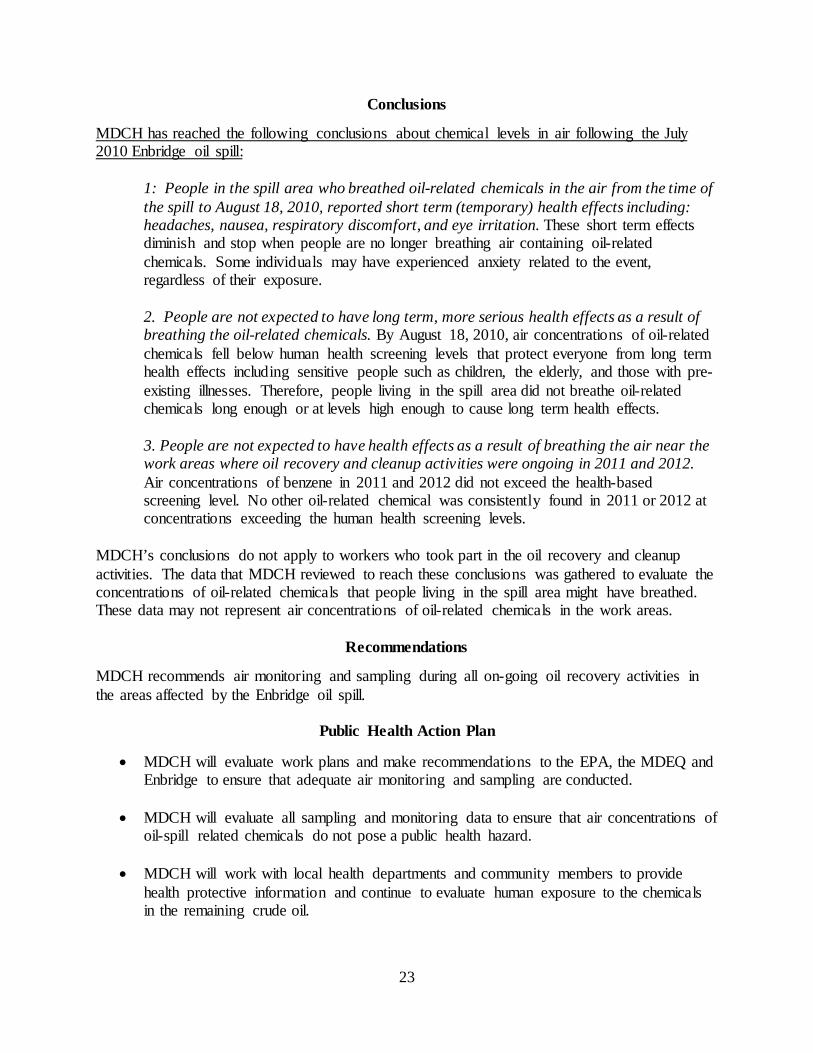
MDCH has reached the following conclusions about chemical levels in air following the July 2010 Enbridge oil spill:
1: People in the spill area who breathed oil-related chemicals in the air from the time of the spill to August 18, 2010, reported short term (temporary) health effects including: headaches, nausea, respiratory discomfort, and eye irritation. These short term effects diminish and stop when people are no longer breathing air containing oil-related chemicals. Some individuals may have experienced anxiety related to the event, regardless of their exposure. 2. People are not expected to have long term, more serious health effects as a result of breathing the oil-related chemicals. By August 18, 2010, air concentrations of oil-related chemicals fell below human health screening levels that protect everyone from long term health effects including sensitive people such as children, the elderly, and those with pre-existing illnesses. Therefore, people living in the spill area did not breathe oil-related chemicals long enough or at levels high enough to cause long term health effects. 3. People are not expected to have health effects as a result of breathing the air near the work areas where oil recovery and cleanup activities were ongoing in 2011 and 2012. Air concentrations of benzene in 2011 and 2012 did not exceed the health-based screening level. No other oil-related chemical was consistently found in 2011 or 2012 at concentrations exceeding the human health screening levels.
MDCH’s conclusions do not apply to workers who took part in the oil recovery and cleanup activities. The data that MDCH reviewed to reach these conclusions was gathered to evaluate the concentrations of oil-related chemicals that people living in the spill area might have breathed. These data may not represent air concentrations of oil-related chemicals in the work areas.
Recommendations
MDCH recommends air monitoring and sampling during all on-going oil recovery activities in the areas affected by the Enbridge oil spill.
Public Health Action Plan
• MDCH will evaluate work plans and make recommendations to the EPA, the MDEQ and Enbridge to ensure that adequate air monitoring and sampling are conducted.
• MDCH will evaluate all sampling and monitoring data to ensure that air concentrations of
oil-spill related chemicals do not pose a public health hazard.
• MDCH will work with local health departments and community members to provide health protective information and continue to evaluate human exposure to the chemicals in the remaining crude oil.

24
Report Preparation
This Public Health Assessment for the Kalamazoo River Enbridge Oil Spill Site was prepared by the Michigan Department of Community Health (MDCH) under a cooperative agreement with the federal Agency for Toxic Substances and Disease Registry (ATSDR). It is in accordance with the approved agency methods, policies, procedures existing at the date of publication. Editorial review was completed by the cooperative agreement partner. ATSDR has reviewed this document and concurs with its findings based on the information presented. ATSDR’s approval of this document has been captured in an electronic database, and the approving agency reviewers are listed below. Authors – MDCH Division of Environmental Health Linda D Dykema, Ph.D. Toxicologist, Principal Investigator Jennifer Gray, Ph.D. Toxicologist ATSDR Reviewers
Trent LeCoultre, MSEH, REHS Technical Project Officer, Central Branch Division of Community Health Investigations Charisse Walcott Technical Project Officer, Central Branch Division of Community Health Investigations
Michelle Watters, MD, PhD, MPH Medical Officer Division of Community Health Investigations Tina Forester, PhD, Deputy Director Division of Community Health Investigations Rick Gillig, MCP, Central Branch Chief Division of Community Health Investigations
Acknowledgments
The Michigan Department of Community Health gratefully acknowledges the assistance of the ATSDR, Science Support Branch in the compiling and summarizing the air data collected in
response to the Kalamazoo River oil spill.

25
References
ACS (America Cancer Society). 2012. Cancer Facts & Figures 2012. Retrieved from http://www.cancer.org
ATSDR (Agency for Toxic Substances and Disease Registry). 2006. Toxicological Profile for Hydrogen Sulfide. Atlanta, GA: U.S. Department of Health and Human Services, Public Health Service.
ATSDR (Agency for Toxic Substances and Disease Registry). 2007. Toxicological profile for Benzene. Atllanta, Georgia: U.S. Department of Health and Human Services, Public Health Service.
ATSDR (Agency for Toxic Substances and Disease Registry). 2013. Air comparison Values in ppb (for Volatile Organic Compounds Only).
Enbridge 2011. About Lakehead. Retrieved from http://response.enbridgeus.com/response/main.aspx?id=12780
EPA (US Environmental Protection Agency). 1998. Carcinogenic Effects of Benzene: An Update. EPA/600/P-97/001F. Washington DC: National Center for Environmental Assessment–Washington Office, Office of Research and Development.
EPA (US Environmental Protection Agency). 2009. Benzene (CAS Reg. NO. 71-43-2): Interim Acute Exposure Guideline Levels (AEGLs).
EPA (US Environmental Protection Agency). 2013. Volatile Organic Compounds (VOCs) Health Effects. Retrieved 2013, from http://www.epa.gov/iaq/voc.html#Health Effects.
Cenovus Energy Inc. 2008. MSDS (Material Safety Date Sheet) for Petroleum Crude Oil.
Lan Q, Zhang L, Li G, et al. 2004a. Hematotoxicity in workers exposed to low levels of benzene. Science 306:1774-1776.
Lan Q, Zhang L, Li G, et al. 2004b. Hematotoxicity in workers exposed to low levels of benzene: Supporting online material. Science 306:1774-1776.
http://www.sciencemag.org/cgi/data/306/5702/1774/DC1/1. August 2, 2005.
MDCH (Michigan Department of Community Health). 2010. Acute Health Effects of the Enbridge Oil Spill. Lansing, Michigan. November 2010 (Minor revisions 12/20/2010). Available at http://www.michigan.gov/documents/mdch/enbridge_oil_spill_epi_report_with_cover_11_22_10_339101_7.pdf
Michigan Department of Environmental Quality (MDEQ). 2010. Michigan 2010 Air Quality Report. http://www.michigan.gov/deq/0,4561,7-135-3310_4195---,00.html
MDLRA (Michigan Department of Licensing and Regulatory Affairs). 2003. Occupational Health Standard for Benzene, Updated May 2003, available at http://www.michigan.gov/documents/CIS_WSH_part311_35617_7.pdf.

26
MDNRE (Michigan Department of Natural Resources and Environment). 2010. Environmental Laboratory Report: EOS Site-Marshall MI. Lansing.
NJDHSS (New Jersey Department of Health and Senior Services). 2003. Public Health Evaluation of the (Proposed) Air Monitoring Plan of the Preliminary Design Report for the Ciba-Geigy Superfund site (Operable Unit 2).
NTSB (National Transportation Safety Board) 2012. Enbridge Incorporated Hazardous Liquid Pipeline Rupture and Release, Marshall, Michigan, July 25, 2010. NTSB/PAR-12/01:PB2012-916501.
Shusterman, D. 1999. The Health Significance of Environmental Odour Pollution: Revisited. Journal of Environmental Medicine, 1: 249-258.
Solomon GA, Jansen S. 2010. Health effects of the gulf oil spill. JAMA, 10:1118-9.
USDOT (United States Department of Transportation). 2008. Emergency Response Guidebook.
van Thriel C, et al. 2008. Odor annoyance of environmental chemicals: sensory and cognitive influences. J Toxicol Environ Health A 71(11-12), 776-85.
Weston (Weston Solutions, Inc.). 2011. Technical Memorandum: Air Monitoring & Sampling Summary, Enbridge Oil Soill-Line 6B, Calhoun and Kalamazoo Counties, Mighian.
Zibrowski EM, Robertson JM. 2006. Olfactory sensitivity in medical laboratory workers occupationally exposed to organic solvent mixtures. Occup Med 56(1), 51-4.
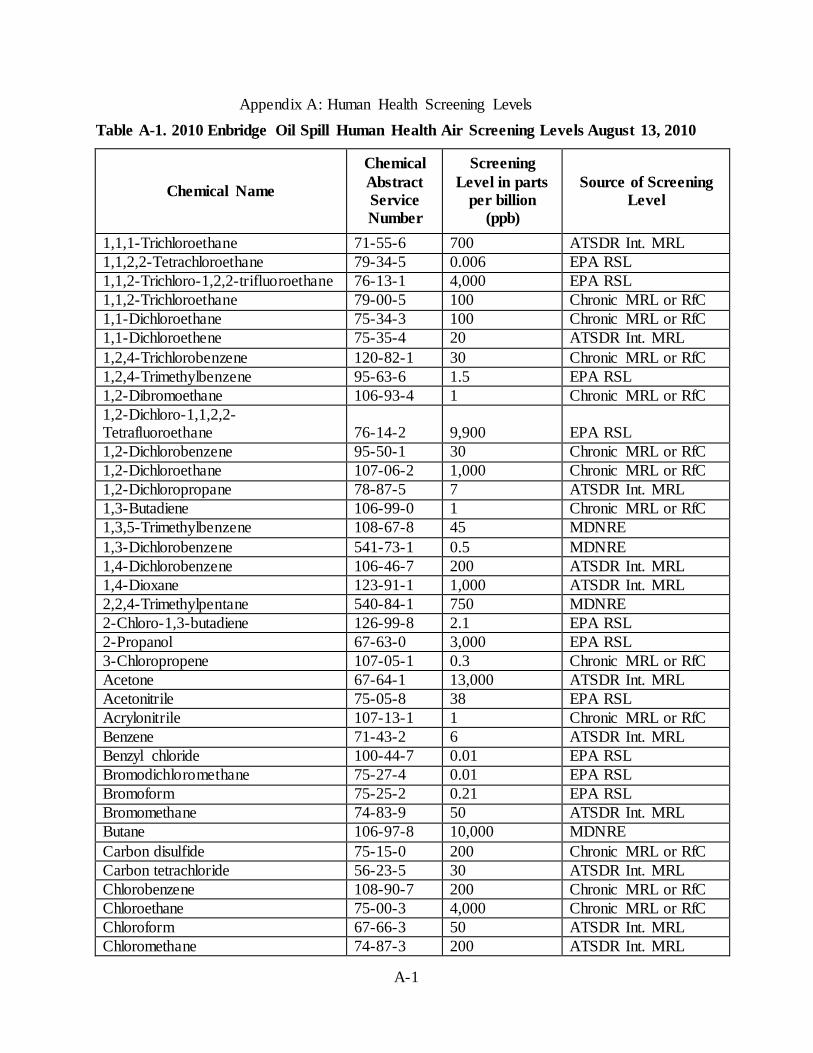
A-1
Appendix A: Human Health Screening Levels Table A-1. 2010 Enbridge Oil Spill Human Health Air Screening Levels August 13, 2010
Chemical Name
Chemical Abstract Service Number
Screening Level in parts
per billion (ppb)
Source of Screening Level
1,1,1-Trichloroethane 71-55-6 700 ATSDR Int. MRL 1,1,2,2-Tetrachloroethane 79-34-5 0.006 EPA RSL 1,1,2-Trichloro-1,2,2-trifluoroethane 76-13-1 4,000 EPA RSL 1,1,2-Trichloroethane 79-00-5 100 Chronic MRL or RfC 1,1-Dichloroethane 75-34-3 100 Chronic MRL or RfC 1,1-Dichloroethene 75-35-4 20 ATSDR Int. MRL 1,2,4-Trichlorobenzene 120-82-1 30 Chronic MRL or RfC 1,2,4-Trimethylbenzene 95-63-6 1.5 EPA RSL 1,2-Dibromoethane 106-93-4 1 Chronic MRL or RfC 1,2-Dichloro-1,1,2,2-Tetrafluoroethane 76-14-2 9,900 EPA RSL 1,2-Dichlorobenzene 95-50-1 30 Chronic MRL or RfC 1,2-Dichloroethane 107-06-2 1,000 Chronic MRL or RfC 1,2-Dichloropropane 78-87-5 7 ATSDR Int. MRL 1,3-Butadiene 106-99-0 1 Chronic MRL or RfC 1,3,5-Trimethylbenzene 108-67-8 45 MDNRE 1,3-Dichlorobenzene 541-73-1 0.5 MDNRE 1,4-Dichlorobenzene 106-46-7 200 ATSDR Int. MRL 1,4-Dioxane 123-91-1 1,000 ATSDR Int. MRL 2,2,4-Trimethylpentane 540-84-1 750 MDNRE 2-Chloro-1,3-butadiene 126-99-8 2.1 EPA RSL 2-Propanol 67-63-0 3,000 EPA RSL 3-Chloropropene 107-05-1 0.3 Chronic MRL or RfC Acetone 67-64-1 13,000 ATSDR Int. MRL Acetonitrile 75-05-8 38 EPA RSL Acrylonitrile 107-13-1 1 Chronic MRL or RfC Benzene 71-43-2 6 ATSDR Int. MRL Benzyl chloride 100-44-7 0.01 EPA RSL Bromodichloromethane 75-27-4 0.01 EPA RSL Bromoform 75-25-2 0.21 EPA RSL Bromomethane 74-83-9 50 ATSDR Int. MRL Butane 106-97-8 10,000 MDNRE Carbon disulfide 75-15-0 200 Chronic MRL or RfC Carbon tetrachloride 56-23-5 30 ATSDR Int. MRL Chlorobenzene 108-90-7 200 Chronic MRL or RfC Chloroethane 75-00-3 4,000 Chronic MRL or RfC Chloroform 67-66-3 50 ATSDR Int. MRL Chloromethane 74-87-3 200 ATSDR Int. MRL

A-2
Table A.1 continued cis-1,2-Dichloroethene 156-59-2 8.6 MDNRE cis-1,3-Dichloropropene* 10061-02-6 4.4 MDNRE Cumene 98-82-8 100 Chronic MRL or RfC Cyclohexane 110-82-7 2,000 Chronic MRL or RfC Cyclohexane,methyl 108-87-2 4,000 MDNRE Cyclopentane 287-92-3 6,000 MDNRE Dibromochloromethane 124-48-1 0.01 EPA RSL Dichlorodifluoromethane 75-71-8 42 EPA RSL Ethyl acetate 141-78-6 890 MDNRE Ethyl benzene 100-41-4 700 ATSDR Int. MRL Heptane 142-82-5 850 MDNRE Hexachlorobutadiene 87-68-3 10 Chronic MRL or RfC Hexane 110-54-3 200 Chronic MRL or RfC Isobutane 75-28-5 10,000 MDNRE Methyl butyl ketone 591-78-6 10 Chronic MRL or RfC Methyl ethyl ketone 78-93-3 2,000 Chronic MRL or RfC Methyl isobutyl ketone 108-10-1 700 Chronic MRL or RfC Methyl tert-butyl ether 1634-04-4 700 ATSDR Int. MRL Methylene chloride 75-09-2 300 ATSDR Int. MRL Napthalene 91-20-3 1 Chronic MRL or RfC Nonane 111-84-2 100 MDNRE Pentane 109-66-0 6,000 MDNRE Propene 115-07-1 2,000 Chronic MRL or RfC Styrene 100-42-5 200 Chronic MRL or RfC Tetrachloroethene 127-18-4 40 Chronic MRL or RfC Tetrahydrofuran 109-99-9 6.1 MDNRE Toluene 108-88-3 1,000 Chronic MRL or RfC trans-1,2-Dichloroethene 156-60-5 200 ATSDR Int. MRL trans-1,3-Dichloropropene* 10061-01-5 0.5 MDNRE Trichloroethene 79-01-6 100 ATSDR Int. MRL Trichlorofluoromethane 75-69-4 130 EPA RSL Vinyl acetate 108-05-4 10 ATSDR Int. MRL Vinyl bromide 593-60-2 1 Chronic MRL or RfC Vinyl chloride 75-01-4 30 ATSDR Int. MRL Xylenes 1330-20-7 2,000 ATSDR Int. MRL
* MDEQ provisional screening value for Dichloropropene based on a 1 in 100,000 cancer risk ATSDR = Agency for Toxic Substances and Disease Registry EPA = United States Environmental Protection Agency MDNRE = Michigan Department of Natural Resources and Environment Int. MRL = Intermediate Minimal Risk Level MRL = Chronic Minimal Risk Level RfC = Reference Concentration for Chronic Exposure RSL = Regional Screening Level

A-3
Table A-2. 2011 Enbridge Oil Spill Human Health Air Screening Levels August 31, 2011
Chemical Name
Chemical Abstract Service Number
Screening Level in parts
per billion (ppb)
Source of Screening Level
1,1,1-Trichloroethane 71-55-6 1,000 EPA RfC 1,1,2,2-Tetrachloroethane 79-34-5 0.006 EPA RSL 1,1,2-Trichloro-1,2,2-trifluoroethane 76-13-1 4,000 EPA RSL 1,1,2-Trichloroethane 79-00-5 0.04 EPA RfC 1,1-Dichloroethane 75-34-3 0.4 EPA RSL 1,1-Dichloroethene 75-35-4 50 EPA RfC 1,2,4-Trichlorobenzene 120-82-1 0.3 EPA RfC 1,2,4-Trimethylbenzene 95-63-6 1.5 EPA RfC 1,2-Dibromoethane 106-93-4 1 EPA RfC 1,2-Dichloro-1,1,2,2-Tetrafluoroethane 76-14-2 9,900 MDEQ 1,2-Dichlorobenzene 95-50-1 30 EPA RfC 1,2-Dichloroethane 107-06-2 600 ATSDR Chr. MRL 1,2-Dichloropropane 78-87-5 1 EPA RfC 1,3-Butadiene 106-99-0 1 EPA RfC 1,3,5-Trimethylbenzene 108-67-8 45 MDEQ 1,3-Dichlorobenzene 541-73-1 0.5 MDEQ 1,4-Dichlorobenzene 106-46-7 10 ATSDR Chr. MRL 1,4-Dioxane 123-91-1 1,000 ATSDR Chr. MRL 2,2,4-Trimethylpentane 540-84-1 750 MDEQ 2-Chloro-1,3-butadiene 126-99-8 6 EPA RfC 2-Propanol 67-63-0 3,000 EPA RfC 3-Chloropropene 107-05-1 32 EPA RfC Acetaldehyde 75-07-0 5 EPA RfC Acetone 67-64-1 13,000 ATSDR Chr. MRL Acetonitrile 75-05-8 36 EPA RfC Acrylonitrile 107-13-1 1 EPA RfC Benzene 71-43-2 3 ATSDR Chr. MRL Benzyl chloride 100-44-7 0.2 EPA RfC Bromodichloromethane 75-27-4 0.01 EPA RSL Bromoform 75-25-2 0.2 EPA RSL Bromomethane 74-83-9 5 ATSDR Chr. MRL Butane 106-97-8 10,000 MDEQ Carbon disulfide 75-15-0 200 EPA RfC Carbon tetrachloride 56-23-5 30 ATSDR Chr. MRL Chlorobenzene 108-90-7 10 EPA RfC Chloroethane 75-00-3 4,000 EPA RfC Chloroform 67-66-3 20 ATSDR Chr. MRL Chloromethane 74-87-3 50 ATSDR Chr. MRL cis-1,2-Dichloroethene 156-59-2 9 MDEQ

A-4
Table A.2 continued cis-1,3-Dichloropropene* 10061-02-6 4 MDEQ Cumene 98-82-8 80 EPA RfC Cyclohexane 110-82-7 2,000 EPA RfC Cyclohexane,methyl 108-87-2 4,000 MDEQ Cyclopentane 287-92-3 6,000 MDEQ Dibromochloromethane 124-48-1 0.01 EPA RSL Dichlorodifluoromethane 75-71-8 20 EPA RfC Ethyl acetate 141-78-6 890 MDEQ Ethyl benzene 100-41-4 60 ATSDR Chr. MRL Heptane 142-82-5 850 MDEQ Hexachlorobutadiene 87-68-3 0.01 EPA RSL Hexane 110-54-3 200 EPA RfC Isobutane 75-28-5 10,000 MDEQ Methyl butyl ketone 591-78-6 10 EPA RfC Methyl ethyl ketone 78-93-3 2,000 EPA RfC Methyl isobutyl ketone 108-10-1 700 EPA RfC Methyl tert-butyl ether 1634-04-4 700 ATSDR Chr. MRL Methylene chloride 75-09-2 300 ATSDR Chr. MRL Napthalene 91-20-3 1 ATSDR Chr. MRL Nonane 111-84-2 40 EPA RfC Pentane 109-66-0 300 EPA RfC Propene 115-07-1 2,000 EPA RfC Styrene 100-42-5 200 ATSDR Chr. MRL Tetrachloroethene 127-18-4 40 ATSDR Chr. MRL Tetrahydrofuran 109-99-9 6 MDEQ Toluene 108-88-3 80 ATSDR Chr. MRL trans-1,2-Dichloroethene 156-60-5 15 EPA RfC trans-1,3-Dichloropropene* 10061-01-5 0.5 MDEQ Trichloroethene 79-01-6 2 EPA RfC Trichlorofluoromethane 75-69-4 130 EPA RfC Vinyl acetate 108-05-4 10 ATSDR Int. MRL Vinyl bromide 593-60-2 1 EPA RfC Vinyl chloride 75-01-4 30 ATSDR Int. MRL Xylenes 1330-20-7 50 EPA RfC * MDEQ provisional screening value for Dichloropropene based on a 1 in 100,000 cancer risk ATSDR = Agency for Toxic Substances and Disease Registry EPA = United States Environmental Protection Agency MDNRE = Michigan Department of Natural Resources and Environment Int. MRL = Intermediate Minimal Risk Level MRL = Chronic Minimal Risk Level RfC = Reference Concentration for Chronic Exposure RSL = Regional Screening Level
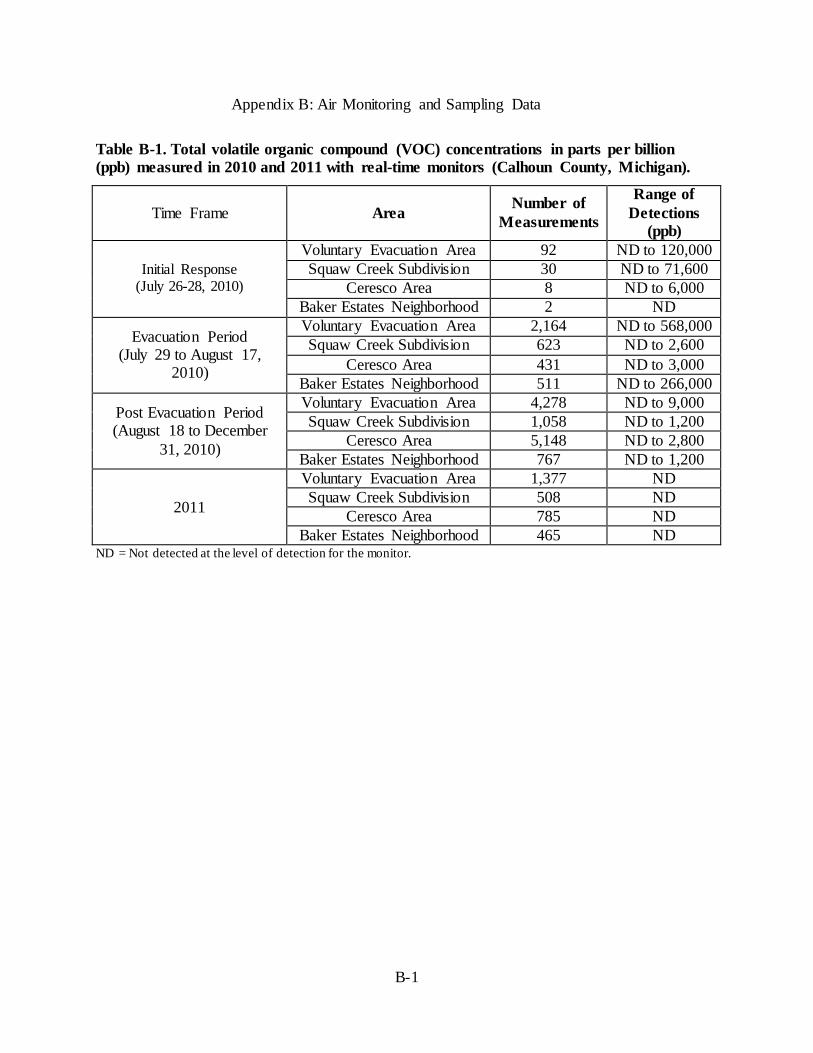
B-1
Appendix B: Air Monitoring and Sampling Data
Table B-1. Total volatile organic compound (VOC) concentrations in parts per billion (ppb) measured in 2010 and 2011 with real-time monitors (Calhoun County, Michigan).
Time Frame Area Number of Measurements
Range of Detections
(ppb)
Initial Response (July 26-28, 2010)
Voluntary Evacuation Area 92 ND to 120,000 Squaw Creek Subdivision 30 ND to 71,600
Ceresco Area 8 ND to 6,000 Baker Estates Neighborhood 2 ND
Evacuation Period (July 29 to August 17,
2010)
Voluntary Evacuation Area 2,164 ND to 568,000 Squaw Creek Subdivision 623 ND to 2,600
Ceresco Area 431 ND to 3,000 Baker Estates Neighborhood 511 ND to 266,000
Post Evacuation Period (August 18 to December
31, 2010)
Voluntary Evacuation Area 4,278 ND to 9,000 Squaw Creek Subdivision 1,058 ND to 1,200
Ceresco Area 5,148 ND to 2,800 Baker Estates Neighborhood 767 ND to 1,200
2011
Voluntary Evacuation Area 1,377 ND Squaw Creek Subdivision 508 ND
Ceresco Area 785 ND Baker Estates Neighborhood 465 ND
ND = Not detected at the level of detection for the monitor.

B-2
Table B-2. Total volatile organic compounds (VOCs) concentrations measured with unidentified instruments from July 26, 2010 to December 31, 2011 (Calhoun County, Michigan).
Time Frame Area Number of Measurements
Range of Detections
(ppb)
Initial Response (July 26-28, 2010)
Voluntary Evacuation Area 6 242 to 57,300 Squaw Creek Subdivision 0 NA
Ceresco Area 0 NA Baker Estates Neighborhood 0 NA
Evacuation Period (July 29 to August 17,
2010)
Voluntary Evacuation Area 80 ND to 4,300 Squaw Creek Subdivision 35 ND to 1,011
Ceresco Area 36 ND to 20 Baker Estates Neighborhood 45 ND to 100
Post Evacuation Period (August 18 to December
31, 2010)
Voluntary Evacuation Area 3 ND Squaw Creek Subdivision 1 ND
Ceresco Area 1 ND Baker Estates Neighborhood 0 NA
2011
Voluntary Evacuation Area 9 ND Squaw Creek Subdivision 2 ND
Ceresco Area 0 NA Baker Estates Neighborhood 0 NA
NA = Not Available ND = Not detected

B-3
Table B-3. Hydrogen sulfide (H2S) concentrations in parts per billion (ppb) measured in 2010 and 2011 with real-time monitors (Calhoun County, Michigan).
Time Frame and Area Screening
Level (ppb)
Number of Measurements
Number of Measurements
Above the Screening
Level
Range of Detections
(ppb)
Initial Response (July 26-28, 2010) Voluntary Evacuation Area
70
4 1 ND Squaw Creek Subdivision 14 0 ND Ceresco Area 0 0 NA Baker Estates Neighborhood 0 0 NA
Evacuation Period (July 29 to August 17, 2010) Voluntary Evacuation Area
70
1,666 7 ND to 112 Squaw Creek Subdivision 476 0 ND Ceresco Area 376 0 ND Baker Estates Neighborhood 464 0 ND
Post Evacuation Period (August 18 to December 31, 2010) Voluntary Evacuation Area
70
3,267 0 ND Squaw Creek Subdivision 920 0 ND Ceresco Area 5,070 0 ND Baker Estates Neighborhood 715 0 ND
2011 Voluntary Evacuation Area
70
1,317 0 ND Squaw Creek Subdivision 465 0 ND Ceresco Area 743 0 ND Baker Estates Neighborhood 442 0 ND
Shaded values are above the chemical-specific 2010 human health screening levels. ND = Not detected.

B-4
Table B-4. Hydrogen sulfide (H2S) concentrations measured with unidentified instruments from July 26, 2010 to December 31, 2011, (Calhoun County, Michigan).
Time Frame and Area Screening
Value (ppb)
Number of Measurements*
Number of Measurements
Above the Screening
Value
Range of Detections
(ppb)
Initial Response Voluntary Evacuation Area
70
0 0 ND Squaw Creek Subdivision 0 0 ND Ceresco Area 0 0 ND Baker Estates Neighborhood 0 0 ND
Evacuation Period Voluntary Evacuation Area
70
81 0 ND Squaw Creek Subdivision 31 0 ND Ceresco Area 36 0 ND Baker Estates Neighborhood 45 0 ND
Post Evacuation Period Voluntary Evacuation Area
70
3 0 ND Squaw Creek Subdivision 1 0 ND Ceresco Area 1 0 ND Baker Estates Neighborhood 0 0 ND
2011 Voluntary Evacuation Area
70
9 0 ND Squaw Creek Subdivision 2 0 ND Ceresco Area 0 0 ND Baker Estates Neighborhood 0 0 ND
ND = Not Detected No H2S was found in five measurements taken with GASTEC colorimetric instruments.

B-5
Table B-5. Benzene air concentrations in parts per billion (ppb) measured in 2010 with Draeger and GASTEC instruments (Calhoun County, Michigan).
Time Frame Area Number of Measurements
Range of Detections
(ppb)
Initial Response
Voluntary Evacuation Area 16 ND to 10,000 Squaw Creek Subdivision 6 ND to 500
Ceresco Area 3 ND to 250 Baker Estates Neighborhood 2 ND
Evacuation Period
Voluntary Evacuation Area 57 ND to 500 Squaw Creek Subdivision 10 ND
Ceresco Area 26 ND to 100 Baker Estates Neighborhood 15 ND
Post Evacuation Period
Voluntary Evacuation Area 28 ND Squaw Creek Subdivision 10 ND
Ceresco Area 30 ND Baker Estates Neighborhood 21 ND
2011
Voluntary Evacuation Area 40 ND Squaw Creek Subdivision 5 ND
Ceresco Area 7 ND Baker Estates Neighborhood 1 ND
Shaded values are above the chemical-specific 2010 human health screening levels. ND = Not detected.

B-6
Table B-6. Benzene concentrations in parts per billion (ppb) measured in 2010 with UltraRAE and Hazardous Air Pollutants on Site (HAPSITE) monitors (Calhoun County, Michigan).
Time Frame and Area
Screening
Level (ppb)
Number of UltraRAE Monitor Readings
Number of UltraRAE Readings Above the Screening
Level
Range of Detections
with UltraRAE Monitors
(ppb)
Number of HAPSITE Monitor Readings
Number of HAPSITE Readings Above the Screening
Level
Range of Detections
with HAPSITE Monitors
(ppb)
Initial Response (July 26-28, 2010) Voluntary Evacuation Area
60
13 8 ND to 6,250 4 0 1.2 to 27.3
Squaw Creek Subdivision 4 0 ND 0 NA NA
Ceresco Area 4 2 ND to 500 0 NA NA Baker Estates Neighborhood 1 0 ND 0 NA NA
Evacuation Period (July 29 to August 17, 2010) Voluntary Evacuation Area
60
1,619 62 ND to 2,200 24 0 ND to 17.6
Squaw Creek Subdivision 437 0 ND to 50 7 0 ND to 2.2
Ceresco Area 271 1 ND to 200 2 0 ND to 0.2 Baker Estates Neighborhood 264 1 ND to 250 3 0 ND
Post Evacuation Period (August 18 to December 31, 2010) Voluntary Evacuation Area
6
3,095 17 ND to 9,450 NA NA NA
Squaw Creek Subdivision 274 0 ND NA NA NA
Ceresco Area 3,704 10 ND to 4,500 NA NA NA Baker Estates Neighborhood 304 0 ND NA NA NA
2011 Voluntary Evacuation Area
3
1,010 0 ND NA NA NA
Squaw Creek Subdivision 465 0 ND NA NA NA
Ceresco Area 704 0 ND NA NA NA Baker Estates Neighborhood 414 0 ND NA NA NA
Shaded values are above the chemical-specific 2010 human health screening levels. NA = No data are available ND = Not detected.

B-7
Table B-7. Benzene concentrations in parts per billion (ppb) measured with unidentified instruments from July 26, 2010 to December 31, 2011 (Calhoun County, Michigan).
Time Frame and Area Screening
Value (ppb)
Number of Readings*
Number of Readings Above the Screening
Value
Range of Detections
(ppb)
Initial Response Voluntary Evacuation Area
60
11 7 ND to 9,750 Squaw Creek Subdivision 1 0 50 Ceresco Area 0 0 NA Baker Estates Neighborhood 0 0 NA
Evacuation Period Voluntary Evacuation Area
60
49 6 ND to 1,000 Squaw Creek Subdivision 30 0 ND Ceresco Area 35 0 ND Baker Estates Neighborhood 41 0 ND
Post Evacuation Period Voluntary Evacuation Area
6
4 0 ND Squaw Creek Subdivision 1 0 ND Ceresco Area 1 0 ND Baker Estates Neighborhood 0 0 ND
2011 Voluntary Evacuation Area
6
9 0 ND Squaw Creek Subdivision 2 0 ND Ceresco Area 0 0 ND Baker Estates Neighborhood 0 0 ND
NA = No data are available ND = not detected

B-8
Table B-8. Benzene concentrations in parts per billion (ppb) in “grab” air samples (Calhoun County, Michigan).
Time Frame and Area Screening Level (ppb) No. of Samples Number of
Detections
No. Detections Above the
Screening Level
Range of Detections
Initial Response (July 26-28, 2010) Voluntary Evacuation Area
6
3 1 1 200 Squaw Creek Subdivision NA NA NA NA Ceresco Area NA NA NA NA Baker Estates Neighborhood NA NA NA NA
Evacuation Period (July 29 to August 17, 2010) Voluntary Evacuation Area
6
19 6 6 7.6 to 290 Squaw Creek Subdivision 4 0 0 ND Ceresco Area 5 0 0 ND Baker Estates Neighborhood 33 0 0 ND
Post Evacuation Period (August 18 to December 31, 2010) Voluntary Evacuation Area
6
680 9 1 1.1 to 190 Squaw Creek Subdivision 97 1 1 8.4 Ceresco Area 98 7 0 1.0 to 2.2 Baker Estates Neighborhood 249 5 2 1.0 to 20
2011 Voluntary Evacuation Area
6
NA NA NA NA Squaw Creek Subdivision NA NA NA NA Ceresco Area 3 0 0 ND Baker Estates Neighborhood 2 0 0 ND
2012 Voluntary Evacuation Area
3
NA NA NA NA Squaw Creek Subdivision NA NA NA NA Ceresco Area NA NA NA NA Baker Estates Neighborhood NA NA NA NA
Shaded values are above the chemical-specific 2010 human health screening levels. ND = Not detected. NA = Data are not available

B-9
Table B-9. Benzene concentrations in parts per billion (ppb) in time-integrated air samples (Calhoun County, Michigan).
Time Frame and Area 2010
Screening Level (ppb)
No. of Samples Number of Detections
No. Detections Above the Screening
level
Range or Concentration of Detection(s)
Initial Response (July 26-28, 2010) Voluntary Evacuation Area
60
NA NA NA NA Squaw Creek Subdivision NA NA NA NA Ceresco Area NA NA NA NA Baker Estates Neighborhood NA NA NA NA
Evacuation Period (July 29 to August 17, 2010) Voluntary Evacuation Area
6
124 14 3 0.26 to 122 Squaw Creek Subdivision 4 1 0 0.6 Ceresco Area 14 1 0 0.9 Baker Estates Neighborhood 39 1 0 0.3
Post Evacuation Period (August 18 to December 31, 2010) Voluntary Evacuation Area
6
394 0 0 ND Squaw Creek Subdivision 34 0 0 ND Ceresco Area 217 0 0 ND Baker Estates Neighborhood 194 0 0 ND
2011 Voluntary Evacuation Area
6
98 0 0 ND Squaw Creek Subdivision 6 0 0 ND Ceresco Area 483 3 0 1 to 3 Baker Estates Neighborhood 214 1 0 4
2012 Voluntary Evacuation Area
3
0 0 0 NA Squaw Creek Subdivision 0 0 0 NA Ceresco Area 48 0 0 ND Baker Estates Neighborhood 0 0 0 NA
Shaded values are above the 2010 human health screening levels. ND = Not detected. NA = Data are not available NA = Data are not available

B-10
Table B-10. Volatile organic compound (VOC) concentrations in parts per billion (ppb) in “grab” air samples collected from July 26 through July 28, 2010, in the Voluntary Evacuation Area (Calhoun County, Michigan).
Chemical 2010
Screening level (ppb)
Voluntary Evacuation Area Number of
Detections/Total Number of Samples
Range of Detections (ppb)
acetone 13,000 2/3 17 to 20 cyclohexane 2,000 2/3 6.2 to 480
cyclohexane,methyl 4,000 1/1 12 heptane 850 2/3 8.4 to 540 hexane 200 3/3 6.3 to 760 pentane 6,000 2/2 17 to 24 toluene 1,000 1/3 300 xylenes 2,000 1/3 110
Shaded values are above the chemical-specific 2010 Human Health Screening Levels.
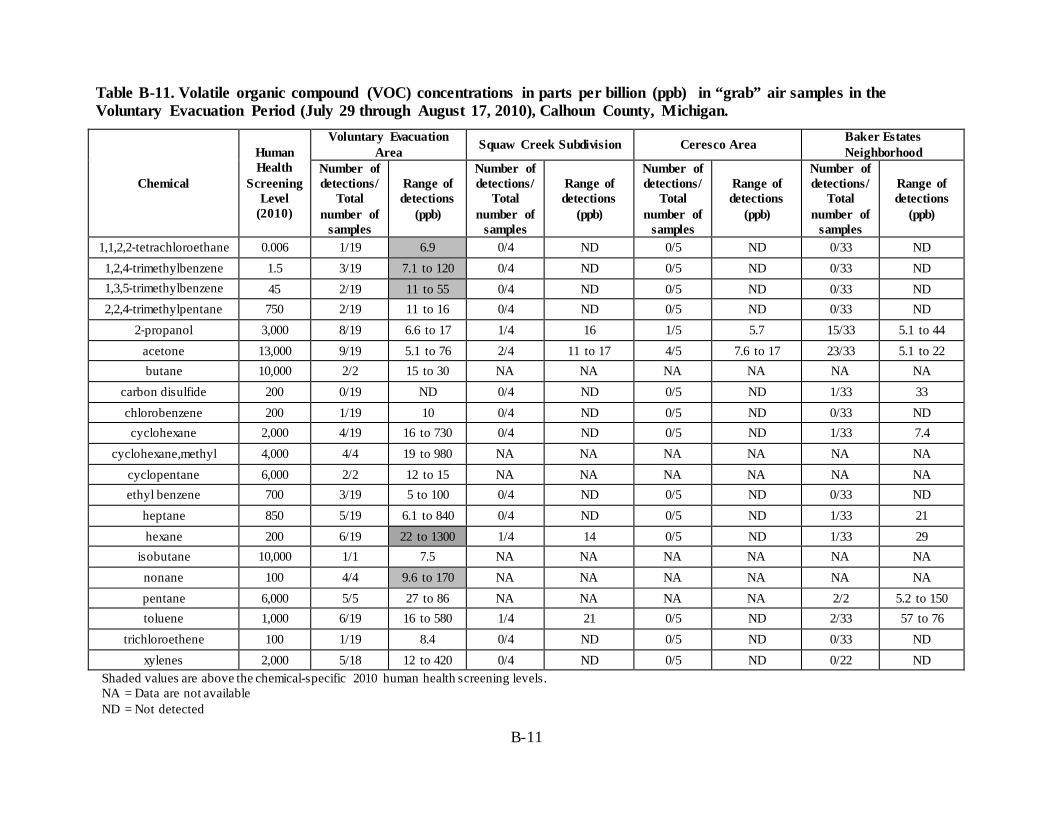
B-11
Table B-11. Volatile organic compound (VOC) concentrations in parts per billion (ppb) in “grab” air samples in the Voluntary Evacuation Period (July 29 through August 17, 2010), Calhoun County, Michigan.
Human Health
Voluntary Evacuation Area Squaw Creek Subdivision Ceresco Area Baker Estates
Neighborhood Number of Number of Number of Number of
Chemical Screening detections/ Range of detections/ Range of detections/ Range of detections/ Range of Level Total detections Total detections Total detections Total detections
(2010) number of (ppb) number of (ppb) number of (ppb) number of (ppb) samples samples samples samples
1,1,2,2‐tetrachloroethane 0.006 1/19 6.9 0/4 ND 0/5 ND 0/33 ND 1,2,4‐trimethylbenzene 1.5 3/19 7.1 to 120 0/4 ND 0/5 ND 0/33 ND 1,3,5‐trimethylbenzene 45 2/19 11 to 55 0/4 ND 0/5 ND 0/33 ND 2,2,4‐trimethylpentane 750 2/19 11 to 16 0/4 ND 0/5 ND 0/33 ND
2‐propanol 3,000 8/19 6.6 to 17 1/4 16 1/5 5.7 15/33 5.1 to 44 acetone 13,000 9/19 5.1 to 76 2/4 11 to 17 4/5 7.6 to 17 23/33 5.1 to 22 butane 10,000 2/2 15 to 30 NA NA NA NA NA NA
carbon disulfide 200 0/19 ND 0/4 ND 0/5 ND 1/33 33 chlorobenzene 200 1/19 10 0/4 ND 0/5 ND 0/33 ND cyclohexane 2,000 4/19 16 to 730 0/4 ND 0/5 ND 1/33 7.4
cyclohexane,methyl 4,000 4/4 19 to 980 NA NA NA NA NA NA cyclopentane 6,000 2/2 12 to 15 NA NA NA NA NA NA ethyl benzene 700 3/19 5 to 100 0/4 ND 0/5 ND 0/33 ND
heptane 850 5/19 6.1 to 840 0/4 ND 0/5 ND 1/33 21 hexane 200 6/19 22 to 1300 1/4 14 0/5 ND 1/33 29
isobutane 10,000 1/1 7.5 NA NA NA NA NA NA nonane 100 4/4 9.6 to 170 NA NA NA NA NA NA pentane 6,000 5/5 27 to 86 NA NA NA NA 2/2 5.2 to 150 toluene 1,000 6/19 16 to 580 1/4 21 0/5 ND 2/33 57 to 76
trichloroethene 100 1/19 8.4 0/4 ND 0/5 ND 0/33 ND xylenes 2,000 5/18 12 to 420 0/4 ND 0/5 ND 0/22 ND
Shaded values are above the chemical-specific 2010 human health screening levels. NA = Data are not available ND = Not detected

B-12
Table B-12. Volatile organic compound (VOC) concentrations in parts per billion (ppb) in time-integrated air samples in the Voluntary Evacuation Period (July 29 through August 17, 2010), Calhoun County, Michigan.
Human Health
Voluntary Evacuation Area Squaw Creek Subdivision Ceresco Area Baker Estates
Neighborhood Number of Number of Number of Number of
Chemical Screening Level
detections/Total
Range of detections
detections/Total
Range of detections
detections/Total
Range of detections
detections/Total
Range of detections
(2010) number of samples
(ppb) number of samples
(ppb) number of samples
(ppb) number of samples
(ppb)
1,2,4‐trimethylbenzene 1.5 5/124 0.41 to 52.9 1/4 1 1/14 0.4 1/39 0.5 1,3,5‐trimethylbenzene 45 3/124 0.24 to 28.4 0/4 ND 0/14 ND 0/39 ND 2,2,4‐trimethylpentane 750 0/94 ND 1/4 0.5 0/13 ND 0/39 ND
2‐propanol 3,000 79/118 5.1 to 110 3/4 1.1 to 9.9 9/11 6 to 81 32/36 6.1 to 140 acetaldehyde NA 4/4 14 to 72 NA NA 0/1 130 2/2 5 to 5.2
acetone 13,000 97/120 0.98 to 55 2/4 2.3 to 7.9 12/12 1.5 to 52 35/38 0.8 to 31 acetonitrile 38 2/8 57 to 64 1/1 12 2/3 1.4 to 1.7 3/3 2.6 to 7.7
butane 10,000 12/12 1.3 to 120 1/1 1.4 1/1 2.2 1/1 57 chloromethane 200 2/124 0.34 to 0.48 0/4 ND 0/14 ND 0/39 ND cyclohexane 2,000 23/123 0.49 to 120 0/3 ND 1/12 1.3 0/36 ND
cyclohexane,methyl 4,000 22/22 0.77 to 290 0/4 ND 1/1 2.5 NA NA cyclopentane 6,000 3/3 5.8 to 14 NA NA NA NA NA NA
dichlorodifluoromethane 42 7/124 0.26 to 0.56 1/4 0.36 3/14 0.3 to 0.4 2/39 0.28 to 0.32
ethyl acetate 890 2/118 5.9 to 31 0/3 ND 0/11 ND 0/36 ND ethyl benzene 700 5/124 0.3 to 76 1/4 0.35 1/14 0.3 0/39 ND
heptane 850 26/123 0.39 to 170 0/3 ND 1/12 2 0/36 ND hexane 200 46/124 0.62 to 482 1/4 20 2/14 1.5 to 5.4 0/39 ND
isobutane 10,000 8/8 1.8 to 69 NA NA NA NA NA NA
methyl butyl ketone 10 1/118 3.2 0/3 ND 0/11 ND 0/36 ND
methyl ethyl ketone 2,000 10/121 0.37 to 220 0/4 ND 2/14 3.5 to 120 0/39 ND methyl isobutyl ketone 700 3/124 0.39 to 30 0/4 ND 0/14 ND 0/39 ND

B-13
Table B-12 continued methyl tert‐butyl ether 700 0/124 ND 1/4 0.56 0/14 ND 0/39 ND
methylene chloride 300 3/124 2.3 to 9 1/4 18 2/14 0.8 to 1.7 3/39 1.5 to 10.7 nonane 100 10/10 1.2 to 200 NA NA 1/1 1 NA NA pentane 6,000 32/32 1.7 to 460 1/1 3.9 1/1 7.9 6/6 0.8 to 78 propene 2,000 5/118 0.37 to 7.2 0/3 ND 0/11 ND 0/36 ND
tetrachloroethene 40 1/124 1.9 0/4 ND 0/14 ND 0/39 ND tetrahydrofuran 6.1 1/118 5 0/3 ND 0/11 ND 0/36 ND
toluene 1,000 26/124 0.48 to 345.2 1/4 2.6 1/14 1.9 4/39 0.4 to 60
trichlorofluoromethane 130 2/124 0.27 0/4 ND 0/14 ND 0/39 ND xylenes 2,000 5/74 3.8 to 41 NA NA 0/5 ND 0/17 ND
Shaded values are above the chemical-specific 2010 human health screening levels. NA = Data are not available ND = Not detected
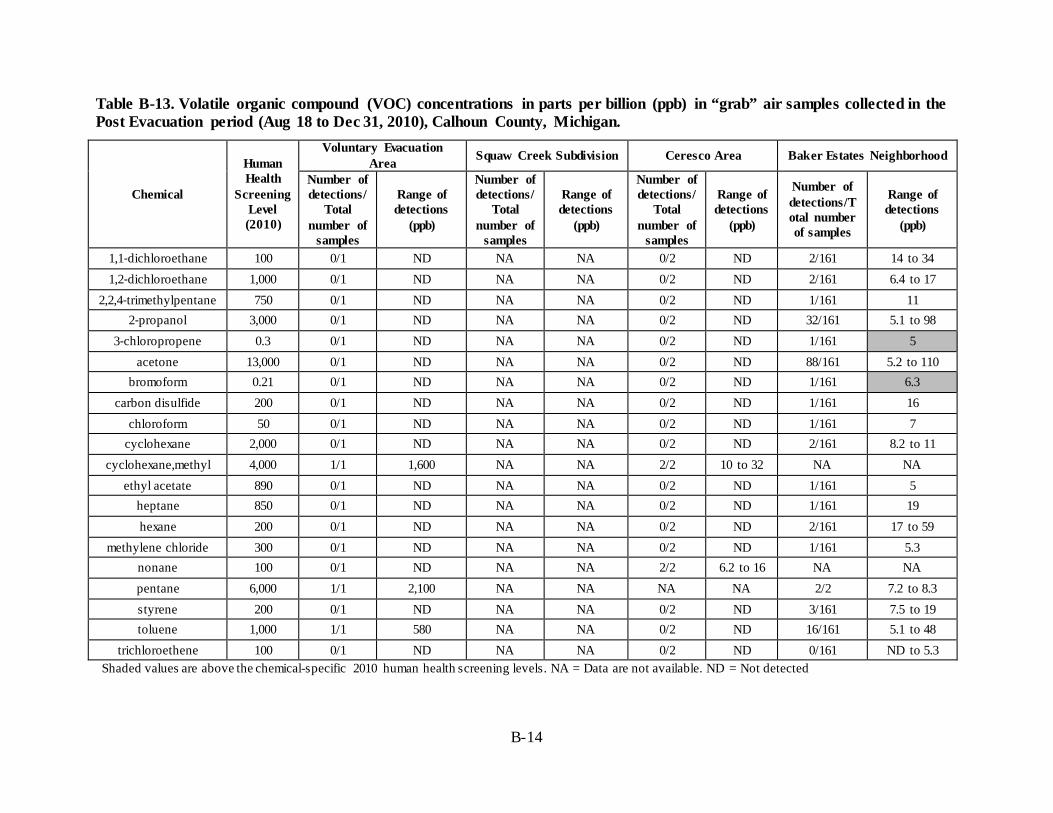
B-14
Table B-13. Volatile organic compound (VOC) concentrations in parts per billion (ppb) in “grab” air samples collected in the Post Evacuation period (Aug 18 to Dec 31, 2010), Calhoun County, Michigan.
Chemical
Human Health
Screening Level (2010)
Voluntary Evacuation Area Squaw Creek Subdivision Ceresco Area Baker Estates Neighborhood
Number of detections/
Total number of
samples
Range of detections
(ppb)
Number of detections/
Total number of
samples
Range of detections
(ppb)
Number of detections/
Total number of
samples
Range of detections
(ppb)
Number of detections/Total number of samples
Range of detections
(ppb)
1,1‐dichloroethane 100 0/1 ND NA NA 0/2 ND 2/161 14 to 34 1,2‐dichloroethane 1,000 0/1 ND NA NA 0/2 ND 2/161 6.4 to 17
2,2,4‐trimethylpentane 750 0/1 ND NA NA 0/2 ND 1/161 11 2‐propanol 3,000 0/1 ND NA NA 0/2 ND 32/161 5.1 to 98
3‐chloropropene 0.3 0/1 ND NA NA 0/2 ND 1/161 5 acetone 13,000 0/1 ND NA NA 0/2 ND 88/161 5.2 to 110
bromoform 0.21 0/1 ND NA NA 0/2 ND 1/161 6.3 carbon disulfide 200 0/1 ND NA NA 0/2 ND 1/161 16
chloroform 50 0/1 ND NA NA 0/2 ND 1/161 7 cyclohexane 2,000 0/1 ND NA NA 0/2 ND 2/161 8.2 to 11
cyclohexane,methyl 4,000 1/1 1,600 NA NA 2/2 10 to 32 NA NA ethyl acetate 890 0/1 ND NA NA 0/2 ND 1/161 5
heptane 850 0/1 ND NA NA 0/2 ND 1/161 19 hexane 200 0/1 ND NA NA 0/2 ND 2/161 17 to 59
methylene chloride 300 0/1 ND NA NA 0/2 ND 1/161 5.3 nonane 100 0/1 ND NA NA 2/2 6.2 to 16 NA NA pentane 6,000 1/1 2,100 NA NA NA NA 2/2 7.2 to 8.3 styrene 200 0/1 ND NA NA 0/2 ND 3/161 7.5 to 19 toluene 1,000 1/1 580 NA NA 0/2 ND 16/161 5.1 to 48
trichloroethene 100 0/1 ND NA NA 0/2 ND 0/161 ND to 5.3 Shaded values are above the chemical-specific 2010 human health screening levels. NA = Data are not available. ND = Not detected

B-15
Table B-14. Volatile organic compound (VOC) concentrations in parts per billion (ppb) in time-integrated air samples in the Post Evacuation period (Aug 18 to Dec 31, 2010), Calhoun County, Michigan.
Human Health
Voluntary Evacuation Area Squaw Creek Subdivision Ceresco Area Baker Estates
Neighborhood Number of Number of Number of Number of
Chemical Screening detections/ Range of detections/ Range of detections/ Range of detections/ Range of Level Total detections Total detections Total detections Total detections
(2010) number of samples
(ppb) number of samples
(ppb) number of samples
(ppb) number of samples
(ppb)
1,1,1‐trichloroethane 700 0/394 ND 0/34 ND 1/217 9.2 0/194 ND 2‐propanol 3,000 216/394 5 to 180 22/34 5.3 to 80 55/317 5 to 68 96/194 5 to 2700
acetaldehyde NA 4/4 6.9 to 56 NA NA 1/1 54 1/1 16 acetone 13,000 243/394 5 to 240 24/34 5 to 40 73/217 5 to 110 100/194 5.1 to 83
acetonitrile 38 3/3 10 to 16 NA NA 1/1 16 NA NA bromomethane 50 1/394 5.9 0/34 ND 0/217 ND 0/194 ND
butane 10,000 5/5 5.6 to 21 NA NA NA NA NA NA ethyl acetate 890 0/394 ND 0/34 ND 0/217 ND 2/194 11 to 77
methyl ethyl ketone 2,000 1/394 34 0/34 ND 0/217 ND 3/194 5.2 to 9.6 methylene chloride 300 2/394 7.2 to 11 0/34 ND 1/217 52 0/194 ND
pentane 6,000 1/1 8.8 1/1 6.5 1/1 7.9 1/1 8.4 tetrahydrofuran 6.1 3/394 8.3 to 170 0/34 ND 0/217 ND 0/194 ND
toluene 1,000 7/394 5 to 13 1/34 7.7 4/217 5.6 to 14 8/194 5.9 to 110 trichloroethene 100 0/394 ND 0/34 ND 1/217 7.1 0/194 ND
Shaded values are above the chemical-specific 2010 human health screening levels. NA = Data are not available ND = Not detected
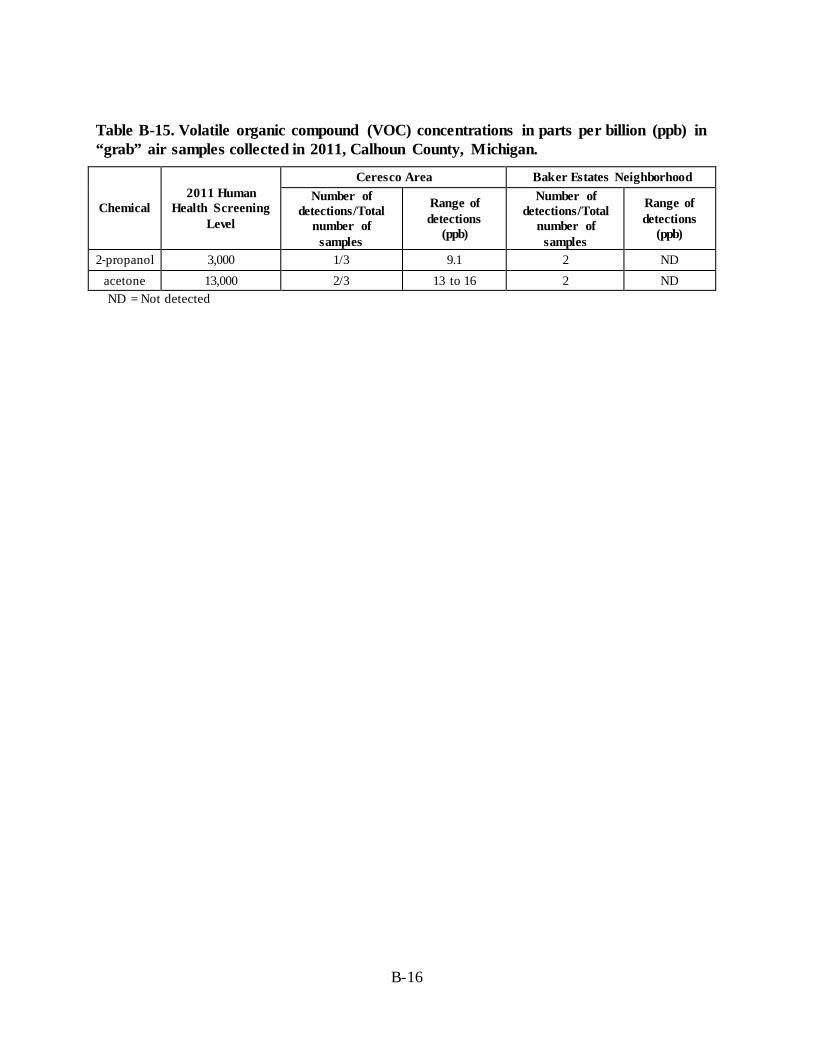
B-16
Table B-15. Volatile organic compound (VOC) concentrations in parts per billion (ppb) in “grab” air samples collected in 2011, Calhoun County, Michigan.
Ceresco Area Baker Estates Neighborhood
Chemical 2011 Human
Health Screening Level
Number of detections/Total
number of samples
Range of detections
(ppb)
Number of detections/Total
number of samples
Range of detections
(ppb)
2‐propanol 3,000 1/3 9.1 2 ND acetone 13,000 2/3 13 to 16 2 ND ND = Not detected
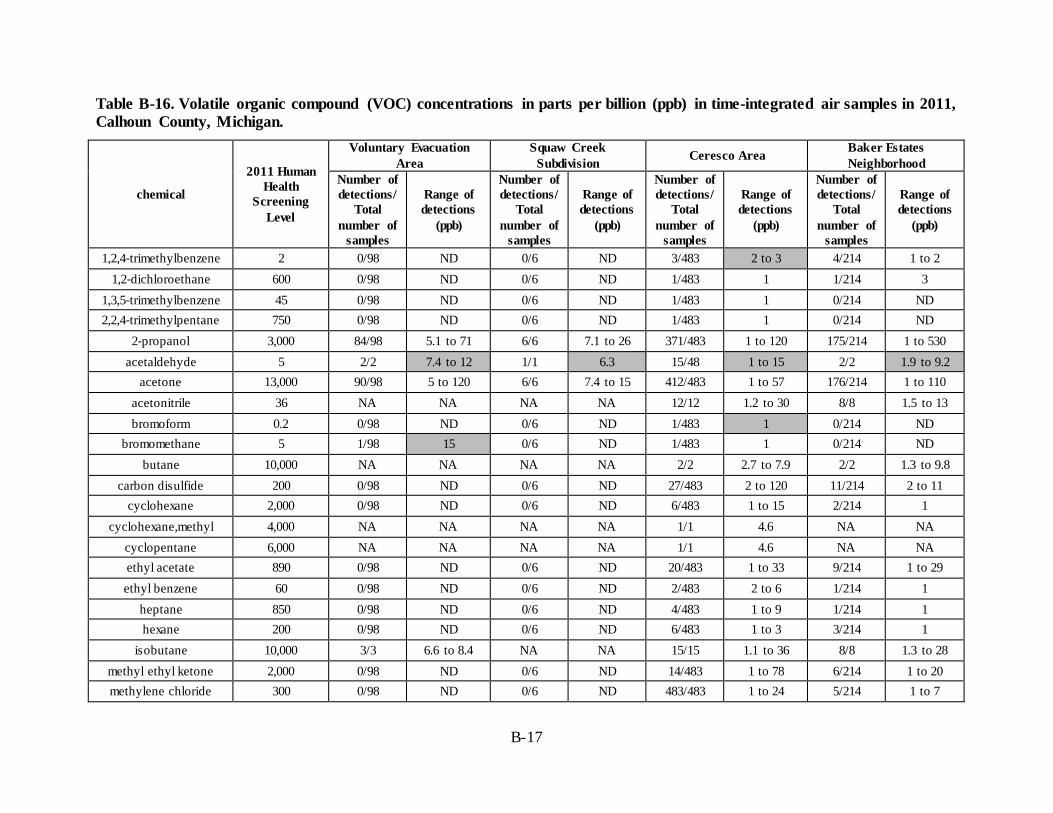
B-17
Table B-16. Volatile organic compound (VOC) concentrations in parts per billion (ppb) in time-integrated air samples in 2011, Calhoun County, Michigan.
chemical
2011 Human Health
Screening Level
Voluntary Evacuation Area
Squaw Creek Subdivision Ceresco Area Baker Estates
Neighborhood Number of detections/
Total number of
samples
Range of detections
(ppb)
Number of detections/
Total number of
samples
Range of detections
(ppb)
Number of detections/
Total number of
samples
Range of detections
(ppb)
Number of detections/
Total number of
samples
Range of detections
(ppb)
1,2,4‐trimethylbenzene 2 0/98 ND 0/6 ND 3/483 2 to 3 4/214 1 to 2 1,2‐dichloroethane 600 0/98 ND 0/6 ND 1/483 1 1/214 3
1,3,5‐trimethylbenzene 45 0/98 ND 0/6 ND 1/483 1 0/214 ND 2,2,4‐trimethylpentane 750 0/98 ND 0/6 ND 1/483 1 0/214 ND
2‐propanol 3,000 84/98 5.1 to 71 6/6 7.1 to 26 371/483 1 to 120 175/214 1 to 530 acetaldehyde 5 2/2 7.4 to 12 1/1 6.3 15/48 1 to 15 2/2 1.9 to 9.2
acetone 13,000 90/98 5 to 120 6/6 7.4 to 15 412/483 1 to 57 176/214 1 to 110 acetonitrile 36 NA NA NA NA 12/12 1.2 to 30 8/8 1.5 to 13 bromoform 0.2 0/98 ND 0/6 ND 1/483 1 0/214 ND
bromomethane 5 1/98 15 0/6 ND 1/483 1 0/214 ND butane 10,000 NA NA NA NA 2/2 2.7 to 7.9 2/2 1.3 to 9.8
carbon disulfide 200 0/98 ND 0/6 ND 27/483 2 to 120 11/214 2 to 11 cyclohexane 2,000 0/98 ND 0/6 ND 6/483 1 to 15 2/214 1
cyclohexane,methyl 4,000 NA NA NA NA 1/1 4.6 NA NA cyclopentane 6,000 NA NA NA NA 1/1 4.6 NA NA ethyl acetate 890 0/98 ND 0/6 ND 20/483 1 to 33 9/214 1 to 29 ethyl benzene 60 0/98 ND 0/6 ND 2/483 2 to 6 1/214 1
heptane 850 0/98 ND 0/6 ND 4/483 1 to 9 1/214 1 hexane 200 0/98 ND 0/6 ND 6/483 1 to 3 3/214 1
isobutane 10,000 3/3 6.6 to 8.4 NA NA 15/15 1.1 to 36 8/8 1.3 to 28 methyl ethyl ketone 2,000 0/98 ND 0/6 ND 14/483 1 to 78 6/214 1 to 20 methylene chloride 300 0/98 ND 0/6 ND 483/483 1 to 24 5/214 1 to 7

B-18
Table B-16 Continued nonane 40 NA NA NA NA 1/1 5 NA NA pentane 300 3/3 6.7 to 7.6 NA NA 16/16 3.4 to 180 9/9 1.6 to 91 propene 2,000 0/98 ND 0/6 ND 8/483 1 to 2 5/214 1 styrene 200 0/98 ND 0/6 ND 1/483 4 0/214 ND
tetrachloroethene 40 0/98 ND 0/6 ND 0/483 ND 1/214 2 tetrahydrofuran 6 0/98 ND 0/6 ND 2/483 2 to 3 0/214 ND
toluene 80 0/98 ND 0/6 ND 94/483 1 to 140 72/214 1 to 85 vinyl acetate 10 0/98 ND 0/6 ND 0/483 ND 1/214 1
Shaded values are above the chemical-specific 2010 human health screening levels. NA = Data are not available ND = Not detected
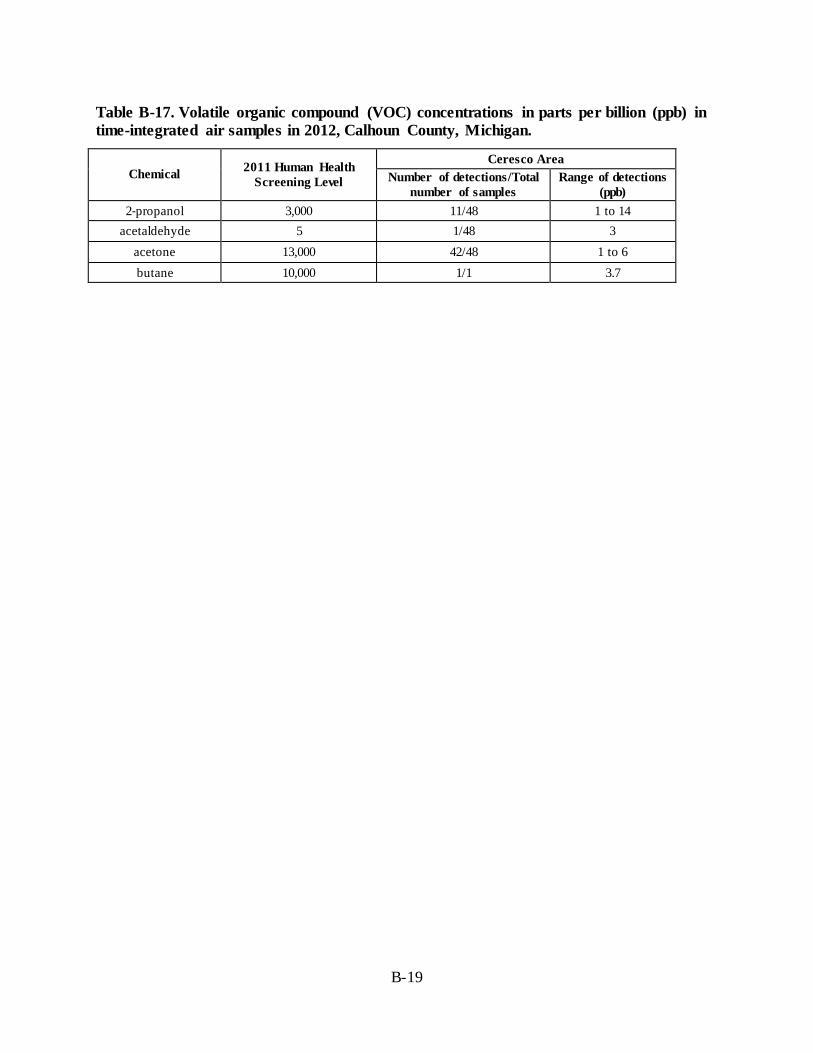
B-19
Table B-17. Volatile organic compound (VOC) concentrations in parts per billion (ppb) in time-integrated air samples in 2012, Calhoun County, Michigan.
Chemical 2011 Human Health Screening Level
Ceresco Area Number of detections/Total
number of samples Range of detections
(ppb) 2‐propanol 3,000 11/48 1 to 14
acetaldehyde 5 1/48 3 acetone 13,000 42/48 1 to 6 butane 10,000 1/1 3.7
C-1
Appendix C: Public Comment Responsiveness Summary
MDCH released the Evaluation of Air Contamination Public Health Assessment for the Kalamazoo River Enbridge Oil Spill (Calhoun and Kalamazoo Counties, Michigan) Public Health Assessment for public comment on August 26, 2014. The public comment period closed on October 26, 2014. Comments received are summarized below followed by MDCH’s responses. Comment: The commenter expressed appreciation for the “government agencies, Enbridge representatives, clean-up crews, news agencies, and others” describing them as “professional and friendly”. The commenter indicated that Enbridge had done a great job in cleaning up the oil and was thankful for receiving many reports of environmental sampling results. Response: MDCH acknowledges and appreciates the sentiments shared in these comments. Comment: The commenter described his/her experiences immediately following the oil spill including communication from the local garbage collection company that notified its clients of the disruption in service caused by closed roads and other impediments created by the spill response. The commenter expressed disappointment that the local health department had not been as proactive in providing information about the spill, the response, evacuations in or near their neighborhood, and the availability of compensation for alternate accommodations if they chose to leave their home until conditions improved. The commenter expressed hopes that county officials and government units could get warnings and information out to the public should similar emergencies occur in the future. Response: MDCH will share these comments with local government authorities in the area of the oil spill and will offer assistance in planning for future emergency responses. Comment: The commenter would like to know who has received the fines paid by Enbridge. Response: To date, only the U.S. Department of Transportation, Pipeline and Hazardous Materials Safety Administration has assessed fines for the 2010 Enbridge oil spill. Other federal and state agencies may assess additional fines as investigations are completed. Civil penalties (fines) paid to the federal government typically go to the U.S. Treasury and into the general revenue stream. Fines assessed under and paid to the State of Michigan, with some exceptions, enter the state’s General Fund. Some fines assessed under the authority of Michigan’s Natural Resources and Environmental Protection Act (Act 451 of 1994) are paid to the Michigan Environmental Response Fund to be used for future environmental clean-ups. Comment: The commenter asked when the dredging in the Kalamazoo River would stop. Response: Enbridge completed dredging of the Ceresco impoundment in December of 2013, however restoration work in this area made necessary by the removal of the Ceresco Dam was not completed until October of 2014. Enbridge completed dredging activities at the Mill Ponds impoundment in the city of Battle Creek in May 2014, and in the Morrow Lake Delta/Neck in
C-2
September 2014. Enbridge will monitor for residual oil in the Kalamazoo River and the Michigan Department of Environmental Quality (MDEQ) will evaluate these results to determine the need for additional dredging (M. DeLong, MDEQ Enbridge Response Unit Chief, personal communication, 2014). Comment: The commenter expressed concern that “three sand bars in Battle Creek” could contain “a lot of oil” and asks if Enbridge would be willing to remove them, and deepen the channel there to about four feet. The commenter further states that it would be good for the city to stock these areas with game fish. Response: The MDEQ continues to monitor the Kalamazoo River for effects of the dredging and the removal of the Ceresco Dam. While the DEQ has noted an accumulation of sediment downstream of the dredged areas, at this time there is no indication that the channel should be deepened (M. DeLong, MDEQ Enbridge Response Unit Chief, personal communication, 2014). The Michigan Department of Natural Resources (MDNR) manages game fish resources in Michigan, rather than a local government such as the city of Battle Creek. The MDNR does not stock the Kalamazoo River between Marshall and Morrow Lake because fish in that section naturally reproduce (J. Wesley, MDNR Fisheries Division, personal communication, 2014). Comment: The commenter asked why the Ceresco Dam was removed, stating that it was a felony and that the dam was owned by the city of Ceresco, not Enbridge or the State of Michigan. Response: The city of Ceresco was not the owner of the Ceresco Dam. The dam was built in 1905 to generate hydroelectric power and had been privately owned since it was retired from active use in the 1960’s. Enbridge purchased the dam from the private owner as part of its plan to restore the stretch of the Kalamazoo River at the city of Ceresco. The dam had deteriorated over the years and was showing a number of deficiencies including cracks in the retaining walls. The MDNR Dam Removal web page at http://www.michigan.gov/dnr/0,4570,7-153-10364_52259_27415-80303--,00.html describes flooding, loss of life, destruction of property, and harm to the downstream environment as the possible consequences when poorly maintained older dams suddenly fail. The MDEQ and the MDNR authorized dredging of the river and removal of the dam. Both agencies are confident that these actions will have significant benefits for the Kalamazoo River by improving the fishery, removing the navigation hazard of the dam, and providing other ecological benefits.

Greetings,
You are receiving a document from the Agency for Toxic Substances and Disease
Registry (ATSDR). We are very interested in your opinions about the document
you received. We ask that you please take a moment now to complete the following
ten question survey. You can access the survey by clicking on the link below.
Completing the survey should take less than 5 minutes of your time. If possible,
please provide your responses within the next two weeks. All information that you
provide will remain confidential.
The responses to the survey will help ATSDR determine if we are providing useful
and meaningful information to you. ATSDR greatly appreciates your assistance as
it is vital to our ability to provide optimal public health information.
https://www.surveymonkey.com/r/ATSDRDocumentSatisfaction
LCDR Donna K. Chaney, MBAHCM
U.S. Public Health Service
4770 Buford Highway N.E. MS-F59
Atlanta, GA 30341-3717
(W) 770.488.0713
(F) 770.488.1542