Embed Size (px)
Citation preview

Public Health App
Gail Meakins and Reid Ewing
University of Utah
1/24/13
Household Travel App
1
Contents
Executive Summary ....................................................................................................................................... 3
D Variables ..................................................................................................... Error! Bookmark not defined.
Literature ....................................................................................................... Error! Bookmark not defined.
Self-Selection ................................................................................................. Error! Bookmark not defined.
Methods ........................................................................................................................................................ 6
Data ................................................................................................................ Error! Bookmark not defined.
Variables ........................................................................................................ Error! Bookmark not defined.
Statistical Analysis .......................................................................................... Error! Bookmark not defined.
Results ........................................................................................................................................................... 6
Discussion.................................................................................................................................................... 10
References ..................................................................................................... Error! Bookmark not defined.

Household Travel App
2
Executive Summary
The Public Health App can be used to estimate levels of physical activity, specifically active travel, within differing physical environments. Active travel is defined as physical activity resulting from purposeful travel. Trips for work, errands, and school are examples. Because physical inactivity is associated with many health risks including obesity and the incidence of chronic diseases such as diabetes and high blood pressure, physical activity is an important predictor of health. Environments that support and encourage active travel have the potential to improve health status.
The Public Health App consists of three models, with household travel outcomes as the dependent variables, and so-called D variables as the independent variables. The predicted outcomes are walk trips, bike trips, and transit trips. The D variables are the demographics of households and the density, diversity, design, destination accessibility, and distance to transit for buffers around their places of residence. The six D’s affect the accessibility of trip productions to trip attractions, and hence the generalized cost of travel by different modes to and from different locations. This affects the utility of different travel choices.
Multilevel modeling (MLM) is used to account for dependence among observations, in this case the dependence of households within a given region. All households within a given region share the characteristic of that region. This dependence violates the independences assumption of ordinary least squares (“OLS”) regression. Therefore, MLM produces a more accurate coefficient and standard error estimates.
The number of household walk trips increases with household size and declines with household income. High income households have greater access to private vehicles. Walk trips increase with land use entropy (mix) within a quarter mile of home and activity density within a mile of home. These measures of density and diversity place destinations within walking distance of home. Walk trips also increase with transit stop density within a mile of home. Transit service is complementary to walking, as households with good access to transit own fewer private vehicles and hence are more likely to use alternative modes.
The bike trip model is the simplest of the three models estimated. Bike trip frequency increases with household size, land use entropy within a quarter mile, activity density within a mile, and percentage of 4-way intersections within a mile. All three built environmental variables tend to reduce bicycling distances between home and trip attractions, thereby reducing the generalized cost of bicycling relative to automobile use.
The number of household transit trips increases with household size and employment, and declines with household income. The number increases with land use entropy, activity density, and percentage of 4-way intersections. Transit-oriented development is virtually defined by these three variables. Controlling for these variables, transit trips increase with two transit service variables, transit stop density within a quarter mile and percentage of regional employment reachable within 30 minutes by transit.

Household Travel App
3
To estimate measures of physical activity, average time per trip by mode is calculated using the 2009 Nationwide Household Travel Survey (NHTS). The NHTS is administered by the Federal Highway Administration and serves as the nation’s inventory of daily travel. Travel times for walking and biking are included, as is walk time to and from public transportation.
These estimates for physical activity are then converted to the Metabolic Equivalent of Task (MET), a physiological measure of the energy cost of physical activity, using The Compendium of Physical Activity (Haskill, 2011).

Household Travel App
4
Introduction
Physical activity is defined as any body movement that is produced by skeletal muscles that requires more energy expenditure than resting. The term physical activity in this application will refer to bodily movement that produces health benefits. Physical inactivity has been identified as the fourth leading risk factor for global mortality causing an estimated 3.2 million deaths globally. Since the 1990’s there has been a decline in mortality rates associated with heart disease, stroke, and cancer and an increase in those associated with obesity and diabetes (Koplan, 1999). If current trends continue obesity and physical inactivity may soon overtake tobacco use as the number one modifiable cause of death (Danaei et al., 2009; Mcginnis & Foerge, 1993; Mokdad, Marks, Stroup, & Gerberding, 2004).
The CDC agenda, Healthy People 2010 includes physical activity as one of the leading indicators of health yet according to self-reported data many adults (43%) and children (18%) fail to meet the recommended physical activity requirements (Saelens & Handy, 2008). The CDC recommends that adults engage in 2 hours and 30 minutes of moderate intensity aerobic exercise or 1 hour and 15 minutes of vigorous activity or a combination of the two every week.
There is a strong relationship between physical activity and health. Physical inactivity is a major risk factor for heart disease, stroke, diabetes, high blood pressure, high triglycerides, certain cancers, and a host of other dangerous conditions. Even moderately intense physical activity such as brisk walking is beneficial when done regularly for a total of 30 minutes or longer on most or all days.
The built environment is implicated in low levels of walking, bicycling, and transit use for work, shopping, and other daily activities, as well as low levels of leisure time physical activity. The 5Ds, listed previously, have been shown to promote active travel. Specific variables correlated with walking are population density, jobs-housing balance, land use mix, intersection density, and jobs within one mile of home (Ewing and Cervero, 2010). In the last fifty years activity levels have dropped for a variety of reasons including new technologies and automation that make our lives easier and decentralized development that favors automobile use (Committee on Physical Activity, 2005).
Obesity is a significant health problem and the prevalence of adult obesity and overweight in the United States has risen significantly in the last 30 years (Khan et al., 2009). Alarmingly, the overweight and obesity prevalence in children is following a similar trajectory (Who). Obesity is linked to cardiovascular disease and certain cancers. The rising incidence of obesity presents serious long term challenges including decreased life expectancy and the potential for negative impacts on an individual’s quality of life, the availability and cost of future health care as well as an individual’s viability and productivity. Two main modifiable risk factors for obesity are unhealthy diets and physical inactivity, and the greatest areas for prevention and treatment are behavior and the environment (http://www.cdc.gov/obesity/causes/index.html). Research has established statistically significant links between elements of the built environment and the risk of obesity (Papas et al, 2007). After controlling for age, education, fruit and vegetable consumption, and other sociodemographic and behavioral covariates, Ewing et al. (2003a) found that adults living in sprawling counties had higher body mass indices (BMIs) and were more likely to be obese (BMI >30) than were their counterparts living in compact counties. Frank and colleagues have reported similar relationships for adults living in sprawling neighborhoods versus compact, walkable neighborhoods (Frank et al., 2006).
Household Travel App
5
Built Environment and Physical Activity
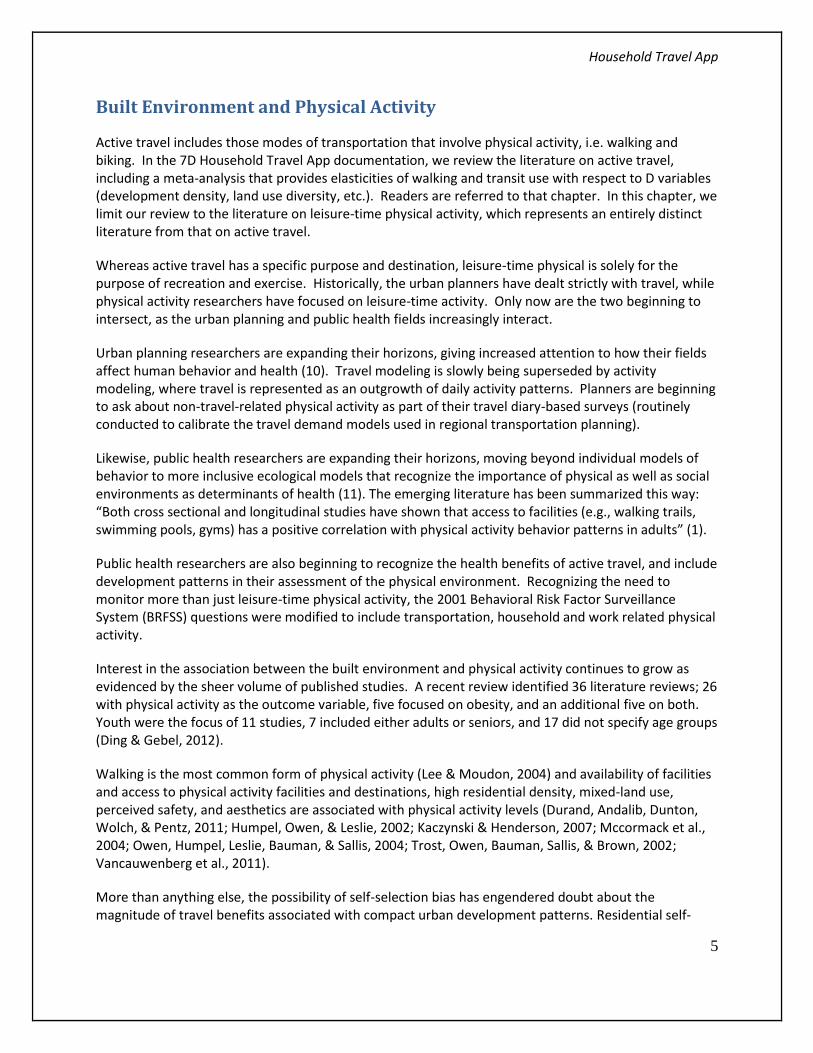
Active travel includes those modes of transportation that involve physical activity, i.e. walking and biking. In the 7D Household Travel App documentation, we review the literature on active travel, including a meta-analysis that provides elasticities of walking and transit use with respect to D variables (development density, land use diversity, etc.). Readers are referred to that chapter. In this chapter, we limit our review to the literature on leisure-time physical activity, which represents an entirely distinct literature from that on active travel.
Whereas active travel has a specific purpose and destination, leisure-time physical is solely for the purpose of recreation and exercise. Historically, the urban planners have dealt strictly with travel, while physical activity researchers have focused on leisure-time activity. Only now are the two beginning to intersect, as the urban planning and public health fields increasingly interact.
Urban planning researchers are expanding their horizons, giving increased attention to how their fields affect human behavior and health (10). Travel modeling is slowly being superseded by activity modeling, where travel is represented as an outgrowth of daily activity patterns. Planners are beginning to ask about non-travel-related physical activity as part of their travel diary-based surveys (routinely conducted to calibrate the travel demand models used in regional transportation planning).
Likewise, public health researchers are expanding their horizons, moving beyond individual models of behavior to more inclusive ecological models that recognize the importance of physical as well as social environments as determinants of health (11). The emerging literature has been summarized this way: “Both cross sectional and longitudinal studies have shown that access to facilities (e.g., walking trails, swimming pools, gyms) has a positive correlation with physical activity behavior patterns in adults” (1).
Public health researchers are also beginning to recognize the health benefits of active travel, and include development patterns in their assessment of the physical environment. Recognizing the need to monitor more than just leisure-time physical activity, the 2001 Behavioral Risk Factor Surveillance System (BRFSS) questions were modified to include transportation, household and work related physical activity.
Interest in the association between the built environment and physical activity continues to grow as evidenced by the sheer volume of published studies. A recent review identified 36 literature reviews; 26 with physical activity as the outcome variable, five focused on obesity, and an additional five on both. Youth were the focus of 11 studies, 7 included either adults or seniors, and 17 did not specify age groups (Ding & Gebel, 2012).
Walking is the most common form of physical activity (Lee & Moudon, 2004) and availability of facilities and access to physical activity facilities and destinations, high residential density, mixed-land use, perceived safety, and aesthetics are associated with physical activity levels (Durand, Andalib, Dunton, Wolch, & Pentz, 2011; Humpel, Owen, & Leslie, 2002; Kaczynski & Henderson, 2007; Mccormack et al., 2004; Owen, Humpel, Leslie, Bauman, & Sallis, 2004; Trost, Owen, Bauman, Sallis, & Brown, 2002; Vancauwenberg et al., 2011).
More than anything else, the possibility of self-selection bias has engendered doubt about the magnitude of travel benefits associated with compact urban development patterns. Residential self-

Household Travel App
6
selection refers to the tendency of people to select neighborhoods that support their travel preferences, for example, those want to walk and would walk anyway, may choose to living in walkable neighborhoods. According to a National Research Council report (2005), “If researchers do not properly account for the choice of neighborhood, their empirical results will be biased in the sense that features of the built environment may appear to influence activity more than they in fact do. (Indeed, this single potential source of statistical bias casts doubt on the majority of studies on the topic to date.)” (p. 5-7)
Methods – Active Travel
Our models of active travel come from the 7D Household Travel App. See page 10 for a discussion of methods. The variables are defined in Table 6 of the 7D Household Travel App.
Results –Active Travel
The number of household walk trips increases with household size and declines with household income. High income households have greater access to private vehicles. Walk trips increase with land use entropy (mix) within a quarter mile of home and activity density within a mile of home. These measures of density and diversity place destinations within walking distance of home. Walk trips also increase with transit stop density within a mile of home. Transit service is complementary to walking, as households with good access to transit own fewer private vehicles and hence are more likely to use alternative modes.
Table 1. Negative Binomial Model of Household Walk Trips
coeff std error
t-ratio
p-value
constant -3.64 0.38 -9.55 <0.001
hhsize 0.424 0.012 36.2 <0.001
lnhhincome -0.0892 0.0233 -3.83 <0.001
entropy1/4mi 0.379 0.067 5.69 <0.001
lnactden1mi 0.279 0.027 10.5 <0.001
int4w1mi 0.0114 0.0013 9.01 <0.001
stopden1mi 0.00507 0.00075 6.72 <0.001
pseudo-R2 0.26
hhwalktrips =-3.64 + 0.424*hhsize - 0.0892*ln(hhincome) + 0.379*entropy1/4mi + 0.279*ln(actden1mi) + 0.0114* int4w1mi + 0.00507* stopden1mi

Household Travel App
7
perwalktrips = hhwalktrips/hhsize
where hhwalktrips is the predicted average number of daily walk trips per household, perwalktrips is the average number of daily walk trips per person
hhsize is the average household size
ln(hhincome) is the natural log of real household income (1973 dollars)
entropy1/4mi is land use entropy within a one quarter mile buffer around the household
ln(actden1mi) is the natural log of activity density(pop + emp per square mile) within a one mile buffer around the household
int4w1mi is the percentage of 4-way intersections within a one mile buffer around the household
stopden1mi is the transit stop density within a one mile buffer of the household
The bike trip model is the simplest of the six models estimated. Bike trip frequency increases with household size, land use entropy within a quarter mile, activity density within a mile, and percentage of 4-way intersections within a mile. All three built environmental variables tend to reduce bicycling distances between home and trip attractions, thereby reducing the generalized cost of bicycling relative to automobile use. The pseudo-R2 of this model is, predictably, also low.
Table 2. Negative Binomial Model of Household Bike Trips
coeff std error
t-ratio
p-value
constant -5.91 0.37 -15.9 <0.001
hhsize 0.472 0.025 18.7 <0.001
entropy1/4mi 0.406 0.162 2.50 0.012
actden1mi 0.000006 0.000002 2.81 0.005
lnint4w1mi 0.726 0.084 8.64 <0.001
pseudo-R2 0.18
hhbiketrips =-5.91+ 0.472*hhsize + 0.406*entropy1/4mi + 0.000006*actden1mi + 0.726* ln(int4w1mi)]
perbiketrips = hhbiketrips/hhsize
lnint4w1mi is the natural log of intersection density for a one-mile buffer around the household
Household Travel App
8
and where other variables are as defined above
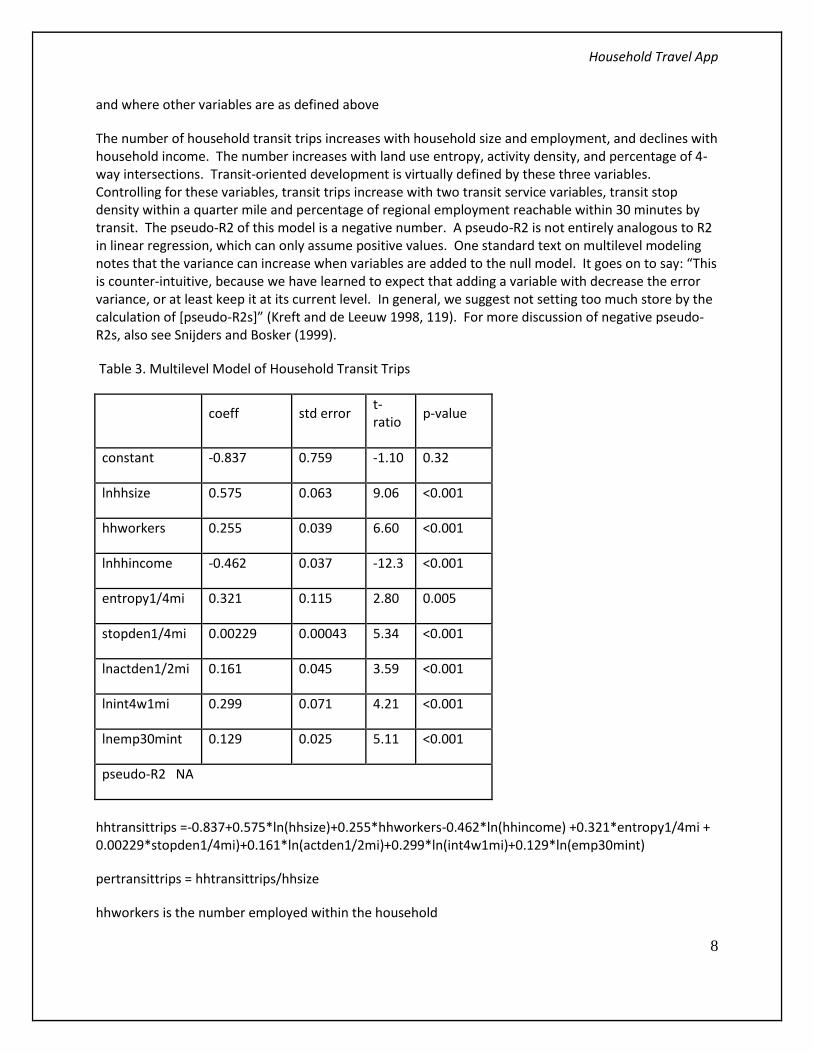
The number of household transit trips increases with household size and employment, and declines with household income. The number increases with land use entropy, activity density, and percentage of 4-way intersections. Transit-oriented development is virtually defined by these three variables. Controlling for these variables, transit trips increase with two transit service variables, transit stop density within a quarter mile and percentage of regional employment reachable within 30 minutes by transit. The pseudo-R2 of this model is a negative number. A pseudo-R2 is not entirely analogous to R2 in linear regression, which can only assume positive values. One standard text on multilevel modeling notes that the variance can increase when variables are added to the null model. It goes on to say: “This is counter-intuitive, because we have learned to expect that adding a variable with decrease the error variance, or at least keep it at its current level. In general, we suggest not setting too much store by the calculation of [pseudo-R2s]” (Kreft and de Leeuw 1998, 119). For more discussion of negative pseudo-R2s, also see Snijders and Bosker (1999).
Table 3. Multilevel Model of Household Transit Trips
coeff std error
t-ratio
p-value
constant -0.837 0.759 -1.10 0.32
lnhhsize 0.575 0.063 9.06 <0.001
hhworkers 0.255 0.039 6.60 <0.001
lnhhincome -0.462 0.037 -12.3 <0.001
entropy1/4mi 0.321 0.115 2.80 0.005
stopden1/4mi 0.00229 0.00043 5.34 <0.001
lnactden1/2mi 0.161 0.045 3.59 <0.001
lnint4w1mi 0.299 0.071 4.21 <0.001
lnemp30mint 0.129 0.025 5.11 <0.001
pseudo-R2 NA
hhtransittrips =-0.837+0.575*ln(hhsize)+0.255*hhworkers-0.462*ln(hhincome) +0.321*entropy1/4mi + 0.00229*stopden1/4mi)+0.161*ln(actden1/2mi)+0.299*ln(int4w1mi)+0.129*ln(emp30mint)
pertransittrips = hhtransittrips/hhsize
hhworkers is the number employed within the household
Household Travel App
9
stopden1/4mi is the transit stop density within a one quarter mile buffer of the household
ln(actden1/2mi) is the natural log of activity density (pop + emp per square mile) within a one half mile buffer around the household
ln(emp30mint) is the percentage of regional employment within 30 minutes by transit
and where other variables are as defined above
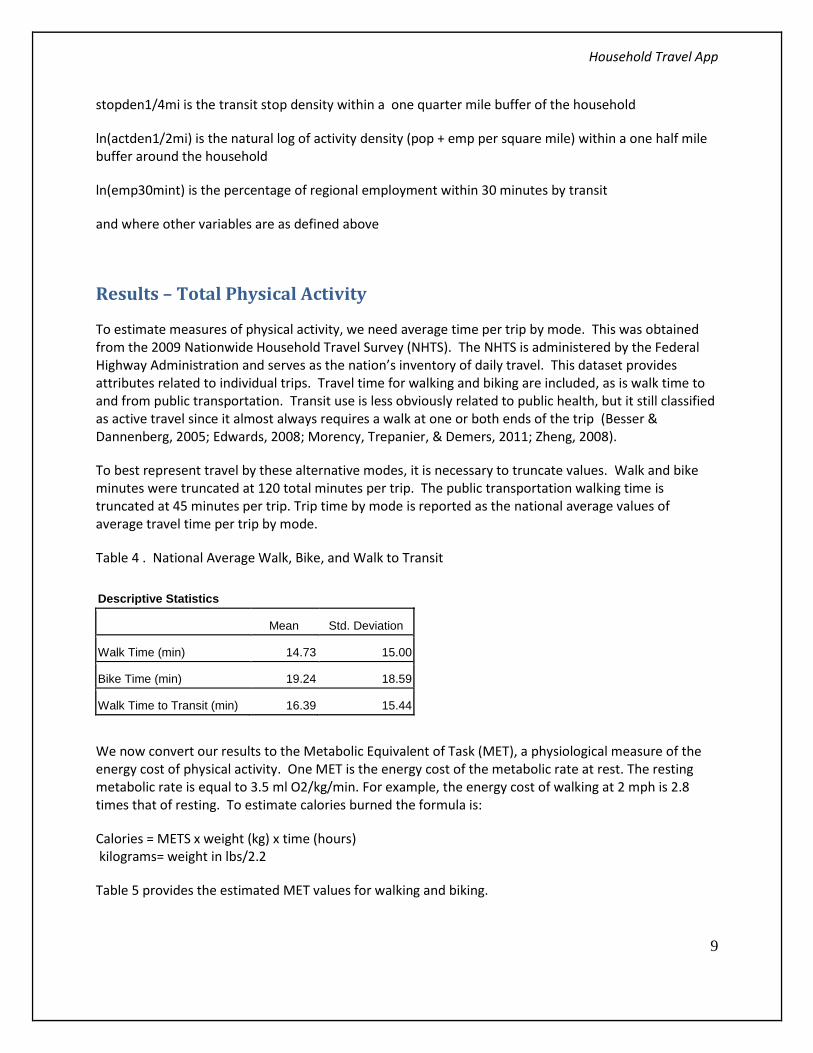
Results – Total Physical Activity
To estimate measures of physical activity, we need average time per trip by mode. This was obtained from the 2009 Nationwide Household Travel Survey (NHTS). The NHTS is administered by the Federal Highway Administration and serves as the nation’s inventory of daily travel. This dataset provides attributes related to individual trips. Travel time for walking and biking are included, as is walk time to and from public transportation. Transit use is less obviously related to public health, but it still classified as active travel since it almost always requires a walk at one or both ends of the trip (Besser & Dannenberg, 2005; Edwards, 2008; Morency, Trepanier, & Demers, 2011; Zheng, 2008).
To best represent travel by these alternative modes, it is necessary to truncate values. Walk and bike minutes were truncated at 120 total minutes per trip. The public transportation walking time is truncated at 45 minutes per trip. Trip time by mode is reported as the national average values of average travel time per trip by mode.
Table 4 . National Average Walk, Bike, and Walk to Transit
Descriptive Statistics
Mean Std. Deviation
Walk Time (min) 14.73 15.00
Bike Time (min) 19.24 18.59
Walk Time to Transit (min) 16.39 15.44
We now convert our results to the Metabolic Equivalent of Task (MET), a physiological measure of the energy cost of physical activity. One MET is the energy cost of the metabolic rate at rest. The resting metabolic rate is equal to 3.5 ml O2/kg/min. For example, the energy cost of walking at 2 mph is 2.8 times that of resting. To estimate calories burned the formula is:
Calories = METS x weight (kg) x time (hours) kilograms= weight in lbs/2.2
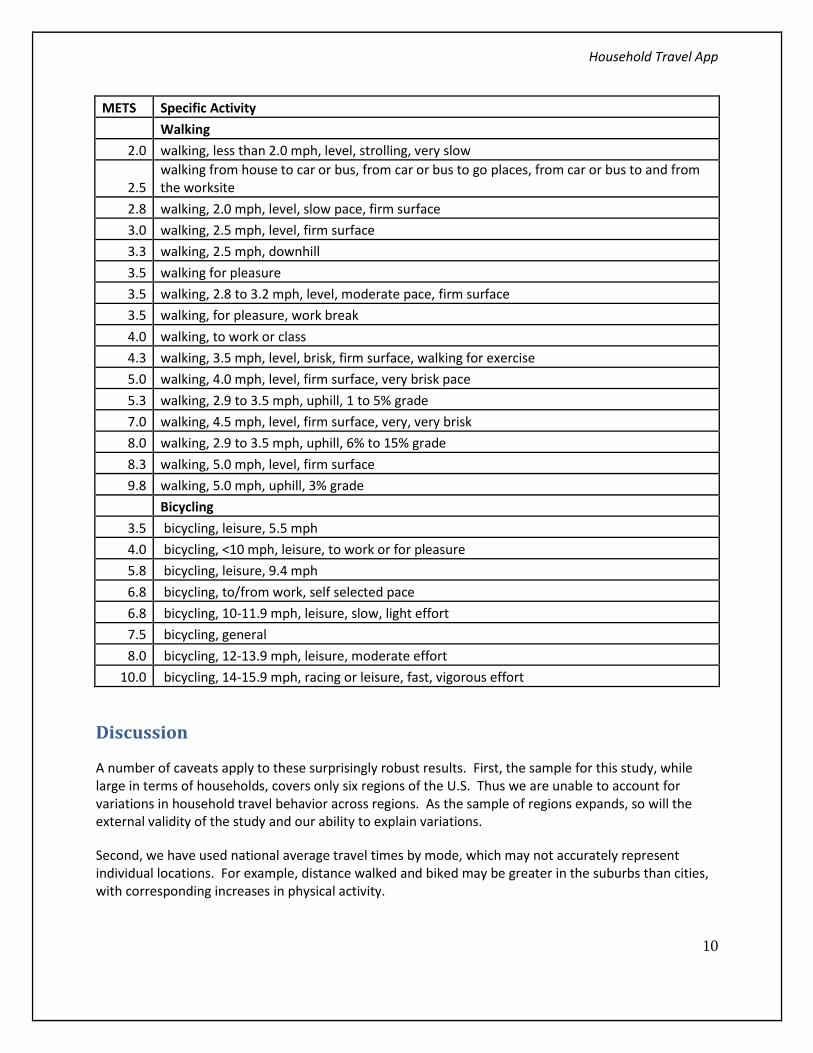
Table 5 provides the estimated MET values for walking and biking.
Household Travel App
10
METS Specific Activity
Walking
2.0 walking, less than 2.0 mph, level, strolling, very slow
2.5 walking from house to car or bus, from car or bus to go places, from car or bus to and from the worksite
2.8 walking, 2.0 mph, level, slow pace, firm surface
3.0 walking, 2.5 mph, level, firm surface
3.3 walking, 2.5 mph, downhill
3.5 walking for pleasure
3.5 walking, 2.8 to 3.2 mph, level, moderate pace, firm surface
3.5 walking, for pleasure, work break
4.0 walking, to work or class
4.3 walking, 3.5 mph, level, brisk, firm surface, walking for exercise
5.0 walking, 4.0 mph, level, firm surface, very brisk pace
5.3 walking, 2.9 to 3.5 mph, uphill, 1 to 5% grade
7.0 walking, 4.5 mph, level, firm surface, very, very brisk
8.0 walking, 2.9 to 3.5 mph, uphill, 6% to 15% grade
8.3 walking, 5.0 mph, level, firm surface
9.8 walking, 5.0 mph, uphill, 3% grade
Bicycling
3.5 bicycling, leisure, 5.5 mph
4.0 bicycling, <10 mph, leisure, to work or for pleasure
5.8 bicycling, leisure, 9.4 mph
6.8 bicycling, to/from work, self selected pace
6.8 bicycling, 10-11.9 mph, leisure, slow, light effort
7.5 bicycling, general
8.0 bicycling, 12-13.9 mph, leisure, moderate effort
10.0 bicycling, 14-15.9 mph, racing or leisure, fast, vigorous effort
Discussion
A number of caveats apply to these surprisingly robust results. First, the sample for this study, while large in terms of households, covers only six regions of the U.S. Thus we are unable to account for variations in household travel behavior across regions. As the sample of regions expands, so will the external validity of the study and our ability to explain variations.
Second, we have used national average travel times by mode, which may not accurately represent individual locations. For example, distance walked and biked may be greater in the suburbs than cities, with corresponding increases in physical activity.

Household Travel App
11
Finally, we did not account for self-selection, where individuals who want to walk, bike, or use transit choose to live or work in walkable, bikeable, or transit-served areas. Nearly all studies of residential selection—the tendency of people to choose residential locations that match their travel preferences—have found that residential self-selection attenuates the effects of the built environment on travel. At the same time, nearly all of them have found “resounding” evidence of statistically significant associations between the built environment and travel behavior, independent of self-selection influences (Cao, Mokhtarian, et al. 2009, p. 389). Where the magnitude of the self-selection effect has been compared to the effect of the built environment on travel, the former has been found to be secondary (Ewing and Cervero, 2010). Thus, we shouldn’t overstate the importance of this caveat.
Bibliography
Besser, L. M. M., & Dannenberg, A. L. M., Mph. (2005). Walking to Public Transit Steps to
Help Meet Physical Activity Recommendations. American Journal of Preventative
Medicine, 29(4), 273-281.
Committee on Physical Activity, H., Transportation,and Land Use. (2005). Does the Built
Environment Influence Physical Activity? Examining the Evidence -- Special Report
282. Transportation Research Board Institute of Medicine.
Danaei, G., Ding, E. L., Mozaffarian, D., Taylor, R. P., Rehm, J. R., Murray, C. J. L., & Ezzat,
M. (2009). The Preventable Causes of Death in the United States: Comparative Risk
Assessment of Dietary, Lifestyle, and Metabolic Risk Factors. PLoS Medicine, 6(4), 1-
23. Retrieved from www.plosmedicine.org
Ding, D., & Gebel, K. M. (2012). Built environment,physical activity,and obesity:What have we
learned from reviewing the literature? Health &Place, 18, 100-105.
Durand, C. P., Andalib, M., Dunton, G. F., Wolch, J., & Pentz, M. A. (2011). A systematic
review of built environment factors related to physical activity and obesity risk:
implications for smart growth urban planning. Obesity Revews, 12(173-182).
Edwards, R. D. (2008). Public transit, obesity, and medical costs: Assessing the magnitudes.
Preventative Medicine, 46(1), 14-21.
Humpel, N., Owen, N., & Leslie, E. (2002). Environmental factors associated with adults
participation in physical activity. American Journal of Preventive Medicine, 26, 119–125.
Kaczynski, A. T., & Henderson, K. A. (2007). Environmental Correlates of Physical Activity: A
Review of Evidence about Parks and Recreation. Leisure Sciences, 29, 315-354.
Khan, L. K., Sobush, K., Keener, D., Goodman, K., Lowry, A., Kakietek, J., & Zaro, S. (2009).
Centers for Disease Control and Prevention. Recommended Community Strategies and
Measurements to Prevent Obesity in the United States. MMWR, 58(RR-7), 1-29.
Koplan, J. (1999). Caloric Imbalance and public health policy. Journal of the American Medical
Association.
Lee, C., & Moudon, A. V. (2004). Physical Activity and Environment Research in the Health
Field: Implications for Urban and Transportation Planning Practice and Research.
Journal of Planning Literature, 19(2), 147-181.
Mccormack, G., Giles-Corti, B., Lange, A., Smith, T., Martin, K., & Pikora, T. (2004). An
update of recent evidence of the relationship between objective and self-report measures
Household Travel App
12
of the physical environment and physical activity behaviours. Journal of Science and
Medicine in Sport, 7(1), 81-92.
Mcginnis, J., & Foerge, W. (1993). Actual Causes of Death in the United States. JAMA, 2207-
2212.
Mokdad, A. H., Marks, J. S., Stroup, D. F., & Gerberding, J. L. (2004). Actual Causes of Death
in the United States 2000. Journal of the American Medical Association, 291(10), 1238-
1245.
Morency, C., Trepanier, M., & Demers, M. (2011). Walking
totransit:Anunexpectedsourceofphysicalactivity. Transport Policy, 18, 800-806.
Owen, N. P., Humpel, N. P., Leslie, E. P., Bauman, A. P., & Sallis, J. F. P. (2004).
Understanding Environmental Influences on Walking Review and Research Agenda.
American Journal of Preventative Medicine, 27(1), 67-76.
Saelens, B., & Handy, S. (2008). Built Environment Correlates of Walking: A Review. Medicine
and Science in Sports and Exercise, 40(7S), 550-566.
Trost, S. G., Owen, N., Bauman, A. E., Sallis, J. F., & Brown, W. (2002). Correlates of adults?
participation in physical activity: review and update. Medicine and Science in Sports and
Exercise 34(12), 1996-2001
Vancauwenberg, J., De Bourdeaudhuij, I., Demeester, F., Van Dyke, D., Salmon, J., Clarys, P.,
& Deforche, B. (2011). Relationship between the physical environment and physical
activity in older adults: A systematic review. Health &Place, 17, 458-469.
Who. The Determinants of Health. Health Impact Assessment (HIA) Retrieved June 10, 2010
Zheng, B. (2008). The benefit of public transportation: Physical activity to reduce obesity and
ecological footprint. Preventative Medicine, 46(1), 4-5.