Embed Size (px)
Citation preview
Public Expose 2020PT BANK RAKYAT INDONESIA (PERSERO) Tbk.
2
BRI AT A GLANCE
3
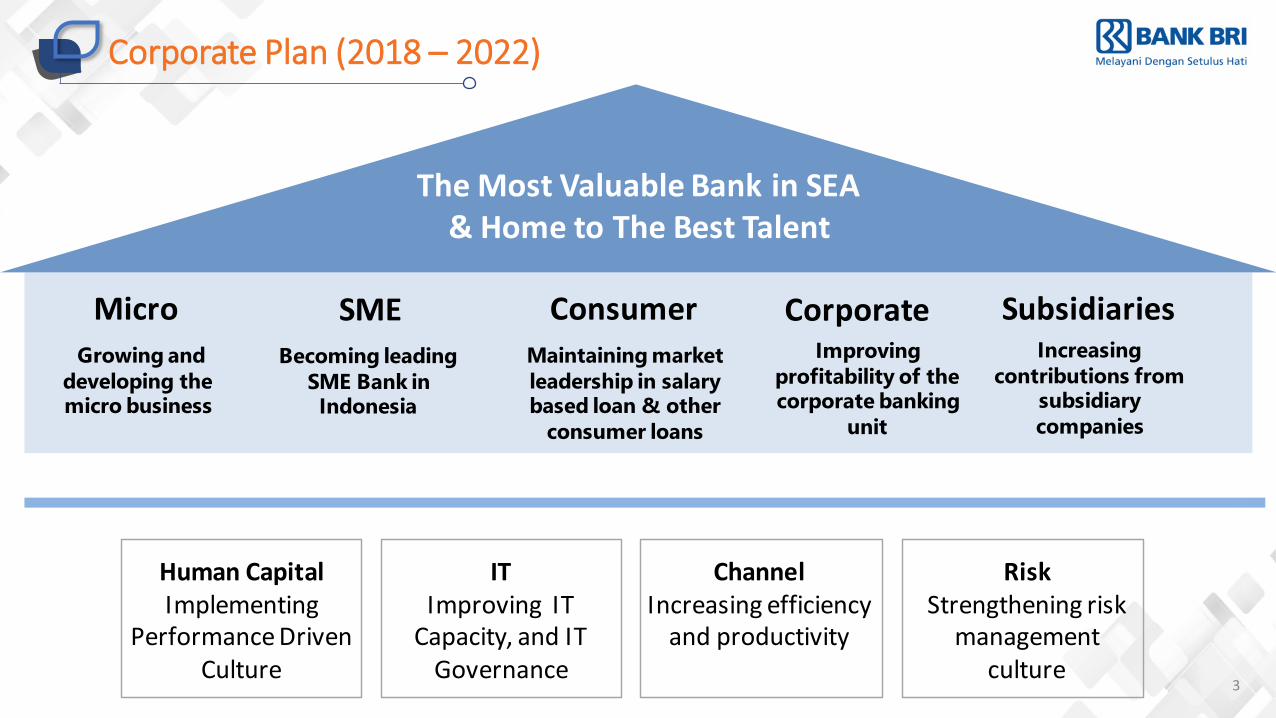
Corporate Plan (2018 – 2022)
The Most Valuable Bank in SEA& Home to The Best Talent
Micro SME Consumer Corporate SubsidiariesGrowing and
developing the micro business
Maintaining market
leadership in salary based loan & other
consumer loans
Becoming leading
SME Bank in Indonesia
Improving
profitability of the corporate banking
unit
Increasing
contributions from subsidiary
companies
Human CapitalImplementing
Performance Driven Culture
ITImproving IT
Capacity, and IT Governance
ChannelIncreasing efficiency
and productivity
RiskStrengthening risk
management culture
4
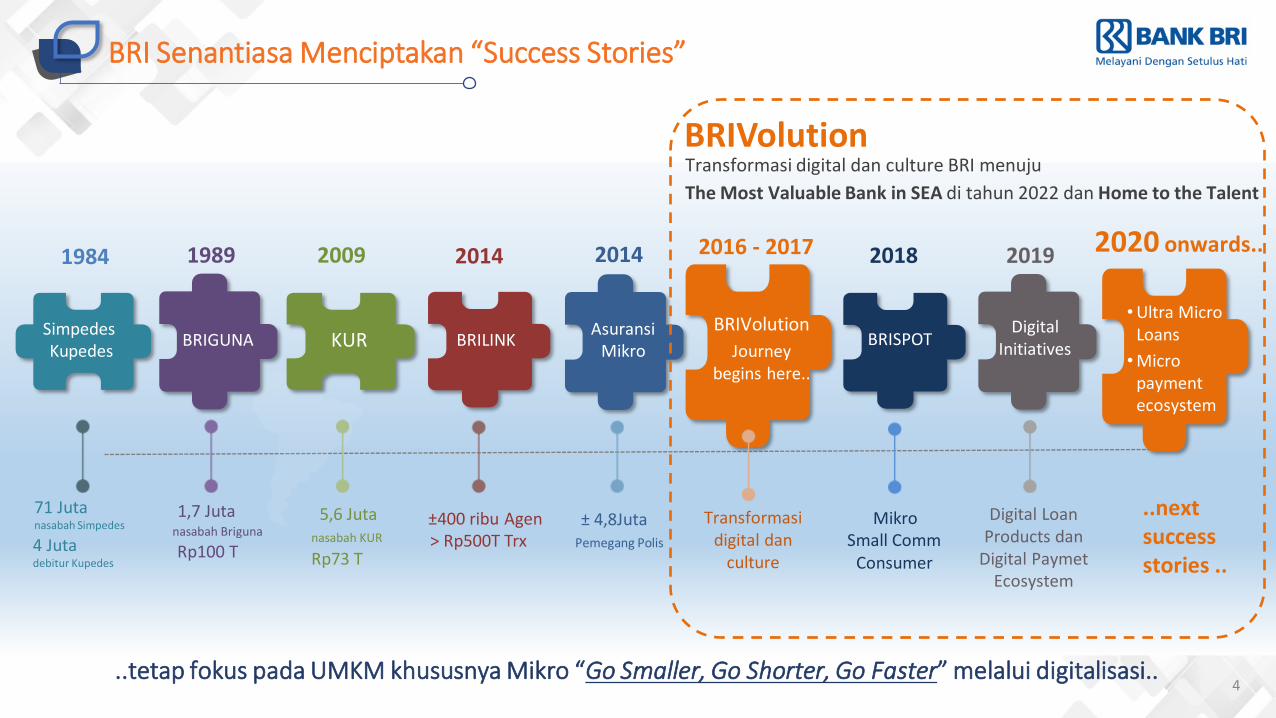
BRI Senantiasa Menciptakan “Success Stories”
SimpedesKupedes
1984
4 Jutadebitur Kupedes
71 Jutanasabah Simpedes
BRIGUNA
1989
1,7 Jutanasabah Briguna
Rp100 T
KUR
2009
5,6 Jutanasabah KUR
Rp73 T
BRILINK
2014
±400 ribu Agen> Rp500T Trx
AsuransiMikro
2014
± 4,8JutaPemegang Polis
BRISPOT
2018
MikroSmall Comm
Consumer
..nextsuccess stories ..
2019
Digital Loan Products dan
Digital Paymet Ecosystem
Digital Initiatives
2020 onwards..
•Ultra Micro Loans
•Micro payment ecosystem
2016 - 2017
BRIVolution
Journey begins here..
BRIVolutionTransformasi digital dan culture BRI menuju
The Most Valuable Bank in SEA di tahun 2022 dan Home to the Talent
Transformasi digital dan
culture
..tetap fokus pada UMKM khususnya Mikro “Go Smaller, Go Shorter, Go Faster” melalui digitalisasi..
2003 2007 2011 2015 2020
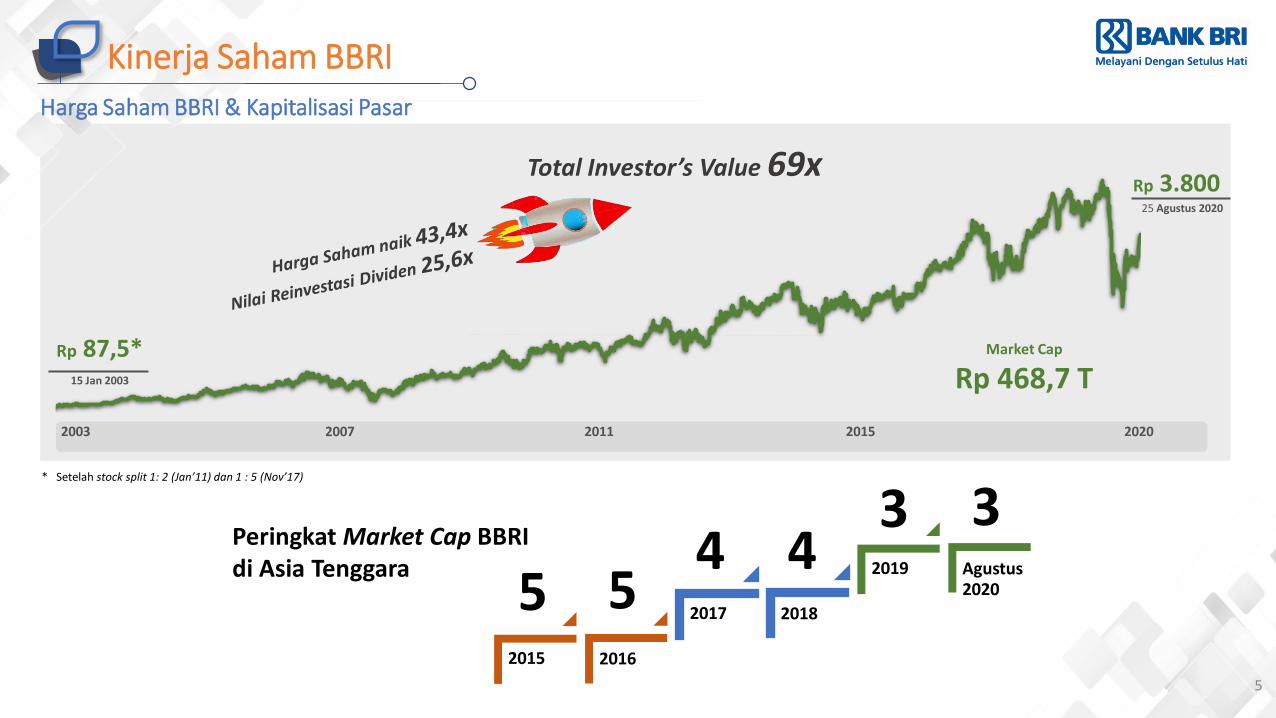
Kinerja Saham BBRI
5
Harga Saham BBRI & Kapitalisasi Pasar
* Setelah stock split 1: 2 (Jan’11) dan 1 : 5 (Nov’17)
Rp 3.80025 Agustus 2020
Market Cap
Rp 468,7 TRp 87,5*
15 Jan 2003
Total Investor’s Value 69x
2015 2016
2017 2018
2019 Agustus 20205 5
4 43 3
Peringkat Market Cap BBRIdi Asia Tenggara
6
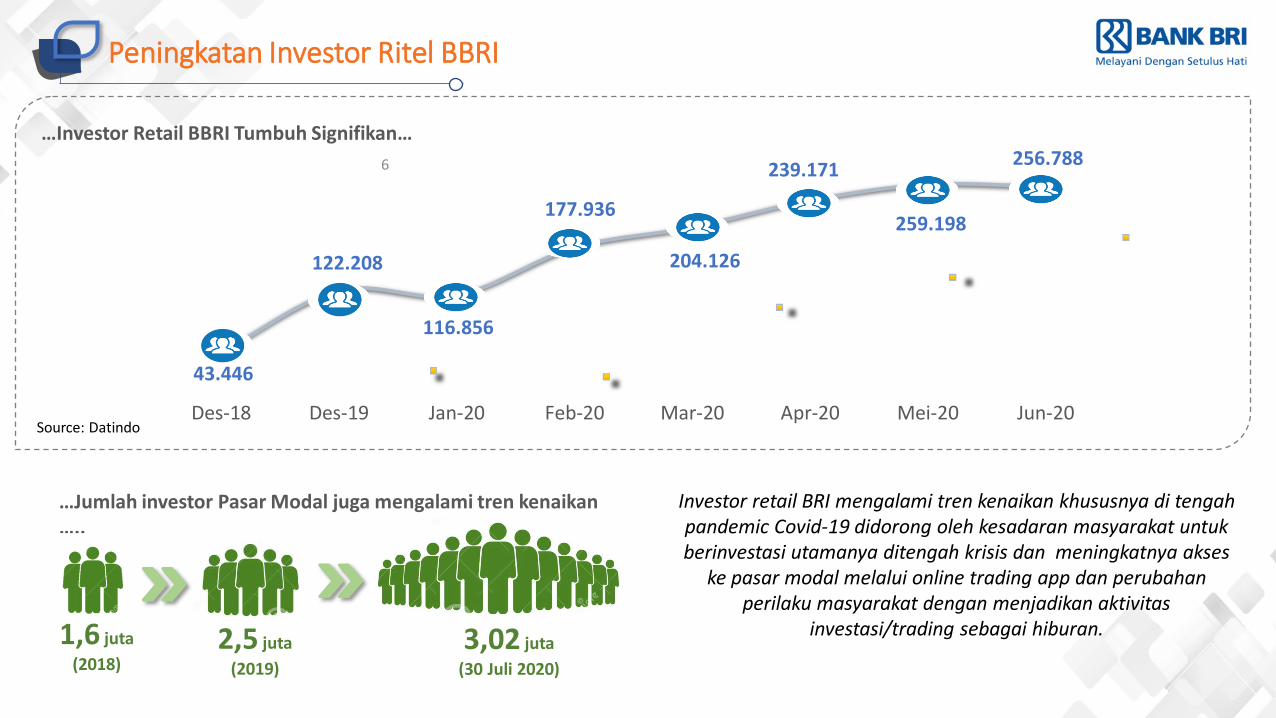
Peningkatan Investor Ritel BBRI
43.446
122.208
116.856
177.936
204.126
239.171
259.198
256.788
Des-18 Des-19 Jan-20 Feb-20 Mar-20 Apr-20 Mei-20 Jun-20
Investor retail BRI mengalami tren kenaikan khususnya di tengah pandemic Covid-19 didorong oleh kesadaran masyarakat untuk berinvestasi utamanya ditengah krisis dan meningkatnya akses
ke pasar modal melalui online trading app dan perubahan perilaku masyarakat dengan menjadikan aktivitas
investasi/trading sebagai hiburan.
…Investor Retail BBRI Tumbuh Signifikan…
2,5 juta
(2019)
…Jumlah investor Pasar Modal juga mengalami tren kenaikan …..
1,6 juta
(2018)3,02 juta
(30 Juli 2020)
Source: Datindo
7
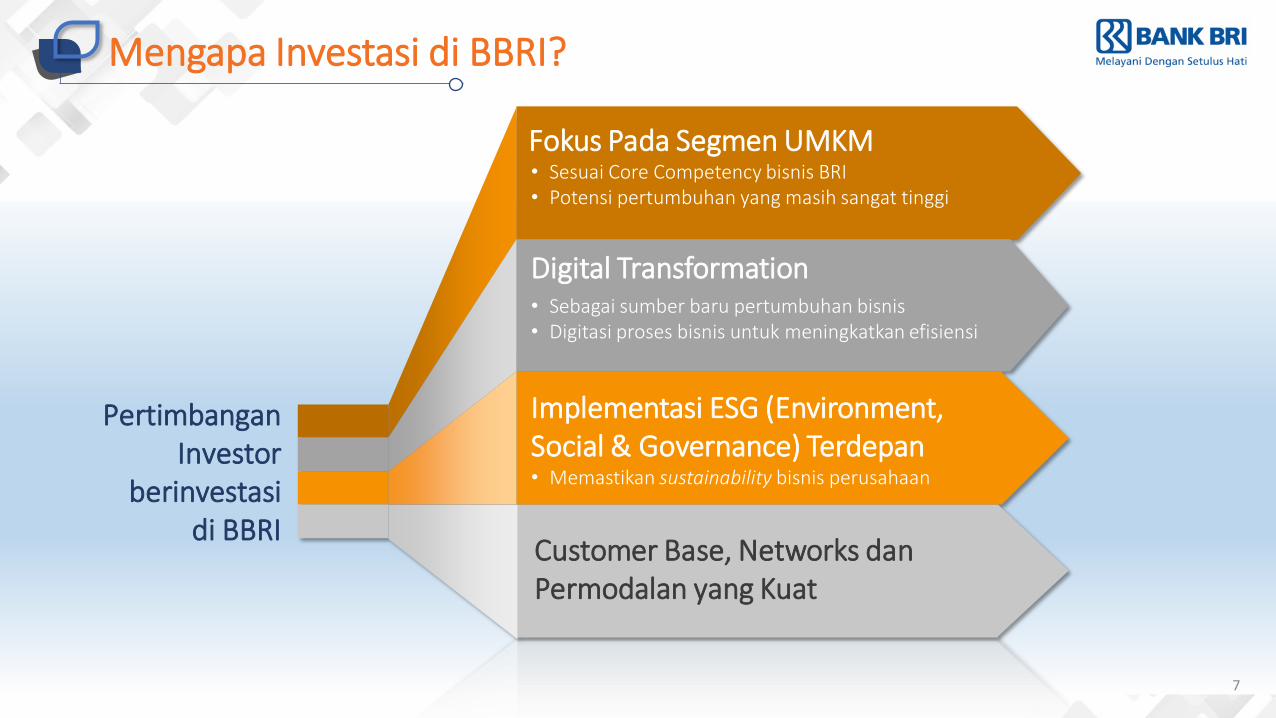
Mengapa Investasi di BBRI?
PertimbanganInvestor
berinvestasidi BBRI
Fokus Pada Segmen UMKM
Digital Transformation
Customer Base, Networks dan Permodalan yang Kuat
• Sesuai Core Competency bisnis BRI• Potensi pertumbuhan yang masih sangat tinggi
• Sebagai sumber baru pertumbuhan bisnis• Digitasi proses bisnis untuk meningkatkan efisiensi
Implementasi ESG (Environment, Social & Governance) Terdepan • Memastikan sustainability bisnis perusahaan
8
STRATEGI BRI DI MASA PANDEMI & PROGRAM PEMULIHAN EKONOMI NASIONAL (PEN)
9
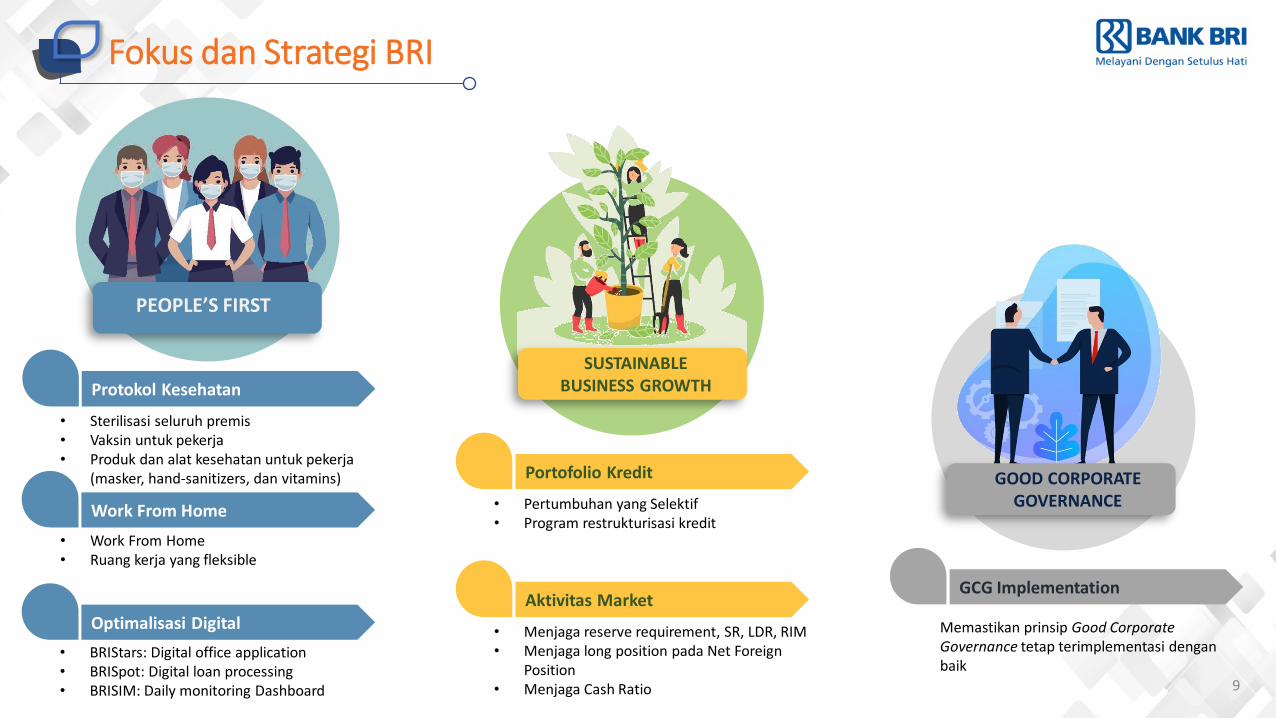
Fokus dan Strategi BRI
PEOPLE’S FIRST
SUSTAINABLEBUSINESS GROWTH
GOOD CORPORATE GOVERNANCE
Protokol Kesehatan
Work From Home
Optimalisasi Digital
• Sterilisasi seluruh premis • Vaksin untuk pekerja• Produk dan alat kesehatan untuk pekerja
(masker, hand-sanitizers, dan vitamins)
• Work From Home• Ruang kerja yang fleksible
• BRIStars: Digital office application• BRISpot: Digital loan processing• BRISIM: Daily monitoring Dashboard
Portofolio Kredit
• Pertumbuhan yang Selektif• Program restrukturisasi kredit
Aktivitas Market
• Menjaga reserve requirement, SR, LDR, RIM • Menjaga long position pada Net Foreign
Position• Menjaga Cash Ratio
GCG Implementation
Memastikan prinsip Good Corporate Governance tetap terimplementasi dengan baik
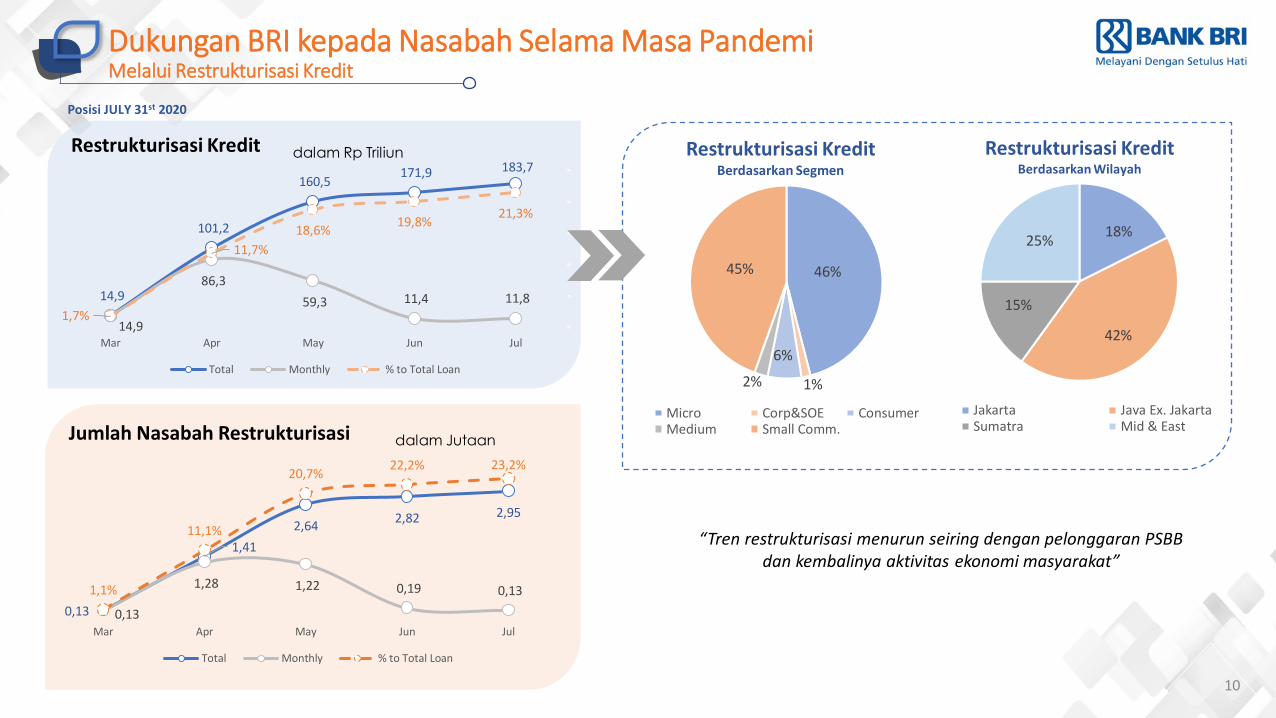
Restrukturisasi KreditBerdasarkan Segmen
46%
1%
6%
2%
45%
Micro Corp&SOE ConsumerMedium Small Comm.
18%
42%
15%
25%
Jakarta Java Ex. JakartaSumatra Mid & East
Restrukturisasi KreditBerdasarkan Wilayah
10
Dukungan BRI kepada Nasabah Selama Masa PandemiMelalui Restrukturisasi Kredit
Restrukturisasi Kredit dalam Rp Triliun
Jumlah Nasabah Restrukturisasi dalam Jutaan
Posisi JULY 31st 2020
14,9
101,2
160,5 171,9 183,7
14,9
86,3
59,3 11,4 11,8 1,7%
11,7%
18,6%19,8%
21,3%
0,0%
5,0%
10,0%
15,0%
20,0%
25,0%
-
20,0
40,0
60,0
80,0
100,0
120,0
140,0
160,0
180,0
200,0
Mar Apr May Jun Jul
Total Monthly % to Total Loan
0,13
1,41
2,642,82 2,95
0,13
1,28 1,22 0,19 0,13 1,1%
11,1%
20,7%22,2% 23,2%
0,0%
5,0%
10,0%
15,0%
20,0%
25,0%
0,00
0,50
1,00
1,50
2,00
2,50
3,00
3,50
Mar Apr May Jun Jul
Total Monthly % to Total Loan
“Tren restrukturisasi menurun seiring dengan pelonggaran PSBB dan kembalinya aktivitas ekonomi masyarakat”
11
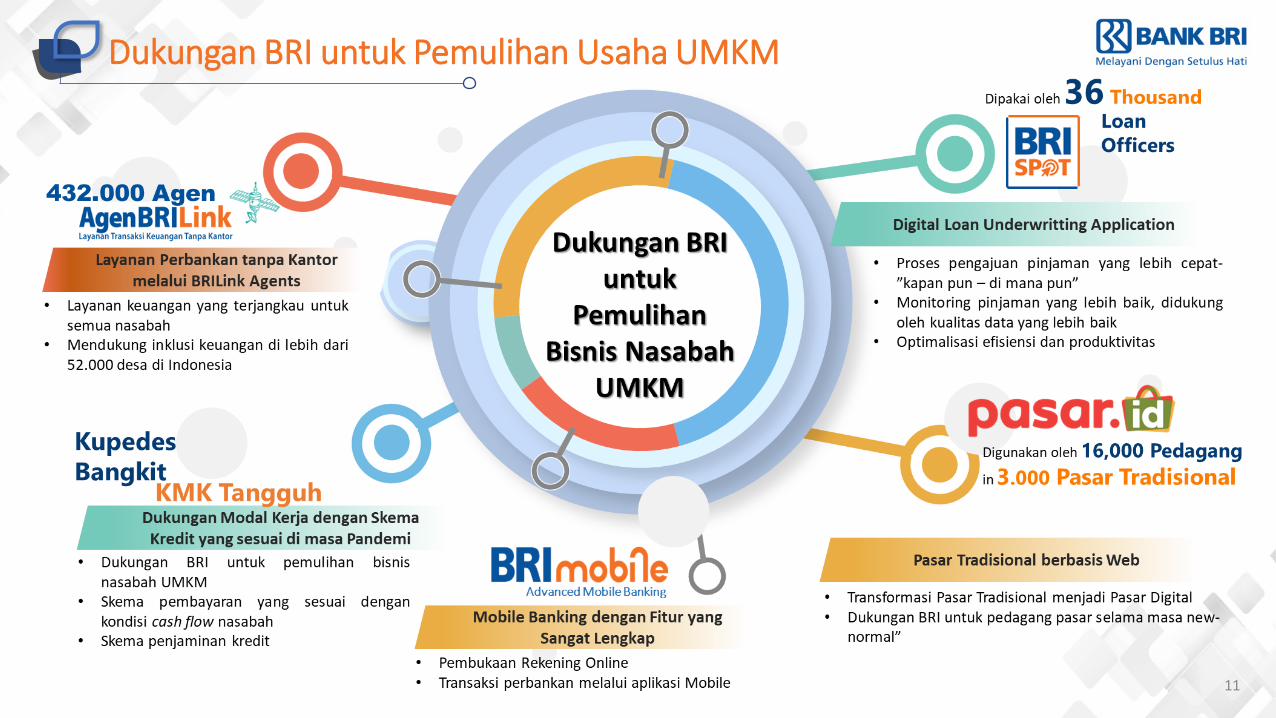
Dukungan BRI untuk Pemulihan Usaha UMKM
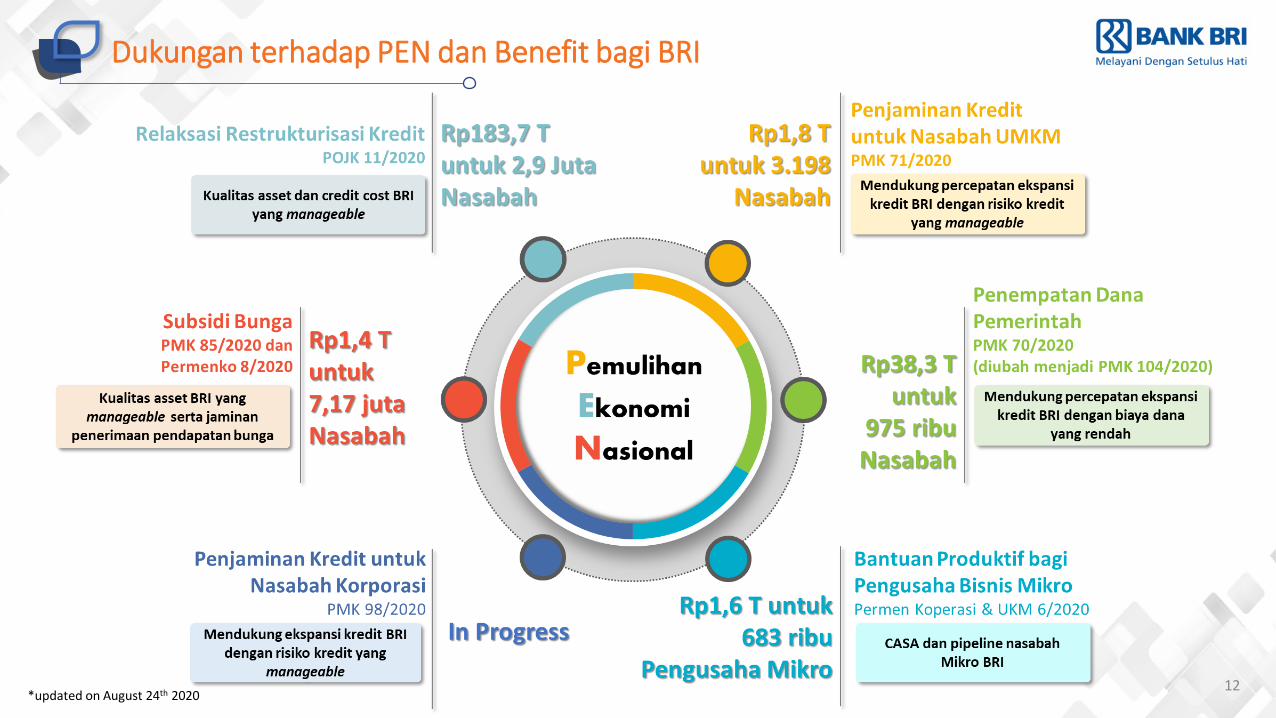
Dukungan terhadap PEN dan Benefit bagi BRI
*updated on August 24th 202012

13
BUSINESS UPDATE
14
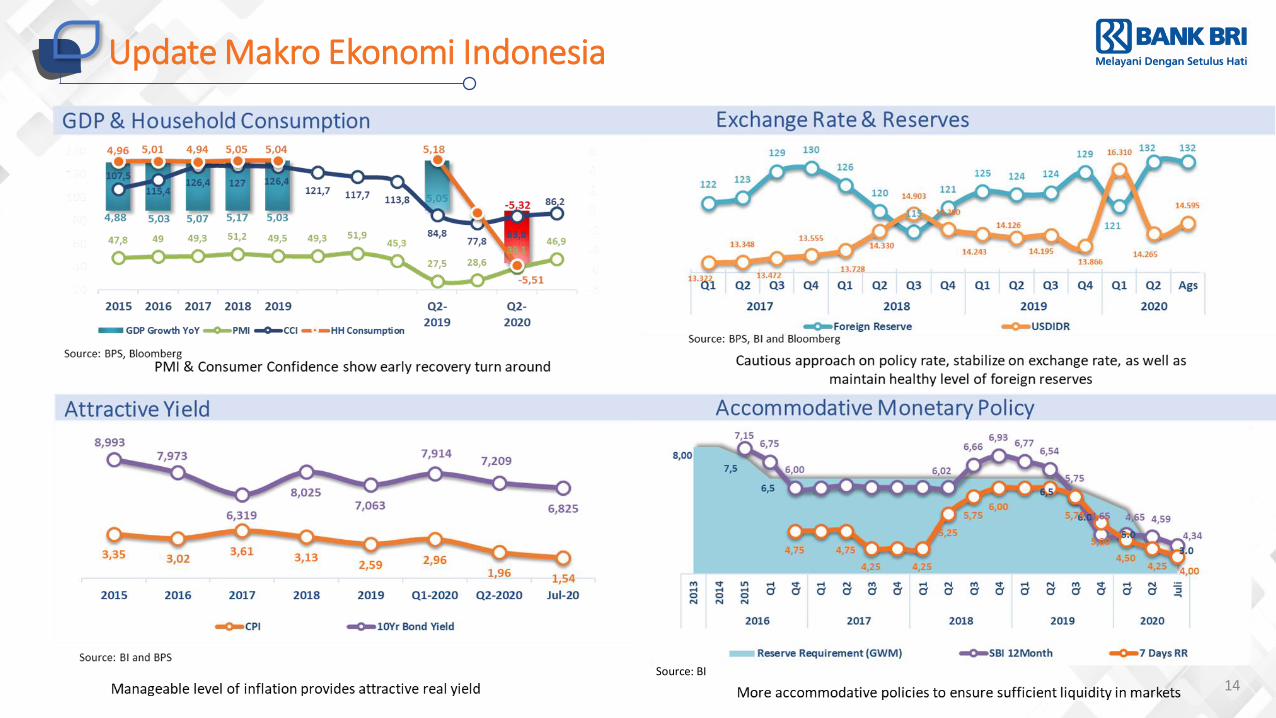
Update Makro Ekonomi Indonesia
Source: BI
15
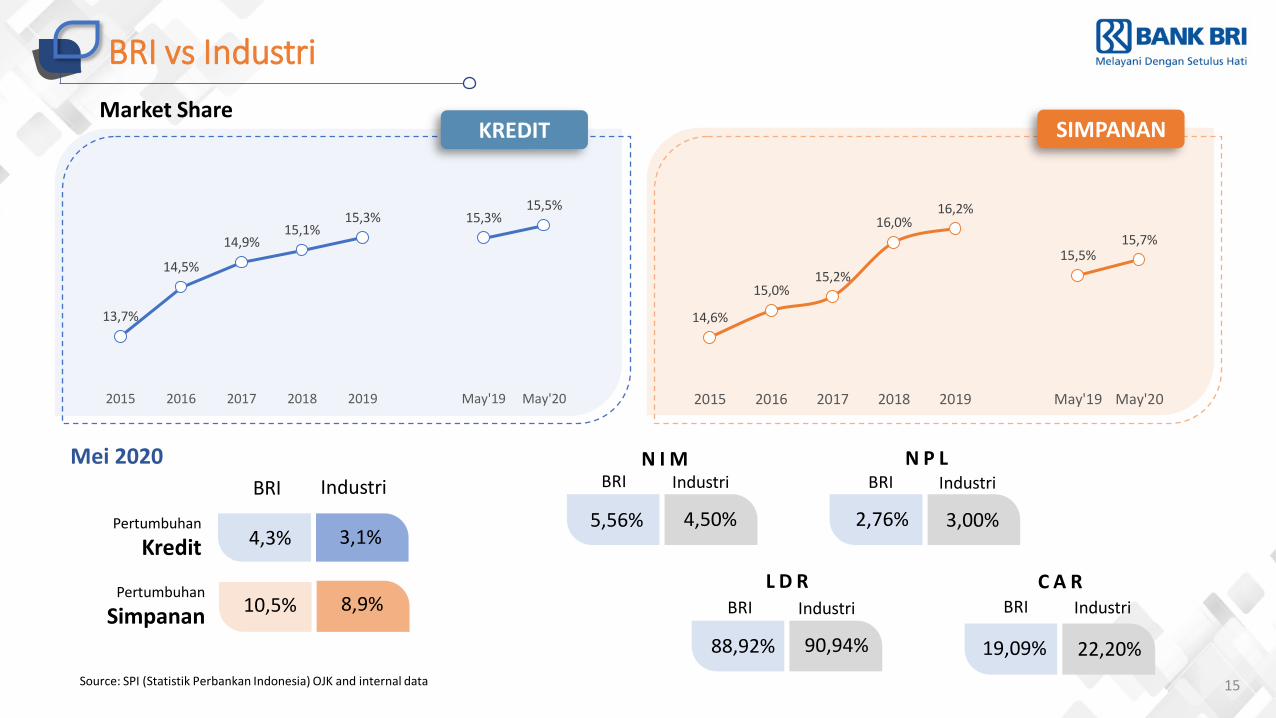
BRI vs Industri
Market Share
Source: SPI (Statistik Perbankan Indonesia) OJK and internal data
KREDIT SIMPANAN
Pertumbuhan
Kredit
BRI Industri
4,3% 3,1%
8,9%10,5%
N I M N P L
L D R
5,56% 2,76%
88,92%
C A R
19,09%
BRI Industri BRI Industri
BRI Industri BRI Industri
4,50% 3,00%
90,94% 22,20%
13,7%
14,5%
14,9%15,1%
15,3% 15,3%15,5%
13,0%
13,5%
14,0%
14,5%
15,0%
15,5%
16,0%
16,5%
2015 2016 2017 2018 2019 May'19 May'20
14,6%
15,0%15,2%
16,0%16,2%
15,5%15,7%
14,0%
14,5%
15,0%
15,5%
16,0%
16,5%
17,0%
2015 2016 2017 2018 2019 May'19 May'20
Mei 2020
Pertumbuhan
Simpanan
16
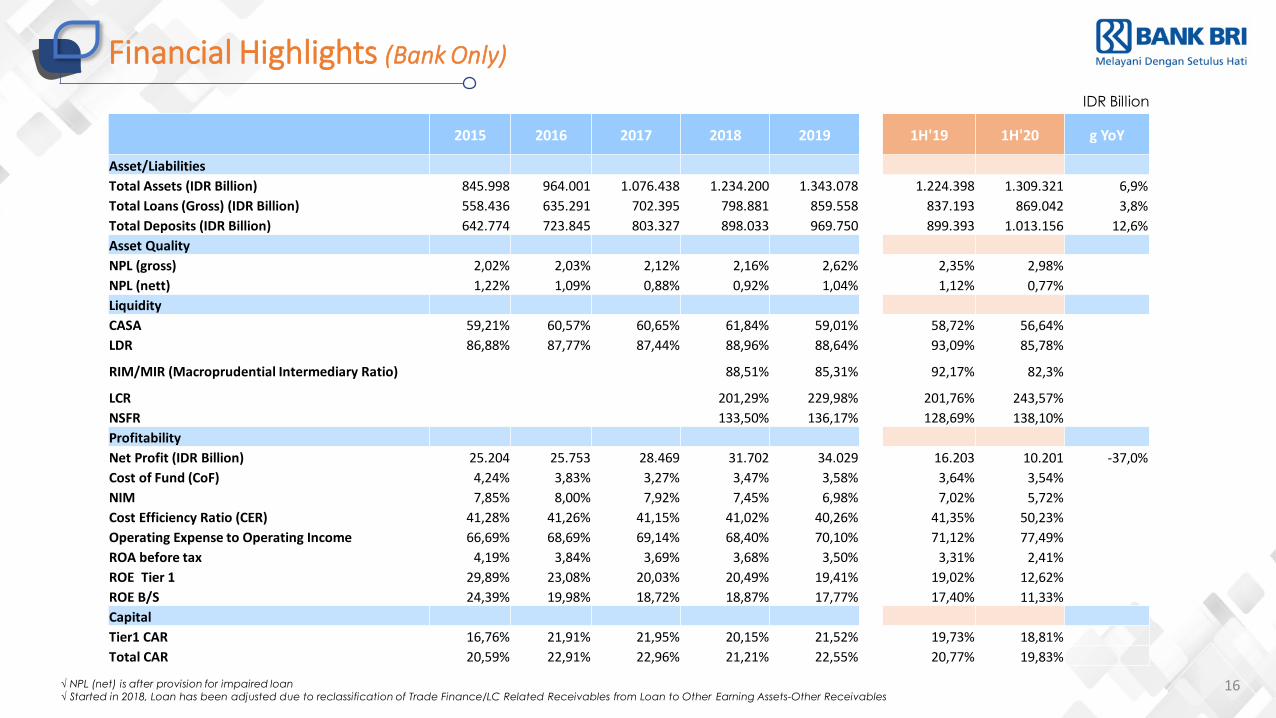
Financial Highlights (Bank Only)
√ NPL (net) is after provision for impaired loan
√ Started in 2018, Loan has been adjusted due to reclassification of Trade Finance/LC Related Receivables from Loan to Other Earning Assets-Other Receivables
2015 2016 2017 2018 2019 1H'19 1H'20 g YoY
Asset/Liabilities
Total Assets (IDR Billion) 845.998 964.001 1.076.438 1.234.200 1.343.078 1.224.398 1.309.321 6,9%
Total Loans (Gross) (IDR Billion) 558.436 635.291 702.395 798.881 859.558 837.193 869.042 3,8%
Total Deposits (IDR Billion) 642.774 723.845 803.327 898.033 969.750 899.393 1.013.156 12,6%
Asset Quality
NPL (gross) 2,02% 2,03% 2,12% 2,16% 2,62% 2,35% 2,98%
NPL (nett) 1,22% 1,09% 0,88% 0,92% 1,04% 1,12% 0,77%
Liquidity
CASA 59,21% 60,57% 60,65% 61,84% 59,01% 58,72% 56,64%
LDR 86,88% 87,77% 87,44% 88,96% 88,64% 93,09% 85,78%
RIM/MIR (Macroprudential Intermediary Ratio) 88,51% 85,31% 92,17% 82,3%
LCR 201,29% 229,98% 201,76% 243,57%
NSFR 133,50% 136,17% 128,69% 138,10%
Profitability
Net Profit (IDR Billion) 25.204 25.753 28.469 31.702 34.029 16.203 10.201 -37,0%
Cost of Fund (CoF) 4,24% 3,83% 3,27% 3,47% 3,58% 3,64% 3,54%
NIM 7,85% 8,00% 7,92% 7,45% 6,98% 7,02% 5,72%
Cost Efficiency Ratio (CER) 41,28% 41,26% 41,15% 41,02% 40,26% 41,35% 50,23%
Operating Expense to Operating Income 66,69% 68,69% 69,14% 68,40% 70,10% 71,12% 77,49%
ROA before tax 4,19% 3,84% 3,69% 3,68% 3,50% 3,31% 2,41%
ROE Tier 1 29,89% 23,08% 20,03% 20,49% 19,41% 19,02% 12,62%
ROE B/S 24,39% 19,98% 18,72% 18,87% 17,77% 17,40% 11,33%
Capital
Tier1 CAR 16,76% 21,91% 21,95% 20,15% 21,52% 19,73% 18,81%
Total CAR 20,59% 22,91% 22,96% 21,21% 22,55% 20,77% 19,83%
IDR Billion
17
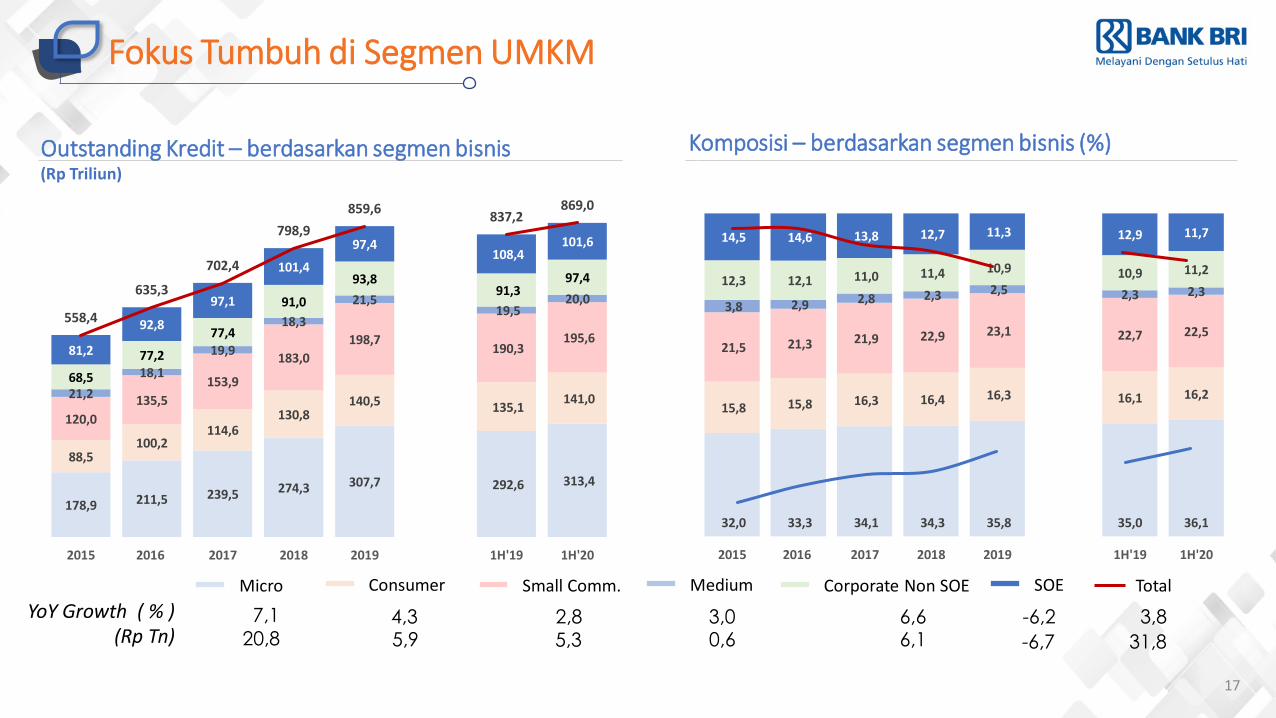
Fokus Tumbuh di Segmen UMKM
178,9 211,5 239,5 274,3 307,7 292,6 313,4
88,5100,2
114,6130,8
140,5 135,1 141,0
120,0
135,5
153,9
183,0
198,7190,3
195,6
21,2
18,1
19,9
18,3
21,519,5
20,0
68,5
77,2
77,4
91,0
93,891,3
97,4
81,2
92,8
97,1
101,4
97,4108,4
101,6
558,4
635,3
702,4
798,9
859,6837,2
869,0
0,0
100,0
200,0
300,0
400,0
500,0
600,0
700,0
800,0
900,0
1000,0
0,0
100,0
200,0
300,0
400,0
500,0
600,0
700,0
800,0
900,0
1000,0
2015 2016 2017 2018 2019 1H'19 1H'20
32,0 33,3 34,1 34,3 35,8 35,0 36,1
15,8 15,8 16,3 16,4 16,3 16,1 16,2
21,5 21,3 21,9 22,9 23,1 22,7 22,5
3,8 2,9 2,8 2,3 2,5 2,3 2,312,3 12,1 11,0 11,4 10,9 10,9 11,2
14,5 14,6 13,8 12,7 11,3 12,9 11,7
-
20,0
40,0
60,0
80,0
100,0
120,0
2015 2016 2017 2018 2019 1H'19 1H'20
7,1YoY Growth ( % ) 4,3 2,8 3,0 6,6 -6,2 3,8(Rp Tn) 20,8 5,9 5,3 0,6 6,1 -6,7 31,8
Outstanding Kredit – berdasarkan segmen bisnis (Rp Triliun)
Komposisi – berdasarkan segmen bisnis (%)
Micro Consumer Small Comm. Medium Corporate Non SOE SOE Total
28,0%
30,0%
32,0%
34,0%
36,0%
38,0%
40,0%
10,0%
15,0%
20,0%
25,0%
30,0%
35,0%
18
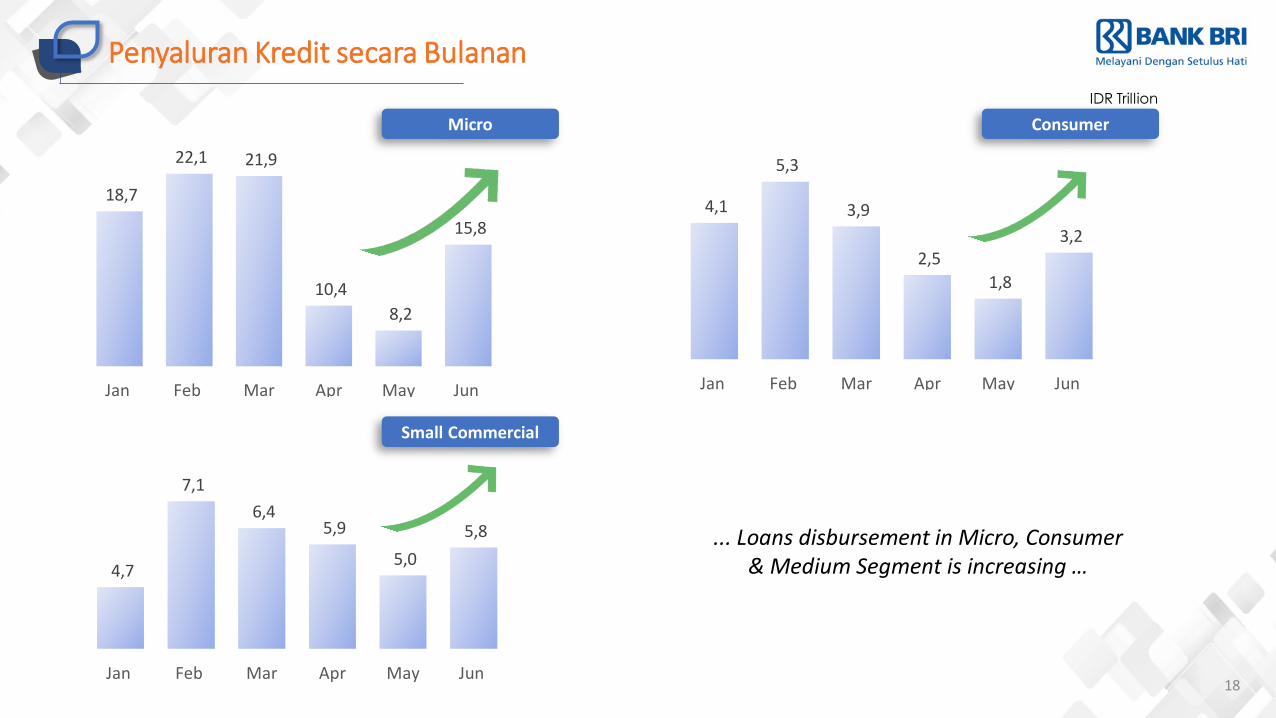
Penyaluran Kredit secara Bulanan
... Loans disbursement in Micro, Consumer & Medium Segment is increasing …
Micro Consumer
Small Commercial
18,7
22,1 21,9
10,4
8,2
15,8
18,3
Jan Feb Mar Apr May Jun Jul
4,7
7,1
6,4 5,9
5,0
5,8 6,4
Jan Feb Mar Apr May Jun Jul
4,1
5,3
3,9
2,5
1,8
3,2 3,3
Jan Feb Mar Apr May Jun Jul
IDR Trillion
19
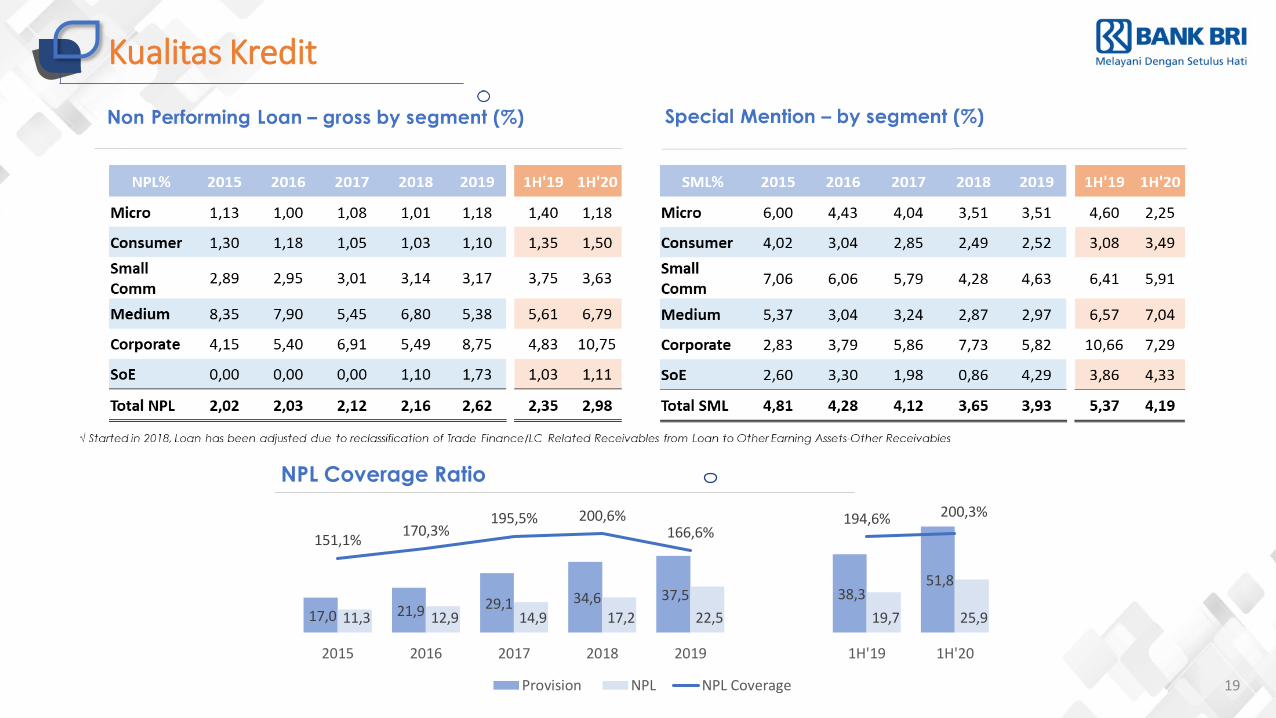
Kualitas Kredit
NPL Coverage Ratio
17,0 21,9 29,1 34,6 37,5 38,3 51,8
11,3 12,9 14,9 17,2 22,5 19,7 25,9
151,1%170,3%
195,5% 200,6%166,6%
194,6% 200,3%
0,0%
50,0%
100,0%
150,0%
200,0%
250,0%
-
10,0
20,0
30,0
40,0
50,0
60,0
2015 2016 2017 2018 2019 1H'19 1H'20
Provision NPL NPL Coverage
20
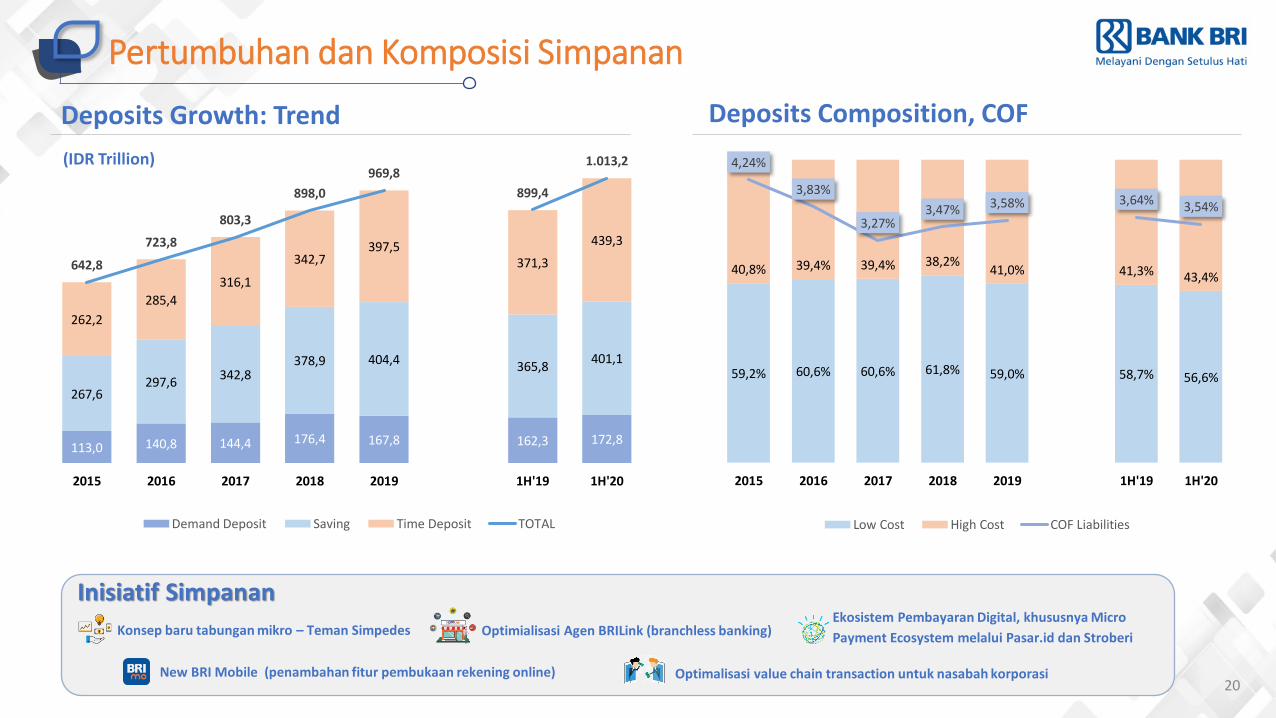
Pertumbuhan dan Komposisi Simpanan
Deposits Composition, COFDeposits Growth: Trend
(IDR Trillion)
113,0 140,8 144,4 176,4 167,8 162,3 172,8
267,6 297,6
342,8 378,9 404,4 365,8
401,1
262,2
285,4
316,1
342,7 397,5
371,3
439,3
642,8
723,8
803,3
898,0
969,8
899,4
1.013,2
0,0
200,0
400,0
600,0
800,0
1.000, 0
1.200, 0
0,0
200,0
400,0
600,0
800,0
1.000, 0
1.200, 0
2015 2016 2017 2018 2019 1H'19 1H'20
Demand Deposit Saving Time Deposit TOTAL
59,2% 60,6% 60,6% 61,8% 59,0% 58,7% 56,6%
40,8% 39,4% 39,4% 38,2%41,0% 41,3% 43,4%
4,24%
3,83%
3,27%3,47% 3,58% 3,64% 3,54%
0,00%
0,50%
1,00%
1,50%
2,00%
2,50%
3,00%
3,50%
4,00%
4,50%
0%
10%
20%
30%
40%
50%
60%
70%
80%
90%
100%
2015 2016 2017 2018 2019 1H'19 1H'20
Low Cost High Cost COF Liabilities
Inisiatif Simpanan
Optimalisasi value chain transaction untuk nasabah korporasi
Konsep baru tabungan mikro – Teman Simpedes
New BRI Mobile (penambahan fitur pembukaan rekening online)
Optimialisasi Agen BRILink (branchless banking)Ekosistem Pembayaran Digital, khususnya Micro
Payment Ecosystem melalui Pasar.id dan Stroberi
21
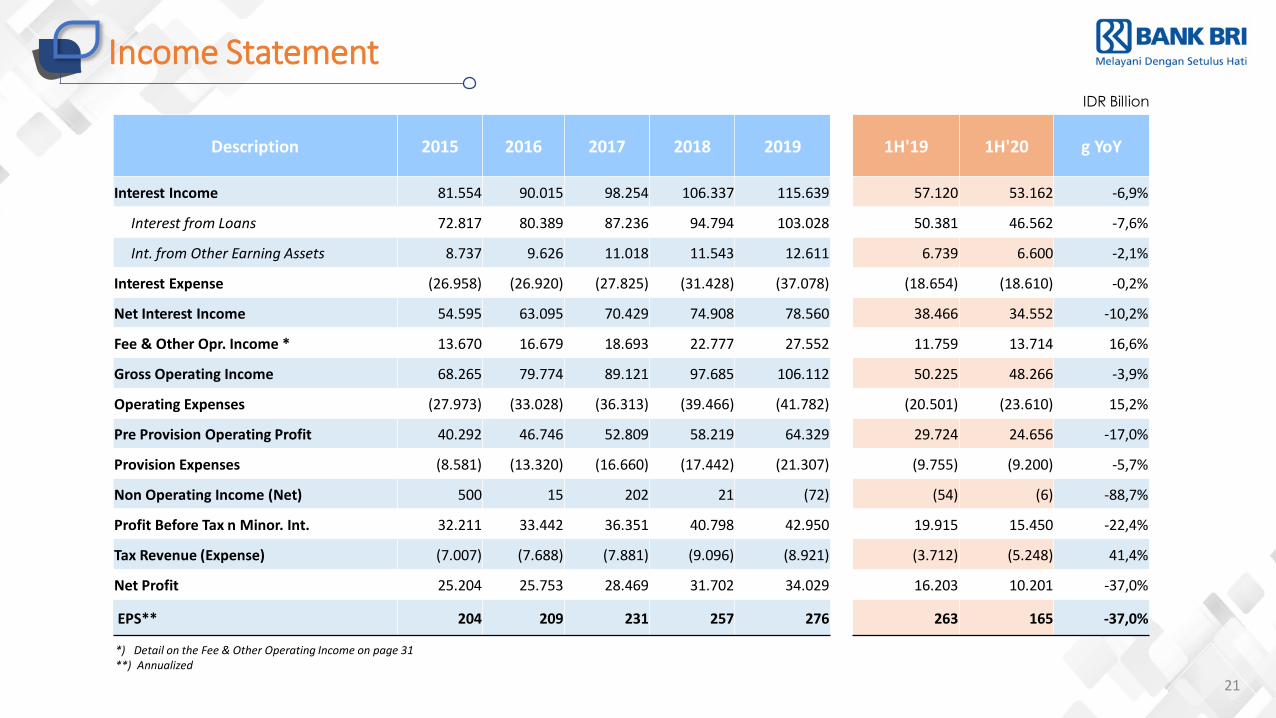
Income Statement
*) Detail on the Fee & Other Operating Income on page 31**) Annualized
IDR Billion
Description 2015 2016 2017 2018 2019 1H'19 1H'20 g YoY
Interest Income 81.554 90.015 98.254 106.337 115.639 57.120 53.162 -6,9%
Interest from Loans 72.817 80.389 87.236 94.794 103.028 50.381 46.562 -7,6%
Int. from Other Earning Assets 8.737 9.626 11.018 11.543 12.611 6.739 6.600 -2,1%
Interest Expense (26.958) (26.920) (27.825) (31.428) (37.078) (18.654) (18.610) -0,2%
Net Interest Income 54.595 63.095 70.429 74.908 78.560 38.466 34.552 -10,2%
Fee & Other Opr. Income * 13.670 16.679 18.693 22.777 27.552 11.759 13.714 16,6%
Gross Operating Income 68.265 79.774 89.121 97.685 106.112 50.225 48.266 -3,9%
Operating Expenses (27.973) (33.028) (36.313) (39.466) (41.782) (20.501) (23.610) 15,2%
Pre Provision Operating Profit 40.292 46.746 52.809 58.219 64.329 29.724 24.656 -17,0%
Provision Expenses (8.581) (13.320) (16.660) (17.442) (21.307) (9.755) (9.200) -5,7%
Non Operating Income (Net) 500 15 202 21 (72) (54) (6) -88,7%
Profit Before Tax n Minor. Int. 32.211 33.442 36.351 40.798 42.950 19.915 15.450 -22,4%
Tax Revenue (Expense) (7.007) (7.688) (7.881) (9.096) (8.921) (3.712) (5.248) 41,4%
Net Profit 25.204 25.753 28.469 31.702 34.029 16.203 10.201 -37,0%
EPS** 204 209 231 257 276 263 165 -37,0%
22
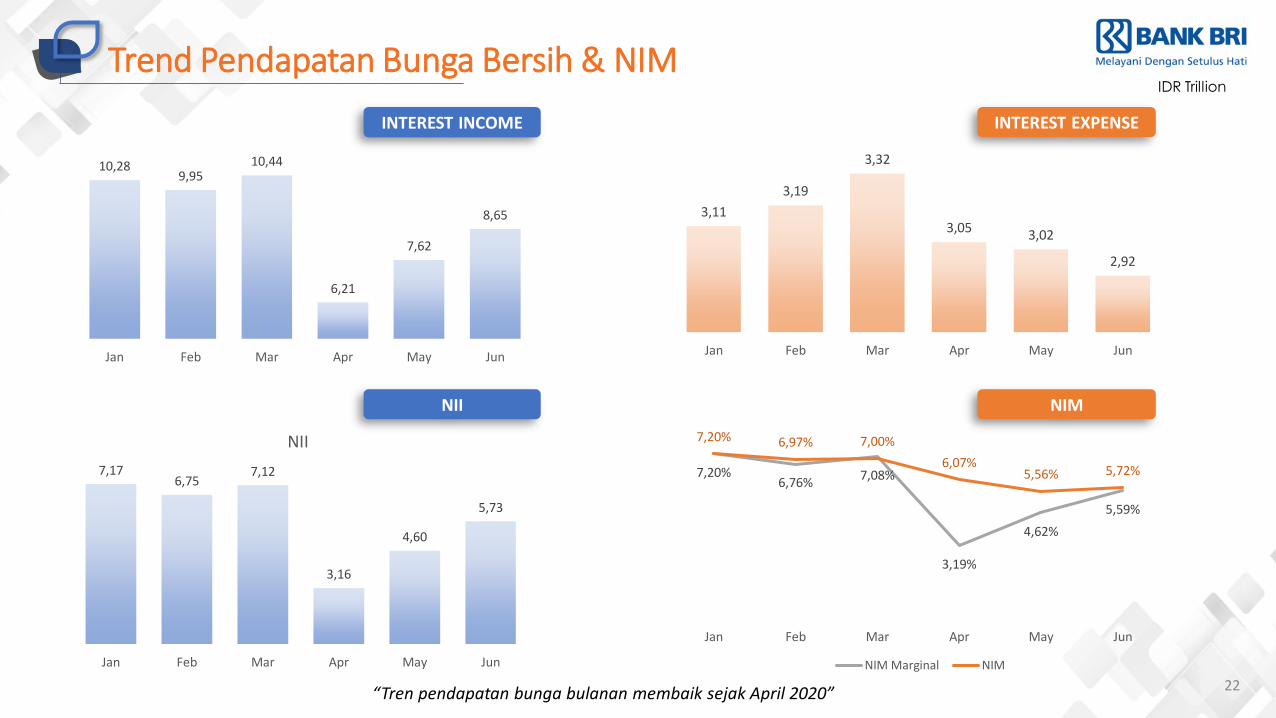
Trend Pendapatan Bunga Bersih & NIM
INTEREST INCOME
IDR Trillion
INTEREST EXPENSE
NII NIM
“Tren pendapatan bunga bulanan membaik sejak April 2020”
3,11
3,19
3,32
3,053,02
2,92
Jan Feb Mar Apr May Jun
10,289,95
10,44
6,21
7,62
8,65
5,00
6,00
7,00
8,00
9,00
10,00
11,00
Jan Feb Mar Apr May Jun
7,176,75
7,12
3,16
4,60
5,73
Jan Feb Mar Apr May Jun
NII
7,20%6,76%
7,08%
3,19%
4,62%
5,59%
7,20% 6,97% 7,00%
6,07%5,56% 5,72%
Jan Feb Mar Apr May Jun
NIM Marginal NIM
23
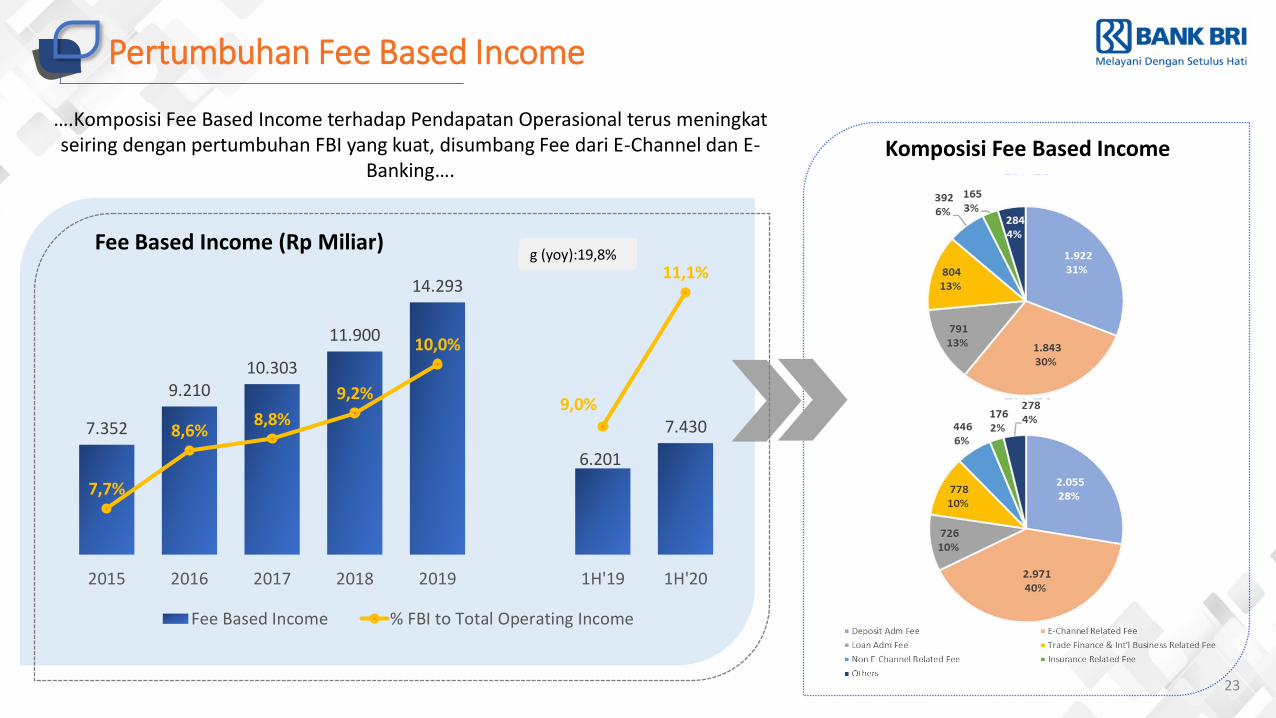
Pertumbuhan Fee Based Income
7.352
9.21010.303
11.900
14.293
6.201
7.430
7,7%
8,6%8,8%
9,2%
10,0%
9,0%
11,1%
7,0%
7,5%
8,0%
8,5%
9,0%
9,5%
10,0%
10,5%
11,0%
11,5%
2000
4000
6000
8000
10000
12000
14000
16000
2015 2016 2017 2018 2019 1H'19 1H'20
Fee Based Income % FBI to Total Operating Income
g (yoy):19,8%Fee Based Income (Rp Miliar)
Komposisi Fee Based Income
….Komposisi Fee Based Income terhadap Pendapatan Operasional terus meningkat seiring dengan pertumbuhan FBI yang kuat, disumbang Fee dari E-Channel dan E-
Banking….
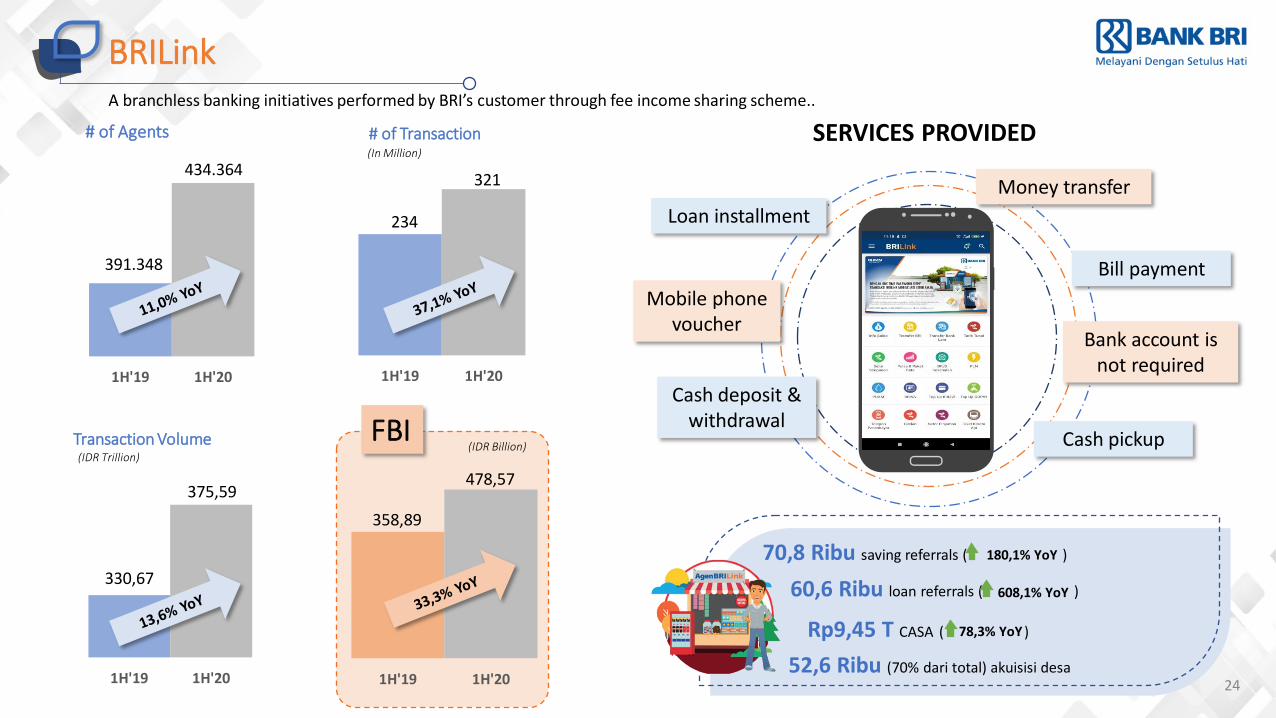
24
BRILink
Bank account is not required
Money transfer
Bill payment
Loan installment
Cash deposit & withdrawal
Mobile phone voucher
SERVICES PROVIDED
360.00 0
370.00 0
380.00 0
390.00 0
400.00 0
410.00 0
420.00 0
430.00 0
440.00 0
1H'19 1H'20
391.348
434.364
# of Agents
-
50
100
150
200
250
300
350
1H'19 1H'20
234
321
# of Transaction(In Million)
300
310
320
330
340
350
360
370
380
1H'19 1H'20
Transaction Volume(IDR Trillion)
330,67
375,59
-
100,00
200,00
300,00
400,00
500,00
600,00
1H'19 1H'20
358,89
478,57
(IDR Billion)FBI
A branchless banking initiatives performed by BRI’s customer through fee income sharing scheme..
Cash pickup
70,8 Ribu saving referrals ( )
60,6 Ribu loan referrals ( )
Rp9,45 T CASA ( )
180,1% YoY
608,1% YoY
78,3% YoY
52,6 Ribu (70% dari total) akuisisi desa
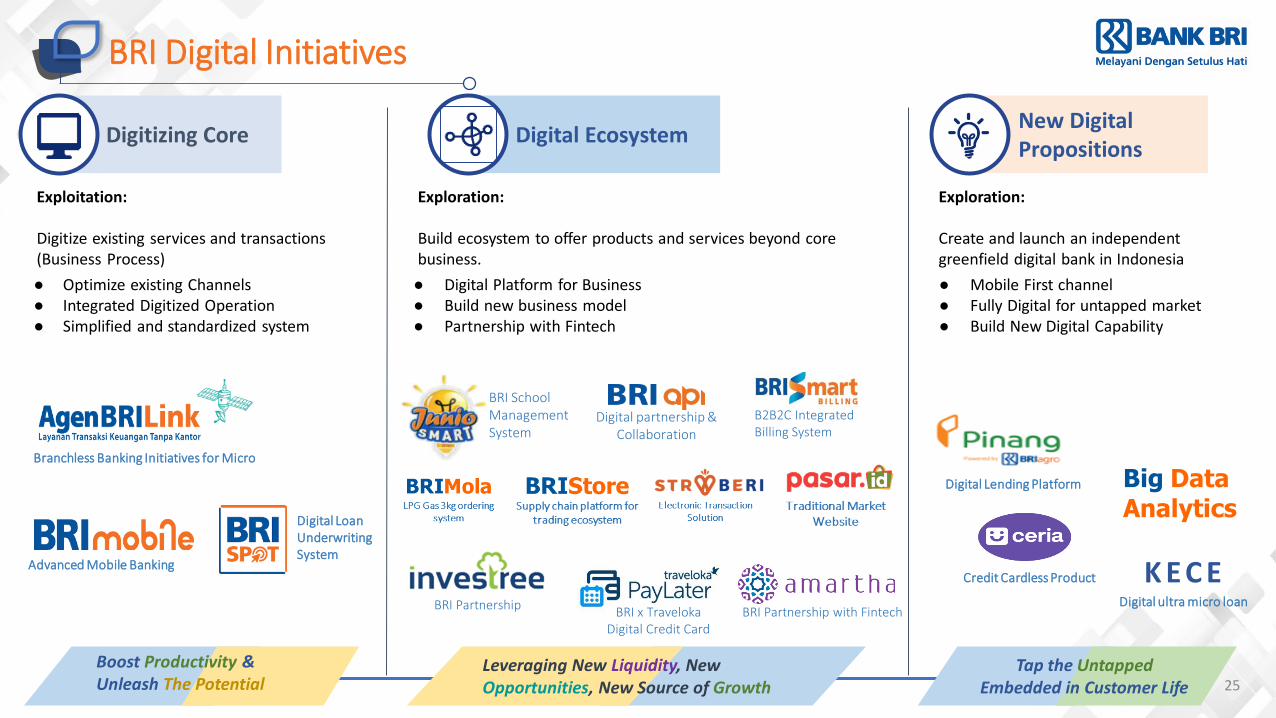
Digitizing Core Digital EcosystemNew Digital Propositions
Exploration:
Build ecosystem to offer products and services beyond core business.
Exploration:
Create and launch an independent greenfield digital bank in Indonesia
Exploitation:
Digitize existing services and transactions (Business Process)
● Optimize existing Channels● Integrated Digitized Operation● Simplified and standardized system
Big Data Analytics
Branchless Banking Initiatives for Micro
Digital LoanUnderwriting System
Advanced Mobile Banking
Digital partnership & Collaboration
B2B2C Integrated Billing System
BRI School Management System
● Digital Platform for Business● Build new business model● Partnership with Fintech
Digital Lending Platform
● Mobile First channel● Fully Digital for untapped market● Build New Digital Capability
Boost Productivity &Unleash The Potential
Tap the UntappedEmbedded in Customer Life
Leveraging New Liquidity, NewOpportunities, New Source of Growth
BRI Partnership
Credit Cardless Product
25
BRI Digital Initiatives
K E C EBRI Partnership with FintechBRI x Traveloka
Digital Credit Card
Digital ultra micro loan
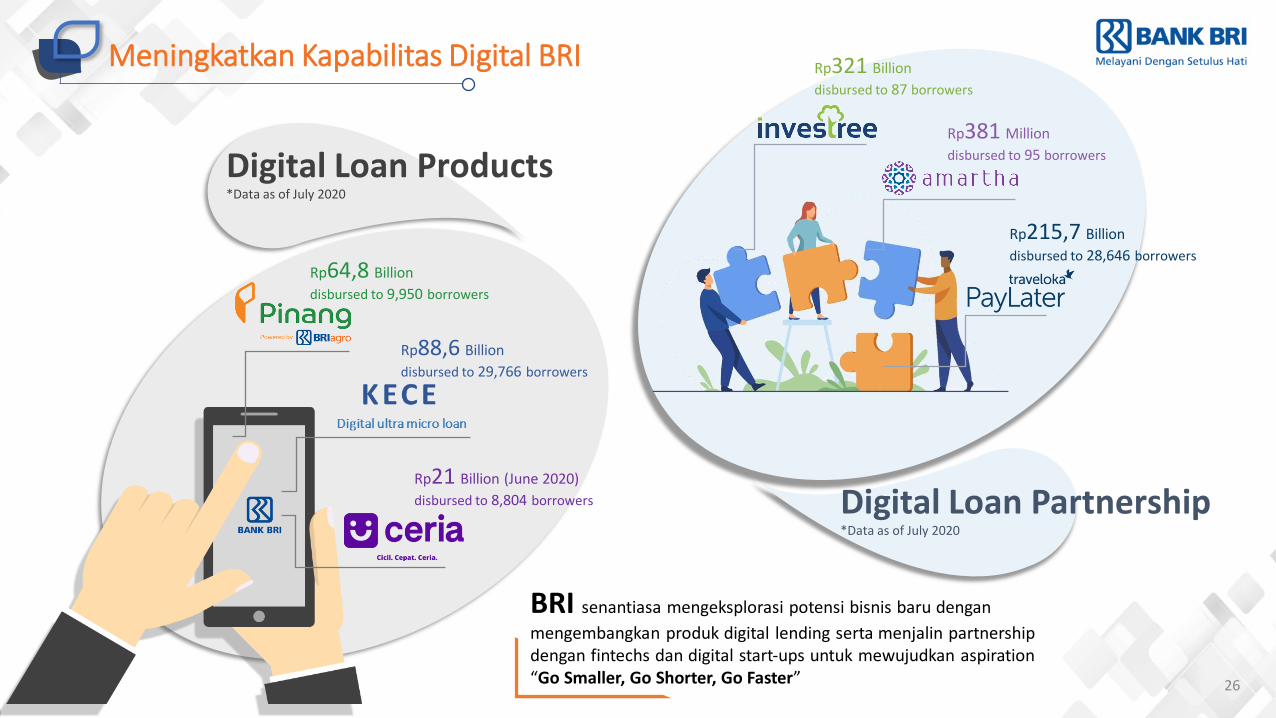
26
Meningkatkan Kapabilitas Digital BRI
Digital Loan Products*Data as of July 2020
Digital Loan Partnership*Data as of July 2020
Rp64,8 Billion
disbursed to 9,950 borrowers
BRI senantiasa mengeksplorasi potensi bisnis baru dengan
mengembangkan produk digital lending serta menjalin partnership dengan fintechs dan digital start-ups untuk mewujudkan aspiration“Go Smaller, Go Shorter, Go Faster”
Rp88,6 Billion
disbursed to 29,766 borrowers
Rp21 Billion (June 2020)
disbursed to 8,804 borrowers
Rp321 Billion
disbursed to 87 borrowers
Rp381 Million
disbursed to 95 borrowers
Rp215,7 Billion
disbursed to 28,646 borrowers
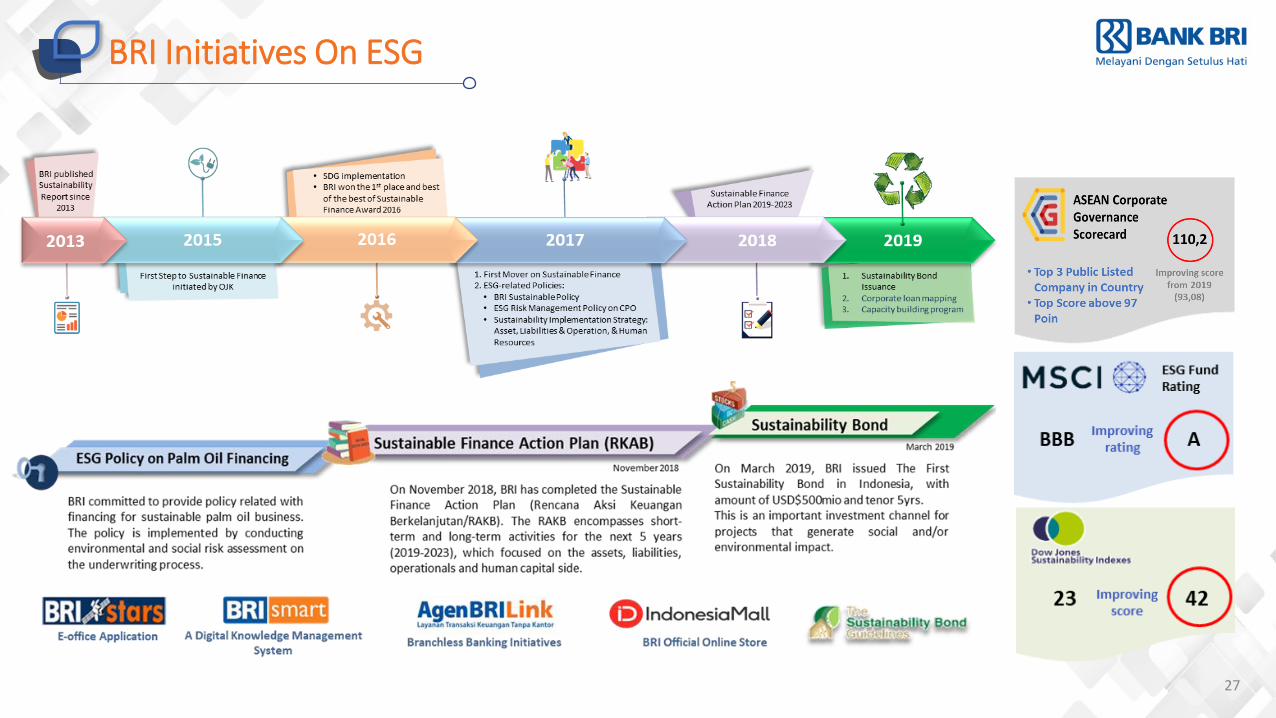
27
BRI Initiatives On ESG
28
KEY TAKEAWAYS
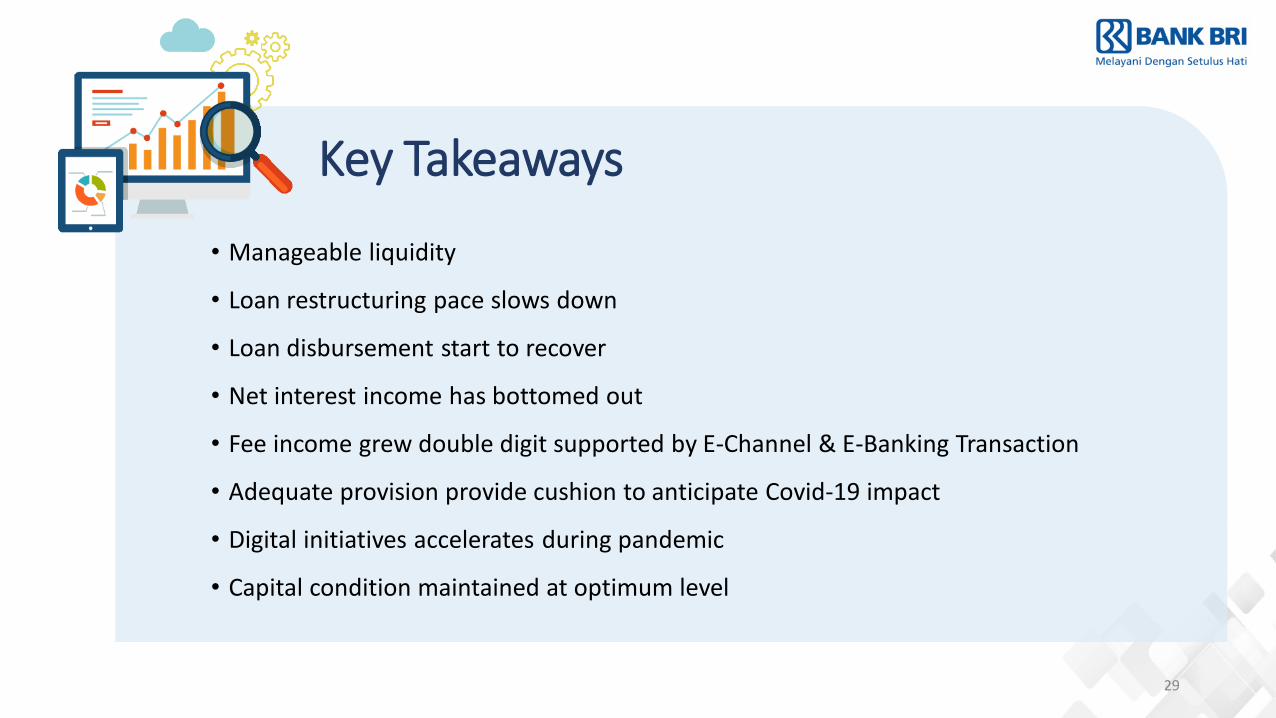
Key Takeaways
29
• Manageable liquidity
• Loan restructuring pace slows down
• Loan disbursement start to recover
• Net interest income has bottomed out
• Fee income grew double digit supported by E-Channel & E-Banking Transaction
• Adequate provision provide cushion to anticipate Covid-19 impact
• Digital initiatives accelerates during pandemic
• Capital condition maintained at optimum level
PT BANK RAKYAT INDONESIA (Persero) Tbk.Investor Relations7th floor BRI II BuildingJl. Jenderal Sudirman No. 44-46 Jakarta 10210Indonesia
Phone : 62 21 5752006/09, 5751952/79Fax : 62 21 5752010Website : www.ir-bri.com Email : [email protected]
Disclaimer ; this report has been prepared by PT bank Rakyat Indonesia (Persero) Tbk (Bank BRI) independently and is circulated for the purpose of general information only. It is not intended to the specific person who may receive this report.The information in this report has been obtained from sources which we deem reliable. No warranty (expressed or implied) is made to the accuracy or completeness of the information. All opinions and estimations included in this reportconstitute our judgment as of this date and are subject to change without prior notice. We disclaim any responsibility or liability without prior notice of Bank BRI and/or their respective employees and/or agents whatsoever arising which maybe brought against or suffered by any person as a result of acting in reliance upon the whole or any part of the contents of this report and neither Bank BRI and/or its affiliated companies and/or their respective employees and/or agentsaccepts liability for any errors, omissions, negligent or otherwise. In this report and any inaccuracy herein or omission here from which might otherwise arise