Embed Size (px)
Citation preview

Report No. 4642-NIR
Niger: Issues and Optionsin the Energy Sector
May 1984
Report of the joint UNDP/World Bank Energy Sector Assessment ProgramThis document has a restricted distribution. its contents may not be disclosedwithout authorization from the Government, the UNDP or the World Bank.
Pub
lic D
iscl
osur
e A
utho
rized
Pub
lic D
iscl
osur
e A
utho
rized
Pub
lic D
iscl
osur
e A
utho
rized
Pub
lic D
iscl
osur
e A
utho
rized
Pub
lic D
iscl
osur
e A
utho
rized
Pub
lic D
iscl
osur
e A
utho
rized
Pub
lic D
iscl
osur
e A
utho
rized
Pub
lic D
iscl
osur
e A
utho
rized

JOINT UNDP/WORLD BANK ENERGY SECTOR ASSESSMENT PROGRAMREPORTS ALREADY ISSUED
Country Date No.
Indonesia November 1981 3542-INDMauritius December 1981 3510-MASKenya May 1982 3800-KESri Lanka May 1982 3794-CE
*Zimbabwe June 1982 3765-ZIMHaiti June 1982 3672-HAPapua New Guinea June 1982 3882-PNGBurundi June 1982 3778-BURwanda June 1982 3779-RWMalawi August 1982 3903-MALBangladesh October 1982 3873-BDZambia January 1982 4110-ZATurkey March 1983 3877-TUBolivia April 1983 4213-BOFiji June 1983 4462-FIJSolomon Islands June 1983 4404-SOLSenegal July 1983 4182-SEUganda July 1983 4453-UGSudan JulY 1983 4511-SUNigeria August 1983 4440-UNINepal August 1983 4474-NEPGambia November 1983 4743-GMPeru January 1984 4677-PECosta Rica January 1984 4655-CRLesotho January 1984 4676-LSOSeychelles January 1984 4693-SEYMorocco March 1984 4157-MOR
.,

FOR OFFICIAL USE ONLY
Report No. 4642-NIR
NIGER
ISSUES AND OPTIONS IN THE ENERGY SECTOR
May 1984
This is one of a series of reports of the Joint UNDP/World Bank EnergySector Assessment Program. Finance for this work has been provided, inpart, by the UNDP Energy Account, and the work has been carried out bythe World Bank. This report has a restricted distribution. Its contentsmay not be disclosed without authorization from the Government, the UNDPor the World Bank.

I

ABSTRACT
Niger's foremost energy problem stems from the fact that the netrenewable supply of fuelwood meets only about 35% of total fuelwooddemand. This massive overexploitation of the natural forest cover causesdesertification, which is of grave concern in a country where only 12% ofthe land is arable. Possible solutions to the crisis include refores-tation and improved forest management, the scope for both of which islimited; dissemination of an improved cooking stove in urban and peri-urban areas; promotion of kerosene for cooking; and replacing fuelwoodwith domestic lignite, the quantities available and the quality of whichneed to be ascertained. Given its landlocked position, Niger also facesa high energy import bill. To reduce it, the country can: ensure conti-nued oil exploration and, in particular, appraisal of the recent, limitedfinds in the Southeast; evaluate its lignite resources and establish pri-orities for their use; and conserve energy in transport and air condi-tioning. In the power subsector, the key issue is the development ofintegrated power system planning. With respect to energy pricing, theGovernment's policy of pricing electricity to reflect the long run mar-ginal cost of power supply needs to be pursued, and fuelwood needs to beproperly priced to stimulate the use of improved stoves and substitutefuels. Finally, the extreme scarcity of qualified manpower in Niger isthe main constraint to planning and operational work. The problem can bealleviated by technical assistance and training, which are needed mosturgently at the subsector level, but also for overall energy planning.


CURRENCY EQUIVALENTS
US$1.00 = CFA Franc 335
This was the exchange rate at the time of the mission. It is the rateused in the report, unless otherwise stated, in which case the rates areas follows:
1978 US$1.00 = 225.6 CFAF1979 US$1.00 = 212.7 CFAF1980 US$1.00 = 211.3 CFAF1981 US$1.00 = 271.7 CFAF1982 US$1.00 = 327.6 CFAF1983 US$1.00 = 345.0 CFAF
CONVERSION FACTORS
General Units
1 kilocalorie (kcal) = 3.968 British thermal units (Btu) = 4,187 joules1 tonne of crude oil equivalent (toe) = 10.2 million kcalI barrel (bbl) = 42 U.S. gallons = 159.0 litres
Conversion Factors by Fuel
Unless otherwise noted, electricity is converted to toe in this report atthe weighted 1981 average rate of fuel consumption of Niger's gas oilburning plants, about 265 toe/GWh.
Fuel tonne/mi kcal/kg toe/tonne
Anou Araren coal 1/laboratory analysis value - 3,600 0.353value used in this report - 2,315 0.227
Lignite - 4,000 0.392Groundnut Shell Briquettes - 4,500 0.441Fuelwood 0.450 4,500 0.441Charcoal - 7,800 0.765Butane - - 1.05GasolinePremium 0.734 - 1.03Regular 0.722 - 1.03
Aviation Gasoline - - 1.03Jet Fuel 0.790 - 1.02Kerosene 0.790 - 1.01Gas Oil 0.830 - 1.00Fuel Oil - - 0.96
1/ The calorific value of coal used in this report was arrived at bysetting the toe value of the 65,502 tonnes of coal burned in 1981 inthe SONICHAR power plant equal to the thermal replacement value(i.e. at 265 toe/GWh) of the electricity thereby produced, takinginto account the 257 toe of gas oil also burned to fire up the coal-burning boilers.
Source: SONICHAR, SONIDEP, SONARA, and Bank mission estimates.

ABBREVIATIONS AND ACRONYMS
AFN Association des Femmes du NigerAGRHYMET Center for Applied Agriculture and Hydrological MeteorologyBDRN Banque de Developpement de la Republique du NigerCCCE Caisse Centrale de Coop6ration EconomiqueCIDA Canadian International Development AgencyCILSS Comite Permanent Inter-6tats de Lutte contre la S6ch6resse
au SahelCOMINAK Compagnie Miniere d'AkoutaCSPPN Caisse de Stabilisation et de P6requation des Prix du NigerCWS Church World ServiceDE Directorate of EnergyFAC Fonds d'Aide et de Cooperation (France)FAO Food and Agriculture Organization of the United NationsGERDAT Groupement d'Etude et de Recherche pour le Developpement de
l'Agronomie TropicaleGPP Groupe des Professionels du PetroleGWh gigawatthourIDA International Development AssociationINRAN Institut National de la Recherche Agronomique au NigerKDA Kandadji Dam AuthorityKfW Kreditanstalt fur WiederaufbaukV kilovoltkW kilowattkWh kilowatthourLPG liquified petroleum gas (propane and butane)LRMC long-run marginal costMCT Ministry of Commerce and TransportMMI Ministry of Mines and IndustryMPW Ministry of Public WorksMW megawattNEPA Nigerien Electric Power AuthorityNIGELEC Societe Nigerienne d'ElectriciteNIGERGAZ Soci6te Nigerienne du GazONAREM Office National des Recherches MinieresONERSOL Office National de l'Energie SolaireSNTN Soci6te Nationale des Transports du NigerSOMAIR Soci6te Miniere de l'AirSONARA Societ6 Nigerienne de Commercialisation de l'ArachideSONICHAR Societe Nigerienne des Charbons d'Anou-ArarenSONIDEP Societe Nig6rienne des Produits Petrolierstoe tonne of oil equivalenttpa tonne per annumUNCC Union Nigerienne de Credit et de CooperationUNSO United Nations Sudano-Sahelian OfficeWMO World Meteorological Organization
This report is based on the findings of an energy assessment mission whichvisited Niger in October-November, 1982, a progress review mission whichtook place in January, 1983, and a mission which discussed the draft re-port with the Government in December, 1983. Mission members included:Messrs. J. Schmedtje (Economist, Mission Leader), N. King (Research Assis-tant), M. Wilton (Civil Engineer), W. Schiebel (Coal and Lignite Consul-tant), R. Edwards (Renewable Energy Consultant), J. Gorse (Forestry Spe-cialist), and J. Rochet (Petroleum Geologist). Mr. M. Petcu, the UNSOResident Energy Adviser to the Government of Niger, also participated ful-Ly in the mission (Energy Institutions, Energy Conservation). The missiongratefully acknowledges the support in its field work of Mr. M. Gervais,the World Bank Resident Representativ/e in Niamev, Niger.

Table of Contents
Page
ISSUES AND RECOMMENDATIONS .................................... i-xiii
I. ENERGY IN THE ECONOMY ................... 1The Economy . . IEnergy in the Economy .. 2Fuelwood Crisis . . 2Import Dependence .. 2
Energy Consumption Trends . . 3Overview ........................ 3Commercial Energy Consumption and GDP . . 4
Overview of Energy Resources . . 5Uranium .. 5Coal and Lignite . . 6Petroleum . . 6Hydropower . . 6Fuelwood . . 6Biomass Other Than Wood . . 7Solar and Wind Energy, Small Hydro . . 7
II. FUELiOOD ............................................... 8Fuelwood Resources .. 8Fuelwood Consumption .. 9Main Forestry Sector Constraints . . 10Increasing Fuelwood Supply . . 13Conservation .. 16Substitution .. 17Forestry Sector Institutions . . 18Manpower Issues and Training Needs in the
Forestry Sector .................................... 18
III. PETROLEUM .............................................. 20Consumption of Petroleum Products . . 20Projected Petroleum Product Consumption . . 22Petroleum Product Supply . . 23Petroleum Exploration .. 24
IV. COAL AND LIGNITE .. 27Exploration and Reserves .. 27Current Uses .. 27Prospective Uses .. 28
V. RENEWABLE ENERGY ....................................... 31Solar Energy ......................................... 31Biomass Other Than Wood .............................. 34Groundnut Shell Briquettes ......................... 34Other Crop Residues and Animal Wastes .............. 35
Wind, SmaLl Hydro .................................... 36The Organizational Framework for Renewable
Energy Activities .................................. 36

Page
VI. ELECTRIC POWER SUBSECTOR DEVELOPMENT ................... 38Growth of Demand ..................................... 38Demand Projections ................................... 39Electricity Supply ................................... 40Supply: Options for Expansion ........................ 42Hydro Resources .................................... 42Power Planning ..................................... 44
Organization of the Power Subsector .................. 46Manpower Issues and Training Needs ................... 48
VII. DEMAND MANAGEMENT: CONSERVATION & ENERGY PRICING ....... 49Conservation ......................................... 49Transport .......................................... 49Buildings .......................................... 50
Energy Prices and Taxes .............................. 52Petroleum Products ................................. 52Electricity ........................................ 54Fuelwood and Charcoal .............................. 54Comparative Energy Prices .......................... 55
VIII. ENERGY PLANNING, INVESTMENT, ANDTECHNICAL ASSISTANCE ................................... 58Energy Sector Planning ............................... 58Energy Investment .................................... 59
Past Investment .................................... 59Investment Requirements ............................ 60
Technical Assistance Needs ........................... 62The Need for Action .................................. 64
TABLES
1.1 Energy and the Balance of Trade, 1978-82 ................. 31.2 Pattern of Net Domestic Energy Consumption
by Sector, 1981 .. 41.3 Commercial Energy Consumption and GDP, 1976-82. . 52.1 Evolution of Natural Forest Cover and Fuelwood
Supply Based on Current Trends, 1980-2015 . .102.2 Fuelwood Resources, Consumption and Needs Based
on Current Trends, 1980-2015 . .112.3 Mission Proposals on Cumulative Objectives for
Fuelwood Production from Plantations and ImprovedForest Management in 2000 and 2015 . .14
2.4 Mission Proposals for Meeting Projected FuelwoodDemand in 2000 and 2015 . .15
3.1 Consumption of Petroleum Products 1973-82. 213.2 Petroleum Product Consumption, 1982-90 . . 236.1 Gross Electricity Demand, 1974-82 . .396.2 Projections of Gross Electricity Consumption,
1980-90 . .406.3 Hydro Resources .. 43

Page
7.1 Structure of Retail Prices for PetroLeum Productsin Niamey, March 1983 .................................. 53
7.2 Permit Fees and Retail Prices for Fuelwood andCharcoal ...... 55
7.3 Retail Prices of Different Fuels per Useful kWh .......... 578.1 Total Energy Investment, 1979-81 ......................... 608.2 Proposed Public Investment in the Interim Plan,
1984-85 ................................................ 61
ANNEXES
1.1 National Energy Balance, 1981 ............................ 662.1 Mean Annual Increment and Net Available Increment
of Fuelwood in 1980 by Type of Forest Cover andGeographic Zone ........................................ 67
2.2 Indicative Cost Estimate of the Niger Energy SectorMission's Proposal for Fuelwood Plantations andImproved Forest Management ............................. 68
2.3 Indicative Cost Estimate of a Five-Year ComplementaryForestry Training Program .............................. 69
3.1 A Preliminary Assessment of the Technical Assistanceand Training Requirements of the Ministry ofMines and Industry for Coordinating Oil andGas Exploration ........................................ 70
4.1 Lignite Exploration Programs ............................. 714.2 Job Description for the Technical Adviser on Coal
and Lignite ............................................ 735.1 Energy Potentially Available from Crop Residues,
1979/80 ................................................ 745.2 Energy Potentially Available from Animal Waste, 1981 ..... 755.3 Production and Transportation Costs of
Groundnut Shell Briquettes ............................. 766.1 Gross Electricity Consumption, 1963-82 ................... 776.2 Electricity Produced and Sold by Voltage Level,
for all of NIGELEC, 1974-82 ............................ 786.3 NIGELEC: Generation, Sales and Losses by Load Center
1977-80 ................................................ 797.1 SNTN: Specific Fuel Consumption,
October 1977-September 1981 ............................ 807.2 Hydrocarbons Price Structure in Niamey in March 1983
(Shipped through Benin) ................................ 817.3 NIGELEC's Current Electricity Rates for Public
Power Supply ........................................... 827.4 Electricity Pricing: Reference Tariff Structure
Computed from Marginal Cost Estimates for 1985-90 83
Page
8.1 Technical Assistance in Energy Planning: JobDescription for the Technical Advisor .................. 84
8.2 NIGELEC, Investment Program, Formulated in July 1982 ..... 858.3 Outline of an Indicative National Energy
Balance for 1990 ....................................... 86
MAPS
IBRD 17253: Energy Resources and Infrastructure in 1982IBRD 16937: Fuelwood Availability

ISSUES AND RECOMMENDATIONS
Main Problems
1. One of the least developed countries in the world, Niger has avery low consumption of energy, about 180 kgoe per capita a year. Likeother low income countries, Niger faces a double energy crisis: overex-ploitation of its meager fuelwood resources which, given the predomin-antly rural nature of the economy, provide four-fifths of the country'sgross energy supply (mostly for cooking), and a rising energy importbill. Because its territory is 75% desert, with only 12% of the landconsidered arable, and given the increasing desertification due to thedestruction of the natural forest cover, the fuelwood crisis is actuallythe more serious of the two. A third major problem is the backlog inintegrated power system planning in a country with very limited electri-fication.
Energy Resources
2. Niger's greatest potential source of energy is uranium, ofwhich it is the fourth largest producer in the world, with a productionof 4,370 tonnes (1981) and reasonably assured reserves of about 160,000tonnes. However, the small size of the foreseeable power demand offersno encouragement for the development of nuclear power, and uranium willprobably remain Niger's principal export commodity.
3. The Anou-Araren coal deposits in the north of the country con-sist of about 9.4 million tonnes at 3,650 kcal/kg, and are now being usedexclusively to generate power for the nearby uranium mines. A recentdiscovery near Solomi, about 30 km north of Anou-Araren, could indicate asignificant deposit of higher quality coal (7000 kcal/kg). There havebeen various indications of lignite deposits further south, the mostpromising of which (near Tahoua) has probable reserves evaluated at 2.6million tonnes, with a calorific value of 4,000 kcal/kg.
4. Although the significance of a recent oil discovery in theAgadem basin in the east is still being evaluated, it seems possible thatreserves may be large enough to warrant development, at least for thedomestic market.
5. Niger's hydro resources are concentrated in the River Niger andits tributaries, where an estimated 2,090 GWh for an average hydrologicalyear could be developed at three sites: Kandadji, W, and Dyodyonga.However, about 830 GWh of this total depends on international agreementsand therefore would not be exclusively for Niger's use.

- 1.1 -
6. As for wood, Niger's natural forest cover is estimated on theorder of 15 million hectares, limited in the main to the southern part ofthe country. Because much of the wood i3 located far from centers ofconsumption, only 1.4 of the 4.2 million m of the mean annual incrementin 1980 are estimated to have been available.
7. In 1979/80, Niger produced an estimated theoretical maximumenergy potential of 2.2 million toe in crop residues and animal waste,but because of competing uses and technical, economic, and social con-straints, less than 5% of this amount could have been used for energyconversion.
8. Solar energy is abundant in Niger. In the south, the averagetotal radiation is 6 kWh/m2/day (an average of about 200 kgoe/m2/year),the average daily duration of sunlight varying from 8.5 to 9.5 hours.However, the only current uses of solar energy are for telecommunicationsin isolated areas and heating water, so that its contribution to meetingNiger's energy needs is minimal. Wind resources are very poor in Niger,and the potential for small hydro development is insignificant.
Alleviating the Fuelwood Shortage: Household Energy Strategies
9. On a country-wide basis fuelwood demand and supply are roughlyin balance at present. However, the total net available increment offuelwood (1.4 million m3 ) accounts for only about 35% of fuelwood demand(4.1 million m3 ). The result is a massive overexploitation of the forestcover in those areas near the centers of consumption. The growing scarc-ity and rising prices of fuelwood mean that many poor urban dwellers can-not afford more than one warm meal a day. Moreover, the overexploitationis causing a decline in soil fertility and desertification, which willresult in heavy losses in agricultural production. If current trendspersist, Niger's already large fuelwood deficit in and around the areasof consumption will more than double by the year 2000.
10. There are several options for tackling the fuelwood crisis,among them: (a) increasing the supply of wood by reforestation andespecially by improved forest management; (b) increasing the amount ofuseful energy derived from wood by the widespread dissemination of im-proved cooking stoves; and (c) substituting other sources of energy forfuelwood.
11. Although increasing the supply of fuelwood should be vigorouslypursued, the scope for it is limited by several constraints to forestdevelopment: (a) poor soils, limited rainfall, and a lack of forestrytechnical packages well-adapted to marginal lands in these arid and semi-arid zones with only one peak of rainfall; (b) the difficulty of protect-ing the natural forest cover from overuse (too much cutting, clearing,grazing, burning, etc.); and (c) a difficulty in obtaining full and sus-tained governmental commitment and popular participation, although some
- Liii -
progress in this regard is being made. Adding the maximum new fuelwoodsupplies which realistically could be obtained by reforestation andimproved forest management (Table 2.3 and Annex 2.2) to the projected netavailable supply of fuelwood from existing resources will meet only about30% of the demand in the year 2000 based on current per capita consump-tion. The other 70% therefore will have to be either eliminated or sub-stituted for by using improved woodstoves or cooking with alternativefuels in order to avoid having to change eating habits (Table 2.4).
12. Many different groups in Niger are attempting to develop anddisseminate an improved woodstove in rural as well as urban areas.Efforts have been directed toward a fixed cement or banco stove. Themost effective improved stove procedure for reducing the demand for woodin the short term is to focus on developing an appropriate stove model todisseminate to carefully selected groups in urban and peri-urban areas,where the fuelwood shortage is most acutely felt. To this end, it isessential to come up with a wood-burning stove that is portable, providesa significant increase in end-use efficiency over current cookingmethods, is inexpensive, and, to the extent possible, is suitable forcharcoal, groundnut shell briquettes, and perhaps lignite. The UpperVolta portable metal fuelwood stove would appear to meet most of thesecriteria (para 2.20).
13. Possible substitutes for fuelwood include: charcoal produced inNiger, domestic coal and lignite, imported kerosene and butane, electri-city, locally produced groundnut shell briquettes, and solar energy.Because the main urban areas can still obtain firewood from within aradius of 100 km, only minimal amounts of charcoal are produced and con-sumed. The ever increasing fuelwood demand from the main population cen-ters and the resulting destruction of the forest cover around them meanthat fuelwood supplies will require increasingly longer truck hauls. Theproduction and marketing of charcoal might therefore appear attractive.However, wood from the natural forest of Niger does not lend itself wellto charcoal production, and the ecologicalLy detrimental consequences ofusing large amounts of wood to produce charcoal poses a significantproblem.
14. The Anou-Araren coal presents serious difficulties in that, inaddition to the high cost of transporting it to populated areas, it re-quires pre-coking to eliminate noxious tar fumes. In the absence of dataon the coal of Solomi, it is not yet possible to determine its possibleuses, from an economic point of view. However, preliminary combustiontests, in appropriate stoves, of briquettes made from this coal, haveproduced positive resuLts from a technical point of view. The Governmentof Niger has requested technical assistance from the Government of Japanin evaluating the workable deposits and in defining the technology forpreparing and using this coal, principally for residential needs. Thelimited testing to date indicates that the Tahoua lignite is well suitedas a fuelwood substitute, having no aetrimental tar content. The prob-able lignite reserves could suppLy 20% of the cooking needs of all thefamilies in Niger for about eight vears. but more information is needed

- iv -
on the quantities available, the quality of the lignite, and likelyconsumer acceptance before its potential as a fuelwood substitute can beproperly assessed.
15. Taking end-use efficiencies into account, the price of kerosenefor cooking, whether subsidized or not, compares favorably with the cur-rent market price for fuelwood, even though the latter is well below thewood's economic cost in most areas. However, there is a need for asimple, inexpensive kerosene stove (e.g. the Indian Nutan model) which isbetter adapted to traditional Nigerien cooking than the models now avail-able. Because of the high cost of butane and electricity, and of theequipment involved, they must be ruled out as cooking fuels for themajority of Nigeriens.
16. Groundnut shell briquettes hold promise as a fuelwood substi-tute, but only on a much more reduced scale than kerosene and, potenti-ally, lignite. Had all the groundnut shells from the 1980/81 growingseason been compacted into briquettes, the 17,000 toe made availablewould have come to no more than 2% of the total 1981 consumption of fuel-wood for the country as a whole. However, 17,000 toe would have amountedto a significant 35% of fuelwood consumption in the city of Niamey forthe same year. Groundnut shells thus could help alleviate the fuelwoodshortage where it is the most critical. As for solar energy, a cookerwell enough adapted to traditional cooking methods to gain popularacceptance has not yet been devised.
Recommendations
17. Given the limits to increasing the supply of wood, relief ofthe fuelwood crisis can most readily be obtained by improved cookingstoves, while at the moment the most promising substitutes are kerosene,lignite, and, to a minor extent, groundnut shell briquettes. 1/ Themission therefore recommends that the following actions be undertaken si-multaneously, all of which are of the highest priority but have beenranked in terms of decreasing short term practical importance:
(a) Concerning improved stoves:
(i) Centralization of efforts concerning improved stoves withinthe Directorate of Energy (DE) of the Ministry of Mines andIndustry. The DE should closely monitor national and in-ternational developments in this area with a view to evolv-ing a policy and a pLan of action for producing and dissem-inating appropriate models of improved stoves (para 2.21).
1/ The pricing study recommended beLow (para. 33) would help determinethe least-cost substitutes on an econom,- basis.

v
(ii) Dissemination on an experimental basis in Niamey of anadapted model of the metal stove which recently has beensuccessfully introduced in Ouagadougou (para 12). Thisproject should benefit from the equipment of the labora-tories of ONERSOL for testing and modifying improvedstoves. The woodstove experts whose services will berequired under this project could also provide assistanceto the DE in managing the tasks described in (i) above.
(b) Concerning lignite:
(i) A systematic drilling program to firm up lignite reservesat Tahoua, and a reconnaissance program, with possible sub-sequent exploration, in the Filingue area. Estimatedcost: US$850,000.
(ii) Combustion tests of the Tahoua lignite to determine thequantities required for preparing typical Migerien meals.These tests should be integrated with the development of asuitable stove for lignite.
(iii) Depending on the results of (i) and (ii), studies of thedemand for lignite as a fuelwood substitute and in industryand power generation, in order to estimate the scale ofmining operations and therefore the mining costs (para4.10).
(c) In evaluating the workable reserves of the Solomi coal and de-fining the technology for preparing and using this resource(para 14), ensuring that the costs of coal production, trans-port, preparation, and utilization (e.g. the cost of producingstoves for residential use) are analyzed as a function of astudy of the demand for this coal as a substitute for wood orfor use by industry (para 4.10).
(d) Promotion of kerosene as a cooking fuel by either acquiring asuitable existing design, or designing and then disseminating akerosene stove suited to traditional cooking. The DE shouldserve as focal point in this effort and turn to the labora-tories of ONERSOL for research work on these stoves (para 3.5).
(e) Pursuit of the tree planting and improved forestry managementobjectives outlined in Table 2.3. Estimated cost: about US$9million p.a. from 1984 through 1988, and US$10 million p.a.from 1989 through 2018. Such a long-term forestry effort wouldrequire a specific complementary forestry training program(para 2.17).
(f) Investigation of new forestry technical packages which are welladapted to marginal Lands in arid and semi-arid zones (para2.17).

- vi-
(g) A study to determine a specific action program to promote theuse of groundnut shell briquettes for residential needs. Thestudy should be carried out in parallel with the design of animproved stove suitable for both these briquettes and wood(para 5.17).
Reducing the Energy Import Bill
18. Until early 1981, Niger depended entirely on imports, not onlyof petroleum products but also of electricity from Nigeria, to supply itscommercial energy needs. Since then, domestic coal has substituted forgas oil in generating power for the uranium mines, which saved, on acalorific basis, the equivalent of about 20% of Niger's total petroleumproduct consumption in 1982. However, given Niger's landlocked positionand the resulting high cost of petroleum products (US$54 per bbl inNiamey in 1982, net of taxes and distributors' margin), total energy im-ports in 1982 still amounted to 18% of the merchandise import bill andnearly 31% of merchandise export revenues. Options for reducing theenergy import bill consist of substituting domestic resources and/orcheaper imported alternatives for imported energy, and conservation.
19. With respect to substitution, the main possibilities are: oilfrom the Agadem basin; Anou-Araren and Solomi coal; Tahoua lignite;hydropower, both Nigerien and as electricity imported from Nigeria; andgroundnut shells. From present indications, it seems unlikely that themost recent Agaden permit oil find by the SNEA/EXXON/TEXACO consortiumwould warrant an export project, but it may be of great value, subject toan economic study, for exploitation for the domestic market. The Govern-ment will need to determine what strategy to adopt for further petroleumexploration and development, particularly in view of the fact that theconsortium's obligations under the present contract have been fulfilled,and this could lead to a halt in further exploration.
20. More Anou-Araren coal cannot be used for power generation thanis currently burned to meet the demand in the adjacent uranium mines andnearby towns of Arlit and Agadez because of the coal deposit's greatdistance from other centers of power demand. Other possibilities forsubstituting this coal for petroleum products do not exist at this timebecause of the coal's excessive ash content and the high cost of trans-porting it to potential consumers in the south of the country, eventhough it may be possible to reduce the transport cost by carrying thecoal in trucks otherwise making empty return trips to the south. As forthe Solomi coal, additional information is needed on its volume, qualityand cost of exploitation before its uses as a substitute for petroleumproducts in industry or power generation can be evaluated. A preliminaryanalysis of the Tahoua lignite suggests that it is probably suitable foruse in the cement industry, among others, as a substitute for gas oil toproduce process heat, as well as for power generation. In addition,given large enough reserves it would cost only about 40% as much as gas

- vii -
oil c.i.f. Niamey. Although of lower quality than the Solomi coal, theTahoua lignite lies close to the region where electricity demand growsfastest, and therefore its use for power generation should receive pri-ority attention. However, more needs to be known about the quantitiesand the quality (especially with respect to combustion for cooking) ofthe lignite before setting priorities for its use as a gas oil or fuel-wood substitute.
21. Power imports from Nigeria, currently priced at USq4.5 per kWhand accounting for about 75% of Niger's non-mining supply of electricity,are in themselves substituting for very costly fuel at diesel generationplants (at USA11.0 per kWh). As long as secondary energy supplied byNigeria remains cheaper than any domestic alternative, it is an elementto be considered in assessing Niger's own limited hydro potential. Astudy taking all the relevant alternatives of supply into account in aleast-cost system expansion plan has recently begun under an IDA PowerCredit.
22. In calorific terms, the 1980/81 cost of groundnut shell bri-quettes c.i.f. Niamey amounted to about 40% of that of gas oil. Thesebriquettes have displaced gas oil in industry in the past, but this hasbeen discontinued. The company marketing these briquettes, SONARA, ishaving great difficulty convincing industrial enterprises to substitutethese briquettes for gas oil, largely because they consider the supply ofbriquettes unreliable. Therefore, it seems appropriate to concentrate onusing these briquettes for residential needs (paras 16 and 17(g)). Animproved stove which is suitable for both wood and briquettes will haveto be developed to alleviate householders' fears of an unreliable supplyof briquettes.
23. The Agadem oil deposits, the Tahoua lignite and the Solomi coaldeserve the greatest attention as possible substitutes for imported pe-troleum products. With respect to national energy resources in generaland Niger's hydro potential in particular, it should be remembered thattheir development does not always improve the country's balance of pay-ments. In the case of the power plant which burns Anou-Araren coal, forexample, savings on the displaced gas oil amount to only CFAF 2.5 billionp.a., compared to debt service payments of about CFAF 4.5 billion p.a. upto at least 1990.
24. Given the small size of Niger's manufacturing sector, the primeareas for conserving imported energy are transport and air conditioning,particularly of office buildings. The largest transport enterprise, theSociete Nationale des Transport de Niger (SNTN), has already reduced itsfuel consumption per kilometer by 22% over a four year period, mainly bytraining in fuel efficient driving. The Ministry of Public Works and theother 400 transport operators in Niger also need to train their driversin fuel efficiency.
25. Office air conditioning accounts for about 25% of electricityconsumption in Niamey. Significant energy savings (25-30%) have been

- viii -
achieved by equipping new public sector buildings with modern central airconditioning; further gains could be made by enforcing energy efficientdesign and building standards in future construction. Substantial energysavings remain to be realized in old public buildings with room airconditioning units by means of the measures recommended below.
Recommendations
26. As part of a plan of action to reduce Niger's energy importbill, the mission recommends (in addition to the lignite explorationprograms specified in para 17) the following:
(a) The Government's continued urgent consideration of: (i) thefeasibility of appraising and producing the Sokhor find, keep-ing in mind the desirability of proceeding rapidly with such aproject to avoid rig mobilization costs (US$10 million); and(ii) determination of a strategy for petroleum exploration anddevelopment. The Bank's Petroleum Projects Division concernedis in touch with the Government on both of these points (para3.13).
(b) Combustion tests to determine the potential for using lignitein industry and power generation (para 4.10).
(c) As mentioned in para 17(c), an analysis of the cost of produc-ing Solomi coal in relation to the demand for its use in indus-try and power generation (para 4.10).
(d) Institution of a course in fuel-efficient driving techniquesopen to any driver interested in taking it. This course mightbe incorporated in the program of the driver training centerwhich is to be established in the Ministry of Public Worksunder the upcoming IDA Fourth Highway Project (para 7.4).
(e) For conservation in buildings:
(i) ensuring that energy efficient design and building guide-lines are followed (para 7.9);
(ii) simple insulation measures ensuring tight closing of win-dows and doors, to be undertaken without delay in all pub-lic buildings as appropriate, once the typical cost andrelated conservation benefits have been established (para7.8);
(iii) institution of office temperature norms and their control(para 7.8); and
(iv) replacement of worn out air conditioners by more energyefficient models and introduction of air coolers based onthe evaporation of water. A pilot project involving

ix -
selected public buildings in Niamey should be considered totest the suitability and effectiveness of these more effi-cient models and air coolers. A prefeasibility studyinitiated by the mission has been carried out by the Minis-try of Public Works in cooperation with the Directorate ofEnergy. Estimated cost: CFAF 100 million (US$300,000), notcounting the cost of new air conditioners (CFAF 297 mil-lion) to replace existing ones (para 7.8).
Other measures of less urgency: initiation of a research program tostudy the economic feasibility of mini-photovoltaic systems in isolatedcenters (para 5.6); evaluation by the Ministry of Mines and Industry ofthe potential for energy economies in industry (para 7.9); and Governmentrelaxation of the prescribed level of stocks of petroleum products to anequivalent of 30 days of consumption, instead of investing in additionalstorage capacity and acquiring the supplementary stocks (para 3.8).
Electric Power Subsector Development
27. Because the existing interconnection with Nigeria will be fullyutilized for capacity imports by 1984 and for energy imports by 1992, themain issue in the development of the power subsector is power supplyplanning for the Niger Valley. The supply problems of the remaining loadcenters do, however, deserve careful consideration because it is theisolated centers that will require increasing quantities of imported gasoil.
28. With respect to the supply of the Niger Valley, NIGELEC'sshort-term planning (to about 1989) appears sound, based as it is on themaintenance of sufficient thermal capacity in Niamey to cover the peak,while taking maximum advantage of the interconnection contract withNigeria to import energy and save fuel expenses. For some time, longer-term planning has been tailored around the assumed commissioning date ofthe Kandadji hydro-scheme. Other possibilities are the W run-of-riverhydro project, the Dyodyonga storage project on the border with Benin,and an expanded interconnection with Nigeria for importing secondaryenergy and, eventually, seasonal power interchange. All available op-tions ought to be examined to arrive at a least cost program of develop-ment.
29. As for the secondary load centers, clusters of small towns andvillages should gradually be connected by transmission lines and servicedfrom one efficient diesel plant. Although the least cost solution may beconnection by 20 kV lines, from a longer term perspective it may be pre-ferable to build 66 kV lines initially operated at 20 kV, with substa-tions of 1,000-2,000 kVA.
30. The power system development study, recently begun under an IDAPower Credit, will examine the various options and their possible

combinations with a view to evolving a comprehensive power sector devel-opment program to 2020 for the Niger Valley and to 1990 for the secondarycenters.
Energy Prices and Taxes
31. The level and structure of current prices for petroleum pro-ducts in Niger provide the right signals for promoting their efficientenergy use. Regarding the electricity tariff, its level and structurewere revised in October 1983 to reflect the long run marginal cost (LRMC)of power supply in Niger. Based on an all-diesel investment program for1985-90, a recent tariff study has developed a "reference" electricitytariff reflecting the estimated LRMC as tempered by considerations ofsocial, financial and administrative expediency (Annex 7.4). The newtariff consists of a fixed component calculated by making an adjustmentto the "reference"t tariff to permit financial equilibrium of NIGELEC, anda variable component which represents the cost of fuel and the power im-ported from Nigeria. The Government thus has integrated the "reference"tariff into the current tariff, the latter being subject to modificationat the request of NIGELEC from time to time as its financial position mayrequire. The mission supports the recent tariff revision and the pursuitof the Government's policy of electricity pricing to approach long runmarginal cost.
32. With respect to fuelwood, its economic cost is reflected byboth the cost of reforestation and the cost of deforestation and ensuingdesertification. Estimates of this economic cost are certain to showthat it is well above the current market prices, high as these may seem,particularly to urban consumers. In addition, as the owner and operatorof the national forests, the Government is entitled to a stumpage fee tocapture some or all of the excess profits (economic rent) realized by theprivate operators supplying fuelwood. The second IDA-assisted forestryproject (Credit NIR 226) provides for studies of the organization of thefuelwood market and of appropriate prices and stumpage fees for fuelwoodfrom plantations and natural forests which reflect its economic cost.The Credit Agreement stipulates that such prices and fees be establishedby the end of 1983. Proper economic pricing of fuelwood is the basicprerequisite for conserving it through improved cooking stoves and theuse of less costly substitutes, both of which are the prime responses toNiger's fuelwood crisis.
Recommendations
33. The mission recommends:
(a) Establishment of appropriate fuelwood prices and stumpage feesby end 1984 (para 7.19).

- xi -
(b) Once combustion tests on the Tahoua lignite have been carriedout, a comprehensive study should be made of comparative energyprices reflecting economic cost with particular reference toproviding energy in urban areas, especially with respect tofuelwood substitution (para 7.22).
Institutional Issues
34. The extreme scarcity of qualified manpower in Niger is the mainconstraint to planning and operational work, both at the subsector leveland for the energy sector as a whole.
35. In the forestry subsector, the Directorate of Forestry andFauna suffers from limited forestry planning and inventory control. Inaddition, there is a need for a more organized exploitation of fuelwoodresources. With respect to renewable energy other than wood, the prin-cipal institutional weaknesses are a lack of overall planning due to themultiplicity of organizations involved, and a lack of economic analysisand market studies.
36. In the petroleum subsector, the Directorate of Energy (DE)lacks the staff and equipment to fulfill its role of acquiring, under-standing, and storing the information generated by foreign explorationcompanies. This is particularly important because the Government mayneed to promote the areas in question in the future.
37. The three main institutional issues in the power subsector are:(a) the lack of a single agency responsible for overall, long-term powerplanning; (b) the usefulness of a concession system whereby the Stateplays a dual role as the authority supervising the management of theelectricity concession and, since it owns 90% of NIGELEC's capital, thatof the agency being supervised; and (c) the increasing subsidization byNIGELEC's power subsector activities of the company's operation of watersupply systems.
38. Given the manpower shortage even at the subsector level and thefact that seven ministries and at least as many operating agencies aredirectly concerned with energy in Niger, the sector lacks an integrated,overall approach to the country's energy probLems. Moreover, no Govern-ment agency has responsibility for energy conservation in general. TheDirectorate of Energy (DE) within the Ministry of Mines and Industry(MMI) is responsible for the formulation of national energy policies inaccordance with Government objectives, but, in addition to its staff con-straints, its position in the Government does not give it the necessaryauthority to coordinate energy sector activities.

- xii -
Recommendations
39. The mission recommends:
(a) Strengthening overall energy planning by appointing an energyeconomist experienced in general energy supply and demandstudies, pricing analyses, optimization techniques, and financ-ing as Energy Adviser to the Ministry of Mines and Industry.(Estimated cost of the economist's services for two years:US$290,000). Excluding the hydrocarbons and coal unit, the DEshould focus exclusively on formulating and coordinatingnational energy policy (para 8.5).
(b) Government examination of the possibility of launching as soonas possible a forestry training program which would complementthe planting and improved forest management objectives outlinedin Table 2.3. Annex 2.3 gives a preliminary outline of such aprogram, which would cost about US$1.5 million over five years(para 2.28).
(c) Expansion of the scope of ONERSOL's work. ONERSOL should takethe lead in formulating an overall strategy for developingNiger's renewable energy resources and coordinate the activi-ties of the agencies already involved in this field. Themission supports the proposal already made by the Directorateof Energy to the Ministry of Higher Education and ScientificResearch, the supervisory Ministry of ONERSOL, to broadenONERSOL's field of activity as indicated above. Once the exactrole of ONERSOL has been determined by the Government, it willbe necessary to define technical assistance in terms of train-ing and equipment required by ONERSOL to manage its workprogram.
(d) Assistance in oil and gas exploration to the DE's hydrocarbonsand coal unit, which, according to a preliminary evaluation,would involve: (i) assistance for retrieval and storage ofdata, including new equipment; (ii) collaboration of expatriateexperts with staff of the hydrocarbons and coal unit on welldefined specific problems; (iii) assistance in revising thepetroleum law and agreements; and (iv) training of Nigeriens ingeology, geophysics, economics, and engineering. Estimatedcost: about US$1 million over three to four years (para 3.15).
(e) Strengthening the capacity of the DE's hydrocarbons and coalunit to coordinate the overall development of the coal/lignitesector by retaining the services of a visiting coal/lignitespecialist. Estimated cost: US2 10,000 over three years (para4.12).
(f) The establishment of a process and the capability for inte-grated power system pLanning (para 6.32). The undertaking of a

- x11i1 -
power system development study (para 6.24) and an institutionalstudy of the power sector (para 6.30) under the IDA PowerCredit (para 6.24) represent the first steps toward setting upsuch a planning process and capability. The mission alsosupports the current examination, under an IDA Water SupplyProject (Credit 1309-NIR), of the problem of subsidization ofwater supply by NICELEC's power subsector activities, with aview to establishing in due course a separate water supplyentity, thus freeing NIGELEC to concentrate on power supply.
(g) Creation of a special energy conservation unit within the Con-struction Directorate of the Ministry of Public Works, especi-ally to implement the conservation measures recommended in para26(e) above. Setting up such a conservation unit will requireequipment (including vehicles), the services of an expatriatespecialist for two years, and the training of Nigerien person-nel in air-conditioning engineering. Estimated cost: aboutUS$125,000 (para 7.9).
Other equally important but less urgent recommendations relating toenergy sector institutions include: (a) Government encouragement forsetting up private organizations for the transport of fuelwood while in-creasing Government control over the wood supply chain, including trans-port (para 2.25); and (b) pursuit of current efforts, under the IDA PowerCredit, to come up with a staff development plan for NIGELEC (para 6.32).

I. ENERGY IN THE ECONOMY
The Economy
1.1 Landlocked in the Sahel and with a population of 5.8 million,Niger is one of the least developed countries in the world. Its terri-tory (1,267,000 km 2 ) is mainly desert (75%); only 12% of the land isconsidered arable, and only 2.5% is actually under cultivation, with soilfertility low and declining. Rainfall is low and irregular, resulting inperiodic droughts. Per capita income was estimated at US$330 in 1980and, with population growing at 2.8% p.a., has actually declined over thepast decade, despite the short-lived uranium boom. The present adultliteracy rate is 8% and life expectancy at birth 43 years. The urbanpopulation accounts for only 10% of the total but is rapidly growing,especially in Niamey. Sixteen percent of the rural population isnomadic.
1.2 Niger's natural resource base is both limited and geographic-ally unbalanced. Scarce water supplies limit agriculture to the NigerValley and the zone along the Nigerian frontier where 90% of the popula-tion lives. The rich uranium deposits discovered in the 1960s, coal andsome small tin deposits are all located in the north central desert re-gion, 600-800 km away from the heavily populated areas. Iron ore depo-sits have been discovered near Say, 50 km southeast of Niamey, with prob-able reserves of 51-53% grade iron estimated at 650 million tonnes. Far-ther downstream on the Niger Valley, especially in the so-called W Parcregion bordering Upper Volta and Benin, phosphate rock holds promise fordevelopment. Identified reserves amount to 500 million tonnes. However,exploitation of these low value/high volume mineral resources is impededby Niger's landlocked position. The nearest ports in Benin and Nigeriaare more than 800 km away. In 1979 and again in 1982, small quantitiesof petroleum were discovered in the Agadem rift basin close to the Chadborder. Evaluation of these finds and follow-up action is in progress.
1.3 Economic activity consists mainly in subsistence agriculturewith emphasis on millet/sorghum and livestock production. In 1981, ruralsector activities accounted for 49% of GDP, whereas energy intensivesectors such as mining contributed 10%, construction 6%, transport 4% andmanufacturing industry 1%; the rest was provided by government and otherservices. The Government's goal of food self-sufficiency, with littleindustrial development planned, will reinforce this economic structure.
1.4 Recent economic growth has been marked by two major overlappingevents: (a) the Sahel drought of 1973-74, resulting in heavy losses toagriculture and livestock and a declining economy; and (b) the start-upof uranium mining in 1971, and the rapid expansion of this industry until1981 when it contributed 70% of export earnings and an important share ofgovernment revenues. The recovery from the drought was speeded up by thereturn of favorable weather conditions and government policies aimed at

2. -
rapid restoration of the cattle population and food self-sufficiency.Given the remote location of the uranium deposits, the mining industryhas remained an economic enclave in the desert with linkage effectslimited mainly to the power, construction and transport industries.Reflecting these developments, real GDP growth turned again positive in1976 and accelerated from 3.5% in 1977 to 13.6% in 1979. However, in thewake of the second large rise in oil prices in 1979-80 and the ensuingworld economic recession, the growth rate dropped to 5% in 1980 and closeto zero in 1982.
Energy in the Economy
1.5 Like other low-income countries, Niger faces a two-prongedenergy crisis: a rising energy import bill and overexploitation of itsmeager fuelwood resources. Because of its potentially disastrous conse-quences, the fuelwood crisis is actually the more serious problem of thetwo.
Fuelwood Crisis
1.6 Reflecting the predominantly rural nature of Niger's economy,fuelwood provides four-fifths of the country's gross energy supply, most-ly for cooking needs. Rising with population growth, fuelwood consump-tion is rapidly depleting the sparse forest cover. As a result, fuelwoodis becoming increasingly scarce and expensive so that less well-off urbandwellers can afford only one warm meal a day. Moreover, soil fertilityis declining and land erosion has become a serious problem, aggravatingthe threat of further desertification.
Import Dependence
1.7 Until early 1981, Niger depended entirely on imports to supplyits commercial energy needs. Since then domestic coal has been substi-tuted for diesel oil in the generation of power for the uranium mines,but the petroleum import bill has kept rising, though at a lower rate.In addition to petroleum products, Niger imports electricity from Nigeriato supply the bulk of its public system (non-mining) demand.
1.8 Energy import dependence in 1982 amounted to 18% of the mer-chandise import bill and nearly 31% of non-energy merchandise exportrevenues including uranium 1/ (Table 1.1). These percentages have morethan doubled since 1978, the increase in part reflecting the 1980-82devaluation of the CFAF vis-a-vis the US dollar by about 35%. In fact,the 1980-82 rise in the value of petroleum product imports masks a de-
l/ As it is not used for energy production in Niger, uranium is treatedhere as a non-energy commodity.
- 3 -
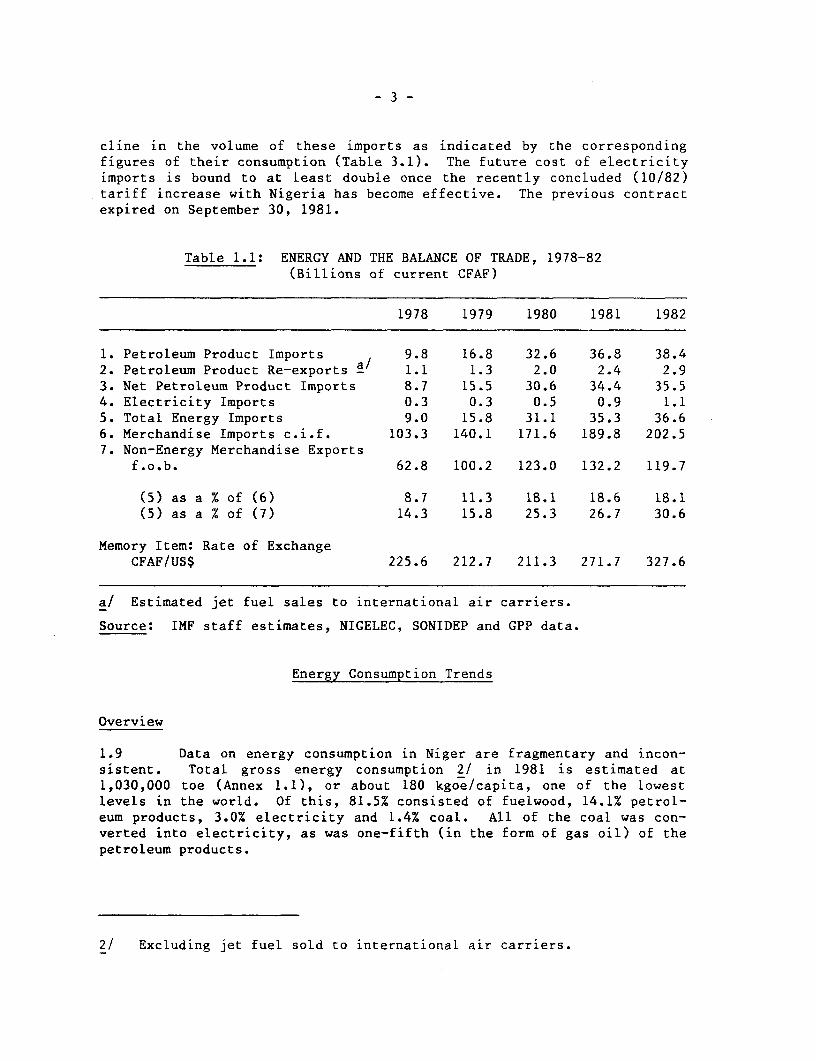
cline in the volume of these imports as indicated by the correspondingfigures of their consumption (Table 3.1). The future cost of electricityimports is bound to at least double once the recently concluded (10/82)tariff increase with Nigeria has become effective. The previous contractexpired on September 30, 1981.
Table 1.1: ENERGY AND THE BALANCE OF TRADE, 1978-82(Billions of current CFAF)
1978 1979 1980 1981 1982
1. Petroleum Product Imports 9.8 16.8 32.6 36.8 38.42. Petroleum Product Re-exports - 1.1 1.3 2.0 2.4 2.93. Net Petroleum Product Imports 8.7 15.5 30.6 34.4 35.54. Electricity Imports 0.3 0.3 0.5 0.9 1.15. Total Energy Imports 9.0 15.8 31.1 35.3 36.66. Merchandise Imports c.i.f. 103.3 140.1 171.6 189.8 202.57. Non-Energy Merchandise Exports
f.o.b. 62.8 100.2 123.0 132.2 119.7
(5) as a % of (6) 8.7 11.3 18.1 18.6 18.1(5) as a % of (7) 14.3 15.8 25.3 26.7 30.6
Memory Item: Rate of ExchangeCFAF/US$ 225.6 212.7 211.3 271.7 327.6
a/ Estimated jet fuel sales to international air carriers.
Source: IMF staff estimates, NIGELEC, SONIDEP and GPP data.
Energy Consumption Trends
Overview
1.9 Data on energy consumption in Niger are fragmentary and incon-sistent. Total gross energy consumption 2/ in 1981 is estimated at1,030,000 toe (Annex 1.1), or about 180 kgoe/capita, one of the lowestlevels in the world. Of this, 81.5% consisted of fuelwood, 14.1% petrol-eum products, 3.0% electricity and 1.4% coal. All of the coal was con-verted into electricity, as was one-fifth (in the form of gas oil) of thepetroleum products.
2/ Excluding jet fuel sold to international air carriers.

- 4 -
Table 1.2: PATTERN OF NET DEMESTIC ENERGY CONSUMPTIONBY SECTOR, 1981
(Percent)
TotalPetroleum Commercial Total
Sector Products Electricity Energy Energy b
Mining 16.05 42.52 20.22 2.87Industry & Construction 30.68 14.96 28.20 12.83Transport 48.37 0.79 40.88 5.81Public Administration 0.03 14.57 2.32 0.33Households/Residential 4.01 20.86 6.66 77.91Agriculture/Commerce!Other 0.86 6.30 1.72 0.25TOTAL 100.00 100.00 100.00 100.00
Total (toe) 115,529 21,590 a/ 137,119 964,277
Note: The figures indicate direct, final consumption, net of all conver-sion losses and, in the case of electricity, of transmission anddistribution losses as well.
a/ Calculated at the maximum theoretical heating value of electricity,85 toe/GWh.
b/ Includes fuelwood (estimated at 824,615 toe), charcoal (estimated at2,425 toe), and groundnut shells (about 118 toe).
Source: National Energy Balance (Annex 1.1).
1.10 Net energy consumption by sector (Table 1.2) reflects the pre-dominant role of fuelwood; its almost exclusive domestic/residential usemakes this sector account for 78% of the total net consumption. Thebalance went mainly into industry and construction (13%), transport (6%)and mining (3%).
1.11 The picture is different for the sectoral distribution of netcommercial energy consumption. Transport took the lion's share - 41% ofthe total and 48% of (directly consumed) petroleum products, followed byindustry and construction (28% and 31%). Mining stands out as the big-gest electricity consumer (43%) and ranks third in total commercialenergy consumption (20%). The relatively high electricity consumption ofhouseholds (21%) and public administration (15%) reflects the widespreaduse of air conditioning, particularly in Niamey.
Commercial Energy Consumption and CDP
1.12 Commercial energy consumption grew much faster than real GDPduring the period under review (Table 1.3). Its implied elasticity with

5-
respect to total GDP was 2.6 between 1976-79, at the height of theuranium boom, and 3.6 over the following three years when GDP growthdecelerated to almost zero in 1982. Since mining has provided the engineof growth, a more useful relationship is the elasticity of commercialenergy consumption with respect to modern sector GDP only. This isestimated at the much lower figure of about 1.5. The fact remains,however, that over the 1976-82 period commercial energy intensity hasincreased by two-thirds, from 0.38 to 0.63 toe per million CFAF of totalGDP. Even more significantly, commercial energy intensity kept risingwhile GDP/capita was actually declining (1979-1982). The same phenomenonis observed as well in other developing countries at similar incomelevels, e.g. Senegal.
Table 1.3: COMMERCIAL ENERGY CONSUMPTION a' AND GDP, 1976-82
Growth Rate % p.a.1976 1979 1982 b/ 1976-1979 1979-1982
Total Consumption,'000 toe 91.5 164.4 208.2 21.8 8.2
Consumption percapita, kgoe 19.3 31.9 35.9 18.2 4.0
CDP (billion CFAF,1976) 241.2 307.1 329.0 c/ 8.4 2.3
GDP per capita('000 CFAF, 1976) 51.0 59.5 56.7 5.3 (1.6)
Energy per millionCFAF of GDP, toe 0.38 0.54 0.63 12.4 5.3
a/ Gross consumption, i.e. including conversion losses in power genera-tion as well as transmission and distribution losses. Electricitycalculated at thermal equivalent value of 265 toe/GWh. Excludesbutane and jet fuel, which is sold to international air carriers.
b/ Extrapolated from data through September 1982.c/ IMF staff estimate.
Source: Ministere du Plan, GPP, NIGELEC, SONICHAR.
Overview of Energy Resources
Uranium
1.13 Niger's present known energy resources are dominated by ura-nium, of which it is one of the largest exporters in the world. Sizableuranium ore deposits exist in the northern part of the country, on thesouthern and western borders of the Air Massif (IBRD Map 17253). Lesserdiscoveries were made in the northeastern Djado region. Most ores grade

-6-
3 kg of uranium per tonne. The Nigerien yellowcake (uranium oxide U3 08)contains about 70% uranium metal. Production began in 1971 and outputexpanded from 450 tonnes of uranium equivalent in that year to 4,370tonnes in 1981. Reasonably assured reserves are estimated at 160,000tonnes, with an additional 53,000 tonnes of probable reserves. Althoughuranium, when measured in terms of burn-up rates of nuclear reactors,represents Niger's largest source of energy, the small size of the fore-seeable power demand offers no encouragement for development of nuclearpower, and uranium will probably remain Niger's principal export commod-ity.
Coal and Lignite
1.14 The Anou-Araren coal deposits in the north of the country con-sist of about 9.4 million tonnes at 3,650 kcal/kg (3.4 million toe). Thecoal is being used exclusively (at the current rate of 100,000 to 200,000tpa) in a 32 MW power plant which supplies the nearby uranium mines andadjacent areas. A recent discovery near Solomi, about 30 km north ofAnou-Araren, could indicate a significant deposit of higher quality coal(7000 kcal/kg). There have been various indications of lignite depositsin the south, the most promising of which has a resource potential tenta-tively evaluated at 2.6 million tonnes, with a calorific value of 4,000kcal/kg (1 million toe in all).
Petroleum
1.15 No commercial discoveries of petroleum have occurred in Nigeras yet. However, petroleum exploration has intensified in recent years,with encouraging finds in the Agadem basin (250 km from the border ofChad). The reserves are being evaluated to determine their productionpossibilities.
Hydropower
1.16 The hydro resources of the country are concentrated in thesouthwestern part where the Niger River traverses about 420 km ofNigerien territory. The potential for hydro power development islimited. Two sites, Kandadji and W, are estimated to have a combinedannual energy capability of 1,250 GWh (330,000 toe) for an average hydro-logical year. Subject to international agreements (with Mali and Benin,respectively) a second stage of Kandadji could add another 750 GWh(199,000 toe), and on the international stretch of the Mekrou tributaryanother site (Dyodyonga) could be developed with an annual output of 80GWh (21,000 toe).
Fuelwood
1.17 In 1980, given the lack of precise data, the FAO estimatedNiger's natural forest cover, which is limited mostly to the southernpart of the country, at 15.1 million hectares (ha). The net availableincrement of fuelwood in the same year amounted to 0.09m3/ha which gives

- 7 -
a total net available increment of 1.4 million m3 (280,000 toe). This,however, was only about 35% of fuelwood consumption (825,000 toe).
Biomass Other Than Wood
1.18 In 1979/80, Niger produced crop residues and animal waste withan estimated theoretical maximum energy potential of 2.2 million toe but,because of competing uses as well as technical, economic, and social con-straints, only a very small fraction (i.e. probably less than 5%) of thisfigure could have been used for energy conversion. Other than the un-known amounts of crop residues and dung burned for cooking in areas ofsevere fuelwood shortages, the largest quantity of biomass energy pro-duced and consumed in 1980 and 1981 was in the form of groundnut shellbriquettes. In 1980/81, 336 tonnes of briquettes (148 toe) were pro-duced. This constitutes less than one percent of the overall theoreticalgroundnut shell potential which in the same season could have producedabout 39,000 tonnes of briquettes (17,000 toe).
Solar and Wind Energy, Small Hydro
1.19 Solar insolation is excellent in Niger. In the southern partof the country, average values of total (direct and diffuse) radiation ona horizontal surface range from 5.6 to 6.3 kWh/m2/day (i.e. 170 to 200kgoe/m2/yr), and the average daily duration of sunlight varies between8.5 and 9.5 hours.
1.20 Niger's wind resource is very poor; maximum wind speeds onlyreach 3.9 m/s, at Tahoua. Similarly, the small hydro resource also seemsto have a limited potential.

-8-
II. FUELWOOD
2.1 In tackling Niger's fuelwood crisis (para 1.6), a concertedeffort is needed both to increase the supply of fuelwood and to reducethe demand for it. Increasing the fuelwood supply means better manage-ment of the natural forest cover and reafforestation, the scope forwhich, however, is limited in Niger and which anyway has a long gestationperiod; importing charcoal does not seem to be a viable alternative. Re-ducing the demand for fuelwood, on the other hand, can be achievedthrough an array of measures, foremost among which are conservationthrough improved fuelwood stoves, and substitution of other energy re-sources. The demand side offers the most scope for substantially reliev-ing the fuelwood crisis.
Fuelwood Resources
2.2 In the absence of precise data, a recent FAO report 3/ hastentatively estimated Niger's total forest cover in 1980 to be 15.1 mil-lion hectares, of which (in million hectares) 5.5 are tree savannas, 3.0bush fallows, 3.0 sylvo-agricultural formations, 2.1 woodlands andsavanna woodlands, and 1.5 shrub savannas. Included in these 15.1 mil-lion hectares are: (a) one million ha of forest and fauna reserves,parks, and controlled forestry areas in proportions of 20% forest re-serves to 80% fauna reserves; and (b) some 20,000 equivalent ha of forestplantations, mostly for fuelwood and building poles. Population growthis seriously encroaching upon and threatening many of these reserves.
2.3 Forests in Niger are not dense areas of trees but are ratherdispersed tree formations. Moreover, most of these forests belong to"agropastoral" or "sylvopastoral" formations which produce little fuel-wood and few building poles. Most of the fuelwood resource potentialexists in the narrow, rain-fed strip of the southern part of the country,stretching from west to east below the northern limit of cultivation.The FAO estimates the total mean annual increment to have been 4,200,000equivalent m3 of roundwood (1,890,000 tonnes) in 1980. In terms of anational average, that amounts to a growth of 0.28 m3 of roundwood perhectare of natural forest cover a year. However, given the overexploita-tion of the natural forest cover around populated areas, much of Niger'sremaining fuelwood resources are at such great distances from consumersthat access to them is becoming more and more difficult. Therefore, in1980 only 1,400,000 mi , or 33% of the mean annual increment, is con-sidered actually to have been available. Given this total net availableincrement, the average net available increment of fuelwood per hectare of
3/ M. N. Keita, Availability of Fuelwood in the Sahel (Present Positionand Prospects), FAO, Rome, .982.

- 9 -
natural forest cover was only 0.09 m3 of roundwood a year in the sameyear. About 10% of this amount would be used for building poles. 4/Annex 2.1 provides a breakdown of the total mean annual increment and thenet available increment of fuetwood in 1980 by type of forest cover andgeographic zone (see also IBRD map 16937).
Fuelwood Consumption
2.4 There are no accurate data on woodfuels consumption in Niger.What is certain is that very little wood is consumed in the form of char-coal because the main urban areas can still obtain firewood from within aradius of 100 km, so that only minimal amounts of charcoal are producedand consumed, mostly for ironing and making tea. However, given the everincreasing fuelwood demand from the main population centers, the irre-mediable destruction of the fragile forest cover around these centersmeans that fuelwood supplies will require increasingly long truck hauls.Charcoal is less expensive than wood to transport on a calorific basisbecause the heating potential of charcoal by volume is higher than thatof wood, and volume rather than weight determines transport cost. Eventhough charcoal production and marketing might prove to be economicallyfeasible, such a course of action is hardly indicated since wood from thenatural forest of Niger does not lend itself well to charcoal production,using large amounts of wood to produce charcoal poses an ecologicaldanger, and Niger has no expertise in large-scale charcoal manufacturing.
2.5 According to the 1981 CILSS/OECD Report, 5/ the average percapita consumption of woodfuels, including cooking and heating, amountto an estimated 0.9 kg of dried wood per day, or about 0.75 equivalent mof roundwood per year. Based on this assrmption, the total fuelwood con-sumption reached 4.1 million equivalent m of roundwood in 1980, of which0.8 million m3 (20%) was consumed in the urban areas and 3.3 million m3(80%) in the rural areas. This total consumption comes to nearly threetimes the net available increment of fuelwood (1.4 million m3) in thesame year.
2.6 The FAO estimates 0.60 equivalent m3 of roundwood per capitaper year to be the amount of fuelwood needed for cooking and heating, orabout 20% less than actually seems to be consumed in Niger. But even onthis basis, 72% of the population faced an acute scarcity of fuelwood in1980, 24% a deficit, and 4% a prospective deficit. Moreover, the conti-nuing depletion of the accessible forest cover is causing a decline in
4/ As this percentage falls within the margin of error of these produc-tion estimates, no special alLowance for building poles is made inthe totals.
5/ Forestry Sector Analysis and Proposals: Niger, CILSS/OECD, 1981.

- 10 -
soil fertility, and desertification will intensify, resulting in heavylosses in agricultural production.
2.7 Unless prompt action is taken both to protect and develop thenatural forest cover and to change current patterns of fuelwood use, thetotal net available increment of fuelwood per year will decline to 1.0million m3 by 2000, almost 30% less than in 1980 (Table 2.1).
Table 2.1: EVOLUTION OF NATURAL FOREST COVER AND FUELWOOD SUPPLYBASED ON CURRENT TRENDS, 1980-2015 a/
1980 Index 2000 Index 2015 Index
Woodlands and savannas(000 ha) 9,100 100 6,900 76 5,300 58
Bush fallows (000 ha) 3,000 100 2,800 93 2,600 87Sylvo-agricultural formations
(000 ha) 3,000 100 5,000 167 6,600 220Total natural forest cover
(000 ha) 15,100 100 14,700 97 14,500 96Mean annual increment per ha
(m3/yr.) 0.28 100 0.22 79 0.18 64Net available increment per ha
(m3/yr.) b/ 0.09 100 0.07 78 0.07 78Total mean annual increment
(000 m ) 4,200 100 3,200 76 2,600 62Total, net available increment
(000 m ) b/ 1,400 100 1,000 71 1,000 71
a/ i.e. with no effort to develop fuelwood resources and no change infuelwood consumption per capita from the 1980 rate.
b/ i.e. the amount of the mean annual increment that is accessible.
Source: FAO.
2.8 This means that Niger's already large fuelwood deficit willmore than double by the year 2000 (Table 2.2).
Main Forestry Sector Constraints
2.9 The main constraints to forestry development are:
(a) poor soils, limited rainfall, and a lack of forestry technicalpackages well-adapted to marginal lands in these arid and semi-arid zones with only one peak of rainfall;

- 11 -
Table 2.2: FUELWOOD RESOURCES, CONSUMPTION AND NEEDS BASED ON
CURRENT TRENDS, 1980-2015 al
('000 m3)
Actual Projected1980 2000 2015
A. Total, net available increment b/ 1,400 1,000 1,000B. Total consumption (at 0.75
m3/capita/year) 4,100 7,200 10,900Deficit (A - B) 2,700 6,200 9,900
C. Total needs (at 0.60 m3/capita/year) 3,300 5,800 8,700Deficit (A - C) 1,900 4,800 7,700
a/ i.e. no protection or development of the forest cover and no changein fuelwood consumption. Based on a growth rate of about 2.8% p.a.,the population figures used to calculate consumption and needs havebeen rounded off to 5.5, 9.6 and 14.5 million inhabitants in 1980,2000 and 2015, respectively.
b/ i.e. total accessible mean annual increment.
Source: CILSS/OECD and FAO.
(b) the difficulty of preventing the natural forest cover fromoveruse (too much cutting, clearing, grazing, burning, etc.);
(c) a difficulty in obtaining full and sustained governmental com-mitment and popular participation. Recent initiatives show anincreased awareness of the problem by both the Government andthe people, and indicate progress in this regard.
2.10 With most of the country receiving less than 400 mm of rain peryear and with rainfall being erratic, forestry in Niger technically issevereLy limited. Because only 12% of the land is considered arable,forestry plantations compete directly with agriculture for good soils.Agrarian as well as livestock pressures on land in the southern rain-fedbelt mean that all forestry plantations need to be efficiently fenced andguarded, an expensive undertaking. Due to the lack of a productive tech-nical package, initial results from ongoing projects show that for theaverage hectase of rain-fed tree plantations the expected pro Iuction isonly 2 to 3 m per year for well managed plantations and 1-2 m per yearfor rural woodlots. There is, however, the possibility of producing woodunder irrigation (pure stand plantations, tree plantations within irri-gated agricultural perimeters, i.e. hedges, wind breaks, groves, thick-ets, ....) which, if feasible, would play a significant role in allevi-ating the continued devastation of the fragile forest cover. The feasi-bility of such plantations is being determined under the second

- 12 -
IDA/FAC/CCCE forestry project. Without prejudging the outcome, one canalready say that pure stand plantations are very costly and the scope fortree plantations within irrigated agricultural perimeters, while yieldinggood results, is limited.
2.11 Competition for the scarce land resources leads directly to theoveruse of the natural forest which constitutes the second main con-straint to forestry development. Better management of the forest coverwould mainly imply protection against over-cutting, over-grazing, over-clearing, and uncontrolled bush fires. Under the best conditions, witheffective participation of the rural population and herders, the produc-tion from better managed natural forests may be expected to increase bytwo-thirds, from the current average of 0.30 m3/ha/year to 0.50m3/ha/year.
2.12 The final major obstacle to improving Niger's wood resourceswas, until recently, the lack of popular as well as governmental support.This lack of support stemmed from the competition for resources betweenagriculture, pastoralism, and forestry. In the eyes of the Governmentand of the people, short-term gains such as an increase in the productionof food crops and livestock frequently outweighed the benefits to be ob-tained in the medium to long term from forestry development programs.Moreover, forestry programs implemented to date have not gained popularsupport, partly because they were conceived without taking into accountthe need for individual participation by the rural population and partlybecause the population did not feel as seriously threatened as it doesnow. However, the difficulty posed by the lack of support is now beingresolved as is evidenced by the Government's public awareness efforts,e.g. its proclamation of the year 1984 as the Year of Reforestation, andby linking the National Holiday of August 3 to the National Holiday ofthe Tree.
2.13 The sensitization of the population needs to be increased forits participation to become more significant. Nevertheless, there areindications that the local population is interested in growing trees.The results of tests in the Majjia Valley have convinced some farmersthat wind breaks can increase millet yields by about 20-30%. Farmers arealso aware that Gao trees (Acacia Albida) that have traditionally playeda fertilizing role for millet land are being cut for wood, threatening toreduce cereal yields, and they have expressed interest in learning moreabout selective protection of natural regeneration for Gao trees andother local tree species. The national forestry code specifies certaintree species as protected but does not discourage the planting or pro-tection of these species by individuals who can eventually exploitthem. As part of its responsibilities, the project unit of the secondIDA/FAC/CCCE forestry project is to work through the Directorate ofForestry and Fauna to educate forestry staff and the rural population onthe proper interpretation of the forestry code. The first reconnaissancestudy planned for the rural forestry component of the project aims atlocating areas suitable for tree planting either on an individual orfamily basis, but with the understanding that the trees planted would be

- 13 -
the personal property of those who planted them and that project exten-sion staff stand ready to give technical advice on planting and treemaintenance to all families willing to plant.
Increasing Fuelwood Supply
2.14 Since the 1973/74 drought, the Government has recognized theneed to protect the remaining forest cover, to develop a sustained supplyof fuelwood, and to promote wood substitutes and a better use of wood.In general terms, this translates into a Government strategy of:(a) building up forestry institutions through training; (b) establishingfast growing tree plantations and improving the management of the naturalforest cover; (c) encouraging the participation of the rural populationin reafforestation; and (d) supporting research into improved forestrytechnical packages and efficient uses of wood. In practice, however,there has not been an adequate allocation of Government funds, and there-fore of equipment or operating supplies to the Directorate of Forestryand Fauna. As it is busy implementing current projects, the Directorateof Forestry and Fauna has not been able to work on inventory control orplanning. There is therefore no detailed forestry master plan.
2.15 After taking into account the results of ongoing projects, par-ticularly with respect to expanding the implementation arm of theDirectorate of Forestry and Fauna, the mission considers the indicativeobjectives presented in Table 2.3 for maximum national production fromplantations and improved forest management through 2015 to berealistic. According to these estimates, the fuelwood production in theyear 2000 from "industrial" irrigated tree plantations, which could allbe on the more economic bottom lands, would only contribute about 3% ofNiamey's projected fuelwood demand of 750,000 m3 for that year (based onan average population growth rate in Niamey of about 6% from 1982 to2000). However, if the absorptive capacity of the Directorate ofForestry and Fauna could be further increased to handle 10,000 ratherthan 2,000 ha of bottom land plantations by the year 2000, the productionfrom these areas close to Niamey would account for almost 15% of thecity's projected demand. Given the competing uses for land in Niger, aprogram is urgently needed to maximize production from plantations aswell as to improve management of the natural forest cover. This willrequire a comprehensive approach which takes into account the interactionof forestry, agriculture, and pastoralism (agro-sylvo-pastoralism). Forexample, more intensive livestock and agricultural practices promotedthrough well balanced and operationally integrated schemes would helpreduce the damage to the fragile natural forest cover. Such an approachwill require a great deal of goodwill and coordination between herders,farmers, and various Government agencies.

- 14 -
Table 2.3: MISSION PROP9SALS ON CUMULATIVE OBJECTIVES FOR FUELWOODPRODUCTION a FROM PLANTATIONS AND IMPROVED
FOREST MANAGEMENT IN 2000 AND 2015
2000 2015Annual Annual Annual Annual
Total Produc- Pro- Total Produc- Pro-Area tivity duction Area tivity duction
(000 ha) (m3/ha) (000 m3) (000 ha) (m3/ha) (000 m3)
State-managed "industrial"irrigated tree plantations 2 15.0 30 5 15.0 75
Tree plantations within irri-gated agricul ur4lperimeters c/ d 2 10.0 20 5 10.0 50
State-managed rain-fed treeplantations 40 2.5 100 60 2.5 150
Rural rain-fed treeplantations - 100 1.5 150 150 1.5 225
Subtotal tree plantations 144 2.1 300 220 2.3 500Better management ofnatural forest cover 2,000 0.5 1,000 4,000 0.5 2,000
Total annual production 1,300 2,500
a/ i.e. incLuding wood for building poles (about 10% of the total).b/ i.e. planting on terraces and bottom lands.c/ Hedges, wind breaks, groves, thickets, ...
d/ Total area planted listed in terms of equivalent hectares.
Source: Bank staff
2.16 Adding the maximum possible "new" fuelwood supplies to the pro-jected net available supply of fuelwood from existing resources, and com-paring the result with the projected demand calculated on the basis of0.75 m3/capita/year shows that by the year 2000 Niger will have to eithereliminate or substitute for about 70% of its fuelwood demand by using im-proved woodstoves or cboking with alternative fuels (Table 2.4). Interms of the more conservative FAO estimate of fuelwood needs at 0.60m /capita/year, about 60% of these projected needs would have to be metthrough conservation and substitution.
Recommendations
2.17 Excluding any actions with respect to conservation of and sub-stitution for fuelwood discussed below, the mission recommends that theGovernment commit itself to:

- 15 -
Table 2.4: MISSION PROPOSALS FOR MEETING PROJECTED FUELWOODDEMAND IN 2000 AND 2015
Actual Projected1980 2000 2015
(000 m3) (%) (000 m3) (%) (000 m3) (%)
Demand with no change a/ 4,100 100 7,200 100 10,900 100Available resources 14with no change - 1,400 34 1,000 14 1,000 9
Tree plantations c/ - - 300 4 500 5
Better management of cInatural forest cover c - - 1,000 14 2,000 18
Better use of wood,use of substitutes - - - 4,900 68 7,400 68
Overcutting of accessibleforest cover 2,700 66 - - - -
a/ At 0.75 m3lcapita/year.b/ i.e. total accessible mean annual increment.c/ Negligible in 1980.d/ Does not apply in 1980.
Source: CILSS/OECD and Bank staff.
(a) pursuing the planting and improved management objectives out-lined in Table 2.3 and described in greater detail in Annex2.2. The planting program should include a vigorous forestryextension effort to help establish individual or family wood-lots in order to secure the support of the rural population,while the program for better management of the natural forestcover should be based on the agro-sylvo-pastoral approachreferred to in para 2.15. As shown in Annex 2.2, the estimatedcosts of these planting and improved management proposals,excluding complementary forestry training and extension work,amount to about US$9 million (1982) p.a. from 1984 through1988, and US$10 million p.a. from 1989 through 2018. Presentlythe Directorate of Forestry and Fauna can handle about US$5million worth of work per year. A long-term forestry effortwould therefore require a specific complementary forestrytraining program (para 2.27).
(b) investigating new forestry technical packages which are welladapted to marginal lands in arid and semi-arid zones for localand exotic tree species by experimentation with vegetativemultiplication, mycorrhiza, and symbiotic microorganisms, suchas rhizobia and frankia.

- 16 -
Conservation
2.18 Substantial savings of fuelwood could be achieved by the earlyintroduction of an improved fuelwood stove which ideally also wouldhandle fuelwood substitutes. Many different groups in Niger are attempt-ing to develop and disseminate a woodstove that is more energy efficientthan the widely used three stone fire and the junk metal stove ("foyermalgache") which is employed mostly in urban areas. These organizationsinclude the Church World Service (CWS), the Young Farmers' Training Cen-ter (Centre de Formation des Jeunes Agriculteurs, CFJA), the Nigerienfarmers' cooperative organization (Union Nigerienne de Credit et de Coop-eration, UNCC), the Association of Nigerien Women (Association des Femmesdu Niger, AFN), the U.S. Peace Corps, the French Volunteer Association(Association Francaise des Volantaires du Progres, AFVP), two CatholicChurch groups in the Tapis Vert project, UNSO, and CILSS. All of theefforts to date have been on a test basis, with the actual building ofstoves and the training of people in their construction limited to a verysmall scale. The AFN-CWS project, designed to closely monitor theacceptability of the cement "Kaya" model in Niamey, has been the largestone, producing 800 stoves.
2.19 The European Economic Community (EEC) and UNSO are proposingtwo additional improved stove projects. The EEC project involves theconstruction and dissemination of 6,000 clay ("banco") stoves over threeyears in Niamey, Maradi and Zinder. Under its Preliminary Plan of Im-proving Wood Stoves in Niger, UNSO proposes to build 100 demonstrationstoves for use in medical centers, schools, maternities, etc. in theprovinces of Zinder, Maradi, Dosso and Tahoua, and to ensure constructionand monitoring of 260 stoves to be placed with families where their op-eration has the best chance of success. There is evidence of a growingconsensus among the organizations involved on the need for overall coor-dination of the various improved woodstove efforts. Another means ofpromoting fuelwood conservation, and one which does not seem to have beenpursued in Niger, is teaching more fuel efficient ways of cooking withthe traditional three stone fire. Proper use of the open fire can in-crease its thermal efficiency from 8% to 15%.
2.20 The mission considers that the most expedient procedure for re-ducing the demand for wood by means of improved woodstoves is to focus ondeveloping appropriate stove models for dissemination to carefullyselected groups in urban and peri-urban areas. In these areas, the lackof fuelwood poses the most severe problem because there are no readilyavailable, inexpensive substitutes. In contrast, rural areas have cropresidues and animal wastes which can be burned (although this practiceshould be avoided because it reduces soil fertility). The improved stovemodels should: (a) be portable enough to appeal to renters; (b) provideat least a 30-50% increase in end-use efficiency over the prevailingmethod of cooking (three stone fire or foyer malgache) in these urban andperi-urban areas; (c) be able to be manufactured locally; (d) be cheapenough so that, for a certain efficiency level, their use leads to

- 17 -
significant cash savings in buying wood; (e) be socially acceptable,which should be greatly facilitated by the financial savings they pro-vide; and (f) be designed for wood but, if possible, be suitable also forcharcoal, groundnut shell briquettes, and perhaps lignite. The UpperVolta portable metal fuelwood stove which recently was introduced suc-cessfully in the Ouagadougou market place, would appear to meet most, ofthese criteria. Its end-use efficiency is reported to be 25-30% (com-pared to an efficiency of about 19% for the "banco" stove and 15% for thethree stone fire). It is manufactured locally from scrap metal andreportedly sells at about CFAF 1,000 (about US$3 equivalent) withoutsubsidy.
Recommendations
2.21 The mission recommends:
(a) Centralization of efforts concerning improved wood stoves with-in the Directorate of Energy (DE) of the Ministry of Mines andIndustry. The DE should closely monitor developments in thisarea at the national level and keep itself informed of progressof similar efforts on the international plane with a view toevolving a policy and a plan of action for producing and dis-seminating appropriate models of improved stoves.
(b) Dissemination on an experimental basis in Niamey of a versionof the "Ouaga stove" mentioned above. This would involve thecareful selection of a target group of people likely to beinterested in using an improved stove, closely monitoring theuse by this group of an "Ouaga" type stove and modifications ofthis stove in light of the experience gained. This would allowgradual increases in the scale of production and marketing formodels which already have received consumer acceptance. Thisexperimental project should benefit from the equipment of thelaboratories of ONERSOL for testing and modifying the parti-cular stove model distributed. The woodstove experts for thisproject could also provide assistance to the DE in managing thetasks described in (a) above.
Substitution
2.22 Possible substitutes for fuelwood include charcoal, coal, lig-nite, biomass other than wood, solar energy, petroleum products, andelectricity. Substitution of the first four would be greatly facilitatedby the dissemination of a multi-fuel stove as discussed above. Also, asdiscussed above (para 2.4), charcoal production in Niger would requirefurther study. The potential of the other substitutes for meetingcooking needs is analyzed in subsequent chapters.

- 18 -
Forestry Sector Institutions
2.23 Organized into eight field districts, the Directorate of For-estry and Fauna (Direction des for&ts et de la faune) of the Ministry ofHydraulics and of the Environment manages Niger's natural forest cover.Forestry research forms part of the activities of Niger's agriculturalresearch institute, INRAN, which reports to the Ministry of Higher Edu-cation and Scientific Research. Under the second IDA/FAC/CCCE forestryproject, the forestry research division of the institute will work onseedling production, soil requirements for forestry, establishing treeplantations, improving the naturaL forest cover and tree plantations, im-proving planting stock, and forestry economics.
2.24 Exploitation of the forest cover for fuelwood in Niger does nottake place on an organized basis; it is commercialized mainly for urbanconsumption. The commercial setup involves gathering the fuelwood,transporting it, and the reselling of it by retailers. The Directorateof Forestry and Fauna theoretically controls the entire wood supplychain, from production to final sale. Because of manpower constraints,the Directorate, in fact, controls mainly the transport phase, as peoplewho want to sell wood must first obtain a permit from the Directorate ofForestry and Fauna. The price of the permit is fixed on a monthly basisaccording to the means of transportation involved, whether donkey, camel,pick-up, or truck. In practice, this is difficult to police. However,the receding forest cover around major population centers has led to anincreasing use of trucks by wood sellers, and this improves the chancesfor better Directorate of Forestry control.
Recommendation
2.25 The mission recommends that the Government pay much greaterattention to controlling the wood supply chain, provided that, because ofits very high costs, the transport phase remain private, subject tocontrol by the Directorate of Forestry and Fauna. It would even beappropriate for the Government to encourage the setting up of privateorganizations for the transport of fuelwood. Besides facilitating theDirectorate's control over fuelwood exploitation, notably through thepolicing of permits, an efficiently organized transport system wouldincrease the amount of the mean annual increment of wood that is acces-sible.
Manpower Issues and Training Needs in the Forestry Sector
2.26 Given the magnitude of Niger's forestry problems, the Direc-torate of Forestry and Fauna, with a total staff of 301 in 1981, remainsunderstaffed even in spite of recent improvements. There is little plan-ning and inventory control, and the situation is made worse by an inade-quate allocation of funds, equipment, and operating supplies from the

- 19 -
Government budget. As a result, the Directorate cannot fulfill a largepart of its responsibilities, such as providing the necessary reaffor-estation or erosion control programs on a significant scale. Two currentprojects are designed to improve the situation by providing operationalinputs, training, vehicles, and equipment: the second IDA/FAC/CCCE for-estry project and the USAID forestry and land use planning project, whichin particular is trying to build up an inventory control unit within theDirectorate.
2.27 Senior forestry officers (level A), until recently have beentrained abroad (nine in 1981), but in the future they will be trained atthe agronomy school (Ecole Superieure d'Agronomie) in Niamey. An in-stitute for rural development (Institut Pratique de D6veloppement Rural)at Kolo provides education for level B and C staff, but there is no for-mal training for level D personnel, who are supposed to learn on the job,although they are the executing agents. Forestry education curriculashould place greater emphasis on reafforestation and natural forest man-agement, and field staff should be provided-with refresher courses inthese areas. In addition, junior level staff lack minimum training inforestry techniques. The second IDA/FAC/CCCE forestry project is addres-sing these needs by establishing a small training center in Niamey toprovide regular training courses for field forestry staff, especiallylevel D. However, given the magnitude of training needs in forestry, along-term commitment to develop forest resources as recommended by themission would require a specific complementary forestry trainingprogram. As a rough estimate, the Directorate of Forestry and Faunawould need to appoint about five new level A, ten new level B, andfifteen new level C staff every year until 1990.
Recommendation
2.28 The mission recommends that the Government, in pursuing theplanting and improved forest management objectives proposed in para 2.17,closely consider the need to launch, as soon as feasible, the complemen-tary forestry training program mentioned above. Such a program wouldcost roughly US$1.5 million to run for five years, as shown on an indi-cative basis in Annex 2.3. Preparation and feasibility studies wouldneed to be carried out to define such a program more precisely.

- 20 -
III. PETROLEUM
Consumption of Petroleum Products
3.1 The consumption of petroleum products more than doubled between1973 and 1980 and then declined by 5.2% p.a. in the following two years(Table 3.1). Most of the increase occurred between 1976 and 1980, at anannual rate of nearly 15%, reflecting the uranium boom. The subsequentdecline was due to the substitution of domestic coal for gas oil insupplying power to the mining district during 1981/82. As a result,gas/diesel oil consumption dropped by 11% p.a. The consumption of gas-oline, on the other hand, continued to rise unabated, even though thesecond drastic world price increase in 1979/80 was immediately passed onto consumers. Much the same goes for kerosene, whose retail price hasremained above its import level even despite subsidization (see para7.12). Again, because of the substitution of coal for gas oil, there wassome change in product composition away from the heavy preponderance ofgas/diesel oil, which dropped from its peak of 74% of total consumptionin 1980 to 64% in 1982. As a corollary, the share of gasoline rose from23% to 32% over the same period, and kerosene increased from 3% to 4%.Gas oil was preferred over the less expensive fuel oil because individualconsumers consider the quantities they need too small to justify the costof maintaining the fuel oil's viscosity at a useable level.
3.2 Of the approximate 145,000 toe of petroleum products consumedin 1981, 6/ transport accounted for 39%, power generation 20%, construc-tion (mainly roads) 19%, mining (excavation equipment) 13%, industry only5%, households 3%, and other sectors the remaining 1% (Annex 1.1).
3.3 Niger consumes very small amounts of butane and kerosene forhousehold purposes (Table 3.1). Detailed information on their consump-tion is lacking but, on a calorific basis, the estimated total amount ofboth fuels used for cooking and lighting comes to less than 1% of Niger'shousehold consumption of wood. Almost exclusively an urban fuel, butaneis used for cooking in higher income households, including those of min-ing personnel, in Government residences, and also in hotels. The totalamount consumed for this purpose has remained constant at about 400 toe(380 tonnes) p.a. In terms of fuel end-use efficiencies, butane by it-self costs, at a subsidized price, about the same amount to cook with asfuelwood burned by the three stone method (Table 7.3). However, theleast expensive equipment for cooking with butane retails for about15,000 CFAF (US$45) in Niamey and the deposit on the bottle comes toabout 6,000 CFAF (US$18). These costs, together with the unfamiliarityof handling a highly flammable material, prevent the majority of familiesfrom using butane for cooking.
6/ Includes gas oil for power generation and butane, but excludes reex-ported jet fuel.

Table 3.1: CONSUMPTION OF PETROLEUM PRODUCTS, 1973-1982 al
1973 1976 1979 1980 1981 1982 blTooo 000 T TO000 '000 Z 000 tGrowth Rate % p.a.toe share toe toe toe share toe toe share 1973-76 1976-80 1980-82
Gasoline 19.2 (26.2) 22.2 31.8 35.2 (22.7) 40.6 44.6 (32.1) 5.0 12.2 12.6AviationGasoline 0.5 (0.7) 2.3 2.4 1.3 (0.8) 0.7 0.5 (0.2) 66.3 -13.3 -38.0Kerosene 2.8 (3.8) 3.4 4.2 4.2 (2.7) 4.5 5.0 (3.6) 6.7 5.4 9.1Gas/DieielOil _ 50.7 (69.3) 60.8 105.2 114.1 (73.7) 98.9 88.9 (64.0) 6.2 17.0 -11.7
TOTAL 73.2 (100.0) 88.7 143.6 154.8 (100.0) 144.7 139.0 (100.0) 6.6 14.9 -5.2
a! Total consumption, including for power generation. Excludes jet fuel (re-exported), butane (e.g. 471toe in 1981), and petroleum products for non-energy uses.
b/ Extrapolated from data for January to September 1982.c/ Includes small amounts of fuel oil (e.g. 600 toe in 1973 and 3500 toe in 1982).
Source: GPP

- 22 -
3.4 As for kerosene, most of the 4,460 toe (4,415 tonnes) consumedin 1981 was for lighting. The consumption of kerosene did increase byabout 7% a year between 1973 and 1982, but again not for cooking, al-though on that score, even at an unsubsidized price, it compares morefavorably with fuelwood than butane does (para 7.21). Simple kerosenestoves are now available in Niamey for 5000 CFAF (US$15). However, thesestoves are not well adapted to traditional Nigerien cooking, not beingstrong enough to heat large pots. More solid, multi-wick kerosene stovesdo exist elsewhere, for example, the Indian "Nutan" model, which has acalorific efficiency of about 36%. Because of its lower cost, greaterease of distribution and use, and the fact that it already is widely con-sumed for lighting, kerosene holds more promise as a fuelwood substitutethan does butane. Substituting kerosene for fuelwood would add only mar-ginally to the energy import bill. If, for example, 40% of the popula-tion in Maradi, Niamey, Tahoua, and Zinder in 1982 had cooked exclusivelywith kerosene on a stove such as the Nutan, the country's net energyimport bill would have increased only by an estimated 3%. 7/
Recommendation
3.5 Because of the severity of the fuelwood shortage and the needfor immediate substitutes, the mission recommends that kerosene be pro-moted as a cooking fuel. To this end, the design for a kerosene stovesuited to traditional cooking methods needs to be either acquired ordeveloped, and then imported or produced locally, for example, by thenewly created SONIEN (para 5.2). As a promotional measure, such a stovemight initially be sold at a subsidized price, depending on the resultsof the study of comparative energy prices recommended in para 7.22.
Projected Petroleum Product Consumption
3.6 Given the Government's emphasis on self-sufficiency in food andthe absence of any plans for a major development of industry, the futureconsumption of petroleum products in Niger will depend primarily on thedevelopment of uranium production, directly and through its linkageeffects on other sectors of the economy. At present, uranium productionis expected to resume its upward trend by 1985, with a third mine comingon stream in 1986. In addition, some independent growth of gas oil con-sumption for thermal power generation will occur, particularly in theisolated provincial centers and as a result of planned capacity additionsat Goudel in 1984 and 1986 (para 6.10). Accordingly, total petroleum
7/ Based on a per capita wood consumption of .75 m3/year, cooking on athree stone fire (8% efficiency); populations of 61.4, 351.45, 39.9,and 78.1 thousand people; and c.i.f. prices of 123.14, 117.78, 126.6and 123.14 CFAF/liter for Maradi, Niamey, Tahoua, and Zinder, re-spectively.

- 23 -
product consumption is projected to grow by 2.4% a year during the 1982-1985 period, and by 5.3% a year from 1985-1990 (Table 3.2). These pro-jections include substitution of kerosene to meet fuelwood for the cook-ing needs of 15% of the populations of Maradi, Niamey, Tahoua, and Zinderin 1985 and 40% of the populations of these cities in 1990, but do notallow for a planned 300,000 tpa cement plant whose economic justificationis doubtful at this stage.
Table 3.2: PETROLEUM PRODUCT CONSUMPTION, 1982-90('000 toe)
1982 Growth Rate, % p.a.(Provisional) 1985 1990 1982-85 1985-90
Gasoline 45.1 51.6 61.3 4.6 3.5Kerosene 5.0 8.5- 17.3 a! 19.3 15.3Gas/Diesel Oil 85.4 85.5 186.8 b/ 0.0 16.9Fuel Oil 3.5 3.8 4.5 2.8 3.5
Total 139.0 149.4 193.5 2.4 5.3
a/ Allows for substitution of kerosene for fuelwood in cooking by 15%of the population of Maradi, Niamey, Tahoua, and Zinder in 1985 and40% of the populations of these cities in 1990, assuming: (1) atotal population for these cities of 564,100 in 1983, with a growthrate of about 6.3% for 1983-1990; (2) a per capita wood consumptionof .75 m3/year, cooking on a three stone fire (8% efficiency); and(3) use of a kerosene stove with 36% efficiency.
b/ Of which 106,800 toe for power generation; allows for 10,000 toe forthe third uranium mine (SMTT) as from 1986.
Source: GPP and Bank staff estimates.
Petroleum Product Supply
3.7 The Ministry of Commerce and Transport (MCT) supervises the im-portation, distribution, and pricing of petroleum products. The para-statal company SONIDEP has the monopoly on importing all petroleum pro-ducts except for fuel oil and butane. SONIDEP buys in the internationalmarket, although state-to-state agreements involving purchases of crudeto be processed elsewhere have been known in the past. Since the commis-sioning in 1981 of the Kaduna refinery in northern Nigeria, increasingquantities of product imports have been supplied by that refinery; thebalance -- again mainly of Nigerian (Port Harcourt refinery) origin --continues to come in through the port of Cotonou in Benin. Cotonou sup-plies the western (Niamey) part of Niger, Kaduna/Kano the eastern part

- 24 -
(Maradi, Zinder), the dividing line between the two supply areas depend-ing on relative transport cost. Other possible sources of supply includeTogo (via the established supply route to Upper Volta) and Algeria. TheGovernment of Niger has set a requirement for stocks of petroleum pro-ducts equal to 72 days' worth of average consumption. The current stock-ing capacity amounts to 30 to 35 days' worth.
Recommendation
3.8 In spite of Niger's landlocked position, its supply of petro-leum products supply is assured by a number of possible sources. Themission therefore recommends that the Government lower the requirementfor stocks to cover 30 days' demand, rather than invest in expanding thestocking capacity and acquiring the extra supplies themselves.
3.9 SONIDEP supplies the network for distributing petroleum pro-ducts in Niger, which consists of Total, Shell, BP, Mobil and Texaco.These companies, which together form GPP (Groupment Professional duPetrole), themselves import most of the small amounts of fuel oil con-sumed (about 2,800 toe in 1981), while another private company, NIGERGAZ,imports and distributes the insignificant quantities of butane consumed(about 500 toe in 1981). The MCT authorizes other imports of petroleumproducts by private companies, but only to supply isolated areas or, inthe case of fuel oil, to directly meet the company's own needs.
Petroleum Exploration
3.10 The surface geology, geophysics, and drilling to date have de-monstrated the presence of various rift basins in Niger of differentsizes, depth, and sedimentary fill. The largest and deepest of all theserifts is the Agadem basin which extends over a length of 600 km in theeast of the country, with an overall width of nearly 300 km. A consider-able thickness of sediments, in excess of 6,000 m, has accumulated in thecentral part of the basin. There are several other rift basins, includ-ing the Bilma basin in the northeast, but they are smaller and shallowerthan the Agadem basin.
3.11 Exploration to date has focused on the Agadem basin in thesoutheast which offers possibilities for discovering hydrocarbons. TheSNEA/EXXON/TEXACO consortium now holds the Agadem permit (about 100,000km2) where two wells, Madama and Yogou 1 (drilled in 1975 and 1979/80respectively), gave oil flows. Test results of Yogou 1, however, sug-gested the presence of only small reserves - 1 to 2 million barrels, with300 to 600 bpd producible for a few years - too little to justify ap-praisal or development in such a remote area. Continued exploration bythe consortium led to a new find in the same basin in the Sokhor areatowards the end of 1982. By April 1983, three wells were drilled, one ofwhich was dry while the other two produced good quality oil (API 340).Present indications make it unlikely that this discovery would warrant an

- 25 -
export project. It may nevertheless be of great value in exploitationfor the domestic market. However, the extent of the reserves would needto be confirmed by drilling at least two appraisal wells. Also, an eco-nomic study will have to be carried out to determine the feasibility ofdeveloping this discovery. To examine possible refinery options, thestudy will have to evaluate the market for the domestic oil produced,particularly with respect to the use of fuel oil in power generation.
3.12 From what is known to date, Niger in general and the Agadembasin in particular offer possibilities for further discovery of oil re-serves and therefore more exploration is warranted. The Agadem permitexpires in early 1985 and it is possible that the present consortium(SNEA, EXXON, TEXACO) or some of its members may wish to renew the con-tract for at least another three years. Negotiations are under way withthe consortium, and the Government has indicated that the drilling oftwo, and possibly three, appraisal wells immediately on the Sokhor struc-ture would be a prerequisite to renewing the permit. To help the Govern-ment promote and accelerate exploration, an advance from a World BankProject Preparation Facility will finance:
(a) a technical/economic study of the feasibility of developing theSokhor discovery, including a brief review of the discovery;
(b) assistance to the Government in its current negotiations withthe oil industry;
(c) an evaluation of the technical assistance needs of the sector,including the need for and cost of providing experts, equip-ment, and training; and
(d) an evaluation of the need for and cost of an independent evalu-ation of the petroleum potential of Niger that would serve as abasis for developing an exploration promotion strategy.
Recommendations
3.13 In view of the high cost of imported petroleum products inNiamey, 8/ the mission supports the Government's urgent consideration of:
(a) the feasibility of appraising and producing the Sokhor find;
(b) the desirability of proceeding rapidly with such a project sothat the Government could avoid mobilization and demobilizationcosts of rig (US$10 million); and
8/ Equivalent in 1982 to US$54 per bbl, net of taxes and distributor'smargins.

- 26-
(c) determining a strategy for petroleum exploration and develop-ment.
3.14 The hydrocarbons and coal unit of the Directorate of Energy(DE) of the Ministry of Mines and Industry coordinates oil and gas explo-ration in Niger. Given the recent developments in the sector, it wouldbe to the advantage of this unit to obtain technical assistance to ensurethe successful outcome of its work. The exploration that already hasbeen carried out and probably will be carried out in the coming years byforeign companies requires that the information be properly acquired,understood, and stored by the Government. This information can then beused as a basis for making the independent evaluation of Niger's petro-leum potential referred to in para 3.12.
Recommendation
3.15 As mentioned above, a World Bank Project Preparation Facilitywill evaluate the technical assistance needs of the petroleum sector inNiger. A preliminary assessment indicates that to fulfill its role, theDE will require: (a) assistance for retrieval and storage of data, in-cluding new equipment; (b) collaboration of expatriate experts with staffof the hydrocarbons and coal unit on specific well-defined problems;(c) assistance in revising the petroleum law and agreements; and(d) training of Nigeriens in geology, geophysics, economics, and engin-eering, i.e. two technicians each year for a period of six months each.As shown in Annex 3.1, the total estimated cost of such a three or fouryear program comes to about US$1 million. The staff of the DE which willhave benefitted from this assistance would form the nucleus of a futurenational oil company, if such a company proves necessary. The cost ofthe program does not cover a general geological and geophysical evalu-ation of the basins which would still be necessary before 1985 to givethe Government the basic knowledge to develop its future strategies.

- 27 -
IV. COAL AND LIGNITE
Exploration and Reserves
4.1 There has been no systematic exploration for coal or lignite inNiger, as the known deposits were discovered while searching for uraniumand water. Coal and lignite exploration falls within the activities ofthe wholly Government-owned Office National des Recherces Minieres(ONAREM), which is supervised by the Ministry of Mines and Industry, butin practice ONAREM's work in this area has been very limited.
4.2 Coal deposits exist approximately 180 km south of the uraniummines near Anou-Araren, about 1,000 km northeast of Niamey. Measured andindicated reserves amount to 6.4 million tonnes, possible reserves 3.0million tonnes. The coal is sub-bituminous, with an average ash contentof 51% and a calorific value of 3,650 kcal/kg. The total reserves there-fore add up to 3.4 million toe. Coal also has been discovered recentlyin seams of five to eight meters thick near Solomi, about 30 km north ofAnou-Araren. Not enough information is available yet to estimate thesize of the resource, but based on the samples taken to date, it is ofmuch higher quality (7000 kcal/kg, ash content 14%) than the Anou-Ararencoal.
4.3 Numerous isolated lignite discoveries have been made in Niger(e.g. southeast of Tahoua, north of Zinder), but the most promising oneis located northwest of Tahoua, about 300 km northeast of Niamey, nearSalkadamma. A first evaluation based on limited data suggests probablereserves of 2.6 million tonnes of (average) 30% ash content and 4,000kcal/kg (one million toe). Additional exploration appears likely tolocate further reserves. Of the other lignite discoveries, the indica-tions near Filingue, about 200 km northeast of Niamey, particularlyappear to warrant systematic investigation.
Current Uses
4.4 The only current use of coal or lignite in Niger is the burningof the Anou-Araren coal to supply power to the nearby uranium mines. Therecently constructed 2 x 18.8 MW (gross) power plant can serve the needsof four uranium mines, the known coal reserves being sufficient tosupport at least a 30-year operation. The SONICHAR company, of which theGovernment owns about 68% of the capital, mines the coal, produces elec-tricity at the mine, and sells it wholesale to the power company NIGELECfor transmission and distribution to the uranium mining companies and tothe surrounding areas.

- 28 -
4.5 The Anou-Araren coal has substituted for the imported gas oilotherwise burned by the mining companies to generate their own electri-city. At the (estimated) 1982 level of SONICHAR's power generation, theimport savings amounted to about 26,000 toe, or about 20% of Niger'stotal petroleum product consumption in that year. These savings willincrease if and when uranium production resumes its upward movement. Un-fortunately, with the recent decline in both mining activities and realpetroleum prices, the very costly investment in SONICHAR's coal-firedpower plant has turned out to be uneconomic, though it appeared justifiedwhen the investment decision was taken. In terms of foreign exchange,SONICHAR's debt service is expected to roughly offset savings on the oilimport bill at least until 1990.
Prospective Uses
4.6 There are no uses for Anou-Araren coal in industry at thistime. The coal is not suitable for use in Niger's cement factory or forgenerating industrial process heat in general because of its excessiveash content and the high cost of transporting it to potential consumersin the south of the country. Although these transport costs might be re-duced by using the spare capacity of the 95% of the trucks returningempty from the uranium mines (para 7.5), the ash content would stillpresent a significant problem. For household cooking with this coal,there is an additional difficulty in that burning it releases noxious tarfumes, ruling out its use in closed rooms. Pre-coking would eliminatethe contaminating tar contents but also raise the coal's ignition tem-perature to more than 1000°C, seriously impairing its suitability as afuelwood substitute. Given the limited work done on the subject to date,further studies are needed to determine the feasibility of using Anou-Araren for household purposes.
4.7 In the absence of data on the quantity, quality and cost of de-veloping the Solomi coal, it is not yet possible to envisage its possibleuses. However, preliminary tests of briquetting and burning it in a spe-cial stove have shown positive results from a technical point of view.The Government of Niger has made a request to the Government of Japan fortechnical assistance in evaluating the workable deposits and defining thetechnology for preparing and using this coal, principally for residentialneeds. This project would cost about CFAF 450 million (US$1.3 million)and consist of two phases. Phase 1 would comprise drilling to determinethe boundaries of the deposit, analysis of the drill cores and techno-logical studies concerning the preparation and combustion of the coal.Depending on the results of Phase 1, Phase 2 would cover feasibilitystudies of exploiting this coal for local and regional uses and of a com-pacting plant to produce briquettes.
4.8 More information also is needed on the quality and quantity oflignite occurrences at Tahoua (Salkadamma) and near Filingue to determinetheir possible uses. A preliminary analysis of the Tahoua lignite

- 29 -
suggests that it is probably suitable for use in the cement industry as asubstitute for gas oil, and that it should also be suitable for powergeneration. A rough estimate of the Tahoua lignite mining costs (open-cast, soft overburden) works out at about CFAF 3,500/t (1982 prices),assuming the reserve potential is large enough. At a transport cost ofCFAF 27/tkm and a distance of 630 km, the cost in Niamey would be aboutCFAF 20,500/t of lignite, or CFAF 52,300/toe. Compared to the 1982 costof CFAF 143,410/toe of gas oil c.i.f. Niamey, Tahoua lignite would costonly about 40% as much. Because of differences in transport cost, thiscomparison would be even more favorable in terms of delivery at thecement factory of Malbaza, only 200 km away from the lignite deposits.Although the Tahoua lignite is of lower quality than the Solomi coal, thepossible use of Tahoua lignite for power generation should receive pri-ority attention because it lies close to the region where electricitydemand grows the fastest.
4.9 The Tahoua lignite also seems to be a promising substitute forfuelwood in that it has no detrimental tar contents, it ignites relative-ly easily and burns with a stable flame. The quantities required forpreparing meals have not been determined yet but, based on such tests ofAnou-Araren coal, may be assumed to be 4 kg of lignite and 0.4 kg woodchips for two meals per family a day. The probable resources of 2.6million tonnes of lignite thus could supply 200,000 families in SouthernNiger (corresponding to 20% of the total population of one million fami-lies) for a period of about eight years. Given the further advantage ofrelatively low transport costs, the Tahoua lignite could be supplied tofinal consumers in Niamey at an estimated cost of CFAF 25/kg 9/ and wouldbe very competitive with fuelwood (Table 7.3).
Recommendations
4.10 The mission recommends the following measures:
(a) with respect to lignite:
(i) an immediate, systematic exploration drilling program forfirming up the lignite reserves at Salkadamma/Tahoua and areconnaissance program in the Filingue-Salkadamma area, thelatter to be followed by an exploration program if ityields positive results. These programs are estimated tocost US$850,000, as shown in Annex 4.1;
(ii) combustion tests to determine the quantities of lignite(and kindling material as necessary) required for preparingtypical meals in Niger. These tests should be integratedwith the development of improved cooking stoves which, ifat all possible, also should be able to handle other
9/ 20.5/kg c.i.f. Niamey plus about 20% retail margin.

- 30 -
fuelwood substitutes (para 2.21). Combustion tests shouldalso be carried out to define the potential for using lig-nite in industry and power generation;
(iii) studies of the demand for lignite as a fuelwood substituteand in industry and power generation in order to provide areliable basis for estimating the mining cost, which woulddepend critically on the scale of mining operations to beenvisaged.
(b) with respect to coal:
(i) In evaluating the workable reserves of the Solomi coal anddefining the technology for preparing and using this re-source (para 4.7), ensuring that the costs of producing,transporting, preparing and utilizing the coal (e.g. thecost of producing stoves for residential use) are analyzedas a function of a study of the demand for this coal as asubstitute for fuelwood or for use in industry and generat-ing electricity.
4.11 The only organizations currently involved in the coal sectorare SONICHAR, which focuses exclusively on mining Anou-Araren coal forpower generation, and ONAREM, which has engaged to a very minor extent inexploration for lignite. As mentioned in para 3.14, the hydrocarbons andcoal section of the Directorate of Energy (DE) has been preoccupied withoil and gas exploration in Niger.
Recommendations
4.12 Given the work which needs to be carried out on lignite andcoal (para 4.10), a central unit needs to formulate and regularly updatea general strategy for exploration and development, and coordinate itsimplementation as well. To this end, the mission recommends strengthen-ing the DE's hydrocarbons and coal unit through the services of a visit-ing coal/lignite specialist. As described in Annex 4.2, such a special-ist would help the unit coordinate the activities recommended in para4.10 to determine the best possible uses of the coal and lignite, giventhe quantities found to be available and their quality. The specialist'sservices should extend over a period of three years and cost aboutUS$210,000. If the lignite exploration, combustion tests, and demandstudies indicate that it could be extensively used by industry or inhouseholds, a corporation should be set up to produce and commercializethe lignite. The same corporation should commercialize Solomi coal, ifthe proposed tests and studies show that its extensive use is economic-ally feasible.

- 31 -
V. RENEWABLE ENERGY
Solar Energy
5.1 Given its latitude and climate, Niger is a country very rich insolar energy, with an average of 3,200 hours of sunlight per year, theaverage daily duration of sunlight varying from 8.5 to 9.5 hours. Dataon solar insolation are limited, but average values of total (direct anddiffuse) radiation on a horizontal surface available for the south of thecountry range from 5.6 to 6.3 kWh/m2/day, i.e. 170 to 200 kgoe/m2/yr.Therefore, purely from a standpoint of resource availability, Niger candeploy a variety of solar thermal and solar photovoltaic devices to pro-duce thermal, mechanical, or electrical energy for a number of end uses.
5.2 A semi-autonomous state organization, ONERSOL (Office Nationalde l'Energie Solaire), was founded in 1965 to carry out applied researchin solar energy, including the study of existing and possible futuretypes of apparatus for using solar energy, and especially the developmentof its own prototypes of solar apparatus. In 1975, its charter was ex-panded to include the manufacture and marketing of solar equipment.ONERSOL comes under the control of the Ministry of Higher Education andScientific Research and its Board of Directors, chaired by the Ministerof Higher Education and Scientific Research, is composed of the ministersof seven other Nigerien ministries, the Director of the BDRN, the Direc-tor of INRAN, and the Secretary General of the National Workers Union.ONERSOL's research section has recently moved into a new building, whileretaining its old laboratory, machine shop, storage space, and equip-ment. The manufacturing and marketing section has been formed into aseparate company, SONIEN (Societe Nigerienne des Energies Nouvelles), asdiscussed below (para 5.25).
5.3 Seeking to establish an adequate solar data base, ONERSOL hasbeen taking solar insolation measurements at Niamey, Agadez, and Zindersince 1966. However, these measurements have not been adequately pro-cessed and stored. Furthermore, ONERSOL has not coordinated theseefforts with those of the national weather service, the MeteorologieNationale, which has received help from AGRHYMET, the Center for AppliedAgriculture and Hydrological Meteorology run by the WMO, in collectinginsolation and wind speed measurements throughout the country.
Recommendation
5.4 As the lead institution for solar energy, ONERSOL should pro-vide the necessary technical assistance to the Meteorologie Nationale toensure the quality of solar insolation data, and interpret and store theinformation which the meteorological service collects.

- 32 -
5.5 To date, ONERSOL's work has focused mainly on solar-thermalpumps, solar water heaters, solar furnaces, and solar cookers. Withrespect to photovoltaic panels, twenty-two of them at ten watts each areused to power television sets for schools in Niger, and there are plansto use panels to power small telecommunication stations, but ONERSOL'sown research on their application is for the moment limited to a cropdrying experiment. The limited current information suggests a signifi-cant need for small, low-lift pumping systems at sites along the RiverNiger and in locations with aquifers at shallow depths. Most of thesesites now being irrigated use diesel or gasoline driven pumps. ONERSOLhas not sought to apply photovoltaic cells to this type of irrigationpumping, but rather has concentrated on solar-thermal pumps and is nowworking on a 10-kW unit of the SOFRETES design at Karma, on the NigerRiver about 50 km north of Niamey. Although the absence of records onthe pumps makes it difficult to assess its performance, its cost is veryhigh (US$45,500/kW) and it requires continued and intensive mainten-ance. Two French engineers work at the site full time to keep the pumpworking. In general, such pumps are not cost-effective in various loca-tions in Africa where they have been installed. The cost of photovoltaiccells, US$9,000-11,000 per panel kW in 1982, excluding the "balance ofsystem" costs, is very high relative to that of diesel generators and, inparticular, prevents their immediate use in irrigating areas larger thanone hectare. However, some applications of the panels (e.g. livestockwatering, irrigation of one ha landholdings, educatLonal television) maybe competitlve today in certain locations. The cost of the panels isexpected to decrease enough by perhaps 1988Wto make them more cost com-petitive with diesel generating systems for other applications, in par-ticular, for irrigating some of the sites mentioned above which requiresmall, low-lift pumping systems.
Recommendation
5.6 The mission recommends initiation of a research program tostudy the technical and economic feasibility of mini-photovoltaic systemsfor lighting, refrigeration and small scale pumping in isolated centers.
5.7 ONERSOL's largest research and development effort has been inthe design, fabrication, and testing of a solar water heating system.The smallest size system has a 200 liter storage tank and 2 m2 of flatplate collector area. The system has no pump. Instead, water circula-tion is brought about through thermosiphoning. The stated peak effici-ency is 60%, but one would expect the actual daily average efficiency tobe much lower. The water heaters are manufactured, mostly from importedmaterials, at ONERSOL's factory in Niamey (400 units p.a. capacity).Currently 550 of these systems are installed in Niamey, and this appli-ance has accounted for most of ONERSOL's sales. Unfortunately, a market-ing study which concluded that 300 of these systems a year could be soldin Niger proved overly optimistic. Given the relatively high cost of thewater heaters (about US$535 for the 200 liter system) for the averageNigerien family, only the most affluent families and Government minis-tries (by a 1975 law) have had them installed. Sales have declined from

- 33 -
a peak of 80 units in 1980/81 to 60 in 1981/82. The domestic marketappears to be nearly saturated, even though the systems are already soldat a loss, production costs adding up to about US$570. There is a poten-tial foreign market in the larger West African cities, but transportcosts would probably significantly reduce the appliance's marketabilitythere.
5.8 Industrial uses for the solar water heaters have not been tho-roughly explored. Based on preliminary data on energy consumption inNigerien industry, and assuming a 20% solar penetration of the potentialmarket, an estimated 340 toe of petroleum products (mainly gas oil) couldbe replaced by solar energy each year, specifically in the textile andbrewing industries. This comes to 20% of industry's estimated directconsumption of gas oil in 1981.
Recommendations
5.9 The mission recommends:
(a) evaluating the potential for solar water heating in industry;and
(b) depending upon the results of this evaluation, installingexisting solar water heaters at a brewery in Niamey as a pilotdemonstration project to show the applicability of solar waterheating to that industry. Such a project would cost aboutUS$25,000 and require one and a half years, including con-struction time and a period of testing and evaluation.
5.10 ONERSOL also has been working on a solar furnace consisting oftwo heliostats, a 100 m2 parabolic reflector, and a central structure tohouse the oven cavity. Construction has been halted because of ashortage of funds. The furnace is designed to displace petroleum prod-ucts in the brick and cement industries. A solar furnace could reach thenecessary temperatures, but the estimated capital cost of the system(US$150,000 for 35 kW peak energy) is too high to justify its use atpresent.
5.11 ONERSOL has experimented with a solar cooker as an alternativeto wood-burning stoves. The cooker consists of a parabolic reflectingdish 1.5 meters in diameter, made of an aluminium reflector glued to afiberglass and epoxy backing. At the focal point of the reflector standsa platform on which to place the pot. This solar dish sells for about25,000 CFAF (US$75) but has few takers so far. The price is too high formost Nigeriens, and the design is not adapted to traditional Nigeriencooking.
Recommendation
5.12 The mission recommends that ONERSOL discontinue work on thesolar furnace and critically review its program on solar cookers. If

- 34 -
cost effective solar cookers which are suited to Nigerien cooking needscannot be developed, the program should be discontinued.
Biomass Other Than Wood
5.13 In 1979/80, Niger produced an estimated theoretical maximumenergy potential of 1.32 million toe in crop residues, but given compet-ing uses, (animal fodder, construction materials, fertilizer) only about2% (32,300 toe) were available for energy uses (Annex 5.1). The esti-mated theoretical maximum energy potential for animal waste in 1979/80was 900,000 toe, which reduces to 400,000 toe when animals in roamingherds are excluded (Annex 5.2). As in the case of crop residues, prob-ably only a small fraction of even this figure can be used for energyconversion because of technical, economic and social constraints.
Groundnut Shell Briquettes
5.14 Other than the unknown amounts of crop residues and dung burnedfor cooking in areas of severe fuelwood shortages, the largest quantityof biomass energy produced and consumed in 1980 and 1981 was in the formof groundnut shell briquettes. At a cost of 26,100 CFAF/tonne in 1981/82(Annex 5.3) and a calorific value of 4,500 kcal/kg, these briquettesappear attractive as a substitute for gas oil and fuelwood. In 1980/81,SONARA, which has a monopoly on the commercialization of Niger's ground-nut crop, produced 336 tonnes of briquettes in its two press compactionplant (5,000 tpa capacity) in Dosso. SONARA can only attract 1% to 2%(1,200 to 2,400 tonnes) of the total groundnut crop, which currentlyamounts to about 120,000 tpa. The total crop would give about 39,000tonnes of briquettes (17,000 toe). Farmers obviously find it more pro-fitable to dispose of the groundnuts themselves, including exporting themto Nigeria.
5.15 To date, the SONICERAM brick factory and the SICONIGER ground-nut oil refinery have been the only industrial clients for SONARA's bri-quettes. The 1980/81 cost of briquettes c.i.f. Niamey in calorific termsamounted to about 40% of that of gas oil - CFAF 59,200/toe vs. CFAF14 3,4 00/toe. This cost would certainly be even more attractive at fullcapacity utilization of SONARA's plant. Since then, the brick factoryhas acquired a new unit which runs on fuel, so it no longer uses the bri-quettes. Despite its efforts, SONARA has great difficulty in convincingindustrial enterprises to substitute these briquettes for gas oil, large-ly because these enterprises question the reliability of supply of thebriquettes.
5.16 Given the limited success it has had with industrial enter-prises, SONARA now is concentrating on use of the briquettes as a cookingfuel. Assuming that all the groundnut shells of the 1980/81 crop hadbeen compacted into briquettes, the 17,000 toe thus available would haverepresented only 2% of the total national consumption of fuelwood in
- 35 -
1981. However, these 17,000 toe would have represented 35% of the 1981fuelwood consumption in Niamey. Groundnut shells thus could alleviatethe fuelwood shortage where it is the most serious. An improved stovewith a chimney needs to be designed to eliminate the smoke the briquettesgive off when burned in a three-stone fire, and thereby make this cookingoption more attractive to households.
Recommendations
5.17 The mission recommends a study to define a specific actionprogram to promote the use of groundnut shell briquettes for residentialneeds. This study should be carried out jointly with the development ofan improved stove which is suitable for both these briquettes and wood.It would be particularly appropriate to examine the possibility of burn-ing the briquettes in a stove model adapted from the "Ouaga stove" dis-cussed in para 2.21.
Other Crop Residues and Animal Wastes
5.18 Other crop residues and animal wastes presently are used asenergy only for cooking in areas of severe fuelwood shortages, but thereis an effort being made to convert them to biogas. Two approaches arebeing pursued: fermentation of crop residues and manure on farms, andfermentation of animal waste at slaughterhouses.
5.19 INRAN (Institut National de la Recherche Agronomique au Niger),together with the French agronomy institute within GERDAT, is carryingout an experimental project at Lossa to produce biogas from crop residuesand oxen manure. The methane runs a modified diesel engine to pump waterfor irrigation and to grind millet into flour. To properly assess theeconomic viability of such biogas installations, data on cost in generaland operation and maintenance in particular need to be studied in greaterdetail.
5.20 Producing biogas at a slaughterhouse is potentially more econo-mic than on farms because there is more substrate concentrated in onelocation and also because the slaughterhouse itself presents numerous im-mediate uses for the energy derived. GERDAT is already pursuing a biogasproject at the Niamey slaughterhouse, where a pilot mini-digester is nowoperating. The operation should be working full scale next year, withthe methane replacing diesel fuel for steam raising and the sludge beingused for fertilizer in Niamey gardens. Biogas from slaughterhouses canalso be used to generate electricity in areas not hooked up to a powergrid, with the sludge used either for fertilizer or as a substrate foranimal feed.
Recommendations
5.21 Ongoing experimentation with bio-digesters should be continued,with the emphasis on cost-effectiveness and replicability on a practical

- 36 -
scale. In particular, biogas projects in other slaughterhouses should beconsidered, building on GERDAT's experience in Niamey.
Wind, Small Hydro
5.22 Niger's wind resource is very poor, maximum speeds reachingonly 3.9 m/s, at Tahoua. Even this speed is only marginally suitable forwater pumping and completely inadeaquate for pumping electricity. Al-though no accurate figures on small hydro availability are obtainable,this resource also seems to have only a limited potential. A few sitesare being studied for small dams for irrigation purposes, but these prob-ably cannot supply electricity as well. Therefore, additional researchinto either wind or small hydro is not a priority at this time.
The Organizational Framework for Renewable Energy Activities
5.23 The multiplicity of government, private, and international or-ganizations working on renewable energy results in a lack of planningwhich, along with a lack of economic analysis and market studies, consti-tutes the main weaknesses of renewable energy activities in Niger. Withrespect to groundnut shell briquettes, the Ministry of Planning, theMinistry of Commerce and Transport, and the Ministry of Hydraulics and ofthe Environment address the question of boosting production of thegroundnuts themselves, while SONARA deals with the production andmarketing of the briquettes. With respect to biogas, in addition to thework of INRAN, GERDAT, and the Niamey slaughterhouse, ONERSOL is planninga small project similar to INRAN/CERDAT's to be carried out by theUniversity of Niamey.
Recommendations
5.24. (a) The mission supports the proposal made by the Directorate ofEnergy to the Ministry of Higher Education and Scientific Re-search, the supervising ministry of ONERSOL, that ONERSOL ex-pand the scope of its work and act as the focal point for allefforts related to renewable energy in Niger. ONERSOL shouldtake the lead in formulating an overall strategy for developingNiger's renewable energy resources and coordinate the activi-ties of the agencies already involved in this work. To faci-litate this coordination, ONERSOL's Board of Directors shouldbe drawn from these agencies and, given the MMI's supervisoryrole with respect to major energy sector organizations,ONERSOL's Director should report directly to this Ministryrather than to the Ministry of Higher Education and ScientificResearch.

- 37 -
(b) ONERSOL should seek primarily to adapt known technologies whosecommercial value has been proven in other countries and/orwhich are likely to be cost effective in Niger. For example,it should carry out the research program proposed in para. 5.6,to study the technical and economic feasibility of using inisolated centers photovoltaic mini-systems already available onthe international market. Given the seriousness of the fuel-wood shortage, ONERSOL laboratories should also support the de-velopment of improved wood and appropriate kerosene stoves(para 2.21) and assist the consultants in their comprehensivestudy of the comparative prices of energy for cooking (para7.24). Once ONERSOL's exact role has been determined by theGovernment, it will be necessary to define technical assistancein terms of training and equipment required by ONERSOL tomanage its work program. Particular attention should be paidto the lack of overall planning, engineering, economic analysisand market study capabilities in ONERSOL.
5.25 As mentioned above (para 5.2), ONERSOL's manufacturing and mar-keting division has been separated from its research division to formSONIEN. The Government currently holds most of SONIEN's capital, butenvisions gradually opening it up to the private sector. The Center forIndustrial Development (CDI) in Belgium has been asked for assistance tocarry out a complete feasibility study of SONIEN. Specifically, thestudy will address SONIEN's potential product line, market prospects,financial viability, etc. CDI would solicit the participation of com-panies which are interested in the venture and which would also parti-cipate in the feasibility study. An agreement is to be establishedbetween ONERSOL and SONIEN under which ONERSOL could propose prototypesto SONIEN, and the latter could ask ONERSOL for specific studies.
Recommendation
5.26 The mission supports the formation of SONIEN and believes fullconsideration should be given to its producing a wide variety of energyrelated apparatus. Furthermore, the mission supports private participa-tion in SONIEN and recommends that it be turned into a strictly privatesector operation.

- 38 -
VI. ELECTRIC POWER SUBSECTOR DEVELOPMENT
6.1 This chapter concentrates on the past and projected growth ofelectricity demand and the associated development of the public supplysystem. Conservation and pricing issues are discussed in Chapter VII.
Growth of Demand
6.2 Spurred by the uranium boom, gross electricity consumption 10/in Niger more than tripled over the 1974-1982 period, to 183 GWh forNIGELEC's public supply system alone, and 256 GWh in all (Table 6.1,Annex 6.1). The most rapid growth occurred from 1977-80 when publicsystem consumption increased by 26% p.a. and that of the uranium mines by36% p.a. Reflecting the subsequent decline in uranium mining activities,demand growth has decelerated since then and become negative for themines themselves. Even so, consumption by the public system grew by 11%p.a. during 1980-82 and by 8% in 1982 over the previous year. WhileNiamey continues to account for the bulk of public system consumption --70% in 1981 -- the provincial centers have been catching up fast, nearlysextupling their consumption since 1974 to a share of 30% in the 1981total. Reflecting the rapid growth of air conditioning, particularly ofgovernment office buildings, power demand in Niamey grew more rapidlythan energy demand, which is reflected in the drop in load factor fromroughly 51% to 46% between 1975 and 1980. In 1982, peak demand in Niameyhad reached 36 MW, i.e. more than three times the peak registered in 1974(11.2 MW), and somewhat higher than the sum of all peak demands of thepublic systems in 1981 (34.4 MW).
6.3 The pattern of electricity consumption by the public system re-mained unchanged between medium voltage (MV) and low voltage (LV) con-sumption (Annex 6.2): MV accounted for 55% of the total in both 1974 and1981, and LV for the remaining 45%. However, in the MV category, theshare of public administration rose to 33% from 29% in 1978 while that ofprivate consumers declined. This trend will probably reverse itself oncethe public construction boom has run its course and the level of economicactivity increases again. In the LV category, the near doubling of con-sumption between 1978 and 1981 by the special tariff category, i.e. smallconsumers, points to the potential for further demand growth as powersupply becomes more widely available, particularly outside Niamey.
10/ This is actually gross electricity supply, i,e. generation pluspurchases by NICELEC, used here as a proxy for electricity sales toconsumers, statistics for which are deficient.

- 39 -
Table 6.1: GROSS ELECTRICITY DEMAND, 1974-1982 a/
(GWh)
Growth Rates, % p.a.1974 1977 1980 1981 1982 1974-77 1977-80 1980-82
Niamey 50.8 64.3 107.9 118.3 n/a 8.2 18.8 n/a
Other Centers 8.5 21.1 41.7 50.6 n/a 35.4 25.5 n/a
NlGELEC Public
System 59.3 85.4 149.6 168.9 183.2 12.9 20.5 10.7
Uranium Mines 18.8 38.4 95.7 87.0 b/ 73.0 d 26.8 35.5 -12.7
Total 78.1 123.8 245.3 255.9 256.2 16.6 25.6 2.2
a/ Actually, gross electricity supply, i.e. generation plus purchases by
NIGELEC, plus autogeneration by the uranium mining companies (until
1981). Used here as proxy for electricity sales to consumers.
b/ 42 GWh supplied by NIGELEC plus an estimated 45 GWh of autogeneration.
c/ Preliminary
d/ NIGELEC supplies only. Remaining autogeneration insignificant.
Source: NIGELEC, Mining Companies.
Demand Projections
6.4 Of the several power demand projections made for Niger in
recent years, particularly in the context of feasibility studies of the
Kandadji hydro project, the mission has retained those underlying the
1982 tariff study prepared for the Ministry of Public Works (Table
6.2). While these projections are fairly summary, they provide a rough
estimate of the magnitude of load growth and its structural change up to
1990. The 1980-90 growth rate projected for the public system as a whole
is similar to that observed over the 1970-80 period, about 14% p.a.
Given the very low level of electricity consumption in Niger at present,
continued high growth rates seem reasonable. Demand in other centers as
a group is projected to grow faster (16.6%) than in Niamey (12.4%) but
more slowly than in the previous decade, at the beginning of which supply
outside Niamey amounted to just 5 GWh in all. Energy demand by the
uranium mines will level off, once the two additional mines planned for
development between 1985-1990 have come on stream. As a result of these
projected trends, the mines' share in total electricity consumption would
drop from 39% in 1980 to 22% in 1990. Niamey, on the other hand, would
increase its share from 44% to 50%, and that of other centers would grow
the fastest, from 17% in 1980 to nearly 28% in 1990.

- 40 -
Table 6.2: PROJECTIONS OF GROSS ELECTRICITY CONSUMPTION, 1980-1990(GWh)
Growth Rates, % p.a.1980 1985 1990 1980-90 1970-80
Niamey 107.9 210 350 12.5 12.4Other Centers 41.7 92 193 16.6 22.9NIGELEC Public
System 149.6 302 543 13.8 14.5Uranium Mines 95.7 151 157 5.1
Total 245.3 453 700 11.1 33.6
Source: Ministere des Travaux Publics et de l'Urbanisme, Etude de laTarification de l'Electricite au Niger, Ingenieurburo Oskar vonMiller GmbH, December 1982.
6.5 More detailed and longer range power demand projections areneeded to define a long term power sector investment program. Theyshould include the relevant price and income elasticities of electricitydemand and probabilistic assumptions on alternative growth scenarios.The power system development study mentioned above will develop suchprojections to 1990 for the secondary load center -- existing and newones -- and to the year 2020 for the Niger Valley interconnected system.
Electricity Supply
6.6 Public electricity supply is now concentrated in the NigerValley system linking Niamey, Dosso and Tillabery, and for the rest, isscattered over about a dozen provincial towns along the Nigerian borderand the towns of Agadez and Arlit in the North. Based on 5.5 persons perhousehold, it is estimated that in 1980 31% of the population of Niameyhad access to electricity. For the other major urban centers of Zinderand Maradi, about 31% and 24% of the population is served, respective-ly. On a national basis, only 3.3% of the population has access to elec-tricity; this is one of the lowest percentages in the world.
6.7 As of September 1982, the serviceable generating capacity ofNIGELEC totalled 49 MW. The largest station is Niamey II, comprisingfour diesel units of 3 MW and two 12-MW gas turbines, for a total instal-lation of 36 MW. The remaining 13 MW is made up by 54 high-speed dieselunits distributed over various provincial towns and ranging from 25 to1100 kW capacity.

- 41 -
6.8 Actually, most of the load of the Niamey-Dosso-Tillabery systemis supplied from the Nigerian interconnection over a single circuit 132kV line. Because the interconnection supplies non-firm power, it isNICELEC's policy to maintain sufficient capacity to meet the peak inNiamey with zero reserve in case of a line outage. The rapid load growthin recent years combined with financial constraints have caused occa-sional capacity deficits. As the peak in Niamey in May 1982 was 36 MW ata time when the installed capacity was 24 MW, a line outage would haveseriously disrupted service.
6.9 As a source of fuel displacement energy, the NEPA interconnec-tion is operating satisfactorily, as evidenced by the low proportion ofthe Niamey load supplied by local generation (1978-29%, 1979-11%, 1980-2.2%, 1981-5.0%). However, the need for back-up capacity or reinforce-ment of the interconnection is clear from the nature of some recentinterruptions:
1982 - one week total outage because of NEPA strike;
1981 - three week outage because of faulty circuit breaker atBirnin Kebbi; and
1979 - four week outage because four towers in Nigeria weretoppled in a storm; damage was repaired with NIGELECassistance.
NIGELEC has installed protective equipment to operate the Niamey II gen-erating plant and the interconnection in parallel, if required.
6.10 Niamey City is supplied from the Niamey II substation (8 feed-ers, 15 kV) and the Goudel substation on the northwest, which is also thesite of a planned new power station (4 feeders, 20 kV). NIGELEC has de-cided to standardize on a 20-kV primary distribution voltage, which willrequire the installation of a number of 15/20 kV autotransformers in thecity. Connection charges are relatively high. Prospective customers payall these charges, which in early 1980 ranged from FCFA 65,000 ($315) fora single phase 6 kW connection to FCFA 200,000 ($965) for a three-phase10 kW connection. In 1982 connections of less than 1 kW to low-incomecustomers cost FCFA 30,000 (US$110). However, for small consumers, one-third of these charges are due in the form of a down payment, with theother two-thirds payable in installments over five years. Demand there-fore tends to be restrained not so much by high connection charges, butrather by the Lack of distribution networks.
6.11 Among other load centers many small diesel units are movedaround as required, with the aim of gradually rationalizing the supply bystandardizing unit sizes, stocks of spare parts, and optimizing fuelconsumption. After the addition of the planned two 1,100 kW units,Malbaza probably will become the central supply of a future Konni-Madoua-Tahoua (KMT)-Malbaza subsystem.

- 42 -
6.12 The reliability of supply appears to be fair except where somelocalized distribution problem exists. The problems in the distributionsystem can be judged from sales statistics and apparent loss percentages,with particular reference to 1979 and 1980. One would expect most prob-lems in the smaller isolated load centers, but the contrary appears to bethe case (see Annex 6.3). Many of the smaller centers report losses of6-15%, a quite plausible range, whereas in the larger centers they go upto 25-30% (Zinder) and 20-30% (Maradi), 20-34% (Agadez) and 10-22%(Niamey). In Niamey, reported sales in 1979 were about the same as in1978, while generation plus purchases increased by 14.3%. Such highapparent losses point to inadequate billing and power theft. Long delaysin reporting and compiling data are probably also responsible for errorsgoing undetected. A survey of connections (for both water and power) hasjust been completed under the 1983 IDA Water Supply Credit and shouldshed some light on the problem.
6.13 In the mining district, the loads of the mines and the adjacentmining towns of Arlit and Akokan were s-upplied until 1981 by captivepower plants of SOMAIR (7.2 MW) and COMINAK (13.5 MW). To replace im-ported gas oil by the nearby Anou-Araren coal, the Societe Nigerienne deCharbon (SONICHAR) built a coal-fired steam plant of 2 x 16 MW (net)capacity which has taken over the supply of the mining district sincethen. This plant is also designed to supply the needs of two additionalmines originally planned to come on stream by 1985, but because of thecurrent slump in the world uranium market, at least one of the mines hasbeen deferred until later. As a result, only half of SONICHAR's capacityis actually used since there is no alternative use for the power, thecost of a transmission line to the Niger Valley system being prohibi-tive. In any event, the supply of energy to the mining district appearsto be assured for many years to come.
Supply: Options for Expansion
Hydro Resources
6.14 The Niger River traverses the western-most part of the country,entering Niger from Mali, flowing southeast for 420 km, and then formingthe border with Benin for another 140 km before reaching Nigeria. It isNiger's only major water resource, and the flat gradient and the topo-graphy of the Niger Valley limit the possibilities for hydroelectric de-velopment. Two sites have been identified: (1) Kandadji (125 MW),located at the river's entrance to Niger, about 200 km upstream fromNiamey; and (2) W (105 MW), about 120 km downstream from Niamey. 11/ Athird site, Dyodyonga (26 MW), is of interest; it is located on the
11/ W is so named because of the shape of the river's meanders at thatlocation.

- 43 -
international stretch of a tributary to the Niger River, the MekrouRiver. Table 6.3 summarizes the technical characteristics and costs ofthese projects.
Table 6.3: HYDRO RESOURCES
Kandadji KandadjiStage I Stage 11 W a
Dam Crest 228 Dam Crest 241 Variant 4 Variant 5 Dyodyonga a/
Installed capacity (MW) 125 105 84 105 26Average energy capability
(GWh/yr) b/ 707 751 465 551 82
Costs (billion CFAF) c/
dam and plant d/ 89.0 72.2 62.0 69.8 11.4
transmission and
substation 10.8 9.4 6.7 7.2 3.3resettlement e/ 22.2 41.1 10.5 10.5 -
Total 122.0 122.7 79.2 87.5 14.7
(Total $US million) (420.7) (423.1) (273.1) (301.7) (50.7)
Investment cost per GWh of
average annual energy
(US$ thousand) 595 563 587 548 618
a/ Reference datum is Kandadji datum plus 36.07 m.
b/ Delivered at Niamey, after deduction of transmission Josses.
c/ Constant CFAF of January 1, 1982.d/ For W, excludes shipping lock, includes access raod to site.
e/ For Kandadji Stage 11, includes CFAF 22 billion in Mali.
Source: For Kandadji, Kandadji Dam. Complementary Studies. Sofrelec, EDF, Sir Alexander
Gibb and Partners, March 1982.
For W, Kandadji Dam. Extension of Complementary Studies, Sir Alexander Gibb andPartners, September 1982.
For Dyodyonga, World Bank data and estimates.
Kandadji Stage II would entail flooding in Mali, while the Dyodyonga siteis on the border with Benin. Assuming, for illustrative purposes, thatall of the additional energy produced by Kandadji Stage II would go toMali and that one half of the energy produced by Dyodyonga would be usedby Benin, the total energy capabilit p of these resources available toNiger would amount to about 1,300 GWh (345,000 toe) for an averagehydrological year.

- 44 -
Power Planning
6.15 Because the existing interconnection with Nigeria will be fullyutilized for capacity imports by 1984 and for energy imports by 1992,power supply planning for the Niger Valley is the dominant issue in thepower sector. The supply problems of the remaining load centers are notcomplex, but nevertheless deserve careful consideration because it is theisolated centers that will require increasing quantities of imported gasoil.
6.16 NIGELEC's short-term planning for supply to the Niger Valley(until about 1989) is based on the maintenance of sufficient thermalcapacity in Niamey to cover the peak, while taking maximum advantage ofthe interconnection contract with Nigeria to import energy and save fuelexpenses. The price of imported energy for the next five years is aboutto be substantially increased but is still attractive to Niger. NIGELEChas requested an increase of the contract limit from 30 MW to 40 MW (i.e.close to line transfer capacity) and actually already has receiveddeliveries of up to 36 MW (1982). Belgian financing has been secured forthe 66-kV transmission line Niamey-Say-Kollo (to be completed in 1984).
6.17 CCCE has agreed to finance a new power station at Goudelcomprising three 12-MW medium speed diesel units, of which two unitswould be installed in 1985, at an estimated cost of US$19.2 million (in1982 dollars). Because of the standby function of the plant, a casecould be made for cheaper gas turbines, but NIGELEC has opted for dieselunits in anticipation of the need for complementary thermal power once ahydro plant on the Niger River is in operation.
6.18 The short-term strategy of NIGELEC appears sound. For sometime, the longer-term planning has been oriented by the desire of theGovernment to build the Kandadji Project. The underlying reasons forthis preference appear to be much more closely related to security ofwater supply, irrigation and food production than to energy supply. TheKandadji Project (either first stage or non-raisable) is indeed the onlymulti-purpose project in Niger. It would permit control of the NigerRiver, thus facilitating irrigation; it would indeed provide a measure ofsecurity of water supply (basically protection against a repetition ofthe extreme drought of 1974); and it would also be a source of electricpower. However, it does not follow from the eventual multi-purpose uti-lization of the project that it is the most economical. If security ofwater supply and electrical energy supply were obtainable by different,separate means, at a lower total cost, the scarce resources saved couldbe employed more profitably elsewhere in the economy. It is thereforeessential to examine the hydro alternatives listed in Table 6.3 first byupgrading the project studies to feasibility level, and second by con-sidering the resources in a system context.
6.19 The role of the existing and future interconnection withNigeria is a prime consideration in any power planning scenario. Thelong run marginal cost of energy from NEPA is estimated to be about

- 45 -
US$0.05/kWh. After allowing for only partial utilization of additionaltransmission until the load in Niamey has grown sufficiently, thelevelized cost of secondary (non-firm) energy from NEPA delivered atNiamey may rise to US$0.09/kWh. Diesel-generated energy costs about$0.15/kWh, of which $0.117/kWh is fuel expense. The levelized cost ofenergy from Kandadji (non-raisable), or W would be $0.10-0.11/kWh ifeither project were commissioned in 1990. Because most of the hydrooutput of the Niger plants is secondary energy, the economic advantage ofthe interconnection with Nigeria is obvious. Energy from Dyodyonga wouldcost about $0.09/kWh, but because of good regulation most of the plantoutput is primary energy and, therefore, probably competitive with boththermal power and imports.
6.20 Power planning may have to take into account the desire ofgovenments to maintain a degree of energy independence. In the case ofNiger such independence, in the sense of having a firm domestic supply,is difficult to achieve. At present the country relies heavily on im-ports of both electrical energy and petroleum fuels. The construction ofa large hydro plant on the Niger River will make little difference tothis dependence, because these run-of-river projects would require back-up by either complementary thermal (using imported fuel oil) or importsof firm energy during four months of the year.
6.21 Despite these qualifications, all available options ought to beexamined in devising a least cost program of development. In broadterms, the practical expansion possibilities for the Niger Valley Systemmay be grouped under the following headings:
(a) Continuation of the non-firm imports from Nigeria only up tothe physical transfer capacity (41 MW) of the existing inter-connection, accompanied by the addition of thermal capacity,first for peaking service and eventually to supply most of thegrowth in energy demand.
(b) Continuation of the present strategy, i.e. increasing thetransmission capacity from Nigeria for non-firm energy supply,while building up thermal back-up capacity in Niamey.
(c) Development of hydro power in Niger (either Low Kandadji orW). The small storage capacity of Kandadji makes little dif-ference to the output in the dry months. Both Kandadji and Wwill have a seasonal energy production pattern similar to thatof the river flow and contribute little to the supply of pri-mary energy. The large supply of secondary energy could befirmed up by complementary thermal power, by firm imports fromNigeria or by electrical integration of the run-of-river Nigerplants with the Dyodyonga storage project. Combinations, alsoare possible, for example, complementary thermal power inNiamey with seasonal non-firm energy imports from Nigeria tolimit fuel expenses.

- 46 -
6.22 The supply of secondary load centers would follow a commonpattern. Clusters of small towns and villages should gradually be con-nected by transmission lines and serviced from one efficient dieselplant. The least costly solution may be connection by 20 kV lines (as atKonni-Malbaza-Madoua) but from a longer term perspective it may be pre-ferable to build 66 kV lines initially operated at 20 kV, with sub-stations of 1,000-2,000 kVA.
6.23 The KMT-Malbaza subsystem could be easily connected with theNEPA system at Sokoto and operated in the same manner as the presentNiamey system, i.e. maintaining a local plant as standby and importing amaximum of fuel displacement energy. NICELEC has programmed the inter-connection for 1985-86. The capital cost of a 132 kV single-circuit lineof 107 km, including terminals, is around US$10 million.
6.24 A power system development study, recently begun under an IDAPower Credit, will examine the various options and their possible combi-nations with a view to evolving a comprehensive power sector investmentprogram to 2020 for the Niger Valley and to 1990 for the secondary cen-ters.
Organization of the Power Subsector
6.25 The production, transmission, distribution, and sale of elec-trical energy in Niger is a state monopoly that can be entrusted to acompany by concession or other suitable means (Ordonnance 74-31,November 15, 1974). The Societe Nigerienne d'Electricite (NIGELEC),which is responsible for supplying electricity to urban centers, is theonly company holding such concessions. However, the State plays a dualrole in this concessionary system: that of the authority supervising themanagement of the electricity concession and, since it owns about 90% ofNIGELEC's capital, that of the agency being supervised. The former comesunder the jurisdiction of the Ministry of Public Works and Urbanism (MPW)and the latter under that of the MMI. As the act of conceding publicdomain to an enterprise operating under a private corporate structurebelongs to the Ministry of Public Works, the MPW exercises overall con-trol over NIGELEC. It is therefore responsible for standardization,regulation of construction, safety standards, and control of the conces-sions. In addition, the MPW carries out electrification of new loadcenters which it then turns over to NIGELEC for operation and upkeep.For its part, the MMI acts for the State as majority shareholder inNIGELEC and as such reviews: (a) NIGELEC'S financial operations; (b) theinvestment plans for meeting demand growth in the concessions NIGELECalready holds, before such plans are forwarded to the Ministry of Plan-ning; and (c), together with the Ministries of Planning and Commerce,tariff proposals prepared by NIGELEC before these are submitted to theGovernment for approval. The Minister of Mines and Industry himself actsas chairman of the board of NIGELEC, and as a majority shareholder theState appoints ten of NIGELEC'S thirteen directors.
- 47 -
6.26 According to the 1974 Ordonnance, the State reserves the rightto create other agencies for producing electricity. SONICHAR (para 4.4)is an example; it generates power while the transmission and distributionof that power remain part of NIGELEC's concession. Another example, andthe third institution involved in the power subsector, is the KandadjiDam Authority (KDA), an agency of ministerial rank reporting directly tothe President of the Republic which aims to harness the Niger River byconstructing the Kandadji dam. To achieve this, KDA is charged withseeking financing, the conception and implementation of all the damconstruction works as weLl as the rebuilding of infrastructure and theresettlement of the people concerned. KDA is also charged with theoperation and maintenance of the works within its jurisdiction and withall financial operations pertaining to its objective.
6.27 The fact that the State controls NIGELEC, a utility with aprivate corporate structure, raises questions as to the usefulness of theconcession system as applied in Niger, since the system's basic aim, theattraction of private investment capital to the public utility sector, nolonger applies. The practical advantage of having a private corporatestructure does remain, as it ensures a degree of independence that wouldnot exist if the State-owned company were relegated to the roLe of a Gov-ernment department. Such autonomy has usually helped utilities attractcompetent staff, set realistic rates, and maintain a sound financialstanding. In this case, however, the State's role of supervisor andmajority shareholder may impair NICELEC's autonomy and obscure its rela-tions with various Government organisms.
6.28 NIGELEC also operates water supply systems in a number of loadcenters as a managing agent of the State. Since NIGELEC's power sub-sector activities have been, in effect, increasingly subsidizing watersupply, these two operations need to be separated, with NIGELEC focussingon power and another agency responsible for water supply. The recentlyapproved IDA water supply project (Credit 1309-NIR) is examining theproblem in detail, and provides for first strengthening NICELEC's WaterDepartment and then converting it into a separate water authority. Coop-eration between the two subsectors and a pooling of resources in smallerurban centers could continue, but in Niamey and other larger cities acomplete separation of operations would seem to be the only way to re-solve the financial problems.
6.29 Under the current institutional setup, no agency has taken re-sponsibility for overall, long-term power planning. NICELEC is concen-trating on extending its thermal power supply and the KDA on Kandadji andalternative hydropower development. Clearly, power system expansionplanning has to take into account all the relevant alternatives and assuch needs to be carried out by one agency.
Recommendations
6.30 The mission supports ongoing efforts to: (a) establish a pro-cess and the capability for integrated power system planning, which is
- 48 -
being promoted under the IDA Power Credit, (b) establish in due course aseparate water supply entity, as provided for under the current IDA watersupply project, thus freeing NIGELEC to concentrate on power supply, and(c) study institutional arrangements in the power subsector, also underthe IDA credit mentioned above.
Manpower Issues and Training Needs
6.31 NIGELEC's skilled manpower resources are being taxed to thelimit. The shortages are most acute among the management and engineeringprofessionals, of which there are only eight out of a total staff 12/ ofabout 1,000. Similarly, the number of higher level technicians (about75) appears to be low considering the dispersion of load centers over avast region. The supply of lower level technicians is better, and shouldbe further improved by the current training of skilled technicians atNIGELEC's Centre de Metier in Niamey. External technical assistance isavailable in several key departments, and is now providing seven support-ing professionals, but these expatriates do not provide continuity tomanagement. Furthermore, there is an absence of academically trainedNigerien counterparts to whom expertise can be transferred for lastingbenefits. This situation will be somewhat rectified over the next fiveyears, as there are now 16 Nigeriens being trained as engineers at theEcole Superieure Interafricaine de l'Electricite near Abidjan. Thecollege provides training in all the technical aspects of electricitysupply and in managing a power utility. Students are sponsored by apower utility, where they must work for a specified length of time aftergraduating. NIGELEC's weakness in skilled manpower seems to be greatestin the management of connections and customer accounts by the Service deDistribution. Planning capabilities are limited to the Service EtudesGenerales et Organisation staffed by one expatriate and one Nigerien.
6.32 The mission supports current efforts under the IDA Power Creditto study NICELEC training needs and come up with a staff developmentplan. This manpower survey and training component should be coordinatedwith the manpower development assistance to NIGELEC planned underbilateral aid. The comprehensive power planning study provided for underthe IDA credit mentioned above which will be carried out with NIGELECstaff participation should lead to a better understanding of NIGELEC'stechnical assistance and training needs in this area.
12/ Workers, lower level technicians, higher level technicians, andprofessionals.

- 49 -
VII. DEMAND MANAGEMENT: CONSERVATION AND ENERGY PRICING
Conservation
7.1 This chapter deals only with the conservation of commercialenergy, as fuelwood conservation was discussed in Chapter II. Given thesmall size of the manufacturing sector in Niger, the prime areas forconserving commercial energy are in transport and air conditioning, par-ticularly of office buildings. The focus here is on conservation throughorganizational and technical measures. Possible conservation throughtaxation and rate setting is dealt with in the context of energy pricing(para 7.10).
Transport
7.2 The largest transport enterprise is the Societe Nationale desTransports du Niger (SNTN) with a fleet of about 500 heavy trucks (25tpayload, 42t gross weight), 35 inter-city buses and 50 buses for urbantransport. SNTN already has achieved significant fuel savings by(a) modernizing its vehicles; (b) instituting norms on fuel consumptionand driving time coupled with performance rewards; (c) training in fuelefficient vehicle operation. The combined effect of these measures andcertain road improvements over the October 1977-September 1981 period hasbeen a reduction in SNTN's fuel consumption/km by 22% (Annex 7.1). SNTNconsiders training in fuel efficient driving the most effective means offuel conservation. Differences of up to 25% in fuel consumption havebeen observed between different drivers under otherwise the same condi-tions. Overall, SNTN estimates fuel savings due to driver training aloneto be on the order of 16%. Of course, the other elements of its conser-vation program have facilitated the introduction and implementation offuel-efficient driving techniques.
7.3 Fuel saving measures remain to be introduced by the other 400transport operators in Niger, many of whom have only one vehicle and donot even keep accounts. Some operators with several vehicles are tryingto take conservation measures but lack competent personnel to do so.
Recommendations
7.4 Under the upcoming IDA Fourth Highway Project, a training cen-ter is to be established within the Ministry of Public Works (MPW) forMPW drivers. Training is to include equipment and vehicle operation.The mission recommends that the training center incorporate in itsprogram the teaching of fuel-efficient driving techniques, which shouldbe opened up to any interested driver.
7.5 Additional, significant fuel economies could be achieved bybetter coordination of cargo schedules. All too often trucks go out orreturn empty for lack of freight on the other leg of the trip. SNTN is

- 50 -
mindful of this problem and is trying to remedy it by appropriate sche-duling of its trucks. One particular case concerns the uranium mineswhich consume about 30 tonnes of various materials transported to themines from the South for each tonne of product transported out. With noother freight available, 95% of the trucks return South empty. Theunused transport capacity would be more than enough to permit low costtransport to the South of the close-by Anou-Araren coal, should this coalprove feasible as a fuelwood substitute.
Buildings
7.6 Energy conservation in buildings is important in Niger not onlyto save on imported energy, but also to improve the load curve of itspower system so as to reduce peak demands. Electricity consumption forair conditioning, especially of office buildings, has greatly increasedin recent years and in Niamey, where this accounts for 25-30% of totaldemand, it also accounts for the peak demand. Aware of the problem, theConstruction Directorate within the Ministry of Public Works ensures thatall new public sector buildings are equipped with modern central airconditioning and associated temperature regulation. The savings achievedover room air conditioning units have been substantial: 30-40% in powerdemand and 25-30% in energy consumption. New public buildings also arerequired to use solar water heating equipment. Significant additionalsavings in new buildings could be achieved by developing energy efficientdesign and building guidelines and following them in future construction.
7.7 Substantial energy savings remain to be realized in old publicbuildings using room air conditioning units. These buildings are poorlyinsulated, and doors and windows rarely close tightly. The air condi-tioners are more or less worn out, which reduces their cooling effici-ency. In addition, employees are careless about using the air condition-ing, e.g. leaving doors open, over-cooling. Some of these factors alsoapply to privately-owned older buildings, but probably to a lesser degreebecause of the direct financial costs involved.
7.8 Several possibilities exist for eliminating this waste ofenergy:
(a) Simple insulation measures ensuring tight closing of windowsand doors. These are relatively cheap and should be undertakenwithout delay in all public buildings as appropriate, once theMinistry of Public Works in cooperation with NIGELEC has estab-lished typical cost and related conservation benefits. Inaddition, the general public should be made aware of thesesavings measures.
(b) Institution of office temperature norms and their control, e.g.by in-house senior clerks. A reasonable norm might be a tem-perature of about 26° C (78° F).

- 51 -
(c) Replacing worn out air conditioners by more energy efficientmodels and introducing air coolers based on the evaporation ofwater. Air conditioners designed for the range of outside tem-peratures that exist in Niger (38°-42° C) and actually used inMiddle Eastern countries are 30% more energy efficient than themodels currently used in Niger. Using 1982 electricity con-sumption figures, these energy savings in air conditioning inNiamey would reduce peak demand by an estimated 3 MW, which atUS$850/kW installed (1982 prices) translates into investmentcost savings of about US$2.5 million. While their capitalcosts are about the same as those of the aforementioned airconditioners, air coolers provide nearly comparable comfort atonly 20% of the energy cost of these air conditioners. Aircoolers would appear well suited to the climate of Niger wherethe relative air humidity during the hot season is only 15%.By humidifying this air to 40%, the temperature will drop byabout 100 C (180 F). Air coolers have been effectively used incountries with similar climatic conditions, e.g. Sudan.
Recommendations
7.9 (a) Energy efficient design and building guidelines should be de-veloped, based on related experience in other countries.
(b) The Government should create a special energy conservation unitwithin the Construction Directorate to continue the currentDirectorate work of inspecting the plans for air-conditioningin new public buildings, review building designs to ensure thatthe guidelines recommended in (a) above have been followed, andpromote the use of solar hot water heaters. The conservationunit also should systematically pursue all the possibilitiesfor energy conservation outlined in para 7.8. Setting up sucha conservation unit will require equipment (including vehi-cles), the services of an expatriate specialist for two years,and the training of Nigerien personnel in air-conditioningengineering, all of which should cost about US$125,000.
(c) Concerning the use of more energy efficient air conditionersand air coolers, a pilot project involving selected publicbuildings in Niamey should be considered to test their suit-ability and effectiveness. A prefeasibility study initiated bythe mission has been carried out by the Ministry of PublicWorks in cooperation with the Energy Directorate. According tothis study, the project would consist of two phases. Phase 1envisages replacement over two years of 550 worn out air con-ditioners by more efficient ones, installation of some 40 aircoolers on an experimental basis in various types of publicsector office buildings and evaluation of the results. Phase 2would establish the proposed energy conservation unit and pre-pare an investment program in energy saving air conditioningbased on the findings of the evaluation study urwer Phase 1.

- 52 -
The cost of the project is estimated at about CFAF 100 million(US$300,000), not counting the cost of the new air conditioners(CFAF 297 million) to replace existing ones.
(d) With respect to energy savings in industry, the Ministry ofMines and Industry should evaluate their potential and takewhatever follow-up action is appropriate.
Energy Prices and Taxes
Petroleum Products
7.10 The Government sets the prices for the four major petroleumproducts used in Niger (premium and regular gasoline, kerosene and gasoil) and, as of March 1983, for butane; 13/ other product prices aredetermined by the market place. To stabilize the product price-s underits control, the Government operates a price stabilization fund financedby special levies on these products. This fund is used to compensate forincreases in the products' import prices until the next adjustment intheir domestic retail prices is made. The latter are based on theirc.i.f. prices Niamey. Retail prices elsewhere in the country varyaccording to the transport cost differentials involved.
7.11 Current retail prices for the controlled petroleum products(Table 7.1, Annex 7.2) are well in excess of their economic cost becausethere were substantial increases in their net taxation as of March 1,1983; and they remain based on the rather higher c.i.f. prices ofFebruary 1982, providing additional government revenues via correspond-ingly higher surpluses of the price stabilization fund. While thesemeasures were taken to help cope with Niger's current financial crisis,they will also result in further petroleum product conservation.
7.12 Relative product prices at the retail level essentially differin the degree of net taxation, a matter of government policy. The cur-rent relative tax burdens vary from 37-39% of the retail prices for gaso-line to -2.5% for kerosene, with gas oil about in the middle at 19%. Themission considers the small net subsidy of kerosene used mainly forlighting particularly in rural areas justified for social reasons. It
13/ The Government has not yet fixed an official price for butane, theretail prices for which have remained stable since 1977 despite thesubstantial increase in their international prices since then. Itcan be expected that, since the Government has included butane inits pricing scheme in order to raise revenues, this implied de factosubsidy will not be perpetuated. In any case it can be ignored,given the negligible quantitative importance of butane in Niger(para. 3.3).

- 53 -
further considers appropriate the preferential tax treatment of gas oilover gasoline. At nearly the same c.i.f. prices but higher fuel effi-ciency of diesel than gasoline driven vehicles, the use of gas oil intransport should be encouraged. 14/ The closest substitute for gas oilin industrial use (including power generation) is fuel oil, thus farlittle used in Niger. Here, conversely, the tax burden on gas oil issufficiently high to encourage the use of the more economical fuel oil,currently taxed at only 8% of its domestic retail price.
Table 7.1: STRUCTURE OF RETAIL PRICES FOR PETROLEUM
PRODUCTS IN NIAMEY, MARCH 1983 a/
Premium Regular
Gasoline Gasoline Kerosene Gas Oil
CFAF/L % CFAF/L % CFAF/L % CFAF/L %
Price c.i.f. Cotonou 78.95 32.9 76.31 33.9 81.75 60.6 83.19 48.9
Transport Cost Niamey 39.17 16.3 42.33 18.8 36.03 26.7 35.84 21.1
Price c.i.f. Niamey 118.12 49.2 118.64 52.7 117.78 87.2 119.03 70.0
Taxes and Duties 68.13 28.4 66.11 29.4 12.32 9.1 22.00 12.9
Price stabilization
levy/subsidy 26.48 11.0 16.89 7.5 -15.71 -11.6 10.02 5.9
Net taxation 94.61 39.4 83.00 36.9 -3.39 -2.5 32.02 18.8
Distribution Margin 27.27 11.4 23.32 10.4 20.61 15.3 18.95 11.2
Retail Price Niamey 240 100.0 225 100.0 135 100.0 170 100.0
US$/Gal. Equivalent b/ 2.67 2.50 1.50 1.89
a/ Based on c.i.f. prices as of February 1982.
b/ US$1.00 = CFAF 340.
Source: SONIDEP.
7.13 In summary, both the level and structure of current prices forpetroleum products in Niger provide the right signals for efficientenergy use.
14/ The argument that, because trucks do the most damage to roads gasoil should be taxed more than gasoline, concerns cost recovery ofroad maintenance expenditures which should not be confused with theefficient pricing of energy.

- 54 -
Electricity
7.14 In October 1983, the level and structure of NIGELEC's tariffwere revised to reflect the long run marginal cost (LRMC) of power supplyin Niger (Annex 7.3). In particular, the new tariff does away with theprevious practice of declining block rates which provided the wrongsignal to consumers in that unit rates declined as consumption in-creased. The current tariff is based on a recent tariff study 15/ whichestimates the LRMC of power supply in Niger from an all-diesel investmentprogram for the period 1985-1990, reflecting the LRMC as tempered byconsiderations of social, financial and administrative expediency (Annex7.4).
7.15 The Government has integrated this "reference" tariff into itstariff calculations. The tariff is set by way of a fixed componentcalculated by applying to the "reference" tariff an adjustment to permitthe financial equilibrium of NICELEC, and a variable component whichtakes into account the cost of fuel and the price of electricity boughtfrom NEPA. The tariff is subject to revision at the request of NIGELECfrom time to time as its financial position may require.
Recommendation
7.16 The mission supports the recent revision of the tariff leveland structure towards reflecting long run marginal cost - an essentialstep for NICELEC's revenues from selling electricity to recover at leastthe financial costs of its supply - and recommends that this policy befurther pursued.
Fuelwood and Charcoal
7.17 Where it cannot be procured "free" for direct family use as isthe tradition, fuelwood has to be bought by the consumer, particularly inthe urban areas. For want of effective government control, retail pricesfor fuelwood and charcoal in Niger are left to be determined in the mar-ket place. Although the Government requires traders to obtain a permitfrom the Forestry Department, permit fees have remained unchanged since1959 and by now amount to less than 1% of the average retail prices forfuelwood and charcoal of CFAF 20/kg and CFAF 50/kg, respectively (Table7.2). Real prices for woodfuels in Niamey and other major towns arereported to have risen by 5% p.a. in recent years and, given the wideningdemand/supply gap, are bound to increase further.
7.18 Two issues need to be addressed immediately:
(a) What is the economic cost of fuelwood?
15/ Etude de la Tarification de l'Electricite au Niger, Ingenieurbu>roOskar von Miller, GmbH, December 1982.

- 55 -
(b) What is a proper return to the government as resource owner,and how can collection be ensured?
The economic cost of fuelwood is reflected by the cost of reafforesta-tion, and in its absence, by the cost of deforestation in terms of de-creasing soil fertility and eventually, desertification. In Niger, bothcosts have to be considered. Estimates along these lines are certain toshow the economic cost of woodfuels to be well above their current marketprices, high as these may seem, particularly to urban consumers. As theowner and operator of the national forests, the Government is entitled toa stumpage fee to capture some or all of the excess profits (economicrent) realized by the private operators supplying fuelwood. While estab-lishing a proper stumpage fee is difficult enough, enforcing it inNigerien conditions is fraught with practical difficulties.
Table 7.2: PERMIT FEES AND RETAIL PRICES FOR FUELWOOD AND CHARCOAL
Forestry Tax or AverageStumpage Fee Retail Price
(CFAF) (CFAF/kg)
Fuelwood 35/stere = 0.15/kg a/ 20
Charcoal 40/quintal = 0.4/kg b/ 50
a/ 1 stere = 200 - 250 kg of dried roundwood.b/ 1 quintal = 100 kg.
Source: Directorate of Forestry and Fauna.
7.19 The second IDA-assisted forestry project (Credit NIR 226) willaddress these issues by providing for studies of the organization of thefuelwood market and appropriate prices and stumpage fees reflecting theeconomic cost of fuelwood from plantations and natural forests. TheCredit Agreement stipulates that such prices and fees be established bythe end of 1983. The mission emphasizes the urgency of meeting thisobjective. Proper economic pricing of fuelwood is the basic prerequisitefor conserving it through improved cooking stoves and the use of lesscostly substitutes, which are the prime responses to Niger's fuelwoodcrisis (Chapter II).
Comparative Energy Prices
7.20 Relative energy prices are a determining factor in a consumer'schoice between alternative fuels which can substitute for each other incooking, industrial heating, and thermal power generation. The choicedepends on the relative efficiency with which each fuel is used and henceits price per unit of useful energy. End-use efficiencies vary widely

- 56 -
between different fuels and applications and even for one fuel in a givenapplication, depending on the equipment used. Fuelwood stoves in Nigerare an outstanding case in point: an improved fuelwood stove with anend-use efficiency only three percentage points higher than that of thetraditional three stone fire would reduce the price per useful unit ofenergy by 30% and conserve 30% of fuelwood as well. Available technologyactually can do better than that.
7.21 Table 7.3 shows the comparative market prices and relevant end-use efficiences for fuelwood and its possible substitutes in Niger. 16/For market prices to provide the right buying signals they should reflectthe economic cost involved which, for Niger's woodfuels and electricity,are known to be higher than their market prices, and which remain to beestablished for lignite and groundnut shell briquettes, as noted before.In addition, the investment cost of appropriate cooking equipment needsto be factored in. Table 7.3 nevertheless affords some interesting ob-servations. In the first place, lignite stands out as the prime sub-stitute for fuelwood; even at twice its estimated cost, lignite remainscompetitive. Similarly, groundnut shell briquettes as costed under asmall scale project by SONICHAR (2,800 tpa) appear attractive as a fuel-wood substitute, and they should be even more so if produced on a largerscale. On the other hand, electricity compares unfavorably, especiallyif priced in line with its economic cost and, in addition, the substan-tial cost of cooking equipment is taken into account. As for the priceof charcoal, although lower than fuelwood, it conceals the fact that on afuelwood equivalent basis charcoal actually costs twice as much. Kero-sene compares favorably, even in terms of its unsubsidized price; it maybecome even more attractive if domestic oil production can make itavailable at a lower economic cost than at present.
Recommendations
7.22 The mission recommends a comprehensive study of comparativeenergy prices reflecting economic cost, with particular reference toproviding energy in urban areas and taking into account the environmentalconsequences of fuelwood and charcoal use. The study should includedetermination of the economic cost of appropriate cooking equipment,stoves in particular, and the related fuel end-use efficiencies in orderto arrive at comparisons based on a meaningful cost per unit of usefulenergy. Only on such a basis can proper pricing and investment decisionsconcerning inter-fuel substitution be developed. The study should becarried out by consultants in cooperation with the new ONERSOL on thetechnical side (stoves, end-use efficiencies). The study would requiresix to eight man-months of appropriate economic and technical expertiseand would cost about US$100,000 in all.
16/ Anou-Ar en coal has not been included in this comparison becausethe many uncertainties concerning its feasibility as a fuelwood sub-stitute must be resolved before even tentative cost estimates can bemade.
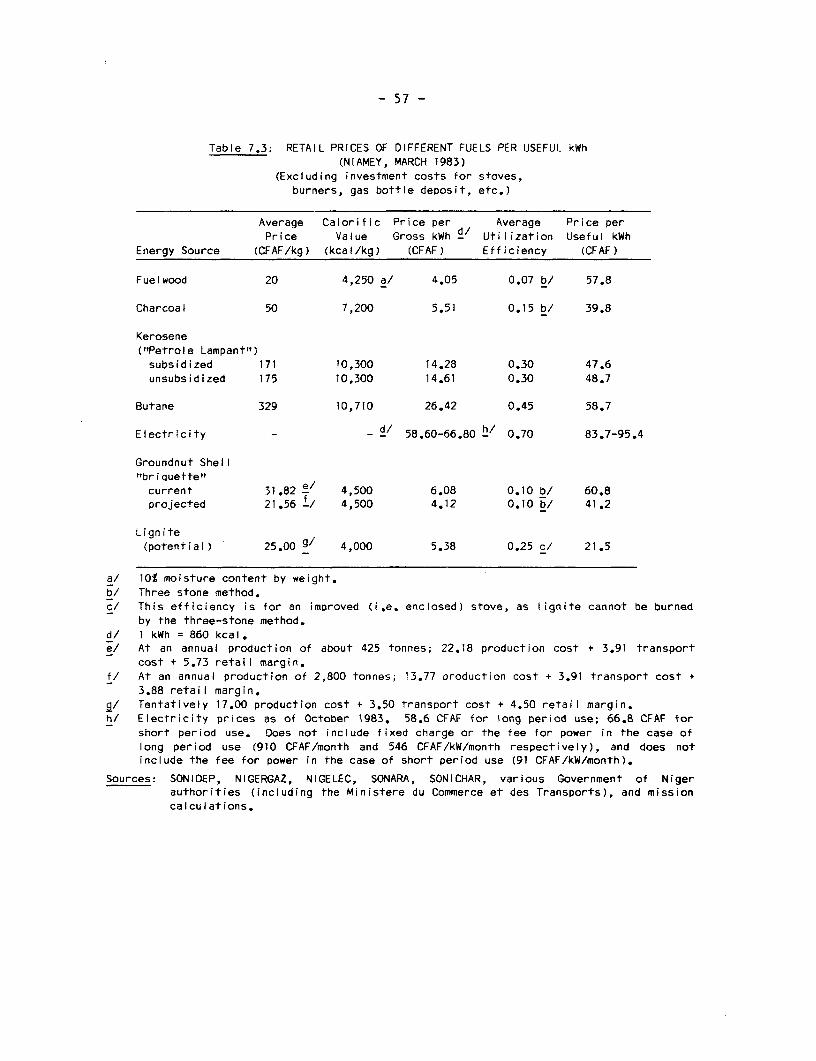
- 57 -
Table 7.3: RETAIL PRICES OF DIFFERENT FUELS PER USEFUL kWh(NIAMEY, MARCH 1983)
(Excluding investment costs for stoves,burners, gas bottle deposit, etc.)
Average Calorific Price per Average Price perPrice Value Gross kWh d/ Utilization Useful kWh
Energy Source (CFAF/kg) (kcal/kg) (CFAF) Efficiency (CFAF)
Fuelwood 20 4,250 a/ 4.05 0.07 b/ 57.8
Charcoal 50 7,200 5.51 0.15 b/ 39.8
Kerosene("Petrole Lampant")subsidized 171 10,300 14.28 0.30 47.6unsubsidized 175 10,300 14.61 0.30 48.7
Butane 329 10,710 26.42 0.45 58.7
Electricity - / 58.60-66.80 h/ 0.70 83.7-95.4
Groundnut Shell"briquette"current 31.82 e/ 4,500 6.08 0.10 b/ 60.8projected 21.56 f, 4,500 4.12 0.10 b/ 41.2
Lignite(potential) 25.00 g/ 4,000 5.38 0.25 c/ 21.5
a/ 10% moisture content by weight.b/ Three stone method.c/ This efficiency is for an improved (i.e. enclosed) stove, as lignite cannot be burned
by the three-stone method.d/ 1 kWh = 860 kcal.e/ At an annual production of about 425 tonnes; 22.18 production cost + 3.91 transport
cost + 5.73 retail margin.f/ At an annual production of 2,800 tonnes; 13.77 production cost + 3.91 transport cost +
3.88 retail margin.9/ Tentatively 17.00 production cost + 3.50 transport cost + 4.50 retail margin.h/ Electricity prices as of October 1983. 58.6 CFAF for long period use; 66.8 CFAF for
short period use. Does not include fixed charge or the fee for power in the case oflong period use (910 CFAF/month and 546 CFAF/kW/month respectively), and does notinclude the fee for power in the case of short period use (91 CFAF/kW/month).
Sources: SONIDEP, NIGERGAZ, NIGELEC, SONARA, SONICHAR, various Government of Nigerauthorities (including the Ministere du Commerce et des Transports), and missioncalculations.

- 58 -
VIII. ENERGY PLANNING, INVESTMENT, AND TECHNICAL ASSISTANCE
Energy Sector Planning
8.1 The extreme scarcity of qualified manpower in Niger is the mainconstraint to planning and operational work, both at the subsector leveland for the energy sector as a whole. Concentrated technical assistanceis urgently needed at both levels to foster the development of Nigerienexpertise, but first of all within the various subsectors.
8.2 Specific technical assistance requirements in subsectoral plan-ning (i.e. developing long-term investment programs and ensuring adequateproject preparation) have been discussed in previous chapters: the com-plementary forestry training program (para 2.27), assistance to thehydrocarbons and coal unit of the Directorate of Energy (DE, para 3.15),coordination of the exploration and development of coal and lignite (para4.10), the refocussing of ONERSOL's efforts (para 5.24), the formulationof a staff development plan for NIGELEC (para 6.32), and the setting upof a conservation unit in the Construction Directorate of the MPW (para7.9). In each of these cases, the training of Nigerien counterparts isessential to carry on the work which expatriate assistance has helped todefine.
Recommendation
8.3 The mission recommends that, unless previously specified other-wise, the training of Nigerien counterparts consist of alternatingperiods of work in the operational/planning unit of their Nigerien organ-ization with periods of work or study in the offices of establishedconsultants (and particularly as participants in consultants' work onNiger), in universities, or in research institutes. Training abroadshould be emphasized during the first two or three years of these assis-tance programs, with subsequent training taking place mainly within therespective units themselves, which by then will be in a position to buildon their own experience.
8.4 The multitude of ministries and operating agencies involved inthe energy sector and the manpower shortage have impeded the developmentof an integrated approach to Niger's energy problems. Currently, ad hoccommittees with members drawn from these various ministries and agenciesdo indeed work out a national energy sector strategy for the Government'sfive-year or interim plans, but this process needs to be reinforced byongoing, long-term planning. In 1981, the Government sought to establishthis by setting up the Directorate of Energy (DE) as a unit of the Minis-try of Mines and Industry (MMI), given the MMI's role in overseeing themain energy-related parastatals. The DE is responsible for formulatingnational energy policies in accordance with Government objectives, andcoordination and control of their implementation. Its mandate encom-passes all forms and aspects of energy, from research and exploration to
- 59 -
supply, transformation, distribution, and use. The three units withinthe DE cover: (1) hydrocarbons and coal, (2) electricity, and (3) newforms of energy. The DE faces two major obstacles in accomplishing itstask: a lack of the necessary authority to coordinate energy sectoractivities, and severe understaffing, with only five more-or-less expe-rienced engineers and economists, three of whom are more involved in mon-itoring oil and gas exploration than in overall sector planning.
Recommendations
8.5 The mission recommends that, to strengthen overall energy plan-ning, an energy economist experienced in general energy supply and demandstudies, pricing analyses, optimization techniques, and financing beappointed as Energy Adviser reporting directly to the Minister of Minesand Industry. This Energy Adviser should, in particular, draft the termsof reference for carrying out the study of comparative energy prices re-commended in para 7.22, and coordinate and monitor its progress. Annex8.1 presents a detailed description of the position, which is to last twoyears and cost about US$290,000. With respect to the Directorate ofEnergy, in addition to pursuing its current work on oil and gas (para3.14), the DE's hydrocarbons and coal section should coordinate the de-velopment of the coal/lignite sector (para 4.12). The rest of the DEshould focus exclusively on formulating and coordinating national energypolicy, leaving the individual energy agencies (e.g. ONERSOL, the Minis-try of Hydraulics and the Environment, NIGELEC) to propose their owndetailed, long-run planning, as emphasized above. For its part, the DEshould ensure that the Government analyzes the agencies' proposals oninvestments, pricing, and other such issues with a broad national per-spective on the sector rather than from the isolated point of view ofeach agency. With respect to implementing national energy policy asdecided by the Government, the existing ministries and other energysector organizations should retain their current functions, subject tothe other recommendations in this report.
Energy Investment
Past Investment
8.6 Total public and private investment in the energy sector, ex-cluding forestry, came to an estimated 22.6 billion current CFAF (1981US$83.2 million) in 1981, assuming negligible private investment otherthan in petroleum exploration and the SONICHAR complex, about 32% ofwhich is privately owned (Table 8.1). This total investment has remainedsteady at about 4% of GDP and 16% of gross fixed investment for 1979-81.
8.7 For the same period, power investments consistently dominatedthe total, accounting in 1981 for about 87% of all energy investments,and over 99% of public investments, i.e. excluding the only wholly pri-vate investments, which are in petroleum exploration, but including

- 60 -
investments in the SONICHAR complex, in which the Government is majorityshareholder. Within the power subsector itself, almost all (98%) of the1981 investments went into the SONICHAR complex, which includes the coalmine, the power plant, transmission and distribution facilities, and themining town. Petroleum exploration by private oil companies constitutedthe next largest category of total public and private investment in 1979-1981, adding up to about 2.8 billion current CFAF (1981 US$10.1 million)or about 12% of the total in 1981. Finally, ONERSOL research accountedfor the remaining investment in the same period (one percent of the 1981total). Most of these funds were spent on solar apparatus, with a veryminor amount paying for a partial evaluation of Niger's wind resources.
Table 8.1: TOTAL ENERGY INVESTMENT, 1979-1981 a'(in million current CFAF and %)
1979 1980 1981million CFAF % million CFAF % million CFAF %
1. Power 13,029 63 16,970 77 19,750 872. Petroleum 7,577 36 4,735 21 2,750 123. Renewable Energy 110 1 498 2 87 14. Total Energy
Investment 20,716 100 22,203 100 22,587 100
(4) as % of GDP 4.68 4.20 3.78(4) as % of grossfixed investment 16.81 14.61 16.41
a/ Public and private, excluding forestry.
Source: Sous-Commission Energie.
8.8 Data on investments in forestry are scarce, but the main pur-pose of forestry projects in Niger has been to directly fight desertifi-cation rather than to produce fuelwood. The First IDA Forestry Project(Credit 800-NIR), now being continued in the Second Forestry Project(Credit 1226-NIR), is the only project which has as a basic objectiveimproving fuelwood supplies. Investments in the project came to about465 million current CFAF (1981 US$1.7 million) in 1981.
Investment Requirements
8.9 Table 8.2 shows proposed public investment in the energy sec-tor, excluding forestry, under the interim plan (1984-85), again brokendown into investments in the power subsector and in renewable energy. Inthe power subsector, NIGELEC's investments are a modification of the in-vestment program (Annex 8.2) it drew up in July 1982 as part of itsstudies with respect to the new Goudel diesel plant (3 x 12 MW) which is

- 61 -
to meet growing demand in the Niamey area. The investments shown inTable 8.2 and in Annex 8.2 only include those which seem certain at thistime, and not those which will be defined by the IDA-financed study ofthe longer-term development of the power system (para 6.24). Two of theGoudel units constitute the largest single investment item in the interimplan. This is part of a sound short-term strategy of maintaining enoughthermal capacity in Niamey to meet peak demand and in case of a failurein the supply from Nigeria. The mission also supports two priorities inthe electrification of secondary load centers, which are the towns of Sayand Kolo. The power planning study, recently begun under the IDA PowerCredit (para 6.30) is included as an item in the interim plan; it willidentify longer-term investment needs in the power subsector.
Table 8.2: PROPOSED PUBLIC INVESTMENT IN THE INTERIM PLAN, 1984-85
(January 1983 million CFAF and 1983 US$) al
Total Cost(million CFAF) (million US$)
PowerResearch and Studies
Long-term planning study 600 1.74Other studies 1 282 3.72
Subtotal 5.46
New Generating CapacityGoudel diesel plant (2x12 MW) 7,500 21.74Zinder diesel plant (2xl.1 MW) 750 2.17Maradi station extension (lx 1.1 MW) 300 0.87Malbaza station extension (2x2 MW) 1 500 4.35
Subtotal 1 W51
Transmission and DistributionSubtotal 7,655 22.19
Electrification of Secondary LoadCenters
Subtotal of 6 centers 687 1.99
Subtotal Power 20,274 58.77
Renewable Energy
Research and StudiesONERSOL 115 0.33
Subtotal Renewable Energy m uTSTotal 20,389 59.10
a/ US$1.00 = 345 CFAF
Source: Sous-Commision Energie

- 62 -
8.10 As noted above, the only significant investments in fuelwoodproduction are being made through the second IDA/FAC/CCCE forestryproject.
Recommendations
8.11 The mission recommends that the Government pursue the indi-cative objectives for maximum national production from plantations andimproved forest management as described in Table 2.3, which would requireadditional investments of about 1982 CFAF 2.3 billion (US$7 million) p.a.from 1984 through 1988, and 1982 CFAF 3.4 billion (US$10 million) p.a.from 1989 through 2018, plus an additional 1982 CFAF 100 million (US$300thousand) p.a. during the first five years for training to ensure thatthe Directorate of Forestry and Fauna has the necessary manpower for theproposed program (para 2.28). These investments are described in Annex2.3.
8.12 Three other areas in which energy sector investments should beconsidered are the development of Solomi coal for household and/or indus-trial use, lignite exploration and development, and petroleum explorationand development. In the case of Solomi coal, if demand and transpor-tation cost studies indicate it would be economic to use the coal inhousehoLds and/or industry, investments will be needed for exploiting itand developing a marketing network (stocking facilities, trucks, etc.).
Recommendations
8.13 Given lignite's potential as a substitute for gas oil and forfuelwood, about (1982) CFAF 285 million (US$850,000) should be soughtimmediately for: (a) a systematic drilling program to detect additionalreserves at Salkadamma/Tahoua; and (b) a reconnaissance program in theFilingue-Salkadamma area, with possible subsequent exploration, as re-commended in para 4.10 and presented in detail in Annex 4.1. At the sametime, the lignite combustion tests and demand studies listed below undertechnical assistance need to be carried out. With respect to petroleumexploration, the Government needs to consider the possibility of apprais-ing and producing the Sokhor find (Chapter III).
Technical Assistance Needs
8.14 The priority areas for technical assistance are as follows:
General Energy Sector
(a) Strengthening overall energy planning by having an energyeconomist act as Energy Advisor to the Minister of Mines andIndustry for two years, at an estimated cost of US$290,000(para. 8.5);

- 63 -
(b) A comprehensive study of comparative energy prices reflectingeconomic cost with particular reference to substituting forfuelwood (para 7.22).
Petroleum
(c) Building up the MMI's capability for acquiring, understanding,and storing petroleum exploration information, at an estimatedcost of US$ one million over three or four years (para 3.15).
Power
(d) A review of the institutional set-up of the power subsector(para 6.30), a study of NIGELEC's manpower needs (para 6.32)and a long-term power planning study (para 6.30) are includedin the IDA Power Credit.
Coal/Lignite
(e) Lignite combustion tests and studies of the demand for ligniteas a fuelwood substitute and in industry and power generation(para 4.10).
(f) In evaluating the workable reserves of the Solomi coal and indefining the technology for preparing and using this resource(para 4.7), ensuring that the costs of exploitation, prepara-tion and utilization are analyzed as a function of a study ofdemand for this coal as a substitute for fuelwood or for use inindustry and generating electricity (para 4.10).
(g) Strengthening of the DE's hydrocarbons and coal unit throughthe services of an expatriate coal/lignite specialist. Esti-mated cost: US$210,000 over a period of three years (para4.12).
Forestry
(h) Investigating new forestry technical packages well adapted tomarginal lands in arid and semi-arid zones (para 2.17).
Renewable Energy
(i) A study defining a specific action program to promote the useof groundnut shell briquettes for residential needs. Thisstudy should be carried out jointly with the development of animproved stove which is suitable for both these briquettes andwood (para 5.17).
(j) An evaluation of the potential for solar water heating inindustry (para 5.9);

- 64 -
Conservation
(k) Creating a special energy conservation unit within the Con-struction Directorate of the Ministry of Public Works andimplementing a pilot project to evaluate the replacement ofworn out air conditioners by more recent models. Setting upthe conservation unit would cost about US$125,000, and thepilot project would cost an estimated US$300,000, excluding thecost of about US$890,000 for new air conditioners to replaceexisting ones (para 7.9).
(1) Institution of a course in fuel-efficient driving techniquesopen to any driver interested in taking it (para 7.4).
The Need for Action
8.15 To demonstrate the urgent need for Government action on boththe energy demand and supply sides, the Mission has prepared an indica-tive summary national energy balance for 1990 (Annex 8.3), based on thevarious energy demand projections presented in this report. 17/ Annex8.3 therefore shows Niger's energy situation in 1990 as it would evolveif there were no changes in consumption habits (e.g. no introduction ofimproved woodstoves, no use of kerosene in cooking, no conservation ofpower in air-conditioning) and no intensive effort to develop domesticresources (e.g. oil, coal, lignite, wood, groundnut shells). In such acase, total energy consumption (excluding butane, jet fuel, and agricul-tural and animal residues burned for cooking) would increase by 23% inall, i.e. at an average rate of 2.3% p.a. from 1981 to 1990. This wouldhave serious consequences, particularly with respect to fuelwood suppliesand the cost of importing petroleum products. The demand for fuelwoodwould have grown by nearly 30% by 1990, which would increase the deficit,i.e. the difference between the net available increment of wood and fuel-wood demand, by more than 50% over its 1981 level (Table 2.2). Thisshortage would result in further deforestation and increased burning ofagricultural and animal residues, both of which accelerate land erosionand desertification.
8.16 With respect to petroleum products, the demand, projected asgrowing at 7.6% p.a., would nearly double in volume by 1990. Assuming on
17/ Except with respect to petroleum products. Table 3.2 assumes somesubstitution of kerosene for fuelwood which is, however, disallowedhere.

- 65 -
top of this an increase of 1.6% p.a. in the real price of crude petro-leum, 18/ Niger's recorded import bill for oil products in real termswould more than double over the 1981-90 period, increasing at an averagerate of 11.3% p.a. In order to finance this import bill, estimated atCFAF 41.3 billion (US$123 million) in 1990, an increase of CFAF 6.0billion (US$18 million) over Niger's estimated 1981 petroleum productsbill for both recorded and unrecorded imports, Niger's export revenueswould have to increase by as much. According to present prospects, anincrease in export revenues of this order essentially would have to comefrom an increase in the volume and/or the real price of Niger's uraniumexports, and it is not now possible to judge whether this might happen ornot. However, even if export revenues from uranium should rise to therequired level by 1990, such additional foreign exchange revenues couldobviously be better used for urgently needed investment in Niger'seconomic and social development.
18/ World Development Report 1983, published for the World Bank byOxford Unversity Press, 1983, p. 28.

ANNEX 1.1Niger: National Energy Balance. 1981
(tonnes of oil equivalent)
PriAgry Eergy Petroleum ProductsAgricultural
Crude and Animal Char- Electri- Gaso- Aviation Jet Kero- Fuel LineLine Hydro Oil Coal I/ Besidues 21 Fuelwood coal city N/ Butane line 4/ Gasoline Fuel sene Gas Oil Oil Total Totals Line
Gross Supply1 Production 17,025 168 838,590 855,783 12 Inports 30,740 502a 41,067 741 17,624 4,362 84,571 2,779 151,646 182,386 23 Primary Exports 34 Stock Cbsnges (2,156)t (50)t (31)s (424)s (2
3)s 97s 11,56
2s 11,181s 8,975 4
5 Total Available 14,869 118 838,590 30,740 471a 40,643 741 17,601 4,459 96,133 2,779 162,827 1,047,144 5
Conversion6 Petroleum Refining 67 Charcoal Production (2,425)e
2,4 2
5e 0 78 Electric Power Generation (14,869) 44,785r (29,697) (29,697)
21
9y 8
9 Conversion Losses (11,550)ej (51,300) (62,850) 910 Tranaission/Distribution Losses (
2,635)z (2,635) 10
11 Net Supply Available 118 824,615 2,425 21,590 471 40,643 741 17,601 4,459 66,436 2,779 133,130 981,878 11
12 Secondary Exports 1213 Bunker Sales (17,601)f (17,601) (17,601) 1314 Net Domestic Consumption 118 824,615 2,425 21,590 471 40,643 741c 4,459 66,436
2,7 7 9
c 115,529 964,277 14
Consumption by Sector15 Mining 9,180 64nh 1
8,4 7 6
ge 18,540 27,720 1516 Industry
2,6 3
5e 165n 3,500ge 2,779 6,444 9,079 16
17 Small Industry 5/ 115 82,460e 2,425 255 1,000ge 1,000 86,255 1718 Construction (buildings, roads) 340e 28,000ge 28,000 28,340 1819 Comerce 935e 38n 38 973 1920 Transport 170e 40,643 741 14,500ge 55,884 56,054 2021 Households 3 742,155 4,505 1
70n 4,459 4,629 751,292 21
22 Public Administration 3,145b 34n 34 3,179 2223 Comnications/Miscellaneous 4
25e 425 23
24 Agriculture __ __ _ _ 960ge 960 960 2425 Total 118 824,615 2,425 21,590 471 40,643 741 4,45 66,436 2,779 115,529 964,277 25
Sources: 1K, SONIDEP, GPP, NIGERGAZ, SONICHAR, NIGELEC, 1/ Coal is converted to toe at .227 toe/t (2,315 kcal/kg), arrived at f All jet fuel assumed sold to foreign planes.SONARA, SOMAIR, COMINAK, SNTN, CILSS, FAO by setting the toe value of the 65,502 tonnes of coal burned in the g Due to lack of data, figures for gas oil consumption
SONICHAR power plant equal to the thermal replacement toe value by sector are very tentative. They are based on CFFNotes: (i) Table does not include an estimated maximum (i.e. at 265 toe/GWh) of the electricity thereby produced, taking estimates.
of less than 250 toe (0.9 GWh) p.a. of solar into account the 257 toe of gas oil also burned to fire up the h Strictly for household use by mining personnel.energy used to heat hot water and to power coal-burning boilers. I Based on 10% conversion efficiency by weight.radio and TV. 2/ Groundnut shells only. Due to lack of data, excludes agricultural n Butane consumption by sector based on NIGERGAZ
(ii) Parentheses indicate negative flows. residues and dung burned in areas of severe fuelwood shortages. estimates.(iii) Conversion factors listed in the first few 3/ Electricity is converted to toe at the weighted 1981 average rate r Power generated by NIGELEC, SONICHAR, SOMAIR, COMINAK.
pages of this report. of fuel consumption of Niger's gas oil burning plants, about 265 toe/GWh. Excludes any minor own-generation by other institutionsConversion losses are then calculated based on an efficiency of about during supply failures.32:, s0 that "T/D Losses" and "Net. Supply Available" are given in terms a Petroleum product stock changes calculated asof the maxim theoretical heating value of electricity, 85 toe/GWh. difference between imports and sales by distribution
4/ Both premium and regular gasolines. companies.5/ Includes bakeries, foundries, forges, metalworkers' shops, t Stock changes calculated as difference between
laundries, salt producing operations, tea driokers,... production and consumption.y This figure is arbitrary in that it reflects the
a Average, calculated from figures for March to February 1980-1981 difference between the toe value of electricity used inand 1981-1982. constructing the table and the actual fuel consumption
b Includes government offices and street lighting. rates of the Nigerien thermal power plants.c Consumptimn assumed equal to imports. z Includes own use by NIGELEC (255 toe) and SONICRAR (85

- 67 -
ANNEX 2.1
Mean Annual Increment and Net Available Increment of Fuelwood in 1980
by Type of Forest Cover and Geographic Zone a/
(000 m; unless otherwise indicated)
Understocked
Underpopulated and Over- Understocked
Desertic and Sahelian and Populated and Becoming
Subdesertic Sudano-Sahelian Savanna Overpopulated Tree Row
Zone Zone Zone Savanna Zone Plantations Totals
Woodlands and Savannas
1. mean annual increment 240 1460 1395 442 - 3537
2. net available incre-
ment 12 73 418 221 - 724
1(2) as a % of (1)1 (5) (5) (30) (50) (-) (20)
Bush Fallows and Sylvo-Agri-
cultural Formations
3. mean annual increment - 255 250 120 10 635
4, net available incre-
ment - 255 250 120 10 635
[(4) as a % of (3)1 (-) (100) (100) (100) (100) (100)
Column Totals
5. mean annual increment 240 1715 1645 562 10 4172
6. net available
increment 12 328 668 341 10 1359
1(6) as % of (5)] (5) (19) (41) (61) (100) (33)
a/ "net available increment"t refers to that amount of the mean annual increment of fuelwood that
was actually available for use in 1980, given the problem of accessibility.
Source: FAO.

ANNEX 2.2Indicative Cost Estimate of the Niger Energy Sector
Assessment Mission's Proposals for Fuelwood Plantations andImproved Forest Management, 1979-2018
I a/ II III IV V VI ViI VIIIFive-Year Period 1979 1983 1984 1988 1989 1993 1994 1998 19999 2003 2004 2008 2009 2013 2014 2018
I. Direct Costs US$/ha
State managed industrialirrigated tree planta-tions 10,000ha/five years 000 0.250 0.250 0.500 0.500 0.500 1.000 1.000 1.000ha cumulative 000 0.250 0.500 1.000 1.500 2.000 3.000 4.000 5.000Direct costs US$000 2,500 2,500 5,000 5,000 5,000 10,000 10,000 10,000
Tree plantations within 4.000irrigated agriculturalperimeters b/
ha/five years 000 0.250 0.250 0.500 0.500 0.500 1.000 1.000 1.000ha cumulative 000 0.250 0.500 1.000 1.500 2.000 3.000 4.000 5.000Direct costs US$000 1,000 1,000 2,000 2,000 2,000 4,000 4,000 4,000
State managed rainfedtree plantations b/ 1,000ha/five years 000 2.5 7.5 10.0 10.0 10.0 10.0 5.0 5.0 E
ha cumulative 000 2.5 10.0 20.0 30.0 40.0 50.0 55.0 60.0 o:
Direct costs US$000 2,500 7,500 10,000 10,000 10,000 10,000 5,000 5,000
Rural rainfed treeplantations 200
ha/five years 000 10.0 15.0 25.0 25.0 25.0 25.0 15.0 10.0ha cumulative 000 10.0 25.0 50.0 75.0 100.0 125.0 140.0 150.0Direct costs US$000 2,000 3,000 5,000 5,000 5,000 5,000 3,000 2,000
Better management ofnatural forest cover 20
ha/five years 000 p.m. 500.0 500.0 500.0 500.0 500.0 750.0 750.0ha cumulative 000 p.m. 500.0 1000.0 1500.0 2000.0 2500.0 3250.0 4000.0Direct costs US$000 5,000 10,000 10,000 10,000 10,000 10,000 15,000 15,000
Total DirectCost US$000 (1982) 13,000 24,000 32,000 32,000 32,000 39,000 37,000 36,000
II. Indirect Costs(50% of direct costs)US$000 (1982) 6,500 12,000 16,000 16,000 16,000 19,500 18,500 18,000
Total Costs US$000 (1982) 19,500 36,000 48,000 48,000 48,000 58,500 55,500 54,000
a/ Current program under the Second IDA/FAC/CCCE Forestry Project (Credit 1226-NIR), a continuation of the IDA Pilot Forestry and Techni-cal Assistance Project (Credit 800-NIR).
b/ Total area planted listed in terms of equivalent ha.
Note: About 10% of the total wood produced from the proposed plantations and improved forest management would be used for building poles.Cost estimates do not include the necessary complementary forestry training.
Source: Bank Staff

- 69 -
ANNEX 2.3
Indicative Cost Estimate for a Five-year ComplementaryForestry Training Program
This program, which should be launched in 1984, is designed tomeet the training needs of the Forestry Department (Direction des Eaux etForets) of the Ministry of Hydraulics and of the Environment in thesecond five years of implementing the planting and improved forest man-agement objectives proposed in para. 2.17 and described in Table 2.3 andAnnex 2.3 of this report. The planting, improved forest management, andcomplementary training programs for the first five years (1979-83) ofsuch a long-term forestry commitment already have been provided for bythe IDA Forestry Pilot and Technical Assistance Project (Credit 800-NIR),and its continuation, the IDA/FAC/CCCE Second Forestry Project (Credit1226-NIR).
The cost estimates listed below cover the training of 25 levelA, 50 level B, and 75 level C personnel, as follows:
for level A, three years of which 50% abroad;for levels B and C, two years all of which in Niger.
Cost Estimate(000 US$)
Investment and equipment 500Technical assistance and
overseas training 500Local staff 200Operating costs 300
Total 1,500

- 70 -
ANNEX 3.1
A Preliminary Assessment of the TechnicalAssistance and Training Requirements of the Ministry
of Mines and Industry for Coordinating Oil and Gas Exploration
In view of the recent discovery at the Sokhor well, the re-quirements for the next three to four years can be estimated as follows(in US$):
(a) Assistance for retrieval and storage of data:
- Six visits of an expert for a period ofone week each time 30,000
- Equipment (storage, reproduction,small laboratory) 80,000
- Training of one Nigerien technician 5,000
(b) Assistance from expatriate specialistsworking on oil and gas exploration withthe staff of the MMI's petroleum unit:
- Two weeks of an experienced explora-tionist every two months on averageduring three years 150,000
- Occasional needs in experts or specialstudies (interpretation, laboratory,reprocessing) estimated at 400,000
(c) Assistance to revise the Petroleum LawAgreements 100,000
(d) Training:
- Two Nigerien Technicians each year (geo-logist, geophysicist, economist,engineer) for a period of six monthseach 50,000
Total 815,000
Contingencies 145,000
GRAND TOTAL 960,000
Source: Bank Staff.

- 71 -
ANNEX 4.1Page 1 of 2
Lignite Exploration Programs
As it was during an OFEDES search for groundwater over the lastfew years that the accidental discoveries of lignite were made in theTertiary strata of the "continental terminal" in the Iullemeden Basinnear Salkadamma and Filingue, a systematic perusal of all well construc-tion records, including a stratigraphical-paleogeographical examination,should be carried out in the course of any further exploration for lig-nite in the area.
A. Exploration at Salkadamma/Tahoua
An exploration program needs to be carried out to calculate theminable reserves of lignite at Salkadamma/Tahoua to evaluate in a pre-feasibility study the economics of mining the lignite.
To define the limits of the deposit, in particular towards theeast and southeast, this exploration program should consist of approxi-mately 10 drill holes, each up to 100 m in depth, located 0.5 to 1 kmapart. At least two additional drill holes should be sunk as far as thelying "siderolitic series of Adar Doutchi" as it is probable that ligniteseams exist below 60 m, a possibility that has not yet been explored.
The costs of the 12 drill holes, with an estimated total of1,300 m (core), are on the order of 40 million CFAF (about US$115,000).To this figure should be added the cost of equipment, expatriate super-vision, and studies. The previous ONAREM drilling program was consider-ably handicapped by the lack of special core barrels for soft soil con-ditions. Therefore, at least four special double core barrels for softsoil conditions are to be made available at a unit price of US$15,000(total price US$60,000). Furthermore, a drill rig with 300 m depthcapacity and optional percussion or rotary drill is needed, its pricebeing in the range of US$100,000. A foreign master driller experiencedin soft soil conditions should assist the ONAREM drilling personnel dur-ing the drilling activities over a period of six months (at an estimatedtwo drill holes per month). The total cost of the master driller'sservices are estimated at US$60,000.
The cost for evaluating the drilling results including qualitytests, aptitude tests of the lignite to a pilot-test scale, soil-mechani-cal investigations, etc. and for preparing a technical-economical pre-feasibility study will be on the order of US$200,000, if an internation-ally known consulting company is entrusted with this task.
The total costs for executing the Salkadamma/Tahoua explorationprogram - excluding the provision of vehicles, consumption of fuel andoil, accommodation in camps to be arrang2d for by the CP - are thereforeestimated at US$550,000.

- 72 -
ANNEX 4.1Page 2 of 2
B. Exploration in the Filingue-Salkadamma Area
Indications of a seam of lignite 0.50 m thick were discoveredat a depth of 68 m in the zone east of Filingue, near Chinyelga. Inaddition, accumulations of resin encountered at 54 m depth of OFEDESwater well No. 75 north of Filingue, near Fadama, suggest extensive plantgrowth during the "continental terminal." A systematic prospecting pro-gram therefore should be carried out in the area between Salkadamma andFilingue. If it yields positive results, it should be followed by anexploration program.
To obtain a preliminary survey of the paleogeographical con-ditions on the middle "continental terminal" in this region and to evalu-ate the possibility of further lignite discoveries in the area, 12 drillholes about 100 m deep on average should be sunk 5 to 10 km apart. In-cluding other costs such as for the infrastructure required (constructionof roads to the drilling sites, erection of camps, etc.), evaluation ofdrilling results, and analyses, the prospecting program (extent of totaldrilling 1200m) should take about 12 months and cost about US$300,000.

- 73 -
ANNEX 4.2
Job Description for the Technical Adviseron Coal and Lignite
Training - Thermal engineer with 10-15 years experiencein industry, of which at least 6 years inindustries involved with coal or ligniteextraction, preparation or utilization.
Length of Mission - Total length of 3 years, starting with 4months followed by 2-week long missions every2 months.
Location - Niamey
Title - Adviser to the hydrocarbons and coal unit ofthe Directorate of Energy.
Job Description To work with the hydrocarbons and coal unit staffon the following issues:
- The coordination of the results of coal andlignite reserve exploration, as well as thecoordination of combustion tests, and ofstudies of demand and transportation costs.
- The evaluation of coal/lignite mining and in-dustrialization projects in order to determinecoal/lignite's most appropriate utilization.
- The coordination of counterpart activities inall projects designed to develop and utilizecoal or lignite.
- Technical appraisals of all coal/lignite com-bustion issues.
Cost of the Assistance - US$210,000

ANNEX 5.1
Potentially Available Energy from Crop Residues, 1979/80
Unit Annual Estimated Energy1979/1980 Energy Energy Fraction PotentiallyProduction Residue h/ Residue c/ Content Content of Residue Available
Crop ('000 tonnes) Coefficients ('000 tonnes) (kcal/kg) ('000 toe) e Available ('000 toe)
Millet 1262.6 1.5i3.0 a! 2841 3700 1030.58 0 0Sorghum 367.9 0.5*0.85 248 3700 90.0 0 0Cowpeas 266.3 1*2 a! 400 3700 144.9 0 0Cassava 162.0 0.1*0.2 a 24 3700 8.9 0.5 4.5Groundnuts 126.1 0.33 42 4500 18.5 1.0 18.5Sugar Cane 113.1 0.13d0.25 21 5150 10.9 0 0Onion 107.8 0.1-0.2 a! 16 3700 5.9 1.0 5.9Rice 30.7 0.38t1.25 25 3550 8.8 0 0Sweet Potatoes 16.9 0.1*0.2 a! 3 3700 0.9 1.0 0.9Voandzou 11.4 0.15D0.30 3 3700 0.9 1.0 0.9Corn 10.0 0.55:1.20 9 3700 3.2 0.5 1.6
Totals 2468.8 3630 1323.48 32.3
a/ Estimated.b/ From Methane Generation from Human, Animal, and Agricultural Wastes, National Academy of Sciences,
Washington, D.C., 1977, unless marked as estimated.c/ Midpoint of range of residue coefficients used.d/ Average value from Energy from Biological Processes, Office of Technology Assessment, Washington, D.C.,
1980, except in the case of groundnuts (mission estimate from SONARA data) and of sugar cane and rice(from C. W. Hall, Biomass as an Alternative Fuel, Government Institutes, Inc., August 1981).
e 1.00 toe = 10.2 million kcal.
Source: World Bank mission estimates based on various source.

ANNEX 5.2
Potentially Available Energy from Animal Waste, 1981
Quantity of Number Total a/ Volume of b/ Total Energy /Number of Waste per 500 of Animals Quantity of Biogas per Potential PotentialAnimals kgm of Animal Per 500 kgm Waste Produced kgm of Waste Methane Energy AvailableAnimal (millions) (tonnes/year) of Animal (million tonnes/yr) (i 3 ) % ('000 toe/yr.) ('000 toe/yr)
Cattle 3.42 14.0 1.2. 2.2 21.8r40.0 0.3 60 464k 860 1864346Sheep 3.19 7.3 10.0*16.7 1.4- 2.3 0.3 64 34' 51 17a 25Coats 7.12 8.0 12.5*25.0 2.34 4.6 0.3 60 51- 101 25' 42Camels 0.40 9.5 1.1* 2.3 1.7* 3.5 0.3 60 34' 76 17A 34Horses 0.28 10.2 1.2- 2.5 1.1* 2.4 0.3 60 25- 51 8^ 25Donkeys 0.48 9.1 1.3* 2.6 1.7* 3.4 0.3 60 344 76 17' 34
Totals 14.89 30.0*.56.2 64241,215 d/ 270i506 e/ U
a/ Includes water contained in the waste.b/ Volume of biogas produced per kgm of solid waste.c/ Excludes animals in roaming herds.d/ Average value: 929,000 toe/year.e/ Average value: 388,000 toe/year
Source: Ministere du Developpement Rural.

- 76 -
ANNEX 5.3
Production and Transportation Cost of Groundnut Shell BriquettesYear 1981/82
(FCFA per metric ton)
Packing 4,500 (180 F per 40 kg bag)
Energy 3,535
Fire Insurance 429
Oil and Lubricant 503
Maintenance, Repair 407
Loading Costs 250
Permanent Staff 1,142
Temporary Staff 5,633
Financial Costs 126
Amortization Costs 5,652
22,177 F per ton = 50,290 F/toe
Transportation 3,911
26,088 F/ton (delivered in Niamey) =
59,169 F/toe
Source: SONARA

- 77 -
ANNEX 6.1
Gross Electricity Consumption, 1963-82 a/(GWh)
Other Of which Total Mining TotalNiamey Centers Maradi NIGELEC Companies Niger b/
Year I II & Zinder III = I + II IV III + IV
1963 12,44 2,07 c/ 2,07 15,51 15,511964 14,29 2,78 d/ 2,66 17,07 17,071965 15,73 3,08 2,84 18,81 18,81
1966 19,21 3,67 3,33 22,88 22,881967 21,11 4,00 3,62 25,11 25,111968 24,59 4,67 e/ 4,17 29,26 29,261969 28,52 4,94 4,19 33,46 33,461970 33,39 5,27 4,41 38,66 38,66
1971 36,23 5,68 4,71 41,91 41,911972 43,16 6,50 5,51 49,66 17,00 66,661973 48,91 7,77 fI 6,22 56,68 17,90 74,581974 50,76 8,50 - 6,32 59,26 18,80 78,061975 53,48 10,43 g/ 6,00 63,91 21,50 85,41
1976 60,09 16,93 h/ 7,02 77,07 29,90 106,971977 64,31 21,08 - 9,19 85,39 38,40 123,791978 75,08 26,17 i/ 11,78 101,25 63,16 164,411979 87,37 34,57 jI 15,56 121,94 91,70 213,641980 107,89 41,72 kI 19,21 149,61 95,70 245,31
1981 118,26 50,63 21,60 168,891982 1/ n.a. n.a. n.a. 183,20 73,00 m/ 256,20
a/ Production alternator terminals, plus purchases.S/ Does not include own generation by businesses other than the Mining
Companies Somair and Cominak.c/ Maradi et Zinder.J/ Plus Agadez.e/ Plus Tahoua.TI Plus Dosso.R/ Plus Filingue.h/ Plus Konni and Malbaza.T/ Plus Magaria and Doutchi.
Plus Tessaoua and Madoua.k/Plus Diffa.
I/ Preliminary figures, of which some are not available (n.a.).m/ Supply by NIGELEC only. Does not include minor amount of own generation
by mining companies.
Source: Ministry of Public Works and Urbanism, (Ministre des Travaux Publicset de l'Urbanisme), Survey of Electricity Pricing in Niger, Ingen-ieurbiiro Oskar von Miller GmbH, December 1982; NIGELEC; Mining Com-panies.

- 78 -
ANNE 6.2
Electricity Produced and Sold by Voltage Level,for all of NIGELEC, 1974-1982
1974 1975 1976 1977 1978 1979 1980 1981 1982 a/
Enery Produced b/(GWh) 59,1 61,9 64,9 26,9 45,4 40,0 38,2 41,6 50,3
Energy Purchased(QWh) 0,2 1,2 12,3 60,2 55,7 81,9 111,4 169,2 214 4
Tctal: Productionplus Purchases(GWh) 59,3 63,1 77,2 87,1 101,1 121,9 149,6 210,8 264,7
nergy deliveredto Netwo-rk(CWh) 57,4 61,1 75,3 84,5 92,0 117,0 143,6 202,4 n.a.
Eergy sold(GSh) 51,2 54,8 68,8 83,7 88,6 90,8 129,7 188,9 237,4
- in MediumVoltage (GWh) 28,2 30,2 38,4 41,6 46,3 51,6 69,1 122,2 c/ n.a.
- in LcwVoltage (GWh) 23,0 24,6 30,4 42,1 42,3 39,2 60,6 66,7 n.a.
Numiber of Consumers- 147 133 168 199 214 241 280 335 396•c n.a.- LT 11880 13840 16425 20358 24518 27814 32929 35228 n.a.
Energy Sold perconsuner
- MV (/cons.) 212 180 193 194 192 184 206 309 c/ n.a.- LV (KWh/cons.) 1936 1777 1851 2068 1725 1409 1840 1893 n.a.
a/ Preliminary figures, of wfhich sane are no available (n.a.).b/ At altermtor tenninals.c/ Including Yining Canpanies: two corsumers who, together, bcught 42 GWh in
1981 and 73 GW in 1982. When these two consuurs (who shoald be itenizedunder HV) are not included, the other MV consumers bave boxght an average of204 2h/cons.
Source: Ministry of Public Works and Urbanism, Survey of Electricity Pricing inNLY r, TIgenieurb<Uro Oskar von Miller, CmIR, Decemner 1982.

ANNEX 6.3
NIGELEC: Generation, Sales and Losses by Load Center, 1977a81
1977 1978 1979 1980 1981Net Gen. Net Gen. Net Gen. Net Gen. Net Gen.
+ Purchases Sales Losses + Purchases Sales Losses + Purchases Sales Losses + Purchases Sales Losses + Purchases Sales LossesLoad Center MWh MWh Z MWh MWh % MWh MWh % MWh MWh % MWh MWh Z
NiameytLossa 63,746 60,680 4.8 72,868 66,057 9.3 83,322 65,270 21.7 107,293 96,226 a/ 10.3 117,711 104,187 11.5Tilabery t 222 * 512 474 7.4 789 724 8.2 1,089 1,074 1.4
Dosso 910 738 18.9 1,332 1,253 5.9 1,856 1,743 6.1 2,399 2,240 6.7 2,437 2,421 .6
Filingue 58 39 32.8 99 69 30.3 134 115 14.2 155 130 15.6 217 181 16.6
Doutchi r * * 124 93 25.0 252 221 12.3 324 298 8.0 388 372 4.1
Konni 137 104 24.1 332 263 20.8 489 420 14.2 793 730 8.0 935 924 1.2
Madacua It t 12 3 75.0 182 178 2.2 333 273 18.0 499 443 11.2
Tahoua 1,163 1,040 10.6 1,723 1,504 12.7 2,305 1,844 20.0 2,896 2,542 12.2 3,341 2,247 32.7
Malbaza b/ 6,103 6,103 t 5,640 5,640 * 6,013 6,012 4 5,970 5,363 10.1 6,150 4,966 19.3
Maradi 4,090 3,527 13.8 5,467 4,664 14.7 7,615 5,359 29.6 9,195 7,347 20.1 9,586 8,264 73.8
Tessaoua * t t 300 245 18.3 417 364 12.7 516 447 13.3 796 548 31.2
Zinder c/ 5,168 4,350 15.8 5,911 5,041 14.7 7,386 5,494 25.6 9,510 6,539 31.3 11,652 8,005 31.3
Magaria 121 98 19.0 242 137 43.4 294 274 6.8 313 328 319 310 2.8
Arlit 1,561 1,503 3.7 1,561 1,548 0.8 2,980 2,919 2.0 4,421 3,624 18.0 5,613 d/5,077 9.5
Agadez 1,489 1,349 9.4 2,423 1,877 22.5 3,136 2,553 19.6 4,411 2,903 34.3 4,030 3,459 14.2
Tanout T * * t t v 46 39 15.2 69 35 49.0 286 217 24.1
Diffa * _ f ^ _ 4 * * * 197 169 14.3 979 828 15.4
Total 84,546 79,531 5.9 98,034 88,616 9.6 116,839 93,279 20.2 149,557 130,510 12.7 166,028 143,523 13.6
a/ NiameytLossa Sales in 1980 taken from Compte Rendu de Gestion 1980. Compte Rendu d'Activite shows only 88,419 MWh.b/ Malbaza Generating Station supplied exclusively the cement plant (at high voltage) until 1980.c/ Statistics for Zinder include Mirriah and Matameye.d/ Estimated.
Note: Purchased power delivered at substations (i.e. transmission losses excluded).
Source: NIGELEC: Compte Rendu d'Activite 1979, 1980, 1981Compte Rendu de Gestion 1978.

- 80 -
ANNEX 7.1
SNTN: Specific fuel consumption, October 1977-September 1981
Period
Oct. 1977 - Oct. 1978 - Oct. 1979 - Oct. 1980 - % Change between
Sept. 1978 Sept. 1979 Sept. 1980 Sept. 1981 Oct. 1977-Sept. 1981
Mileage
(million km) 17.383 21.739 26.657 20.004 +15.1
Fuel Cost
(FCFA/km) 41.58 43.28 54.10 56.40 +35.6
Average Gasoil Price
(FCFA/1) 75.04 77.25 96.77 130.06 +73.3
Specific Gasoil
Consumption (I/km) 0.554 0.560 0,559 0.434 -21.7
Source: SNTN

- 81 -
ANNEX 7.2
Hydrocarbon Price Structure in Niamey in March 1983(Shipped through Benin)
(CFAF/hl unless otherwise indicated)
Premium RegularGasoline Gasoline Kerosene Gasoil
FOB price (Cotonou)Price ex-Parakou depot 10,430.20 10,627.76 10,468.64 10,558.45Road transport PKou-
Niamey 1,501.00 1,368.50 1,368.50 1,368.50c.i.f. price Niamey
(not cleared customs) 11,931.20 11,996.26 11,837.14 11,926.95c.i.f. price Niamey 11,811.89 11,864.30 11,777.95 11,903.10Statistical tax 15.05 11.13 14.38 14.49Customs duty 60.18 60.52 57.52 11.59Entrance tax 589.20 589.80 57.52 394.80Production tax 329.22 330.37 183.21 260.12Specific tax 1,800.00 1,800.00 900.00 700.00Transport costs to
Niamey depot 128.10 128.10 128.10 128.10Tax on transfer costs 19.14 19.14 19.14 19.14Loss Niamey depot 128.06 128.60 90.68 94.38Loss transport and transfer 58.09 58.72 56.40 57.86Amortization, maintenance of
equipment 467.92 150.00 115.00 50.00Overhead expenses 400.00 380.00 350.00 245.00Financial costs 568.77 570.59 514.42 525.09Profit 170.00 110.00 115.00 90.00Transit "HAD" 106.33 105.93 91.47 104.47Retailer's margin 600.00 600.00 500.00 500.00Delivery costs to Niamey city 100.00 100.00 100.00 100.00
TOTAL 17,351.95 17,007.20 15,070.79 15,198.14
Stabilization 2,648.05 1,688.80 -2,570.79 1,001.86Sales price (CFAF/hl) 20,000.00 18,700.00 12,500.00 16,000.00
Sales price at the pumps(CFAF/l) 240 225 135 170
Source: SONIDEP

- 82 -
ANNEX 7.3
Current NIGELEC Prices for Public Supply of Electricity(Valid since October 1983)
Fixed Power Active Energy F/kWh Isolated Reactive EnergyTariff Charge Charge of Interconnected Network Centers (0.75E)
(F/month) (F/kW/month) March-Oct. Nov.-Feb. (F/kVArh)
P 100.1 72.8K-11 HV General 91,000 910 Int 27.4 23.6 45.1 8.5
OP 24.6 20.8 37.0
K-12 HVHeavy User 91,000 2,366 32.0 28.2 38.1 8.5
P 103.5 - 75.3
K-21 MV General 9,100 910 Int 34.5 30.1 39.2 8.5OP 28.1 23.8 38.0
K-22 MVHeavy User 9,100 2,548 36.5 32.1 39.2 8.5
P 107.7 - 90.0
K-31 LV Hourly 1,820 182 Int 68.0 63.0 69.0 -OP 32.5 27.5 39.4
K-33 a/ LVHeavy User 910 546 58.6 58.6 58.6 -
K-33 a/ LVLight User - 91 66.8 66.8 66.8 -
K-34 Public Lightingwith meter - 10,920 31.3 31.3 31.3 -
without meter - 22,345 - - -
a/ For general public prices, see table below.
Low Volatage Tariffs, General Public
K-33 Light Users K-32 Heavy UsersBilling Code Fixed Charge Active Energy Fixed Charge Active Energy
(F/month) (F/kWh) (F/month) (F/kWh)
K-331, K-321 3 kW 273 66.8 2,548 58.6K-332, K-322 6 kW 546 66.8 4,186 58.6K-333, K-323 12 kW 1,092 66.8 7,462 58.6K-334, K-324 18 kW 1,638 66.8 10,738 58.6K-335, K-325 30 kW 2,730 66.8 17,290 58.6
Price (P = Peak From March to October: 4.5 hrs/dayCategories (Int = Intermediate All the time except P and OP
(OP = Off-peak 12 hours a day, all year round
List of Abbreviations
HV : High Voltage 66-132 kV Int : Intermediate hours - 8 am toMV : Medium Voltage 5.5-15-20 kV 1 pm and 3 pm to 10 pmLV : Low Voltage 220-380 V (except peak hours).P : Peak from March to October OP : Off-peak hours - 10 pm to
10:30 am to 12:30 pm; 8 am and 1 pm to 3 pm.3:30 pm to 6:30 pm. Active Energy:
Energy produced and actuallyconsumed.
Reactive Energy:Energy produced but not -^n-
sumed.

- 83 -
ANNEX 7.4
Electricity Pricing: Reference Tariff Structure Computed from Marginal
Costs Estimates for the Period 1985-90
Fixed Power Active Energy Reactive Energy
Charge Charge Price Price
Tariff (F/month) (F/month/kW) Hour Category (F/kWh) (F/kVarh)
K-11: HV General 100 000 1 000 Peak 84.00 + VI 8.40
Intermediate 3.00 + VI
Off-peak VI
K-12: HV Heavy User 100 000 2 600 Unique 8.10 + VI 8.40
K-13: HV Interruptible 100 000 2 600 Unique 2.40 + VI 8.40
K-21: MV General 10 000 1 000 Peak 84.00 + V2 8.40
Intermediate 7.00 + V2
Off-peak V2
K-22: MV Heavy User 10 000 2 800 Unique 9.20 + V2 8.40
K-23: MV Interruptible 10 000 2 800 Unique 2.80 + V2 8.40
K-31: LV Hourly 2 000 200 Peak 84.00 + V3
Intermediate 39.00 + V3
Off-peak V3
K-32: LV Heavy User 1 000 600 Unique 30.00 + V3
K-33: LV General - 100 1/ Unique 39.00 + V3
K-34: Public - 12 000
Lighting + 365 V3
Variable Price Component:
NIAMEY Other
March-Oct. Nov-Feb Centers
VI 39.454 14.723 41.760
V2 42.886 16.004 45.391
V3 40.077 50.156
a/ Minimum Billable: F 300.
Source: Ministry of Public Works and Urbanism, Survey of Electricity Pricing in Niger,
Ingenieurburo Oskar von Aiii , GmbH, December 1982.

- 84 -
ANNEX 8.1
Technical Assistance in Energy Planning: Job Descriptionfor the Technical Advisor
Training and Experience - Economist with energy specialization.10 -15 years experience required, ofwhich at least 5 years in research,project evaluation and energy sectorplanning. An experience in the planningdepartment of a public administrationwould be particularly appreciated. Ex-perience in Africa would be useful butis not required.
Length of Mission - 24 months.
Location - Niamey
Title - The expert will be the energy advisor tothe Ministry of Mining and Industry.
Job Description - To contribute to the planning process ofthe whole energy sector as a whole, inparticular with respect to (1) the regu-lar drafting of demand projections forall types of energy within the frameworkof the country's economic development(2) the study of ways of meeting the de-mand, including the evaluation of in-vestments to create new capacities;(3) the setting up of a system to cen-tralize all relevant statistics on theenergy sector.
- To provide methodological support in theeconomic analysis of projects in allenergy sectors. To evaluate economicstudies on pricing and financing policy.
Cost of TechnicalAssistance - US$290,000.

ANNEX 8.2
NIGELEC's Investment Program, Formulated in July 1982
(in million CFA Francs, current values)
Total 1982 1983 1984 1985 1986 1987 1988 1989 1990
Gas Turbine 12 MW, Niamey 2 1600 1600
SONICHAR Station 300 300
Niamey - Say Line 1600 560 900 200
Goudel Power Station 2 x 12 MW 7700 4400 2800 500
Maradi Power Station 2 x 1,1 MW 500 300 200
Malbaza Power Station 2 x 1,1 MW 500 300 200
Niamey Dispatching 370 40 110 220
Maibaza-Tahoua-Madaoua
Interconnection 1850 1200 650
Goudei Power Station
(ext 1) 1 x 12 MW 5000 2000 3000
Maradi Power Station 00
(ext) 1 x 1,1 MW 450 250 200 U'
Goudel Power Station
(ext 2) 1 x 12 MW 6000 2500 3500 1/
Miscellaneous Investments 8250 600 700 800 900 1050 1200 1400 1600
Total 1 34120 3600 6040 5710 2670 3050 4450 4100 5100
NIGELEC Building 5600 100 2500 2500 500 - -
Total 2 39720 3000 6140 8210 5170 3550 4550 4100 5100
a/ Another generator will be necessary In the Goudel Station by 1990.
Note: Monetary value increases assumed: 12% per year. In 1982 CFA, the total cost of the program is Million
Francs 19,800 for total I and Million Francs 24,000 for Total 2.
Source: NIGELEC.

ANNEX 8.3
Outline of an Indicative National Energy Balance for 1990(tonnes of oil equivalent) a/
Agricul+ Petroleum Products b/
Crude tural ElectrilLine Hydro Oil Coal Residues c/ Fuelwood Charcoal city e/ Gasoline f Kerosene Gas Oil Fuel Oil Total Line Totals Line
Gross Supply1 Production 41,605 310 1,078,230 1,120,145 12 Import 37,100 61,300 5,900 186,800 4,500 258,500 295,600 23 Total Available 41,605 310 1,078,230 37,100 61,300 5,900 186,800 4,500 258,500 1,415,745 3
Conversion4 Charcoal Production (3,124) 3,124 0 4 15 Electric Power °'
Generation (41,605) 148,400 (106,795) (106,795) 0 56 Conversion Losses (14,882) (126,140) (141,022) 6
7 Transmission/Distri-bution Losses (6,500) (6,500) 7
8 Net Supply Available/NetDomestic Consumption 310 1,060,224 3,124 52,860 61,300 5,900 80,005 4,500 151,705 1,268,223 8
Note: This projection presents the situation in Niger in 1990, without any change in Nigerien energy consumption habits and without the development of new domestic
sources of energy.
a/ All conversion factors are the same as those used in the National Energy Balance for 1981 (Annex 1.1 of this report).
b/ Excluding butane and jet fuel. Demand projections as in Table 3.2 of this report, except in the case of kerosene. The projections in this annex do not allowfor any substitution of kerosene for fuelwood in cooking.
c/ Groundnut shells only.d Demand projections as in Table 2.2 of this report, based on a consumption of 0.75 m
3/capita/year.
e/ Demand projections as in Table 6.2 of this report.f/ Premium, regular and aviation gasolines.
Source: Bank Staff estimates.


IBRD 17253\ALGERIA LIeA4 '8 \, 'r IA' IO U,,E 1083
MAURITANIA - \ 7 .
I , L B Y
~k8oy jMAN NI G E R
ENEGYREOURESAN
GlOrIA 518 ~ ( .. 1 D.5,i (D-1p.d
MSINGFR92STRUCEDTURE9 PONE PLANTS
-Is- Petroleum Pnd dSt.-PI-
EM ~~~Hydro JU,d,r, SIAdy)
TRANSMISSION LINES: O 71r JIA P'IRhflt
132 hr A, ,I.le -- -20ko
le-10
- Ped Rood,, AGADf - E oRthEodr
DIAAEt p 0 50 LO. is 4b 3r__ .7
MILES 0 35 l00 150 -/
M A L I GLr uoro /Ek f N'c-'.j~~~~~~~~~
T,4> Crrr8 DI E, L,,......r
tArorlrrd, -~~~~~~~~~~~~~~~~~~~ 5L0IAIrOM ~ ~ ~ ~ ~ ~ 1 -.-
U..OU.4AILIA.. ~ ~ ~ ~ K.
N I G E R I A
' -B E N I N''M~


0- 2 4° 6° 8 10' 14-
NIGER A L G E R I A LIBYAE N E R G Y A S S E S S M E N T ANNUAL FUELWOOD PRODUCTION 'FUELWQOD AVAILABILITY PERHECTARE OF NATURAL FORFST COVERFUELWOOD AVAILABILITYYENNULETVIAE
MEAN ANNUAL 3NET AVAI LAB LEINCREMENT(m
3I INCREMENT (m
3)
-22° Desertic and Subdesertic Zone 0 20 001 . .. 22Underpopulnted Sahelian and Sudano 020 0.04
v Sahelian Zone ..-
Understocked and overpopulated 0.39 016Savanna Zone
Understocked and becoming 0.43 0.26overpopulated Savanna Zone NATIONAL 0009
-20 ° AdministrOtive District Headquarters * 0.2 20-(3 Department Capitals
Q National Capital / .Administrative District Boundaries
-. . - Department Boundaries r IBilmia_._ International Boundaries
200-.., Isohyets in Millimeters, per Year
50d 100 1b0 200 2 0KILOMETERS
-o/r~d8wiads 1 Innrn _ / _ x D016'
MA L I CH r C H A D
~~~~~~~~~~~~~ oTa _lnpouV LA \l§ N IU Em H\ )Iz ,r
//7n /oundarlr / *\ JGQY N {7r
<~~~~~~~. BENINdoo INOE .. . -gMRONAs
-foo A;L IB-C uLo Source: FAO R 261mi\
TTa,rraphe~~~~~~parhePp &p- B,rcp~~~~~~~o MAAD(L Igue' -' Y A> '
The OPheP,r* SayO~~~~~~~~~~~~~~~~~~a
A ~ ~ ~ ~ ~ ~ ~ ~ ~ ~ ~ ~ ~ ~ ~ ~ ~ A heed ard Ire brJvrpar,esshrJ,errgoBimmK070rrrraS,r,pdOrrOI,rhep. or Dhgonoetch
1,000000,, GULF OF CAMEROONCA~~~~~~~~~~~~~~~~~~~~~~~~~~~~~~~~~~~~~~~~NIM Y A
Source: TAD Roe198 8 1 12nin-Gooure ~ ~ ~ ~ ~ ~ ~ ~ ~ ~ ~ ~ ~ ~ ~ ~ ~ ~ ~ ~ ~~OGUNA--