Embed Size (px)
Citation preview

Document of
The World Bank
FOR OFFICIAL USE ONLY {1 Ž ;-iS'
Report No. 4700-MA
STAFF APPRAISAL REPORT
MALAYSIA
ELEVENTH POWER PROJECT
May 17, 1984
Projects DepartmentEast Asia and Pacific Regional Office
This document has a restricted distribution and may be used by recipients only in the performance oftheir official duties. Its contents may not otherwise be disclosed without World Bank authorization.
Pub
lic D
iscl
osur
e A
utho
rized
Pub
lic D
iscl
osur
e A
utho
rized
Pub
lic D
iscl
osur
e A
utho
rized
Pub
lic D
iscl
osur
e A
utho
rized
Pub
lic D
iscl
osur
e A
utho
rized
Pub
lic D
iscl
osur
e A
utho
rized
Pub
lic D
iscl
osur
e A
utho
rized
Pub
lic D
iscl
osur
e A
utho
rized

CURRENCY EQUIVALENTS
Calendar 1983 February 1984
Currency Unit = Ringgit (M$) M$US$1.0= M$2.30 M$2.30M$1.0 US$0.435 US$0.435
FISCAL YEAR
NEB: September 1 - August 31
Government: January 1 - December 31
WEIGHTS AND MEASURES
1 cubic meter (cu m) = 35.31 cubic feet (cu ft)I hectare (ha) = 2.47 acres (ac)1 meter (m) = 3.28 feet (ft)
1 square kilometer (sq km) = 0.386 square miles (sq mi)1 kilogram (kg) = 2.205 pounds (lb)I metric ton = 1,000 kilograms (kg)1 cubic meter per second (cms) = 35.31 cubic feet per second (cfs)1 kilovolt (kV) = 1,000 volts (V)1 Megavolt-ampere (MVA) = 1,000 kilovolt-amperes (kVA)1 kilovolt-ampere (kVA) = 1,000 volt-amperes (VA)I Megawatt (MW) = 1,000 kilowatts (kW)1 Gigawatt hour (GWh) = 1 million kilowatt hours (kWh)1Kilocalorie (kcal) = 3.968 British thermal units (Btu)
ABBREVIATIONS
EPU - Economic Planning Unit, MalaysiaETP - Ministry of Energy, Telecommunications and PostsLRMC - Long Run Marginal CostNEB - National Electricity Board of the States of MalayaPETRONAS National Petroleum AgencyPRHE - Perak River Hydroelectric Power Company, Ltd.RE - Rural ElectrificationSEB - Sabah Electricity Board
SESCO - Sarawak Electricity Supply Corporation

FOR OFFICIAL USE ONLY
MALAYSIA
ELEVENTH POWER PROJECT
Table of Contents
Page No.
LOAN AND PROJECT SUMMARY
I. ENERGY AND THE POWER SECTOR . . . .1.............................. Overview ....Energy Resources .... IOil ....Gas ....Coal. ... 2Hydro Power... 2The Power Sector.... 2Access to Electricity. . . . 2Sector Organizationn... ....... 3Sector Issues and Bank Role. . . . 3Experience with Past Loans. . . . 4
TI. THE BORROWER. 5Organization, Management and Operation . . 5Manpower and Training... 6Accounting and Budgeting. . . 6Billing and Collection . ..... .7
Audit and Internal Control. . . 7Taxation.... 7Dividends... 8Insurance... 8
III. THE POWER MARKET AND THE DEVELOPMENT PROGRAM .... 8Historical Trendrend.. . ... 8Load Forecast ...... 8Present Generating Capacity ..... 8Generation Expansion Program..... 8Long Range Plan . ..... 9Transmission ....... 9Distribution...... 9Rural Electrification ..... 10
IV. THE PROJECT.... 11Objectives .... 11Project Description . . . .11
This report was prepared by Messrs. V.P. Thakor and J. Chang on the basis ofan appraisal conducted in June 1983.
This document has a restricted distribution and may be used by recipients only in the performance oftheir official duties. Its contents may not otherwise be disclosed without World Bank authorization.

- ii -
Page No.
Transmission Lines and Substations ......................... 12Distribution . . ............................................. 12Training Simulator . ...................... 13Computer System for Accounts .............................. . 14Cost Estimate .... 14Engineering and Construction .... 14Consulting Services .... 14Procurement .... ... 15Implementation Schedule ................................... . 16Financing Plan .... 16Disbursement .... 17Monitoring and Reporting .... 17Ecology ..... 17
V. TTHE FINANCIAL ASPECTS .. 17Past Operating Results ................... 17Comparative Financial Position .. 19Tariffs ..... 20Financing of Development Program .. 20Future Financial Performance ............................. 21Self Financing Ratios ...................................... 22Other Financial Covenants .. 23
VI. JUSTIFICATION .. ................ 23Economic Rate of Return .. 24Risks ...................................................... 24
VII AGREEMENTS TO BE REACHED AND RECOMMENDATIONS ................. 24Agreements to be Reached ........................ 24Recommendations ............................................ 25
- iii -
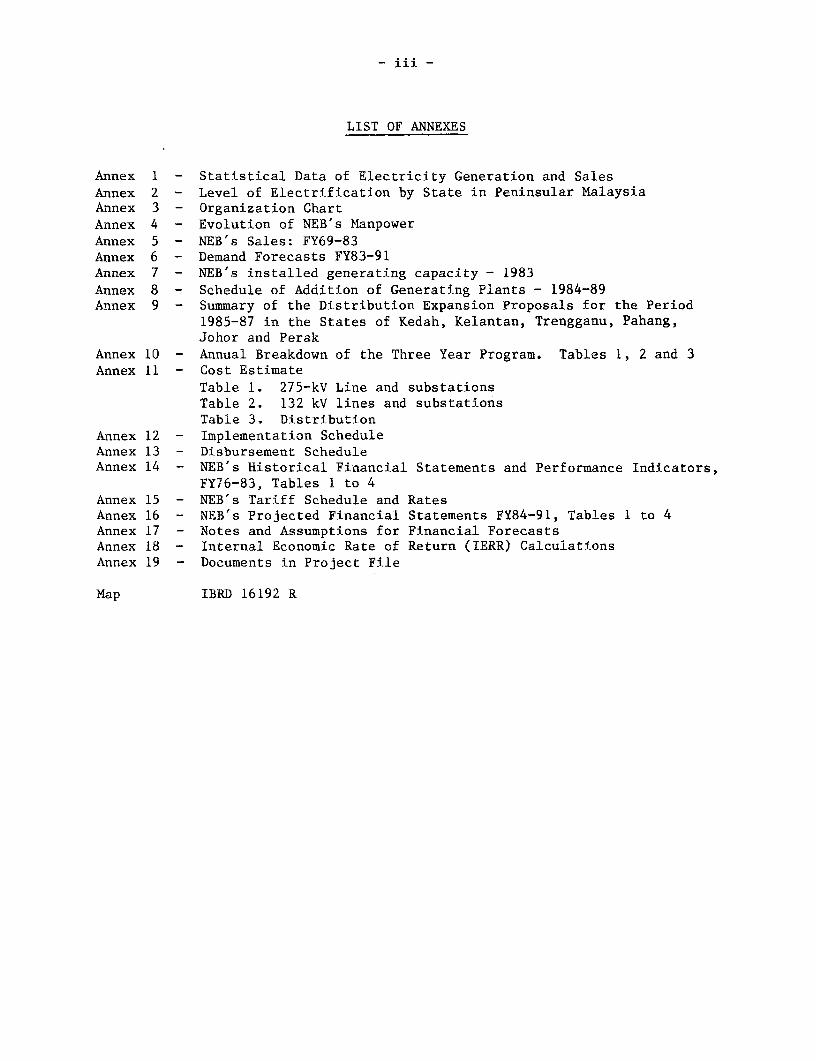
LIST OF ANNEXES
Annex 1 - Statistical Data of Electricity Generation and SalesAnnex 2 - Level of Electrification by State in Peninsular MalaysiaAnnex 3 - Organization ChartAnnex 4 - Evolution of NEB's ManpowerAnnex 5 - NEB's Sales: FY69-83Annex 6 - Demand Forecasts FY83-91Annex 7 - NEB's installed generating capacity - 1983
Annex 8 - Schedule of Addition of Generating Plants - 1984-89Annex 9 - Summary of the Distribution Expansion Proposals for the Period
1985-87 in the States of Kedah, Kelantan, Trengganu, Pahang,Johor and Perak
Annex 10 - Annual Breakdown of the Three Year Program. Tables 1, 2 and 3Annex 11 - Cost Estimate
Table 1. 275-kV Line and substationsTable 2. 132 kV lines and substationsTable 3. Distribution
Annex 12 - Implementation ScheduleAnnex 13 - Disbursement ScheduleAnnex 14 - NEB's Historical Financial Statements and Performance Indicators,
FY76-83, Tables 1 to 4Annex 15 - NEB's Tariff Schedule and RatesAnnex 16 - NEB's Projected Financial Statements FY84-91, Tables 1 to 4Annex 17 - Notes and Assumptions for Financial ForecastsAnnex 18 - Internal Economic Rate of Return (IERR) CalculationsAnnex 19 - Documents in Project File
Map IBRD 16192 R

MALAYSIA
ELEVENTH POWER PROJECT
Loan and Project Summary
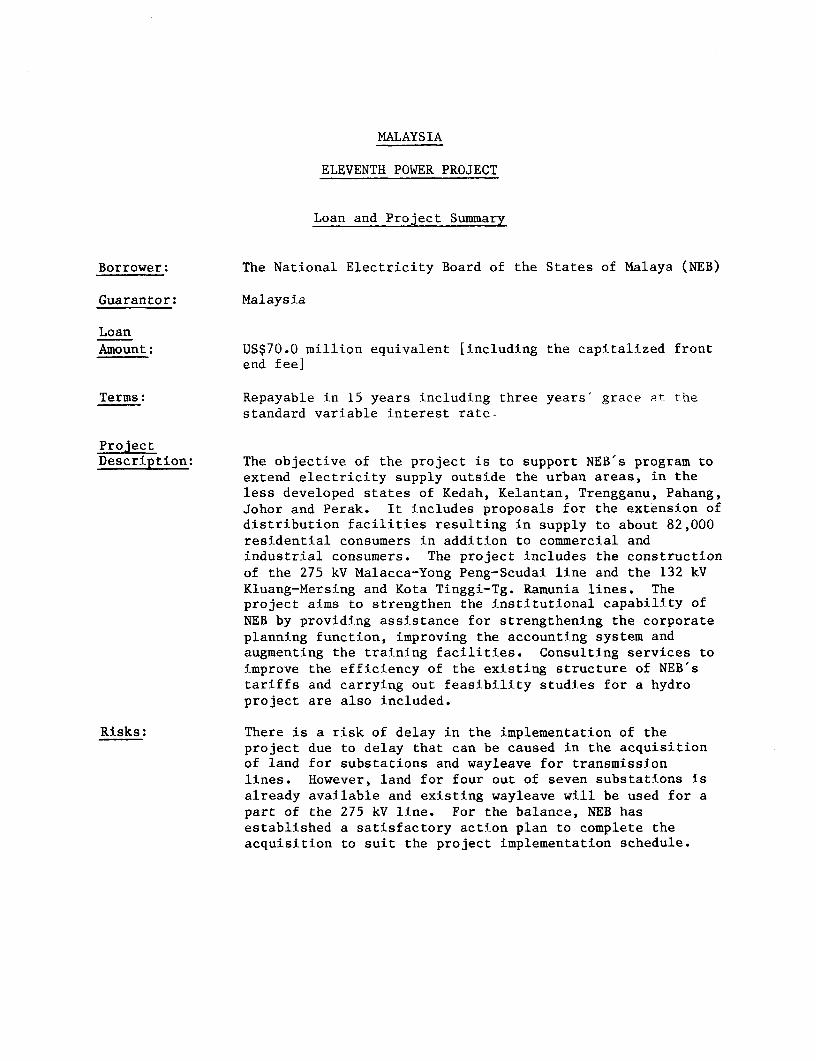
Borrower: The National Electricity Board of the States of Malaya (NEB)
Guarantor: Malaysia
LoanAmount: US$70.0 million equivalent [including the capitalized front
end fee]
Terms: Repayable in 15 years including three years' grace Pt thestandard variable interest rate-
Pro jectDescription: The objective of the project is to support NEB's program to
extend electricity supply outside the urban areas, in theless developed states of Kedah, Kelantan, Trengganu, Pahang,Johor and Perak. It includes proposals for the extension ofdistribution facilities resulting in supply to about 82,000residential consumers in addition to commercial andindustrial consumers. The project includes the construction
of the 275 kV Malacca-Yong Peng-Scudai line and the 132 kVKluang-Mersing and Kota Tinggi-Tg. Ramunia lines. Theproject aims to strengthen the institutional capability ofNEB by providing assistance for strengthening the corporateplanning function, improving the accounting system andaugmenting the training facilities. Consulting services toimprove the efficiency of the existing structure of NEB'stariffs and carrying out feasibility studies for a hydroproject are also included.
Risks: There is a risk of delay in the implementation of theproject due to delay that can be caused in the acquisitionof land for substations and wayleave for transmissionlines. However, land for four out of seven substations isalready available and existing wayleave will be used for apart of the 275 kV line. For the balance, NEB hasestablished a satisfactory action plan to complete theacquisition to suit the project implementation schedule.
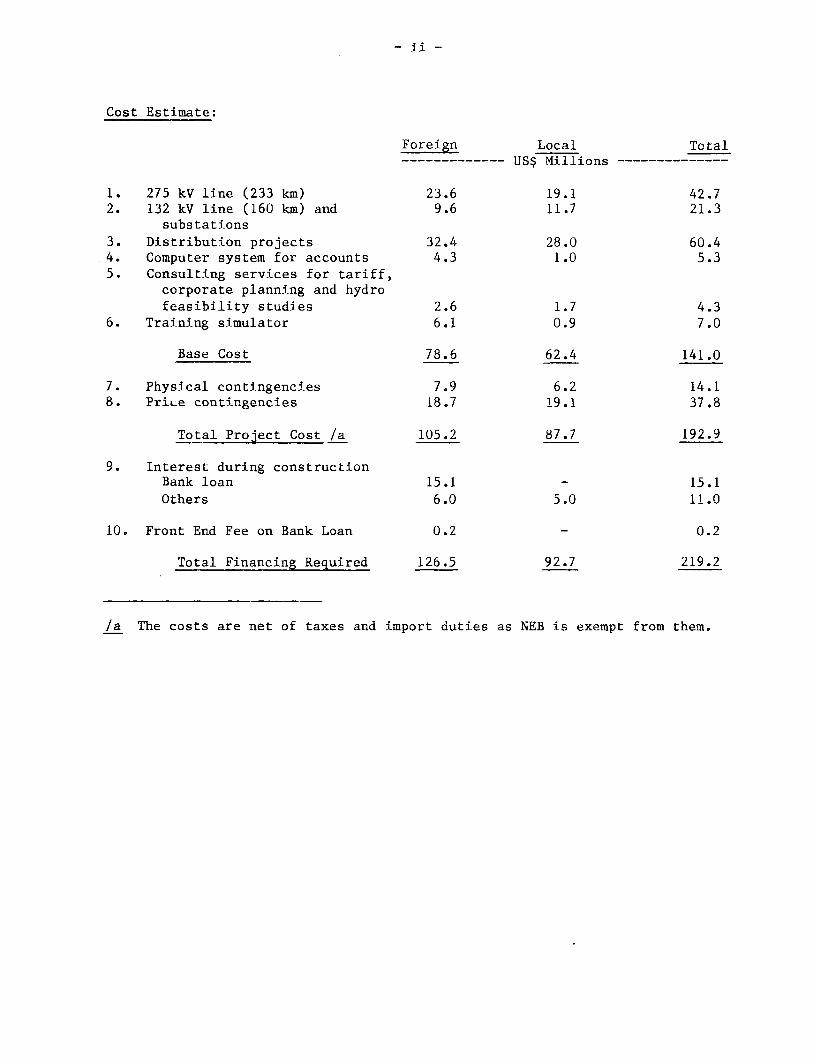
Cost Estimate:
Foreign Local Total------------- US$ Millions --------------
1. 275 kV line (233 km) 23.6 19.1 42.72. 132 kV line (160 kin) and 9.6 11.7 21.3
substations3. Distribution projects 32.4 28.0 60.44. Computer system for accounts 4.3 1.0 5.35. Consulting services for tariff,
corporate planning and hydrofeasibility studies 2.6 1.7 4.3
6. Training simulator 6.1 0.9 7.0
Base Cost 78.6 62.4 141.0
7. Physical contingencies 7.9 6.2 14.18. PriLe contingencies 18.7 19.1 37.8
Total Project Cost /a 105.2 87.7 192.9
9. Interest during constructionBank loan 15.1 - 15.1
Others 6.0 5.0 11.0
10. Front End Fee on Bank Loan 0.2 - 0.2
Total Financing Required 126.5 92.7 219.2
/a The costs are net of taxes and import duties as NEB is exempt from them.
- iii -
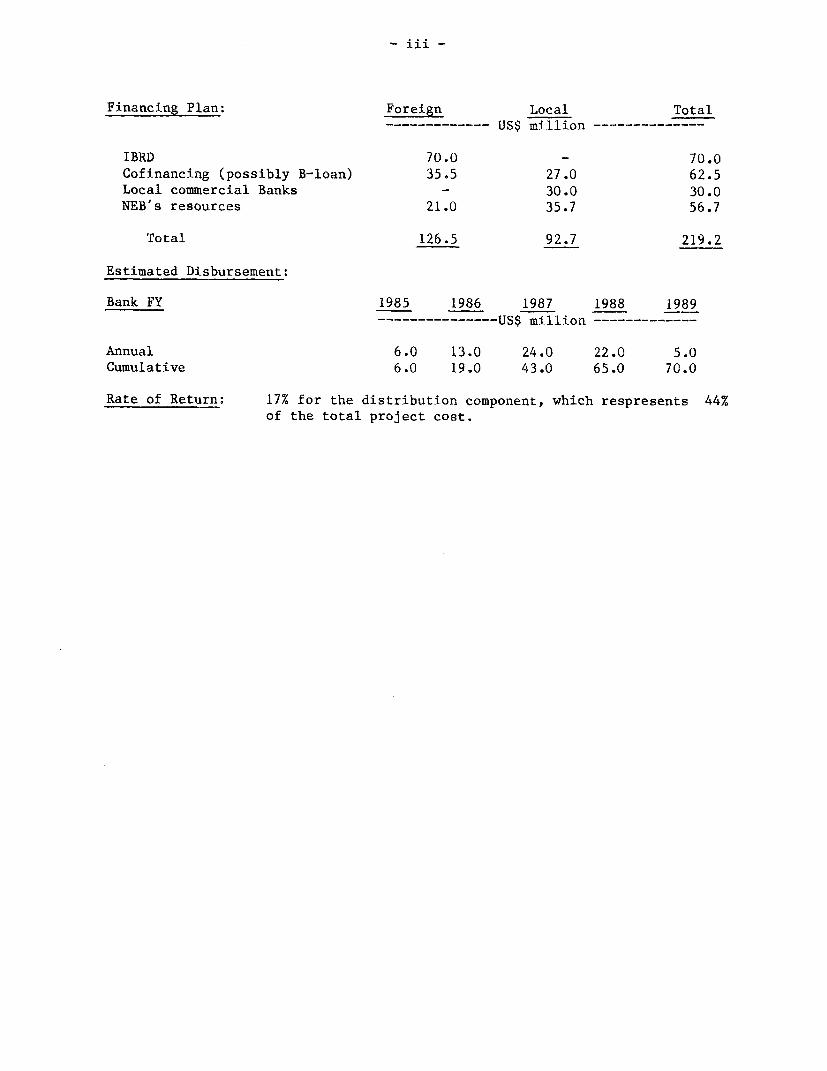
Financing Plan: Foreign Local Total…--------- US$ million --------------
IBRD 70.0 70.0Cofinancing (possibly B-loan) 35.5 27.0 62.5Local commercial Banks - 30.0 30.0NEB's resources 21.0 35.7 56.7
Total 126.5 92.7 219.2
Estimated Disbursement:
Bank FY 1985 1986 1987 1988 1989----- US$ million -------------
Annual 6.0 13.0 24.0 22.0 5.0Cumulative 6.0 19.0 43.0 65.0 70.0
Rate of Return: 17% for the distribution component, which respresents 44%of the total project cost.


I. ENERGY AND THE POWER SECTOR
Overview
1.01 With a per capita income of about US$1,840 in 1982, Malaysia is one
of the most prosperous developing countries in Asia. The real GDP grew at acompound growth rate of 7.8% during the period 1970-80; the total energy con-sumption grew at 8.6%. About 92% of the total energy consumption was met bypetroleum products, amounting to about 52.0 million barrels of oil equivalentIn 1980 (about 150,000 barrels per day). Of this 43% was used for the trans-port sector, 29% for electric power generation, 21% for industry and 7% forresidential and commercial uses. However, Malaysia is a net exporter ofoil. Substantial reserves of natural gas have also been discovered (para.1.03).
Energy Resources
Oil
1.02 Oil production in Malaysia increased from about 100,000 barrels perday (bpd) in 1975 to about 400,000 bpd in 1983. Official estimates of remain-ing recoverable reserves were 1.74 billion barrels, which are consideredconservative. Industry sources put ultimate recoverable reserves at about 3-3.6 billion barrels. Notwithstanding the higher reserves, with consumptiongrowing at 8 to 9% p.a., the country could be a net importer of oil in thenext decade if no substitution takes place.
Gas
1.03 Recoverable reserves of non-associated gas have been estimated atover 38 trillion standard cubic feet (scf), which is equivalent to about6 billion barrels of oil. There are about twenty offshore gas fields, themajority being near Trengganu. Two fields offshore in Sarawak are under
development by Shell to supply gas to the Liquefied Natural Gas (LNG) plant inBintulu, recently completed, which at peak production will yield 6 milliontons of LNG per year for export to Japan. Industrial developments includingammonia/urea plants are also planned in the Bintulu area. A gas gatheringsystem and a pipeline under construction from gas fields offshore Trengganu totransport the gas to a 900 MW combined cycle power generating plant at Pakawill be completed in 1984-86. A 50 MW gas-fired generating plant is underconstruction at Labuan island in Sabah.
1.04 A study to evolve a master plan for the long term development andutilization of gas commissioned by the Petroleum Agency in Malaysia (Petronas),has been completed./l Long term development strategy indicates a need for gaspipeline extension from the East Coast to the more populous West Coast and to
/1 Master Plan study for Gas Utilization: Chem System Inc. and DavyMckee, Ltd. Draft. Final Report. June 1982.
- 2 -
Singapore, for use of gas as a fuel in power plants. Consultants are appoin-ted for a detailed feasibility study of the gas pipelines. Use of gas fordevelopment of variouis petrochemical industries is also proposed.
Coal
1.05 Malaysia does not have significant reserves of coal. Estimates ofrecoverable coal resources, located primarily in Sarawak, are 400-500 milliontons, which are mainly of lignite type with high moisture content, Developmentactivities in the domestic coal industry are at present only at the preli-minary exploration stage. However, imported coal is proposed to be used forpower generation (para 3.05).
Hydropower
1.06 Hydro potential in Malaysia is considerable, estimated at120,000 Glh per year (more than 10 times the total electricity production in1982). However, nearly 71% of it is located in Sarawak and 16% in Sabah wheredemand is low. Present hydro capacity in Peninsular Malaysia of about 800 MW(2,700 GWh) will reach 1,200 MW by 1986 with the addition Kenyir, now underconstruction. Projects totalling over 1,000 MW are under different stages ofstudy.
1.07 In view of Peninsular Malaysia's limited hydro resources, studiesare being carried out for the exploitation of Sarawak's hydro potential forpossible transmission of bulk power to Peninsular Malaysia (para. 3.07)
The Power Sector
1.08 Power in Malaysia is supplied principally by autonomous Governmententities. The National Electricity Board of the States of Malaya (NEB) servesPeninsular Malaysia, while the Sabah Electricity Board (SEB) and SarawakElectricity Supply Corporation (SESCO) serve the two states on the island ofBorneo. Total capacity installed by these entities at end-FY83 was 2,892 MW,of which the NEB accounted for 2,610 MW. Annex-1, tables A to D give thestatistical data about electricity generation and sales in Malaysia.
1.09 Nearly 75% of the NEB's generating capacity is oil based, whichproduces about 86% of the total electrical energy. The composition of theNEB's generating capacity based on oil would be reduced from 75% at present tobelow 50% in the next 5 years due to the commissioning of hydro, gas and coalfired stations. (Annex-8). If a gas pipeline to the West Coast materializes,most of the oil-fired plants would also be converted to gas firing in the nextdecade, reducing dependence on oil for power generation to only 10% of thetotal.
Access to Electricity
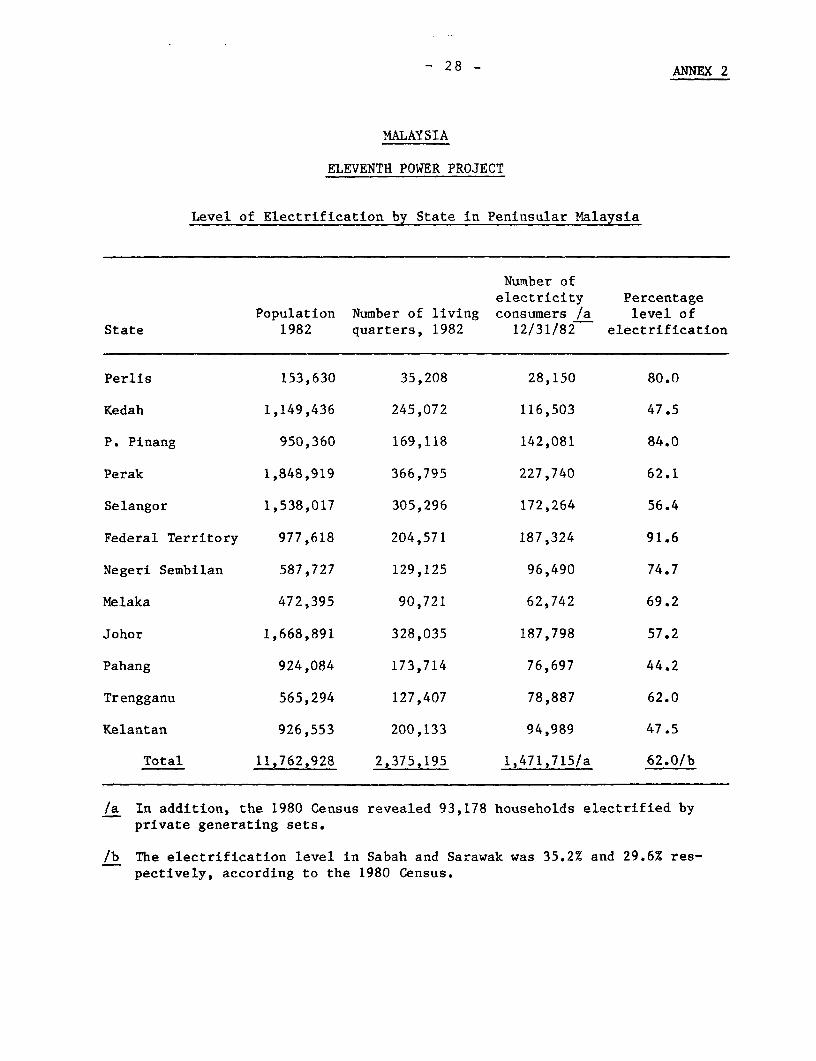
1.10 The population of Peninsular Malaysia in 1982 was estimated to be11.7 million; the per capita electricity consumption was about 760 kWh andproduction of 855 k1lh. About 62% of 2.4 million households in the Peninsulaare electrified. The total number of rural households in Malaysia in 1980 was
-3-
about 1.5 million. Progress in rural electrification has resulted in anincrease in rural households electrified by the NEB from 100,000 in 1970 toabout 450,000 in 1980. The degree of electrification in different statesvaries from a high of about 92% to a low of about 45%. Pahang, Kedah,Kalantan, Johor, Trengganu and Perak are the least electrified states with 45to 62% electrification (Annex-2). The degree of electrification in ruralareas in these states is considerably lower.
Sector Organization
1.11 A cabinet committee on energy formed in 1980 is responsible forevolving the energy policy. It consists of the Prime Minister, Deputy PrimeMinister, and Ministers of Energy, Trade and Industry, and Science and Tech-nology. This committee is supported by a "Committee of Officials" chaired bythe Chief Secretary to the Government and having representatives from
Petronas, the Treasury, the Ministries of Energy, Science and Technology,Trade and Industry, NEB and the Economic Planning Unit (EPU).
1.12 The Ministry of Energy, Telecommunications and Posts (ETP), createdin 1979, has the responsibility for coordinating the activities of diversegovernment agencies dealing with energy. However, in practice, the Ministry'sresponsibility for energy policy so far has been limited and consists primar-ily of jurisdiction over NEB. In 1980, an Energy Unit was created in theMinistry to act as a secretariat for the cabinet committee on Energy. Thisunit is expected to have a wider role in the energy sector in future.
1.13 Petronas, established in 1974, as a Government company, has opera-ting responsibilities in the oil and gas sector. Malaysia's PetroleumDevelopment Act gives it exclusive rights over exploration and production ofpetroleum. It supervises work programs for exploration and production of con-tracting oil companies and has authority to negotiate future productionsharing agreements. Petronas' own exploration activities are undertakenthrough a subsidiary company, Petronas Carigali Berhad, formed in 1978.
Sector Issues and Bank Role
1.14 The principal task in the energy sector is to reduce the heavydependence on oil, thereby extending the life of oil reserves and protectingforeign exchange earnings. In the power sector this objective is beingpursued by constructing all future generating capacity based on hydro, gas orcoal (para. 1.09). During the appraisal of the tenth power project (Loan2146-MA) it was agreed to finance two studies to help NEB in future planning;one dealing with the implications of using coal for power generation andanother for long-range planning of the power system. The coal utilizationstudy, which is completed, has identified suitable sites for coal firedthermal generating plants and arrangements for coal handling; terms of refer-ence for the system planning study have been finalized, and NEB has strength-ened its system planning group to undertake the study with the help of expertassistance from outside.
1.15 Rapid development of gas resources, with a clear understanding ofhow best to use the gas, is an important task. A Gas Utilization Study has
-4-
been recently completed (para. 1.04), in which the Bank assisted the Govern-ment (Petronas) in drafting terms of reference and advising on consultants'contract. The Bank is also financing an Energy Planning Study through theninth power project (1808-MA) which commenced in November 1983. It willanalyze available information on the supply side, prepare detailed demandanalysis, and help in long-term policy decisions in the energy sector.
1.16 Efficient pricing of energy resources to promote rational use andconservation is important. While the fuel oil for electricity generation wascharged at the international price, subsidies existed in the domestic price ofkerosene and diesel. The Government has recently eliminated these subsi-dies. The project provides funds for a detailed study of electricity tariffs(para. 5.07).
1.17 The level of electrification in rural areas in Malaysia has been lowand the rural electrification program has been accelerated since 1976(para. 3.13). A detailed study of the rural electrification program financedby a Bank Loan (1178-MA) was completed in 1978 (para. 3.14). In the tenthpower loan (Loan 2146-MA) (para. 3.17) agreements were reached and variousmeasures for improving the efficiency of the rural electrification programwere initiated.
Experience with Past Loans
1.18 The Bank has made ten loans to NEB, aggregating US$369.5 million(net of cancellations). The projects under the first eight loans have beencompleted and are operating satisfactorily. Project performance audit reports(PMARs) were made for the fifth and sixth loans in 1979 and 1981 respec-tively. The fifth power project was completed about three months behind sche-dule with a cost overrun of 15% whereas the sixth project was delayed byeleven months and the cost overrun was 31%. Both these projects were executedas planned and achieved their major objectives. The PPAR for the sixth powerproject (Report no. 3506 of June 22, 1981) notes that NEB is a well managedutility and has some effective staff training programs. It concludes that,apart from the utility's unsatisfactory financial performance (in 1980 and 81)due to factors beyond the control of its management, the project was asuccess. NEB's financial position has since improved (para. 5.03).
1.19 The seventh and eighth power projects have been completedsatisfactorily. The implementation of the ninth power project is also onschedule. All units at Bersia hydro electric station were commissioned in1983; the first two units at Kenering were commissioned in 1983 and the thirdunit was commissioned in March 1984. All these were in accordance with theSAR schedule. The implementation of the tenth power project (RuralElectrification) has been slowed down because of the Government's decision toreduce investments on rural electrification and minihydro program due tocurrent constraints on its domestic resources. Currently, discussions are inprogress to define the reduced scope of the project.

- 5 -
II. THE BORROWER
2.01 The borrower will be the National Electricity Board (NEB) of theStates of Malaya (Peninsular Malaysia). The proposed loan will be the Bank'seleventh loan to the power sector in Malaysia.
Organization, Management and Operation
2.02 NEB is an autonomous Government-owned corporation, established underthe Electricity Act of 1949, and is responsible to the Ministry of Energy,Telecommunications and Posts. NEB is a well-established entity and has thecapability to implement major projects.
2.03 NEB is both a regulatory and an operating agency responsible for thegeneration, transmission, and distribution of electricity in the Peninsula.NEB has the legal power to set tariffs (para 5.08) and to grant licenses toindependent electricity works.
2.04 NEB's operational and policy decisions are made by the Board ofDirectors. All members of the Board are appointed by the Minister of Energy,Telecommunications and Posts, who establishes their terms. The Chairman ofthe Board is the Chief Secretary of the Cabinet and the Deputy Chairman is theGeneral Manager of NEB. NEB's management is competent.
2.05 NEB's operation is divided into four departments: DevelopmentPlanning, Major Projects, Operations and Administration; each department isheaded by a Deputy General Manager. The Development Planning Department,which combines the functions of technical and financial planning, acts as acatalyst to improve coordination between different departments. It is cur-rently in the process of reviewing its functions and redefining the responsi-bilities within the organization. There is a need to strengthen NEB's inte-grated corporate planning capabilities, particularly in the areas of financialplanning. Consulting services are envisaged to assist in this task and otherrelated areas. Under the proposed loan, funds have been provided for thispurpose. NEB has finalized the terms of reference acceptable to the Bank andhas agreed to appoint consultants satisfactory to the Bank by December 31,1984.
2.06 In addition to the four major departments at the headquarters, NEBhas a Corporate Audit Department and three other departments: Rural Electri-fication, Materials Management, and Accounting; each reports directly to theGeneral Manager. Subsequent to its re-organization review after the comple-tion of the management study by the consultants (para. 2.08), NEB has shiftedthe Materials Management Department directly under the General Manager. NEB'sheadquarters organization chart is given in Annex-3.
2.07 NEB's field operations are organized into five regional areasincluding district offices and stations; the regional areas are Northern,Central, Southern, Eastern and Federal Territory. Some of the responsib-ilities of the district offices include billing and collections, erection andmaintenance of distribution lines, and the operation and maintenance of diesel

- 6 -
and mini-hydro plants in the districts. The remaining functions are
centralized at the headquarters in Kuala Lumpur.
2.06 In 1982 the Government financed a study by Gilbert/CommonwealthInternational (USA) to review NEB's organization, management and operation.The study was completed by the end of 1982 which concluded that NEB was anefficient organization but identified areas of improvement. NEB has formed asenior management committee to supervise various subcommittees which areassigned to review and implement the consultants' recommendations.
Manpower and Training
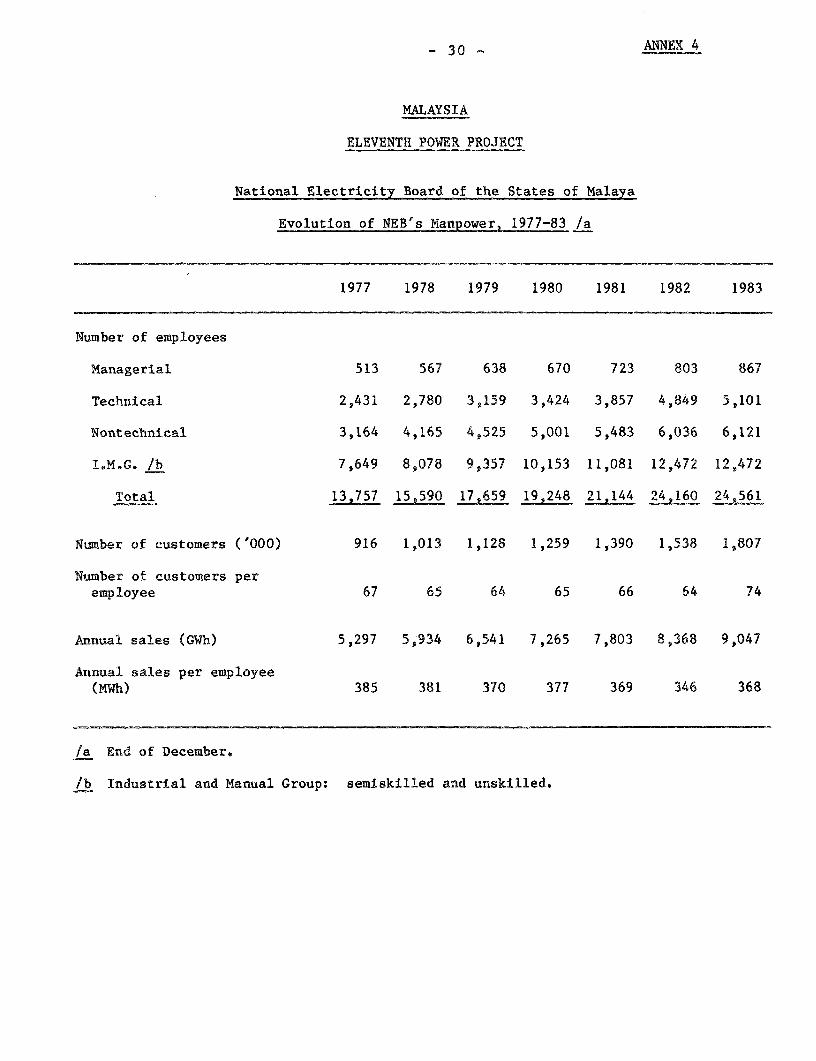
2.09 NEB's staff increased from 13,757 employees in 1977 to 24,561 in1983, averaging about 10% per year since FY77. The number of customers peremployee is about 74. Because of NEB's expanded operation in districts andgrowing involvement in rural electrification, the number of its semi-skilledand unskilled employees has been substantially larger than the number of staffat the management and technical levels, and was growing at a faster rate untilaround 1981 after which NEB took steps restricting hiring of unskilledemployees. Evolution of NEB's manpower from 1977 through 1983 is given inAnnex-4.
2.10 During the past few years NEB has experienced a shortage of trainedstaff at the middle management and working levels and mainly in the financialand accounting areas. NEB has been trying to correct this situation throughvarious training programs, which comprise scholarships for degrees andadvanced courses in engineering, accounting, computers and management at localand overseas universities and professional schools. NEB operates its owntraining center which provides training and refresher courses for technicaland administrative staff. The project includes funds for augmenting thetraining facilities (para. 4.09).
Accounting and Budgeting
2.11 NEB's accounting systems are satisfactory and conform to modernpower utility practices. Accounting applications such as general ledgers,payroll, stores and accounts payable and receivable at the Board level inKuala Lumpur have been computerized. The computer center is well-staffed andequipped. In the past, there have been some delays in the preparation offinancial reports due to delays in preparing and transmitting accountingrecords and summaries from the districts and to the large number of errorrejects encountered in the reports manually prepared by the districts. NEBplans to computerize the processing at these districts, and the project pro-vides funds for this work (para. 4.10). This will enable NEB to expediteaccounts closing and to provide timely reports on items such as incomereturns, fuel issues, etc; currently, these reports are about two monthsbehind schedule.
2.12 NEB prepares annual budgets for its capital and operating expendi-tures. Periodical reports comparing actuals and budget estimates areregularly prepared and submitted to management for review and monitoringpurposes.

-7-
Billing and Collection
2.13 Bills are prepared monthly by district offices. In all districtsthe meter readers themselves prepare bills on-the-spot and hand them to cus-tomers. Collections can be made through district offices, post offices andcollection agents under a uniform payment system for all utility bills.Customers are required to maintain a guarantee deposit equivalent to 60 daysof consumption. These procedures account for the comparatively low level ofcustomers accounts receivable outstanding (about 50 days billing at the end ofFY83).
Audit and Internal Control
2.14 The accounts of all government-owned corporations including NEB arerequired to be closed within six months after the end of the fiscal year andsubmitted for audit by the Auditor General under the law. Due to a staffshortage, the Auditor General has decided to continue to retain external audi-
tors to audit NEB's accounts, subject to Government's final approval. Exter-nal auditors have been Price Waterhouse and Co. and a local firm (Hanafiah,
Raslan, Mohamad and Partners); both firms have been accepted by the Bank inthe previous loans to NEB.
2.15 During negotiations assurances were obtained that NEB will continueto employ independent auditors acceptable to the Bank to audit NEB'saccounts. In the past, NEB has been unable to comply with the Bank's existingcovenant requiring submission of annual audited financial statements to theBank within six months of the close of NEB's fiscal year. The delay is mainly
due to delays in closing and auditing the accounts and their approval by theAuditor General's Office. However, NEB has been able to provide the Bank withunaudited accounts for review within the stipulated time. It was agreed dur-ing negotiations that NEB will continue to submit unaudited financial state-ments to the Bank within six months after the end of NEB's fiscal year andsubmit audited financial statements together with the Auditor's long-formreports within nine months after the end of the relevent fiscal year.
2.16 As required under Loan 1808-MA, NEB established in October 1982 aCorporate Audit Department which is directly responsible to the GeneralManager. Its senior staff include qualified management experts, engineers andaccountants and its responsibilities cover audits of management and technicalas well as accounting operations. To strengthen the department, additionalstaff are being employed and various training programs are also being conduc-ted with assistance from external auditors.
Taxation
2.17 NEB has been exempted since January 1980 for a period of five yearsof payment of corporate taxes, development tax and custom duties. TheGovernment will review the situation at the end of the period.
-8-
Dividends
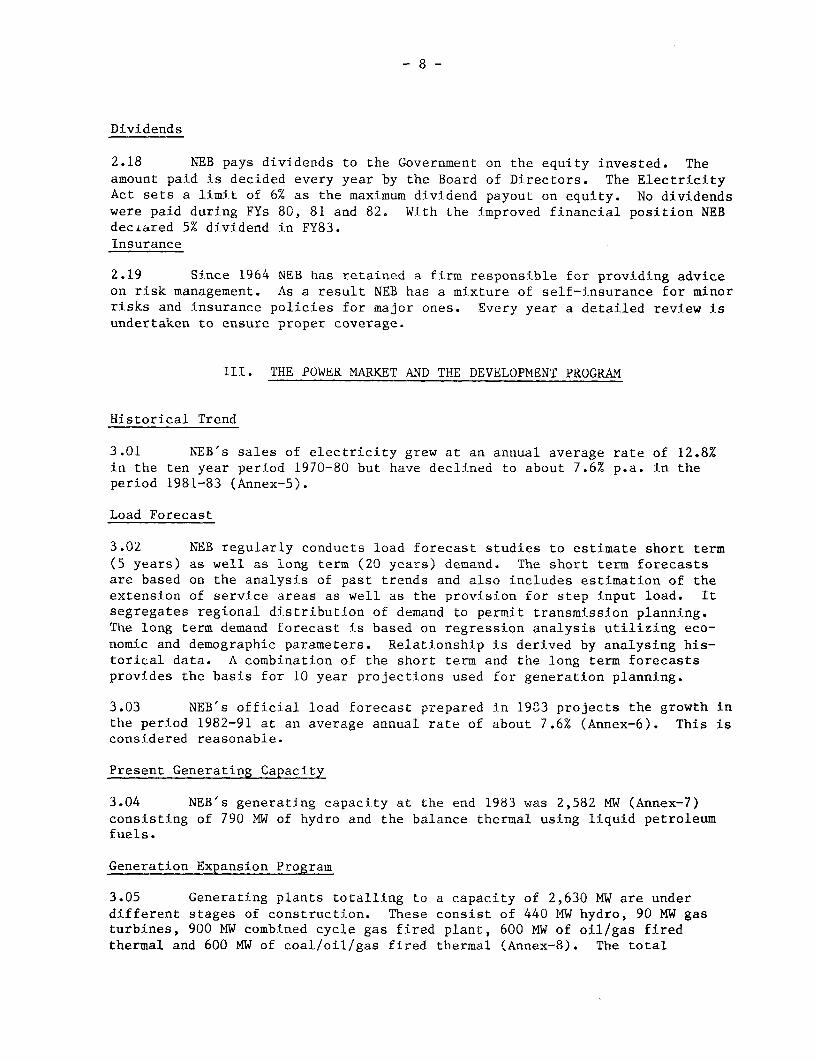
2.18 NEB pays dividends to the Government on the equity invested. Theamount paid is decided every year by the Board of Directors. The ElectricityAct sets a limit of 6% as the maximum dividend payout on equity. No dividendswere paid during FYs 80, 81 and 82. With the improved financial position NEBdeciared 5% dividend in FY83.Insurance
2.19 Since 1964 NEB has retained a firm responsible for providing adviceon risk management. As a result NEB has a mixture of self-insurance for minorrisks and insurance policies for major ones. Every year a detailed review isundertaken to ensure proper coverage.
III. THE POWER MARKET AND THE DEVELOPMENT PROGRAM
Historical Trend
3.01 NEB's sales of electricity grew at an annual average rate of 12.8%in the ten year period 1970-80 but have declined to about 7.6% p.a. in theperiod 1981-83 (Annex-5).
Load Forecast
3.02 NEB regularly conducts load forecast studies to estimate short term(5 years) as well as long term (20 years) demand. The short term forecastsare based on the analysis of past trends and also includes estimation of theextension of service areas as well as the provision for step input load. Itsegregates regional distribution of demand to permit transmission planning.The long term demand forecast is based on regression analysis utilizing eco-nomic and demographic parameters. Relationship is derived by analysing his-torical data. A combination of the short term and the long term forecastsprovides the basis for 10 year projections used for generation planning.
3.03 NEB's official load forecast prepared in 1933 projects the growth inthe period 1982-91 at an average annual rate of about 7.6% (Annex-6). This isconsidered reasonable.
Present Generating Capacity
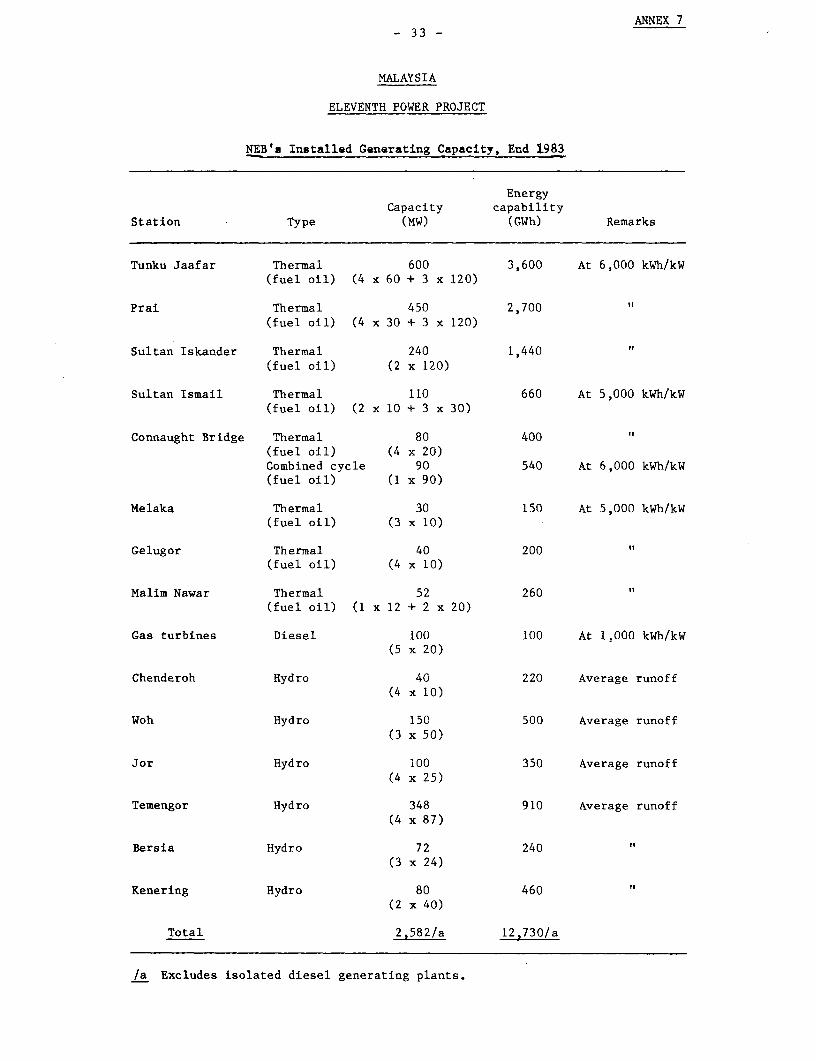
3.04 NEB's generating capacity at the end 1983 was 2,582 MW (Annex-7)consisting of 790 MW of hydro and the balance thermal using liquid petroleumfuels.
Generation Expansion Program
3.05 Generating plants totalling to a capacity of 2,630 MW are underdifferent stages of construction. These consist of 440 MW hydro, 90 MW gasturbines, 900 MW combined cycle gas fired plant, 600 MW of oil/gas firedthermal and 600 MW of coal/oil/gas fired thermal (Annex-8). The total

-9-
installed capacity of over 5,000 MW by the end of 1988 would be considerablyin excess of the 1989 requirements demand and would be adequate to meetcurrently projected system requirements up to 1991. Therefore, commitment ofnew generating capacity will not be necessary till 1986/87.
3.06 The decisions to commit the large generating capacity additions weretaken in the period before 1981 when (a) the system demand growth was high;(b) gas find near the east coast provided the logic for building a 900 MW com-bined cycle gas fired plant ahead of the power needs; and (c) desire for oilsubstitution prompted earlier initiation of the 600 MW second phase of thePort Kelang power station as a coal/gas fired station. The investment pro-gram, however, is well formulated and balanced. NEB has inhouse capability toformulate the investment plan and reviews it annually.
Long Range Plan
3.07 Formulation of a long-range power development program for the 1990s
is a complex task dependant on the evaluation of several important factors,both on supply and demand sides. The supply options consist of offshore gas,imported coal, hydro potential in Sarawak and the nuclear option. Major
policy decisions on the pattern of gas utilization are to be taken on thebasis of the recently completed study (para 1.15). Prefeasibility studies onthe utilization of imported coal for power generation have been recently com-pleted (para 1.14) and provide a basis for further detailed anlaysis. Feas-ibility studies for the development of about 1,500 MW of hydro capacity inSarawak and transmission of electricity to Peninsular Malaysia, over 1,400 kmaway including 600 km of submarine transmission, are being conducted.
3.08 NEB is proposing to initiate a study to prepare the power develop-ment strategy for the next 15-20 years (para 1.14) which will use the resultsof the studies on supply options as well as derive electricity demand fore-casts using results of the Energy Planning Study (para 1.15).
Transmission
3.09 Transmission development studies were carried out by Preece Cardewand Rider, (Consultants, U.K.) in 1976 and 1977 and these were reviewed andupdated by NEB. The major transmission program up to 1985-86 consists ofconstructing a 275 kV transmission backbone system to integrate all generatingfacilities on Peninsular Malaysia and also to facilitate regional developmentand accelerate supply of electricity to the east coast. Also transmissionaugmentation of the southern grid is proposed (para. 4.04).
Distribution
3.10 For administrative convenience, NEB has divided Peninsular Malaysiainto 25 districts, each headed by a District Manager with complete responsi-bility for subtransmission, distribution, sales and consumer liaison. Eachdistrict is responsible for planning and implementing expansion of distri-bution extension schemes. Normally such planning is formalized only one yearahead, for inclusion in NEB's capital expenditure budget. However, conceptualplanning for the next three to four years is carried out at the districtlevel. Recently, NEB has taken two steps to provide a longer time frame for

- 10 -
distribution planning. One, the distribution division at headquarters hasbeen made responsible for coordination of distribution planning. Two, itappointed a firm of local consulting engineers, Tenaga Ewbank Perunding, whohave prepared a ten-year perspective development plan for distributionfacilities in each state.
Rural Electrification
3.11 In Malaysia, an urban area is defined as a gazetted controlled areathat has a population of 10,000 or more. In 1980, there were 73 urban areasin Peninsular Malaysia, having about 34% of the total population. Rural elec-trification (RE) projects are defined as projects which supply electricity toareas outside the urban areas.
3.12 Rural electrification in Malaysia began in the 1950s when during theemergency, a large number of villages were electrified from diesel generatorsto provide perimeter lighting for security reasons. Originally, the installa-tions were operated by NEB's predecessor organization (the Central ElectricityBoard) on the basis of cost reimbursement from the Government. After theemergency, the majority of the small systems were sold to private licensees asthey were uneconomic on a full NEB service basis; about 60 licensees stillexist.
3.13 Rural electrification with social objectives, however, commenced ona small scale with the first five year development plan (1956-60), andslightly accelerated during the second five year plan (1961-65). During thatdecade about 600 villages with about 62,000 consumers were electrified.Thereafter, greater importance to rural electrification has been given in eachsuccessive five year development plan as illustrated below:
Number of Number ofvillages residential Investment
Plan period electrified consumers million M$
1966-70 635 52,418 251971-75 1,380 96,727 741976-80 3,160 230,000 2771981-85 3,007 218,821 457
3.14 Under the seventh power project (Loan 1178-MA), financing of a ruralelectrification study was included in order to formulate a comprehensive ruralelectrification plan and to review its technical, economic and financialimplications (para. 1.17). The study was completed in August 1978 by theMiddle West Service Company of Chicago in association with the PerundingBersatu Sdn. Bhd. of Kuala Lumpur.
- 11 -
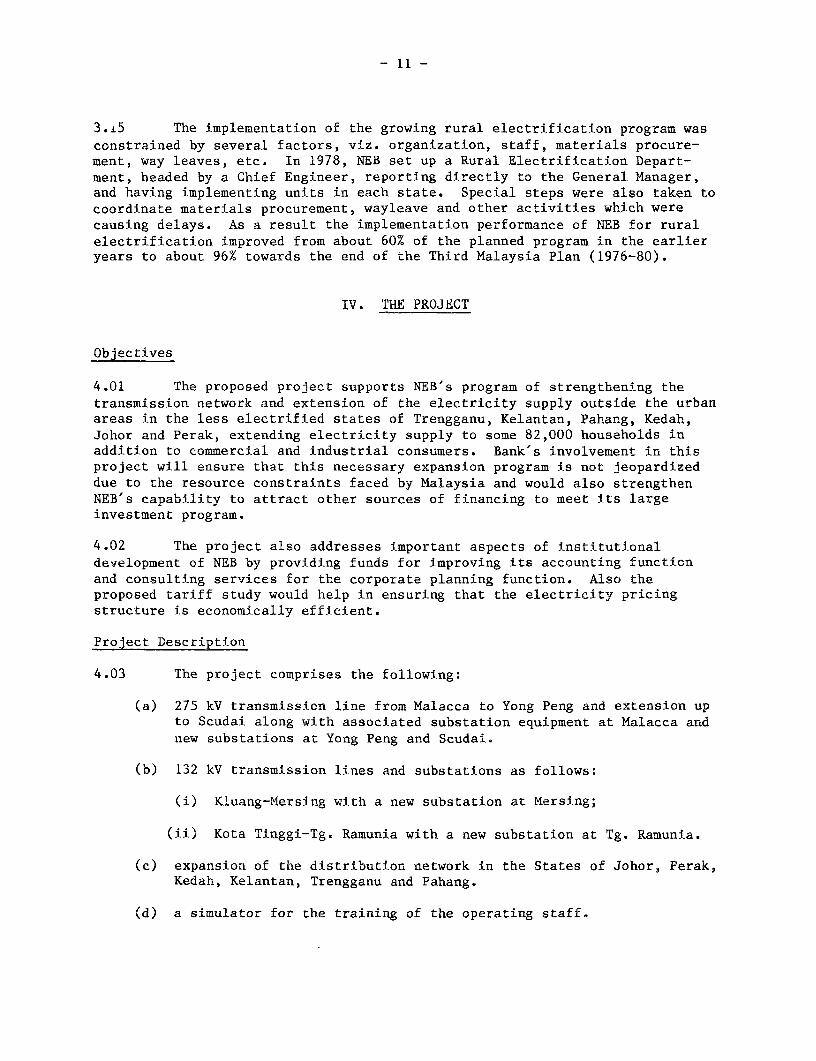
3.i5 The implementation of the growing rural electrification program wasconstrained by several factors, viz. organization, staff, materials procure-ment, way leaves, etc. In 1978, NEB set up a Rural Electrification Depart-ment, headed by a Chief Engineer, reporting directly to the General Manager,and having implementing units in each state. Special steps were also taken tocoordinate materials procurement, wayleave and other activities which werecausing delays. As a result the implementation performance of NEB for ruralelectrification improved from about 60% of the planned program in the earlieryears to about 96% towards the end of the Third Malaysia Plan (1976-80).
IV. THE PROJECT
Objectives
4.01 The proposed project supports NEB's program of strengthening thetransmission network and extension of the electricity supply outside the urbanareas in the less electrified states of Trengganu, Kelantan, Pahang, Kedah,Johor and Perak, extending electricity supply to some 82,000 households inaddition to commercial and industrial consumers. Bank's involvement in thisproject will ensure that this necessary expansion program is not jeopardizeddue to the resource constraints faced by Malaysia and would also strengthenNEB's capability to attract other sources of financing to meet its largeinvestment program.
4.02 The project also addresses important aspects of institutionaldevelopment of NEB by providing funds for improving its accounting functionand consulting services for the corporate planning function. Also theproposed tariff study would help in ensuring that the electricity pricingstructure is economically efficient.
Project Description
4.03 The project comprises the following:
(a) 275 kV transmission line from Malacca to Yong Peng and extension upto Scudai along with associated substation equipment at Malacca andnew substations at Yong Peng and Scudai.
(b) 132 kV transmission lines and substations as follows:
(i) Kluang-Mersing with a new substation at Mersing;
(ii) Kota Tinggi-Tg. Ramunia with a new substation at Tg. Ramunia.
(c) expansion of the distribution network in the States of Johor, Perak,Kedah, Kelantan, Trengganu and Pahang.
(d) a simulator for the training of the operating staff.

- 12 -
(e) computer equipment and software at various districts of the NEB forimproving the speed and efficacy of the compilation of accounts.
(f) consulting services for the transmission component of the project,for strengthening corporate planning, for the study of tariffstructure and for feasibility studies of Pergau hydroelectricproject.
Transmission Lines and Substations
4.04 The 275 kV transmission line from Malacca to Scudai via Yong Peng(route length 233 km) will be a double circuit line with twin ACSR conductors(300 sq. mm) (map 16192R). A fully switched substation with double busbarconfiguration will be established at Malacca with seven 275 kV switchingbays. A new 275 kV/132 kV substation will be established at Yong Peng with2 x 180 MVA, 275/132 kV autotransformers. The lines from Yong Peng to Scudaiwill be initially operated at 132 kV, postponing the construction of the275/132 kV substation at Scudai, by a few years.
4.05 Both the 132 kV lines are radial lines needed to extend the gridsupply to new areas in eastern Johor. They will be double circuit lines; thefirst will have 300 sq.mm and the second 150 sq mm ACSR conductors. Existing132 kV substations at Kluang and Kota Tinggi will be expanded and new 132/11kV substations will be set up at Mersing and Tg. Ramunia, each having 2 x 15MVA transformer capacity.
Distribution
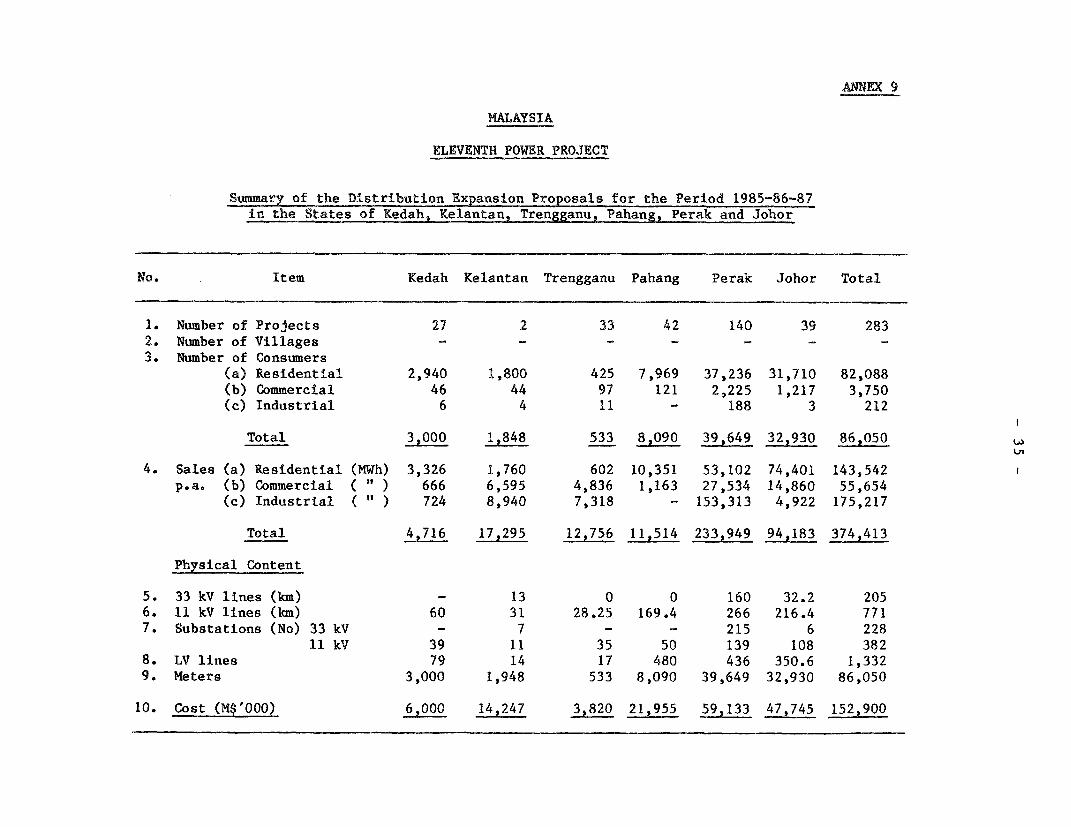
4.06 The project covers a time slice of the program for the extension ofdistribution network outside the urban areas in the states of Johor, Perak,Kedah, Kelantan, Trengganu and Pahang. Annex 9 presents a summary of theprogram. The implementation of various elements of the program will becarried out after a detailed scrutiny of the need and timing. Also NEB hasestablished procedures for evaluating the financial viability of eachproposal. Only those schemes which meet the technical and economic criteria,will be implemented. Industrial and commercial consumers are required to payconnection charges based on the cost of supply and anticipated revenue.
4.07 The following is a summary of the scope of the program in terms ofthe physical facilities proposed:

- 13 -
No. Item Unit Quantity
1. 33 kV O.H/UG Lines km 2052. 11 kV O.H./UG Lines km 7713. 400 V Lines km 1,3324. 33 kV/400 V substations No 228
MVA 695. 11 kV/400 V substations No 382
MVA 1926. Meters - single phase No 86,090
three phase No 3,960
4.08 The estimated annual breakdown of the program in the six states ispresented in Annex-10; tables 1,2 and 3. The proposed investments exclusiveof price contingencies are summarized below:
State Investment in M$ (Millions)1985 1986 1987 Total
Kedah /a - 2.9 3.1 6.0Kelantan /a - 7.7 6.5 14.2Trengganu /a - 2.2 1.6 3.8Pahang /a - 10.0 12.0 22.0Perak 17.6 16.9 24.6 59.1Johor 9.2 14.4 24.2 47.8
Total 26.8 54.1 72.0 152.9
/a Loan 2146-MA includes the 1985 program for these states, amounting toM$ 30.1 million.
Training Simulator
4.09 A multifuel fired (coal/oil/gas) station with 2x300 MW units isproposed at Port Kelang (para. 3.05) for which NEB proposes to providespecialized training facilities for the operating staff at their trainingschool at Kajang. After detailed study, it was concluded that a full scopefacsimile simulator should be utilized for training because of its ability tofully recreate the prevailing conditions in the control room and fully trainthe operating staff off-line. The decision is justified. NEB has competantstaff to operate, maintain and effectively utilize such a facility.

- 14 -
Computer System for Accounts
4.10 The project includes distributed source data generation networkand computerization at various district offices and stations (para. 2.11).Currently, NEB's computer center at the headquarters processes about one mil-lion records per month and this volume is increasing at about 10% per year.Except in Kuala Lumpur, all accounting records are kept and processed manuallyat the districts. NEB plans to computerize the accounting applications atabout 90 districts and stations. The computing equipment and softwarerequired would include multi-terminal clusters with disks, printers and wordprocessors.
Cost Estimate
4.11 Annex-11, tables 1, 2 and 3 give the detailed cost estimates for the275 kV transmission line, 132 kV transmission lines and substations and thedistribution component respectively. All costs are based on the end 1983prices; physical contingencies are at 10%. The price contingencies whichamount to 24.4% of the base cost plus physical contingencies, are worked outon the basis of the following inflation factors:
Year 1984 1985 1986 1987 and after
Local Inflation 10.0 9.0 8.0 6.0Foreign Inflation 7.5 7.0 6.0 6.0
4.12 Table 4.1 summarizes the project cost estimate. The costs are netof taxes and duties since the NEB is exempt from them.
Engineering and Construction
4.13 NEB's Transmission Department will carry out the design, procurementand construction management of the transmission lines and substations. Theyare experienced in carrying out such work and are adequately staffed. Theengineering for the distribution will be carried out by the DistributionDepartment and the District Managers' organizations in the states who willalso manage the construction. Procurement of the distribution materials willbe handled by NEB's Materials Management group. These departments are compe-tent and adequately staffed for the implementation of this Project.
Consulting Services
4.14 The feasibility studies for the 100 MW Pergau hydroelectric projectare estimated to cost US$1.8 million, with a foreign component of US$0.9 mil-lion which will include remuneration and international travel by expatriateconsultants. The local costs will include subsurface exploration and

- 15 -
Table 4.1: PROJECT COST ESTIMATE
ForeignM$ (millions) US$ (millions) Cost as
Foreign Local Total Foreign Local Total % of total
275 kV Line (233 km) 54.3 44.0 98.3 23.6 19.1 42.7 52.3132 kV lines (160 km) 22.1 27.0 49.1 9.6 11.7 21.3 45.0and substations
Distribution 74.7 64.3 139.0 32.4 28.0 60.4 53.7Computer system foraccounts 10.0 2.0 12.0 4.3 1.0 5.3 8.1
Consulting services fortariff, corporateplanning and hydrofeasibility studies 6.0 4.0 10.0 2.6 1.7 4.3 60.0
Training simulator 14.0 2.0 16.0 6.1 0.9 7.0 87.5
Base Cost 181.1 143.3 324.4 78.6 62.4 141.0 55.8
Physical contingencies (10%) 18.1 14.3 32.4 7.9 6.2 14.1 55.8Price contingencies 43.0 44.0 87.0 18.7 19.1 37.8 49.4
Total Project Cost 242.2 201.6 443.8 105.2 87.7 192.9 54.6
Interest during constructionBank Loan 34.7 - 34.7 15.1 - 15.1 100.0
Others 13.9 11.5 25.4 6.0 5.0 11.0 54.5Front End Fee on Bank Loan 0.4 - 0.4 0.2 - 0.2 100.0
Total financing required 291.2 213.1 504.3 126.5 92.7 219.2 59.1
topographical surveys by local contractors. NEB has prepared terms ofreference satisfactory to the Bank and has agreed to appoint consultants byDecember 31, 1984. A provision for 10 man-months of expert assistance for thetariff study and 25 man-months of expert assistance for corporate planning ismade.
Procurement
4.15 Equipment and services financed under the proposed Bank loan shallbe procured by International Competitive Bidding (ICB) in accordance with theBank's Procurement Guidelines. Under ICB, local manufacturers will be per-mitted to participate where appropriate and be eligible for a preference of15% of the CIF cost of the imported goods or the prevailing custom duties andother import taxes, whichever is lower, in the evaluation of bids. The Bank-financed items will include 275 kV and 132 kV lines and substations, some

- 16 -
distribution materials, simulator and computer system. Consulting servicesfinanced under the Bank loan would be engaged in accordance with the Bankguidelines.
4.16 For the procurement of equipment and related civil works notfinanced by the Bank loan, NEB follows ICB procedures for foreign items andLCB procedures for local items, which are acceptable to the Bank.
4.17 Procurement arrangements are shown in Table 4.2 below:
Table 4.2: PROCUREMENT ARRANGEMENTS
(US$ millions)
TotalProject Element ICB LCB Other N.A. Cost
A. 275 KV line and 33.1 11.4 - 13.9 58.4substations (21.0)a/ - - - (21.0)
B. 132 kV lines and 19.3 3.0 - 6.9 29.2substations (10.2) (10.2)
C. Distribution 38.2 25.2 - 19.2 82.6(20.8) (20.8)
D. Simulator and 14.3 1.2 - 1.2 16.7computer equipment (14.3) (14.3)
E. Consulting services - - 6.0 - 6.0(3.5) (3.5)
Total 104.9 40.8 6.0 41.2 192.9(66.3) (3.5) (69.8)
/a Figures in parentnesis indicate financing from the Bank loan.
4.18 All bidding packages for goods financed by the Bank and estimated tocost over US$500,000 equivalent would be subject to the Bank's prior review ofprocurement documents, which cover all the foreseen contracts.
Implementation Schedule
4.19 Annex-12 gives the implementation schedules for the various elementsof the project. The 132 kV lines and substations will be completed by June1987 and the 275 kV lines are expected to be completed by January 1988. Thedistribution component will be implemented by mid 1988.
Financing Plan
4.20 The financing plan prepared by NEB and agreed with the Bank duringthe negotiations is shown below. In the event a B loan does not materialize,NEB will borrow from commercial banks with the guarantee of the Government.

- 17 -
Foreign Local TotalSource - (US$ Millions) -------- %
IBRD 70.0 - 70.0 31.9Cofinancing (possibly B Loan) 35.5 27.0 62.5 28.5Local commercial Banks - 30.0 30.0 13.7NEB's resources 21.0 35.7 56.7 25.9
Total 126.5 92.7 219.2 100.0
Disbursement
4.21 The Bank loan would be disbursed against (a) 100% of the foreignexpenditures of directly imported equipment and materials; (b) 100% of localexpenditures ex-factory of locally manufactured items (c) 70% of the cost ofitems procured locally and (d) 100% of expenditures for consulting services.
4.22 Annex-13 gives the disbursement schedule for the proposed Bank loanas well as the Bankwide profile of disbursements for distribution and trans-mission projects, which are very close for the first two years. The disburse-ment in the third and the fourth year is estimated to be more rapid due to thenature of the distribution component of the project for which all procurementfinanced by the Bank loan will be completed by the end of 1986.
Monitoring and Reporting
4.23 Satisfactory procedures for monitoring the progress of the projectin terms of physical execution and consumer connections, have been agreed withNEB who will furnish quarterly progress reports.
Ecology
4.24 Transmission and distribution projects will be designed and carriedout in accordance with the current technological practices and will causeminimum disturbance to the environment. No safety hazards are foreseen.
V. THE FINANCIAL ASPECTS
Past Operating Results
5.01 NEB's past operating results were generally satisfactory. During
the period FY76 througii FY79, the rate of growth in NEB's operating expensesexceeded the increase in the operating revenues, primarily because ofincreases in operating and fuel costs resulting from the rise in the inter-national oil prices. However, NEB was able to generate a profit each year and

- 18 -
maintain a rate of return on revalued net fixed assets ranging between 5.0%and 7.5% until FY79. These results were due partly to an increase in electri-city sales of about 10% per year and partly to the automatic increases in the
Fuel Cost Variation Charges (FCVC) (para. 5.08).
5.02 In October 1979, the Government approved a 13% increase in NEB'stariffs, but did not permit the application of FCVC. This increase was,however, not sufficient to absorb the impact of the steep increase in fuel oilprices and NEB reported an operating loss of about M$20 million (a net loss ofM$82 mil'lion) in FY80.
5.03 To restore NEB's financial viability the Government permittedanother tariff increase of about 52% in December 1980 to cover the oil priceincreases; the Government also abolished the FCVC, but approved a restructur-ing of the tariff to a progressive block rate (para. 5.07). In addition, theGovernment approved the following measures: (a) exempt NEB from taxes andduties until FY85; (b) temporarily postpone NEB's dividend payment to theGovernment; and (c) provide equity contribution to NEB. As a result of thesemeasures, coupled with subsequent reduction in the world oil prices, NEB'sfinances improved significantly with the rate of return on revalued net fixedassets increasing to about 7% in FY81 and 9% in FY82. For FY83 the rate ofreturn on revalued net fixed assets is estimated at about 12% and the selffinancing ratio including consumers' contribution is estimated over 50%. Asummary of NEB's historical statements for FY76 through FY83 is given inTable 5.1 below. Detailed financial statements with NEB's performance indica-tors are presented in Annex-14.
Table 5.1: SUMMARY HISTORICAL INCOME STATEMENTS, FY76-FY83
FY76 FY77 FY78 FY79 FY80 FY81 FY82 FY83/a
Energy sales (GWh) 4,543 5,297 5,934 6,540 7,265 7,803 8,368 9,047Operating revenues
(M$ million) 493 577 655 833 1,097 1,589 1,866 2,013Operating expenses
(M$ million) 401 499 528 738 1,116 1,425 1,598 1,635Operating Income(M$ million) 92 78 127 95 (19) 164 268 378
Net income (M.$ million) 62 46 79 35 (82) 96 212 324/bOperating Ratio (%) 68 73 67 73 88 82 86 81Rate of return (%) ic 7.2 5.3 7.5 4.9 (0.2) 6.5 9.1 12.2Self financing
ratio (%) 46 38 35 37 8 11 51 58Average tariff
(M¢/kWh) 10.7 10.7 10.8 12.6 15.0 20.2 22.0 22.0
/a Unaudited./b After net dividends of M$26.9 million.7T7 On revalued net fixed assets.

- 19 -
Comparative Financial Position
5.04 NEB's estimated balance sheet as of FY83 is sound. Its presentfinancial position is summarized below and is compared with the position inFY76 and FY80:
Table 5.2: COMPARATIVE BALANCE SHEETS, FY76, FY80 AND FY83
Fiscal year ending August 31 1976 1980 1983 /a---------- (M$ million) ----------
AssetsFixed AssetsNet fixed assets in operation 1,523 2,712 4,042Work in progress 381 1,173 2,472
Total Net Fixed Assets 1,904 3,885 6,514
Current Assets 207 541 938Other 4 6 4
Total Assets 22115 4,432 7,456
LiabilitiesEquity /b 1,188 2,543 4,374Long-term debt 604 1,246 2,019Current liabilities 218 470 894Other 105 173 169
Total Liabilities 2,115 4,432 7,456
Current ratio 1.0 1.2 1.1Debt/equity ratio /c 46/54 46/54 39/61
/a Unaudited./b Including contributions, and operational and revaluation surplus./c Excluding surplus from revaluation.
5.05 From FY76 to FY83, NEB's total net fixed assets increased by aboutthree times and its equity including Government contributions and surplus fromoperations increased by nearly four times. Net long term borrowings increasedfrom M$604 million to about M$2,000 million, with debt/equity ratio (excludingsurplus from asset revaluation) maintained at a comfortable margin around40/60 and a debt service coverage ratio estimated at about 3.8 times at theend of FY83.
- 20 -
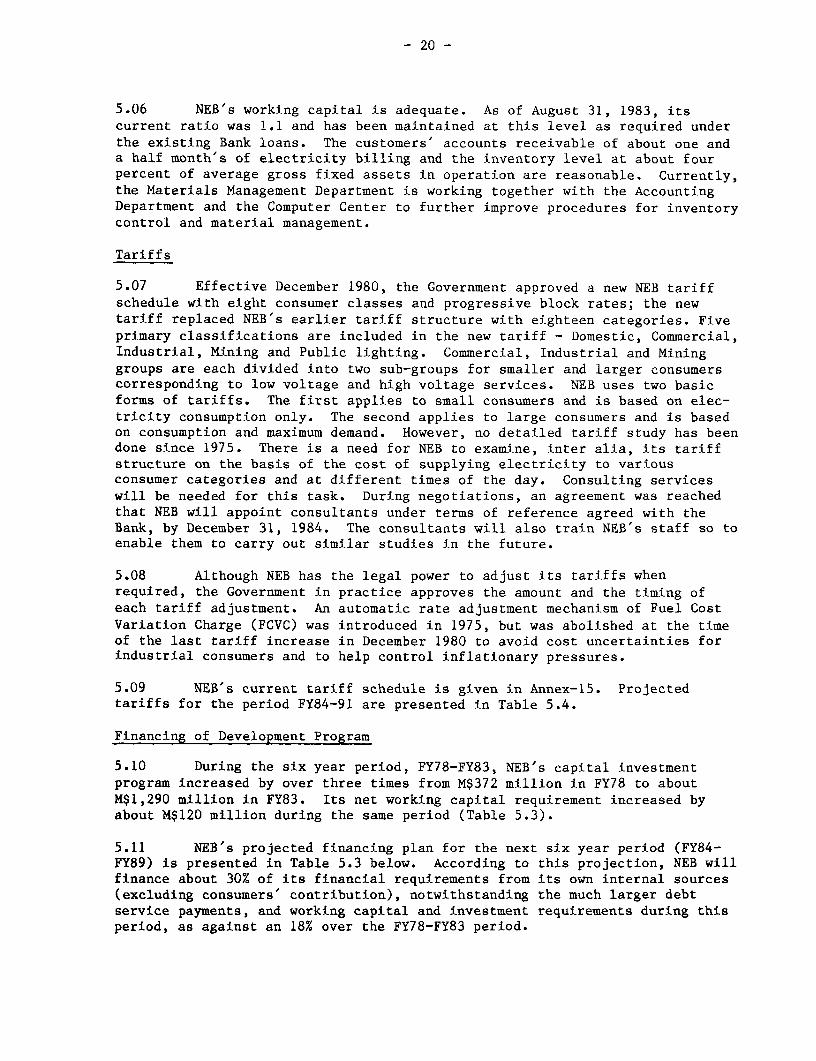
5.06 NEB's working capital is adequate. As of August 31, 1983, itscurrent ratio was 1.1 and has been maintained at this level as required underthe existing Bank loans. The customers' accounts receivable of about one anda half month's of electricity billing and the inventory level at about fourpercent of average gross fixed assets in operation are reasonable. Currently,the Materials Management Department is working together with the AccountingDepartment and the Computer Center to further improve procedures for inventorycontrol and material management.
Tariffs
5.07 Effective December 1980, the Government approved a new NEB tariffschedule with eight consumer classes and progressive block rates; the newtariff replaced NEB's earlier tariff structure with eighteen categories. Fiveprimary classifications are included in the new tariff - Domestic, Commercial,Industrial, Mining and Public lighting. Commercial, Industrial and Mininggroups are each divided into two sub-groups for smaller and larger consumerscorresponding to low voltage and high voltage services. NEB uses two basicforms of tariffs. The first applies to small consumers and is based on elec-tricity consumption only. The second applies to large consumers and is basedon consumption and maximum demand. However, no detailed tariff study has beendone since 1975. There is a need for NEB to examine, inter alia, its tariffstructure on the basis of the cost of supplying electricity to variousconsumer categories and at different times of the day. Consulting serviceswill be needed for this task. During negotiations, an agreement was reachedthat NEB will appoint consultants under terms of reference agreed with theBank, by December 31, 1984. The consultants will also train NEB's staff so toenable them to carry out similar studies in the future.
5.08 Although NEB has the legal power to adjust its tariffs whenrequired, the Government in practice approves the amount and the timing ofeach tariff adjustment. An automatic rate adjustment mechanism of Fuel CostVariation Charge (FCVC) was introduced in 1975, but was abolished at the timeof the last tariff increase in December 1980 to avoid cost uncertainties forindustrial consumers and to help control inflationary pressures.
5.09 NEB's current tariff schedule is given in Annex-15. Projectedtariffs for the period FY84-91 are presented in Table 5.4.
Financing of Development Program
5.10 During the six year period, FY78-FY83, NEB's capital investmentprogram increased by over three times from M$372 million in FY78 to aboutM$1,290 million in FY83. Its net working capital requirement increased byabout M$120 million during the same period (Table 5.3).
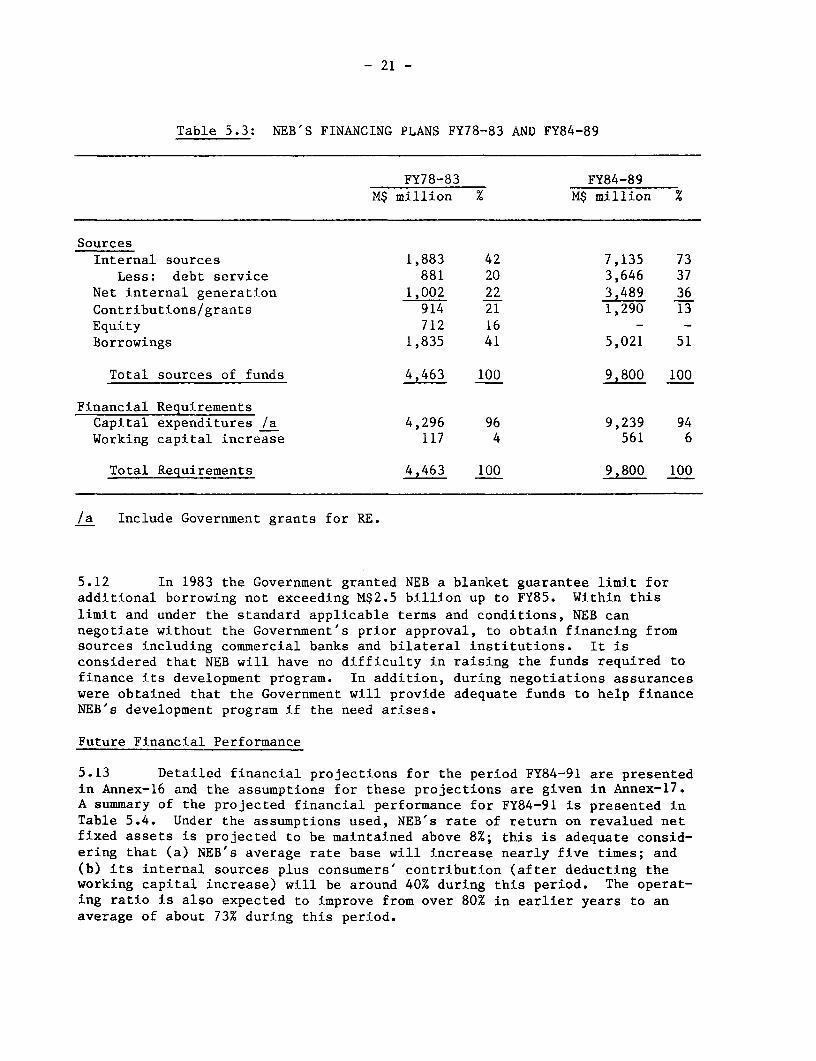
5.11 NEB's projected financing plan for the next six year period (FY84-FY89) is presented in Table 5.3 below. According to this projection, NEB willfinance about 30% of its financial requirements from its own internal sources(excluding consumers' contribution), notwithstanding the much larger debtservice payments, and working capital and investment requirements during thisperiod, as against an 18% over the FY78-FY83 period.
- 21 -
Table 5.3: NEB'S FINANCING PLANS FY78-83 AND FY84-89
FY78-83 FY84-89M$ million % M$ million %
SourcesInternal sources 1,883 42 7,135 73
Less: debt service 881 20 3,646 37Net internal generation 1,002 22 3,489 36Contributions/grants 914 21 1,290 13Equity 712 16 - -Borrowings 1,835 41 5,021 51
Total sources of funds 4,463 100 9,800 100
Financial RequirementsCapital expenditures /a 4,296 96 9,239 94Working capital increase 117 4 561 6
Total Requirements 4,463 100 9,800 100
/a Include Government grants for RE.
5.12 In 1983 the Government granted NEB a blanket guarantee limit foradditional borrowing not exceeding M$2.5 billion up to FY85. Within thislimit and under the standard applicable terms and conditions, NEB cannegotiate without the Government's prior approval, to obtain financing fromsources including commercial banks and bilateral institutions. It isconsidered that NEB will have no difficulty in raising the funds required tofinance its development program. In addition, during negotiations assuranceswere obtained that the Government will provide adequate funds to help financeNEB's development program if the need arises.
Future Financial Performance
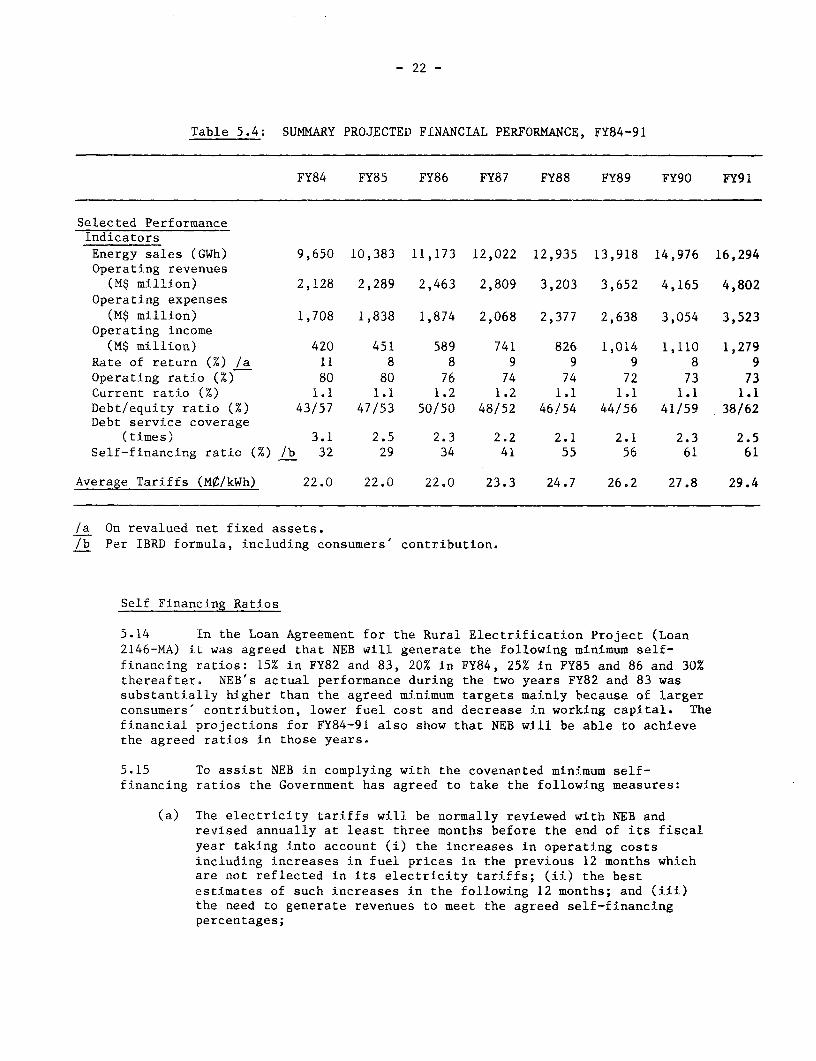
5.13 Detailed financial projections for the period FY84-91 are presentedin Annex-16 and the assumptions for these projections are given in Annex-17.A summary of the projected financial performance for FY84-91 is presented inTable 5.4. Under the assumptions used, NEB's rate of return on revalued netfixed assets is projected to be maintained above 8%; this is adequate consid-ering that (a) NEB's average rate base will increase nearly five times; and(b) its internal sources plus consumers' contribution (after deducting theworking capital increase) will be around 40% during this period. The operat-ing ratio is also expected to improve from over 80% in earlier years to anaverage of about 73% during this period.
- 22 -
Table 5.4: SUMMARY PROJECTED FINANCIAL PERFORMANCE, FY84-91
FY84 FY85 FY86 FY87 FY88 FY89 FY90 FY91
Selected PerformanceIndicatorsEnergy sales (GWh) 9,650 10,383 11,173 12,022 12,935 13,918 14,976 16,294Operating revenues(M$ million) 2,128 2,289 2,463 2,809 3,203 3,652 4,165 4,802
Operating expenses(M$ million) 1,708 1,838 1,874 2,068 2,377 2,638 3,054 3,523
Operating income(M$ million) 420 451 589 741 826 1,014 1,110 1,279
Rate of return (%) /a 11 8 8 9 9 9 8 9Operating ratio (%) 80 80 76 74 74 72 73 73Current ratio (%) 1.1 1.1 1.2 1.2 1.1 1.1 1.1 1.1Debt/equity ratio (%) 43/57 47/53 50/50 48/52 46/54 44/56 41/59 38/62Debt service coverage
(times) 3.1 2.5 2.3 2.2 2.1 2.1 2.3 2.5Self-financing ratio (%) /b 32 29 34 41 55 56 61 61
Average Tariffs (M¢/kWh) 22.0 22.0 22.0 23.3 24.7 26.2 27.8 29.4
/a On revalued net fixed assets./b Per IBRD formula, including consumers' contribution.
Self Financing Ratios
5.14 In the Loan Agreement for the Rural Electrification Project (Loan2146-MA) it was agreed that NEB will generate the following minimum self-financing ratios: 15% in FY82 and 83, 20% in FY84, 25% in FY85 and 86 and 30%thereafter. NEB's actual performance during the two years FY82 and 83 wassubstantially higher than the agreed minimum targets mainly because of largerconsumers' contribution, lower fuel cost and decrease in working capital. Thefinancial projections for FY84-91 also show that NEB will be able to achievethe agreed ratios in those years.
5.15 To assist NEB in complying with the covenanted minimum self-financing ratios the Government has agreed to take the following measures:
(a) The electricity tariffs will be normally reviewed with NEB andrevised annually at least three months before the end of its fiscalyear taking into account (i) the increases in operating costsincluding increases in fuel prices in the previous 12 months whichare not reflected in its electricity tariffs; (ii) the bestestimates of such increases in the following 12 months; and (iii)the need to generate revenues to meet the agreed self-financingpercentages;
- 23 -
(b) Should the actual increases in fuel prices during any year besubstantially greater than the best estimates assumed in (ii) of (a)above for that year, the Government will take appropriate interimmeasures as are necessary; and
(c) If NEB's financial results for a year indicate that it will notachieve the agreed self-financing percentages in that year (Year A),then the tariffs for the immediately succeeding year (Year B) willbe set at a level which will permit NEB to recover in Year B theshortfall in the agreed self-financing percentages for Year A.
5.16 Following the recommendation by the management consultants, NEB hasestablished a senior management tariff committee with working groups coordin-ated under the responsibility of the commercial manager to review NEB's tariff
periodically as required.
5.17 NEB's operating results are sensitive to changes in the oil prices;this is because fuel costs continue to be NEB's largest operating expense andthese costs are largely beyond NEB's own control. While the Bank hasrecommended that the Government and NEB consider the possibility and thetiming to reinstitute the FCVC at its future tariff reviews, the agreedmeasures (para. 5.15) are adequate to ensure NEB's financial viability basedon an effective mechanism for tariff review and revision, taking into accountany significant changes in fuel prices. The self-financing ratios agreedunder the previous loan (i.e. 20% in FY84, 25% in FY85 and 86 and 30% there-after) will be continued under the proposed loan.
Other Financial Covenants
5.18 Under previous Bank loans to NEB, the following agreements werereached with respect to NEB's financial performance: (a) a current ratiocovenant of 1.1 times; (b) a debt limitation covenant based on a debt/equityratio of 60/40; and (c) an investment limitation covenant of a maximum of 1%of NEB's revalued gross fixed assets in other industrial activities. NEB hascomplied with these covenants. The financial forecasts indicate that NEB willcontinue to meet these requirements (Table 5.4). All three covenants will berepeated under the proposed loan.
6. JUSTIFICATION
6.01 The transmission and distribution proposals included in the project
are a part of NEB's expansion program (paras. 3.05 to 3.10). The program isdesigned to satisfy the projected demands and is fully justified. Theinternal economic rate of return for the investment program for the period1983-91 is 25% at the prevailing tariff, indicating that the cost of supply inreal terms would decline in the coming years; mainly due to the substitutionof oil for power generation by hydro, coal and gas (para. 1.09).
6.02 The transmission line between Malacca - Yong Peng - Scudai isjustified by technical studies of the system transmission requirements. The
- 24 -
justification rests on (a) anticipated power flows, (b) system stabilityrequirements, and (c) merit order generation scheduling between power plantson the West Coast and South. The proposed alternative is the least-cost wayof achieving these objectives, compared to other alternatives of 132 kV linesor shifting to a higher voltage of 400 or 500 kV.
6.03 The 132 kV lines and substations included in the project are neces-sary for extending the grid supply to areas with existing and potentialdemand. Each proposal has been studied in comparison with two other alter-natives, viz. (a) establishing or augmenting diesel generating stations tomeet the demand and (b) carrying out the extension by 33 kV or 11 kV lines.In all cases the proposed alternative has been demonstrated to be the leastcost solution.
6.04 The distribution proposals have been formulated to meet theanticipated demand of electricity outside the urban areas. In all cases, theextension of supply will be carried out after ascertaining the need and thefinancial viability of the proposed extension (para 4.06). Basically,therefore, the distribution expansion proposals form a part of NEB's normalprogram of the extension of supply dictated by the demand.
Economic Rate of Return
6.05 For the distribution component of the project, rate of return hasbeen worked out by using the revenue at the prevailing tariff, as benefit, asdetailed in Annex-18. On this basis, the IERR works out to 17%. It wouldreduce to 15% if the costs increase by 10% or if the sales reduce by 10%. TheIERR does not fully reflect the economic benefits of the project since theconsumer surplus is ignored.
Risks
6.06 The risk in the implementation of transmission lines is primarilyone of delay that can be caused in the acquisition of land for the substationsand right of way for the line construction. Land for four out of sevensubstations is already available and existing wayleave will be used for a partof the 275 kV line. For the balance, NEB has established a satisfactoryaction plan to complete the acquisition to suit the project implementationschedule. The only risk in the implementation of the distribution program isthat if demand does not materialize, the program proposed for the three yearsperiod may extend over a longer period.
7. AGREEMENTS REACHED AND RECOMMENDATIONS
Agreements Reached
7.01 During the negotiations, the following agreements have been reachedwith NEB and the Government:

- 25 -
(a) With NEB
(i) NEB will appoint consultants satisfactory to the Bank byDecember 31, 1984 for improving corporate planning capabilities(para. 2.05) and for the feasibility study for hydro (para.4.14) under terms of reference agreed with the Bank;
(ii) NEB will employ auditors acceptable to the Bank to audit NEB'saccounts and to send unaudited financial statements to the Bankwithin six months and audited financial statements with audi-
tor's reports within nine months of the end of NEB's fiscalyear (para. 2.15);
(iii) NEB will appoint consultants satisfactory to the Bank by
December 31, 1984, to carry out a detailed tariff study underterms of reference agreed with the Bank (para. 5.07);
(iv) NEB will achieve the following minimum self-financing ratios:20% in FY84, 25% in FY85 and FY86, and 30% thereafter(para. 5.17);
(v) NEB will maintain a current ratio of not less than 1.1(para. 5.18);
(vi) NEB will consult the Bank for incurring debt if its long-termdebt exceeds 60% of the sum of its equity and debt(para. 5.18); and
(vii) NEB will limit its industrial investment (para. 5.18).
(b) With Government
(i) Government will provide or arrange for adequate funds tofinance NEB's development program, if necessary (para. 5.12).
(c) With NEB and Government
(i) NEB and Government will review the electricity tariff at least
once every year and adjust it to enable NEB to achieve self-financing ratios agreed with the Bank (para. 5.15).
Recommendations
7.02 With the above agreements, the Project constitutes a suitable basisfor a Bank loan of US$70.0 million (including the capitalized front end fee)to NEB for a period of 15 years including a grace period of three years, atthe standard variable interest rates, with the guarantee of Malaysia.

ANNEX I
- 2 6 Page 1 of 2
MALAYSIA
ELEVENTH POWER PROJECT
Statistical Data of Electricity Generation and Sales
A. Generating, Capacity in Malaysia in August 1983(MW)
Entity Total Hydro Steam Gas turbine Diesel
NEB 2,574.1 726.2 1,612.0 100.0 135.9Other licensees 36.7 2.0 - 34.7
Total PeninsularMalaysia 2 610.8 728.2 1,612.0 100.0 170,6
SEB 133.0 - - 133.0SESCO 148.2 - 14.6 133.6
Total Malaysia 2,892-0 728.2 1,612.0 114.6 437.2
B. Electricity Generation in Peninsular Malaysia for FY83(GWh)
Entity Total Hydro Steam Gas turbine Diesel
NEB 10,672.4 1,488.7 8,430.1 354.2 399.4PRHE /a 36.4 12.6 23.5 - 0.3Other licensees andindustries 339.1 - - 339.1
Mining industries 53.3 16.5 2,9 - 33.9
Total PeninsularMalaysia 11,101.2 1517.8 8,456.5 354.2 772.7
/a PRHE generated only for the month of September 1982, since it was takenover by NEB from October 1, 1982.
ANNEX 1- 27 - Page 2 of 2
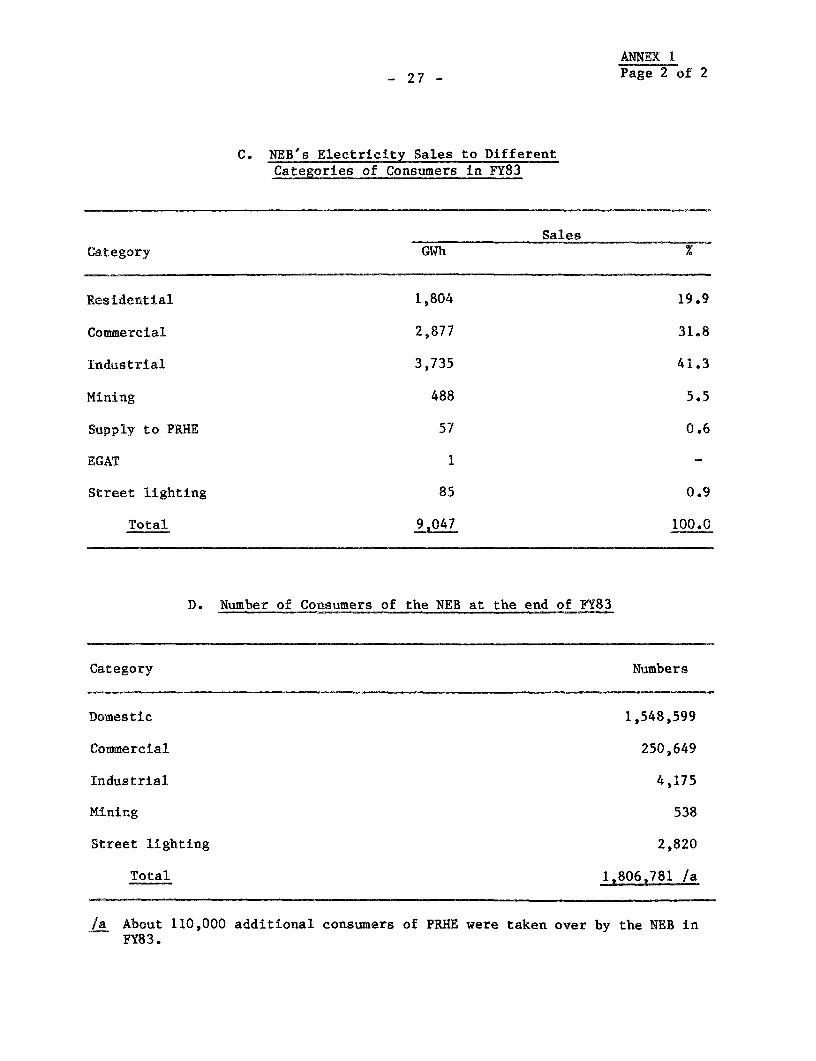
C. NEB's Electricity Sales to DifferentCategories of Consumers in FY83
SalesCategory GWh %
Residential 1,804 19.9
Commercial 2,877 31.8
Industrial 3,735 41.3
Mining 488 5.5
Supply to PRHE 57 0.6
EGAT 1
Street lighting 85 0.9
Total 9,047 100.0
D. Number of Consumers of the NEB at the end of FY83
Category Numbers
Domestic 1,548,599
Commercial 250,649
Industrial 4,175
Mining 538
Street lighting 2,820
Total 1,806,781 /a
/a About 110,000 additional consumers of PRHE were taken over by the NEB inFY83.
- 28 - ANNEX 2
MALAYSIA
ELEVENTH POWER PROJECT
Level of Electrification by State in Peninsular Malaysia
Number ofelectricity Percentage
Population Number of living consumers /a level ofState 1982 quarters, 1982 12/31/82 electrification
Perlis 153,630 35,208 28,150 80.0
Kedah 1,149,436 245,072 116,503 47.5
P. Pinang 950,360 169,118 142,081 84.0
Perak 1,848,919 366,795 227,740 62.1
Selangor 1,538,017 305,296 172,264 56.4
Federal Territory 977,618 204,571 187,324 91.6
Negeri Sembilan 587,727 129,125 96,490 74.7
Melaka 472,395 90,721 62,742 69.2
Johor 1,668,891 328,035 187,798 57.2
Pahang 924,084 173,714 76,697 44.2
Trengganu 565,294 127,407 78,887 62.0
Kelantan 926,553 200,133 94,989 47.5
Total 11,762,928 2,375,195 1,471,715/a 62.0/b
/a In addition, the 1980 Census revealed 93,178 households electrified byprivate generating sets.
/b The electrification level in Sabah and Sarawak was 35.2Z and 29.6% res-pectively, according to the 1980 Census.

MALAYSIA - NATIONAL ELECTRICITY BOARDORGANIZATION CHART
MGENERAL MANAGER
MANAGER FOR MANAGER FOR I DEVELOPMENT MANAGER MAJOROPERATIONS ADMINISTRATIO DVLPMENNIN PROJECTS
CHIEF ENGINEER -
GENERATION SECRETARY FINANCIAL TRANSMISSION CHIEF RURAL MATERIALS PLANNING SYSTEM PROJECTS ACCOUNTANT ELECTRIFICATION MANAGEMENT
J SYSTEMS I j MANAGEMENT TECHNICAL THERMAL * ACCOUNTS I NIHYDRO
j OPERATIONS I n SERVICES I n PLANNING PROJECTS ACCOUNTSPROGRAM
SPECIAL ~~HYDRO DATA
DISTRIBUTION PERSONNEL PSERVICE ROJECTS PROCESSING
I AREA I E COMMERCIAL RESEARCH AND AHE
I MANAGERS I m MANAGER | |oDEVELOPMENT 3ARCHITECT
TRAININGVVorld Bank -23333
- 30 ANNEX 4
MALAYSIA
ELEVENTH POWER PROJECT
National Electricity Board of the States of Malaya
Evolution of NEB's Manpower, 1977-83 /a
1977 1978 1979 1980 1981 1982 1983
Number of employees
Managerial 513 567 638 670 723 803 867
Technical 2,431 2,780 3,159 3,424 3,857 4,849 5,101
Nontechnical 3,164 4,165 4,525 5,001 5,483 6,036 6,121
I.M.G. /b 7,649 8,078 9,357 10,153 11,081 12,472 12,472
Total 13,757 15c590 17_659 21144 241602
Number of customers ('000) 916 1,013 1,128 1,259 1,390 1,538 1,807
Number of customers peremployee 67 65 64 65 66 64 74
Annual sales (GWh) 5,297 5,934 6,541 7,265 7,803 8,368 9,047
Annual sales per employee(MWh) 385 381 370 377 369 346 368
/a End of December.
/b Industrial and Manual Group: semiskilled and unskilled.

ANNEX 5
- 31 -
MALAYSIA
ELEVENTH POWER PROJECT
NEB's Sales, FY69-83(GWh)
Fiscal Resi- Com- Indus- Bulk supply to %Year dential mercial trial Mining PRHE & others Total increase
1969 249 577 496 362 255 1,939 9.71970 268 629 576 352 353 2,178 12.31971 291 688 672 350 400 2,401 10.21972 322 775 848 346 475 2,766 15.21973 369 899 1,079 313 481 3,141 13.61974 406 1,015 1,297 297 485 3,502 11.51975 474 1,153 1,481 303 570 3,982 13.71976 580 1,323 1,758 296 586 4,543 14.11977 702 1,529 1,969 320 787 5,297 16.61978 848 1,784 2,160 311 831 5,934 12.01979 987 2,038 2,448 295 773 6,541 10.21980 1,148 2,216 2,744 294 863 7,265 11.11981 1,302 2,401 2,928 285 887 7,803 7.41982 1,457 2,593 3,200 285 833 8,368 7.21983 1,804 2,877 3,736 487/a 143/a 9,047 8.1/a
/a Takeover of PRHE by NEB from October 1, 1982.

- 32 ANNEX 6
MALAYSIA
ELEVENTH POWER PROJECT
Demand Forecast, 1983-91
Generation requirementsLoad
Fiscal Sales Growth Energy Peak factoryear (GWh) (% p.a.) (GWh) (MW) (%)
1982/a 8,368 7.2 9,817 1,637 68.5
1983/a 9,047/b 8.1 10,330 1,767 66.7
1984 9,650 6.7 11,098 1,836 69.0
1985 10,383 7.6 11,940 1,975 69.0
1986 11,173 7.6 12,849 2,126 69.0
1987 12,022 7.6 13,825 2,198 69.0
1988 12,935 7.6 14,875 2,461 69.0
1989 13,918 7.6 16,006 2,648 69.0
1990 14,976 7.6 17,222 2,849 69.0
1991 16,294 7.6 18,738 3,100 69.0
/a Actual.
/b Includes PRHE area after October 1, 1982.
ANNEX 73 33
MALAYSIA
ELEVENTH POWER PROJECT
NEB'a Installed Generating Capacity, End 1983
EnergyCapacity capability
Station Type (MW) (GWh) Remarks
Tunku Jaafar Thermal 600 3,600 At 6,000 kWh/kW(fuel oil) (4 x 60 + 3 x 120)
Prai Thermal 450 2,700 "(fuel oil) (4 x 30 + 3 x 120)
Sultan Iskander Thermal 240 1,440 "(fuel oil) (2 x 120)
Sultan Ismail Thermal 110 660 At 5,000 kWh/kW(fuel oil) (2 x 10 + 3 x 30)
Connaught Bridge Thermal 80 400(fuel oil) (4 x 20)Combined cycle 90 540 At 6,000 kWh/kW(fuel oil) (1 x 90)
Melaka Thermal 30 150 At 5,000 kWh/kW(fuel oil) (3 x 10)
Gelugor Thermal 40 200(fuel oil) (4 x 10)
Malim Nawar Thermal 52 260(fuel oil) (1 x 12 + 2 x 20)
Gas turbines Diesel 100 100 At 1,000 kWh/kW(5 x 20)
Chenderoh Hydro 40 220 Average runoff(4 x 10)
Woh Hydro 150 500 Average runoff(3 x 50)
Jor Hydro 100 350 Average runoff(4 x 25)
Temengor Hydro 348 910 Average runoff(4 x 87)
Bersia Hydro 72 240(3 x 24)
Kenering Hydro 80 460(2 x 40)
Total 2,582/a 12,730/a
/a Excludes isolated diesel generating plants.

-34 -ANNEX 8
MALAYSIA
ELEVENTH POWER PROJECT
Schedule of Additions of Generating Planits, 948
Energycapability
Station Unit MW Date Type (G0h) /a
Connaught Bridge 2 90 Apr 1984 Combustion 540gas turbine Turbines
(oil/gas)
Kenering 3 40 Mar 1984 Hydro 0
Paka Combine GT 1 100 Oct 1984 Gas turbine 5,400Cycle GT 2 100 Nov 1984 Gas turbine
GT 3 100 Jan 1985 Gas turbineGT 4 100 Feb 1985 Gas turbineGT 5 100 Apr 1985 Gas turbineGT 6 100 May 1985 Gas turbineST 7 100 Oct 1985 Steam turbineST 8 100 Jan 1986 Steam turbineST 9 100 Apr 1986 Steam turbine
Port Kelang 1 300 Aug 1985 Thermal 3,6002 300 Feb 1986 (oil/gas)
Kenyir 1 100 Jul 1985 Hydro 1,6002 100 Oct 1985 Hydro3 100 Dec 1985 Hydro4 100 Mar 1986 Hydro
Port Kelang II 3 300 Jun 1988 Thermal 3,6004 300 Dec 1988 (oil/coal/gas)
Total 2,630 13,740
/a Energy capability for hydro plants on the basis of average runoff, and forthermal plants at 6,000 kWh per installed kW.
ANNEX 9
MALAYSIA
ELEVENTH POWER PROJECT
summary of the Distribution Expansion Proposals for the Period 1985-86-87in the States of Kedah, Kelantan, Trengganu, Pahang, Perak and Johor
No. Item Kedah Kelantan Trengganu Pahang Perak Johor Total
1. Number of Projects 27 2 33 42 140 39 2832. Number of Villages3. Number of Consumers
(a) Residential 2,940 1,800 425 7,969 37,236 31,710 82,088(b) Commercial 46 44 97 121 2,225 1,217 3,750(c) Industrial 6 4 11 - 188 3 212
Total 3,000 1,848 533 8,090 39,649 32,930 86,050
4. Sales (a) Residential (MWh) 3,326 1,760 602 10,351 53,102 74,401 143,542p.a. (b) Commercial ( " ) 666 6,595 4,836 1,163 27,534 14,860 55,654
(c) Industrial ( " ) 724 8,940 7,318 - 153,313 4,922 175,217
.Total 4f71 17,295 12,756 11,514 233,949 94,183 374,413
Physical Content
5. 33 kV lines (km) - 13 0 0 160 32.2 2056. 11 kV lines (km) 60 31 28.25 169.4 266 216.4 7717. Substations (No) 33 kV - 7 - - 215 6 228
11 kV 39 11 35 50 139 108 3828. LV lines 79 14 17 480 436 350.6 1,3329. Meters 3,000 1,948 533 8,090 39,649 32,930 86,050
10. cost (M$'000) 6,000 14,247 3,820 21,955 59,133 47,745 152,900
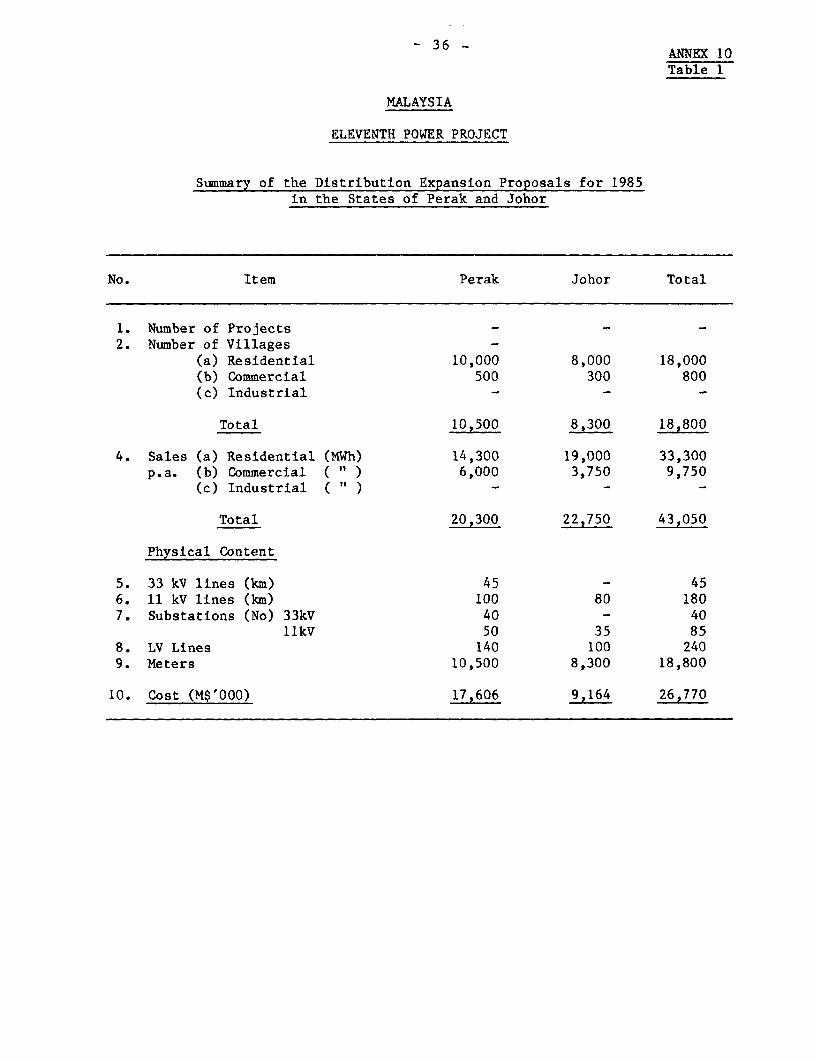
- 36 - ANNEX 10
Table 1
MALAYSIA
ELEVENTH POWER PROJECT
Summary of the Distribution Expansion Proposals for 1985in the States of Perak and Johor
No. Item Perak Johor Total
1. Number of Projects2. Number of Villages
(a) Residential 10,000 8,000 18,000(b) Commercial 500 300 800(c) Industrial - - -
Total 10,500 8,300 18,800
4. Sales (a) Residential (MWh) 14,300 19,000 33,300p.a. (b) Commercial ( " ) 6,000 3,750 9,750
(c) Industrial ( " )- - -
Total 20,300 22,750 43,050
Physical Content
5. 33 kV lines (km) 45 - 456. 11 kV lines (km) 100 80 1807. Substations (No) 33kV 40 - 40
llkV 50 35 858. LV Lines 140 100 2409. Meters 10,500 8,300 18,800
10. Cost (M$'000) 17,606 9,164 26,770
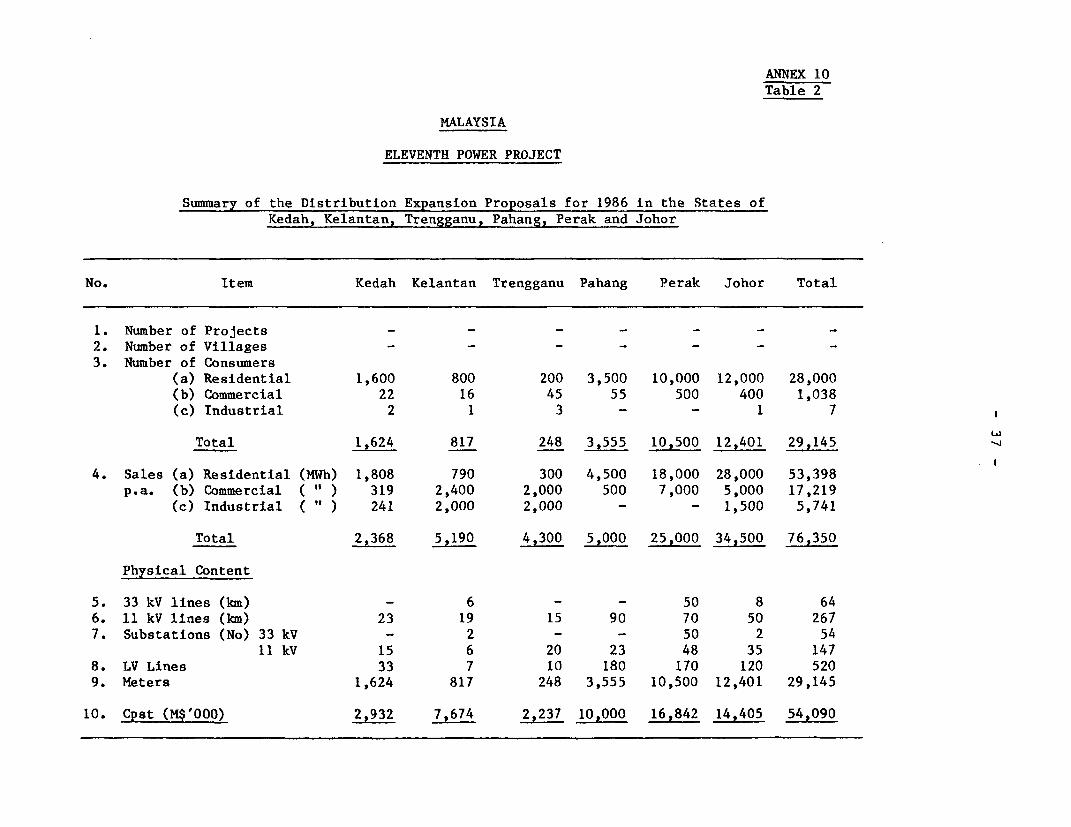
ANNEX 10Table 2
MALAYSIA
ELEVENTH POWER PROJECT
Summary of the Distribution Expansion Proposals for 1986 in the States ofKedah, Kelantan, Trengganu, Pahang, Perak and Johor
No. Item Kedah Kelantan Trengganu Pahang Perak Johor Total
1. Number of Projects - - - - - -
2. Number of Villages - - - - - - -
3. Number of Consumers(a) Residential 1,600 800 200 3,500 10,000 12,000 28,000(b) Commercial 22 16 45 55 500 400 1,038(c) Industrial 2 1 3 - - 1 7
Total 1,624 817 248 3,555 10,500 12,401 29,145
4. Sales (a) Residential (MWh) 1,808 790 300 4,500 18,000 28,000 53,398p.a. (b) Commercial ( ' ) 319 2,400 2,000 500 7,000 5,000 17,219
(c) Industrial ( " ) 241 2,000 2,000 - - 1,500 5,741
Total 2,368 5,190 4,300 5,000 25,000 34,500 76,350
Physical Content
5. 33 kV lines (km) - 6 - - 50 8 64
6. 11 kV lines (km) 23 19 15 90 70 50 2677. Substations (No) 33 kV - 2 - - 50 2 54
11 kV 15 6 20 23 48 35 1478. LV Lines 33 7 10 180 170 120 5209. Meters 1,624 817 248 3,555 10,500 12,401 29,145
10. Cpst (M$'000) 2,932 7,674 2,237 10,000 16,842 14,405 54,090
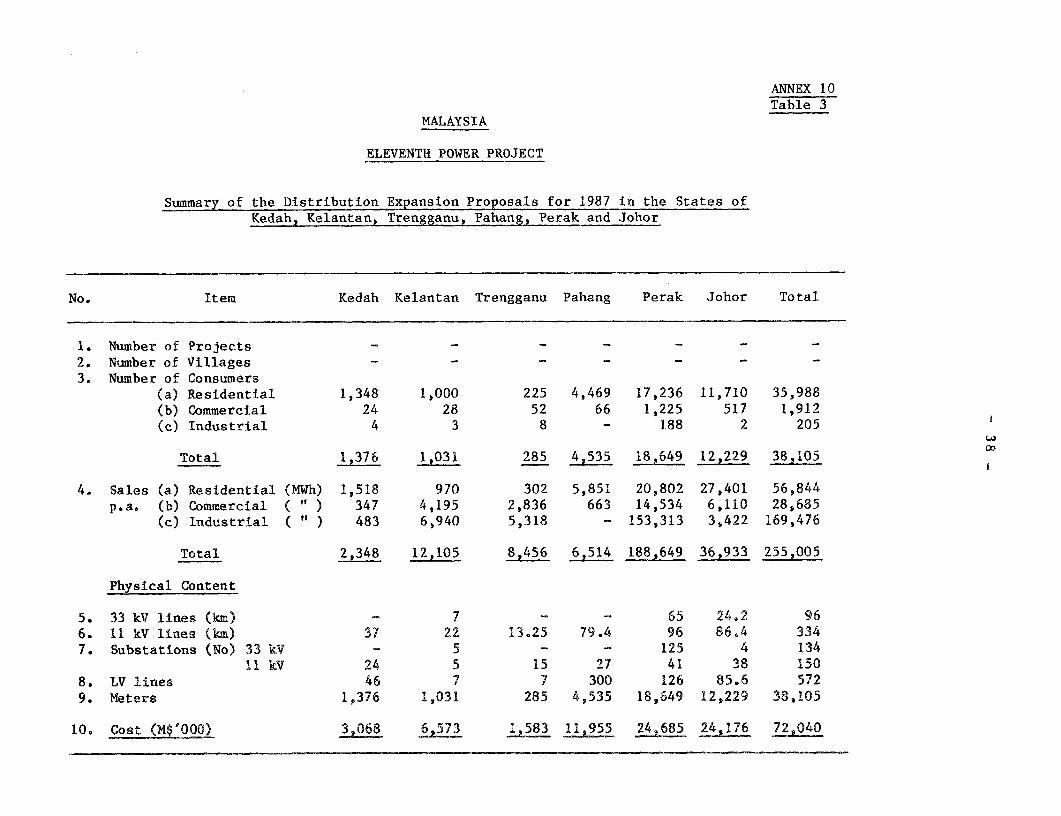
ANNEX 10Table 3
MALAYSIA
ELEVENTH POWER PROJECT
Summary of the Distribution Expansion Proposals for 1987 in the States ofKedah, Kelantan, Trengganu, Pahang, Perak and Johor
No. Item Kedah Kelantan Trengganu Pahang Perak Johor Total
1. Number of Projects2. Number of Villages -3. Number of Consumers
(a) Residential 1,348 1,000 225 4,469 17,236 11,710 35,988(b) Commercial 24 28 52 66 1,225 517 1,912(c) Industrial 4 3 8 - 1.88 2 205
Total 1, 31 285 4,535 18,649 12,229 38X105
4. Sales (a) Residential (MWh) 1,518 970 302 5,851 20,802 27,401 56,844p.a. (b) Commercial ( " ) 347 4,195 2,836 663 14,534 6,110 28,685
(c) Industrial ( " ) 483 6,940 5,318 - 153,313 3,422 169,476
Total 2p348 12,105 8,456 6,514 188,649 36,933 255,005
Physical Content
5. 33 kV lines (km) 7 - - 65 24,2 966. 11 kV lines (km) 37 22 13.25 79.4 96 8604 3347. Substations (No) 33 kV - 5 - - 125 4 134
11 kV 24 5 15 27 41 38 150
8. LV lines 46 7 7 300 126 85.6 5729. Meters 1,376 1,031 285 4,535 18,649 12,229 38,105
10, Cost (M$'OO0) 3,068 6,573 1,583 11,955 2 4,176 72 040

ANNEX 11-39 Table 1
MALAYSIA
ELEVENTH POWER PROJECT
Cost Estimate -275 kV Nalacca-Yong Peng-Scudai Line(233 km)
Cost M$ millionsSr.No. Item Foreign Local Total
1. Towers and fittings 19.1 - 19.12. Conductors and accessories 19.2 - 19.23. Survey and compensation - 9.5 9.54. Right of way and access roads - 1.1 1.15. Tower foundations and erection - 12.5 12.56. Stringing and Commissioning - 5.1 5.17. Overheads and administration - 7.8 7.8
Subtotal line 38.3 36.0 74.3
8. 275 kV substation at Yong Peng andextension at Melaka (10 switching bays) 9.2 2.0 11,2
9. Extension of 132 kV substations atYong Peng and Skudai (9 bays) 4.4 1.0 5.4
10. 2 x 180 MVA, 275/132 kV transformers 2.4 - 2.411. Land and civil works - 3.5 3.512. Overheads and administration - 1.5 1.5
Subtotal substations 16.0 8.0 24.0
Total Base Cost 54.3 44.0 98.3
13, Physical contingency (10%) 5.4 4.4 9.814. Price contingency 13.4 13.9 27.3
Total Project Cost 73.1 62.3 135.4

- 40 -ANNEX 11Table 2
MALAYSIA
ELEVENTH POWER PROJECT
Cost Estimate - 132 kV Lines and Substations(Kota Tinggi-Tg. Ramunia, 73 km and Kluang-Mersing, 87 km)
Cost M$ millionsSr.No. Item Foreign Local Total
1. Conductors 5.0 - 5.02. Towers, fillings and accessories 10.0 0.2 10.23. Survey and compensation - 6.2 6.24. Clearance and right of way and access roads - 0.7 0.75. Foundations and tower erection - 11.3 11.36. Stringing and commissioning - 3.0 3.0
Subtotal lines 15.0 21.4 36.4
7. Substation land and civil works - 2.0 2.08. 132 kV switching bays (14 Nos) 4.9 0.7 5.69. 4 x 15 MVA transformers 1.4 0.2 1.610. 11 kV switching bays (19 Nos) 0.6 0.1 0.711. Control and auxilliary equipment 0.2 0.1 0.3
Subtotal substations 7.1 3.1 10.2
12. Administration and overheads - 2.5 2.5
Total Base Cost 22.1 27.0 49.1
13. Physical contingencies (10%) 2.2 2.7 4.914. Price contingencies 2.8 5.6 8.4
Total cost 27.1 35.3 62.4

- 41 - ANNEX 11
Table 3
MALAYSIA
ELEVENTH POWER PROJECT
Cost Estimate - Distribution
Cost M$ millionsSr.No. Item Foreign Local Total
1. 33 kV lines 9.6 6.4 16.0
2. 11 kV lines 29.2 10.3 39.5
3. Substations 33 kV/400 V 22.8 15.2 38.011 kV/400 V 10.8 7.2 18.0
4. 400 V lines - 21.3 21.3
5. Service connections and meters 2.3 3.9 6.2
Total Base Cost /a 74.7 64.3 139.0
6. Physical contingency 7.5 6.4 13.9
7. Price contingency 19.8 22.3 42.1
Total Cost 102.0 93.0 195.0
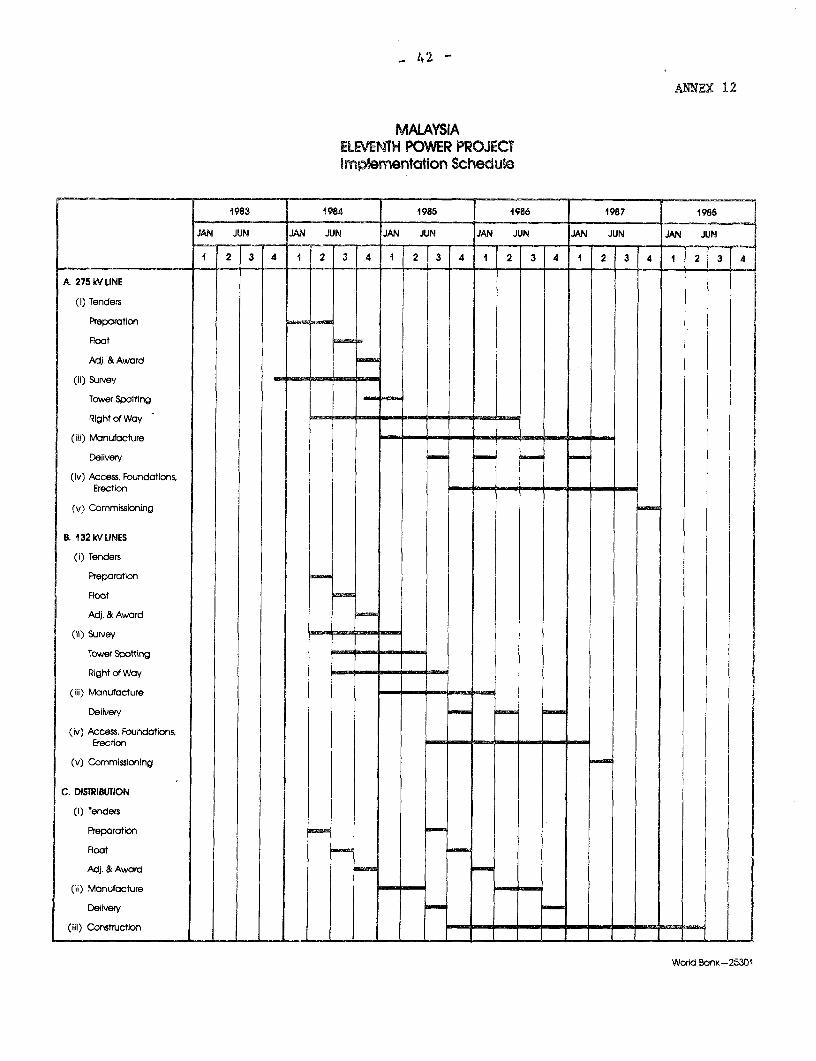
4 42 -
AMEX 12
MALAYSIAELEVENTH POWER PROJECTImplementation Schedule
1983 1984 1985 1986 1987 1988
JAN JUN JAN JUN JAN JUN JAN JUN JAN JUN JAN JUN
1 234 1 2 3 4 1 2 3 4 1 2 34 1 2134 1 213 4
A 275 W _LINE
(I) Tenders
Preparation
Adj. & Award
(ii) Survey
Tower Spotting
Right of Way
(iii) Manufacture I - - - - -_ - -
Delivery
(lv) Access, Foundations,
Erection- - -- -
(v) Commissioning
B. 132 WkVLINES
(I) Tenders
Preparation
Float
Adj. & Award
(ii) Survey
Tower Spotting
Right of Way | _ -
(Ili) Manufacture I - - - a
Delivery
(iv) Access, Foundations,Erection- - - - -
(v) Commissioning
C. DISTRIBUTION
(I) Tenders
Preparation
Float
Adj. & Award
(ii) Manufacture
Delivery
(Ill) Constructlon - - - - - -
World Bank-25301

- 43 - ANNEX 13
MALAYSIA
ELEVENTH POWER PROJECT
Disbursement Schedule
Bank Disbursement US$ millions Cumulative percent disbursementFY Semester Semester Cumulative Project Bank Profile /a
1985 I 1.0 1.0 1.4 3.3II 5.0 6.0 8.6 8.3
1986 I 6.0 12.0 17.1 15.2II 7.0 19.0 27.1 23.9
1987 1 10.0 29.0 41.4 34.0II 14.0 43.0 61.4 44.9
1988 I 12.0 55.0 78.6 55.8II 10.0 65.0 92.9 66.2
1989 I 5.0 70.0 100.0 75.3II - - 83.1
/a For 49 distribution and transmission projects Bankwide, in the period1971-81 (memo by Hans A. Adler of June 9, 1982).

44 ANNEX 14Table 1
MALAYSIA
ELEVENTH POWER PROJECT
National Electricity Board of the States of Malaya
Income Statements, FY76-82(M$ million)
FY ended August 31 1976 1977 1978 1979 1980 1981 1982
Sales (GWh) 4,543.0 5,297.0 5,934.0 6,540.0 7,265.0 7,802.8 8,368.0Sales increase (%) 14.1 16,6 12.0 10.2 11.1 7.4 7.3Average price per kWh (Me) 10.7 10.7 10.8 12.6 15.0 20.2 22.0
Revenue from sale of electricity 487.9 566.1 643.4 821.6 1,091.4 1,578.0 1,839.7Other operating revenue 5.3 10.4 11.9 11.8 5.4 11.1 26.0
Total Revenues 493.2 576.5 655.3 833.4 1,096.8 1,589.1 1,865.7
Operating ExpensesPurchased power 12.8 14.3 14.3 27.8 34.8 51.3 52.8Fuel 210.4 241.3 280.8 412.6 744.6 1,003.5 1,152.3Administrative, operations andmaintenance 100.2 139.7 129.2 166.8 183.4 241.1 258.6
Taxes 11.0 25.0 15.0 - - - -
Total Costs 334.4 420.3 439.3 607.2 962.8 1,295.9 1,463.7
Income Before Depreciation 158.8 156.2 216.0 226.2 134.0 293.2 402.0
Depreciation /a 67.3 78.2 88.3 131.3 153.3 129.4 133.8
Income Before Interest 91.5 78.0 127.2 94.9 (19.3) 163.8 268.2
Nonoperating income /b - - - 0.6 14.2 26.6 31.8Interest charged to operations 29.9 31.9 48.5 60.9 77.0 94.1 88.0
Net Income 61.6 46.1 79.2 34.6 (82.1) 96.3 212.0
Appropriations of Net IncomeDividends 5.0 6.4 7.1 8.7 - - -Retained earnings 56.6 39.7 72.1 25.9 (82.1) 96.3 212.0Operating ratio (%) 68 73 67 73 88 82 86Rate of return (%) 7 5 8 5 (0.2) 7 9
/a On revalued fixed assets.lb Including Government reimbursement to cover operating losses in rural/diesel stations.
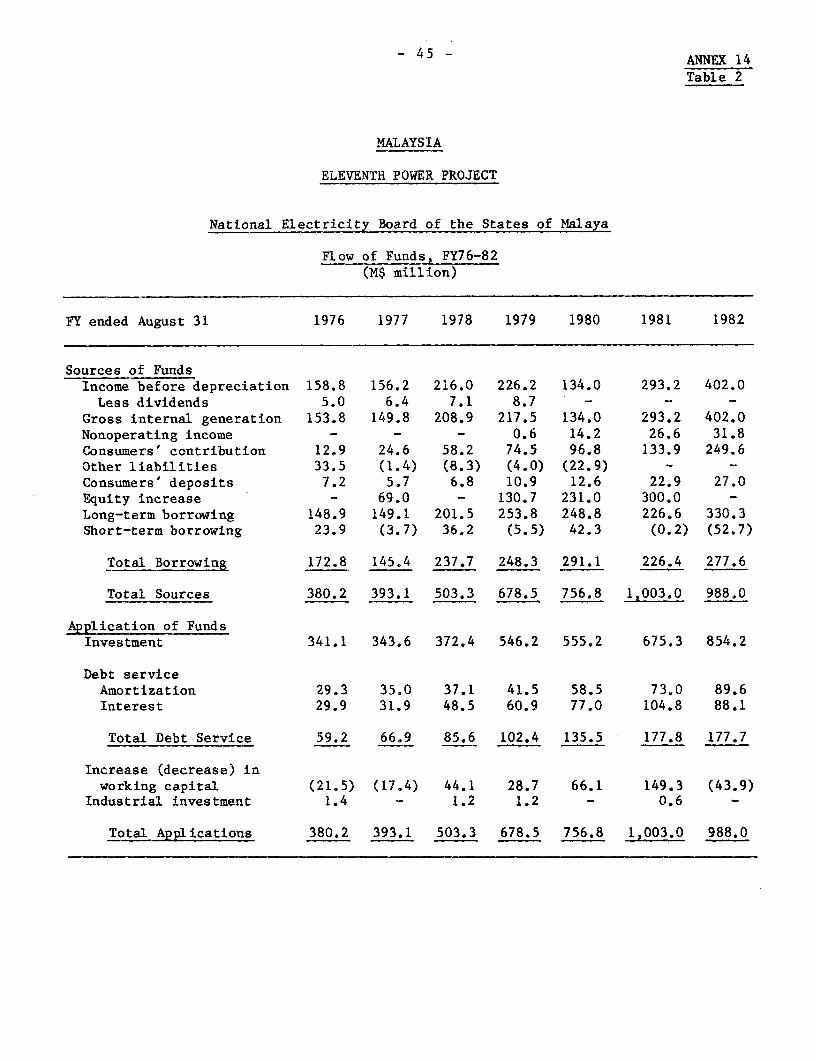
- 45 - ANNEX 14
Table 2
MALAYSIA
ELEVENTH POWER PROJECT
National Electricity Board of the States of Malaya
Flow of Funds, FY76-82(M$ million)
FY ended August 31 1976 1977 1978 1979 1980 1981 1982
Sources of FundsIncome before depreciation 158.8 156.2 216.0 226.2 134.0 293.2 402.0Less dividends 5.0 6.4 7.1 8.7 - - -
Gross internal generation 153.8 149.8 208.9 217.5 134.0 293.2 402.0Nonoperating income - - - 0.6 14.2 26.6 31.8Consumers' contribution 12.9 24.6 58.2 74.5 96.8 133.9 249.6Other liabilities 33.5 (1.4) (8.3) (4.0) (22.9) - -Consumers' deposits 7.2 5.7 6.8 10.9 12.6 22.9 27.0Equity increase - 69.0 - 130.7 231.0 300.0 -Long-term borrowing 148.9 149.1 201.5 253.8 248.8 226.6 330.3Short-term borrowing 23.9 (3.7) 36.2 (5.5) 42.3 (0.2) (52.7)
Total Borrowing 172.8 145.4 237.7 248.3 291.1 226.4 277.6
Total Sources 380.2 393.1 503.3 678.5 756.8 1,003.0 988.0
Application of FundsInvestment 341.1 343.6 372.4 546.2 555.2 675.3 854.2
Debt serviceAmortization 29.3 35.0 37.1 41.5 58.5 73.0 89.6Interest 29.9 31.9 48.5 60.9 77.0 104.8 88.1
Total Debt Service 59.2 66.9 85.6 102.4 135.5 177.8 177.7
Increase (decrease) inworking capital (21.5) (17.4) 44.1 28.7 66.1 149.3 (43.9)
Industrial investment 1.4 - 1.2 1.2 - 0.6 -
Total Applications 380.2 393.1 503.3 678.5 756.8 1,003.0 988.0
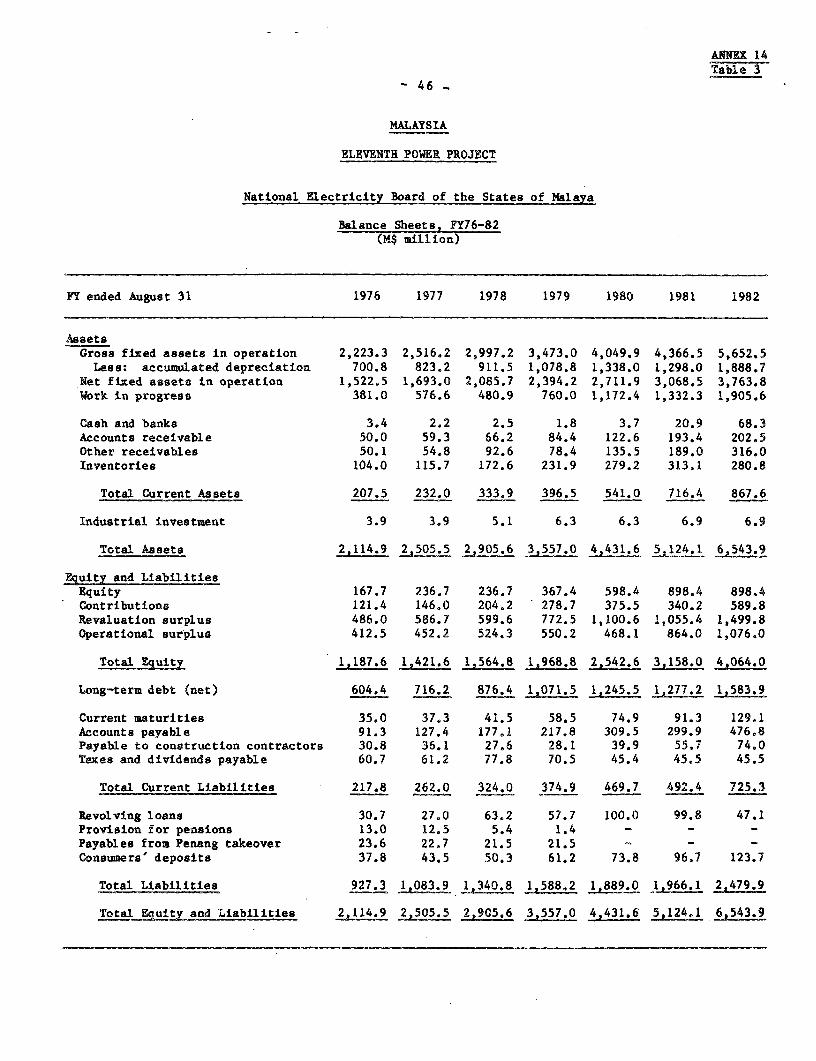
ANNEX 14Tabl e 3
-46_
MALAYSIA
ELEVENTH POWER PROJECT
National Electricity Board of the States of Malaya
Balance Sheets, FY76-82(M$ million)
FY ended August 31 1976 1977 1978 1979 1980 1981 1982
AssetsGross fixed assets in operation 2,223.3 2,516.2 2,997.2 3,473.0 4,049.9 4,366.5 5,652.5Less: accumulated depreciation 700.8 823.2 911.5 1,078.8 1,338.0 1,298.0 1,888.7
Net flxed assets in operation 1,522.5 1,693.0 2,085.7 2,394.2 2,711.9 3,068.5 3,763.8Work in progress 381.0 576.6 480.9 760.0 1,172.4 1,332.3 1,905.6
Cash and banks 3.4 2.2 2.5 1.8 3.7 20.9 68.3Accounts receivable 50.0 59.3 66.2 84.4 122.6 193.4 202.5Other receivables 50.1 54.8 92.6 78.4 135.5 189.0 316,0Inventories 104.0 115.7 172.6 231.9 279.2 313.1 280.8
Total Current Assets 207.5 232.0 333.9 396.5 541.0 716.4 867.6
Industrial investment 3.9 3.9 5.1 6.3 6.3 6.9 6.9
Total Assets 22114 505.5 2,905.6 3557.0 4j431.6 5_124.1 6,543.9
Equity and LiabilitiesEquity 167.7 236.7 236.7 367.4 598.4 898.4 898.4Contributions 121.4 146.0 204.2 278.7 375.5 340.2 589.8Revaluation surplus 486.0 586.7 599.6 772.5 1,100.6 1,055.4 1,499.8Operational surplus 412.5 452.2 524.3 550.2 468.1 864.0 1,076,0
Total Equity 1,187.6 1,421.6 1,564.8 _1968.8 2,542.6 3,158.0 4,064.0
Long-term debt (net) 604.4 716.2 876.4 1,071.5 1,245.5 i_77.2 1,583.9
Current maturities 35.0 37,3 41.5 58.5 74.9 91.3 129.1Accounts payable 91.3 127.4 177.1 217.8 309.5 299.9 476,8Payable to construction contractors 30.8 36.1 27.6 28.1 39.9 55.7 74.0Taxes and dividends payable 60.7 61.2 77.8 70.5 45.4 45.5 45.5
Total Current Liabilities 217.8 262.0 324.0 374.9 469.7 492.4 725.3
Revolving loans 30.7 27.0 63.2 57.7 100.0 99.8 47.1Provision for pensions 13.0 12.5 5.4 1.4 - - -Payables from Penang takeover 23.6 22.7 21.5 21.5 -Consumers' deposits 37.8 43.5 50.3 61.2 73.8 96.7 123.7
Total Liabilities 927.3 1,083.9 1 340 8 1 588 2 1 889.0 12966.1 2_479.9
Total Equity and Liabilities 2,114.9 2,505.5 2,905.6 3,557.0 4 431.6 5124.1 6543.9

ANNEX 14- 47 - 4501Table 4
MALAYSIA
ELEVENTH POWER PROJECT
National Electricity Board of the States of Malaya
Perforsisn.e Indicatars, FY76-83(Percentage change in relatian to the prenieus year is pre.ented In brackets)
FY ended Aogust 31 1976 1977 1978 1979 1980 1981 1982 1983/d
Iostalled capacity (MW) 1,187.8 (3.8) 1,316.4 (10.8) 1,439.8 (9.4) 1,795.7 (24.7) 2,167.6 (20.7) 2,178 2,4.08 2,574laniscn detand (MW) 843.8 (22.9) 975.1 (15.6) 1,162.0 (11.0) 1,297.5 (11.7) 1,457.0 (12.3) 1,541 1,637 1,767
Energy generated and pyrchased (GWh) 5,356.9 (15.1) 6,257.8 (16.8) 6,991.5 (11.7) 7,651.0 (9.4) 8,466.3 (10.6) 9,130 9,817 10,330energy sent oat (GWh) 5,143.2 (14.9) 5,953.6 (16.7) 6,651.4 (11.7) 7,302.4 (9.8) 8,071.3 (10,5) 8,666 9,302 9,796
MarketEnergy sales (GWh) 4,543 (14.1) 5,297 (16.6) 5,934.2 (12.0) 6,540.6 (10.2) 7,265 (11.1) 7,902.8 (7.4) 8,368 (7.2) 9,347 (8.1)Syaten lances (X) 11.0 11.0 10.8 10.4 10.0 10.0 10.3 7.6Anneal lead factor (X) 72.8 68.9 69.5 71.5 67.6 67.5 68.5 66.7Na. of cansumert ('000) 840 916 (9.2) 1,013 (10.5) 1,128 (11.3) 1,258 (11.6) 1,390 1,538 1,807Na. of enyply.en (end of year) 12,463 13,746 (7.6) 15,590 (13.3) 17,679 (13.4) 19,248 (8.8) 21,144 (9.9) 24,160 (14.3) 24,561 (1.7)kWh sald pet employee ('000) (anerages) 355 404 404 393 386 369 346 368
Prof0itablilitrAverage rate ef ietern (%) Ia 7.2 5.3 7.5 4.9 (0.2) 6.5 9.1 12.2Average tariff - total (MC/kIWh) 10.7 10.7 13.8 12.5 15.0 20.2 22.0 22.0Averoge operattng cent (MCIkWh) /b 8.8 9.4 8.9 10.9 14.9 18.3 19.1 1.1Anerage fuel coot (MC/kWh) 4.6 4.5 4.7 6.3 10.2 13.4 14.3 13.3Self fie--cing rastio(%) 46.0 38.5 35.0 36.5 7.9 11.5 50.7 58.3Operating ratio (0) 81.0 86.0 80.0 85.0 100.5 89.6 85.6 81.2Sn. of days bills notstandiog 37 39 38 37 41 45 40 5,1
Debt/eqeity ratio (excluding revalnationnurplas) 46/54 46/54 47/53 46/54 46/54 40/60 43/60 39/61
Debt sernices coetage 2.6 2.2 2.4 2,1 1.1 1.5 3.1 3.8
LiquidityNet working capital (M$ million) Ic -10.3 -30.0 9.9 21.6 71.3 160.0 (43.9) (127.4)Carrent ratio (times) /c 1.0 0.9 1.0 1.1 1.2 1.5 1.2 1.1
/a After tases. en reralued assets.7S Per .nit sold. Tones and depreciation are included is operating cents.77 incladesa -rent nat-rities.7; U-nadited.
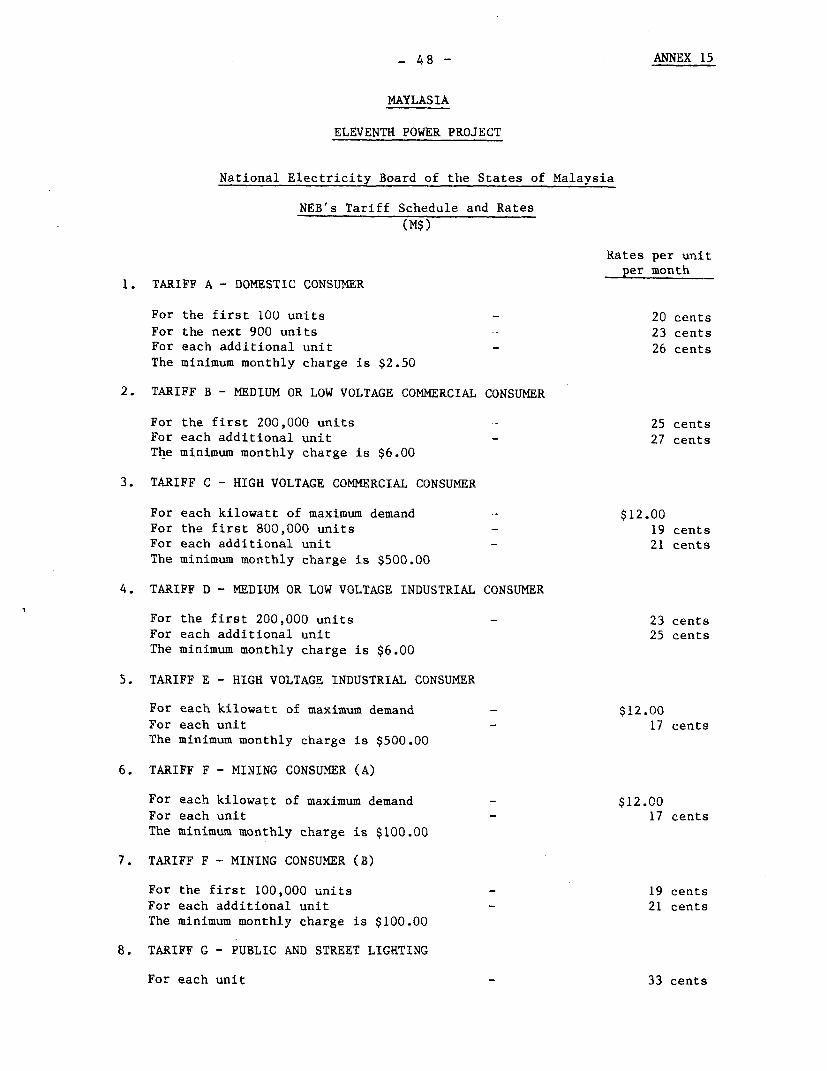
_ 48 - ANNEX 15
MAYLASIA
ELEVENTH POWER PROJECT
National Electricity Board of the States of Malaysia
NEB's Tariff Schedule and Rates
(M$)
Rates per unitper month
1. TARIFF A - DOMESTIC CONSUMER
For the first 100 units 20 centsFor the next 900 units 23 centsFor each additional unit 26 centsThe minimum monthly charge is $2.50
2. TARIFF B - MEDIUM OR LOW VOLTAGE COMMERCIAL CONSUMER
For the first 200,000 units 25 centsFor each additional unit 27 centsThe minimum monthly charge is $6.00
3. TARIFF C - HIGH VOLTAGE COMMERCIAL CONSUMER
For each kilowatt of maximum demand -- $12.00For the first 800,000 units 19 centsFor each additional unit 21 centsThe miniaum monthly charge is $500.00
4. TARIFF D - MEDIUM OR LOW VOLTAGE INDUSTRIAL CONSUMER
For the first 200,000 units 23 centsFor each additional unit 25 centsThe minimum monthly charge is $6.00
5. TARIFF E - HIGH VOLTAGE INDUSTRIAL CONSUMER
For each kilowatt of maximum demand - $12.00For each unit 17 centsThe minimum monthly charge is $500.00
6. TARIFF F - MINING CONSUMER (A)
For each kilowatt of maximum demand - $12.00For each unit 17 centsThe minimum monthly charge is $100.00
7. TARIFF F - MINING CONSUMER (B)
For the first 100,000 units 19 centsFor each additional unit 21 centsThe minimum monthly charge is $100.00
8. TARIFF G - PUBLIC AND STREET LIGHTING
For each unit 33 cents
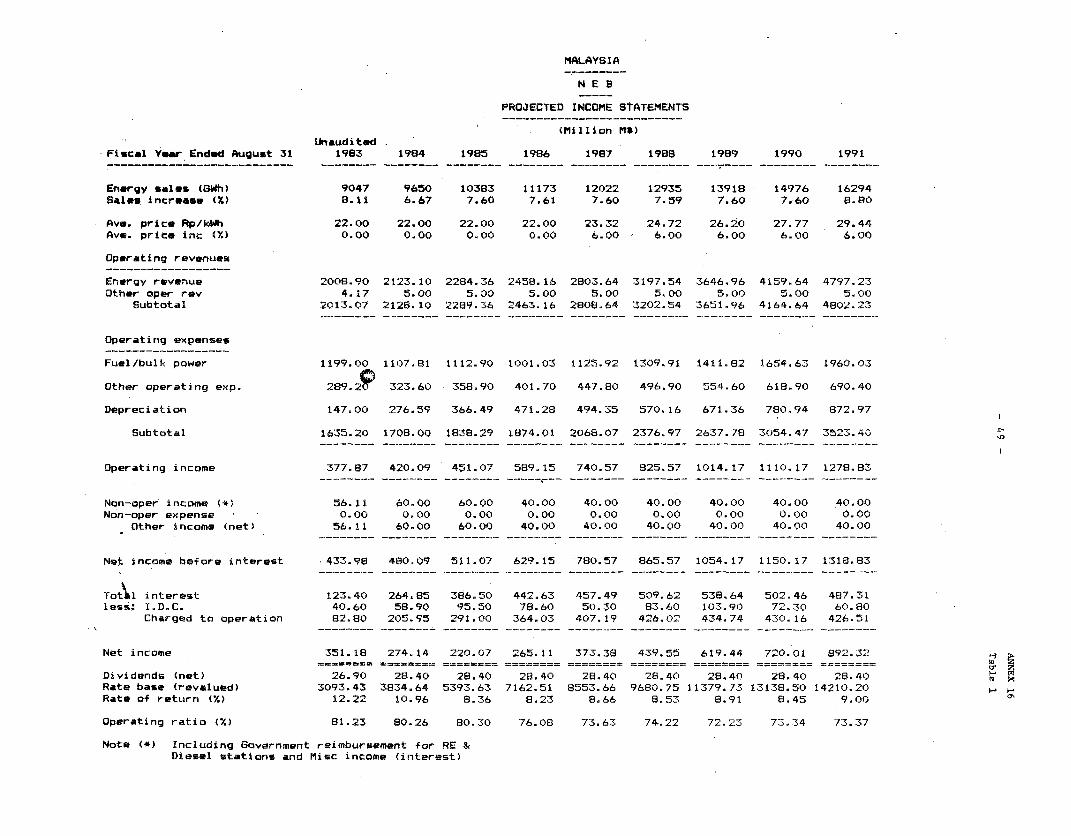
MALAYSIA
N E B
PROJECTED INCOME STATEMENTS--------------------------
(Million MV
UnauditedFiscal Yew Ended August 31 1983 1984 1985 1986 1987 1988 1989 1990 1991
Energy sales (GWh) 9047 9650 10383 11173 12022 12935 13918 14976 16294
Sale- increase (X) 8.11 6.67 7.60 7.61 7.60 7.59 7.60 7.60 8.80
Ave. price Rp/kblh 22.00 22.00 22.00 22.00 23.32 24.72 26.20 27.77 29.44
Ave. price inc (X) 0.00 0.00 0.00 0.00 6.00 6.00 6.00 6.00 6.00
Operating revenues__________________
Energy revenue 2008.90 2123.10 2284.36 2458.16 2803.64 3197.54 3646.96 4159.64 4797.23
Other oper rev 4.17 5.00 5.00 5.00 5.00 5.00 5.00 5.00 5.00
Subtotal 2013.07 2126.10 2289.36 2463.16 2808.64 3202.54 3651.96 4164.64 4802.23
Operating expenses__________________
Fuel/bulk power 1199.00 1107.81 1112.90 1001.03 1125.92 1309.91 1411.82 1654.63 1960.03
Other operating exp. 289.2w 323.60 358.90 401.70 447.80 496.90 554.60 618.90 690.40
Depreciation 147.00 276.59 366.49 471.28 494.35 570.16 671.36 780.94 872.97
Subtotal 1635.20 1708.00 1838.29 1874.01 2068.07 2376.97 2637.78 3054.47 3523.40
Operating income 377.87 420.09 451.07 589.15 740.57 825.57 1014.17 1110.17 1278.63
Non-oper income (*) 56.11 60.00 60.00 40.00 40.00 40.00 40.00 40.00 40.00
Non-oper expense 0.00 0.00 0.00 0.00 0.00 0.00 0.00 0.00 0.00
Other income (net) 56.11 60.00 60.00 40.00 40.00 40.00 40.00 40.00 40.00
Net income before interest 433.98 480.09 511.07 629.15 780.57 865.57 1054.17 1150.17 1318.83
ToatIl interest 123.40 264.85 386.50 442.63 457.49 509.62 538.64 502.46 487.31
lesss I.D.C. 40.60 58.90 95.50 78.60 50.30 83.60 103.90 72.30 60.80
Charged to operation 82.80 205.95 291.00 364.03 407.19 426.02 434.74 430.16 426.51
Net income 351.18 274.14 220.07 265.11 373.38 439.55 619.44 720.01 892.32 H
Dividends (net) 26.90 28.40 28.40 28.40 28.40 28.40 28.40 28.40 28.40
Rate base (revalued) 3093.43 3834.64 5393.63 7162.51 8553.66 9680.75 11379.73 13138.50 14210.20
Rate of return (.) 12.22 10.96 8.36 8.23 8.66 8.53 8.91 8.45 9.00
Operating ratio (%) 81.23 80.26 60.30 76.08 73.63 74.22 72.23 73.34 73.37
Note (*) Including Government reimbursement for RE &
Diesel stations and Misc income (interest)
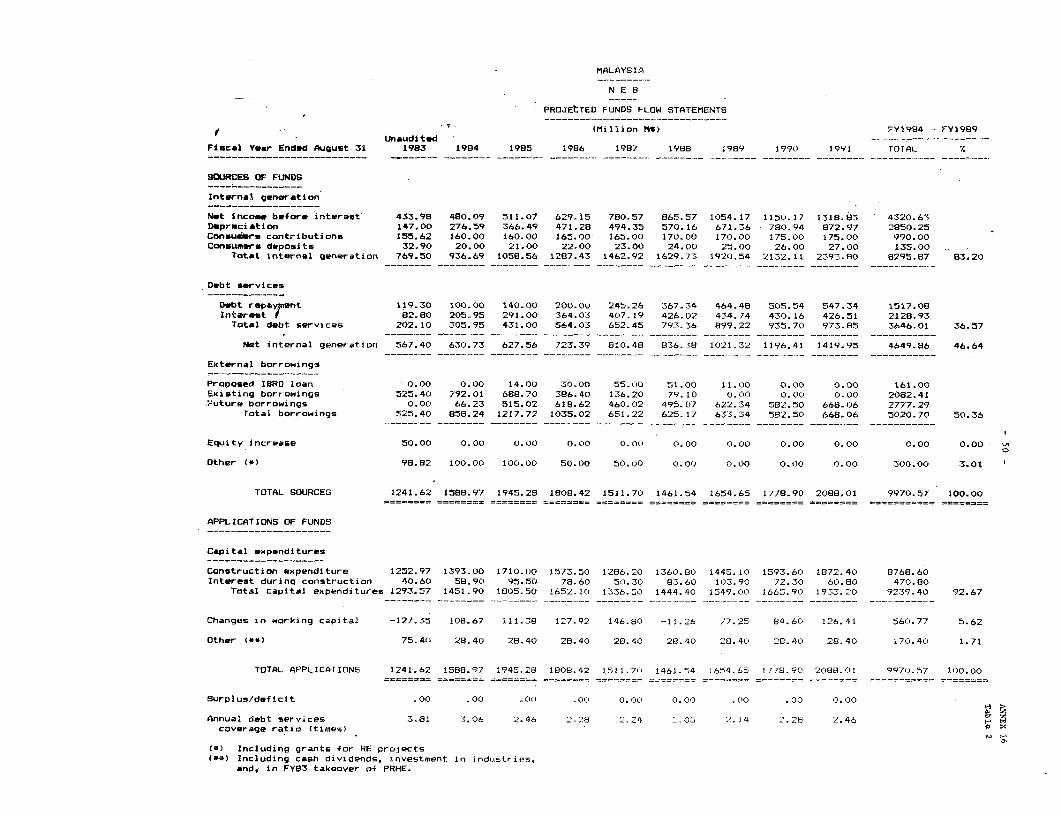
MALAYSIA
N E 8
PROJEtTED FUNDS FLOW STATEMENTS-------------------------------
v ' (Million M$) FY1984 - FY1989Unaudited
Fiscal Year Ended August 31 1983 1984 1985 1986 1987 1988 1969 1990 1991 TOTAL %
SOURCES OF FUNDS
Internal generation
Net income before interest 433.98 480.09 511.07 629.15 780.57 865.57 1054.17 1150.17 1318.83 4320.63Depreciation 147.00 276.59 366.49 471.28 494.35 570.16 671.36 780.94 872.97 2850.25Consumers contributions 155.62 160.00 160.00 165.00 165.00 170.00 170.00 175.00 175.00 990.00Consumers deposits 32.90 20.00 21.00 22.00 23.00 24.00 25.00 26.00 27.00 135.00
Total internal generation 769.50 936.69 1058.56 1287.43 1462.92 1629.73 1920.54 2132.11 2393.80 8295.87 83.20
Debt services
Dwbt rspaypent 119.30 100.00 140.00 200.00 245.26 367.34 464.48 505.54 547.34 1517.08Int-re-t a 82.80 205.95 291.00 364.03 407.19 426.02 434.74 430.16 426.51 2128.93
Total dabt services 202.10 305.95 431.00 564.03 652.45 793.36 899.22 935.70 973.85 3646.01 36.57
Net internal generation 567.40 630.73 627.56 723.39 810.48 836.38 1021.32 1196.41 1419.95 4649.86 46.64
External borrowings,
Proposed IBRD loan 0.00 0.00 14.00 30.00 55.00 51.00 11.00 0.00 0.00 161.00Existing borrowings 525.40 792.01 688.70 386.40 136.20 79.10 0.00 0.00 0.00 2082.41Future borrowings 0.00 66.23 515.02 618.62 460.02 495.07 622.34 582.50 668.06 2777.29
Total borrowings 525.40 858.24 1217.72 1035.02 651.22 625.17 633.34 582.50 668.06 5020.70 50.36
Equity increase 50.00 0.00 0.00 0.00 0.00 0.00 0.00 0.00 0.00 0.00 0.00 t
Other 1*) 98.82 100.00 100.00 50.00 50.00 0.00 0.00 0.00 0.00 300.00 3.01
TOTAL SOURCES 1241.62 1588.97 1945.28 1808.42 1511.70 1461.54 1654.65 1778.90 2088.01 9970.57 100.00
APPLICATIONS OF FUNDS
Capital expenditures
Construction expenditure 1252.97 1393.00 1710.00 1573.50 1286.20 1360.80 1445.10 1593.60 1872.40 8768.60Interest during construction 40.60 58.90 95.50 78.60 50.30 83.60 103.90 72.30 60.80 470.80
Total capital expenditures 1293.57 1451.90 1805.50 1652.10 1336.50 1444.40 1549.00 1665.90 1933.20 9239.40 92.67
Changes in working capital -127.35 108.67 111.38 127.92 146.80 -11.26 77.25 84.60 126.41 560.77 5.62
Other (**) 75.40 28.40 28.40 28.40 28.40 28.40 28.40 28.40 28.40 170.40 1.71
TOTAL APPLICATIONS 1241.62 1588.97 1945.28 18108.42 1511.70 1461.54 1654.65 1778.90 208B8.01 9970.57 100.00
Surplus/deficit .00 .00 .00 .00 .CC)0 u. 00 .0C) .0C . (0C)
Annual debt services 3.81 3.06 2.46 2.28 2.24 2.05 2.14 2.28 2.46coverage ratio (times) a x
(5) Including grants for RE projects(5*) Including cash dividends, investment in indLustriess
and, in FY83 takeover of PRHE.

MALAYSIA
N E B
PROJECTED BALANCE SHEETS
(Million M$)LUnaud i ted
Fiscal Year Ended August 31 1983 1984 1985 1986 1987 1988 1989 1990 1991
ABEUTS
Fixed assets
Plant in service 5961.40 7868.25 10456.32 13107.77 15140.85 17440.01 20923.70 23701.46 26182.38loss' Accum depreciation 1919.20 2310.94 2839.20 3509.23 4214.13 5037.15 6010.74 7152.32 8454.43Operating plant 4042.20 5557.30 7617.12 9598.S5 10926.72 12402.86 14912.96 16549.13 17727.95
Work in progress 2472.14 2368.54 2205.64 2003.14 2129.34 2223.54 1406.24 1594.14 2499.34Total fixed assets 6514.34 7925.84 9822.76 11601.69 13056.06 14626.40 16319.20 1i143.27 20227.29
Current assets______________
Cash and bank 69.60 78.34 94.51 121.64 144.96 110.73 119.60 110.85 127.01Consumer acct/ret-v 274.90 290.84 312.93 303.06 345.65 394.22 449.62 512.83 591.44Inventories 294.20 371.88 476.59 619.41 746.37 780.61 859.39 961.92 1073.19Other 299.00 345.00 396.75 456.26 S11.01 562.12 618.33 680.16 748.18
Total current assets 937.70 1086.06 1280.78 1500.37 1748.01 1847.67 2046.94 2265.76 2539.81
Other assets 3.60 3.60 3.60 3.60 3.60 3.60) 3.60 3.60 3.60
TOTAL ASSETS 745514 l9015.50 11107.14 13105.65 14807.66 16477.67 18369.74 20412.64 22770.70
EQUITY AND LIABILITIES
Equity
Paid-in capital 948.42 948.42 948.42 948.42 948.42 948.42 948.42 948.42 948.42
Retained earnings 1400.28 1646.02 1837.69 2074.40 2419.39 2830.54 3421.58 4113.18 4977.11
Revaluation reserve 1180.98 1417.18 1875.09 2473.19 3085.42 3781.53 4596.69 5535.80 6559.59
Grants/contributions 844.26 1104.26 1364.26 1579.26 1794.26 1964.26 2134.26 2309.26 2484.26
Total, equity 4373.94 5115.88 6025.46 7075.28 8247.48 9524.75 11100.94 12906.67 14969.38
Long term debt (LtD) 2119.00 2877.24 3954.96 4789.98 5195.95 5453.77 5622.62 5699.58 5820.30
less: Current portion 100.00 140.00 200.00 245.26 367.34 464.48 505.54 547.34 700.00
Not long term debt 2019.00 2737.24 3754.96 4544.73 4828.61 4989.29 5117.08 5152.24 5120.30
i ~ ~ ~ ~ ~ ~ ~ - - - - -- - - - - - - -_-- - - - - - - - - - - ------- - --- _ -- _ -__ --_ --__ -__-
4prrent liabilities
Current portion of LtD 100.00 140.00 200.00 245.26 367.34 464.48 505.54 547.34 700.00
Accounts payable 793.70 833.39 916.72 1008.40 1109.24 1220.16 1342.17 1476.39 1624.03
Other 0.00 0.00 0.00 0.00 0.00 0.00 0.00 0.00 0.00
Total current liab 893.70 973.39 1116.72 1253.65 1476.58 1684.64 1847.72 2023.73 2324.03
Other liabilities 169.00 189.00 210.00 232.00 255.00 279.00 304.00 330.00 357.00
TOTAL EQUITY AND LIAB 7455.64 9015.51 11107.14 13105.66 14807.67 16477.68 18369.74 20412.64 22770.71
Current ratio (times) 1.1 1.1 1.1 1.2 1.2 1.1 1.1 1.1 1.1
Debt of Debt+Equity (7. 39 43 47 SO 48 46 44 41 38
Acccounts receivable as 50 50 50 45 45 45 45 45 45 m
days of sales

MALAYSIA
N E B
PROJECTED SELF FINANCING RATIOS
(Million M$)Unaudited
Fiscal Year Ended August 31 1983 1984 1985 1986 1987 1988 1989 1990 1991
Funds from internal sources
Operating revenues 2013.07 2128.10 2289.36 2463.16 2808.64 3202.54 3651.96 4164.64 4802.23Consumer contributions 155.62 160.00 160.00 165.00 165.00 170.00 170.00 175.00 175.00Consumer deposits 32.90 20.00 21.00 22.00 23.00 24.00 25.00 26.00 27.00Other
Subtotal 2201.59 2308.10 2470.36 2650.16 2996.64 3396.54 3846.96 4365.64 5004.23
Less:
Operating expenses (a) 1465.88 1411.41 1451.80 1402.73 1573.72 1806.81 1966.42 2273.53 2650.43Debt service 202.10 .305.95 431.00 564.03 652.45 793.36 899.22 935.70 973.85Incr. in working capital -127.35 108.67 i.38 127.92 146.80 -11.26 77.25 84.60 126.41Other (**) 25.40 28.40 28.40 28.40 28.40 28.40 28.40 28.40 28.40
Subtotal 1566.03 1854.44 2022.58 2123.08 2401.36 2617.31 2971.29 3322.24 3779.09
Net internal sources 635.56 453.66 447.78 527.08 595.28 779.23 875.66 1043.40 1225.14 1
£-, M~~~~~~~~~~~~~~~~~~~~~~~~~~~~~~~~~~~~~~~~~~~~~U
3-year average C494.74 512.33 476.17 523.38 633.86 750.06 899.43 1048.07 1056.18
Capital expenditures
Total (incl. IDC) 1293.57 1451.90 1805.50 1652.10 1336.50 1444.40 1549.00 1665.90 1933.20Less: Investment in RE by
Government grants 98.82 100.00 100.00 50.00 50.00 0.00 0.00 0.00 0.00
Subtotal 1194.75 1351.90 1705.50 1602.10 1286.50 1444.40 1549.00 1665.90 1933.20
3-year average 1090.55 1417.38 1553.17 1531.37 1444.33 1426.63 1553.10 1716.03 1999.70
Self financing ratio (X) 58.28 32.01 28.83 34.42 41.21 54.62 56.38 60.80 61.27
Covenanted level (X) 15.00 20.00 25.00 25.00 30.00 30. 00 30. ZO.OO 30. o0 0o..
(*) Excluding Government reimbursementfor RE and diesel stations
(**) Including cash dividends, andinvestment in industries, etc.
4 a'
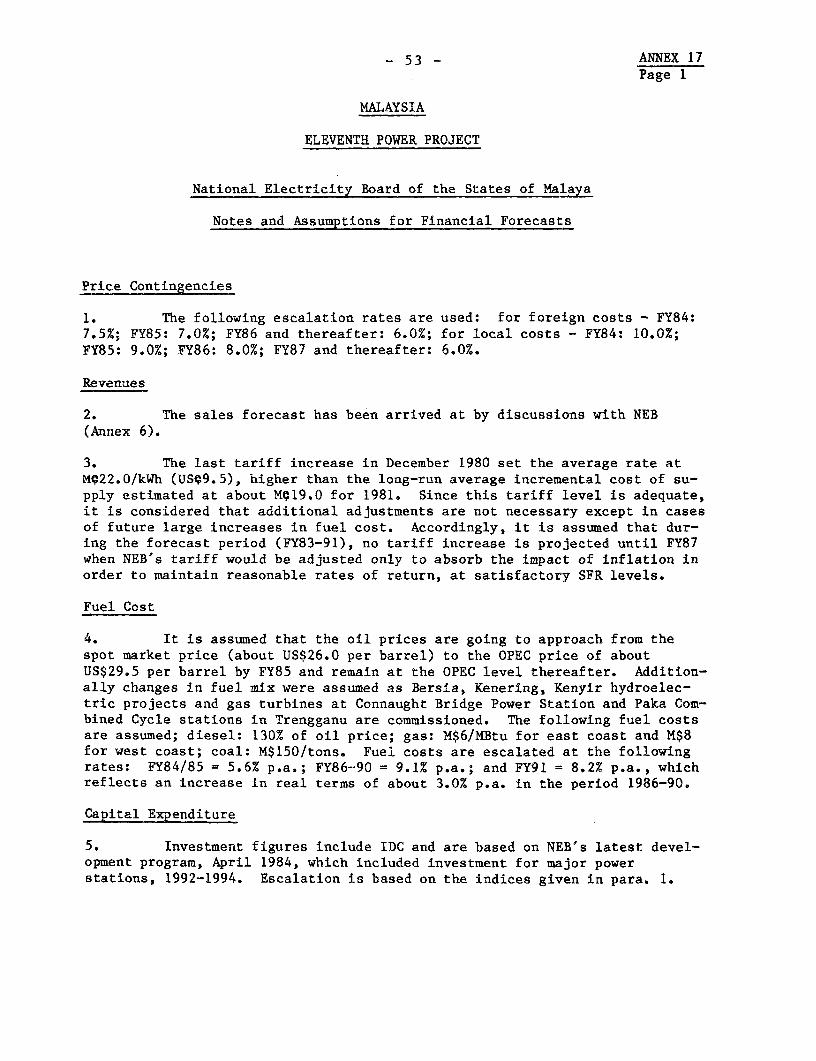
- 53 - ANNEX 17Page 1
MALAYSIA
ELEVENTH POWER PROJECT
National Electricity Board of the States of Malaya
Notes and Assumptions for Financial Forecasts
Price Contingencies
1. The following escalation rates are used: for foreign costs - FY84:7.5%; FY85: 7.0%; FY86 and thereafter: 6.0%; for local costs - FY84: 10.0%;FY85: 9.0%; FY86: 8.0%; FY87 and thereafter: 6.0%.
Revenues
2. The sales forecast has been arrived at by discussions with NEB(Annex 6).
3. The last tariff increase in December 1980 set the average rate atMr22.0/kWh (US99.5), higher than the long-run average incremental cost of su-pply estimated at about Mr19.0 for 1981. Since this tariff level is adequate,it is considered that additional adjustments are not necessary except in casesof future large increases in fuel cost. Accordingly, it is assumed that dur-ing the forecast period (FY83-91), no tariff increase is projected until FY87when NEB's tariff would be adjusted only to absorb the impact of inflation inorder to maintain reasonable rates of return, at satisfactory SFR levels.
Fuel Cost
4. It is assumed that the oil prices are going to approach from thespot market price (about US$26.0 per barrel) to the OPEC price of aboutUS$29.5 per barrel by FY85 and remain at the OPEC level thereafter. Addition-ally changes in fuel mix were assumed as Bersia, Kenering, Kenyir hydroelec-tric projects and gas turbines at Connaught Bridge Power Station and Paka Com-bined Cycle stations in Trengganu are commissioned. The following fuel costsare assumed; diesel: 130% of oil price; gas: M$6/MBtu for east coast and M$8for west coast; coal: M$150/tons. Fuel costs are escalated at the followingrates: FY84/85 = 5.6% p.a.; FY86-90 = 9.1% p.a.; and FY91 = 8.2% p.a., whichreflects an increase in real terms of about 3.0% p.a. in the period 1986-90.
Capital Expenditure
5. Investment figures include IDC and are based on NEB's latest devel-opment program, April 1984, which included investment for major powerstations, 1992-1994. Escalation is based on the indices given in para. 1.

ANNEX 1754 - Page 2
Equity
6. It is assumed that after FY83, the Government will not make anyequity contribution. But the Government will continue to provide constructiongrants for the reimbursement of a part of capital expenditure for rural elec-trification projects until FY87.
Taxes and Dividends
7. NEB declared dividends in FY83. In the financial projections, anannual dividend of M$28.4 is assumed. No tax payment is assumed pending theGovernment's review of NEB's taxation status in 1985 (paras. 2.17 and 2.18).
Borrowings
8. Given NEB's previous experience and current opportunities, the rela-tive participation of different sources in future borrowing is assumed to bedistributed as follows: bilateral and export credits 38%; multilateral 29%;commercial banks (foreign and domestic) 21% and suppliers' credits 12%. Inthe past NEB has received bilateral and export credits on very soft terms(3-1/2 to 4-1/2% p.a.); it is assumed that these credits will be contracted at5% p.a. in the future. NEB's average borrowing cost is about 8%. To be onthe conservative side, it is assumed that annual interest rates would be 10%.
9. By FY83, NEB has borrowed about M$200 million under the blanketguarantee limit of M$2.5 million by the Government. NEB can request for theextension of this facility if necessary.
Notes on Financial Ratios
10. Self-financing ratio, which measures NEB's contribution from inter-nally generated funds to its capital investment, is calculated on a 3-yearaverage investment which includes the previous year, the test and the nextfollowing year.
11. For the computation of the rate of return on average net fixedassets; fixed assets, accumulated depreciation and consumers' contribution arerevalued using the fixed capital formation deflator published by the CentralBank of Malaysia. For the forecast period, the revaluation factors are basedon the weighted average of the escalation rates presented in para. I above.
12. Bank overdrafts in the case of NEB are actually revolving loans con-tracted at very favorable interest rates (8.5% to 9.25% p.a.). The customaryyearly repayment is not required and commercial banks advise NEB well inadvance whenever they are considering that the loan or part of it should berepaid. Because of these special characteristics, these loans were notincluded in the computation of net working capital and current ratio. Never-theless, if in the future they become repayable within the following twelvemonths, these loans, or part of them, should be treated as current liabili-ties.

-55 - ANNEX 18
MALAYSIA,
ELEVENTH POWER PROJECT
Calculation of the Internal Economic Rate of Return (IERR)
Bulk Total Sales (GWh) /d Revenue (M$ millions)Year Investment OEM supply cost Residential Commercial Industrial Total Residential Commercial Industrial Total
/a /b /c /e /f Li
1985 26.8 0.7 2.9 30.4 16.7 4.9 0 21.6 3.3 1.2 0 5.586 54.1 2.0 8.6 64.7 46.7 14.5 2.8 64.0 9.3 3.6 0.6 13.587 72.0 3.8 27.3 103.1 84.2 31.5 88.4 204.1 16.8 7.9 20.3 45.088 3.0 3.8 32.3 39.1 98.5 37.1 105.0 241.6 19.7 9.3 24.4 53.489 3.0 3.8 37.3 44.1 112.9 42.7 123.6 279.2 22.6 10.7 28.4 61.790 3.0 3.8 42.3 49.1 127.3 48.3 141.2 316.8 25.5 12.1 32.5 70.1
1991 3.0 3.8 46.8 53.6 138.4 52.9 158.8 350.1 27.7 13.2 36.5 77.492 3.0 3.8 50.2 57.0 144.1 55.8 175.8 375.7 28.8 14.0 40.4 83.093 3.0 3.8 52.7 59.5 151.3 58.6 184.6 394.5 30.3 14.7 42.5 87.594 3.0 3.8 55.3 62.1 148.9 61.5 193.8 414.2 31.8 15.4 44.6 91.895 3.0 3.8 58.1 64.9 166.8 64.6 203.5 434.9 33.4 16.2 46.8 96.496 3.0 3.8 61.0 67.8 175.2 67.8 213.7 456.7 35.0 17.0 49.2 101.297 3.0 3.8 64.1 70.9 183.9 71.2 224.7 479.8 36.8 17.8 51.7 106.398 0 3.8 " " "t " " ""99 0 3.8 " " " " " " " " "
2000 0 3.8 " " " " " " " "01 0 3.8 " " " " I ,.02 0 3.8 " " "03 0 3.8 " 04 0 3.8 " ".05 0 3.8 " " "06 0 3.8 " " I " " " "07 0 3.8 " " " " " " " 08 0 3.8 " " " " " " " " " 09 0 3.8 " " " " " " "
2010 0 3.8 " "2011 0 3.8 " " " " " " " " " "2012 0 3.8 "
/a Investments between 1988 and 1997 at 2% of the total project investment, each year, to sustain growth.7b' O&M cost - 2.5% of the investment.7-c Bulk supply cost = 13.36 Me/KWh at the substation, including distribution losses, derived from the calculations of the
average incremental cost of supply based on the investment program of 1983-88./d Growth in sales at 5% p.a. between 1992 and 1997, and constant thereafter.Ie Domestic tariff - M420 per kWh, prevailing.
7T Commercial tariff - MW25 per kWh, prevailing.7E Industrial tariff - M23 per kWh, prevailing.
Sensitivity Analysis IERR (X)
Base case - 16.56Costs up by 10% - 14.78Benefits up by 10% - 18.47Benefits down by 10% - 14.60Benefits lag by 1 year - 14.12Benefits lag by 2 years - 12.39

- 56 - ANNEX 19
MALAYSIA
ELEVENTH POWER PROJECT
Documents in Project File
1. IBRD 1lth Power Loan Report for RE 1 projects by Distribution Department,NEB. Dated June 21, 1983 (Revised Oct. 12, 1983).
2. Assessment of Feasibility of Grid Supply to Mersing. Report No. PPP(T):1983/3 of April 12, 1983 by Planning Department, NEB.
3. Bulk Supply to Promet Factory and FELDA Schemes Kota Tinggi District,Johor. Report No. PPP(T): 1983/2 of April 14, 1983 by PlanningDepartment, NEB.
4. 275 kV reinforecement of Southern Transmission Network. Report No.PP(T): 1983/9 of August 1983 by Planning Department, NEB.
5. Rural Electrification Surveys - 1983. Draft Report October 1983 byCommercial Department, NEB.
6. Pergau Hydro-electric Project. Proposal for Reappraisal and InformationPaper. Ref. HED 9/2/64 of Sept. 27, 1983 by Hydro Department, NEB.
7. Electricity Act, Laws of Malaysia, Act 116, 1949 (Revised 1973).
8. Basic Price and Price Fluctuation Agreements for the Supply of Fuel Oil(Dated April 7, 1983 and May 5, 1983), PETRONAS and NEB.
9. NEB, Budget 1983/84 and Revised Budget 1982/83 (dated August 20, 1983).
10. NEB's Capital Budget for 1983/84 (Dated August 26, 1983), andNEB Review of Capital Budget, 1982/83 through 1984/85 (datedSeptember 27, 1983).
11. NEB Capital Assets Classification.
12. NEB Overview of EDP Department and Realtime Computer Applications (datedJune 1, 1983).
13. NEB 1981/82 Accounts and Supplementary Information, Price Waterhouse,May 12, 1983.
14. Laws of Malaysia, Act 240: Statutory Bodies (Accounts and Annual Reports)Act 1980.
15. Calculations of IERR for the investment program - 1983-91. NEB, April1984.
16. NEB 1982/83 Accounts and 1983/84-1990/91 Financial Estimates, April 1984.
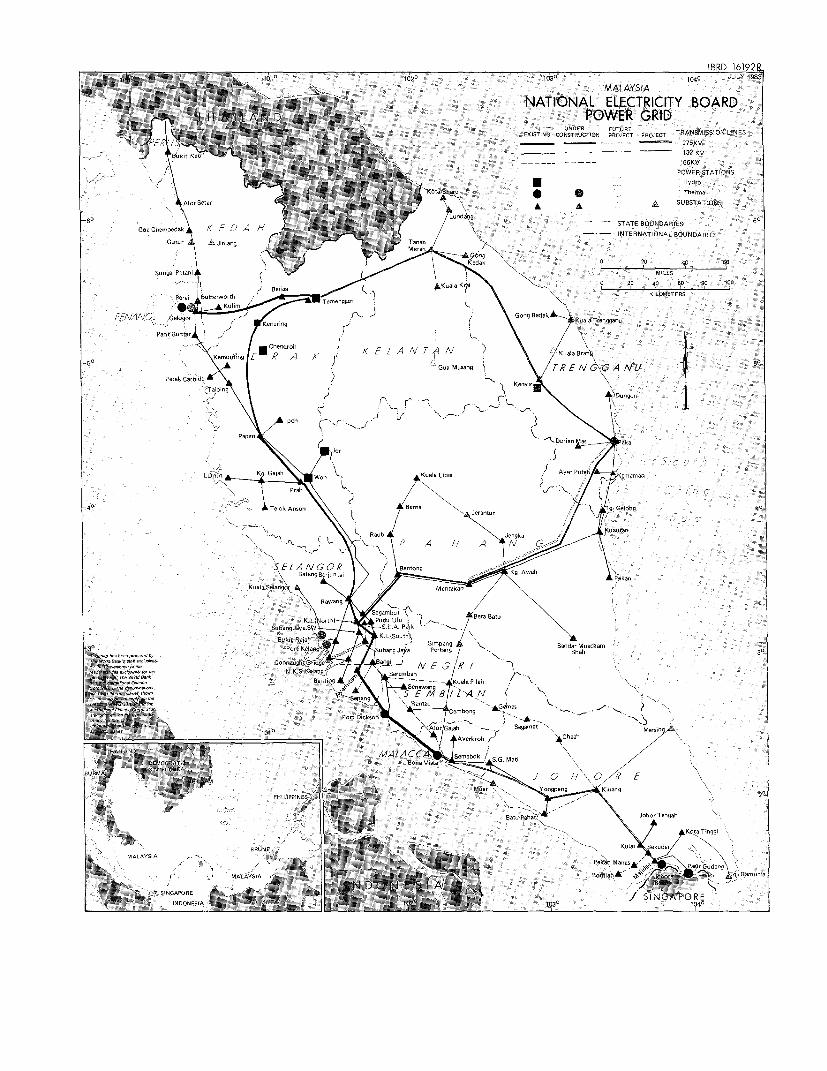
IBRD 16192f0 161" 1520 I03~~~~~~~~~~~~~~~~~~~~~~~ io~~~~~~~" ~~ JULY 1985
'a ~~~~~~~~~~~~MALAYSiA- - ~~~~~~~~~~~~NATIONAL ELECTRICITY BOARDr- T HALAN D POWER GRID
J ~~~~~~~~~~~~~~~~~~~~~~~~~~~~~EXISTING CONSTRUCTION PROJECT ....... TRANSMISSION LINESNf,~~~~~~~~~~~~ ~~~~~~~ N - ~~~~~~~~~~~~~275KVJ ~~~~~~~~~ _______ -~~~~~~~~~~~~~~~~~~~~~~~~~~132 KV
66KV
POWER STATIONS
-j ~~~~~~~~~~~~~~Hydro
A A ~~~~~~ ~ SUBSTATIONS
- -. - ~~~~~~~~~~INTERNATIONAL BOUNDARIES
60 Go0 Then 500105 K A I-' ~~~~~~~~~~~~~~~~~~~~~~ ( - -~~~ STAT BONARE 60
SunSal Potani ~~~~~~~~~~~~~~~~~~~~~~~~~~~~~~~MILES-~~~~~~~~~~~~~~~~~ 0~~~~~~~~~~~~~~~ 20 40 GB 8S 156
POrI -GOI thGO KILOMETERS
* KAINAN/
FE! V~NG Geloqor ~ > ( 0009 Ba-ar hKAOIV ToIVX4- 0
Por,tBontar EPA K K ELAN TA~~~~~~~~~G. Nu-g K t /v G\G A NU
J U, '\- J tu
L,IT,01 Kg G BRaT g .q-~'
40 ~ ~ ~ ~ ~ ~ TRIOS Anson 40~~~~~~~~~~~~~~~."
S.bL ANGOP B S EotA. g -
601009 BerLLnoa
K Pl eagr Meola-kJ. " a b., 1 \1M-Z
So Ga del' nSA ~ ~ ~ ~ ~ ~ ~ ~ ~ ~ ~ ~ ~ ~~~~~S.h30 ZiRi~L~ ,neq \*Ron odno
GV,erobo,ona,o 0 KJ~1EN >1- obag nC-PeRugh300100000000000050001, CnooBoShtWf6d~~~-o' - - Ba /
400000000 0'00 ~ ~ ~ ~ ~ ~ ~ ~~.KS.r-.000,0 a 0000000,00~~~~~~~~~~~~~~~~~~~~~~~~...Pi~
a,000Ia,OI 00000000 -- ~~~~ K~~aIoPiIA G a100000000,0100000 000IIR~~~~~ -,-0000000 ?10R00OOOO ~ ~ ~ ~ ~ ~ ~ ~ ~ ~ P. Di E v~
,o000000ooonia00 -'~~~~~~~~~~~~~~~~~~~~~~rr /2ChAIh00000,000000
0010? 00o'BG,OB& 00000 ~ ~ ~ ~ ~ ~ ~ ~ ~ ~ ~ ~ ~ ~ ~ ~ ~~S- k . a0oo~~~~nRooo'O0o'oo0A'poo0bo ~ ~ ~ ~ ~ ~ ~ ~ 8.. V ob~G ~
00000
000000000000R50
0~ ~ ~ ~ ~ ~ ~ ~ ~ ~ ~ ~ ~ ~ ~ ~ ~ I-0100'o-000 0000 Port Dickson~~~~~~~~~~~~~~~~~~~~~~~~~~~~~~~~~~~~~~~~~~~~~~~~~~0
onoooonooonoroooooonl - Me~~~~~~~~~~~~~~~~~~~~~~t P Jhr TnIph
000000,onOOO 1010 ~ ~ ~ ~ ~ ~ ~ ~ ~ ~ ~ ~ ~ ~ ~ ~ ~ ~ ~ ~ ~ ~ ~~ T
o'01E4~L0,,'0
"' ~K-''X ALACCA~ BRUNEkI/ SMaR,i
Monr VOOBBeOR KILOOG 0~~PO G.d
N'b 0,~~~~~-k fBb Joba TngA
< IGPE -ISNGAPORE
INSONESIA . - K01504Al'0031A ~ ~ ~ ~ ~ ~ ~ ~ IN 1030 Os 1 040
![repository.psa.edu.myrepository.psa.edu.my/bitstream/123456789/1289/1/JKA... · 2019. 2. 13. · Batu Pahat Kluang [10 marks] [10 markah] Calculate the cost of brickwork for 230 mm](https://img.pdfslide.us/doc/110x75/60da8f643a73e0234a12742c/2019-2-13-batu-pahat-kluang-10-marks-10-markah-calculate-the-cost-of-brickwork.jpg)