Embed Size (px)
Citation preview
PUB‐NLH‐148 Island Interconnected System Supply Issues and Power Outages
Page 1 of 4
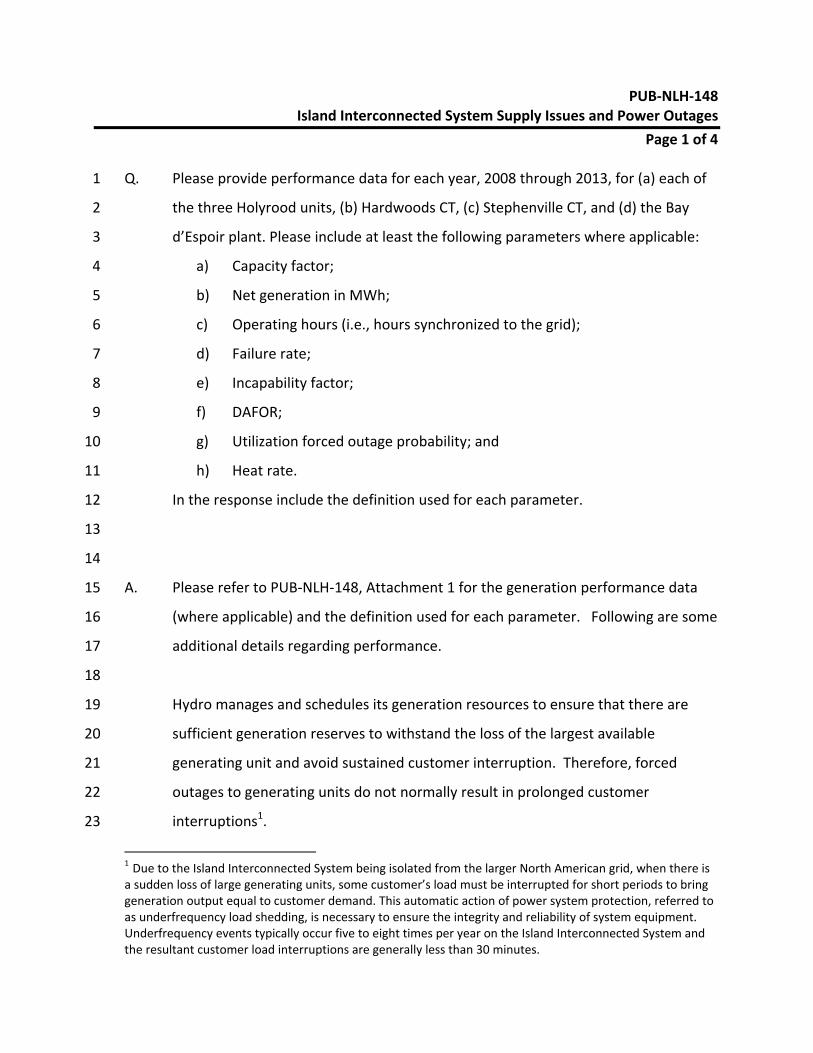
Q. Please provide performance data for each year, 2008 through 2013, for (a) each of 1
the three Holyrood units, (b) Hardwoods CT, (c) Stephenville CT, and (d) the Bay 2
d’Espoir plant. Please include at least the following parameters where applicable: 3
a) Capacity factor; 4
b) Net generation in MWh; 5
c) Operating hours (i.e., hours synchronized to the grid); 6
d) Failure rate; 7
e) Incapability factor; 8
f) DAFOR; 9
g) Utilization forced outage probability; and 10
h) Heat rate. 11
In the response include the definition used for each parameter. 12
13
14
A. Please refer to PUB‐NLH‐148, Attachment 1 for the generation performance data 15
(where applicable) and the definition used for each parameter. Following are some 16
additional details regarding performance. 17
18
Hydro manages and schedules its generation resources to ensure that there are 19
sufficient generation reserves to withstand the loss of the largest available 20
generating unit and avoid sustained customer interruption. Therefore, forced 21
outages to generating units do not normally result in prolonged customer 22
interruptions1. 23
1 Due to the Island Interconnected System being isolated from the larger North American grid, when there is a sudden loss of large generating units, some customer’s load must be interrupted for short periods to bring generation output equal to customer demand. This automatic action of power system protection, referred to as underfrequency load shedding, is necessary to ensure the integrity and reliability of system equipment. Underfrequency events typically occur five to eight times per year on the Island Interconnected System and the resultant customer load interruptions are generally less than 30 minutes.
PUB‐NLH‐148 Island Interconnected System Supply Issues and Power Outages
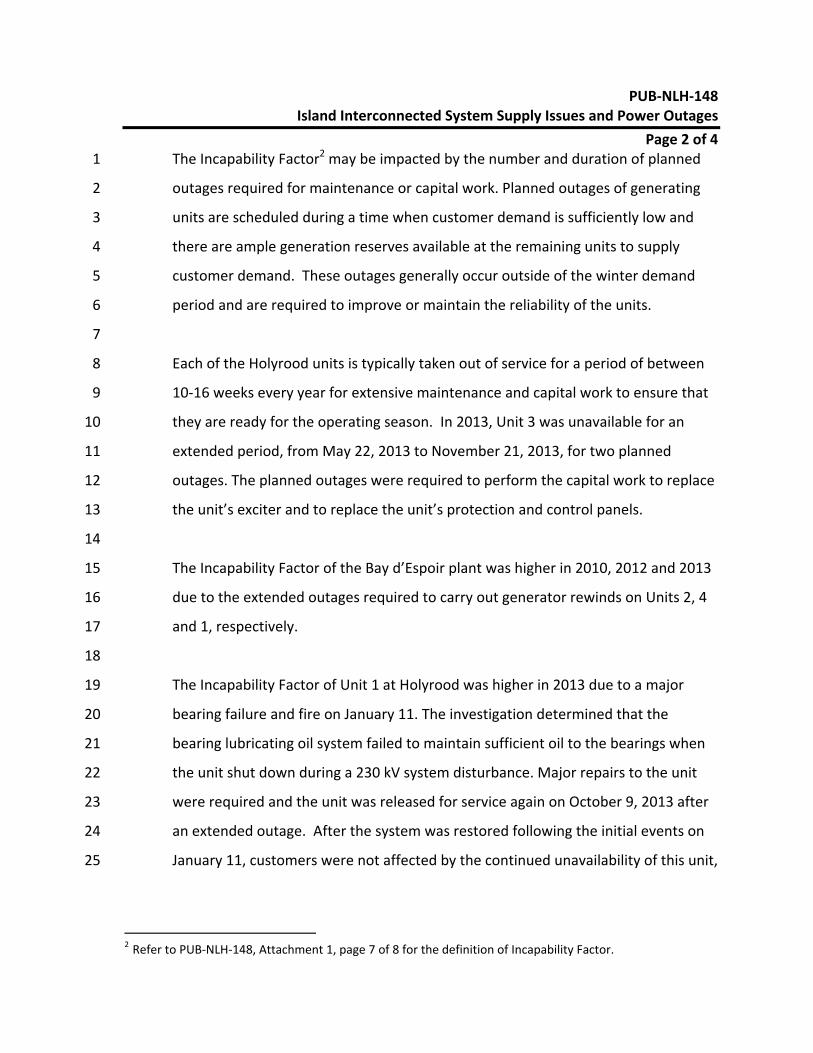
Page 2 of 4 The Incapability Factor2 may be impacted by the number and duration of planned 1
outages required for maintenance or capital work. Planned outages of generating 2
units are scheduled during a time when customer demand is sufficiently low and 3
there are ample generation reserves available at the remaining units to supply 4
customer demand. These outages generally occur outside of the winter demand 5
period and are required to improve or maintain the reliability of the units. 6
7
Each of the Holyrood units is typically taken out of service for a period of between 8
10‐16 weeks every year for extensive maintenance and capital work to ensure that 9
they are ready for the operating season. In 2013, Unit 3 was unavailable for an 10
extended period, from May 22, 2013 to November 21, 2013, for two planned 11
outages. The planned outages were required to perform the capital work to replace 12
the unit’s exciter and to replace the unit’s protection and control panels. 13
14
The Incapability Factor of the Bay d’Espoir plant was higher in 2010, 2012 and 2013 15
due to the extended outages required to carry out generator rewinds on Units 2, 4 16
and 1, respectively. 17
18
The Incapability Factor of Unit 1 at Holyrood was higher in 2013 due to a major 19
bearing failure and fire on January 11. The investigation determined that the 20
bearing lubricating oil system failed to maintain sufficient oil to the bearings when 21
the unit shut down during a 230 kV system disturbance. Major repairs to the unit 22
were required and the unit was released for service again on October 9, 2013 after 23
an extended outage. After the system was restored following the initial events on 24
January 11, customers were not affected by the continued unavailability of this unit, 25
2 Refer to PUB‐NLH‐148, Attachment 1, page 7 of 8 for the definition of Incapability Factor.
PUB‐NLH‐148 Island Interconnected System Supply Issues and Power Outages
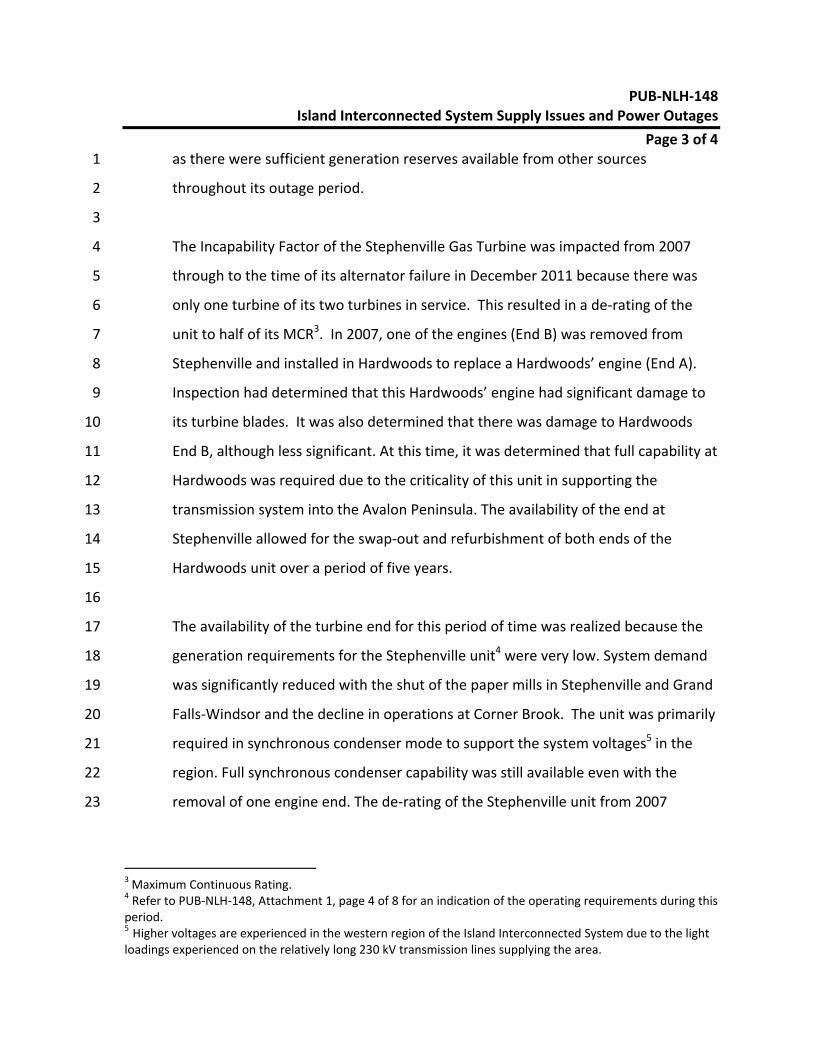
Page 3 of 4 as there were sufficient generation reserves available from other sources 1
throughout its outage period. 2
3
The Incapability Factor of the Stephenville Gas Turbine was impacted from 2007 4
through to the time of its alternator failure in December 2011 because there was 5
only one turbine of its two turbines in service. This resulted in a de‐rating of the 6
unit to half of its MCR3. In 2007, one of the engines (End B) was removed from 7
Stephenville and installed in Hardwoods to replace a Hardwoods’ engine (End A). 8
Inspection had determined that this Hardwoods’ engine had significant damage to 9
its turbine blades. It was also determined that there was damage to Hardwoods 10
End B, although less significant. At this time, it was determined that full capability at 11
Hardwoods was required due to the criticality of this unit in supporting the 12
transmission system into the Avalon Peninsula. The availability of the end at 13
Stephenville allowed for the swap‐out and refurbishment of both ends of the 14
Hardwoods unit over a period of five years. 15
16
The availability of the turbine end for this period of time was realized because the 17
generation requirements for the Stephenville unit4 were very low. System demand 18
was significantly reduced with the shut of the paper mills in Stephenville and Grand 19
Falls‐Windsor and the decline in operations at Corner Brook. The unit was primarily 20
required in synchronous condenser mode to support the system voltages5 in the 21
region. Full synchronous condenser capability was still available even with the 22
removal of one engine end. The de‐rating of the Stephenville unit from 2007 23
3 Maximum Continuous Rating.
4 Refer to PUB‐NLH‐148, Attachment 1, page 4 of 8 for an indication of the operating requirements during this period. 5 Higher voltages are experienced in the western region of the Island Interconnected System due to the light loadings experienced on the relatively long 230 kV transmission lines supplying the area.
PUB‐NLH‐148 Island Interconnected System Supply Issues and Power Outages
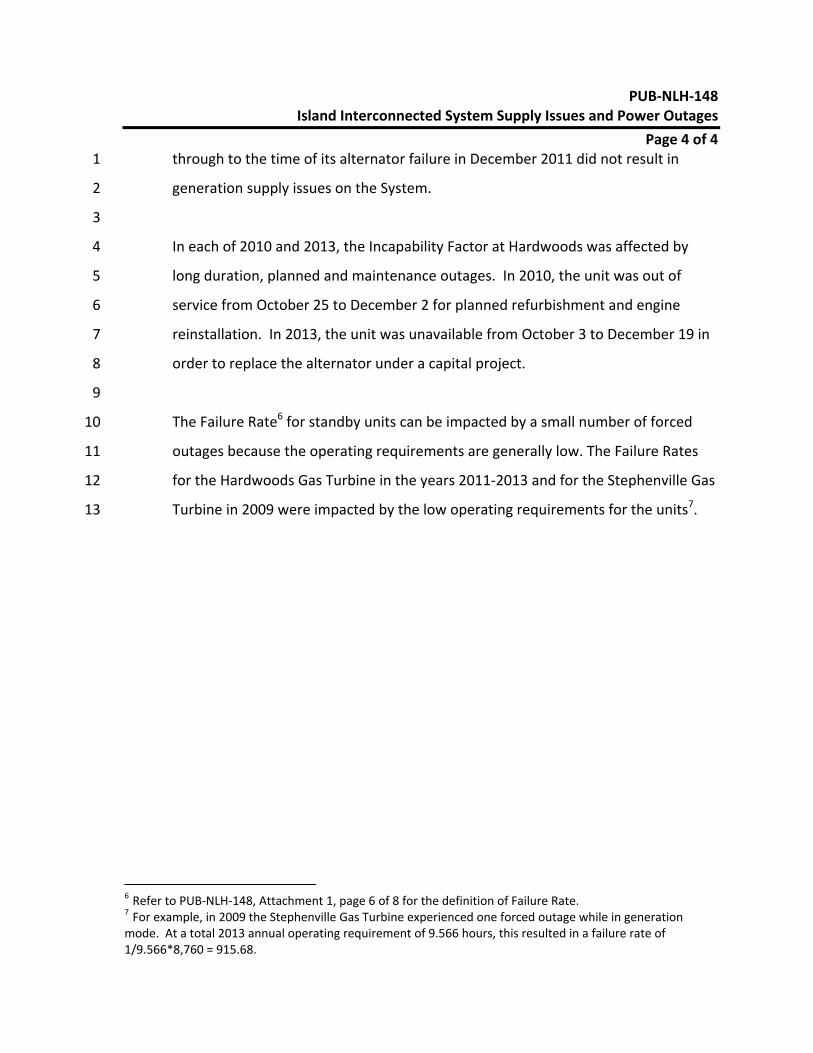
Page 4 of 4 through to the time of its alternator failure in December 2011 did not result in 1
generation supply issues on the System. 2
3
In each of 2010 and 2013, the Incapability Factor at Hardwoods was affected by 4
long duration, planned and maintenance outages. In 2010, the unit was out of 5
service from October 25 to December 2 for planned refurbishment and engine 6
reinstallation. In 2013, the unit was unavailable from October 3 to December 19 in 7
order to replace the alternator under a capital project. 8
9
The Failure Rate6 for standby units can be impacted by a small number of forced 10
outages because the operating requirements are generally low. The Failure Rates 11
for the Hardwoods Gas Turbine in the years 2011‐2013 and for the Stephenville Gas 12
Turbine in 2009 were impacted by the low operating requirements for the units7. 13
6 Refer to PUB‐NLH‐148, Attachment 1, page 6 of 8 for the definition of Failure Rate. 7 For example, in 2009 the Stephenville Gas Turbine experienced one forced outage while in generation mode. At a total 2013 annual operating requirement of 9.566 hours, this resulted in a failure rate of 1/9.566*8,760 = 915.68.
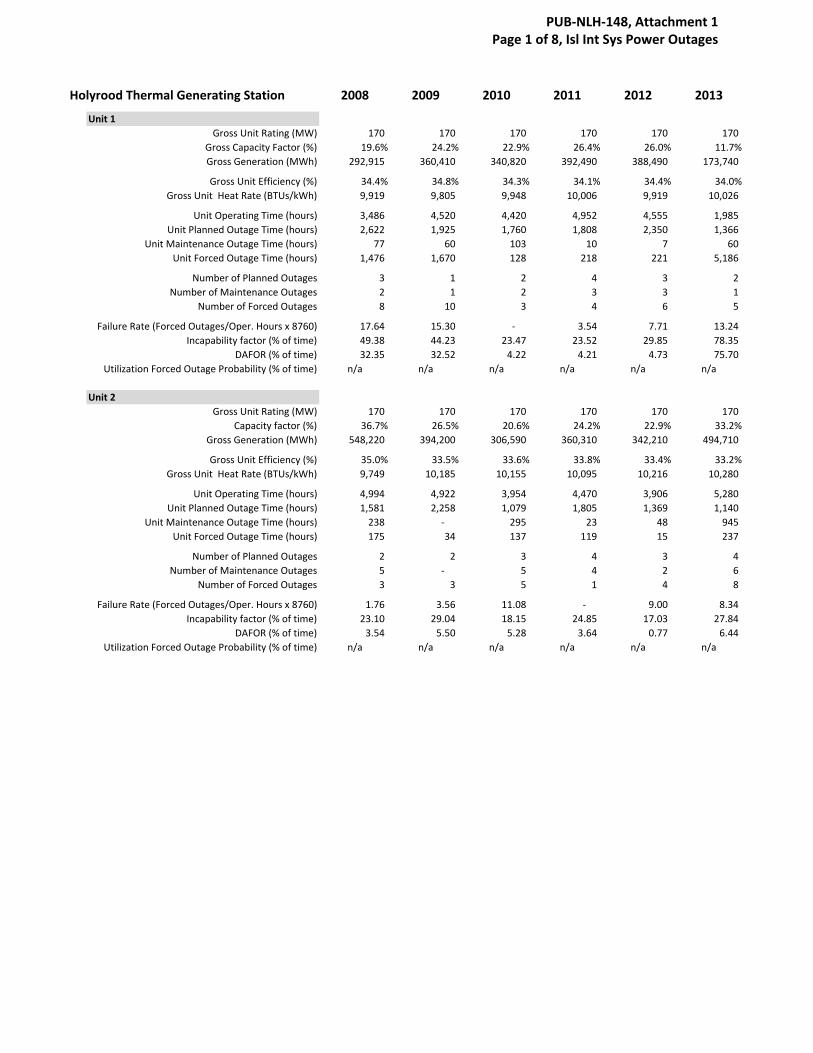
Holyrood Thermal Generating Station 2008 2009 2010 2011 2012 2013
Unit 1
Gross Unit Rating (MW) 170 170 170 170 170 170
Gross Capacity Factor (%) 19.6% 24.2% 22.9% 26.4% 26.0% 11.7%
Gross Generation (MWh) 292,915 360,410 340,820 392,490 388,490 173,740
Gross Unit Efficiency (%) 34.4% 34.8% 34.3% 34.1% 34.4% 34.0%
Gross Unit Heat Rate (BTUs/kWh) 9,919 9,805 9,948 10,006 9,919 10,026
Unit Operating Time (hours) 3,486 4,520 4,420 4,952 4,555 1,985
Unit Planned Outage Time (hours) 2,622 1,925 1,760 1,808 2,350 1,366
Unit Maintenance Outage Time (hours) 77 60 103 10 7 60
Unit Forced Outage Time (hours) 1,476 1,670 128 218 221 5,186
Number of Planned Outages 3 1 2 4 3 2
Number of Maintenance Outages 2 1 2 3 3 1
Number of Forced Outages 8 10 3 4 6 5
Failure Rate (Forced Outages/Oper. Hours x 8760) 17.64 15.30 ‐ 3.54 7.71 13.24
Incapability factor (% of time) 49.38 44.23 23.47 23.52 29.85 78.35
DAFOR (% of time) 32.35 32.52 4.22 4.21 4.73 75.70
Utilization Forced Outage Probability (% of time) n/a n/a n/a n/a n/a n/a
Unit 2
Gross Unit Rating (MW) 170 170 170 170 170 170
Capacity factor (%) 36.7% 26.5% 20.6% 24.2% 22.9% 33.2%
Gross Generation (MWh) 548,220 394,200 306,590 360,310 342,210 494,710
Gross Unit Efficiency (%) 35.0% 33.5% 33.6% 33.8% 33.4% 33.2%
Gross Unit Heat Rate (BTUs/kWh) 9,749 10,185 10,155 10,095 10,216 10,280
Unit Operating Time (hours) 4,994 4,922 3,954 4,470 3,906 5,280
Unit Planned Outage Time (hours) 1,581 2,258 1,079 1,805 1,369 1,140
Unit Maintenance Outage Time (hours) 238 ‐ 295 23 48 945
Unit Forced Outage Time (hours) 175 34 137 119 15 237
Number of Planned Outages 2 2 3 4 3 4
Number of Maintenance Outages 5 ‐ 5 4 2 6
Number of Forced Outages 3 3 5 1 4 8
Failure Rate (Forced Outages/Oper. Hours x 8760) 1.76 3.56 11.08 ‐ 9.00 8.34
Incapability factor (% of time) 23.10 29.04 18.15 24.85 17.03 27.84
DAFOR (% of time) 3.54 5.50 5.28 3.64 0.77 6.44
Utilization Forced Outage Probability (% of time) n/a n/a n/a n/a n/a n/a
PUB-NLH-148, Attachment 1 Page 1 of 8, Isl Int Sys Power Outages
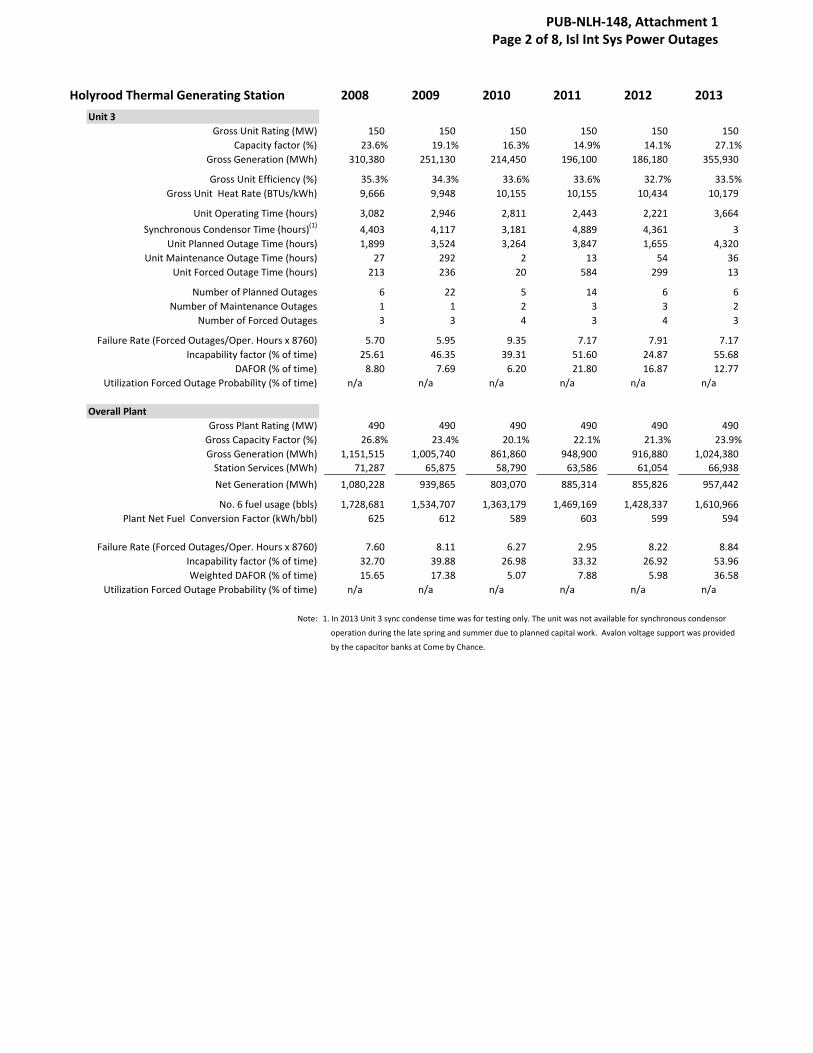
Holyrood Thermal Generating Station 2008 2009 2010 2011 2012 2013
Unit 3
Gross Unit Rating (MW) 150 150 150 150 150 150
Capacity factor (%) 23.6% 19.1% 16.3% 14.9% 14.1% 27.1%
Gross Generation (MWh) 310,380 251,130 214,450 196,100 186,180 355,930
Gross Unit Efficiency (%) 35.3% 34.3% 33.6% 33.6% 32.7% 33.5%
Gross Unit Heat Rate (BTUs/kWh) 9,666 9,948 10,155 10,155 10,434 10,179
Unit Operating Time (hours) 3,082 2,946 2,811 2,443 2,221 3,664
Synchronous Condensor Time (hours)(1)
4,403 4,117 3,181 4,889 4,361 3
Unit Planned Outage Time (hours) 1,899 3,524 3,264 3,847 1,655 4,320
Unit Maintenance Outage Time (hours) 27 292 2 13 54 36
Unit Forced Outage Time (hours) 213 236 20 584 299 13
Number of Planned Outages 6 22 5 14 6 6
Number of Maintenance Outages 1 1 2 3 3 2
Number of Forced Outages 3 3 4 3 4 3
Failure Rate (Forced Outages/Oper. Hours x 8760) 5.70 5.95 9.35 7.17 7.91 7.17
Incapability factor (% of time) 25.61 46.35 39.31 51.60 24.87 55.68
DAFOR (% of time) 8.80 7.69 6.20 21.80 16.87 12.77
Utilization Forced Outage Probability (% of time) n/a n/a n/a n/a n/a n/a
Overall Plant
Gross Plant Rating (MW) 490 490 490 490 490 490
Gross Capacity Factor (%) 26.8% 23.4% 20.1% 22.1% 21.3% 23.9%
Gross Generation (MWh) 1,151,515 1,005,740 861,860 948,900 916,880 1,024,380
Station Services (MWh) 71,287 65,875 58,790 63,586 61,054 66,938
Net Generation (MWh) 1,080,228 939,865 803,070 885,314 855,826 957,442
No. 6 fuel usage (bbls) 1,728,681 1,534,707 1,363,179 1,469,169 1,428,337 1,610,966
Plant Net Fuel Conversion Factor (kWh/bbl) 625 612 589 603 599 594
Failure Rate (Forced Outages/Oper. Hours x 8760) 7.60 8.11 6.27 2.95 8.22 8.84
Incapability factor (% of time) 32.70 39.88 26.98 33.32 26.92 53.96
Weighted DAFOR (% of time) 15.65 17.38 5.07 7.88 5.98 36.58
Utilization Forced Outage Probability (% of time) n/a n/a n/a n/a n/a n/a
Note: 1. In 2013 Unit 3 sync condense time was for testing only. The unit was not available for synchronous condensor
operation during the late spring and summer due to planned capital work. Avalon voltage support was provided
by the capacitor banks at Come by Chance.
PUB-NLH-148, Attachment 1 Page 2 of 8, Isl Int Sys Power Outages
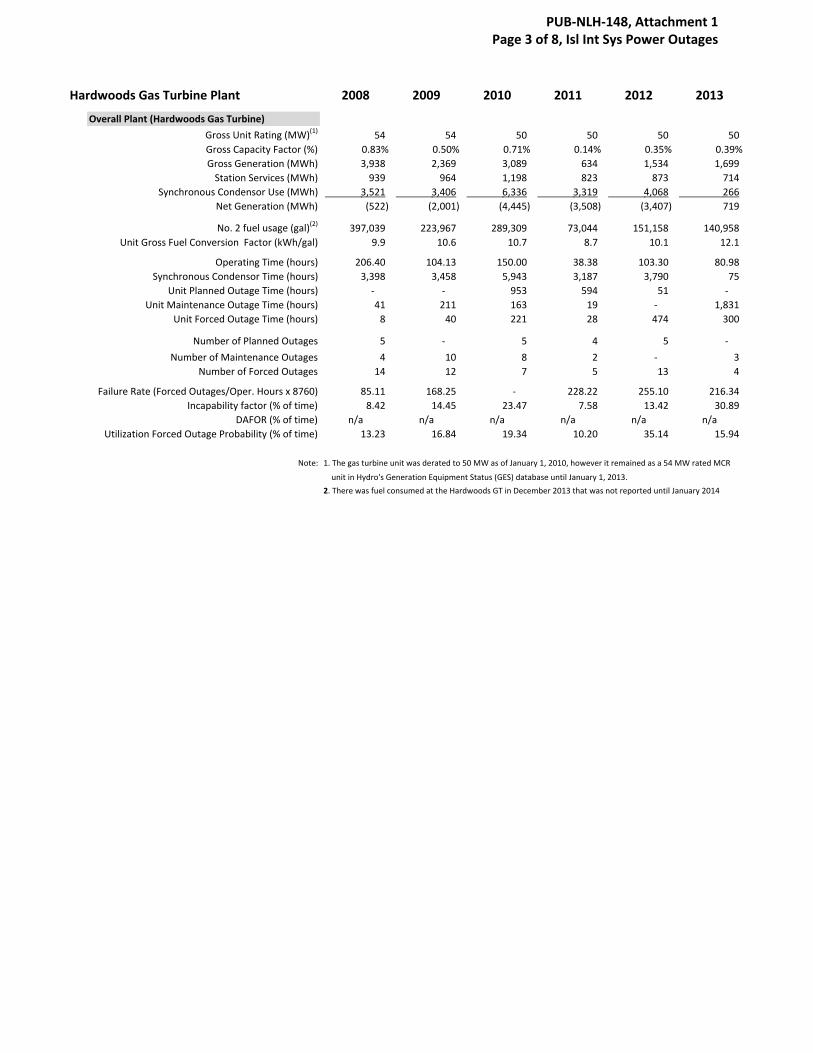
Hardwoods Gas Turbine Plant 2008 2009 2010 2011 2012 2013
Overall Plant (Hardwoods Gas Turbine)
Gross Unit Rating (MW)(1) 54 54 50 50 50 50
Gross Capacity Factor (%) 0.83% 0.50% 0.71% 0.14% 0.35% 0.39%
Gross Generation (MWh) 3,938 2,369 3,089 634 1,534 1,699
Station Services (MWh) 939 964 1,198 823 873 714
Synchronous Condensor Use (MWh) 3,521 3,406 6,336 3,319 4,068 266
Net Generation (MWh) (522) (2,001) (4,445) (3,508) (3,407) 719
No. 2 fuel usage (gal)(2) 397,039 223,967 289,309 73,044 151,158 140,958
Unit Gross Fuel Conversion Factor (kWh/gal) 9.9 10.6 10.7 8.7 10.1 12.1
Operating Time (hours) 206.40 104.13 150.00 38.38 103.30 80.98
Synchronous Condensor Time (hours) 3,398 3,458 5,943 3,187 3,790 75
Unit Planned Outage Time (hours) ‐ ‐ 953 594 51 ‐
Unit Maintenance Outage Time (hours) 41 211 163 19 ‐ 1,831
Unit Forced Outage Time (hours) 8 40 221 28 474 300
Number of Planned Outages 5 ‐ 5 4 5 ‐
Number of Maintenance Outages 4 10 8 2 ‐ 3
Number of Forced Outages 14 12 7 5 13 4
Failure Rate (Forced Outages/Oper. Hours x 8760) 85.11 168.25 ‐ 228.22 255.10 216.34
Incapability factor (% of time) 8.42 14.45 23.47 7.58 13.42 30.89
DAFOR (% of time) n/a n/a n/a n/a n/a n/a
Utilization Forced Outage Probability (% of time) 13.23 16.84 19.34 10.20 35.14 15.94
Note: 1. The gas turbine unit was derated to 50 MW as of January 1, 2010, however it remained as a 54 MW rated MCR
unit in Hydro's Generation Equipment Status (GES) database until January 1, 2013.
2. There was fuel consumed at the Hardwoods GT in December 2013 that was not reported until January 2014
PUB-NLH-148, Attachment 1 Page 3 of 8, Isl Int Sys Power Outages
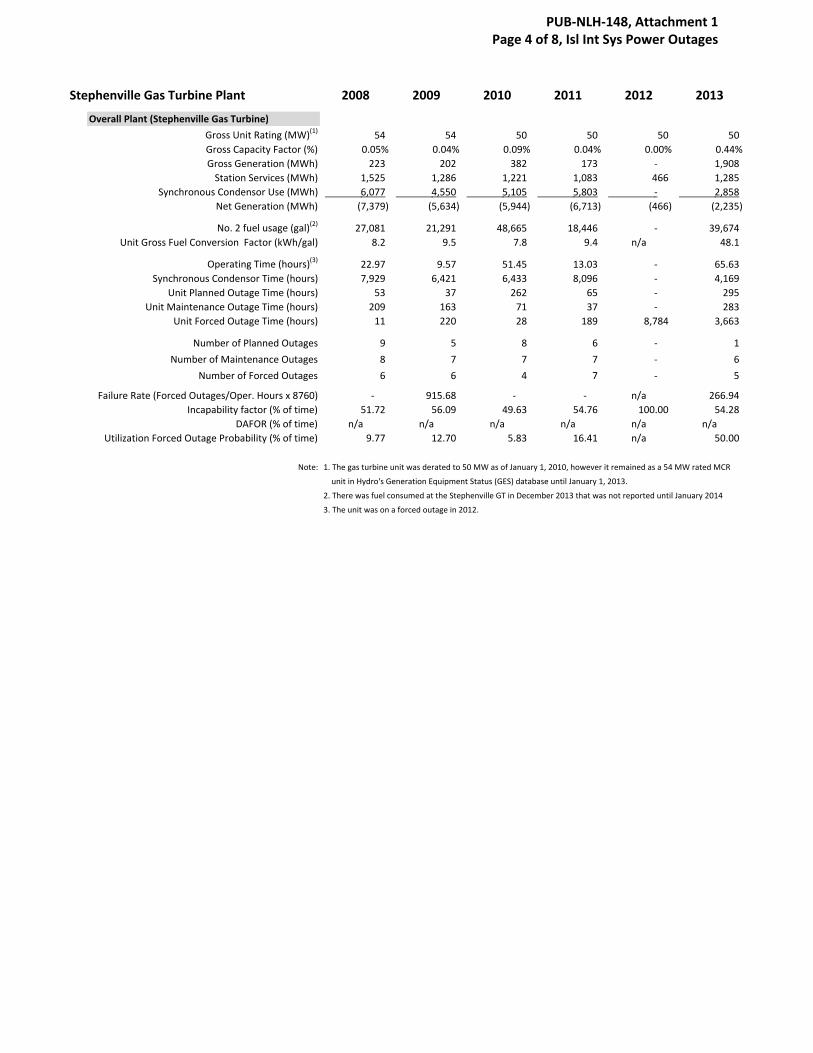
Stephenville Gas Turbine Plant 2008 2009 2010 2011 2012 2013
Overall Plant (Stephenville Gas Turbine)
Gross Unit Rating (MW)(1)
54 54 50 50 50 50
Gross Capacity Factor (%) 0.05% 0.04% 0.09% 0.04% 0.00% 0.44%
Gross Generation (MWh) 223 202 382 173 ‐ 1,908
Station Services (MWh) 1,525 1,286 1,221 1,083 466 1,285
Synchronous Condensor Use (MWh) 6,077 4,550 5,105 5,803 ‐ 2,858
Net Generation (MWh) (7,379) (5,634) (5,944) (6,713) (466) (2,235)
No. 2 fuel usage (gal)(2) 27,081 21,291 48,665 18,446 ‐ 39,674
Unit Gross Fuel Conversion Factor (kWh/gal) 8.2 9.5 7.8 9.4 n/a 48.1
Operating Time (hours)(3) 22.97 9.57 51.45 13.03 ‐ 65.63
Synchronous Condensor Time (hours) 7,929 6,421 6,433 8,096 ‐ 4,169
Unit Planned Outage Time (hours) 53 37 262 65 ‐ 295
Unit Maintenance Outage Time (hours) 209 163 71 37 ‐ 283
Unit Forced Outage Time (hours) 11 220 28 189 8,784 3,663
Number of Planned Outages 9 5 8 6 ‐ 1
Number of Maintenance Outages 8 7 7 7 ‐ 6
Number of Forced Outages 6 6 4 7 ‐ 5
Failure Rate (Forced Outages/Oper. Hours x 8760) ‐ 915.68 ‐ ‐ n/a 266.94
Incapability factor (% of time) 51.72 56.09 49.63 54.76 100.00 54.28
DAFOR (% of time) n/a n/a n/a n/a n/a n/a
Utilization Forced Outage Probability (% of time) 9.77 12.70 5.83 16.41 n/a 50.00
Note: 1. The gas turbine unit was derated to 50 MW as of January 1, 2010, however it remained as a 54 MW rated MCR
unit in Hydro's Generation Equipment Status (GES) database until January 1, 2013.
2. There was fuel consumed at the Stephenville GT in December 2013 that was not reported until January 2014
3. The unit was on a forced outage in 2012.
PUB-NLH-148, Attachment 1 Page 4 of 8, Isl Int Sys Power Outages
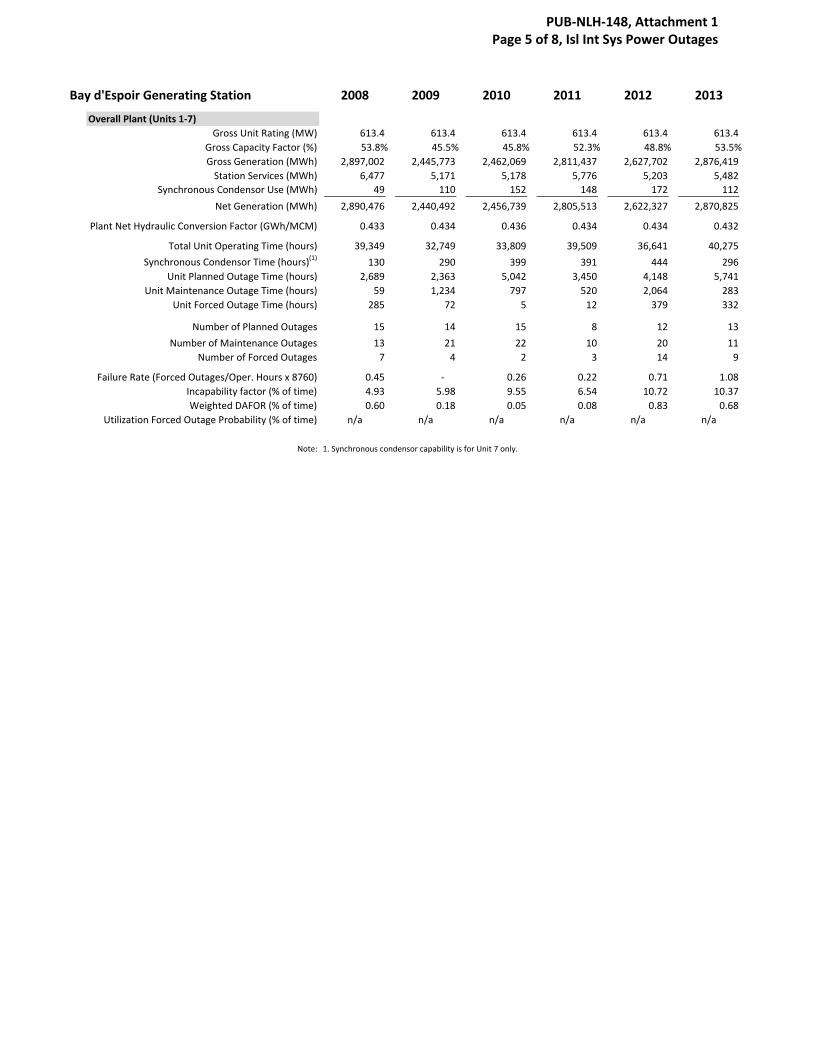
Bay d'Espoir Generating Station 2008 2009 2010 2011 2012 2013
Overall Plant (Units 1‐7)
Gross Unit Rating (MW) 613.4 613.4 613.4 613.4 613.4 613.4
Gross Capacity Factor (%) 53.8% 45.5% 45.8% 52.3% 48.8% 53.5%
Gross Generation (MWh) 2,897,002 2,445,773 2,462,069 2,811,437 2,627,702 2,876,419
Station Services (MWh) 6,477 5,171 5,178 5,776 5,203 5,482
Synchronous Condensor Use (MWh) 49 110 152 148 172 112
Net Generation (MWh) 2,890,476 2,440,492 2,456,739 2,805,513 2,622,327 2,870,825
Plant Net Hydraulic Conversion Factor (GWh/MCM) 0.433 0.434 0.436 0.434 0.434 0.432
Total Unit Operating Time (hours) 39,349 32,749 33,809 39,509 36,641 40,275
Synchronous Condensor Time (hours)(1) 130 290 399 391 444 296
Unit Planned Outage Time (hours) 2,689 2,363 5,042 3,450 4,148 5,741
Unit Maintenance Outage Time (hours) 59 1,234 797 520 2,064 283
Unit Forced Outage Time (hours) 285 72 5 12 379 332
Number of Planned Outages 15 14 15 8 12 13
Number of Maintenance Outages 13 21 22 10 20 11
Number of Forced Outages 7 4 2 3 14 9
Failure Rate (Forced Outages/Oper. Hours x 8760) 0.45 ‐ 0.26 0.22 0.71 1.08
Incapability factor (% of time) 4.93 5.98 9.55 6.54 10.72 10.37
Weighted DAFOR (% of time) 0.60 0.18 0.05 0.08 0.83 0.68
Utilization Forced Outage Probability (% of time) n/a n/a n/a n/a n/a n/a
Note: 1. Synchronous condensor capability is for Unit 7 only.
PUB-NLH-148, Attachment 1 Page 5 of 8, Isl Int Sys Power Outages
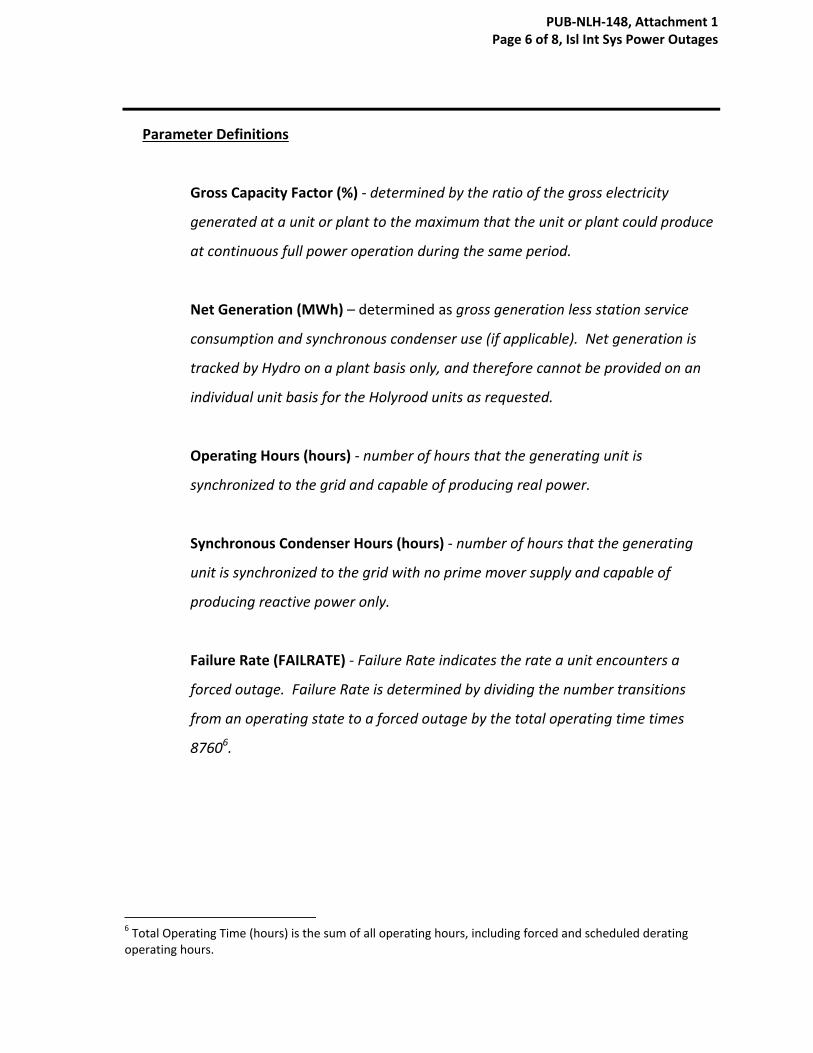
Parameter Definitions
Gross Capacity Factor (%) ‐ determined by the ratio of the gross electricity
generated at a unit or plant to the maximum that the unit or plant could produce
at continuous full power operation during the same period.
Net Generation (MWh) – determined as gross generation less station service
consumption and synchronous condenser use (if applicable). Net generation is
tracked by Hydro on a plant basis only, and therefore cannot be provided on an
individual unit basis for the Holyrood units as requested.
Operating Hours (hours) ‐ number of hours that the generating unit is
synchronized to the grid and capable of producing real power.
Synchronous Condenser Hours (hours) ‐ number of hours that the generating
unit is synchronized to the grid with no prime mover supply and capable of
producing reactive power only.
Failure Rate (FAILRATE) ‐ Failure Rate indicates the rate a unit encounters a
forced outage. Failure Rate is determined by dividing the number transitions
from an operating state to a forced outage by the total operating time times
87606.
6 Total Operating Time (hours) is the sum of all operating hours, including forced and scheduled derating operating hours.
PUB-NLH-148, Attachment 1 Page 6 of 8, Isl Int Sys Power Outages
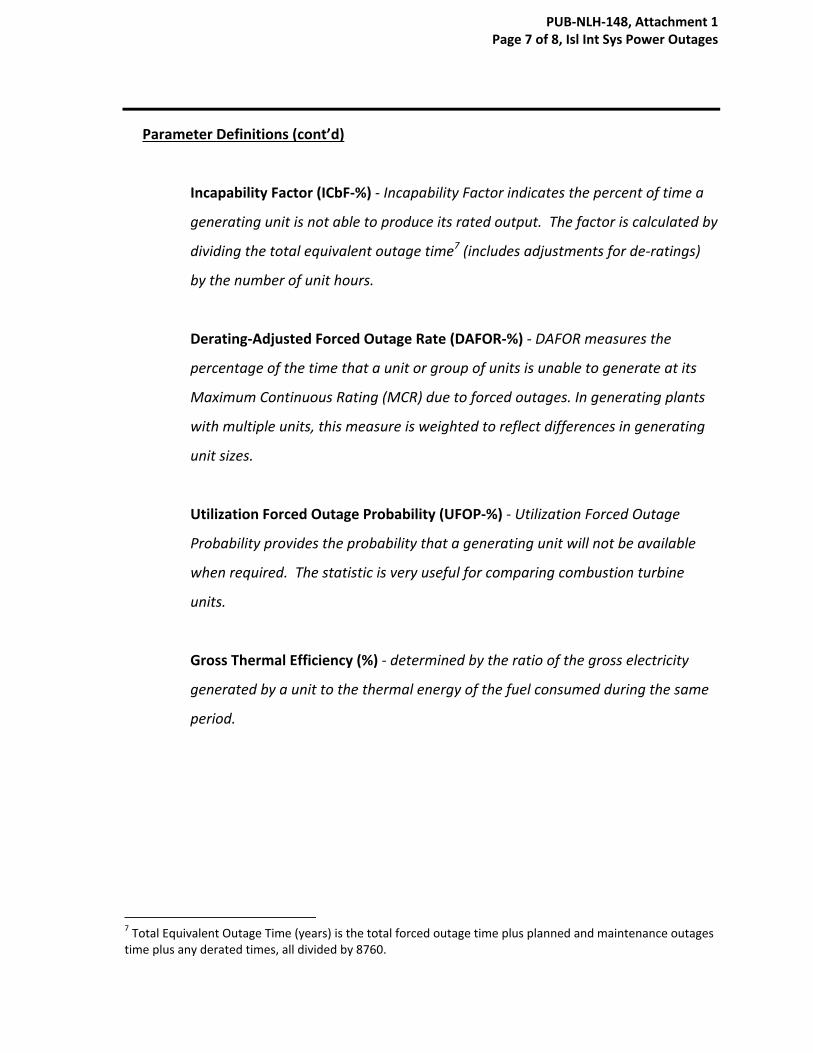
Parameter Definitions (cont’d)
Incapability Factor (ICbF‐%) ‐ Incapability Factor indicates the percent of time a
generating unit is not able to produce its rated output. The factor is calculated by
dividing the total equivalent outage time7 (includes adjustments for de‐ratings)
by the number of unit hours.
Derating‐Adjusted Forced Outage Rate (DAFOR‐%) ‐ DAFOR measures the
percentage of the time that a unit or group of units is unable to generate at its
Maximum Continuous Rating (MCR) due to forced outages. In generating plants
with multiple units, this measure is weighted to reflect differences in generating
unit sizes.
Utilization Forced Outage Probability (UFOP‐%) ‐ Utilization Forced Outage
Probability provides the probability that a generating unit will not be available
when required. The statistic is very useful for comparing combustion turbine
units.
Gross Thermal Efficiency (%) ‐ determined by the ratio of the gross electricity
generated by a unit to the thermal energy of the fuel consumed during the same
period.
7 Total Equivalent Outage Time (years) is the total forced outage time plus planned and maintenance outages time plus any derated times, all divided by 8760.
PUB-NLH-148, Attachment 1 Page 7 of 8, Isl Int Sys Power Outages
Parameter Definitions (cont’d)
Gross Heat Rate (BTUs/kWh) ‐ is determined by the amount of BTUs required in
the oil admitted to the Boiler furnace to produce 1 kWh (3412 BTUs) at the
generator terminals8.
Fuel Conversion Factor – this parameter tracks the efficiency in converting fuel
oil into electrical energy at Hydro’s thermal units and gas turbines and is
measured as the ratio of the kWhs generated to the number of barrels or gallons
of fuel oil consumed.
Hydraulic Conversion Factor (GWh/MCM) ‐ This measure tracks the efficiency in
converting water to energy and it is calculated as the ratio of Net GWh generated
for every one million cubic metres (MCM) of water turbined.
8 Hydro does not track heat rate at its gas turbine units.
PUB-NLH-148, Attachment 1 Page 8 of 8, Isl Int Sys Power Outages