Embed Size (px)
Citation preview

Mon. Not. R. Astron. Soc. 420, 2684–2699 (2012) doi:10.1111/j.1365-2966.2011.20240.x
PTF10iya: a short-lived, luminous flare from the nuclear region of astar-forming galaxy
S. Bradley Cenko,1� Joshua S. Bloom,1 S. R. Kulkarni,2 Linda E. Strubbe,1,3
Adam A. Miller,1 Nathaniel R. Butler,1† Robert M. Quimby,4 Avishay Gal-Yam,5
Eran O. Ofek,2† Eliot Quataert,1,3 Lars Bildsten,6,7 Dovi Poznanski,1,8,9†Daniel A. Perley,1 Adam N. Morgan,1 Alexei V. Filippenko,1 Dale A. Frail,10
Iair Arcavi,5 Sagi Ben-Ami,5 Antonio Cucchiara,1,8 Christopher D. Fassnacht,11
Yoav Green,5 Isobel M. Hook,12,13 D. Andrew Howell,6,14 David J. Lagattuta,11
Nicholas M. Law,15 Mansi M. Kasliwal,2 Peter E. Nugent,8 Jeffrey M. Silverman,1
Mark Sullivan,12 Shriharsh P. Tendulkar2 and Ofer Yaron5
1Department of Astronomy, University of California, Berkeley, CA 94720-3411, USA2Cahill Center for Astrophysics, California Institute of Technology, Pasadena, CA 91125, USA3Theoretical Astrophysics Center, University of California, Berkeley, CA 94720-3411, USA4IPMU, University of Tokyo, Kashiwanoha 5-1-5, Kashiwa-shi, Chiba, Japan5Department of Particle Physics and Astrophysics, The Weizmann Institute of Science, Rehovot 76100, Israel6Department of Physics, Broida Hall, University of California, Santa Barbara, CA 93106, USA7The Kavli Institute for Theoretical Physics, Kohn Hall, University of California, Santa Barbara, CA 93106, USA8Computational Cosmology Center, Lawrence Berkeley National Laboratory, 1 Cyclotron Road, Berkeley, CA 94720, USA9School of Physics and Astronomy, Tel-Aviv University, Tel-Aviv 69978, Israel10National Radio Astronomy Observatory, PO Box 0, Socorro, NM 87801, USA11Department of Physics, University of California Davis, 1 Shields Avenue, Davis, CA 95616, USA12Department of Physics (Astrophysics), University of Oxford, Keble Road, Oxford OX1 3RH13INAF-Osservatorio di Roma, via Frascati 33, I-00040 Monteporzio Catone (Roma), Italy14Las Cumbres Observatory Global Telescope Network, Goleta, CA 93117, USA15Dunlap Institute for Astronomy and Astrophysics, University of Toronto, 50 St. George Street, Toronto M5S 3H4, Ontario, Canada
Accepted 2011 November 18. Received 2011 October 16; in original form 2011 March 3
ABSTRACTWe present the discovery and characterization of PTF10iya, a short-lived (�t ≈ 10 d, withan optical decay rate of ∼0.3 mag d−1), luminous (Mg′ ≈ −21 mag) transient source foundby the Palomar Transient Factory. The ultraviolet/optical spectral energy distribution is rea-sonably well fitted by a blackbody with T ≈ (1–2) × 104 K and peak bolometric luminosityLBB ≈ (1–5) × 1044 erg s−1 (depending on the details of the extinction correction). A com-parable amount of energy is radiated in the X-ray band that appears to result from a distinctphysical process. The location of PTF10iya is consistent with the nucleus of a star-forminggalaxy (z = 0.224 05 ± 0.000 06) to within 350 mas (99.7 per cent confidence radius), or aprojected distance of less than 1.2 kpc. At first glance, these properties appear reminiscent ofthe characteristic ‘big blue bump’ seen in the near-ultraviolet spectra of many active galacticnuclei (AGNs). However, emission-line diagnostics of the host galaxy, along with a historicallight curve extending back to 2007, show no evidence for AGN-like activity. We thereforeconsider whether the tidal disruption of a star by an otherwise quiescent supermassive blackhole may account for our observations. Though with limited temporal information, PTF10iyaappears broadly consistent with the predictions for the early ‘super-Eddington’ phase of a
�E-mail: [email protected]†Einstein Fellow.
C© 2012 The AuthorsMonthly Notices of the Royal Astronomical Society C© 2012 RAS

PTF10iya: a short-lived, luminous flare 2685
solar-type star being disrupted by a ∼107 M� black hole. Regardless of the precise physicalorigin of the accreting material, the large luminosity and short duration suggest that otherwisequiescent galaxies can transition extremely rapidly to radiate near the Eddington limit; manysuch outbursts may have been missed by previous surveys lacking sufficient cadence.
Key words: accretion, accretion discs – black hole physics – galaxies: active – galaxies:nuclei.
1 IN T RO D U C T I O N
Understanding the physics of accretion, and, in particular, the asso-ciated electromagnetic emission, is a topic at the forefront of modernastrophysics. From planet formation to Galactic X-ray binaries tothe most luminous quasars, accretion plays a role in an astoundingarray of phenomena across a diverse range of mass and size scales.Of special interest is the importance of the process in the formationand growth of the supermassive black holes (SMBHs) that appear toreside in the centres of all bulge galaxies (Kormendy & Richstone1995), and the mechanism by which these SMBHs are intimatelyconnected to the growth and evolution of galaxies (i.e. the MBH–σ ∗relation; Ferrarese & Merritt 2000; Gebhardt et al. 2000).
Rees (1988) first suggested that the tidal disruption of a star by aSMBH could be a powerful method to study accretion in otherwisequiescent galaxies. If the observational signature of the resultingelectromagnetic emission, known as a tidal disruption flare (TDF),were better constrained, these outbursts could potentially be usedto probe the properties (i.e. mass) of SMBHs in quiescent galaxiesbeyond the reach of (resolved) kinematic studies of central gas andstars.
The task of observationally identifying TDFs, however, is greatlycomplicated by the diverse array of transient phenomena that oc-cur in galactic nuclei. Aside from the well-known classes of activegalactic nuclei (AGNs), such as blazars and normal Seyfert galaxies,potential TDF ‘impostors’ include the relatively rare double-peakedemitters (systems that exhibit both blueshifted and redshifted emis-sion lines that may indicate an origin in a rotating accretion disc;Halpern & Filippenko 1988), and Type IIn supernovae (SNe IIn;objects with narrow and intermediate width emission lines indica-tive of interaction with a moderately dense circumstellar medium;see Filippenko 1997 for a review). Future progress requires a fullaccounting of these interlopers, both at the individual (i.e. to estab-lish or rule out a TDF origin for a given event) and class (i.e. for ratecalculations) levels (van Velzen et al. 2011a; Strubbe & Quataert2011).
In the optical bandpass, wide-field, high-cadence surveys suchas the Palomar Transient Factory (PTF; Law et al. 2009; Rau et al.2009), Pan-STARRS1 (PS1; Kaiser et al. 2002), the Catalina Real-time Transient Survey (CRTS; Drake et al. 2009) and SkyMapper(Schmidt et al. 2005) are all currently attempting to chart the brightend of the transient landscape in advance of the Large SynopticSurvey Telescope (LSST). As untargeted transient surveys, theseprojects should provide a relatively unbiased view (with the notableexception of dust extinction) of the optical variability of nearbygalaxies, where many AGNs and SNe emit a significant fraction oftheir bolometric luminosity, and are therefore well suited to addressmany of the questions mentioned above.
Here we present the discovery by PTF of a short-lived, luminoustransient (PTF10iya) in the nuclear region of a redshift z = 0.22star-forming galaxy, which serves as an interesting test case formany of these issues. Our manuscript is organized as follows.
In Section 2, we describe the discovery of PTF10iya, as well asoptical, ultraviolet (UV), near-infrared (NIR) and X-ray follow-up observations and archival data at the location of the tran-sient. Section 3 presents the astrometry of the transient emis-sion, the broad-band spectral energy distribution (SED), and theproperties of the host galaxy. In Section 4, we outline possibleemission mechanisms to explain the observed properties of theoutburst.
Throughout this paper, we adopt a standard � cold dark mattercosmology with H0 = 71 km s−1 Mpc−1, �m = 0.27 and �� =1 − �m = 0.73 (Spergel et al. 2007). All quoted uncertainties are1σ (68 per cent) confidence intervals unless otherwise noted, andUT times are used throughout.
2 O BSERVATI ONS
2.1 Palomar 48-inch discovery and photometry
As part of the PTF 5-d cadence survey, we obtained a pair ofR-band images of PTF field 4328 on 2010 June 6 with the Palomar48-inch telescope (P48) equipped with the refurbished CFHT12kcamera (Rahmer et al. 2008). Subtraction of a stacked referenceimage of the field with HOTPANTS1 revealed a new transient source atcoordinates α = 14h38m41.s00, δ = 37◦39′33.′′6 (J2000.0), with anastrometric uncertainty of ±150 mas in each coordinate [referencedwith respect to the Sloan Digital Sky Survey (SDSS) Data Release7 catalogue; Abazajian et al. 2009].
The transient was discovered 3 hours later by OARICAL, an au-tonomous software framework of the PTF collaboration (Bloomet al. 2011b), and given the name PTF10iya. The software fur-ther noted the presence of a coincident catalogued extended source,SDSS J143840.98+373933.4 (hereafter SDSS J1438; Fig. 1), iden-tifying this object as a potential host galaxy for PTF10iya.
No transient emission was detected at this location with P48,either prior to (extending back to 2009 May) or after (through 2011July) the outburst, to a typical 3σ limiting magnitude of R ≈ 21.A listing of P48 observations taken around the time of outburst,calibrated using SDSS magnitudes of nearby point sources and thefilter transformations of Jordi, Grebel & Ammon (2006), is providedin Table 1.
This field was also observed as part of the Palomar-QUEST sur-vey (Djorgovski et al. 2008) on eight separate nights ranging from2007 May 6 to 2008 July 30. The observations have been com-piled into a single searchable data base at the Lawrence BerkeleyNational Laboratory as part of the Deep Sky project.2 The galaxySDSS J1438 is only weakly detected in most images. We thereforeforgo image subtraction and perform photometry with a 2.5 arcsec(radius) aperture on all individual frames, using the SDSS i′ filter to
1 See http://www.astro.washington.edu/users/becker/hotpants.html.2 See http://supernova.lbl.gov/~nugent/deepsky.html.
C© 2012 The Authors, MNRAS 420, 2684–2699Monthly Notices of the Royal Astronomical Society C© 2012 RAS

2686 S. B. Cenko et al.
Figure 1. Finder chart for PTF10iya. Left-hand panel: P60 r′ image from 2010 June 7. Middle panel: P60 reference image from several weeks later. Right-handpanel: digital subtraction of the two P60 images. The transient PTF10iya is indicated by the black tick marks. All images are oriented with north up and eastto the left.
Table 1. UV/optical observations of PTF10iya.
Datea Telescope/instrument Filter Exposure time Magnitudeb
(UT) (s)
2010 June 1.295 P48 R 60.0 >20.622010 June 1.344 P48 R 60.0 >20.532010 June 6.302 P48 R 60.0 19.77 ± 0.102010 June 6.356 P48 R 60.0 19.91 ± 0.112010 June 7.170 P60 i′ 120.0 20.24 ± 0.202010 June 7.172 P60 r′ 120.0 19.92 ± 0.102010 June 7.174 P60 g′ 120.0 19.79 ± 0.082010 June 11.335 P48 R 60.0 >19.392010 June 11.779 Swift/UVOT UVW1 314.5 19.73 ± 0.272010 June 11.782 Swift/UVOT U 157.0 19.31 ± 0.182010 June 11.784 Swift/UVOT UVW2 629.4 19.73 ± 0.172010 June 11.788 Swift/UVOT UVM2 1478.2 19.77 ± 0.152010 June 13.311 P60 i′ 180.0 22.14 ± 0.352010 June 13.313 P60 r′ 120.0 21.62 ± 0.282010 June 13.318 P60 g′ 120.0 21.46 ± 0.282010 June 16.334 P48 R 60.0 >20.752010 June 16.378 P48 R 60.0 >20.602010 June 18.687 P60 i′ 1080.0 >22.242010 June 18.689 P60 r′ 720.0 >22.692010 June 18.689 P60 g′ 360.0 >21.612010 August 10.498 Swift/UVOT UVM2 1771.4 >21.012010 August 10.499 Swift/UVOT U 591.4 >20.672010 August 10.499 Swift/UVOT UVW1 1179.0 >20.472010 August 10.499 Swift/UVOT UVW2 1998.5 >20.69
a UT at the mid-point of exposure/co-add.bAll reported magnitudes have had host-galaxy flux removed and represent light only fromthe transient PTF 10iya. Magnitudes here have not been corrected for Galactic extinction[E(B − V) = 0.010 mag; Schlegel et al. 1998], nor for extinction in the host galaxy of thetransient. Observations in the g′, r′, and i′ bands are reported on the AB magnitude system(Oke & Gunn 1983). U- and R-band observations are with reference to Vega, while UVW1,UVM2 and UVW2 are on the UVOT photometric system (Poole et al. 2008).
calibrate the observed red bandpass (an order-blocking filter witha cut-off bluewards of λ ≈ 6100 Å). The resulting photometry isgiven in Table 2.
Taking the weighted mean of all the pre-outburst Deep Sky mea-surements of the potential host galaxy, we calculate 〈i′〉 = 19.53 ±
0.17 mag, in good agreement with the value from SDSS, giventhe somewhat different passbands (i ′
SDSS = 19.65 ± 0.04 mag). Ifwe assume a constant flux equal to this value, we find χ2 = 6.32(17 d.o.f.). The observations are therefore consistent with a staticflux level (null probability 0.991).
C© 2012 The Authors, MNRAS 420, 2684–2699Monthly Notices of the Royal Astronomical Society C© 2012 RAS
PTF10iya: a short-lived, luminous flare 2687
Table 2. Historical Deep Sky observations of SDSS J1438.
Datea Exposure time Magnitudeb
(UT) (s)
2007 May 6.486 60.4 19.84 ± 0.312007 May 18.462 60.2 19.63 ± 0.302007 May 18.464 60.4 19.72 ± 0.312007 May 18.476 60.5 19.82 ± 0.332007 May 18.477 60.4 19.73 ± 0.312008 May 8.476 60.2 19.60 ± 0.242008 May 8.477 60.4 19.41 ± 0.272008 May 8.485 60.3 19.66 ± 0.272008 May 8.486 60.3 19.30 ± 0.402008 Jun 10.326 60.3 19.34 ± 0.262008 Jun 10.368 60.3 19.61 ± 0.322008 Jun 13.306 80.5 19.61 ± 0.302008 Jun 13.351 80.3 19.42 ± 0.292008 Jun 18.239 100.3 19.62 ± 0.342008 Jul 2.286 100.3 19.41 ± 0.292008 Jul 2.317 100.4 19.55 ± 0.292008 Jul 30.194 100.3 19.29 ± 0.232008 Jul 30.238 100.3 19.32 ± 0.26
a UT at the mid-point of exposure.bInstrumental magnitudes were determined using a 2.5 arcsec (radius) aper-ture. Photometric calibration was performed relative to the SDSS i′ filter andare on the AB magnitude system (Oke & Gunn 1983). The magnitudes herehave not been corrected for Galactic extinction [E(B − V) = 0.010 mag;Schlegel, Finkbeiner & Davis 1998], nor for extinction in the host galaxy.
We caution, however, that an outburst of comparable magnitude tothat observed from PTF10iya (i′ = 20.24 mag; Section 2.2) may nothave been detectable due to the small ratio of host flux to transientflux and the low signal-to-noise ratio of most observations. Theabove limits therefore more directly limit brighter and/or redderoutbursts from SDSS J1438.
2.2 Palomar 60-inch photometry
Upon discovery of PTF10iya, the field was automatically insertedinto the queue of the robotic Palomar 60-inch telescope (P60; Cenkoet al. 2006) for multicolour follow-up observations. Images wereprocessed using our custom real-time pipeline, and then subtractedfrom reference frames obtained several months after the outburstusing HOTPANTS (Fig. 1). Subtracting late-time (after 2010 July)P60 images from archival SDSS frames yielded no residual flux,confirming that the transient was below our detection threshold atthis time. A log of our P60 observations of PTF10iya, with laterimages stacked to increase depth, is provided in Table 1.
2.3 Swift UV-Optical Telescope/X-ray Telescope
Motivated by the blue continuum (Section 2.6) and the large ab-solute magnitude of the outburst (MR ≈ −21 mag; Section 3.2),we triggered UV and X-ray target-of-opportunity observations ofPTF10iya with the Swift satellite (Gehrels et al. 2004). The field wasobserved by the UV–Optical Telescope (UVOT; Roming et al. 2005)and the X-ray Telescope (XRT; Burrows et al. 2005) beginning at17:53 on 2010 June 11. A second set of images were obtained withSwift on 2010 August 10, while a series of reference orbits observedfrom 2011 August 18 to 2011 September 7 were stacked to removequiescent flux from the potential host galaxy SDSS J1438.
For the UVOT U-band observations, we determined the countrate at the location of PTF10iya using the techniques described
by Li et al. (2006), while for the UVW1, UVM2 and UVW2 datawe used the methods of Poole et al. (2008).3 After subtractingthe pile-up-corrected count rates directly (see e.g. Brown et al.2009), transient emission at the location of PTF10iya is clearlydetected in all four blue filters in our initial epoch on 2010 June 11.Comparing our second epoch on 2010 August 10 with the late-timereference images, we find that the UV flux has not varied over thisinterval. This would suggest that the transient emission has fadedbelow the UVOT sensitivity limit several months after discovery.A full listing of the host-subtracted UV photometry is provided inTable 1.
We reduced the XRT data using the pipeline described by Butler(2007). In the first epoch on 2010 June 11, an X-ray source is clearlydetected (34.5 ± 4.5 counts) at the location of PTF10iya (thoughwith large astrometric uncertainty, ∼5 arcsec), corresponding to aflux FX = (7.5+6.2
−2.5) × 10−13 erg cm−2 s−1 (0.3–10 keV). Fitting apower-law model (dN/dE ∝ E−�) to the observed spectrum resultsin a photon index of � = 1.8+1.2
−1.0 (χ2 = 14.72 for 17 d.o.f.). No X-ray emission is detected at the location of PTF10iya in the secondepoch obtained on 2010 August 10, nor in the final reference epochfrom 2011 August to September. Assuming the same spectrum asin the first epoch, we derive a 3σ flux limit (0.3–10 keV) on thequiescent flux level of FX < 3 × 10⁻¹⁴ erg cm−2 s−1.
2.4 Keck laser guide-star adaptive optics
On 2010 June 18, we observed the field of PTF10iya with theNear-Infrared Camera 2 (NIRC2) mounted behind the laser guide-star adaptive optics (LGS/AO) system on the Keck II telescope(Wizinowich et al. 2006). Beginning at 8:10, we obtained a se-ries of K ′-band exposures, each consisting of 10 non-destructivereadouts of either 10 or 20 s, for a total time on source of 800 s.Images were reduced using standard IRAF4 routines, using a mediancombination of the (non-aligned) dithered images to correct for thesky background. Prior to registration, we applied the distortion cor-rection provided by the Keck Observatory.5 The resulting image(shown in the middle and right-hand panels of Fig. 2) was used forastrometric analysis (Section 3.1). However, this procedure doesnot conserve flux, and so we created a separate co-addition that didnot include the distortion correction for photometry.
A second series of LGS/AO images were obtained on 2010December 2 with a total integration time of 750 s using the identicalinstrumental setup. Both SDSS J1438 and the offset point source(Section 3.1) are detected, with no evidence for variability in eithersource.
2.5 Palomar 200-inch Large Format Camera
We observed the field of PTF10iya with the Large Format Camera(LFC; Simcoe et al. 2000) mounted on the 5-m Palomar Hale Tele-scope on 2010 August 9. A total of five dithered exposures (each120 s) were obtained in the r′ filter beginning at 4:46. After reg-istering the individual images to a common reference, the frames
3 We do not use the V-band and B-band data here, as the host plus transientwere only marginally detected, and no Swift reference frames were obtainedin these filters.4 IRAF is distributed by the National Optical Astronomy Observatory, whichis operated by the Association for Research in Astronomy, Inc., under co-operative agreement with the National Science Foundation.5 See http://www2.keck.hawaii.edu/inst/nirc2/forReDoc/post_observing/dewarp.
C© 2012 The Authors, MNRAS 420, 2684–2699Monthly Notices of the Royal Astronomical Society C© 2012 RAS
2688 S. B. Cenko et al.
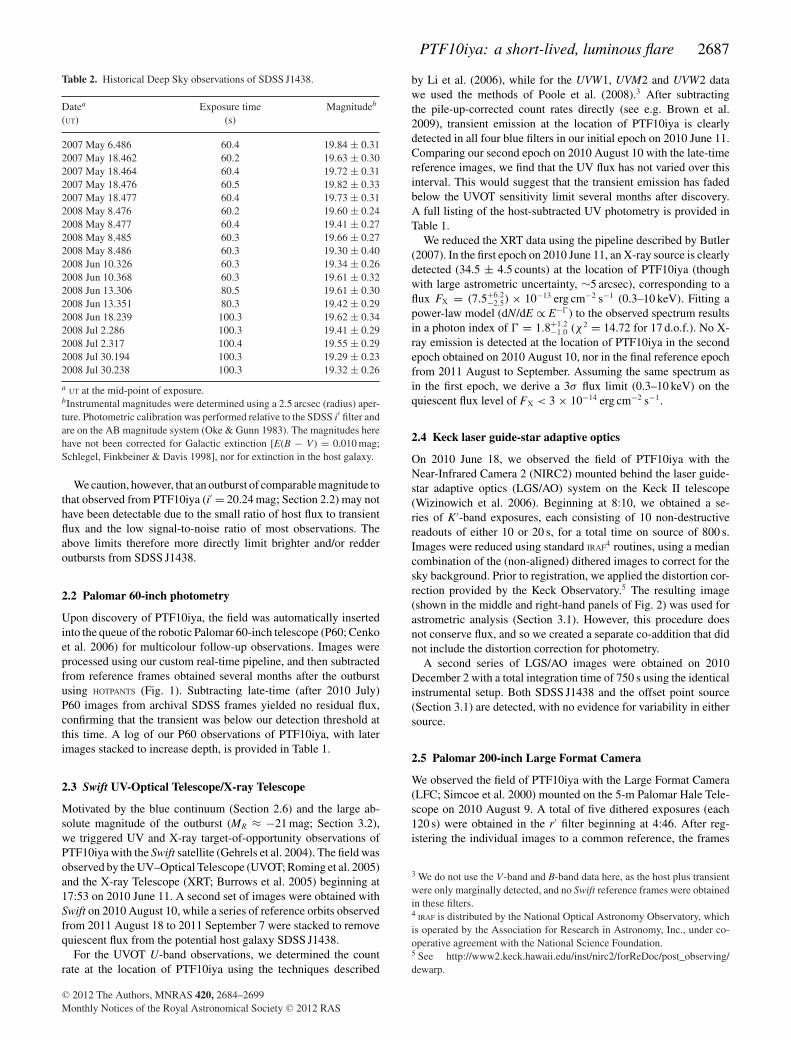
Figure 2. PTF10iya astrometry. The left-hand panel displays the Palomar LFC r′ reference imaging of the field of PTF10iya. Due to the relative sparsenessof the field, the image contains only two point sources in common with the NIRC2/LGS imaging (middle panel), marked ‘A’ and ‘B’. Using only thesetwo sources, we calculate the 99.7 per cent containment radius for PTF10iya to be 350 mas. This localization region is shown in a zoomed-in version of theNIRC2/LGS imaging in the right-hand panel. The position of the nucleus of SDSS J1438, marked with a plus sign, is consistent with the location of the transientemission. The point source to the north-west is ruled out as a counterpart to PTF10iya at large confidence, and the lack of association is further reinforced bythe absence of variability of this point source over the course of 6 months. All images are oriented with north up and east to the left.
Table 3. Optical spectra of PTF10iya.
Datea Telescope/instrument Wavelength coverage Exposure time Spectral resolution(UT) (Å) (s) (Å)
June 8.43 Keck I/LRIS (blue) 3500–5600 450.0 7.0June 8.43 Keck I/LRIS (red) 5600–10100 370.0 6.5June 9.10 WHT/ISIS (blue) 3100–5300 600.0 3.4June 9.10 WHT/ISIS (red) 5300–9500 600.0 7.3June 12.49 Keck I/LRIS (blue) 3500–5600 600.0 4.0June 12.49 Keck I/LRIS (red) 5600–10100 600.0 6.5July 8.29 Keck I/LRIS (blue) 3500–5600 1200.0 4.0July 8.29 Keck I/LRIS (red) 5600–10100 1200.0 6.5
a UT at the beginning of exposure.
were combined into a single co-add using the SWARP software pack-age.6 The resulting stacked image is shown in the left-hand panelof Fig. 2.
2.6 Optical spectroscopy
We undertook a series of spectroscopic observations of PTF10iyawith the Intermediate dispersion Spectrograph and Imaging System(ISIS) mounted on the 4.2-m William Herschel Telescope (WHT;June 9) and the Low Resolution Imaging Spectrometer (LRIS; Okeet al. 1995) mounted on the 10-m Keck I telescope (June 8, June 12,July 7). For all spectra, the slit was oriented at the parallactic angle tominimize losses due to atmospheric dispersion (Filippenko 1982).Details of the observational setup for each respective spectrum areprovided in Table 3.
All spectra were reduced using standard routines (see e.g.Ellis et al. 2008 for details). Spectra were extracted optimally(Horne 1986) within the IRAF environment. A dispersion solutionwas computed using afternoon calibration spectra of arc lamps,and then adjusted for each individual exposure using night-sky
6 See http://www.astromatic.net/software/swarp.
lines. Telluric atmospheric absorption features were removed us-ing the continuum from spectrophotometric standard stars (Wade& Horne 1988; Matheson et al. 2000). Finally, a sensitivity func-tion was applied using observations of spectrophotometric stan-dards at a comparable airmass. The red and blue arms wererebinned to a common dispersion and then joined across thedichroic.
To account for slit losses, we have adjusted the flux calibrationfor all four spectra using broad-band photometry from our (unsub-tracted) P60 images at comparable epochs. Three of the resultingspectra are shown in Fig. 3.
2.7 Radio observations
We observed the location of PTF10iya with the NRAO7 ExpandedVery Large Array (EVLA) for 1 h on 2011 April 29.3 UT. Observa-tions with a total bandwidth of 256 MHz were obtained at centrefrequencies of 1.3 and 8.4 GHz. A compact source (J1426+3625)
7 The National Radio Astronomy Observatory (NRAO) is a facility of theNational Science Foundation operated under cooperative agreement by As-sociated Universities, Inc.
C© 2012 The Authors, MNRAS 420, 2684–2699Monthly Notices of the Royal Astronomical Society C© 2012 RAS

PTF10iya: a short-lived, luminous flare 2689
Figure 3. Spectroscopic observations of PTF10iya/SDSS J1438. The spec-tra from June 9 (WHT) and June 12 (LRIS) have been offset for clarity.Our spectrum from June 8 obtained with LRIS is not plotted, as it is nearlyidentical to the WHT spectrum.
near PTF10iya was observed every 4–6 min for accurate phase cal-ibration, while 3C 286 was observed at the end of the run for thebandpass and flux-density calibration. The data were reduced andimaged using the AIPS (Astronomical Image Processing System)software package.
There was no emission detected at the position of PTF10iya to3σ limits of 0.13 and 0.07 mJy at 1.3 and 8.4 GHz, respectively.At the distance of the host galaxy (Section 3.3), this correspondsto spectral luminosities of <1.4 × 1029 erg s−1 Hz−1 (1.3 GHz)and <7.8 × 1028 erg s−1 Hz−1 (8.4 GHz).
2.8 Additional archival data
As discussed in Section 2.1, PTF10iya is spatially coincident (seeSection 3.1 for a detailed discussion of astrometry) with the ex-tended source SDSS J1438. The photometry (model magnitudes)provided by SDSS implies a modestly red galaxy (g′ − r′ =0.72 mag).
The location of PTF10iya was observed with the Very LargeArray (VLA) at 1.4 GHz in 1995 December as part of the FaintImages of the Radio Sky at Twenty centimetres (FIRST; Becker,White & Helfand 1995). No source is detected at this location to a 3σ
limiting flux density of 0.39 mJy. There is no source consistent withthe location of PTF10iya in either the Fermi Large Area Telescope(LAT; 100 MeV–100 GeV) 1-year Point Source Catalogue (Abdoet al. 2010) or the ROSAT (0.1–2.4 keV) All-Sky Survey BrightSource Catalogue (Voges et al. 1999).
3 A NA LY SIS
3.1 Astrometry
We first determine if there is any discernible offset between the ob-served transient emission and the nucleus of the galaxy SDSS J1438,as this greatly constrains viable models for the outburst. Becauseof the significantly smaller pixel scale (0.38 arcsec, compared with1.0 arcsec for the P48 camera), we initially consider the P60 imag-ing.
Starting with the g′ data (where the transient emission is detectedmost strongly), we compute an astrometric solution for the refer-
ence image using 20 point sources in SDSS. The 1σ uncertaintyassociated with the absolute astrometric calibration is 90 mas ineach coordinate. Using the centroiding method from SEXTRACTOR,8
we measure a position for SDSS J1438 in our reference images ofα = 14h38m40.s988, δ = +37◦39′33.′′43 (J2000.0), consistent withinthe stated uncertainties with the SDSS measurement.
Aligning our P60 g′ image from 2010 June 7 with the co-addedP60 reference image using 15 common point sources, we mea-sure a dispersion of 0.20 pixel (80 mas) in each direction. On thesubtracted image, we measure a position for the transient emis-sion of α = 14h38m40.s983, δ = +37◦39′33.′′46, correspondingto an offset from SDSS J1438 of (+0.09, −0.14) pixels. Repeat-ing the process for the r′ and i′ filters yields similar results. Thus,based solely on the P60 observations, we conclude that PTF10iyaoccurred within 120 mas (radius) of the nucleus of SDSS J1438(68 per cent confidence interval). At z = 0.224 (Section 3.3), thiscorresponds to a projected distance of d < 420 pc.
The significantly improved angular resolution provided by theLGS/AO imaging system with NIRC2 could provide even tighterconstraints on any offset between PTF10iya and SDSS J1438. It isclear from the LGS image (Fig. 2, right-hand panel) that a pointsource is detected offset from the nucleus of SDSS J1438: using theNIRC2 (wide-camera) pixel scale (0.039686 arcsec), we measurea radial offset of 970 mas (corresponding to a cardinal offset of140 mas west, 960 mas north at the specified position angle of 0◦).
Aligning the NIRC2 data from 2010 June 18 with optical imag-ing of the field is complicated by the lack of sources common toboth frames. Even in our deepest LFC stack, we find only twopoint sources9 present in both images (Fig. 2, sources ‘A’ and ‘B’).We therefore allow for only a translational offset (i.e. �x, �y) be-tween the two images. In other words, we have fixed the relativescale and rotation (based on the known NIRC2 pixel scale andposition angle), and calculated the average shift between the twopoint sources. The resulting uncertainty associated with this pro-cedure, calculated as the average offset between the positions ofsources A and B in the LFC and NIRC2 images, is 50 mas in eachcoordinate.
Using the resulting astrometry, we measure a position for thepoint source of α = 14h38m40.s968, δ = +37◦39′34.′′43. Thus, thepoint source is offset from the transient location by 990 mas inradius. Even if we assume a relatively conservative uncertainty of100 mas in each coordinate (double the derived value) to accountfor the lack of common sources for registration, we still concludethat the point source is offset from PTF10iya with overwhelmingconfidence.
On the other hand, in the NIRC2 image we measure a positionfor SDSS J1438 of α = 14h38m40.s980, δ = +37◦39′33.′′47. Thisfalls only 40 mas from the location of PTF10iya, fully consistentwithin the errors. This is clearly illustrated in the right-hand panelof Fig. 2, where the centroid of SDSS J1438 (indicated with a plussign) falls within the 99.7 per cent confidence (350 mas adopting ourconservative estimate) localization of PTF10iya. The point source,however, is well outside this position.
Two additional lines of evidence further argue against an asso-ciation between the offset NIR point source and the optical tran-sient PTF10iya. Using the K-band magnitude for the nearby brightstar 2MASS J143841.12+3739571 (source A in Fig. 2) from the
8 See http://www.astromatic.net/software/sextractor.9 The requirement that the common sources be unresolved by default pre-cludes the usage of SDSS J1438.
C© 2012 The Authors, MNRAS 420, 2684–2699Monthly Notices of the Royal Astronomical Society C© 2012 RAS
2690 S. B. Cenko et al.
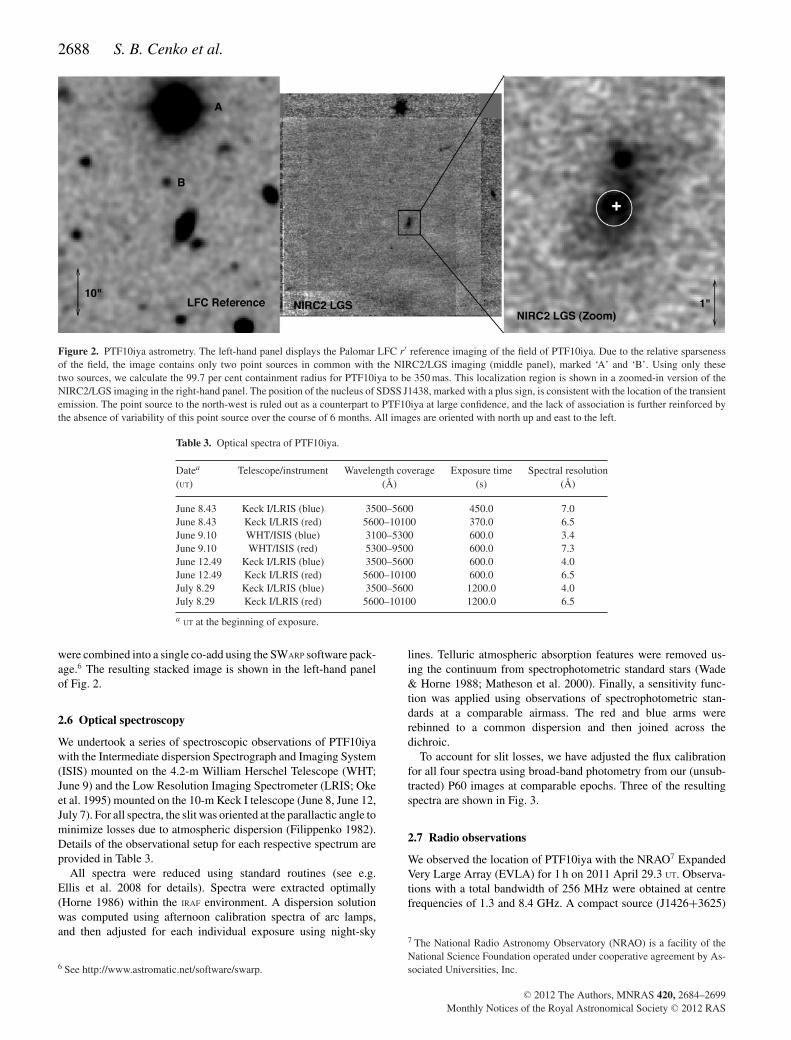
Figure 4. Observed optical light curve of PTF10iya, around the time ofoutburst. The time is referenced to the P48 discovery on June 6.302. Theinverted triangles represent 3σ upper limits. The shaded grey vertical barindicates the epoch of our Swift X-ray and UV observations. The horizon-tal dashed line indicates the quiescent (r′) magnitude of the host galaxySDSS J1438. The times of optical spectroscopic observations are markedwith an ‘S’. No correction has been applied for extinction within the hostgalaxy (Section 3.3). Note that the i′- and g′-band data have been offsetslightly in the horizontal direction for plotting purposes.
Two-Micron All-Sky Survey Point Source Catalog (Skrutskie et al.2006) as a reference, we measure a magnitude of K = 19.61 ± 0.08(Vega) for the offset point source on 2010 June 18. Within uncer-tainties, this value remains constant in our next epoch of K-bandimaging nearly 6 months later. In addition, in terms of flux density(f ν), the point source is actually brighter than the contemporane-ous optical limits from P60. Given that the observed spectrum ofPTF10iya was extremely blue (Section 3.2), it seems even moreunlikely that this point source is associated with PTF10iya.
As the offset NIR point source is undetected in even our deep-est (P200) optical imaging of the field, the object could eitherbe a foreground cool dwarf star, or an unresolved overdensity inSDSS J1438.10 We shall assume it is unrelated to PTF10iya for theremainder of this work.
To summarize, we conclude that the location of the transientPTF10iya is consistent with the nucleus of the galaxy SDSS J1438.Our 99.7 per cent confidence localization, with a radius of 350 mas,corresponds to a projected distance of 1.2 kpc at z = 0.224 (the 68per cent confidence radius of 150 mas corresponds to a projecteddistance of only 540 pc). Given the astrometric alignment, togetherwith the detection of absorption features in the transient spectra(Section 3.2), we shall assume for the remainder of this work thatPTF10iya is associated with SDSS J1438.
3.2 Light curve, spectral energy distribution and energetics
The optical light curve of PTF10iya (i.e. after subtracting host-galaxy contamination) is shown in Fig. 4. Given the non-detectionwith P48 on June 1, we can place a limit on the rise time of τ r <
5 d (dm/dt > 0.15 mag d−1). The R/r′ flux remains roughly constant
10 While M dwarfs are known to undergo dramatic, blue outbursts and cansometimes be confused for extragalactic transients (e.g. Kulkarni & Rau2006), the time-scale of PTF 10iya is orders of magnitude longer than anyknown such outburst.
for at least 1 day, after which it declines quite steeply at a rate of�0.3 mag d−1, or an e-folding time-scale of τ d ≈ 4 d. A similardecay is seen in both the g′ and the i′ filters.
Our detections of PTF10iya are largely clustered into two distinctepochs: June 6–9 (P48 and P60 optical photometry, WHT and LRISoptical spectroscopy) and June 11–13 (P60 optical photometry, SwiftUV and X-ray photometry, and LRIS spectroscopy). With onlylimited constraints on the light-curve evolution, we assume that theflux in all bandpasses is approximately constant over the course ofeach of the two epochs, and proceed to study the broad-band SED.
In order to do so, we must (1) remove the contribution of thehost galaxy SDSS J1438 from our spectroscopic observations; and(2) deredden the (subtracted) spectra and photometry to accountfor extinction within the host galaxy. As described in Section 2.6,the absolute flux scale for each spectrum has been calculated usingcontemporaneous P60 photometry of the host plus transient (i.e.before the image-subtraction process). To remove the host-galaxycontribution from our June spectra of PTF 10iya, we thus subtractedthe observed LRIS spectrum from July 7 (which is dominated byhost light).
While the initial spectra contained both emission and absorp-tion lines consistent with the redshift of SDSS J1438, the resultingsubtracted spectra are largely featureless with a relatively strongblue continuum (Fig. 5). All residual features are narrow and corre-spond to nebular emission or stellar absorption lines seen in the late-time host spectrum, and thus could result from small mismatches inresolution, slit orientation or wavelength solution.
To account for host-galaxy extinction, we use the reddening lawinferred for starburst galaxies from Calzetti (2001) with E(B −V)gas = 0.40 mag, which we derive from the observed Balmer decre-ment (Section 3.3). We discuss the effect of uncertainties in theinferred extinction on our results in what follows.
In Fig. 5, we plot the derived host- and extinction-correctedUV/optical SED of PTF10iya at both epochs. The broad-bandphotometry and spectra agree reasonably well and suggest that anysystematic uncertainties introduced in this process are relativelymodest.
We consider several continuum models in attempting to fit theobserved UV/optical SEDs. A power-law model (f λ ∝ λ−α) fails toreproduce the observed spectral curvature (particularly for the June6–9 data; left-hand panel of Fig. 5), and significantly overpredictsthe UV flux. A blackbody spectrum, however, provides a reasonabledescription of the data at both epochs. The best-fitting blackbodymodels are plotted in Fig. 5, while the derived fit parameters aredisplayed in Table 4 .
Two sources of uncertainty could potentially introduce large sys-tematic errors into these results. First, improper flux calibration(particularly in the near-UV, where atmospheric absorption can behighly variable) or host-galaxy subtraction could bias the derivedblackbody parameters. Our nearly simultaneous LRIS (June 8.43)and WHT (June 9.10) spectra allow us to test this to some extent,as the spectrum is unlikely to have evolved dramatically over this
Table 4. Optical/UV blackbody SED fit parameters.
Dates E(B − V)gas T LBB RBB
(mag) (104 K) (1044 erg s−1) (au)
June 6–9 0.40 2.1 ± 0.3 4.8 ± 1.4 130 ± 20June 6–9 0 1.3 ± 0.2 0.8 ± 0.2 140 ± 30June 11–13 0.40 2.2 ± 0.3 1.4 ± 0.3 63 ± 13June 11–13 0 1.5 ± 0.2 0.27 ± 0.09 57 ± 12
C© 2012 The Authors, MNRAS 420, 2684–2699Monthly Notices of the Royal Astronomical Society C© 2012 RAS
PTF10iya: a short-lived, luminous flare 2691
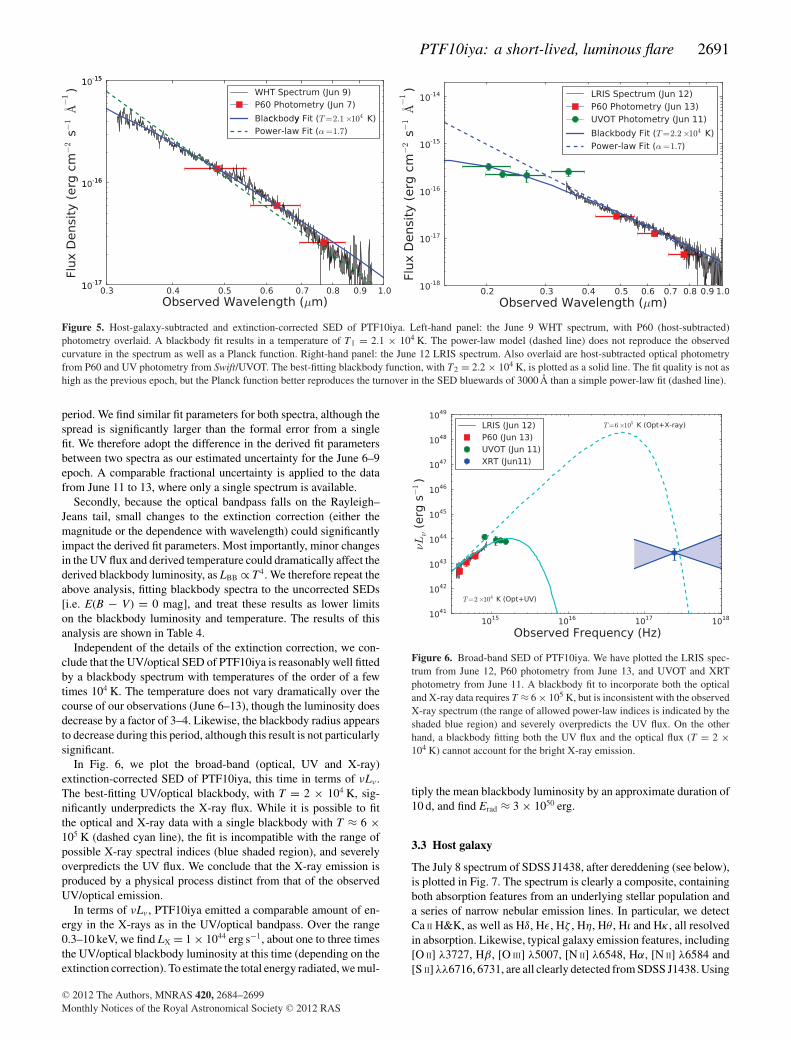
Figure 5. Host-galaxy-subtracted and extinction-corrected SED of PTF10iya. Left-hand panel: the June 9 WHT spectrum, with P60 (host-subtracted)photometry overlaid. A blackbody fit results in a temperature of T1 = 2.1 × 10⁴ K. The power-law model (dashed line) does not reproduce the observedcurvature in the spectrum as well as a Planck function. Right-hand panel: the June 12 LRIS spectrum. Also overlaid are host-subtracted optical photometryfrom P60 and UV photometry from Swift/UVOT. The best-fitting blackbody function, with T2 = 2.2 × 10⁴ K, is plotted as a solid line. The fit quality is not ashigh as the previous epoch, but the Planck function better reproduces the turnover in the SED bluewards of 3000 Å than a simple power-law fit (dashed line).
period. We find similar fit parameters for both spectra, although thespread is significantly larger than the formal error from a singlefit. We therefore adopt the difference in the derived fit parametersbetween two spectra as our estimated uncertainty for the June 6–9epoch. A comparable fractional uncertainty is applied to the datafrom June 11 to 13, where only a single spectrum is available.
Secondly, because the optical bandpass falls on the Rayleigh–Jeans tail, small changes to the extinction correction (either themagnitude or the dependence with wavelength) could significantlyimpact the derived fit parameters. Most importantly, minor changesin the UV flux and derived temperature could dramatically affect thederived blackbody luminosity, as LBB ∝ T4. We therefore repeat theabove analysis, fitting blackbody spectra to the uncorrected SEDs[i.e. E(B − V) = 0 mag], and treat these results as lower limitson the blackbody luminosity and temperature. The results of thisanalysis are shown in Table 4.
Independent of the details of the extinction correction, we con-clude that the UV/optical SED of PTF10iya is reasonably well fittedby a blackbody spectrum with temperatures of the order of a fewtimes 104 K. The temperature does not vary dramatically over thecourse of our observations (June 6–13), though the luminosity doesdecrease by a factor of 3–4. Likewise, the blackbody radius appearsto decrease during this period, although this result is not particularlysignificant.
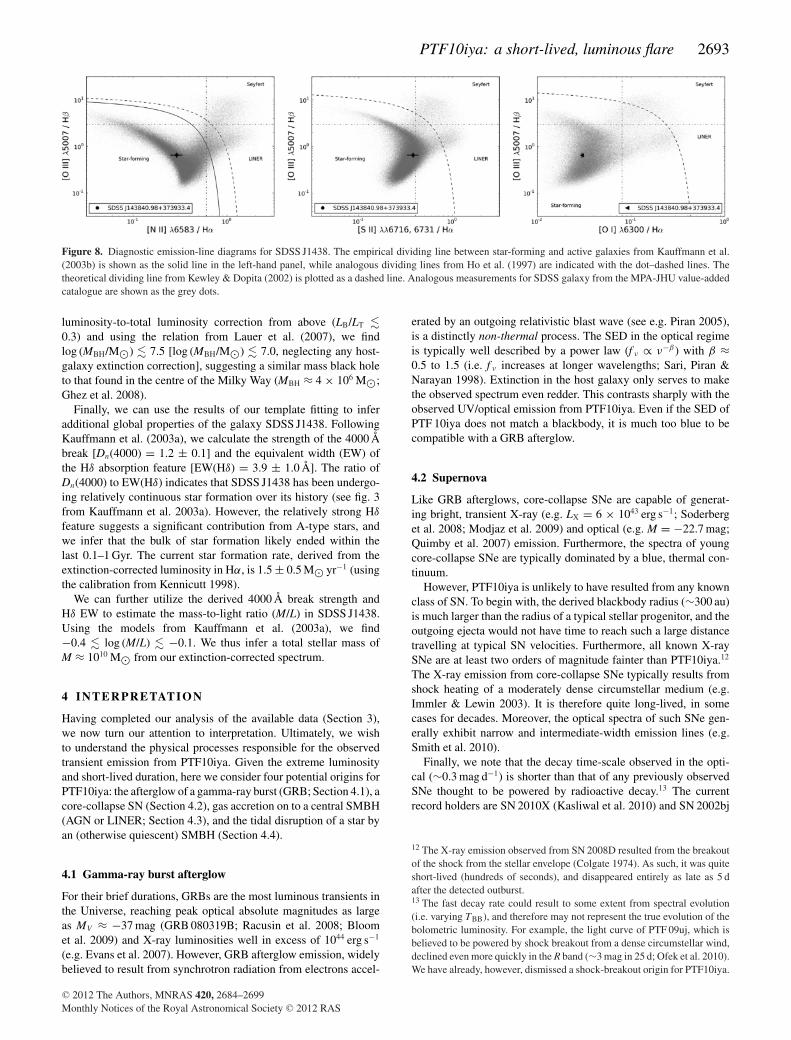
In Fig. 6, we plot the broad-band (optical, UV and X-ray)extinction-corrected SED of PTF10iya, this time in terms of νLν .The best-fitting UV/optical blackbody, with T = 2 × 10⁴ K, sig-nificantly underpredicts the X-ray flux. While it is possible to fitthe optical and X-ray data with a single blackbody with T ≈ 6 ×10⁵ K (dashed cyan line), the fit is incompatible with the range ofpossible X-ray spectral indices (blue shaded region), and severelyoverpredicts the UV flux. We conclude that the X-ray emission isproduced by a physical process distinct from that of the observedUV/optical emission.
In terms of νLν , PTF10iya emitted a comparable amount of en-ergy in the X-rays as in the UV/optical bandpass. Over the range0.3–10 keV, we find LX = 1 × 1044 erg s−1, about one to three timesthe UV/optical blackbody luminosity at this time (depending on theextinction correction). To estimate the total energy radiated, we mul-
Figure 6. Broad-band SED of PTF10iya. We have plotted the LRIS spec-trum from June 12, P60 photometry from June 13, and UVOT and XRTphotometry from June 11. A blackbody fit to incorporate both the opticaland X-ray data requires T ≈ 6 × 10⁵ K, but is inconsistent with the observedX-ray spectrum (the range of allowed power-law indices is indicated by theshaded blue region) and severely overpredicts the UV flux. On the otherhand, a blackbody fitting both the UV flux and the optical flux (T = 2 ×10⁴ K) cannot account for the bright X-ray emission.
tiply the mean blackbody luminosity by an approximate duration of10 d, and find Erad ≈ 3 × 1050 erg.
3.3 Host galaxy
The July 8 spectrum of SDSS J1438, after dereddening (see below),is plotted in Fig. 7. The spectrum is clearly a composite, containingboth absorption features from an underlying stellar population anda series of narrow nebular emission lines. In particular, we detectCa II H&K, as well as Hδ, Hε, Hζ , Hη, Hθ , Hι and Hκ , all resolvedin absorption. Likewise, typical galaxy emission features, including[O II] λ3727, Hβ, [O III] λ5007, [N II] λ6548, Hα, [N II] λ6584 and[S II] λλ6716, 6731, are all clearly detected from SDSS J1438. Using
C© 2012 The Authors, MNRAS 420, 2684–2699Monthly Notices of the Royal Astronomical Society C© 2012 RAS

2692 S. B. Cenko et al.
Figure 7. De-redshifted (z = 0.224 05) and extinction-corrected [E(B − V)gas = 0.40 mag] host-galaxy spectrum (black) and template fit (red). FollowingTremonti et al. (2004), we fit a linear combination of 39 stellar synthesis templates from Bruzual & Charlot (2003) in order to remove the stellar continuumfrom the spectrum of SDSS J1438. The resulting emission-line intensity ratios (Fig. 8) were then calculated using the subtracted spectrum.
the strongest unblended emission lines, we measure a redshift ofz = 0.224 05 ± 0.000 06. All of the emission lines are unresolvedby the red arm of our LRIS spectrum, with a full width at half-maximum intensity (FWHM) of ∼6.5 Å.
We can estimate the extinction along the line of sight to thesource using the observed intensity ratios of host-galaxy Balmeremission lines. Fitting a Gaussian profile to the lines, we findthat (LHα/LHβ )obs = 4.4 ± 0.4. Assuming Case B recombination(Osterbrock 1989) and the relation from Calzetti (2001), we findE(B − V)gas = 0.40 ± 0.08 mag.
The fundamental issue we wish to resolve is the origin of theseemission lines. The atoms could be ionized by the hard power-law spectrum generated by gas accretion on to a central SMBH(i.e. an AGN), UV photons from young, massive O and B stars(i.e. star formation), or as part of a phenomenon known as a low-ionization nuclear emission-line region (LINER; Heckman 1980),which are likely related to AGNs, possibly resulting from changesto the geometry of the disc at low accretion levels (e.g. Ho 2008).
Typically this is done via a diagnostic diagram (Baldwin, Phillips& Terlevich 1981; Veilleux & Osterbrock 1987) which comparesvarious emission-line intensity ratios. In order to extract the lineflux due to the central source, however, we must first remove anycontributions from the underlying stellar population (in particular,Balmer-series absorption; e.g. Ho, Filippenko & Sargent 1997).Following Tremonti et al. (2004) and Kauffmann et al. (2003b),we fit a version of the dereddened host spectrum with the emissionlines removed to a linear combination of a series of 39 templatespectra constructed from the stellar synthesis models of Bruzual& Charlot (2003). The resulting least-squares fit (restricting theweighting coefficients to be positive) is shown in red in Fig. 7,and does a reasonable job reproducing the observed host spectrumacross the entire bandpass.
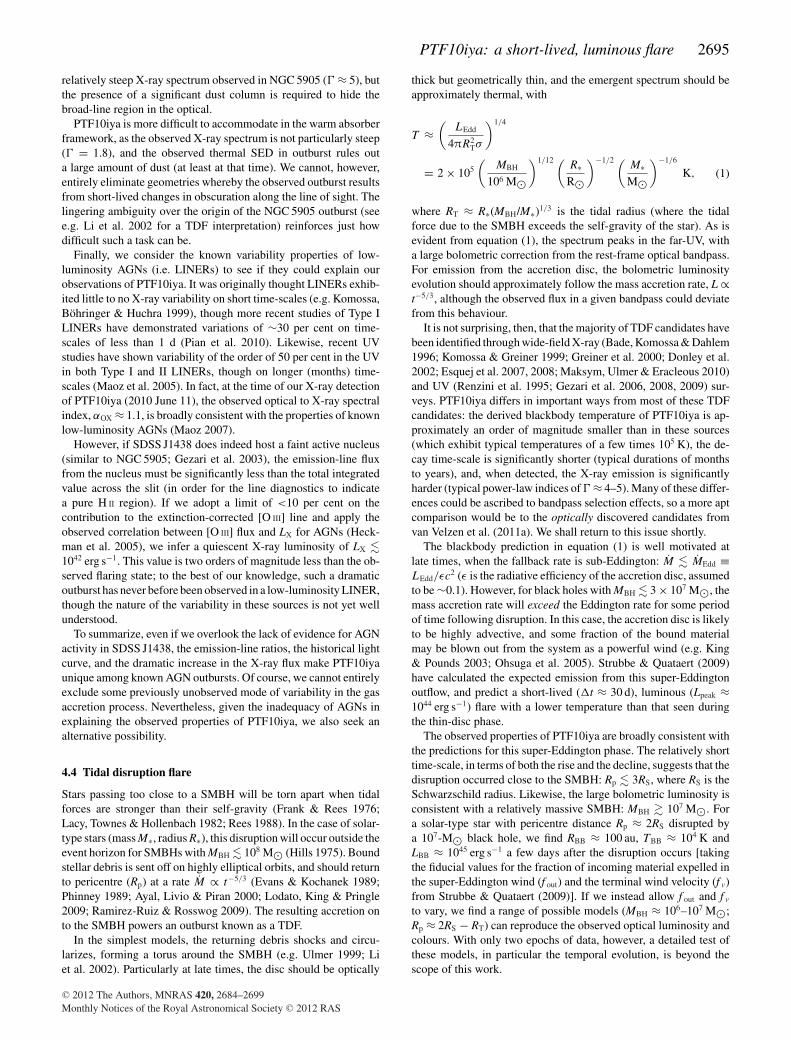
After subtracting the template to remove stellar contamination,we measure the following diagnostic ratios: L[O III] λ5009/LHβ =0.65±0.07, L[N II] λ6583/LHα = 0.29±0.04, L[S II] λλ6716,6731/LHα =0.38 ± 0.05 and L[O I] λ6300/LHα < 0.03. The resulting diagnosticdiagrams, including division lines between star-forming galaxies,AGNs and LINERs from Kauffmann et al. (2003b), Kewley &Dopita (2002) and Ho et al. (1997), are shown in Fig. 8. Also
plotted are analogous measurements for a large number of galaxyspectra from the MPA/JHU value-added SDSS catalogue.11
In all three plots, SDSS J1438 falls firmly within the locus ofstar-forming galaxies from SDSS. There may be a slight excessof [S II] λλ6716, 6731 relative to Hα, as the host lies directly onthe dividing line between star-forming galaxies and LINERs fromHo et al. (1997). However, even on this plot, SDSS J1438 appearsto be more consistent with the star-forming galaxies from SDSSthan the LINER branch, and does not reach the theoretical limitfrom Kewley & Dopita (2002). The simplest interpretation, then, isthat the narrow emission lines in SDSS J1438 result from photoion-ization by the UV photons copiously produced by young, massivestars.
The observed morphology of SDSS J1438 further reinforces thenotion that this galaxy either is or recently was actively formingnew stars. Using the GALFIT software (Peng et al. 2002), we fit the r′
LFC images of SDSS J1438 to a Sersic profile (Sersic & Pastoriza1967), allowing the concentration parameter (n) and the effectiveradius (re) to vary freely. We find that a good fit (both in terms ofχ2 per d.o.f. and by visual inspection) is achieved when n ≈ 0.65and re ≈ 1.7 arcsec. Analogous fits to the SDSS g′ and r′ imagesyield similar results.
The relatively small concentration number suggests that the emis-sion from SDSS J1438 is dominated by a disc-like profile; for bulge-dominated systems, the radial profile is typically well fitted by a deVaucouleurs function (n = 4). Adding a bulge profile (n = 4) sig-nificantly reduces the fit quality. By varying the fit parameters andexamining the residuals, we estimate that the ratio of the bulge lu-minosity to total luminosity (LB/LT) is �30 per cent, a typical valuefor spiral galaxies.
With this (approximate) deconvolution, we can constrain themass of the central SMBH using the observed bulge luminosityversus black hole mass relation (Magorrian et al. 1998). Integrat-ing our (dereddened) spectrum of SDSS J1438 over the rest-frameV band, we find MV = −20.75 ± 0.15 mag (MV = −19.82 ±0.17 mag neglecting any host extinction). Applying the bulge
11 See http://www.mpa-garching.mpg.de/SDSS.
C© 2012 The Authors, MNRAS 420, 2684–2699Monthly Notices of the Royal Astronomical Society C© 2012 RAS
PTF10iya: a short-lived, luminous flare 2693
Figure 8. Diagnostic emission-line diagrams for SDSS J1438. The empirical dividing line between star-forming and active galaxies from Kauffmann et al.(2003b) is shown as the solid line in the left-hand panel, while analogous dividing lines from Ho et al. (1997) are indicated with the dot–dashed lines. Thetheoretical dividing line from Kewley & Dopita (2002) is plotted as a dashed line. Analogous measurements for SDSS galaxy from the MPA-JHU value-addedcatalogue are shown as the grey dots.
luminosity-to-total luminosity correction from above (LB/LT �0.3) and using the relation from Lauer et al. (2007), we findlog (MBH/M�) � 7.5 [log (MBH/M�) � 7.0, neglecting any host-galaxy extinction correction], suggesting a similar mass black holeto that found in the centre of the Milky Way (MBH ≈ 4 × 10⁶ M�;Ghez et al. 2008).
Finally, we can use the results of our template fitting to inferadditional global properties of the galaxy SDSS J1438. FollowingKauffmann et al. (2003a), we calculate the strength of the 4000 Åbreak [Dn(4000) = 1.2 ± 0.1] and the equivalent width (EW) ofthe Hδ absorption feature [EW(Hδ) = 3.9 ± 1.0 Å]. The ratio ofDn(4000) to EW(Hδ) indicates that SDSS J1438 has been undergo-ing relatively continuous star formation over its history (see fig. 3from Kauffmann et al. 2003a). However, the relatively strong Hδ
feature suggests a significant contribution from A-type stars, andwe infer that the bulk of star formation likely ended within thelast 0.1–1 Gyr. The current star formation rate, derived from theextinction-corrected luminosity in Hα, is 1.5 ± 0.5 M� yr−1 (usingthe calibration from Kennicutt 1998).
We can further utilize the derived 4000 Å break strength andHδ EW to estimate the mass-to-light ratio (M/L) in SDSS J1438.Using the models from Kauffmann et al. (2003a), we find−0.4 � log (M/L) � −0.1. We thus infer a total stellar mass ofM ≈ 1010 M� from our extinction-corrected spectrum.
4 IN T E R P R E TATI O N
Having completed our analysis of the available data (Section 3),we now turn our attention to interpretation. Ultimately, we wishto understand the physical processes responsible for the observedtransient emission from PTF10iya. Given the extreme luminosityand short-lived duration, here we consider four potential origins forPTF10iya: the afterglow of a gamma-ray burst (GRB; Section 4.1), acore-collapse SN (Section 4.2), gas accretion on to a central SMBH(AGN or LINER; Section 4.3), and the tidal disruption of a star byan (otherwise quiescent) SMBH (Section 4.4).
4.1 Gamma-ray burst afterglow
For their brief durations, GRBs are the most luminous transients inthe Universe, reaching peak optical absolute magnitudes as largeas MV ≈ −37 mag (GRB 080319B; Racusin et al. 2008; Bloomet al. 2009) and X-ray luminosities well in excess of 1044 erg s−1
(e.g. Evans et al. 2007). However, GRB afterglow emission, widelybelieved to result from synchrotron radiation from electrons accel-
erated by an outgoing relativistic blast wave (see e.g. Piran 2005),is a distinctly non-thermal process. The SED in the optical regimeis typically well described by a power law (f ν ∝ ν−β ) with β ≈0.5 to 1.5 (i.e. f ν increases at longer wavelengths; Sari, Piran &Narayan 1998). Extinction in the host galaxy only serves to makethe observed spectrum even redder. This contrasts sharply with theobserved UV/optical emission from PTF10iya. Even if the SED ofPTF 10iya does not match a blackbody, it is much too blue to becompatible with a GRB afterglow.
4.2 Supernova
Like GRB afterglows, core-collapse SNe are capable of generat-ing bright, transient X-ray (e.g. LX = 6 × 1043 erg s−1; Soderberget al. 2008; Modjaz et al. 2009) and optical (e.g. M = −22.7 mag;Quimby et al. 2007) emission. Furthermore, the spectra of youngcore-collapse SNe are typically dominated by a blue, thermal con-tinuum.
However, PTF10iya is unlikely to have resulted from any knownclass of SN. To begin with, the derived blackbody radius (∼300 au)is much larger than the radius of a typical stellar progenitor, and theoutgoing ejecta would not have time to reach such a large distancetravelling at typical SN velocities. Furthermore, all known X-raySNe are at least two orders of magnitude fainter than PTF10iya.12
The X-ray emission from core-collapse SNe typically results fromshock heating of a moderately dense circumstellar medium (e.g.Immler & Lewin 2003). It is therefore quite long-lived, in somecases for decades. Moreover, the optical spectra of such SNe gen-erally exhibit narrow and intermediate-width emission lines (e.g.Smith et al. 2010).
Finally, we note that the decay time-scale observed in the opti-cal (∼0.3 mag d−1) is shorter than that of any previously observedSNe thought to be powered by radioactive decay.13 The currentrecord holders are SN 2010X (Kasliwal et al. 2010) and SN 2002bj
12 The X-ray emission observed from SN 2008D resulted from the breakoutof the shock from the stellar envelope (Colgate 1974). As such, it was quiteshort-lived (hundreds of seconds), and disappeared entirely as late as 5 dafter the detected outburst.13 The fast decay rate could result to some extent from spectral evolution(i.e. varying TBB), and therefore may not represent the true evolution of thebolometric luminosity. For example, the light curve of PTF 09uj, which isbelieved to be powered by shock breakout from a dense circumstellar wind,declined even more quickly in the R band (∼3 mag in 25 d; Ofek et al. 2010).We have already, however, dismissed a shock-breakout origin for PTF10iya.
C© 2012 The Authors, MNRAS 420, 2684–2699Monthly Notices of the Royal Astronomical Society C© 2012 RAS

2694 S. B. Cenko et al.
(Poznanski et al. 2010), both decayed after the peak at a rate of∼0.2 mag d−1. It would require an extremely small ejecta massand/or an outflow entirely transparent to the gamma-rays producedby the radioactive decay to produce a SN that decayed at such arapid rate, both of which are inconsistent with the large observedluminosity.
4.3 AGN/LINER
The nuclear location of PTF10iya, together with the observed spec-trum (reminiscent of the ‘big blue bump’; Sanders et al. 1989; Breg-man 1990), naturally leads us to consider accretion on to a SMBHas a possible origin (Shields 1978; Malkan & Sargent 1982). Herewe determine if gas accretion (either in the form of a normal AGNor a LINER) is consistent with the observed properties of PTF10iya.
To begin with, we must confront the fact that the nebular emissionlines in the spectrum of SDSS J1438 do not appear to be caused byAGN photoionization, even with a low-ionization parameter as ina LINER. In and of itself, however, this is not sufficient to entirelydiscount continuous accretion activity. Because of the non-zero sizeof our slit, our spectrum of the ‘nucleus’ of SDSS J1438 could becontaminated by nearby H II regions. For example, Hubble SpaceTelescope (HST) spectroscopy of NGC 5905, initially classified as astarburst galaxy in a similar analysis to that conducted in Section 3.3,revealed a faint Seyfert nucleus that had previously gone undetected(Gezari et al. 2003).
If we set aside for the moment the nebular emission-line classifi-cation, we still must simultaneously account for the short time-scaleand the order of magnitude increase in the UV/optical and X-rayflux. The most dramatically variable class of AGNs are the blazars,which are thought to arise when a relativistic jet fed by accretionis oriented directly along our line of sight (e.g. Blandford & Rees1978; Urry & Padovani 1995). For example, 3C 279 has variedacross the entire electromagnetic spectrum by factors of the orderof a few on time-scales shorter than days (e.g. Wehrle et al. 1998).
Blazars are typically hosted in massive (� 1010 M�) ellipti-cal galaxies, though individual counterexamples are known (seee.g. Gal-Yam et al. 2002, for a blazar initially thought to be anorphan GRB afterglow). More importantly, blazars are almost ex-clusively bright radio sources, even in quiescence. Using our post-outburst radio limits from the EVLA (Section 2.7), we calculatean upper limit on the quiescent radio luminosity (νLν) of <3 ×1038 erg s−1 at ν = 1.3 GHz. Even when comparing with samplesof blazars selected based on X-ray variability, the ratio of quiescentoptical flux to X-ray flux [αOX ≡ −log (f ν,O/f ν,X)/log (νO/νX) >
1.6], like the ratio of quiescent radio flux to optical flux [αRO ≡−log (f ν,R/f ν,O)/log (νR/νO) < 0.1], appears inconsistent with theproperties of the known blazar population (αOX = 0.6–1.4; αRO =0.2–0.5; Beckmann et al. 2003).
Even during outburst, the characteristic double-peaked blazarSED (e.g. Urry & Padovani 1995; Fossati et al. 1997) does notprovide a good match to the observed emission from PTF10iya.Well below the first peak (νLν) in the broad-band spectrum, blazarSEDs are dominated by non-thermal synchrotron radiation, risingas a power law like ν1. The SED only becomes shallower near thepeak frequency. The observed spectrum of PTF10iya, on the otherhand, is quite steep, with νLν ∝ ν2.7. Furthermore, the SED oflower luminosity blazars typically peaks at higher frequencies thanthat of higher luminosity sources (e.g. Fossati et al. 1998). Objectswith peak frequencies as low as the UV typically have peak νLν �1045 erg s−1, several orders of magnitude brighter than PTF 10iya.
In contrast, the faintest blazars compiled in the sample of Fossatiet al. (1998), with peak νLν ≈ 6 × 1044 erg s−1 (a factor of severalbrighter than PTF10iya), peak in the soft X-ray band.
Turning now to Seyfert galaxies, we consider two separate classesof known sources, and compare their variability properties to thoseof PTF10iya. ROSAT detected bright (LX � 1042 erg s−1) X-rayoutbursts from a number of narrow-line Seyfert 1 (NLS1) galaxiesas part of the All-Sky Survey (Voges et al. 1999). For instance,the nearby (z = 0.028) galaxy WPVS 007 was detected in outburstwith LX ≈ 1044 erg s−1 in 1990 November; 3 years later, the X-rayflux had declined by a factor of 400 (Grupe et al. 1995). WhileWPVS 007 is the most dramatic example, many other NLS1 galax-ies were observed by ROSAT to vary by more than an order ofmagnitude on time-scales as short as days (e.g. McHardy et al.2004). In some cases, the X-ray flare was followed by variability inthe optical spectra, including the appearance of high-ionization ironemission lines (e.g. IC 3599; Brandt, Pounds & Fink 1995; Grupeet al. 1995; Komossa & Bade 1999).
However, several properties of either PTF 10iya (the outburst) orSDSS J1438 (the quiescent host) are inconsistent with the NLS1interpretation. To begin with, the X-ray spectra of NLS1 galaxiesare typically significantly steeper (power-law index � ≈ 3–5 com-pared to �PTF10iya = 1.8) than the observed X-ray outburst fromPTF10iya (Grupe et al. 2004). The X-ray spectral slope is actu-ally quite crucial to the interpretation of the NLS1 phenomenon,where the observed variability is thought to arise from changes inthe covering fraction of a warm absorbing cloud (Grupe, Leighly& Komossa 2008). In addition, optical spectra of NLS1 galax-ies are characterized by (1) relatively narrow Balmer emissionlines [FWHM(Hβ) < 2000 km s−1]; (2) weak [O III] λ5007 emis-sion ([O III]/Hβ < 3); and (3) strong Fe II emission (Osterbrock &Pogge 1985; Goodrich 1989). For SDSS J1438, the [O III] λ5007emission is indeed quite weak. However, while the Hα and Hβ
emission lines are clearly narrow, there is in fact no sign of abroad component whatsoever – both Hβ and Hα are unresolvedin our July LRIS spectrum. Together with the lack of Fe II emission,PTF10iya appears to differ fundamentally from the known prop-erties of NLS1 galaxies, or of normal Seyfert 1 galaxies for thatmatter.
While a Seyfert 2 galaxy (those lacking any evidence for abroad-line region in the optical) may be easier to hide in the spec-trum of the quiescent host galaxy, dramatic continuum variabil-ity is not typically observed from these sources. One particularlyinteresting exception merits mention here: NGC 5905 (Bade, Ko-mossa & Dahlem 1996; Komossa & Bade 1999).
Bright X-ray emission (LX = 7 × 1043 erg s−1) was detected fromNGC 5905 in 1990 July by the ROSAT all-sky survey. Follow-up ob-servations over the subsequent months and years failed to re-detectthe source, implying that the quiescent flux is at least two ordersof magnitude fainter than the outburst. Like in the NLS1 galax-ies, the X-ray spectrum during outburst was quite soft (� ≈ 4–5).However, follow-up optical spectroscopy, both from the groundand with HST , failed to reveal any broad component to the Balmeremission lines (Komossa & Bade 1999; Gezari et al. 2003).
A variety of models have been proposed to explain the prop-erties of the NGC 5905 outburst (e.g. Komossa & Bade 1999; Li,Narayan & Menou 2002). In the AGN context, Komossa & Bade(1999) explored the possibility of a variable absorbing cloud alongthe line of sight. In this warm absorber model, the Seyfert nucleusbecomes visible by ionizing the ambient medium, making it trans-parent to soft X-rays (much like a NLS1). This naturally explains the
C© 2012 The Authors, MNRAS 420, 2684–2699Monthly Notices of the Royal Astronomical Society C© 2012 RAS
PTF10iya: a short-lived, luminous flare 2695
relatively steep X-ray spectrum observed in NGC 5905 (� ≈ 5), butthe presence of a significant dust column is required to hide thebroad-line region in the optical.
PTF10iya is more difficult to accommodate in the warm absorberframework, as the observed X-ray spectrum is not particularly steep(� = 1.8), and the observed thermal SED in outburst rules outa large amount of dust (at least at that time). We cannot, however,entirely eliminate geometries whereby the observed outburst resultsfrom short-lived changes in obscuration along the line of sight. Thelingering ambiguity over the origin of the NGC 5905 outburst (seee.g. Li et al. 2002 for a TDF interpretation) reinforces just howdifficult such a task can be.
Finally, we consider the known variability properties of low-luminosity AGNs (i.e. LINERs) to see if they could explain ourobservations of PTF10iya. It was originally thought LINERs exhib-ited little to no X-ray variability on short time-scales (e.g. Komossa,Bohringer & Huchra 1999), though more recent studies of Type ILINERs have demonstrated variations of ∼30 per cent on time-scales of less than 1 d (Pian et al. 2010). Likewise, recent UVstudies have shown variability of the order of 50 per cent in the UVin both Type I and II LINERs, though on longer (months) time-scales (Maoz et al. 2005). In fact, at the time of our X-ray detectionof PTF10iya (2010 June 11), the observed optical to X-ray spectralindex, αOX ≈ 1.1, is broadly consistent with the properties of knownlow-luminosity AGNs (Maoz 2007).
However, if SDSS J1438 does indeed host a faint active nucleus(similar to NGC 5905; Gezari et al. 2003), the emission-line fluxfrom the nucleus must be significantly less than the total integratedvalue across the slit (in order for the line diagnostics to indicatea pure H II region). If we adopt a limit of <10 per cent on thecontribution to the extinction-corrected [O III] line and apply theobserved correlation between [O III] flux and LX for AGNs (Heck-man et al. 2005), we infer a quiescent X-ray luminosity of LX �1042 erg s−1. This value is two orders of magnitude less than the ob-served flaring state; to the best of our knowledge, such a dramaticoutburst has never before been observed in a low-luminosity LINER,though the nature of the variability in these sources is not yet wellunderstood.
To summarize, even if we overlook the lack of evidence for AGNactivity in SDSS J1438, the emission-line ratios, the historical lightcurve, and the dramatic increase in the X-ray flux make PTF10iyaunique among known AGN outbursts. Of course, we cannot entirelyexclude some previously unobserved mode of variability in the gasaccretion process. Nevertheless, given the inadequacy of AGNs inexplaining the observed properties of PTF10iya, we also seek analternative possibility.
4.4 Tidal disruption flare
Stars passing too close to a SMBH will be torn apart when tidalforces are stronger than their self-gravity (Frank & Rees 1976;Lacy, Townes & Hollenbach 1982; Rees 1988). In the case of solar-type stars (mass M∗, radius R∗), this disruption will occur outside theevent horizon for SMBHs with MBH � 108 M� (Hills 1975). Boundstellar debris is sent off on highly elliptical orbits, and should returnto pericentre (Rp) at a rate M ∝ t−5/3 (Evans & Kochanek 1989;Phinney 1989; Ayal, Livio & Piran 2000; Lodato, King & Pringle2009; Ramirez-Ruiz & Rosswog 2009). The resulting accretion onto the SMBH powers an outburst known as a TDF.
In the simplest models, the returning debris shocks and circu-larizes, forming a torus around the SMBH (e.g. Ulmer 1999; Liet al. 2002). Particularly at late times, the disc should be optically
thick but geometrically thin, and the emergent spectrum should beapproximately thermal, with
T ≈(
LEdd
4πR2Tσ
)1/4
= 2 × 10⁵
(MBH
106 M�
)1/12 (R∗R�
)−1/2 (M∗M�
)−1/6
K, (1)
where RT ≈ R∗(MBH/M∗)1/3 is the tidal radius (where the tidalforce due to the SMBH exceeds the self-gravity of the star). As isevident from equation (1), the spectrum peaks in the far-UV, witha large bolometric correction from the rest-frame optical bandpass.For emission from the accretion disc, the bolometric luminosityevolution should approximately follow the mass accretion rate, L ∝t−5/3, although the observed flux in a given bandpass could deviatefrom this behaviour.
It is not surprising, then, that the majority of TDF candidates havebeen identified through wide-field X-ray (Bade, Komossa & Dahlem1996; Komossa & Greiner 1999; Greiner et al. 2000; Donley et al.2002; Esquej et al. 2007, 2008; Maksym, Ulmer & Eracleous 2010)and UV (Renzini et al. 1995; Gezari et al. 2006, 2008, 2009) sur-veys. PTF10iya differs in important ways from most of these TDFcandidates: the derived blackbody temperature of PTF10iya is ap-proximately an order of magnitude smaller than in these sources(which exhibit typical temperatures of a few times 105 K), the de-cay time-scale is significantly shorter (typical durations of monthsto years), and, when detected, the X-ray emission is significantlyharder (typical power-law indices of � ≈ 4–5). Many of these differ-ences could be ascribed to bandpass selection effects, so a more aptcomparison would be to the optically discovered candidates fromvan Velzen et al. (2011a). We shall return to this issue shortly.
The blackbody prediction in equation (1) is well motivated atlate times, when the fallback rate is sub-Eddington: M � MEdd ≡LEdd/εc
2 (ε is the radiative efficiency of the accretion disc, assumedto be ∼0.1). However, for black holes with MBH � 3 × 10⁷ M�, themass accretion rate will exceed the Eddington rate for some periodof time following disruption. In this case, the accretion disc is likelyto be highly advective, and some fraction of the bound materialmay be blown out from the system as a powerful wind (e.g. King& Pounds 2003; Ohsuga et al. 2005). Strubbe & Quataert (2009)have calculated the expected emission from this super-Eddingtonoutflow, and predict a short-lived (�t ≈ 30 d), luminous (Lpeak ≈1044 erg s−1) flare with a lower temperature than that seen duringthe thin-disc phase.
The observed properties of PTF10iya are broadly consistent withthe predictions for this super-Eddington phase. The relatively shorttime-scale, in terms of both the rise and the decline, suggests that thedisruption occurred close to the SMBH: Rp � 3RS, where RS is theSchwarzschild radius. Likewise, the large bolometric luminosity isconsistent with a relatively massive SMBH: MBH � 107 M�. Fora solar-type star with pericentre distance Rp ≈ 2RS disrupted bya 107-M� black hole, we find RBB ≈ 100 au, TBB ≈ 104 K andLBB ≈ 1045 erg s−1 a few days after the disruption occurs [takingthe fiducial values for the fraction of incoming material expelled inthe super-Eddington wind (f out) and the terminal wind velocity (f v)from Strubbe & Quataert (2009)]. If we instead allow f out and f v
to vary, we find a range of possible models (MBH ≈ 106–107 M�;Rp ≈ 2RS − RT) can reproduce the observed optical luminosity andcolours. With only two epochs of data, however, a detailed test ofthese models, in particular the temporal evolution, is beyond thescope of this work.
C© 2012 The Authors, MNRAS 420, 2684–2699Monthly Notices of the Royal Astronomical Society C© 2012 RAS
2696 S. B. Cenko et al.
After the accretion rate drops below Eddington, in the tidal dis-ruption model the emission should be dominated by shock-heatedmaterial in the accretion disc. Given the predicted temperature forthe disc in this phase (equation 1), it is important to check if wewould be sensitive to any disc emission in our X-ray and UV ob-servations from 2010 August. Using models for the sub-Eddingtondisc emission from Strubbe & Quataert (2009) with the systemparameters determined above, we estimate νLν(λrest = 2000 Å) �2 × 1042 erg s−1. This corresponds to a UVOT UVW1 magnitudeof �22.5. Even neglecting the derived host-galaxy extinction, thisvalue is several magnitudes fainter than our limits at this time. Like-wise, the derived X-ray emission from this accretion disc componentis well below the upper limits from the XRT at this time.
On the other hand, comparing our late-time (�t ≈ 2 months)limits with the observed UV properties of candidate TDFs fromGALEX presents a slightly more complex picture. With typicalnear-UV absolute magnitudes (AB) of ≈−18 to −19 mag at thistime (Gezari et al. 2009), a comparable source would appear withUVW1 ≈ 19.5–20.5 mag at the distance of PTF10iya. One possi-bility to explain this apparent discrepancy with our derived limits(UVW1 > 20.5 mag) is extinction: our derived value of E(B −V)gas = 0.40 mag corresponds to AUVW1 ≈ 1.5 mag. With this cor-rection, our 2010 August UVOT limits are not sufficiently deep torule out UV flares similar to those reported by Gezari et al. (2009).However, our derived extinction correction is quite uncertain. Weare therefore left to conclude that our 2010 August Swift observa-tions are not sufficiently constraining to either detect or rule out theexpected disc signature during the sub-Eddington phase.
A 107-M� SMBH is consistent with the limits for SDSS J1438derived from the black hole versus bulge luminosity relation(Section 3.3). Furthermore, Strubbe & Quataert (2011) predict thatany absorption features in the optical bandpass due to the pho-toionization of the unbound material should be weaker for moremassive black holes, and indeed we do not detect such features inthe early-time spectra of PTF10iya. We reiterate, however, that theestimated black hole mass is still sufficiently small to ensure thatthe disruption would occur outside the event horizon.
In addition to the outburst properties, the host galaxy of PTF10iyais consistent with a TDF interpretation. No variability is seen in theoptical light curve in our PTF and Deep Sky imaging of the fieldin the last few years. The observed emission-line ratios in quies-cence indicate a moderately star forming galaxy and are incompat-ible with photoionization by the hard X-ray continuum common inAGNs. In fact, the host galaxy of PTF10iya, SDSS J1438, bears astrong resemblance to the host galaxy of D23H-1, a candidate TDFdiscovered by GALEX (Gezari et al. 2009). The diagnostic emission-line ratios are all consistent within 2σ uncertainties, as is the derivedline-of-sight extinction.
Several important distinctions between PTF10iya and previousTDF candidates remain, however. First, PTF10iya appears to decaymuch more rapidly than any previously claimed TDF candidate,even the handful discovered in the optical. Given that the constraintson the outburst dates are much weaker for nearly all previous can-didates,14 this may be simply because PTF10iya was caught shortlyafter the disruption; the higher cadence of PTF enables detection ofshort-lived outbursts that might have been missed by other surveys.Nevertheless, the contrast between the two TDF candidates from
14 Two exceptions include D1-9, where a rising light curve was observed inthe optical (Gezari et al. 2008), and NGC 5905, where a rising X-ray lightcurve was observed (Li et al. 2002).
van Velzen et al. (2011a), which decayed by ∼0.5–1.0 mag in 50 dsince discovery, and PTF10iya, which decayed by ∼1.5 mag in only6 d, is quite striking.
Most importantly, the X-ray emission from PTF10iya, whichaccounts for a significant fraction of the bolometric luminosity,remains a significant challenge for TDF models. Unlike previousTDF candidates discovered in the X-rays, the shallow, non-thermalX-ray spectrum is inconsistent with a simple extrapolation of a105-K blackbody to high energies.
Recently, two unusual high-energy transients discovered by theSwift satellite (Swift J1644+57 and Swift J2058+05) were sug-gested to result from the tidal disruption process (Bloom et al.2011a; Burrows et al. 2011; Cenko et al. 2011; Levan et al. 2011;Zauderer et al. 2011). While both sources display extremely lumi-nous (LX > 1047 erg s−1) X-ray emission, this was also accompaniedby a luminous radio source, with compelling evidence that the out-burst marked the birth of a collimated, relativistic outflow (i.e. ajet). One possibility is that the observed emission from PTF10iyais generated by the same process (i.e. tidal disruption), but we areviewing the system from outside the narrow angle of the jet (an‘off-axis’ TDF).
Giannios & Metzger (2011) considered off-axis emission fromthe interaction of a mildly relativistic jet with surrounding material,and predict bright (Lν � 1030 erg s−1 Hz−1 at 10 GHz), self-absorbedradio emission peaking around a year after disruption.15 Our radionon-detections (Section 2.7) are an order of magnitude below thepredictions of these models, suggesting in this case either that norelativistic jet was generated during the disruption process or thatthe surrounding environment differed significantly from the nom-inal parameters assumed by Giannios & Metzger (2011). We notethat these limits are significantly more constraining for these radiojet models than previous observations, which were either obtainedshortly after disruption (van Velzen et al. 2011a) or solely at lowfrequency, where self-absorption comes into play (Bower 2011).
If we do not consider relativistic jetted models, we may still beable to explain the observed X-ray flare by analogy with AGNs.Theoretically, for MBH > 107 M�, the density at pericentre isnever quite high enough for the gas and radiation to reach thermalequilibrium, and so instead, photons likely Compton upscatter offfast-moving electrons to produce hard X-rays (Strubbe & Quataert2011). While such a phenomenon, similar to what is observed inthe hard X-ray bandpass in AGNs, may account for the X-ray emis-sion from PTF10iya, the process is relatively poorly understood andbeyond the scope of this work.
5 C O N C L U S I O N S
To summarize, we reiterate the primary observed properties ofPTF10iya:
(i) It was a short-lived (τ ≈ 10 d), luminous (Mg′ ≈ −21 mag)UV/optical flare.
(ii) After subtracting the host-galaxy contribution, the transientemission is relatively blue, and reasonably well fitted by a blackbodywith T ≈ (1–2) × 104 K, R ≈ 200 au and L ≈ 1044–1045 erg s−1.
(iii) A simultaneous X-ray flare of comparable energy output(LX ≈ 1044 erg s−1) at �t ≈ 5 d after the outburst was detected.
15 van Velzen, Kording & Falcke (2011b) also consider radio jets from TDFs,but powered instead internally by the accretion process. The predicted radioluminosity and spectra are mostly similar to those of Giannios & Metzger(2011).
C© 2012 The Authors, MNRAS 420, 2684–2699Monthly Notices of the Royal Astronomical Society C© 2012 RAS
PTF10iya: a short-lived, luminous flare 2697
(iv) It was astrometrically consistent with the nucleus of a z =0.224 05 star-forming galaxy with a predominantly disc-like mor-phology (SDSS J1438).
(v) There is no evidence, either from the historical light curve orhost spectrum, for previous episodes of accretion on to the centralSMBH, that is, SDSS J1438 does not appear to be an AGN.
After ruling out other known classes of extragalactic variablesources (GRBs and SNe), we have demonstrated that the basicproperties of the UV/optical outburst (luminosity, temperature, du-ration) are broadly consistent with the recent predictions of Strubbe& Quataert (2009) for the early stages following the tidal disruptionof a solar-type star by an ∼107 M� SMBH. This picture is furthersupported by the lack of variability in the historical optical lightcurve, and the emission-line diagnostic diagrams which suggest anordinary star-forming galaxy (i.e. not a Seyfert or LINER).
At the same time, PTF10iya differs in important ways from pre-viously identified TDF candidates. While some of this can be under-stood largely as bandpass biases (e.g. lower blackbody temperaturethan for UV- and X-ray-selected candidates), the short duration andassociated bright X-ray flare suggest a significant diversity if indeedall of these sources do result from the tidal disruption of a star bya SMBH. Without an unambiguous signature, such as the predictedbroad (0.01–0.1c), blueshifted absorption features in the rest-frameUV bandpass (Strubbe & Quataert 2011), we cannot definitely ruleout an unusual AGN outburst scenario.
While much of the interpretation herein has been centred on theTDF framework, it is nonetheless interesting to speculate on whatmight cause such a short time-scale outburst in an otherwise quies-cent AGN. The black hole binary systems known as soft X-ray tran-sients (SXTs) at first glance appear to be potential stellar mass ana-logues. These systems, such as A0620-00 (Elvis et al. 1975; Gelino,Harrison & Orosz 2001), spend decades in a quiescent state accret-ing from their companions at extremely low rates (MEdd < 0.01).After intervals of several decades, however, a thermal viscous in-stability in the accretion disc triggers a dramatic outburst typicallylasting several weeks (e.g. Cannizzo 1993). Since the recurrencetime should scale proportionally to black hole mass, a quiescent107-M� black hole would be expected to undergo such an out-burst every ∼106 yr, much too long to detect on human time-scales.Interpreting AGN outbursts in this manner yields a self-consistentquasar luminosity function (Siemiginowska & Elvis 1997), and canaccount for the resemblance between the power spectrum of AGNsand stellar mass black hole binaries in the soft/high state (McHardyet al. 2004, 2006).
There are significant problems with this picture, however. First,the thermal viscous instability may not be capable of producinglarge-amplitude outbursts in SMBH systems, as the gas in thesesystems is well coupled to the magnetic field even in quiescencedue to the larger size of the accretion disc (Menou & Quataert 2001).Even more troubling, the outburst duration should also scale as theblack hole mass, so SXT-like outbursts in SMBH systems wouldhave durations of ∼104–105 yr. Conversely, a 10-d outburst in a107-M� system corresponds to an ∼1 s outburst in a 10-M�black hole binary. While some stellar mass Galactic systemsdo exhibit dramatic X-ray flares on such short time-scales (e.g.GRS 1915+105; Greiner, Morgan & Remillard 1996; Morgan,Remillard & Greiner 1997; Muno, Morgan & Remillard 1999),these systems do not return to quiescence immediately (if at all). Tothe best of our knowledge, there are no known stellar mass blackhole binaries that transition from quiescence to Eddington lumi-nosities on such a short time-scale. If PTF10iya is truly an AGN
outburst, it would suggest some new accretion physics that does notappear to manifest itself in stellar mass systems.
Regardless of its ultimate origin, it is clear that events likePTF10iya have not been previously reported. However, because ofits short time-scale, this does not necessarily mean such outburstsare rare. Given the large luminosity (comparable to the brightestSNe), current and future optical surveys should be capable of de-tecting additional similar events out to relatively large distances,provided they observe with sufficiently high cadence. Rapid broad-band follow-up observations will be key to uncovering more ex-amples of this class (see e.g. Gal-Yam et al. 2011, for a detaileddiscussion of the PTF follow-up time-line).
AC K N OW L E D G M E N T S
We wish to thank S. A. Wright, K. Bundy and the anonymous refereefor valuable comments and discussions regarding this manuscript.Follow-up data were obtained by the Palomar Transient FactoryTDF Key Project.
SBC and AVF wish to acknowledge generous support fromGary and Cynthia Bengier, the Richard and Rhoda GoldmanFund, NASA/Swift grant NNX10AI21G, NASA/Fermi grantNNX1OA057G, and NSF grant AST-0908886. NRB is supportedthrough the Einstein Fellowship Program (NASA CooperativeAgreement NNG06DO90A). JSB and his group were partially sup-ported by NASA/Swift Guest Investigator grants NNX09AQ66Gand NNX10AF93G, and a SciDAC grant from the US Departmentof Energy. The Weizmann Institute PTF partnership is supportedin part by grants from the Israeli Science Foundation to AG. Jointwork by the Weizmann and Caltech groups is supported by a grantfrom the Binational Science Foundation to AG and SRK, and AG ac-knowledges further support from a EU/FP7 Marie Curie IRG fellow-ship. LB is supported by the NSF under grants PHY-0551164 andAST-0707633. P60 operations are funded in part by NASA throughthe Swift Guest Investigator Program (grant NNG06GH61G).
We acknowledge the use of public data from the Swift dataarchive. Some of the data presented herein were obtained at theW. M. Keck Observatory, which is operated as a scientific partner-ship among the California Institute of Technology, the Universityof California, and NASA. The Observatory was made possible bythe generous financial support of the W. M. Keck Foundation. Theauthors wish to recognize and acknowledge the very significant cul-tural role and reverence that the summit of Mauna Kea has alwayshad within the indigenous Hawaiian community; we are most for-tunate to have the opportunity to conduct observations from thismountain.
R E F E R E N C E S
Abazajian K. N. et al., 2009, ApJS, 182, 543Abdo A. A. et al., 2010, ApJS, 188, 405Ayal S., Livio M., Piran T., 2000, ApJ, 545, 772Bade N., Komossa S., Dahlem M., 1996, A&A, 309, L35Baldwin J. A., Phillips M. M., Terlevich R., 1981, PASP, 93, 5Becker R. H., White R. L., Helfand D. J., 1995, ApJ, 450, 559Beckmann V., Engels D., Bade N., Wucknitz O., 2003, A&A, 401, 927Blandford R. D., Rees M. J., 1978, in Wolfe A. M., ed., BL Lac Objects.
University of Pittsburgh Press, Pittsburgh, PA, p. 328Bloom J. S. et al., 2009, ApJ, 691, 723Bloom J. S. et al., 2011a, Sci, 333, 203Bloom J. S. et al., 2011b, PASP, preprint (arXiv:1106.5491)Bower G. C., 2011, ApJ, 732, L12Brandt W. N., Pounds K. A., Fink H., 1995, MNRAS, 273, L47
C© 2012 The Authors, MNRAS 420, 2684–2699Monthly Notices of the Royal Astronomical Society C© 2012 RAS

2698 S. B. Cenko et al.
Bregman J. N., 1990, A&AR, 2, 125Brown P. J. et al., 2009, AJ, 137, 4517Bruzual G., Charlot S., 2003, MNRAS, 344, 1000Burrows D. N. et al., 2005, Space Sci. Rev., 120, 165Burrows D. N. et al., 2011, Nat, 476, 421Butler N. R., 2007, AJ, 133, 1027Calzetti D., 2001, PASP, 113, 1449Cannizzo J. K., 1993, ApJ, 419, 318Cenko S. B. et al., 2006, PASP, 118, 1396Cenko S. B. et al., 2011, ApJ, preprint (arXiv:1107.5307)Colgate S. A., 1974, ApJ, 187, 333Djorgovski S. G. et al., 2008, Astron. Nachr., 329, 263Donley J. L., Brandt W. N., Eracleous M., Boller T., 2002, AJ, 124,
1308Drake A. J. et al., 2009, ApJ, 696, 870Ellis R. S. et al., 2008, ApJ, 674, 51Elvis M., Page C. G., Pounds K. A., Ricketts M. J., Turner M. J. L., 1975,
Nat, 257, 656Esquej P., Saxton R. D., Freyberg M. J., Read A. M., Altieri B., Sanchez-
Portal M., Hasinger G., 2007, A&A, 462, L49Esquej P. et al., 2008, A&A, 489, 543Evans C. R., Kochanek C. S., 1989, ApJ, 346, L13Evans P. A. et al., 2007, A&A, 469, 379Ferrarese L., Merritt D., 2000, ApJ, 539, L9Filippenko A. V., 1982, PASP, 94, 715Filippenko A. V., 1997, ARA&A, 35, 309Fossati G., Celotti A., Ghisellini G., Maraschi L., 1997, MNRAS, 289, 136Fossati G., Maraschi L., Celotti A., Comastri A., Ghisellini G., 1998,
MNRAS, 299, 433Frank J., Rees M. J., 1976, MNRAS, 176, 633Gal-Yam A., Ofek E. O., Filippenko A. V., Chornock R., Li W., 2002, PASP,
114, 587Gal-Yam A. et al., 2011, ApJ, 736, 159Gebhardt K. et al., 2000, ApJ, 539, L13Gehrels N. et al., 2004, ApJ, 611, 1005Gelino D. M., Harrison T. E., Orosz J. A., 2001, AJ, 122, 2668Gezari S., Halpern J. P., Komossa S., Grupe D., Leighly K. M., 2003, ApJ,
592, 42Gezari S. et al., 2006, ApJ, 653, L25Gezari S. et al., 2008, ApJ, 676, 944Gezari S. et al., 2009, ApJ, 698, 1367Ghez A. M. et al., 2008, ApJ, 689, 1044Giannios D., Metzger B. D., 2011, MNRAS, 416, 2102Goodrich R. W., 1989, ApJ, 342, 224Greiner J., Morgan E. H., Remillard R. A., 1996, ApJ, 473, L107Greiner J., Schwarz R., Zharikov S., Orio M., 2000, A&A, 362, L25Grupe D., Beuermann K., Mannheim K., Bade N., Thomas H., de Martino
D., Schwope A., 1995, A&A, 299, L5Grupe D., Wills B. J., Leighly K. M., Meusinger H., 2004, AJ, 127, 156Grupe D., Leighly K. M., Komossa S., 2008, AJ, 136, 2343Halpern J. P., Filippenko A. V., 1988, Nat, 331, 46Heckman T. M., 1980, A&A, 87, 152Heckman T. M., Ptak A., Hornschemeier A., Kauffmann G., 2005, ApJ, 634,
161Hills J. G., 1975, Nat, 254, 295Ho L. C., 2008, ARA&A, 46, 475Ho L. C., Filippenko A. V., Sargent W. L. W., 1997, ApJS, 112, 315Horne K., 1986, PASP, 98, 609Immler S., Lewin W. H. G., 2003, in Weiler K., ed., Supernovae and Gamma-
Ray Bursters. Springer-Verlag, Berlin, p. 91Jordi K., Grebel E. K., Ammon K., 2006, A&A, 460, 339Kaiser N. et al., 2002, in Tyson J. A., Wolff S., eds, SPIE Conf. Ser.
Vol. 4836, Survey and Other Telescope Technologies and Discoveries.SPIE, Bellingham, p. 154
Kasliwal M. M. et al., 2010, ApJ, 723, L98Kauffmann G. et al., 2003a, MNRAS, 341, 33Kauffmann G. et al., 2003b, MNRAS, 346, 1055Kennicutt R. C., 1998, ARA&A, 36, 189
Kewley L. J., Dopita M. A., 2002, ApJS, 142, 35King A. R., Pounds K. A., 2003, MNRAS, 345, 657Komossa S., Bade N., 1999, A&A, 343, 775Komossa S., Greiner J., 1999, A&A, 349, L45Komossa S., Bohringer H., Huchra J. P., 1999, A&A, 349, 88Kormendy J., Richstone D., 1995, ARA&A, 33, 581Kulkarni S. R., Rau A., 2006, ApJ, 644, L63Lacy J. H., Townes C. H., Hollenbach D. J., 1982, ApJ, 262, 120Lauer T. R. et al., 2007, ApJ, 662, 808Law N. M. et al., 2009, PASP, 121, 1395Levan A. J. et al., 2011, Sci, 333, 199Li L., Narayan R., Menou K., 2002, ApJ, 576, 753Li W., Jha S., Filippenko A. V., Bloom J. S., Pooley D., Foley R. J., Perley
D. A., 2006, PASP, 118, 37Lodato G., King A. R., Pringle J. E., 2009, MNRAS, 392, 332McHardy I. M., Papadakis I. E., Uttley P., Page M. J., Mason K. O., 2004,
MNRAS, 348, 783McHardy I. M., Koerding E., Knigge C., Uttley P., Fender R. P., 2006, Nat,
444, 730Magorrian J. et al., 1998, AJ, 115, 2285Maksym W. P., Ulmer M. P., Eracleous M., 2010, ApJ, 722, 1035Malkan M. A., Sargent W. L. W., 1982, ApJ, 254, 22Maoz D., 2007, MNRAS, 377, 1696Maoz D., Nagar N. M., Falcke H., Wilson A. S., 2005, ApJ, 625, 699Matheson T., Filippenko A. V., Ho L. C., Barth A. J., Leonard D. C., 2000,
AJ, 120, 1499Menou K., Quataert E., 2001, ApJ, 552, 204Modjaz M. et al., 2009, ApJ, 702, 226Morgan E. H., Remillard R. A., Greiner J., 1997, ApJ, 482, 993Muno M. P., Morgan E. H., Remillard R. A., 1999, ApJ, 527, 321Ofek E. O. et al., 2010, ApJ, 724, 1396Ohsuga K., Mori M., Nakamoto T., Mineshige S., 2005, ApJ, 628, 368Oke J. B., Gunn J. E., 1983, ApJ, 266, 713Oke J. B. et al., 1995, PASP, 107, 375Osterbrock D. E., 1989, Astrophysics of Gaseous Nebulae and Active Galac-
tic Nuclei. University Science Books, Mill Valley, CAOsterbrock D. E., Pogge R. W., 1985, ApJ, 297, 166Peng C. Y., Ho L. C., Impey C. D., Rix H.-W., 2002, AJ, 124, 266Phinney E. S., 1989, in Morris M., ed., Proc. IAU Symp. 136, The Center
of the Galaxy. Kluwer, Dordrecht, p. 543Pian E., Romano P., Maoz D., Cucchiara A., Pagani C., Parola V. L., 2010,
MNRAS, 401, 677Piran T., 2005, Rev. Mod. Phys., 76, 1143Poole T. S. et al., 2008, MNRAS, 383, 627Poznanski D. et al., 2010, Sci, 327, 58Quimby R. M., Aldering G., Wheeler J. C., Hoflich P., Akerlof C. W., Rykoff
E. S., 2007, ApJ, 668, L99Racusin J. L. et al., 2008, Nat, 455, 183Rahmer G., Smith R., Velur V., Hale D., Law N., Bui K., Petrie H., Dekany
R., 2008, in McLean I. S., Casali M. M., eds, SPIE Conf. Ser. Vol. 7014,Ground-based and Airborne Instrumentation for Astronomy II. SPIE,Bellingham, p. 70144Y
Ramirez-Ruiz E., Rosswog S., 2009, ApJ, 697, L77Rau A. et al., 2009, PASP, 121, 1334Rees M. J., 1988, Nat, 333, 523Renzini A., Greggio L., di Serego Alighieri S., Cappellari M., Burstein D.,
Bertola F., 1995, Nat, 378, 39Roming P. W. A. et al., 2005, Space Sci. Rev., 120, 95Sanders D. B., Phinney E. S., Neugebauer G., Soifer B. T., Matthews K.,
1989, ApJ, 347, 29Sari R., Piran T., Narayan R., 1998, ApJ, 497, L17Schlegel D. J., Finkbeiner D. P., Davis M., 1998, ApJ, 500, 525Schmidt B. P., Keller S. C., Francis P. J., Bessell M. S., 2005, BAAS, 37,
457Sersic J. L., Pastoriza M., 1967, PASP, 79, 152Shields G. A., 1978, Nat, 272, 706Siemiginowska A., Elvis M., 1997, ApJ, 482, L9Simcoe R. A., Metzger M. R., Small T. A., Araya G., 2000, BAAS, 32, 758
C© 2012 The Authors, MNRAS 420, 2684–2699Monthly Notices of the Royal Astronomical Society C© 2012 RAS
PTF10iya: a short-lived, luminous flare 2699
Skrutskie M. F. et al., 2006, AJ, 131, 1163Smith N., Chornock R., Silverman J. M., Filippenko A. V., Foley R. J., 2010,
ApJ, 709, 856Soderberg A. M. et al., 2008, Nat, 453, 469Spergel D. N. et al., 2007, ApJS, 170, 377Strubbe L. E., Quataert E., 2009, MNRAS, 400, 2070Strubbe L. E., Quataert E., 2011, MNRAS, 415, 168Tremonti C. A. et al., 2004, ApJ, 613, 898Ulmer A., 1999, ApJ, 514, 180Urry C. M., Padovani P., 1995, PASP, 107, 803van Velzen S., Farrar G. R., Gezari S., Morrell N., Zaritsky D., Ostman L.,
Smith M., Gelfand J., 2011a, ApJ, 741, 73
van Velzen S., Kording E., Falcke H., 2011b, MNRAS, L310Veilleux S., Osterbrock D. E., 1987, ApJS, 63, 295Voges W. et al., 1999, A&A, 349, 389Wade R. A., Horne K., 1988, ApJ, 324, 411Wehrle A. E. et al., 1998, ApJ, 497, 178Wizinowich P. L. et al., 2006, PASP, 118, 297Zauderer B. A. et al., 2011, Nat, 476, 425
This paper has been typeset from a TEX/LATEX file prepared by the author.
C© 2012 The Authors, MNRAS 420, 2684–2699Monthly Notices of the Royal Astronomical Society C© 2012 RAS