Embed Size (px)
Citation preview
0
VERIFICATION REPORT RELATED TO BREACHES OF APP’S NATURAL FOREST CLEARANCE MORATORIUM IN PT. BUMI ANDALAS PERMAI,
PT. SEBANGUN BUMI ANDALAS, AND PT. BUMI MEKAR HIJAU SOUTH SUMATRA
FCP Implementation Team
11 SEPTEMBER 2013
1
1. BACKGROUND
On February 1st 2013, APP made the commitment to immediately stop natural forest
conversion within all of its supply chain. APP is using High Carbon Stock (HCS) to
identify areas of natural forest, and High Conservation Value (HCV) assessments to
identify other areas for protection. The result of the HCS & HCV assessments will
guide the forest managers of APP pulpwood suppliers of which areas they can develop
into plantations and those areas they need to maintain as natural forest and HCVs.
The FCP Implementation Team - comprised of TFT and APP staff - regularly monitors
the implementation of the moratorium on all of APP’s pulpwood suppliers’ areas. A
recent audit of all concessions brought the following cases to the attention of the FCP
Joint Steering Committee (JSC) and identified moratorium breaches totaling an area of
69.45 ha of HCS forest within three of APP’s suppliers’ concessions in South Sumatra:
PT. Bumi Mekar Hijau (BMH) – 63.47 ha
PT. Sebangun Bumi Andalas (SBA) – 3.49ha
PT. Bumi Andalas Permai (BAP) – 2.49ha
2. PRE-ASSESSMENTS TO IDENTIFY HCS/HCV/PEATLAND AREAS WITHIN BAP, SBA AND BMH RKT 2013 COMPARTMENTS
The FCP Joint Steering Committee decided to prioritise pre-assessments to identify
HCS/HCV/peatland areas in specific zones that were due to be developed in 2013 (i.e.
the RKT 2013 operational compartments) within BAP, SBA and BMH.
APP requested that these pre-assessments were carried out in South Sumatra to
identify ‘low risk’ areas for ongoing plantation development in order to meet its fibre
forecasts. This process would allow limited land preparation activities to proceed on low
risk areas: that is, areas identified as without conservation values including forests (non-

2
HCS), peatland and other important areas (i.e. non-HCV). The pre-assessments would
allow plantation development to proceed while still allowing APP to fulfil its FCP
commitments. This pre-assessment stage is only being applied to RKT areas within
these three companies in South Sumatra. Full HCS and HCV (including peatland)
assessments are currently being conducted in the rest of the areas within these same
concessions. Pre-assessments are only being undertaken in South Sumatra and not
elsewhere by any other APP’s suppliers.
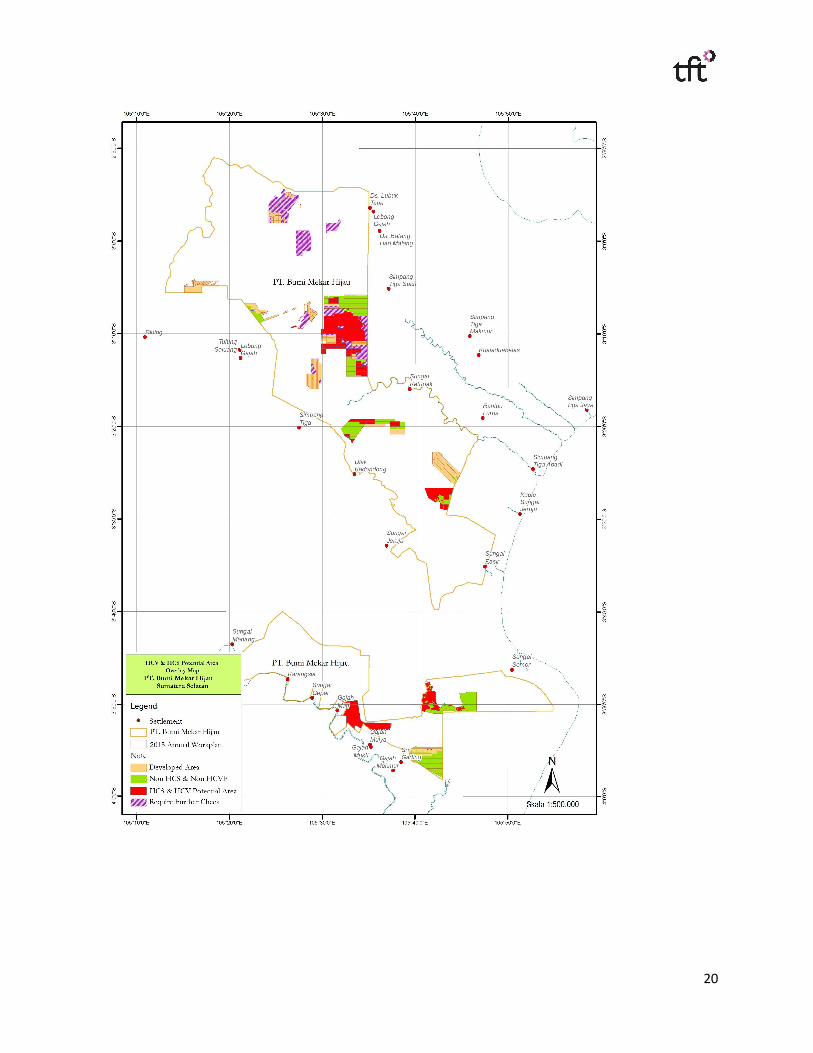
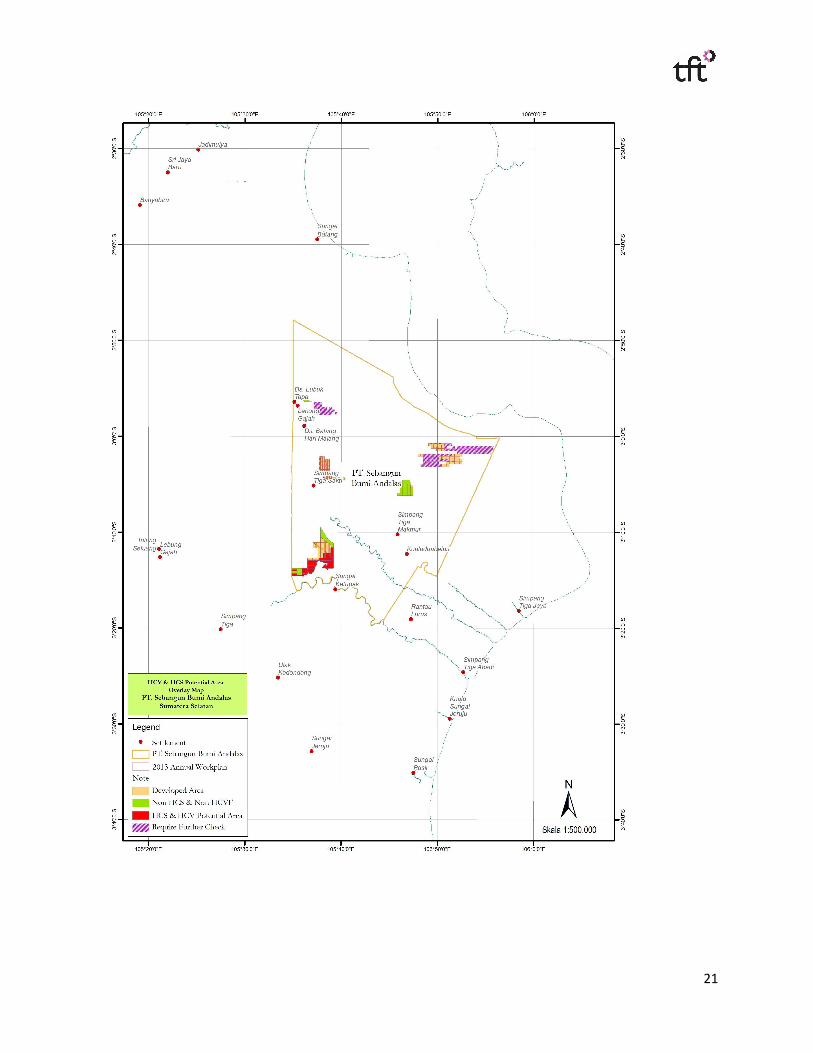
Three operational maps were generated for the pre-assessment stage designating
specific operational RKT 2013 compartments into three broad categories:
a. ALREADY DEVELOPED: - Developed: Compartments whereby HTI had already been established
(plantation and canal/other infrastructures).
b. NO GO AREAS: - Potential HCS/HCV/peatland: Compartments that potentially contained
above ground carbon stocks of more than 35 ton/Ha or strata Old
Scrub/BT and Forest Cover/HK and/or potential HCV, including peatland
areas. These compartments were then considered as “No Go” areas.
- Require further check (RFC): Compartments that could not be classified
accurately as inconsistencies between the principle data sources; aerial
survey, field measurement, and Spot 5 analysis were identified and
therefore a more intensive evaluation and field check would need to be
conducted prior to any operations. These compartments were then
considered as part of the “No Go” areas.
c. GO AREAS: - Non-HCS/non-HCV/non-peatland: compartments that contained above
ground carbon stocks of less than 35 ton/Ha (or strata classified as Open
Land/LT and Young Scrub/BM) and no potential HCV, including peatland
areas. These compartments were then considered as “Go” areas. The
3
extent of this area is 14,600 Ha, of which 6,623 Ha had been developed
between 1st February 2013 and 31st July 2013.
Pre-assessments to identify HCS/HCV/peatland areas were conducted for all three
companies between 29 January and 8 February 2013. The methodology used for the
pre-assessment is described in Appendix1.
3. POTENTIAL BREACHES OF THE DESIGNATED “NO GO” AREAS OF 2013 RKT COMPARTMENTS IN BAP, SBA AND BMH
Based on the updated Planting Realization Map of the three HTI companies that were
obtained by the FCP Implementation Team on 15 July 2013, land preparation and
planting activities had occurred inside the designated “No Go” areas. Of the total 489
compartments located inside the “No Go”, 23 were affected. The profile of these 23
compartments can be seen in Appendix 2.
With this finding, the FCP JSC immediately instructed the FCP Implementation Team to
conduct a document review and field verification on the alleged cutting of potential
HCV/HCS/peatland areas within compartments designated as “No Go”.
4. VERIFICATION STEPS TAKEN BY THE FCP IMPLEMENTATION TEAM
The following steps were taken in relation to the potential forest moratorium breaches
within the “No Go” areas in the 23 compartments in BAP, SBA, and BMH:
a. A preliminary evaluation was conducted in APP’s Office in Jakarta on relevant
documents, data, and maps against the original recommendations of the
HCS/HCV/peatland pre-assessment.
b. APP/TFT formed a Field Verification Team (FVT) that was sent to BAP, SBA, and
BMH where the breaches occurred (see Appendix 5).
4
c. The FVT conducted a field visit from the 23rd to 27th July 2013 using the following
steps:
Ø Reviewed relevant documents in the Region of Palembang and in the 4
Districts (Simpang Tiga District, Kuala Lumpur District, Sungai Ketupak
District, and Simpang Heran District).
Ø Interviewed relevant parties in the Region of Palembang and in the 4
Districts.
Ø Conducted field observations in the 23 compartments where the potential
forest moratorium breaches within the “No Go” areas had occurred.
Ø Conducted a two-stage data reconciliation process with all the relevant
resource persons in the APP Office in Jakarta that commenced on the 1st
August 2013 and which was completed on the 22nd August. The findings
were reported to the FCP JSC.
5. CONCLUSION OF THE FIELD VERIFICATION TEAM
Based on the result of the verification process and accompanying field data the FVT
concluded:
1. Within BAP, SBA and BMH RKT, potential forest moratorium breaches occurred
after 1 February 2013 in RKT compartments (2013) inside the designated “No
Go” areas. The total area developed was 431.1 Ha and took place in 23
compartments (Appendix2).
2. A first stage of data reconciliation (alignment of field verification data and APP
operational data (Appendix 3) concluded that:
a. With respect to HCV, these 23 compartments were cross checked in
relation to potential HCV areas identified during the pre-assessments
(HCS/HCV/peatland) in February 2013 – there was no overlap. Therefore,
none of the 23 compartments above were assessed to contain HCV and
all further verification would focus on identifying potential HCS.
5
b. With respect to HCS, the verification analysis output revealed that of the
431.1 Ha, a maximum area of 72 Ha could provisionally be considered as
HCS and therefore in breach of the forest moratorium. This estimate
would be further analysed in a second stage of verification to establish a
more accurate figure.
3. Following stage 1, whereby field verification data and APP Operational data (field
and head office) were reconciled, a second stage comparative spatial analysis
was implemented (Appendix 4) to both double check the output of the first stage
and to strengthen the overall result through the inclusion of plot data generated in
the full HCS assessment implemented in June/July 2013. Based on the analysis
of spatial mapping data and field data, it can be concluded that the total HCS
area cleared after 1 February 2013 is 69.45 Ha. This is an unacceptable breach
of APP’s natural forest clearance moratorium and its FCP.
4. This 69.45 Ha of HCS was cleared despite the FCP Implementation Team “RKT
2013 Recommendation Map” and Moratorium Protocol being distributed to all
regional and district managers. Land preparation activities took place within the
compartments designated as “No Go” areas because of a lack of understanding
by the district managers of the pre-assessment objectives and the ongoing
HCV/HCS assessment work being carried out in the “No Go” areas. Further,
there wasn’t a clear and comprehensive protocol and sign off process in place
between the regional and district managers related to “No Go” and “Go” areas.
5. If the pulpwood suppliers’ operational teams had been provided a robust
checklist of actions and documents requiring formal sign-off and on-going
monitoring and supervision, this incident would have been avoided.
6. None of the wood cleared from the 69.45 Ha of HCS was sent to APP’s mills.
6. ACTIONS BEING TAKEN TO STRENGTHEN APP’S MORATORIUM AND
IMPLEMENTATION OF ITS FCP
As a result of these breaches of the forest moratorium in the “No Go” areas, the
following steps are being taken:

6
a. The FCP Implementation Team is developing clear procedures which include:
I. A sign off process illustrating how the HCS and HCV recommendations and
associated final “Go” and “No Go” maps generated are to be used by
operational staff, as part of their operational planning.
II. A checklist to accompany the sign off process to ensure that there is formal
signoff at each stage of the process.
b. These procedures will apply to all future land development processes across
APP’s entire supply base
c. Retraining: All relevant APP and pulpwood supplier operation staff will be
recalled for re-briefing to ensure there is a clear understanding of the signoff
procedures and operationalisation of the recommendations in accordance with
APP’s FCP.
d. Monitoring:
I. Updated Planting Realization Maps to be sent monthly to the FCP
implementation team.
II. Random field checks are to be conducted by the FCP implementation team
every three months.
e. Restoration: TFT recommends that APP restore or compensate for the
equivalent HCS area of what was cleared since 1st February 2013.

7
Appendix 1. Summary result of the pre-assessments to identify HCS/HCV/peatland areas Methodology Pre-assessments to identify of HCS/HCV/peatland areas were deployed in BAP, BMH and SBA, which focused on the areas planned to be developed during 2013(the RKT 2013 operational compartments). The company requested that these pre-assessments be undertaken to facilitate plantation development in ‘low risk’ areas in order to meet its suppliers’ plantation forecasts for its proposed new pulp mill being built in South Sumatra. Pre-assessments are not being applied elsewhere to any other of APP’s suppliers. Full HCS and HCV (including peatland) assessments are currently being deployed over all areas of these three companies. Scope Block RKT 2013 HTI concession:
1. PT. Bumi Mekar Hijau (BMH)
2. PT. Sebangun Bumi Andalas (SBA)
3. PT. Bumi Andalas Permai (BAP)
Data on the extent of each concession are as follows:
Name of Company Total Extent (Ha)
Extent of RKT 2013 (Ha)
PT. Bumi Mekar Hijau (BMH) 253,612 33,896 PT. Sebangun Bumi Andalas (SBA) 135,689 8,147 PT. Bumi Andalas Permai (BAP) 194,589 17,717 Total 583,891 59,760
Source: Layout and spatial analysis of 2013RKT compartments Method
1. Desk Study
• Map of land cover
• Map of SPOT 5 and its interpretation
• Progress of the HTI activity (land clearing, plantation, etc.)
8
2. Analysis of Secondary Data
3. Aerial Survey
4. Carbon Stock Measurement (above ground biomass)
5. Consultation with selected stakeholders
6. Biodiversity Survey (HCV 1, 2, & 3)
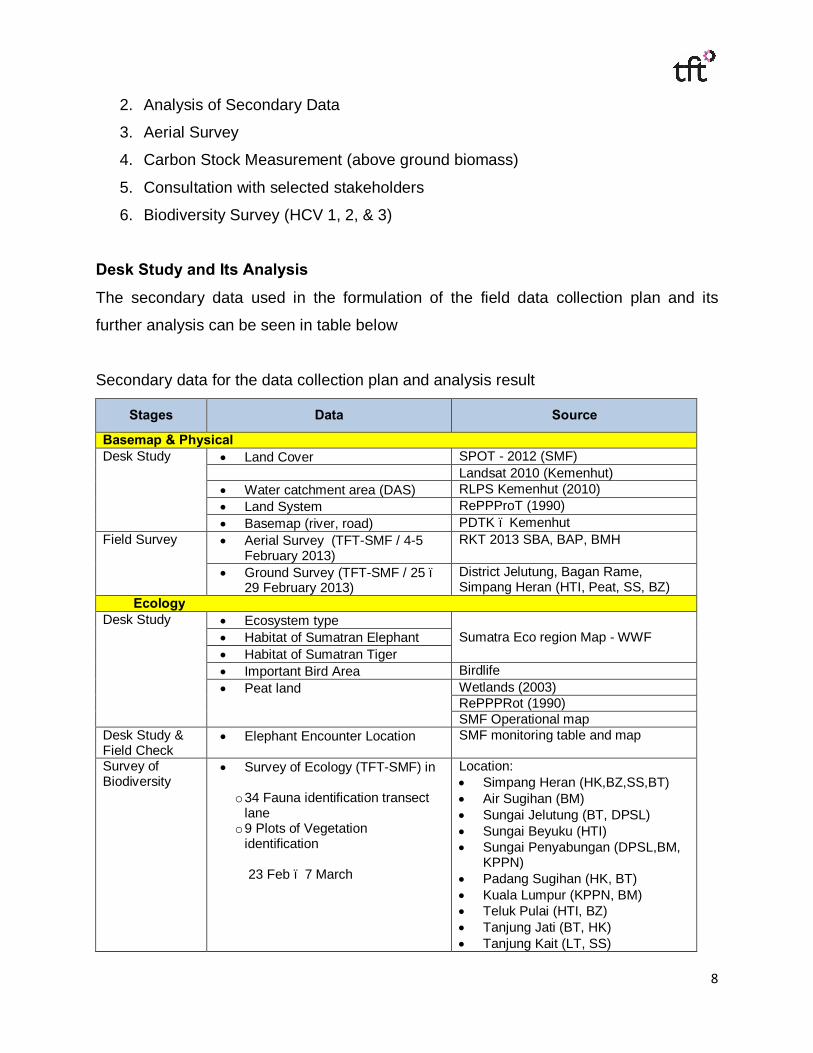
Desk Study and Its Analysis
The secondary data used in the formulation of the field data collection plan and its
further analysis can be seen in table below
Secondary data for the data collection plan and analysis result
Stages Data Source
Basemap & Physical Desk Study • Land Cover SPOT - 2012 (SMF)
Landsat 2010 (Kemenhut) • Water catchment area (DAS) RLPS Kemenhut (2010) • Land System RePPProT (1990) • Basemap (river, road) PDTK – Kemenhut
Field Survey • Aerial Survey (TFT-SMF / 4-5 February 2013)
RKT 2013 SBA, BAP, BMH
• Ground Survey (TFT-SMF / 25 – 29 February 2013)
District Jelutung, Bagan Rame, Simpang Heran (HTI, Peat, SS, BZ)
Ecology Desk Study • Ecosystem type
Sumatra Eco region Map - WWF • Habitat of Sumatran Elephant • Habitat of Sumatran Tiger • Important Bird Area Birdlife • Peat land Wetlands (2003)
RePPPRot (1990) SMF Operational map
Desk Study & Field Check
• Elephant Encounter Location SMF monitoring table and map
Survey of Biodiversity
• Survey of Ecology (TFT-SMF) in
o 34 Fauna identification transect lane
o 9 Plots of Vegetation identification 23 Feb – 7 March
Location: • Simpang Heran (HK,BZ,SS,BT) • Air Sugihan (BM) • Sungai Jelutung (BT, DPSL) • Sungai Beyuku (HTI) • Sungai Penyabungan (DPSL,BM,
KPPN) • Padang Sugihan (HK, BT) • Kuala Lumpur (KPPN, BM) • Teluk Pulai (HTI, BZ) • Tanjung Jati (BT, HK) • Tanjung Kait (LT, SS)
9
Stages Data Source
• Sungai Ketupak (BR, HTI) • Sungai Serdang (BT) • Sungai Gebang (Karet, BM, LT,
BM, HTI, LT) Social Desk Study • OKI statistical data (OKI Dalam
Angka) BPS OKI
• Land conflict map BAP, SBA, BMH Interview & FGD
• Interview & FGD (TFT-SMF) 23 Feb – 7 March 2013
Location: • Banyu Biru Village • Jadi Mulya Village • Kuala 12 Village • Lebong Gajah Village • Simpang Tiga Jaya (S. Pedada)
Village • Simpang Tiga Sakti Village • Srijaya Baru Village • Sungai Batang Village • Tulung Seluang Village • 3 Penyabungan Hamlet, Riding
Village • Bagan Rame Hamlet • Parit 26 Hamlet • Sungai Janun Hamlet • Sungai Kong Hamlet
Legal Documents Desk Study • Macro Delineation
BAP, SBA, BMH • RKU • LHP Gelam • LHP Karbon • RKL & RLP 2012 • LITBANGHUT reports • LHP Cultivation of Gelam species • LHP 2012 Peat Carbon • LHP 2011 Peat Emission • LHP Rehabilitation Technology of
Peat Swamp Forest • Proceeding in the management of
Forests and Swamp Lands in an Integrated and Wise manner
• Proceeding in the Role of Science and Technology (Iptek) in Supporting the Development of Plantation Forests and Welfare of the Community
Balitbanghut
• RKT Block BAP, SBA, BMH
Based on the secondary data analysis, the data collection in the field was obtained from
the following activities:

10
Aerial Survey The aerial survey covered 56% of the total area within the RKT 2013 of all the 3
companies. The scope of the observation on each concession is presented in table
below.
Scope of the observation of the “Aerial Survey” activity
HTI Extent of RKT 2013 (Ha)
Extent of the Aerial Survey Observation (Ha)
% of the observation
BMH 33,896 16,034 47.3 SBA 8,147 5,463 66.7 BAP 17,717 12,100 68.3 Total 59,760 33,597 56.2
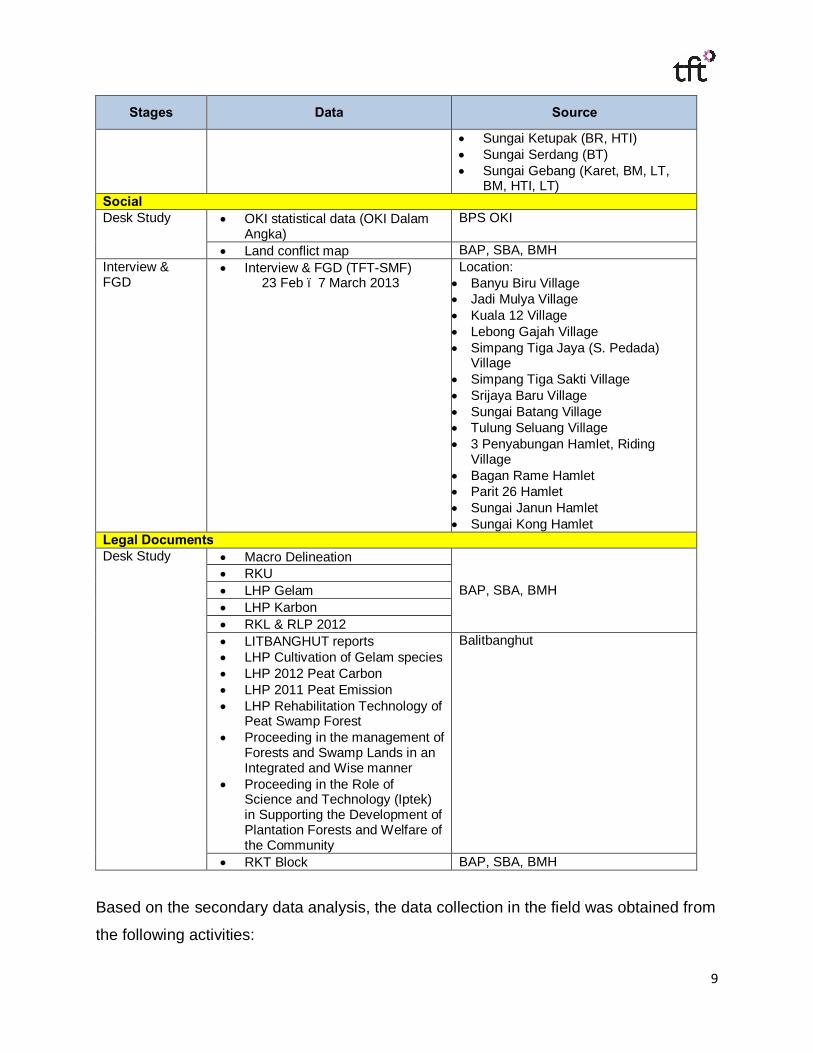
Carbon Stock Measurement The HCS plots were randomly deployed with the intensity of sampling from 0.01% to
0.025% detailed in the table below. These randomly deployed HCS plots only targeted
non-peat areas as defined through available peat maps as these areas were
automatically categorized as “No Go”.
Number of HCS measurement plot on each HTI Concession
HTI Extent of Scrub on RKT 2013
(ha)
Intensity of the
sampling (%)
Plot Plan ∑
Plot Realization
∑ Plot Remarks
SBA 4,034 0.025 20 18 2 plots were already cleared; 4 plots carbon contain over 35 tons/ha and 14 plot carbon contain below 35 tons/ha; No indication of peat existence in these plots
11
HTI Extent of Scrub on RKT 2013
(ha)
Intensity of the
sampling (%)
Plot Plan ∑
Plot Realization
∑ Plot Remarks
BMH 27,754 0.010 56 56 4 plots carbon contain over 35 tons/ha and 52 plot carbon contain below 35 tons/ha; No indication of peat existence in these plots
BAP 12,515 0.025 63 60 3 plots were already cleared; 4 plots carbon contain over 35 tons/ha and 56 plots carbon contain below 35 tons/ha; No indication of peat existence in these plots
Total 44,303 139 134 12 plots carbon contain over 35 tons/ha and 122 plots carbon contain below 35 tons/ha; No indication of peat existence in these plots
The maps below show the plots location and flight paths.
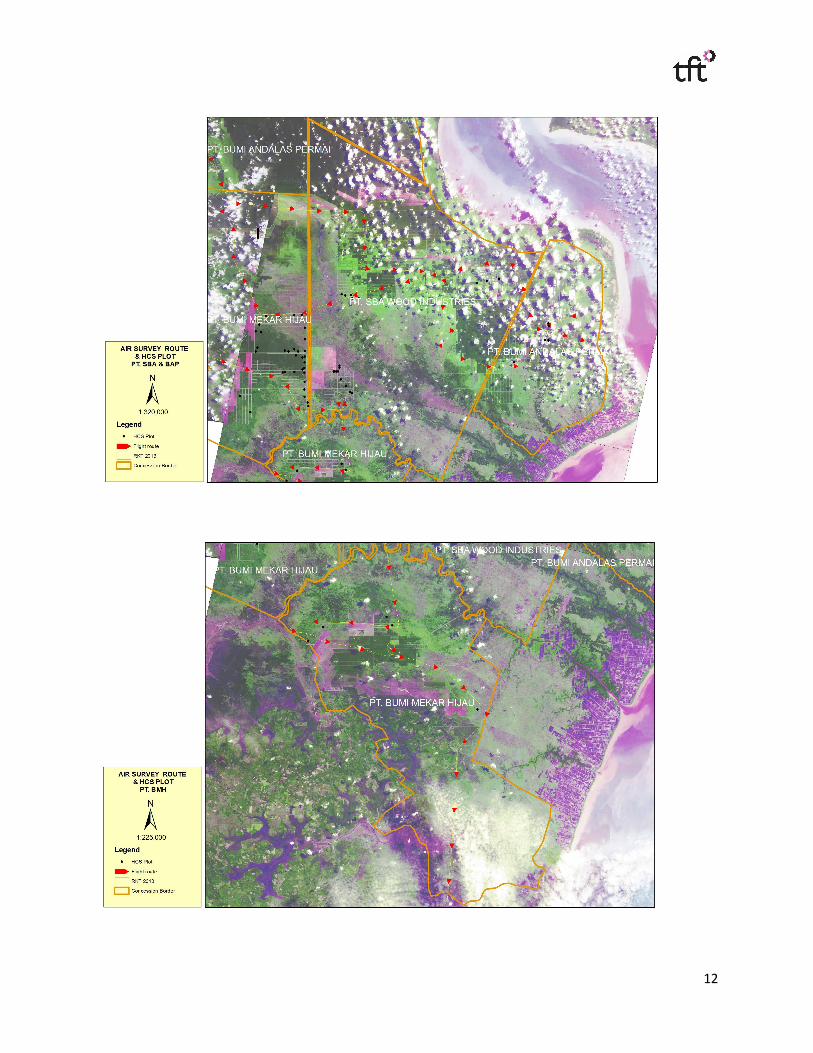
12
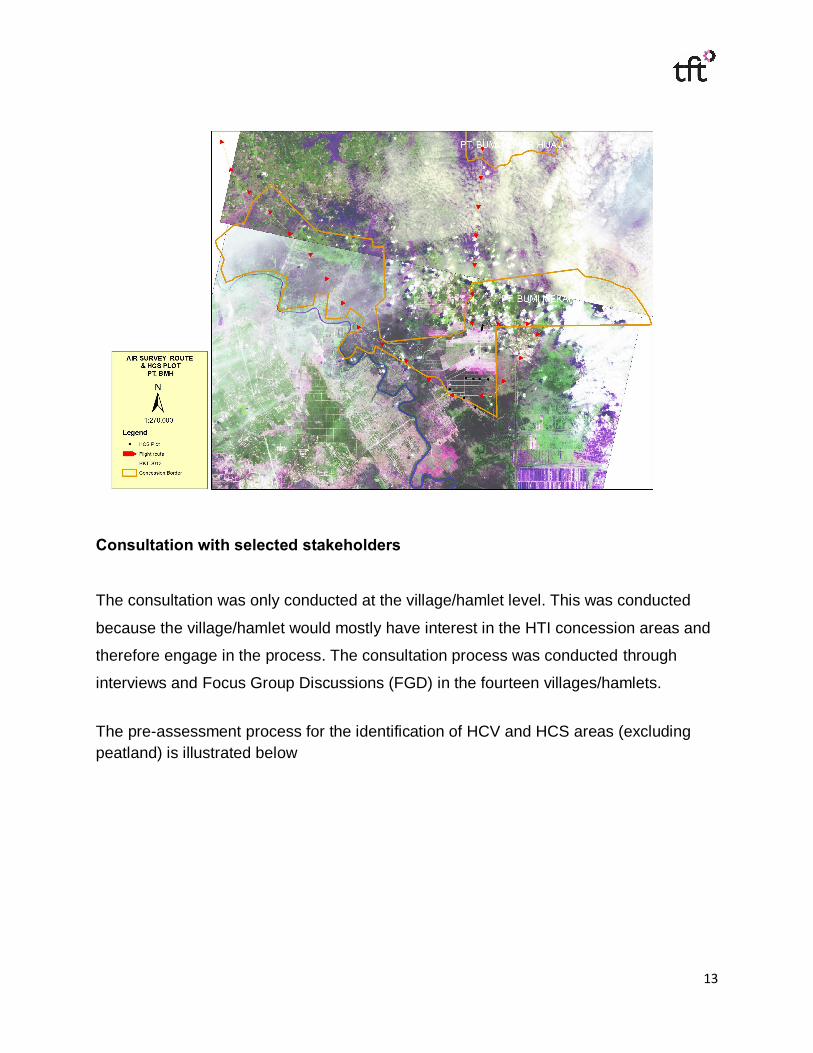
13
Consultation with selected stakeholders
The consultation was only conducted at the village/hamlet level. This was conducted
because the village/hamlet would mostly have interest in the HTI concession areas and
therefore engage in the process. The consultation process was conducted through
interviews and Focus Group Discussions (FGD) in the fourteen villages/hamlets.
The pre-assessment process for the identification of HCV and HCS areas (excluding peatland) is illustrated below
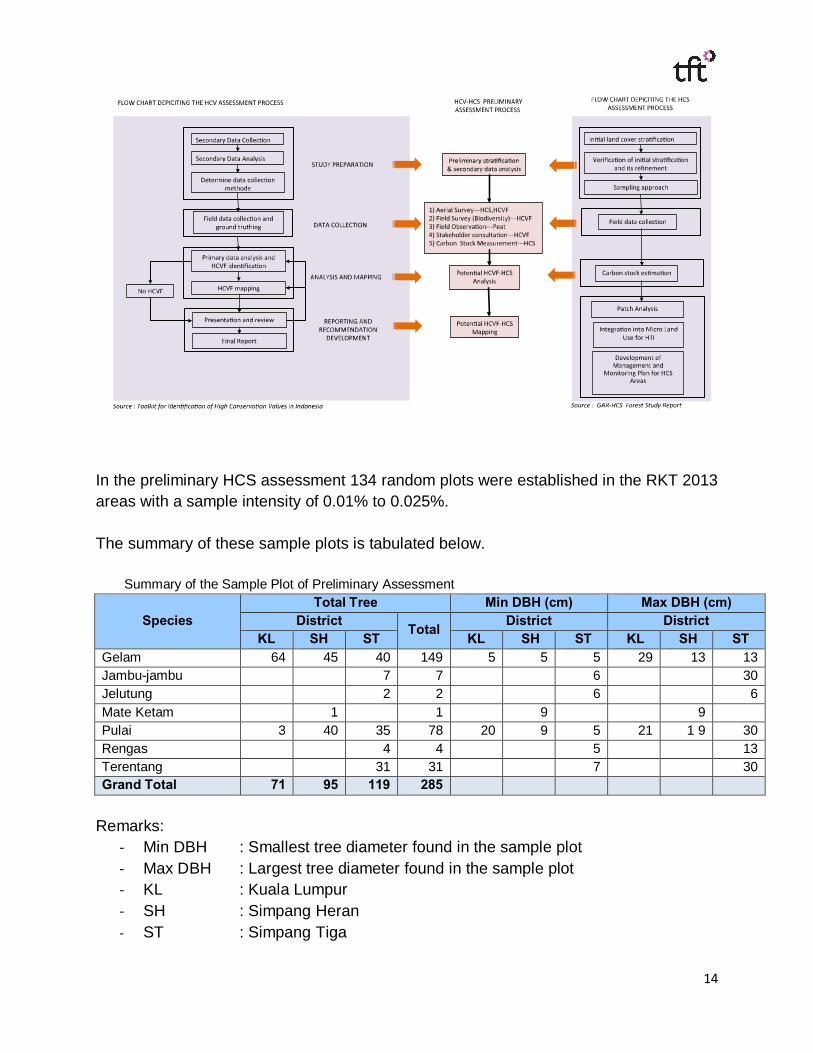
14
In the preliminary HCS assessment 134 random plots were established in the RKT 2013 areas with a sample intensity of 0.01% to 0.025%. The summary of these sample plots is tabulated below.
Summary of the Sample Plot of Preliminary Assessment
Species Total Tree Min DBH (cm) Max DBH (cm)
District Total District District KL SH ST KL SH ST KL SH ST
Gelam 64 45 40 149 5 5 5 29 13 13 Jambu-jambu 7 7 6 30 Jelutung 2 2 6 6 Mate Ketam 1 1 9 9 Pulai 3 40 35 78 20 9 5 21 1 9 30 Rengas 4 4 5 13 Terentang 31 31 7 30 Grand Total 71 95 119 285
Remarks:
- Min DBH : Smallest tree diameter found in the sample plot - Max DBH : Largest tree diameter found in the sample plot - KL : Kuala Lumpur - SH : Simpang Heran - ST : Simpang Tiga

15
The HCS approach distinguishes natural forest from degraded lands with only small trees, scrub, or grass remaining. It separates vegetation into six different classes (stratification) through the combination of analyzing satellite images and field plots. The Indonesian descriptions of these are: High Density Forest (HK3), Medium Density Forest (HK2), Low Density Forest (HK1), Old Scrub (BT) 3, Young Scrub (BM), and Cleared/Open Land (LT). For the purpose of this study, a provisional threshold for HCS forest of greater than 35 tC/Ha of above ground biomass (AGB) was set. As a result of the pre-assessments (HCS/HCV/peatland), specific operational RKT 2013 compartments could be classified into three broad categories:
1. ALREADY DEVELOPED: - Developed: Compartments whereby HTI had already been established
(plantation and canal/other infrastructures).
2. NO GO AREAS:
- Potential HCS/HCV/peatland: Compartments that potentially contained
above ground carbon stocks of more than 35 ton/Ha or strata Young
Scrub/BT and Forest Cover/HK and/or potential HCV, including peatland
areas. These compartments were then considered as “No Go” areas.
- Require further check (RFC): Compartments that could not be classified
accurately as inconsistencies between the principle data sources (aerial
survey, field measurement, and Spot 5 analysis) were identified and
therefore a more intensive evaluation and field check would need to be
conducted prior to any operations. A precautionary approach was taken
whereby these compartments were classified as “Require further check”
and therefore “No Go” areas.
3. GO AREAS: - Non-HCS/ non-HCV/ non-peatland: compartments that contained above
ground carbon stocks of less than 35 ton/Ha (or strata classified as Open
16
Land/LT and Young Scrub/BM) and no potential HCV, including peatland
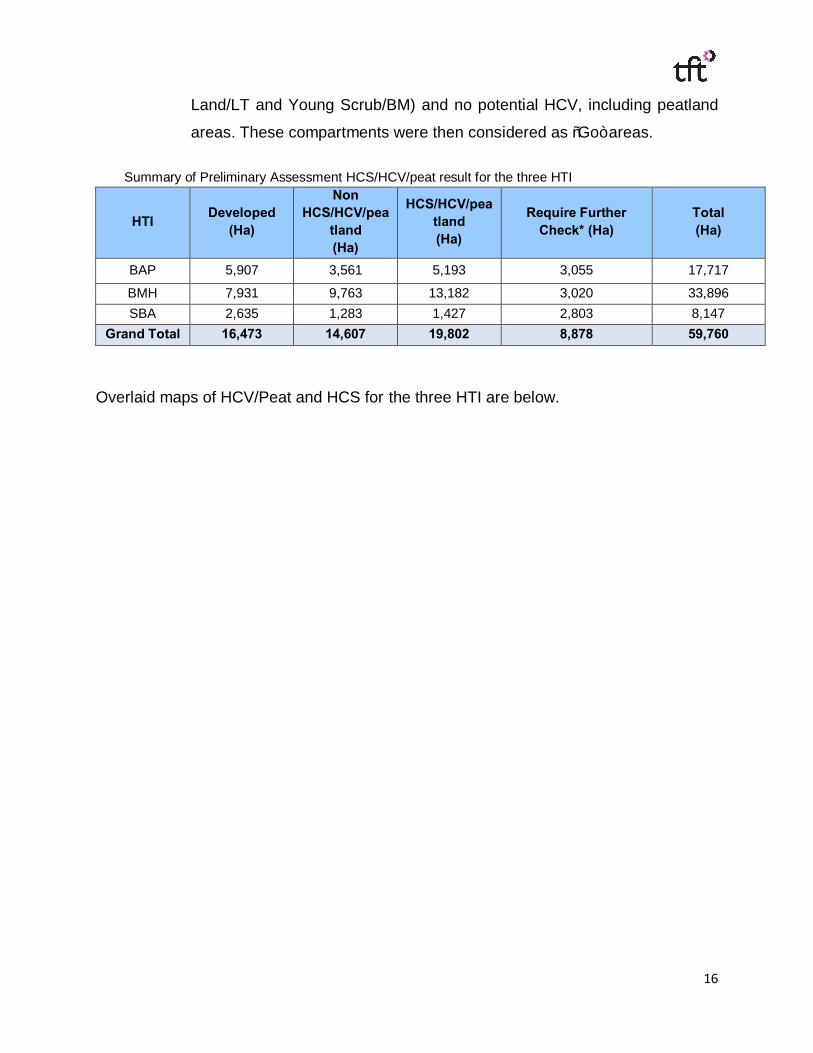
areas. These compartments were then considered as “Go” areas.
Summary of Preliminary Assessment HCS/HCV/peat result for the three HTI
HTI Developed (Ha)
Non HCS/HCV/pea
tland (Ha)
HCS/HCV/peatland (Ha)
Require Further Check* (Ha)
Total (Ha)
BAP 5,907 3,561 5,193 3,055 17,717
BMH 7,931 9,763 13,182 3,020 33,896 SBA 2,635 1,283 1,427 2,803 8,147
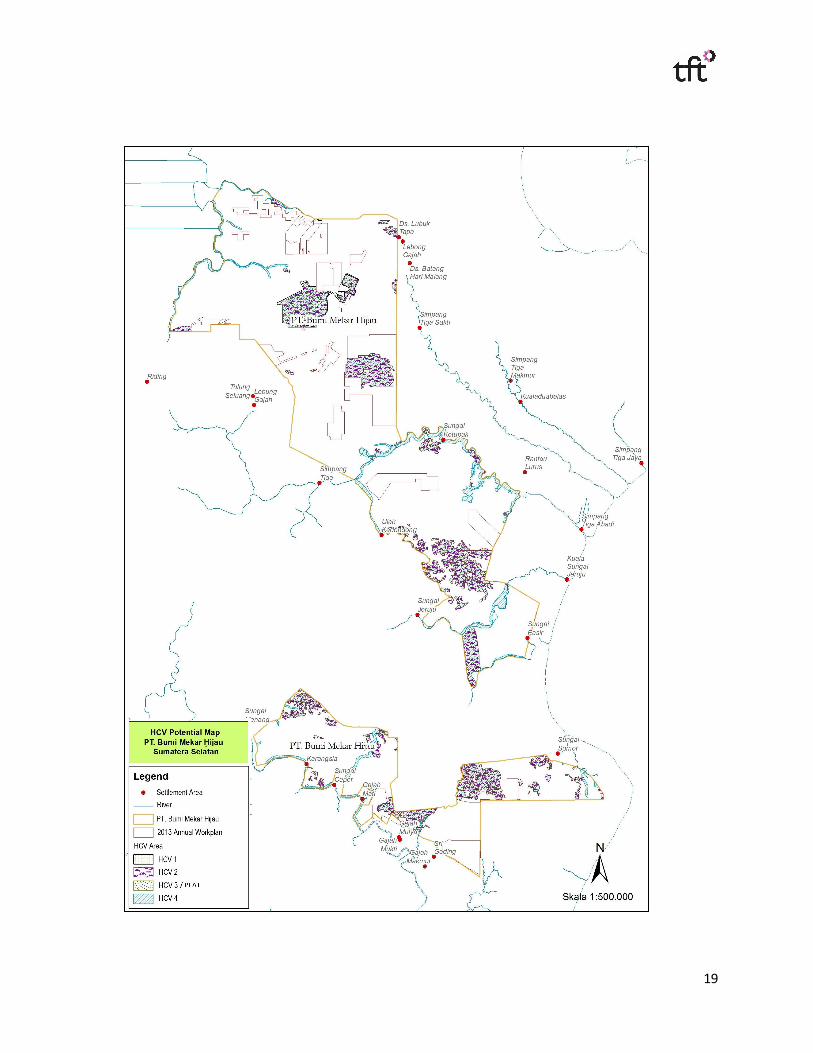
Grand Total 16,473 14,607 19,802 8,878 59,760 Overlaid maps of HCV/Peat and HCS for the three HTI are below.

17
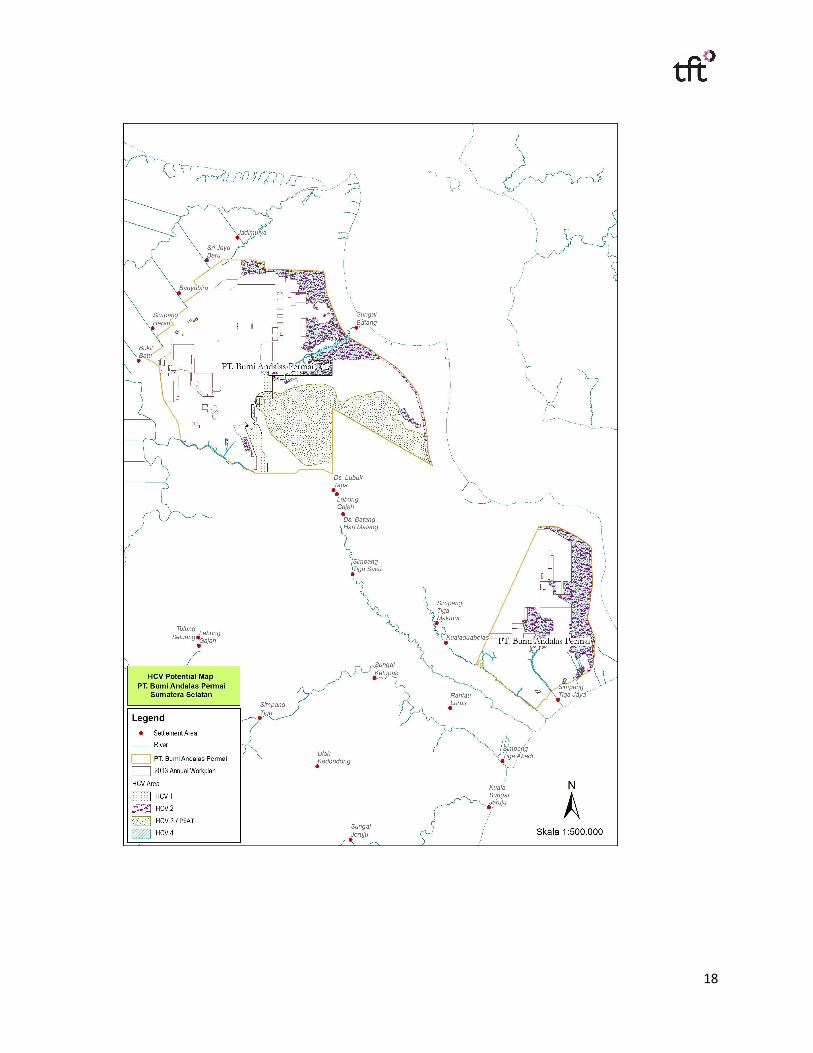
18
19
20
21
22
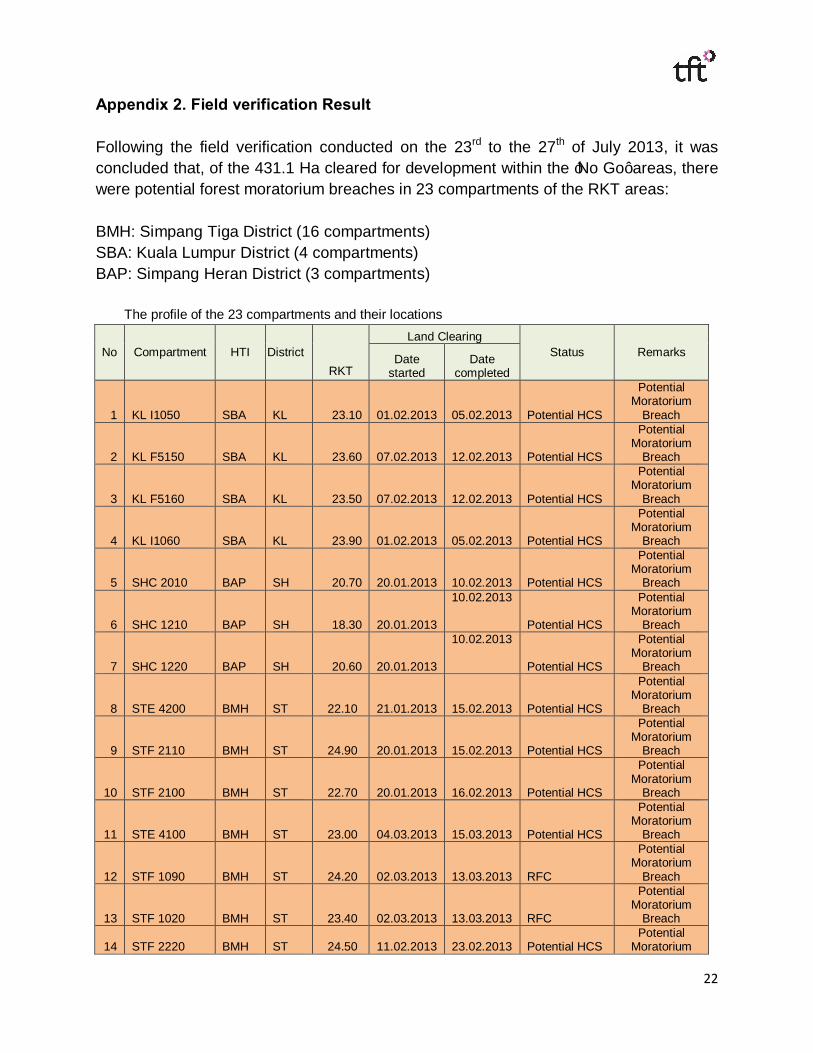
Appendix 2. Field verification Result Following the field verification conducted on the 23rd to the 27th of July 2013, it was concluded that, of the 431.1 Ha cleared for development within the ‘No Go’ areas, there were potential forest moratorium breaches in 23 compartments of the RKT areas: BMH: Simpang Tiga District (16 compartments) SBA: Kuala Lumpur District (4 compartments) BAP: Simpang Heran District (3 compartments)
The profile of the 23 compartments and their locations
No Compartment HTI District RKT
Land Clearing Status Remarks Date
started Date
completed
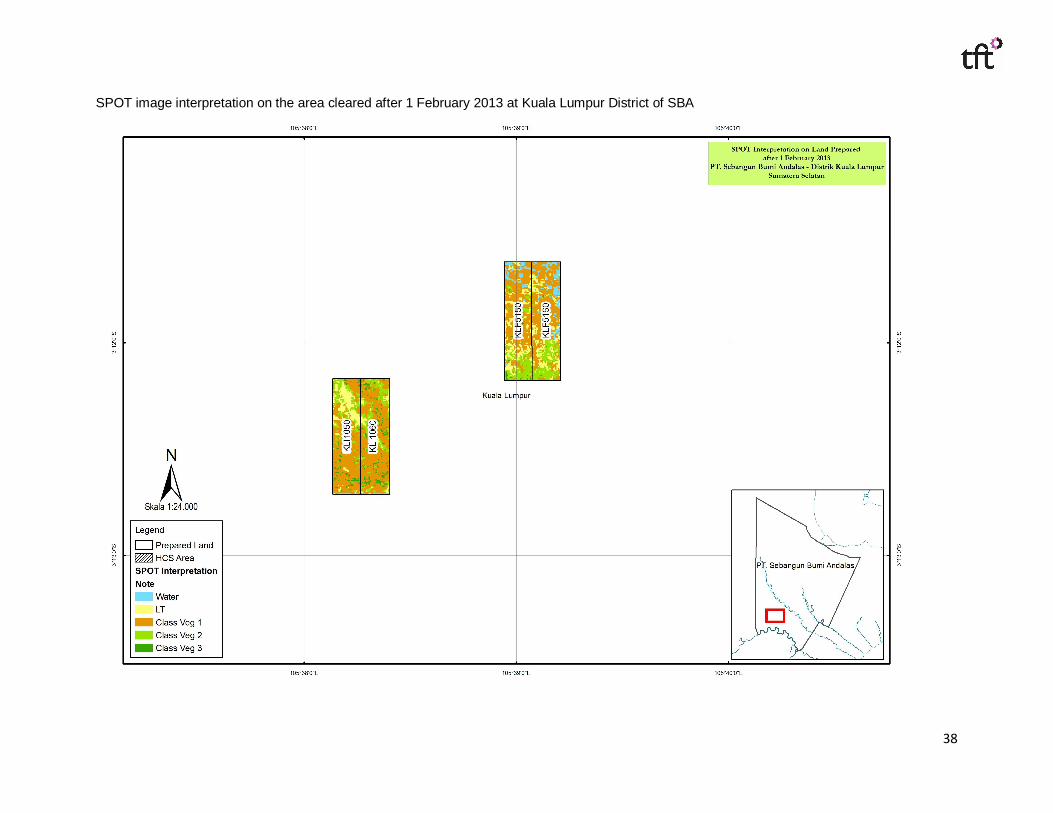
1 KL I1050 SBA KL 23.10 01.02.2013 05.02.2013 Potential HCS
Potential Moratorium
Breach
2 KL F5150 SBA KL 23.60 07.02.2013 12.02.2013 Potential HCS
Potential Moratorium
Breach
3 KL F5160 SBA KL 23.50 07.02.2013 12.02.2013 Potential HCS
Potential Moratorium
Breach
4 KL I1060 SBA KL 23.90 01.02.2013 05.02.2013 Potential HCS
Potential Moratorium
Breach
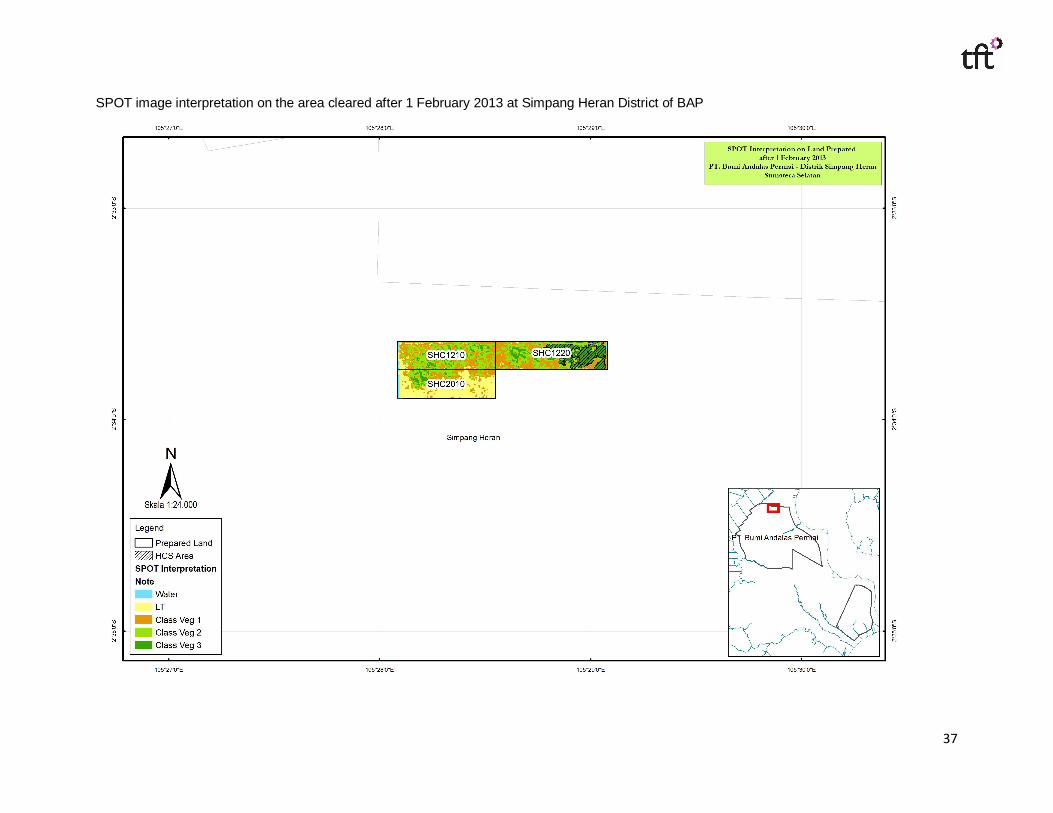
5 SHC 2010 BAP SH 20.70 20.01.2013 10.02.2013 Potential HCS
Potential Moratorium
Breach
6 SHC 1210 BAP SH 18.30 20.01.2013
10.02.2013
Potential HCS
Potential Moratorium
Breach
7 SHC 1220 BAP SH 20.60 20.01.2013
10.02.2013
Potential HCS
Potential Moratorium
Breach
8 STE 4200 BMH ST 22.10 21.01.2013 15.02.2013 Potential HCS
Potential Moratorium
Breach
9 STF 2110 BMH ST 24.90 20.01.2013 15.02.2013 Potential HCS
Potential Moratorium
Breach
10 STF 2100 BMH ST 22.70 20.01.2013 16.02.2013 Potential HCS
Potential Moratorium
Breach
11 STE 4100 BMH ST 23.00 04.03.2013 15.03.2013 Potential HCS
Potential Moratorium
Breach
12 STF 1090 BMH ST 24.20 02.03.2013 13.03.2013 RFC
Potential Moratorium
Breach
13 STF 1020 BMH ST 23.40 02.03.2013 13.03.2013 RFC
Potential Moratorium
Breach
14 STF 2220 BMH ST 24.50 11.02.2013 23.02.2013 Potential HCS Potential
Moratorium
23
No Compartment HTI District RKT
Land Clearing Status Remarks Date
started Date
completed Breach
15 STF 2190 BMH ST 23.10 13.02.2013 24.02.2013 RFC
Potential Moratorium
Breach
16 STF 2210 BMH ST 24.50 04.03.2013 16.03.2013 Potential HCS
Potential Moratorium
Breach
17 STF 2200 BMH ST 23.10 02.03.2013 13.03.2013 Potential HCS
Potential Moratorium
Breach
18 STF 2120 BMH ST 24.50 10.02.2013 22.02.2013 RFC
Potential Moratorium
Breach
19 STE 4110 BMH ST 26.40 04.03.2013 17.03.2013 Potential HCS
Potential Moratorium
Breach
20 STD 3240 BMH ST 22.10 12.02.2013 22.02.2013 RFC
Potential Moratorium
Breach
21 STD 4040 BMH ST 20.80 12.02.2013 21.03.2013 RFC
Potential Moratorium
Breach
22 STD 4170 BMH ST 22.80 12.02.2013 23.02.2013 RFC
Potential Moratorium
Breach
23 STD 4240 BMH ST 22.40 12.02.2013 25.02.2013 Potential HCS
Potential Moratorium
Breach
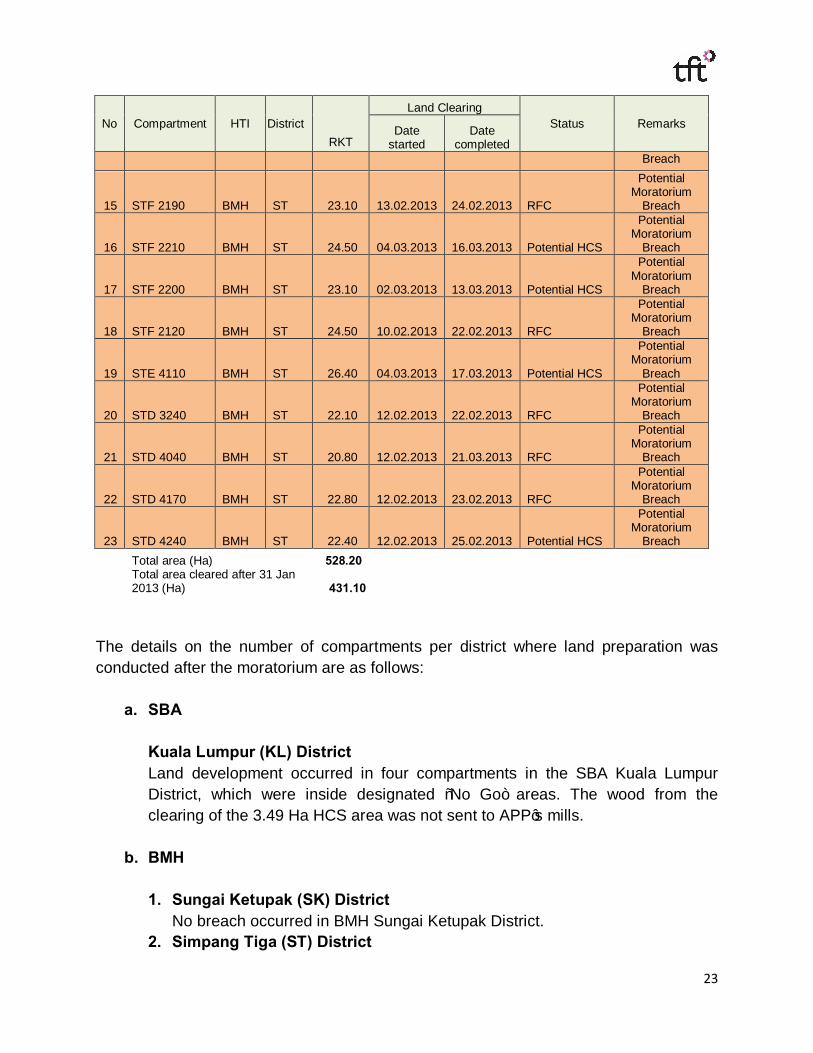
Total area (Ha) 528.20
Total area cleared after 31 Jan 2013 (Ha) 431.10
The details on the number of compartments per district where land preparation was conducted after the moratorium are as follows:
a. SBA
Kuala Lumpur (KL) District Land development occurred in four compartments in the SBA Kuala Lumpur District, which were inside designated “No Go” areas. The wood from the clearing of the 3.49 Ha HCS area was not sent to APP’s mills.
b. BMH 1. Sungai Ketupak (SK) District
No breach occurred in BMH Sungai Ketupak District. 2. Simpang Tiga (ST) District
24
Land development occurred in 16 compartments of the BMH Simpang Tiga District, which were inside the designated “No Go” areas. The wood from the clearing of the 63.47 Ha HCS area was not sent to APP’s mills.
c. BAP
Simpang Heran (SH) District Land development occurred in 3 compartments of the BMH Simpang Heran District, which were inside the designated “No Go” areas. The wood from the clearing of the 2.49 Ha HCS area was not sent to APP’s mills.
25
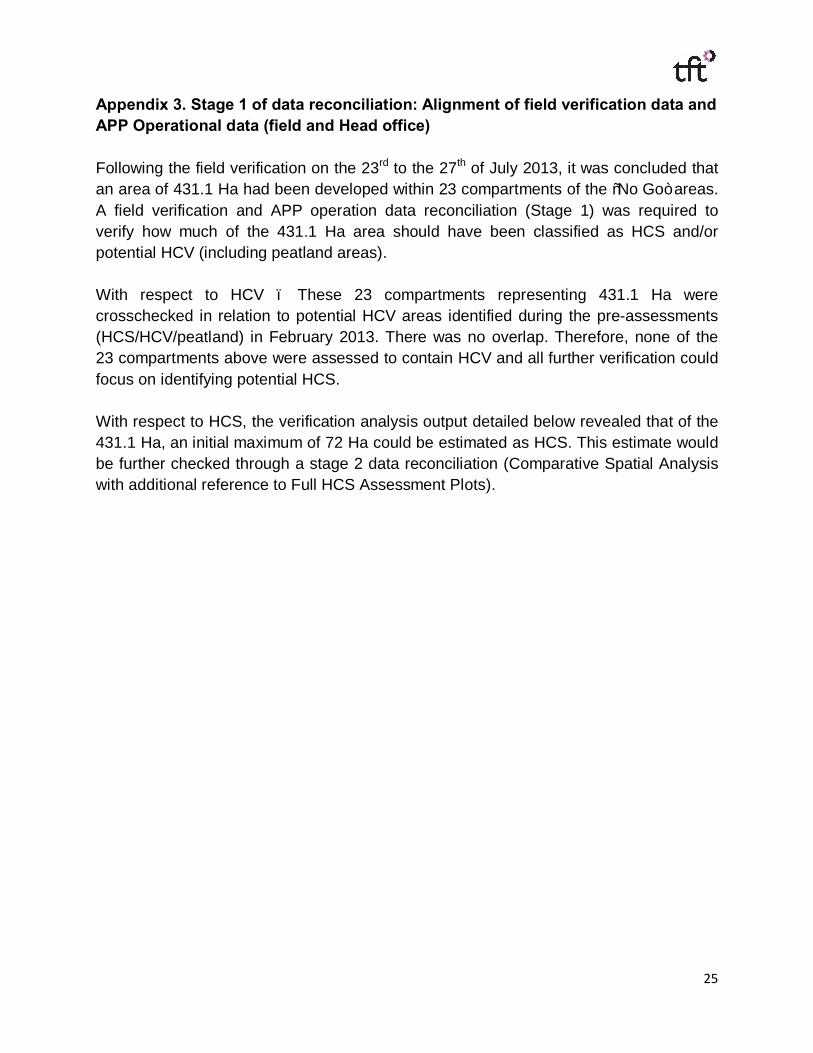
Appendix 3. Stage 1 of data reconciliation: Alignment of field verification data and APP Operational data (field and Head office) Following the field verification on the 23rd to the 27th of July 2013, it was concluded that an area of 431.1 Ha had been developed within 23 compartments of the “No Go” areas. A field verification and APP operation data reconciliation (Stage 1) was required to verify how much of the 431.1 Ha area should have been classified as HCS and/or potential HCV (including peatland areas). With respect to HCV – These 23 compartments representing 431.1 Ha were crosschecked in relation to potential HCV areas identified during the pre-assessments (HCS/HCV/peatland) in February 2013. There was no overlap. Therefore, none of the 23 compartments above were assessed to contain HCV and all further verification could focus on identifying potential HCS. With respect to HCS, the verification analysis output detailed below revealed that of the 431.1 Ha, an initial maximum of 72 Ha could be estimated as HCS. This estimate would be further checked through a stage 2 data reconciliation (Comparative Spatial Analysis with additional reference to Full HCS Assessment Plots).
26
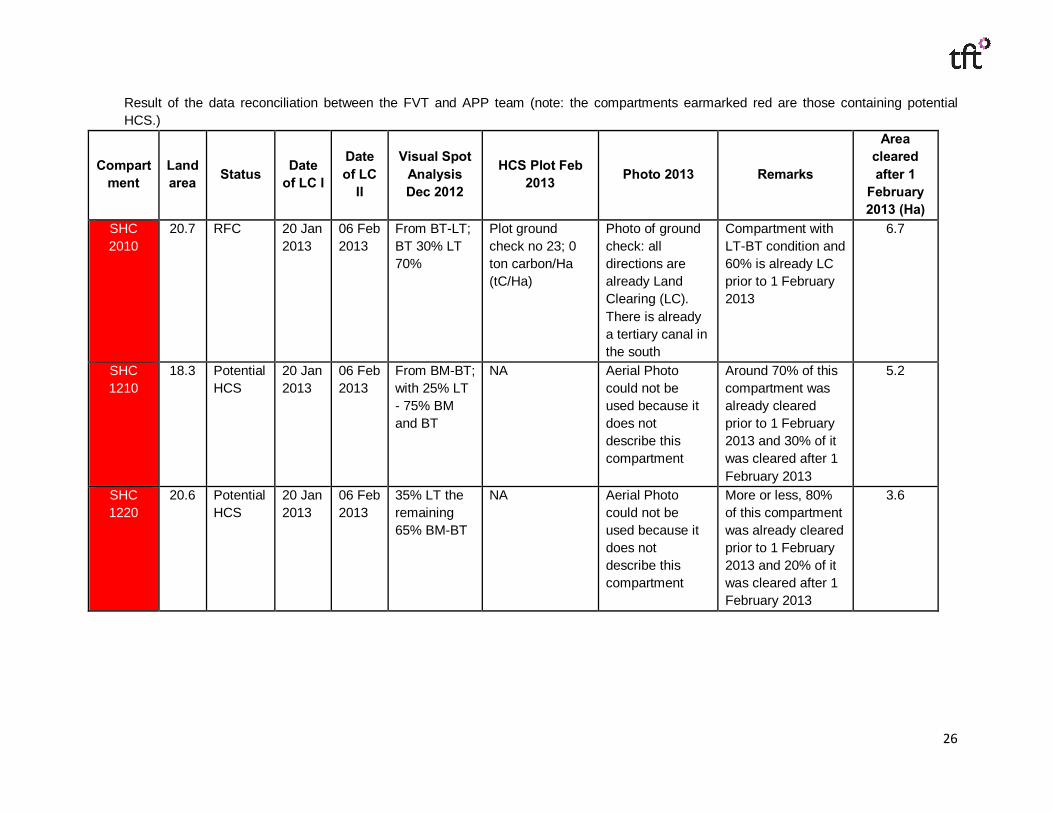
Result of the data reconciliation between the FVT and APP team (note: the compartments earmarked red are those containing potential HCS.)
Compartment
Land area Status Date
of LC I
Date of LC
II
Visual Spot Analysis Dec 2012
HCS Plot Feb 2013 Photo 2013 Remarks
Area cleared after 1
February 2013 (Ha)
SHC 2010
20.7 RFC 20 Jan 2013
06 Feb 2013
From BT-LT; BT 30% LT 70%
Plot ground check no 23; 0 ton carbon/Ha (tC/Ha)
Photo of ground check: all directions are already Land Clearing (LC). There is already a tertiary canal in the south
Compartment with LT-BT condition and 60% is already LC prior to 1 February 2013
6.7
SHC 1210
18.3 Potential HCS
20 Jan 2013
06 Feb 2013
From BM-BT; with 25% LT - 75% BM and BT
NA Aerial Photo could not be used because it does not describe this compartment
Around 70% of this compartment was already cleared prior to 1 February 2013 and 30% of it was cleared after 1 February 2013
5.2
SHC 1220
20.6 Potential HCS
20 Jan 2013
06 Feb 2013
35% LT the remaining 65% BM-BT
NA Aerial Photo could not be used because it does not describe this compartment
More or less, 80% of this compartment was already cleared prior to 1 February 2013 and 20% of it was cleared after 1 February 2013
3.6
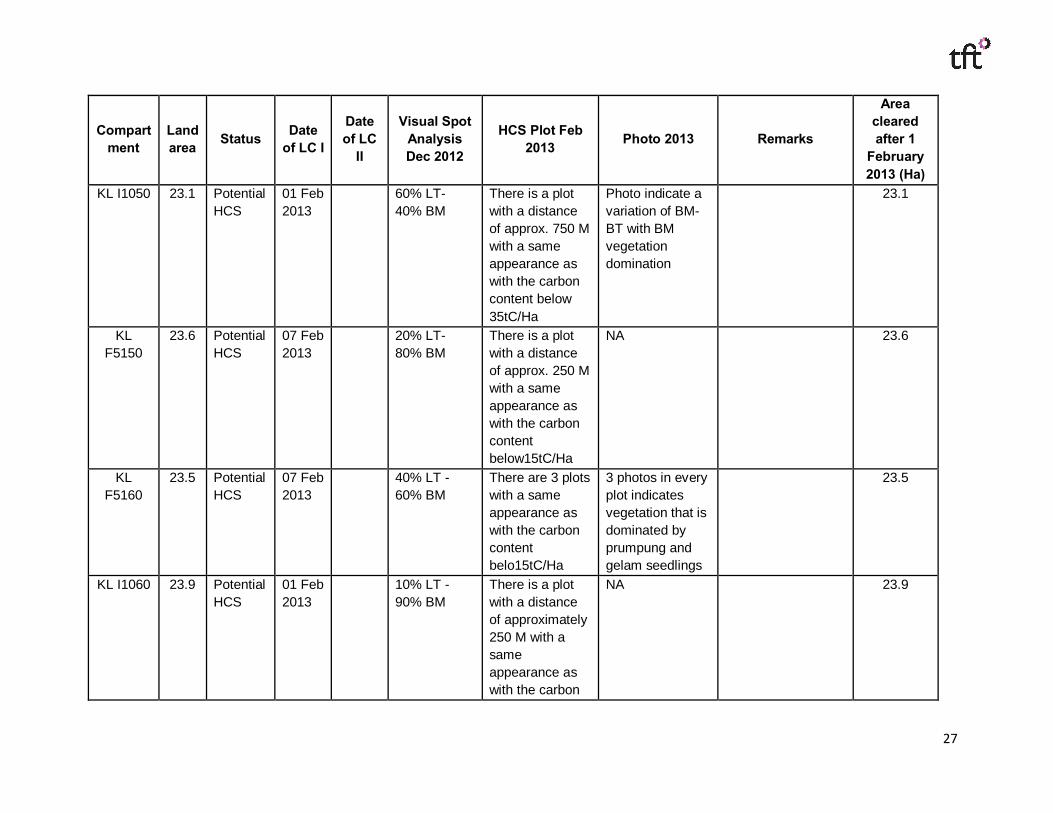
27
Compartment
Land area Status Date
of LC I
Date of LC
II
Visual Spot Analysis Dec 2012
HCS Plot Feb 2013 Photo 2013 Remarks
Area cleared after 1
February 2013 (Ha)
KL I1050 23.1 Potential HCS
01 Feb 2013
60% LT- 40% BM
There is a plot with a distance of approx. 750 M with a same appearance as with the carbon content below 35tC/Ha
Photo indicate a variation of BM-BT with BM vegetation domination
23.1
KL F5150
23.6 Potential HCS
07 Feb 2013
20% LT- 80% BM
There is a plot with a distance of approx. 250 M with a same appearance as with the carbon content below15tC/Ha
NA 23.6
KL F5160
23.5 Potential HCS
07 Feb 2013
40% LT - 60% BM
There are 3 plots with a same appearance as with the carbon content belo15tC/Ha
3 photos in every plot indicates vegetation that is dominated by prumpung and gelam seedlings
23.5
KL I1060 23.9 Potential HCS
01 Feb 2013
10% LT - 90% BM
There is a plot with a distance of approximately 250 M with a same appearance as with the carbon
NA 23.9

28
Compartment
Land area Status Date
of LC I
Date of LC
II
Visual Spot Analysis Dec 2012
HCS Plot Feb 2013 Photo 2013 Remarks
Area cleared after 1
February 2013 (Ha)
content below 35tC/Ha
STE 4200 22.1
Potential HCS
21 Jan 2013
10 Feb 2013
10% LT - 70% BM - 20% BT
NA NA 7.1
STF 2110
24.9 Potential HCS
20 Jan 2013
11 Feb 2013
90% LT - 10% BM
NA NA 4.9
STF 2100 22.7
Potential HCS
20 Jan 2013
12 Feb 2013
50% LT - 50% BM NA NA
4.7
STE 4100
23 Potential HCS
04 Mar 2013
40% BT - 60% BM
NA NA 23
STF 1090
24.2 RFC 02 Mar 2013
100% LT There is a plot (no 50) with a distance of 500 M from the compartment
Photo ground check indicates vegetation of open land in the form of bushes
24.2
STF 1020
23.4 RFC 02 Mar 2013
100% LT There is a plot (no 50) with a distance of 200 M from the compartment
Photo ground check indicates vegetation of open land in the form of bushes
23.4
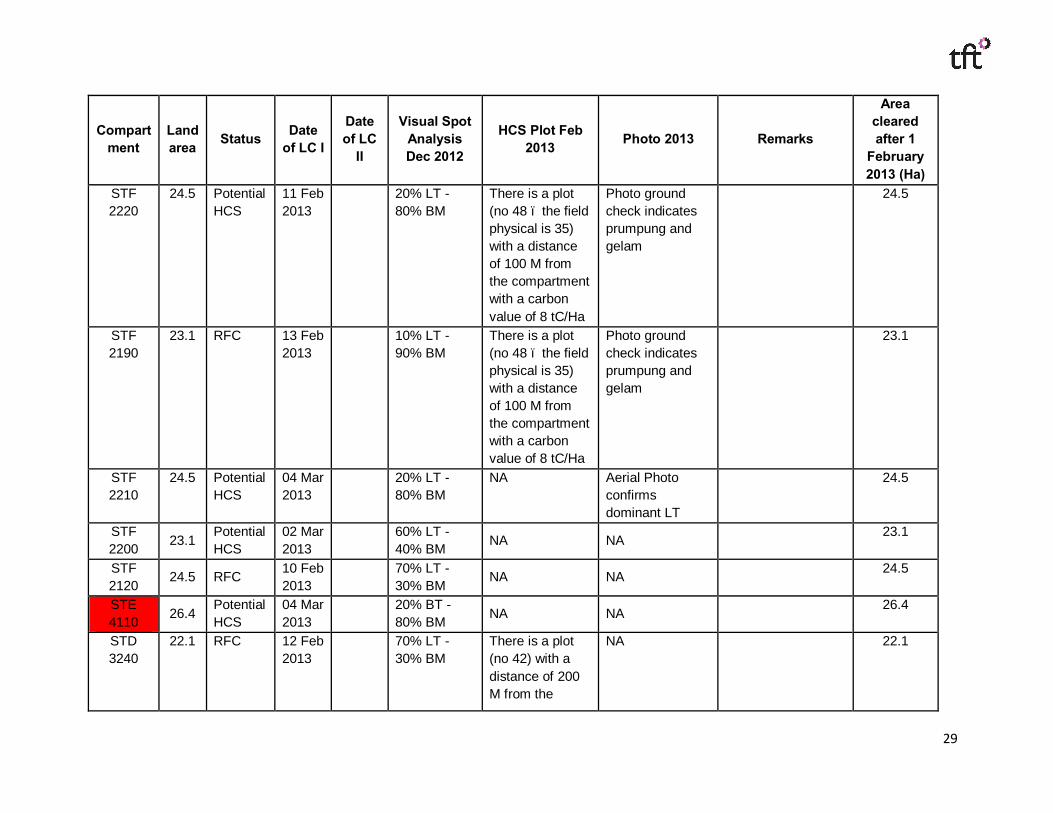
29
Compartment
Land area Status Date
of LC I
Date of LC
II
Visual Spot Analysis Dec 2012
HCS Plot Feb 2013 Photo 2013 Remarks
Area cleared after 1
February 2013 (Ha)
STF 2220
24.5 Potential HCS
11 Feb 2013
20% LT - 80% BM
There is a plot (no 48 – the field physical is 35) with a distance of 100 M from the compartment with a carbon value of 8 tC/Ha
Photo ground check indicates prumpung and gelam
24.5
STF 2190
23.1 RFC 13 Feb 2013
10% LT - 90% BM
There is a plot (no 48 – the field physical is 35) with a distance of 100 M from the compartment with a carbon value of 8 tC/Ha
Photo ground check indicates prumpung and gelam
23.1
STF 2210
24.5 Potential HCS
04 Mar 2013
20% LT - 80% BM
NA Aerial Photo confirms dominant LT
24.5
STF 2200 23.1
Potential HCS
02 Mar 2013
60% LT - 40% BM NA NA
23.1
STF 2120
24.5 RFC 10 Feb 2013
70% LT - 30% BM
NA NA 24.5
STE 4110 26.4
Potential HCS
04 Mar 2013
20% BT - 80% BM NA NA
26.4
STD 3240
22.1 RFC 12 Feb 2013
70% LT - 30% BM
There is a plot (no 42) with a distance of 200 M from the
NA 22.1

30
Compartment
Land area Status Date
of LC I
Date of LC
II
Visual Spot Analysis Dec 2012
HCS Plot Feb 2013 Photo 2013 Remarks
Area cleared after 1
February 2013 (Ha)
compartment with a carbon value of 11tC/Ha
STD 4040
20.8 RFC 12 Feb 2013
70% LT - 30% BM
There is a plot (no 42) with a distance of 200 M from the compartment with a carbon value of 11 tC/Ha
Aerial Photo confirms dominant land preparation
20.8
STD 4170
22.8 RFC 12 Feb 2013
10% LT - 90% BM
NA Aerial Photo indicates BM and LT
22.8
STD 4240
22.4 Potential HCS
12 Feb 2013
100% BM NA Aerial Photo indicates BM
22.4
31
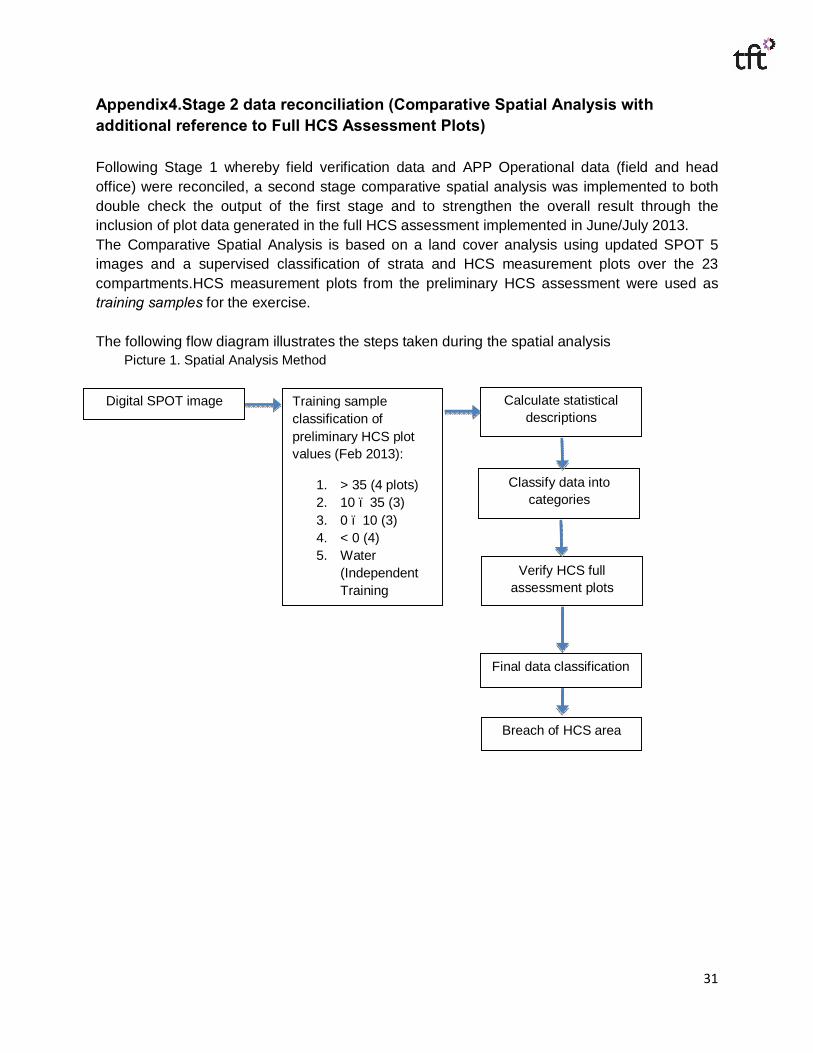
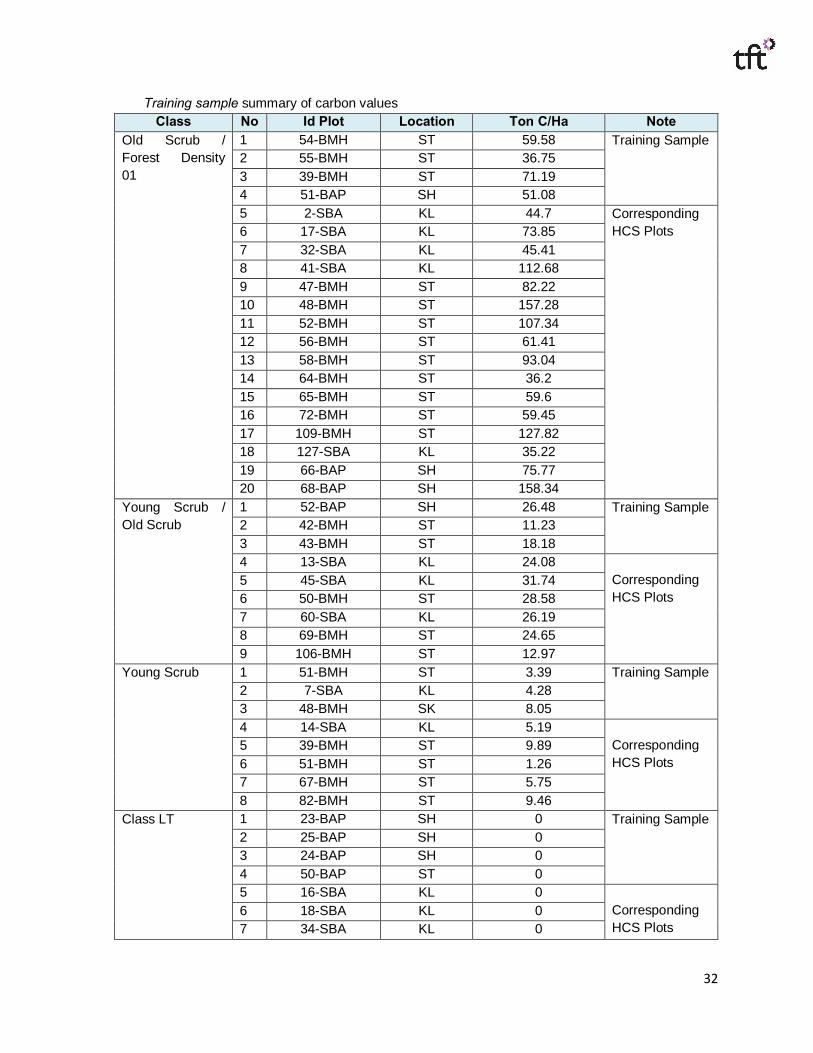
Appendix4.Stage 2 data reconciliation (Comparative Spatial Analysis with additional reference to Full HCS Assessment Plots) Following Stage 1 whereby field verification data and APP Operational data (field and head office) were reconciled, a second stage comparative spatial analysis was implemented to both double check the output of the first stage and to strengthen the overall result through the inclusion of plot data generated in the full HCS assessment implemented in June/July 2013. The Comparative Spatial Analysis is based on a land cover analysis using updated SPOT 5 images and a supervised classification of strata and HCS measurement plots over the 23 compartments.HCS measurement plots from the preliminary HCS assessment were used as training samples for the exercise. The following flow diagram illustrates the steps taken during the spatial analysis
Picture 1. Spatial Analysis Method
Training sample classification of preliminary HCS plot values (Feb 2013):
1. > 35 (4 plots) 2. 10 – 35 (3) 3. 0 – 10 (3) 4. < 0 (4) 5. Water
(Independent Training
Digital SPOT image Calculate statistical descriptions
Classify data into categories
Verify HCS full assessment plots
Final data classification
Breach of HCS area
32
Training sample summary of carbon values Class No Id Plot Location Ton C/Ha Note
Old Scrub / Forest Density 01
1 54-BMH ST 59.58 Training Sample 2 55-BMH ST 36.75 3 39-BMH ST 71.19 4 51-BAP SH 51.08 5 2-SBA KL 44.7 Corresponding
HCS Plots 6 17-SBA KL 73.85 7 32-SBA KL 45.41 8 41-SBA KL 112.68 9 47-BMH ST 82.22 10 48-BMH ST 157.28 11 52-BMH ST 107.34 12 56-BMH ST 61.41 13 58-BMH ST 93.04 14 64-BMH ST 36.2 15 65-BMH ST 59.6 16 72-BMH ST 59.45 17 109-BMH ST 127.82 18 127-SBA KL 35.22 19 66-BAP SH 75.77 20 68-BAP SH 158.34
Young Scrub / Old Scrub
1 52-BAP SH 26.48 Training Sample 2 42-BMH ST 11.23 3 43-BMH ST 18.18 4 13-SBA KL 24.08
Corresponding HCS Plots
5 45-SBA KL 31.74 6 50-BMH ST 28.58 7 60-SBA KL 26.19 8 69-BMH ST 24.65 9 106-BMH ST 12.97
Young Scrub 1 51-BMH ST 3.39 Training Sample 2 7-SBA KL 4.28 3 48-BMH SK 8.05 4 14-SBA KL 5.19
Corresponding HCS Plots
5 39-BMH ST 9.89 6 51-BMH ST 1.26 7 67-BMH ST 5.75 8 82-BMH ST 9.46
Class LT 1 23-BAP SH 0 Training Sample
2 25-BAP SH 0 3 24-BAP SH 0 4 50-BAP ST 0 5 16-SBA KL 0
Corresponding HCS Plots
6 18-SBA KL 0 7 34-SBA KL 0

33
Class No Id Plot Location Ton C/Ha Note 8 44-SBA KL 0 9 107-SBA KL 0 10 108-SBA KL 0 11 129-SBA KL 0 12 130-SBA KL 0 13 49-BAP SH 0 14 49-BAP SH 0 15 54-BAP SH 0 16 55-BAP SH 0 17 118-BAP SH 0 18 134-BAP SH 0 19 135-BAP SH 0
Water Use 5 independent training samples (at the canals)
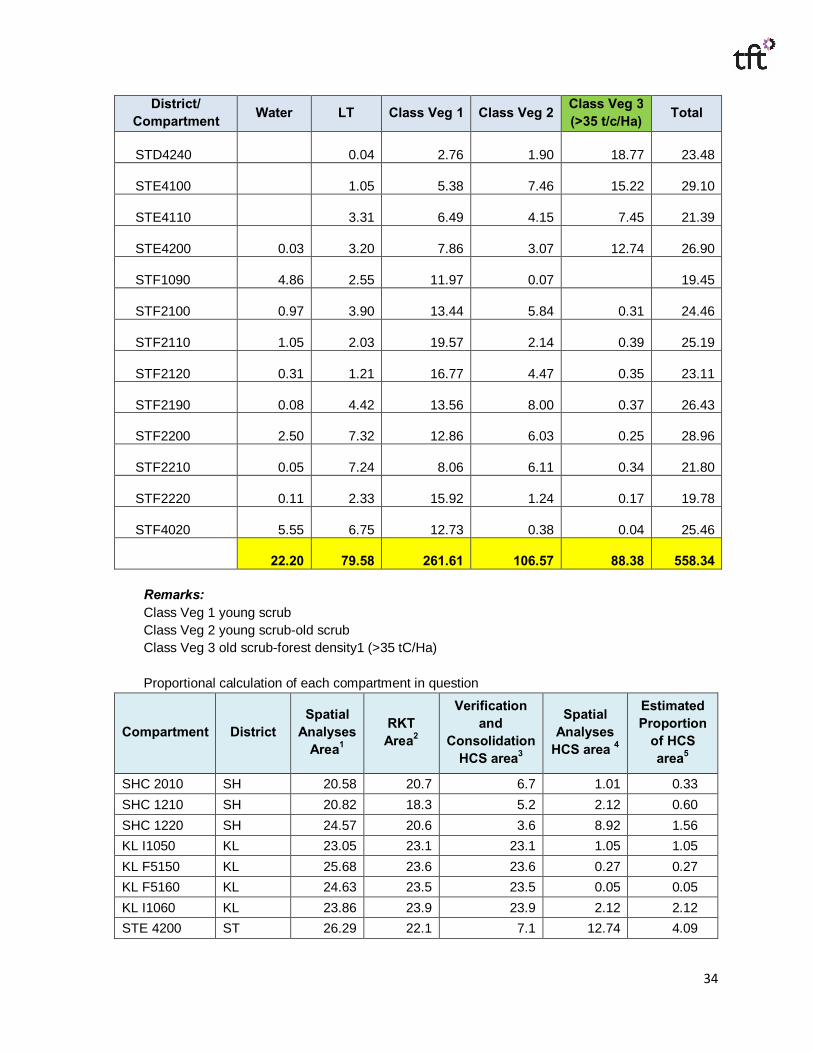
Based on the Supervised Classification, the total area containing HCS was estimated to be 88.38Ha (Table 7). Through further portioning between the verification and consolidation data and spatial data analysis (Table 8) it can be concluded that the final HCS area cleared after the 1stof February 2013 is 69.45 Ha.
Land cover distribution of each compartment in question District/
Compartment Water LT Class Veg 1 Class Veg 2 Class Veg 3 (>35 t/c/Ha) Total
Kuala Lumpur 4.57
16.15
58.95
17.04
3.48 100.20
KLF5150 1.52
5.37
13.35
4.15
0.27 24.66
KLF5160 2.69 4.61
14.05
4.25 0.05 25.66
KLI1050 0.19
4.45
14.98
3.56
1.05 24.24
KLI1060 0.17 1.72
16.56
5.07
2.12 25.64
Simpang Heran 1.16
14.19
19.11
20.31
12.17 66.93
SHC1210 0.43
1.20
7.31
10.04
2.23 21.22
SHC1220 0.21
0.19
7.44
7.47
8.92 24.23
SHC2010 0.51
12.79
4.35
2.81
1.01 21.48
Simpang Tiga 16.47
49.24 183.56
69.22 72.72 391.22
STD3240 0.87
2.45
15.30
4.47
2.16 25.25 STD4040
0.03 0.83 16.18 6.85 0.74
24.63
STD4170 0.05 0.62 4.71
7.03 13.42 25.83
34
District/ Compartment Water LT Class Veg 1 Class Veg 2 Class Veg 3
(>35 t/c/Ha) Total
STD4240
0.04
2.76
1.90
18.77 23.48
STE4100
1.05
5.38
7.46
15.22 29.10
STE4110
3.31
6.49
4.15
7.45 21.39
STE4200 0.03
3.20
7.86
3.07
12.74 26.90
STF1090 4.86
2.55
11.97
0.07 19.45 STF2100 0.97 3.90 13.44 5.84 0.31 24.46
STF2110 1.05
2.03
19.57
2.14
0.39 25.19
STF2120 0.31
1.21
16.77
4.47
0.35 23.11
STF2190 0.08
4.42
13.56
8.00
0.37 26.43
STF2200 2.50
7.32
12.86
6.03
0.25 28.96
STF2210 0.05
7.24
8.06
6.11
0.34 21.80
STF2220 0.11
2.33
15.92
1.24
0.17 19.78
STF4020 5.55
6.75
12.73
0.38
0.04 25.46
22.20
79.58
261.61
106.57
88.38 558.34 Remarks: Class Veg 1 young scrub Class Veg 2 young scrub-old scrub Class Veg 3 old scrub-forest density1 (>35 tC/Ha) Proportional calculation of each compartment in question
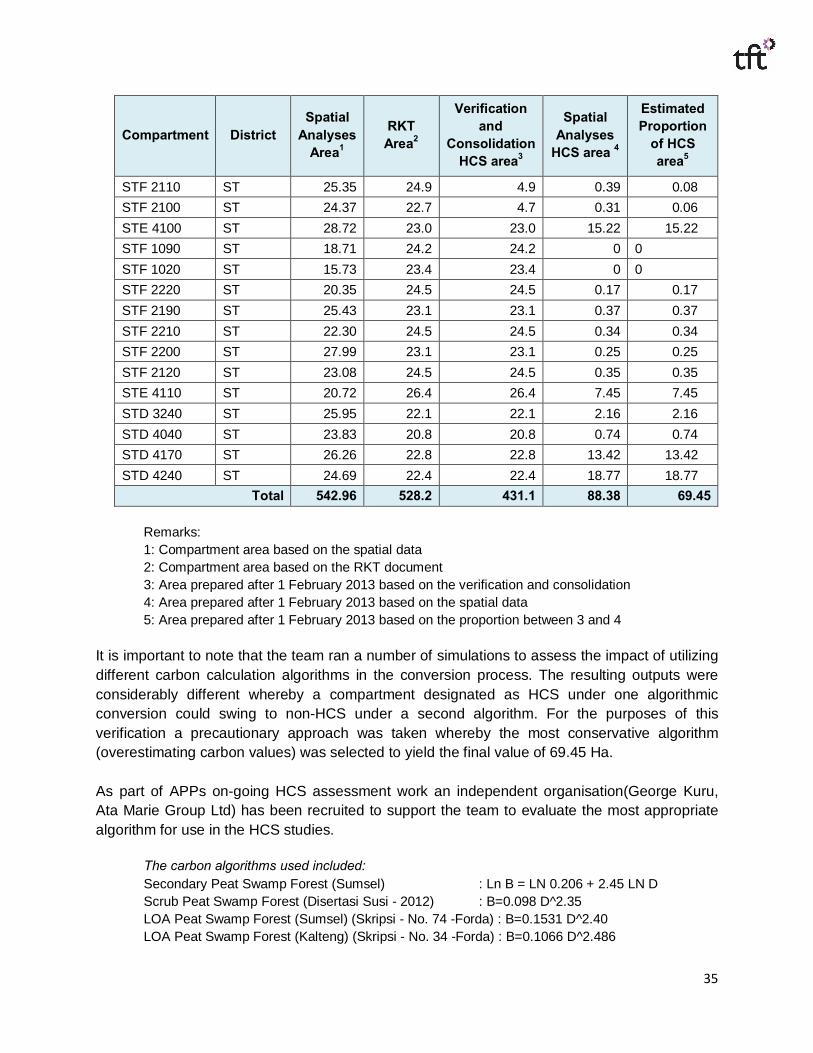
Compartment District Spatial
Analyses Area1
RKT Area2
Verification and
Consolidation HCS area3
Spatial Analyses
HCS area 4
Estimated Proportion
of HCS area5
SHC 2010 SH 20.58 20.7 6.7 1.01 0.33 SHC 1210 SH 20.82 18.3 5.2 2.12 0.60 SHC 1220 SH 24.57 20.6 3.6 8.92 1.56 KL I1050 KL 23.05 23.1 23.1 1.05 1.05 KL F5150 KL 25.68 23.6 23.6 0.27 0.27 KL F5160 KL 24.63 23.5 23.5 0.05 0.05 KL I1060 KL 23.86 23.9 23.9 2.12 2.12 STE 4200 ST 26.29 22.1 7.1 12.74 4.09
35
Compartment District Spatial
Analyses Area1
RKT Area2
Verification and
Consolidation HCS area3
Spatial Analyses
HCS area 4
Estimated Proportion
of HCS area5
STF 2110 ST 25.35 24.9 4.9 0.39 0.08 STF 2100 ST 24.37 22.7 4.7 0.31 0.06 STE 4100 ST 28.72 23.0 23.0 15.22 15.22 STF 1090 ST 18.71 24.2 24.2 0 0 STF 1020 ST 15.73 23.4 23.4 0 0 STF 2220 ST 20.35 24.5 24.5 0.17 0.17 STF 2190 ST 25.43 23.1 23.1 0.37 0.37 STF 2210 ST 22.30 24.5 24.5 0.34 0.34 STF 2200 ST 27.99 23.1 23.1 0.25 0.25 STF 2120 ST 23.08 24.5 24.5 0.35 0.35 STE 4110 ST 20.72 26.4 26.4 7.45 7.45 STD 3240 ST 25.95 22.1 22.1 2.16 2.16 STD 4040 ST 23.83 20.8 20.8 0.74 0.74 STD 4170 ST 26.26 22.8 22.8 13.42 13.42 STD 4240 ST 24.69 22.4 22.4 18.77 18.77
Total 542.96 528.2 431.1 88.38 69.45 Remarks: 1: Compartment area based on the spatial data 2: Compartment area based on the RKT document 3: Area prepared after 1 February 2013 based on the verification and consolidation 4: Area prepared after 1 February 2013 based on the spatial data 5: Area prepared after 1 February 2013 based on the proportion between 3 and 4
It is important to note that the team ran a number of simulations to assess the impact of utilizing different carbon calculation algorithms in the conversion process. The resulting outputs were considerably different whereby a compartment designated as HCS under one algorithmic conversion could swing to non-HCS under a second algorithm. For the purposes of this verification a precautionary approach was taken whereby the most conservative algorithm (overestimating carbon values) was selected to yield the final value of 69.45 Ha. As part of APPs on-going HCS assessment work an independent organisation(George Kuru, Ata Marie Group Ltd) has been recruited to support the team to evaluate the most appropriate algorithm for use in the HCS studies.
The carbon algorithms used included: Secondary Peat Swamp Forest (Sumsel) : Ln B = LN 0.206 + 2.45 LN D Scrub Peat Swamp Forest (Disertasi Susi - 2012) : B=0.098 D^2.35 LOA Peat Swamp Forest (Sumsel) (Skripsi - No. 74 -Forda) : B=0.1531 D^2.40 LOA Peat Swamp Forest (Kalteng) (Skripsi - No. 34 -Forda) : B=0.1066 D^2.486
36
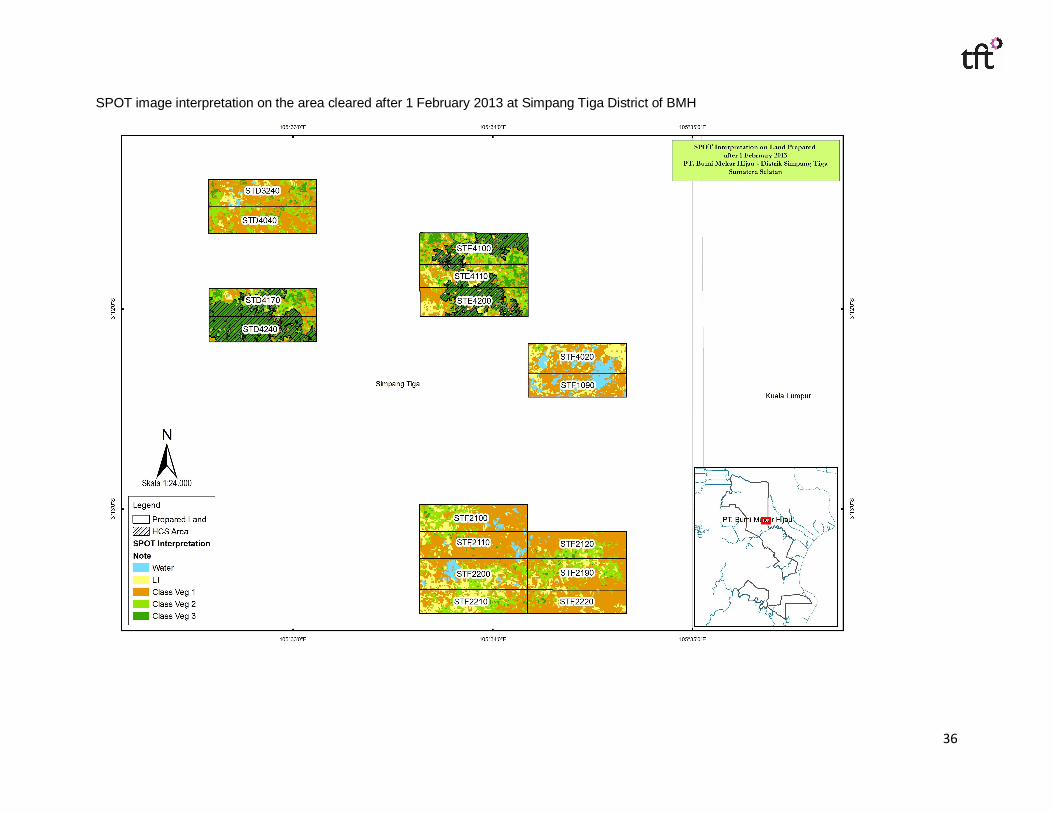
SPOT image interpretation on the area cleared after 1 February 2013 at Simpang Tiga District of BMH
37
SPOT image interpretation on the area cleared after 1 February 2013 at Simpang Heran District of BAP
38
SPOT image interpretation on the area cleared after 1 February 2013 at Kuala Lumpur District of SBA

39
Appendix 5. Field Verification related to the alleged breach in South Sumatra A. Implementation of the Verification
1. Date and Implementers of the Verification The verification was conducted from the 23rd to the 27th of July 2013.The Field Verification Team was comprised of:
- Yudi Purnomo (TFT) - Abidin Lakadimu (TFT) - Ihwan Rafina (TFT)
The Supplier Resource Team was comprised of:
- Baron Y. Setiawan (PMD Region of Palembang) - Muhammad Rozi (PMD Region of Palembang) - Iyus Yusuf (PMD Region of Palembang) - Sudadi (PMD Region of Palembang) - Kgs. M. Iqbal (PMD Region of Palembang) - Iwan Zalkashi (DM Simpang Tiga) - Madenin (PSD Simpang Tiga) - Rahmat Muda Kelana Madenin (Project Leader I Simpang Tiga District) - Alpison (Project Leader of Simpang Heran District) - Hendri (PSD Kuala Lumpur) - M. Fahmi (PH Kuala Lumpur District) - Ruli Kurniawan (DM Sungai Ketupak) - Rudi Susanto (PSD Sungai Ketupak) - Supriansyah (PTU Sungai Ketupak)
2. Document Verification
A document review was conducted to understand the chronology of events. The FVT accompanied by staff from each District conducted the document reviews.
Following the natural forest clearance moratorium commitment made by the APP on the 31st of January 2013, the FOD (Head of the Region) of Palembang sent an Internal Office Memo No. Reg: FOD-2013-I-005 and the Moratorium Protocol to forest operators in all Districts and Supporting Departments through email. The FOD also requested forest operators/contractors in all Districts to stop all operational activity of new land preparation.

40
After the HCS/HCV/peat preliminary assessment, the Planning Department in the Office of the Region of Palembang developed an operational map named “RKT 2013 Recommendation Map” based on The FCP Implementation Team Map illustrating the result of the HCV and HCS preliminary assessment on RKT 2013 and associated “Go” and “No Go” areas. This “RKT 2013 Recommendation Map” was sent to forest operators in all the Districts on the 8th of February 2013 through email.
a. SBA
1. Kuala Lumpur District
A verification process was conducted on the following documents related to the land preparation in operational areas subject to the pre-assessments(HCS/HCV/peatland) on RKT 2013.
v RKT
RKT 2013 was approved by the SBA Chief Director according to SK.093/SBAWI/XII/2012 dated on the 10th of December 2012. RKT 2013 is valid from the 1st of January 2013 until the 31st of December 2013, a total land area of 2,606 Ha. Land allocation in SBA according to the approved 2013 RKT
Company District Land Area
Remarks Lay out (Ha)
(Ha) TP TU TK KL
SBA Kuala Lumpur 30,754
Plan 13,505 6,848 4,397 4,278
Realization 5,036 0 0 0
In the SBA RKT 2013 document, the activity plan for all districts include the following:
• The land preparation plan on bare land, including former harvested areas is
8,353.23 Ha. • The planting plan on bare land, including former harvested areas in the areas:
- Main Plants : 7,869 Ha - Indigenous Species Plants : 100 Ha - Livelihood Plants : 400 Ha
v On the 8th of February 2013, despite the distribution of the “RKT 2013 Recommendation Map” and Moratorium Protocol being sent to the Kuala
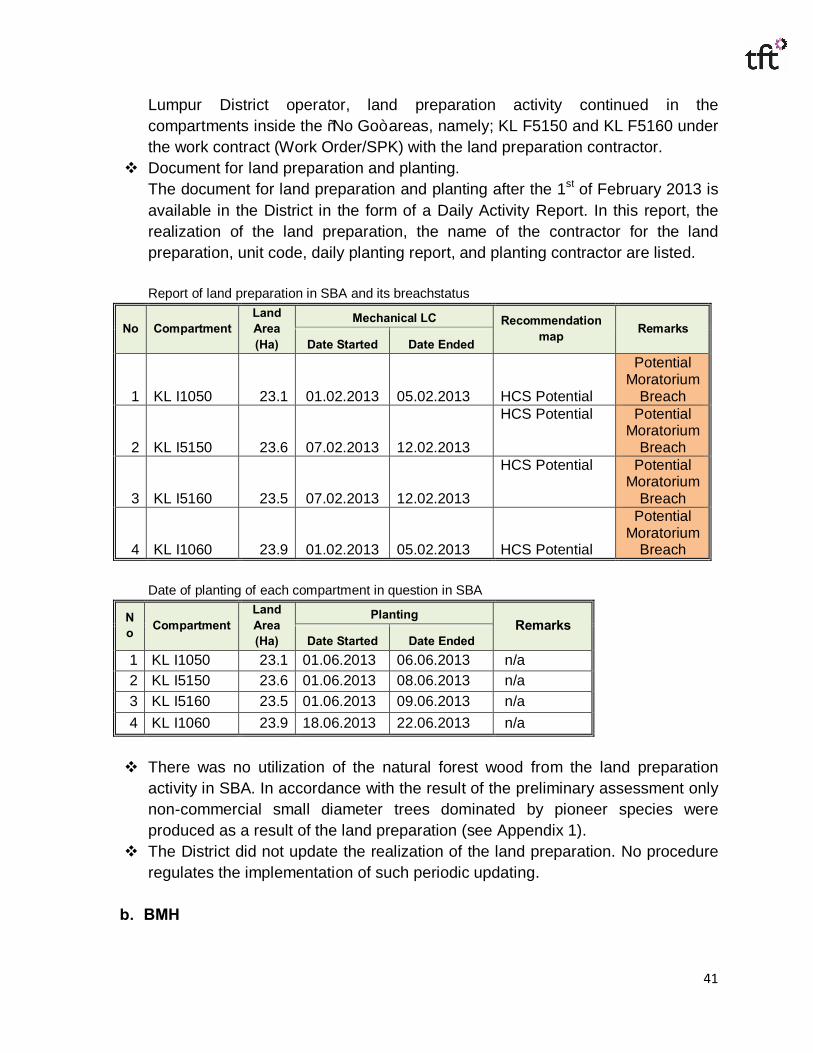
41
Lumpur District operator, land preparation activity continued in the compartments inside the “No Go” areas, namely; KL F5150 and KL F5160 under the work contract (Work Order/SPK) with the land preparation contractor.
v Document for land preparation and planting. The document for land preparation and planting after the 1st of February 2013 is available in the District in the form of a Daily Activity Report. In this report, the realization of the land preparation, the name of the contractor for the land preparation, unit code, daily planting report, and planting contractor are listed. Report of land preparation in SBA and its breachstatus
No Compartment Land Area (Ha)
Mechanical LC Recommendation map Remarks
Date Started Date Ended
1 KL I1050 23.1 01.02.2013 05.02.2013 HCS Potential
Potential Moratorium
Breach
2 KL I5150 23.6 07.02.2013 12.02.2013
HCS Potential Potential Moratorium
Breach
3 KL I5160 23.5 07.02.2013 12.02.2013
HCS Potential Potential Moratorium
Breach
4 KL I1060 23.9 01.02.2013 05.02.2013 HCS Potential
Potential Moratorium
Breach Date of planting of each compartment in question in SBA
No Compartment
Land Area (Ha)
Planting Remarks
Date Started Date Ended 1 KL I1050 23.1 01.06.2013 06.06.2013 n/a 2 KL I5150 23.6 01.06.2013 08.06.2013 n/a 3 KL I5160 23.5 01.06.2013 09.06.2013 n/a 4 KL I1060 23.9 18.06.2013 22.06.2013 n/a
v There was no utilization of the natural forest wood from the land preparation
activity in SBA. In accordance with the result of the preliminary assessment only non-commercial small diameter trees dominated by pioneer species were produced as a result of the land preparation (see Appendix 1).
v The District did not update the realization of the land preparation. No procedure regulates the implementation of such periodic updating.
b. BMH
42
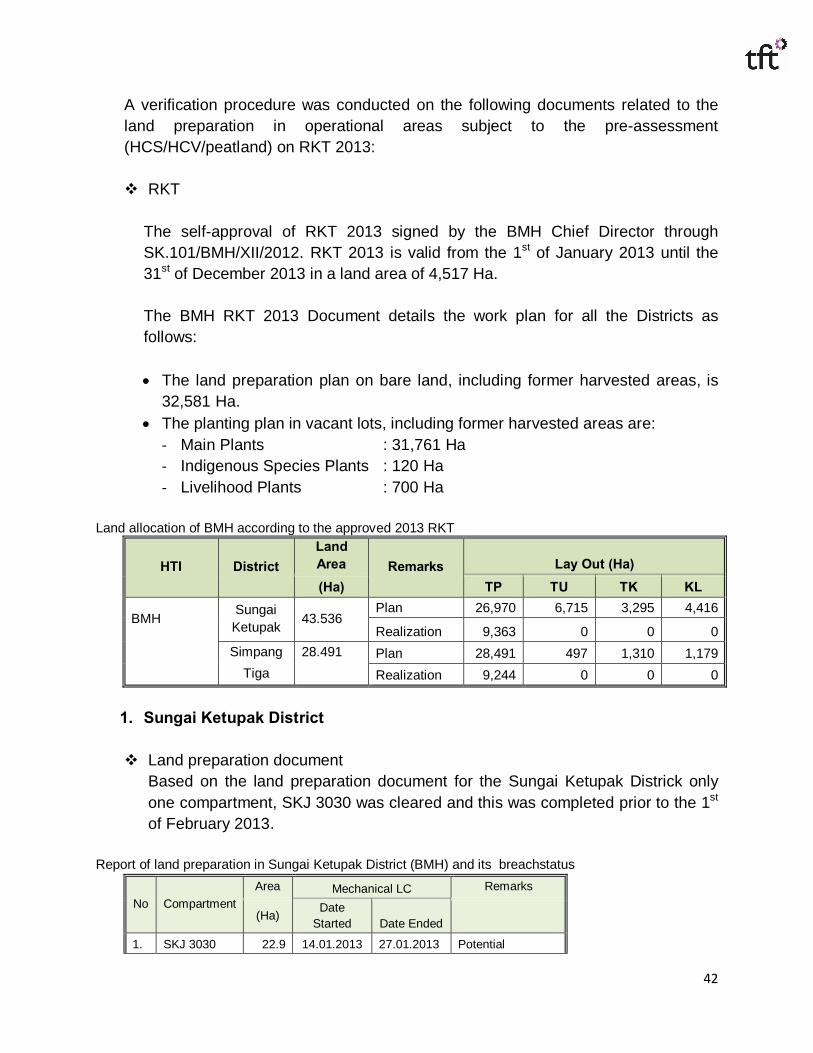
A verification procedure was conducted on the following documents related to the land preparation in operational areas subject to the pre-assessment (HCS/HCV/peatland) on RKT 2013: v RKT
The self-approval of RKT 2013 signed by the BMH Chief Director through SK.101/BMH/XII/2012. RKT 2013 is valid from the 1st of January 2013 until the 31st of December 2013 in a land area of 4,517 Ha. The BMH RKT 2013 Document details the work plan for all the Districts as follows: • The land preparation plan on bare land, including former harvested areas, is
32,581 Ha. • The planting plan in vacant lots, including former harvested areas are:
- Main Plants : 31,761 Ha - Indigenous Species Plants : 120 Ha - Livelihood Plants : 700 Ha
Land allocation of BMH according to the approved 2013 RKT
HTI District Land Area Remarks Lay Out (Ha) (Ha) TP TU TK KL
BMH Sungai Ketupak 43.536
Plan 26,970 6,715 3,295 4,416
Realization 9,363 0 0 0
Simpang 28.491 Plan 28,491 497 1,310 1,179
Tiga
Realization 9,244 0 0 0
1. Sungai Ketupak District
v Land preparation document
Based on the land preparation document for the Sungai Ketupak Districk only one compartment, SKJ 3030 was cleared and this was completed prior to the 1st of February 2013.
Report of land preparation in Sungai Ketupak District (BMH) and its breachstatus
No Compartment Area Mechanical LC Remarks
(Ha) Date Started Date Ended
1. SKJ 3030 22.9 14.01.2013 27.01.2013 Potential
43
Moratorium Breach
v The District did not update the realization of the land preparation. No procedure
regulates the implementation of such updating.
2. Simpang Tiga District v On the 8th of February 2013, despite the distribution of the “RKT 2013
Recommendation Map” and Moratorium Protocol being sent to the Simpang Tiga District operator, land preparation activity continued in 16 compartments inside the “No Go” areas, under the work contract (Work Order/SPK) with the land preparation contractor.
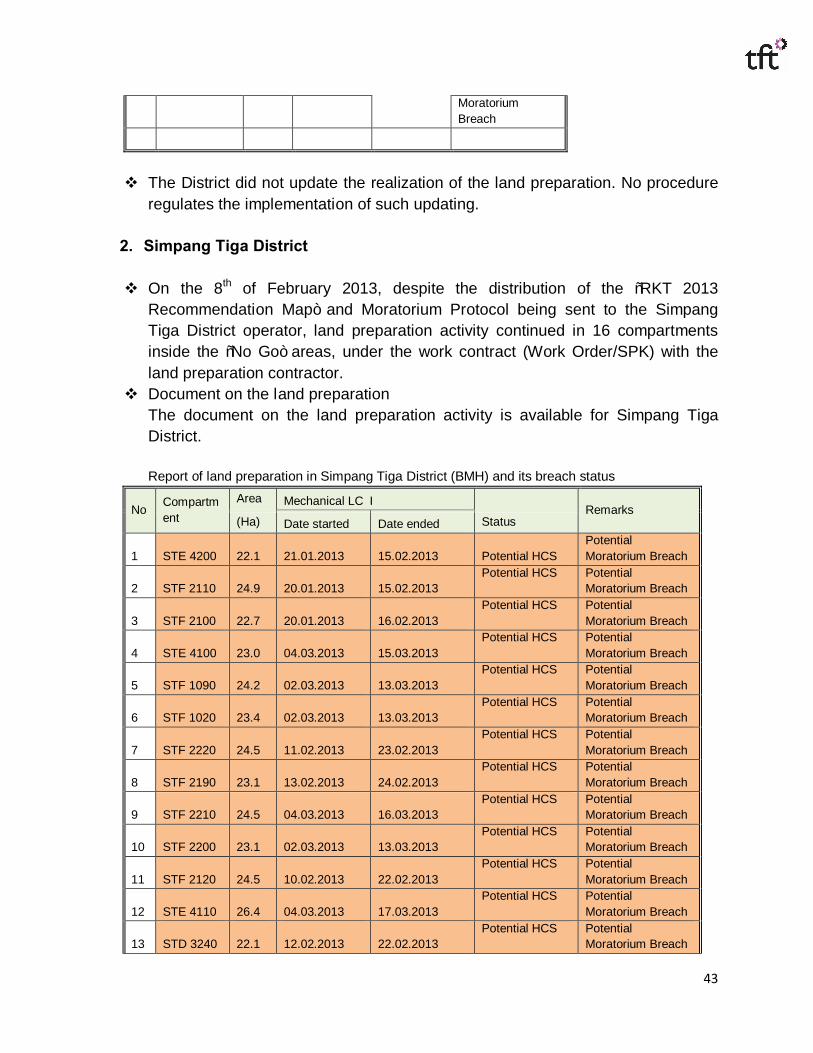
v Document on the land preparation The document on the land preparation activity is available for Simpang Tiga District. Report of land preparation in Simpang Tiga District (BMH) and its breach status
No Compartment
Area Mechanical LC I Remarks (Ha) Date started Date ended Status
1 STE 4200 22.1 21.01.2013 15.02.2013 Potential HCS Potential Moratorium Breach
2 STF 2110 24.9 20.01.2013 15.02.2013 Potential HCS Potential
Moratorium Breach
3 STF 2100 22.7 20.01.2013 16.02.2013 Potential HCS Potential
Moratorium Breach
4 STE 4100 23.0 04.03.2013 15.03.2013 Potential HCS Potential
Moratorium Breach
5 STF 1090 24.2 02.03.2013 13.03.2013 Potential HCS Potential
Moratorium Breach
6 STF 1020 23.4 02.03.2013 13.03.2013 Potential HCS Potential
Moratorium Breach
7 STF 2220 24.5 11.02.2013 23.02.2013 Potential HCS Potential
Moratorium Breach
8 STF 2190 23.1 13.02.2013 24.02.2013 Potential HCS Potential
Moratorium Breach
9 STF 2210 24.5 04.03.2013 16.03.2013 Potential HCS Potential
Moratorium Breach
10 STF 2200 23.1 02.03.2013 13.03.2013 Potential HCS Potential
Moratorium Breach
11 STF 2120 24.5 10.02.2013 22.02.2013 Potential HCS Potential
Moratorium Breach
12 STE 4110 26.4 04.03.2013 17.03.2013 Potential HCS Potential
Moratorium Breach
13 STD 3240 22.1 12.02.2013 22.02.2013 Potential HCS Potential
Moratorium Breach
44
No Compartment
Area Mechanical LC I Remarks (Ha) Date started Date ended Status
14 STD 4040 20.8 12.02.2013 21.03.2013 Potential HCS Potential
Moratorium Breach
15 STD 4170 22.8 12.02.2013 23.02.2013 Potential HCS Potential
Moratorium Breach
16 STD 4240 22.4 12.02.2013 25.02.2013 Potential HCS Potential
Moratorium Breach
v There is no utilization of the natural forest wood from the land preparation
activity in the Simpang Tiga District. According to the result of the preliminary assessment, only non-commercial species can be found in the area (see Appendix 1).
v The District did not update the realization of the land preparation. No procedure regulates the implementation of such periodic updating.
c. BAP
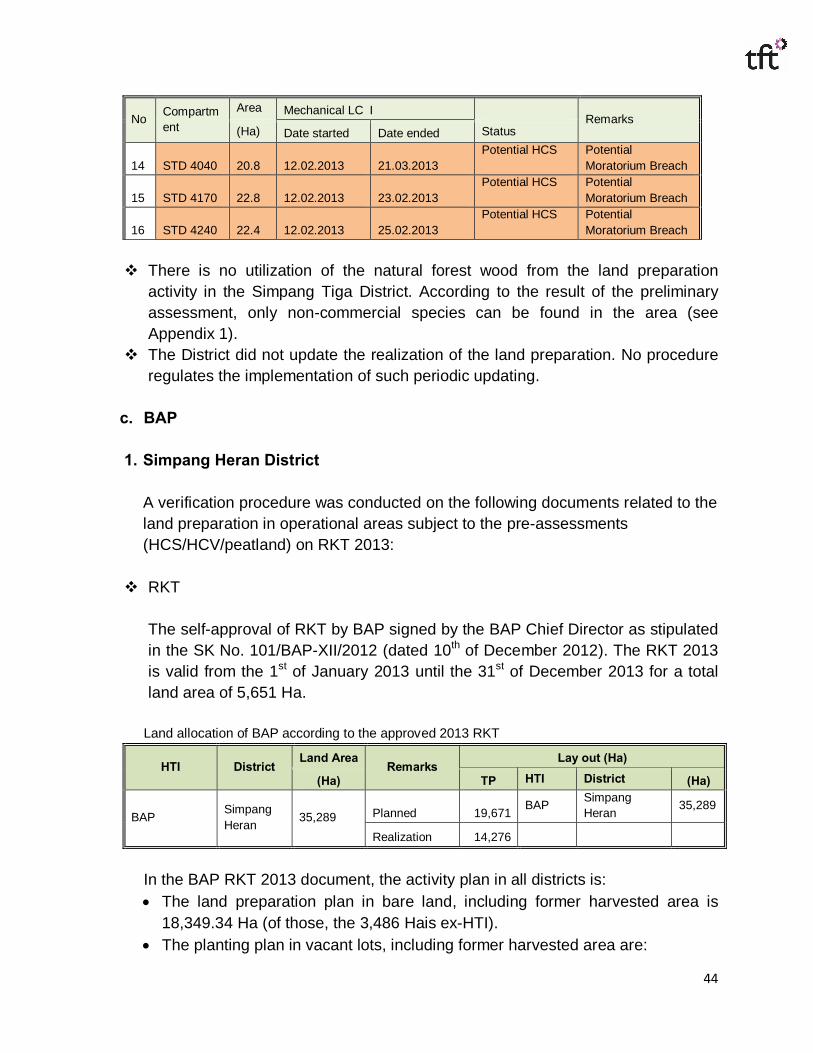
1. Simpang Heran District A verification procedure was conducted on the following documents related to the land preparation in operational areas subject to the pre-assessments (HCS/HCV/peatland) on RKT 2013:
v RKT The self-approval of RKT by BAP signed by the BAP Chief Director as stipulated in the SK No. 101/BAP-XII/2012 (dated 10th of December 2012). The RKT 2013 is valid from the 1st of January 2013 until the 31st of December 2013 for a total land area of 5,651 Ha.
Land allocation of BAP according to the approved 2013 RKT
HTI District Land Area
Remarks Lay out (Ha)
(Ha) TP HTI District (Ha)
BAP Simpang Heran 35,289 Planned 19,671 BAP Simpang
Heran 35,289
Realization 14,276 In the BAP RKT 2013 document, the activity plan in all districts is: • The land preparation plan in bare land, including former harvested area is
18,349.34 Ha (of those, the 3,486 Hais ex-HTI). • The planting plan in vacant lots, including former harvested area are:
45
- Main Plants : 16,549Ha - Indigenous Species Plants : 140 Ha - Livelihood Plants : 1,660 Ha
v Land preparation Document
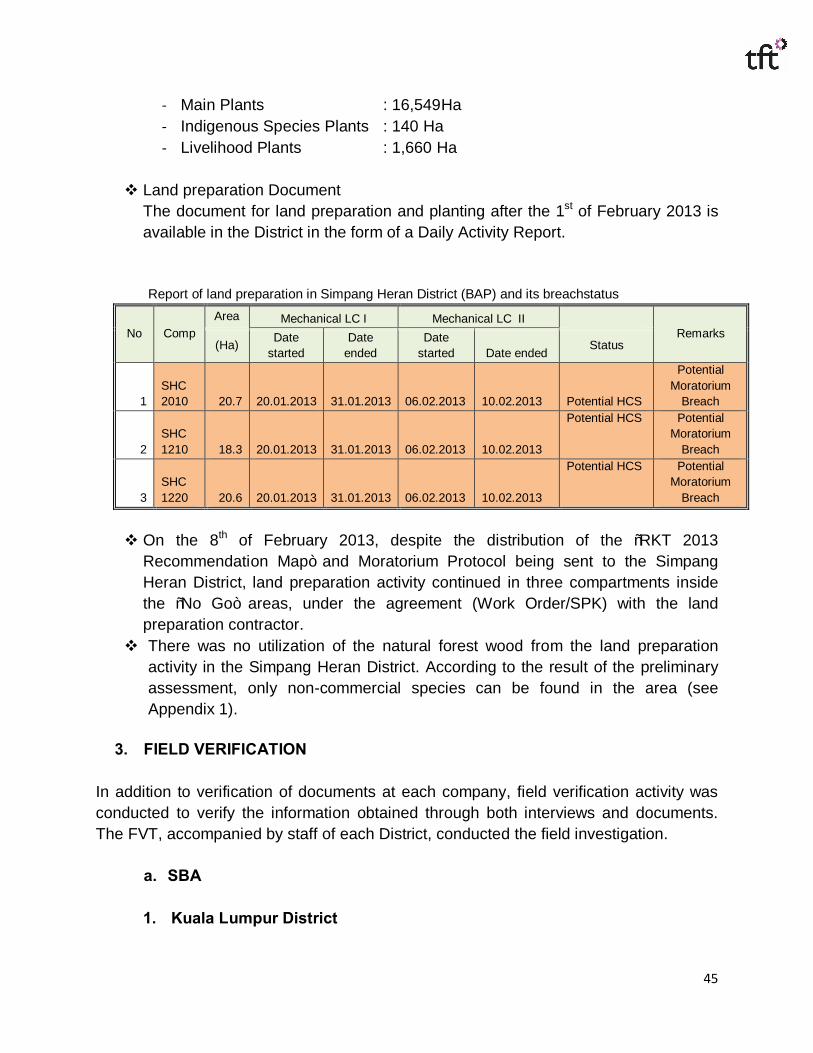
The document for land preparation and planting after the 1st of February 2013 is available in the District in the form of a Daily Activity Report. Report of land preparation in Simpang Heran District (BAP) and its breachstatus
No Comp Area Mechanical LC I Mechanical LC II
Remarks (Ha) Date
started Date
ended Date
started Date ended Status
1 SHC 2010 20.7 20.01.2013 31.01.2013 06.02.2013 10.02.2013 Potential HCS
Potential Moratorium
Breach
2 SHC 1210 18.3 20.01.2013 31.01.2013 06.02.2013 10.02.2013
Potential HCS Potential Moratorium
Breach
3 SHC 1220 20.6 20.01.2013 31.01.2013 06.02.2013 10.02.2013
Potential HCS Potential Moratorium
Breach
v On the 8th of February 2013, despite the distribution of the “RKT 2013
Recommendation Map” and Moratorium Protocol being sent to the Simpang Heran District, land preparation activity continued in three compartments inside the “No Go” areas, under the agreement (Work Order/SPK) with the land preparation contractor.
v There was no utilization of the natural forest wood from the land preparation activity in the Simpang Heran District. According to the result of the preliminary assessment, only non-commercial species can be found in the area (see Appendix 1).
3. FIELD VERIFICATION
In addition to verification of documents at each company, field verification activity was conducted to verify the information obtained through both interviews and documents. The FVT, accompanied by staff of each District, conducted the field investigation.
a. SBA 1. Kuala Lumpur District
46
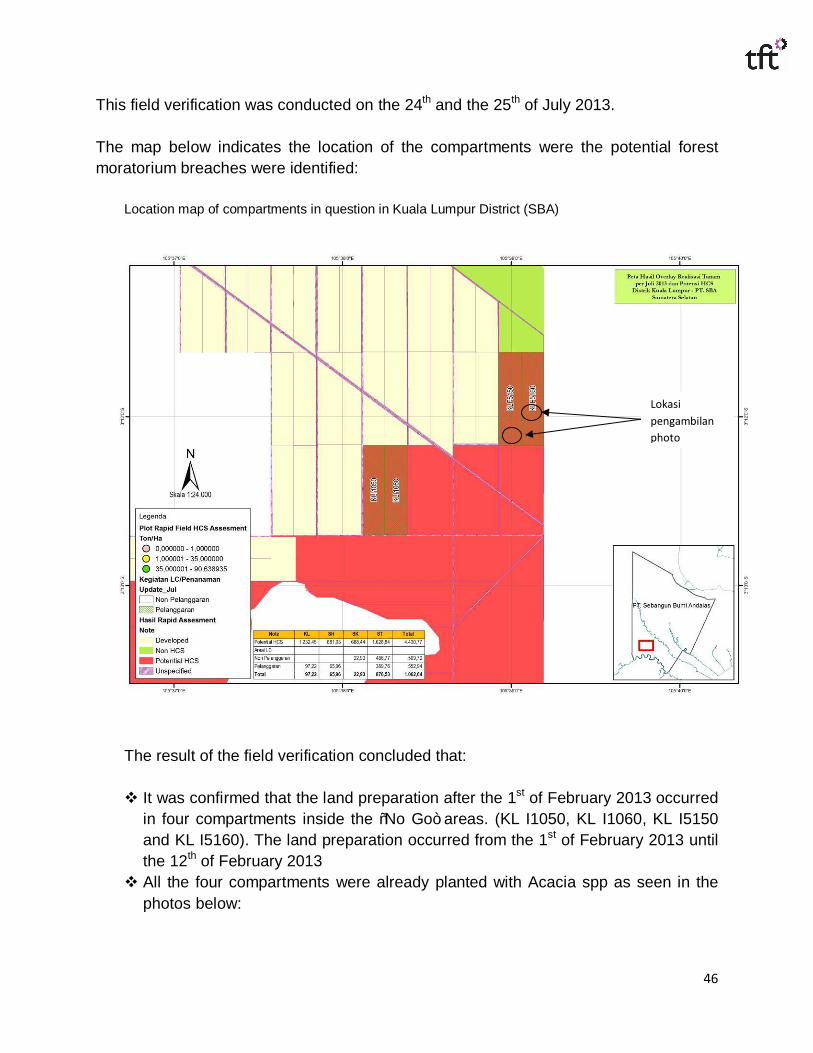
This field verification was conducted on the 24th and the 25th of July 2013.
The map below indicates the location of the compartments were the potential forest moratorium breaches were identified:
Location map of compartments in question in Kuala Lumpur District (SBA)
The result of the field verification concluded that: v It was confirmed that the land preparation after the 1st of February 2013 occurred
in four compartments inside the “No Go” areas. (KL I1050, KL I1060, KL I5150 and KL I5160). The land preparation occurred from the 1st of February 2013 until the 12th of February 2013
v All the four compartments were already planted with Acacia spp as seen in the photos below:
Lokasi pengambilan photo

47
Planted compartments in question in SBA
48
b. BMH
1. Sungai Ketupak District
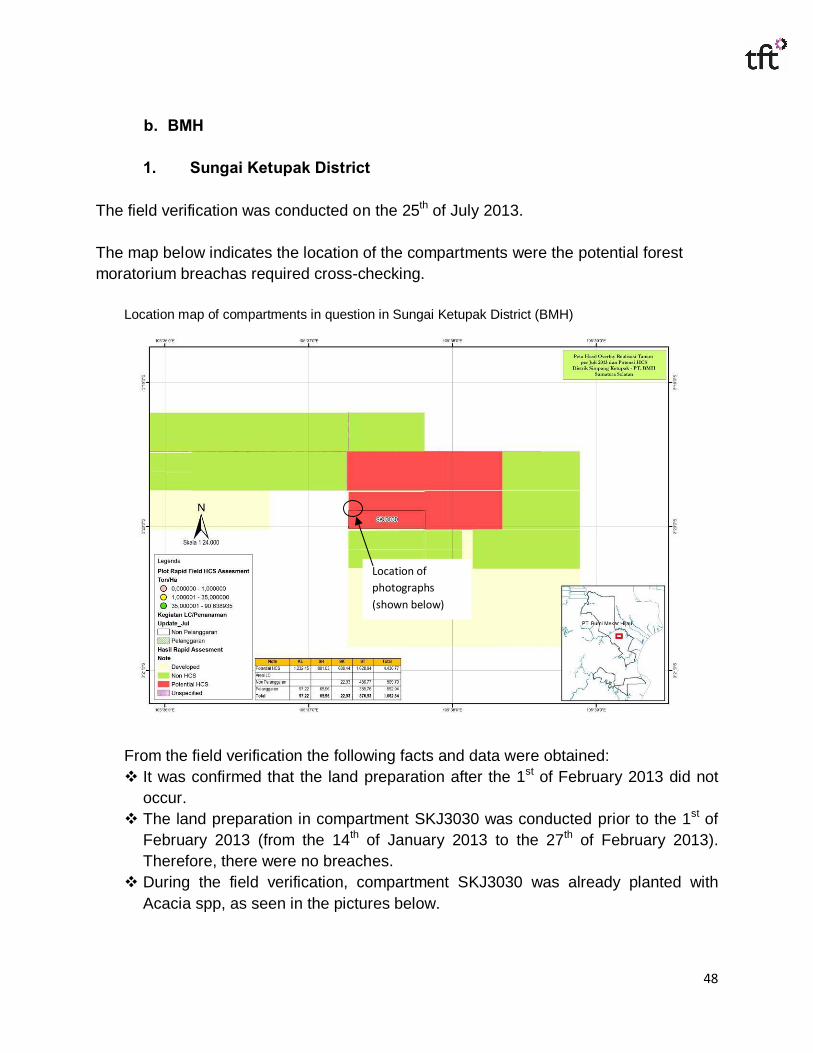
The field verification was conducted on the 25th of July 2013. The map below indicates the location of the compartments were the potential forest moratorium breachas required cross-checking.
Location map of compartments in question in Sungai Ketupak District (BMH) From the field verification the following facts and data were obtained: v It was confirmed that the land preparation after the 1st of February 2013 did not
occur. v The land preparation in compartment SKJ3030 was conducted prior to the 1st of
February 2013 (from the 14th of January 2013 to the 27th of February 2013). Therefore, there were no breaches.
v During the field verification, compartment SKJ3030 was already planted with Acacia spp, as seen in the pictures below.
Location of photographs (shown below)
49
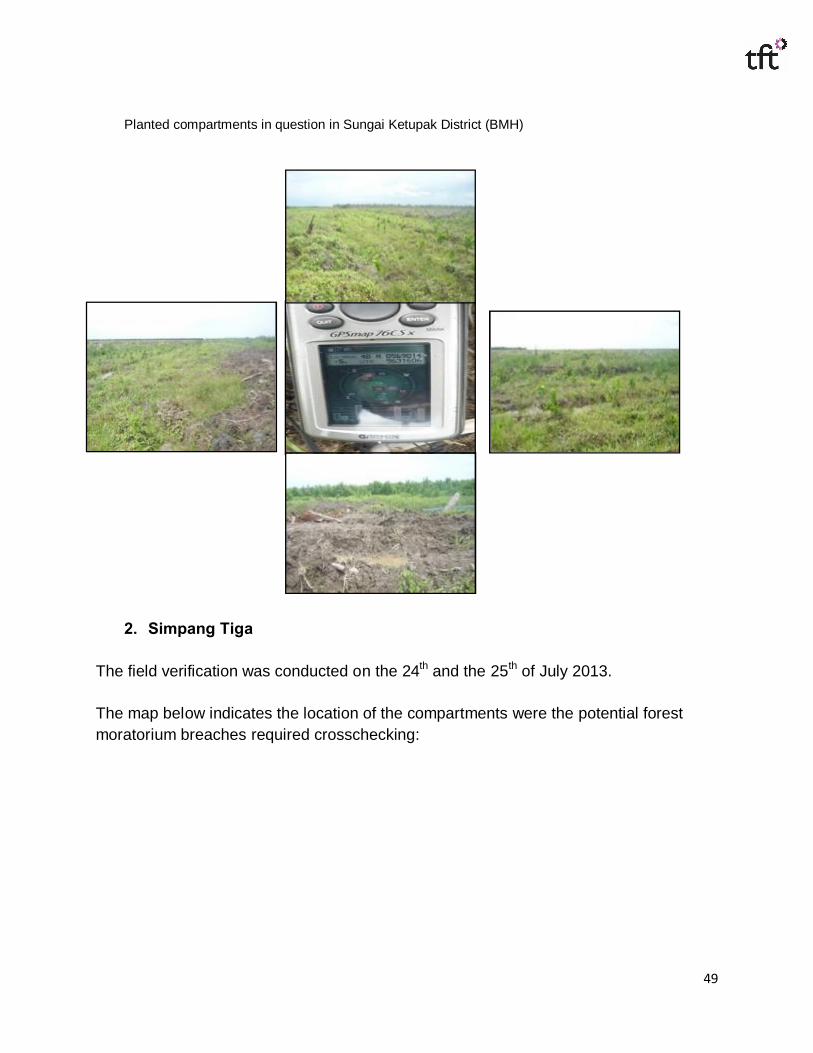
Planted compartments in question in Sungai Ketupak District (BMH)
2. Simpang Tiga
The field verification was conducted on the 24th and the 25th of July 2013.
The map below indicates the location of the compartments were the potential forest moratorium breaches required crosschecking:
50
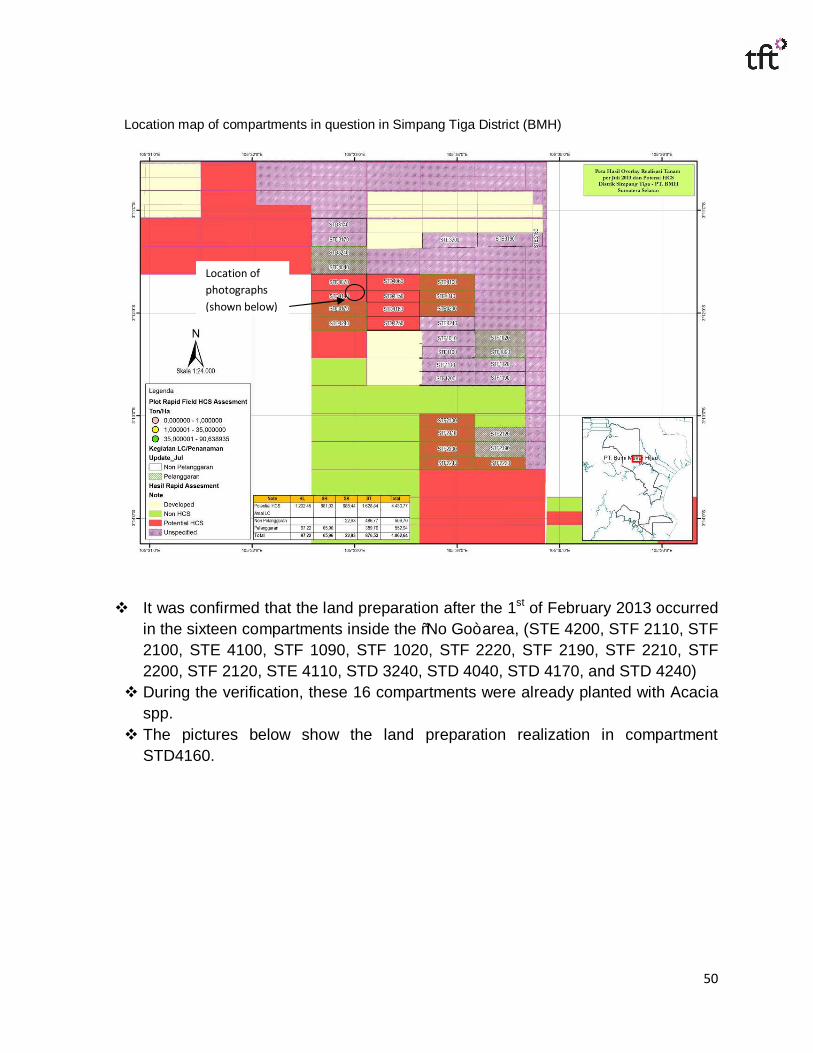
Location map of compartments in question in Simpang Tiga District (BMH) v It was confirmed that the land preparation after the 1st of February 2013 occurred
in the sixteen compartments inside the “No Go” area, (STE 4200, STF 2110, STF 2100, STE 4100, STF 1090, STF 1020, STF 2220, STF 2190, STF 2210, STF 2200, STF 2120, STE 4110, STD 3240, STD 4040, STD 4170, and STD 4240)
v During the verification, these 16 compartments were already planted with Acacia spp.
v The pictures below show the land preparation realization in compartment STD4160.
Location of photographs (shown below)
51
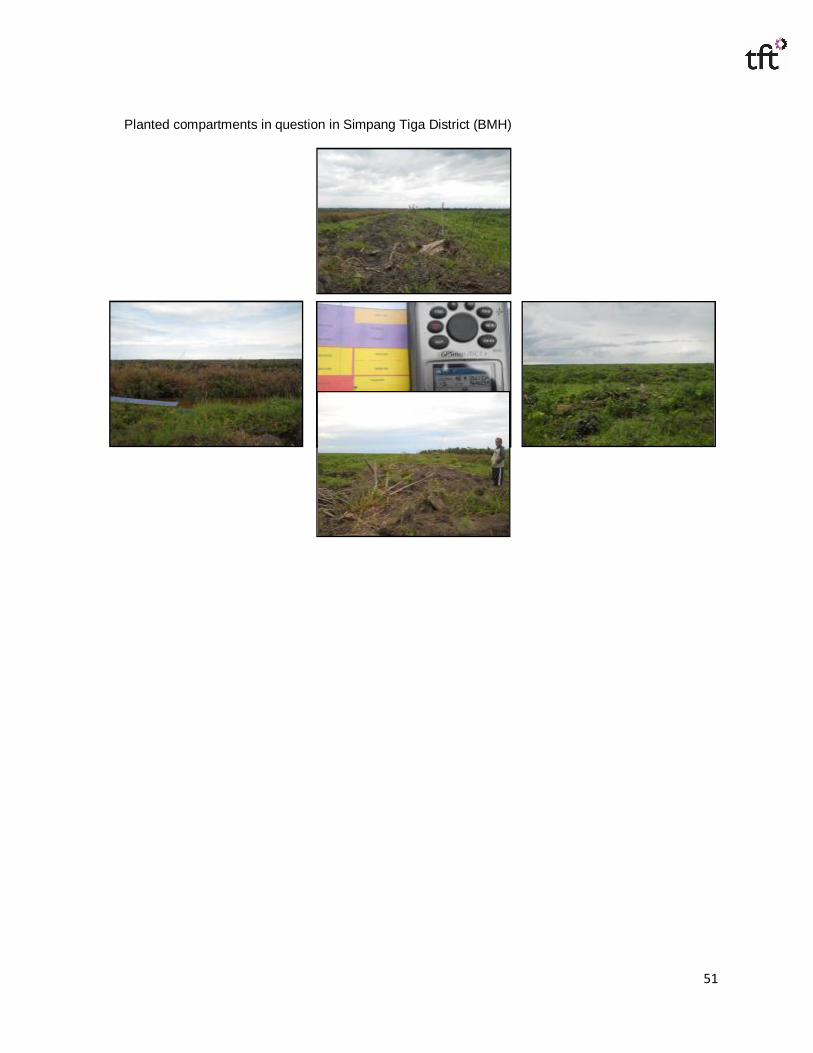
Planted compartments in question in Simpang Tiga District (BMH)
52
c. BAP
1. Simpang Heran District
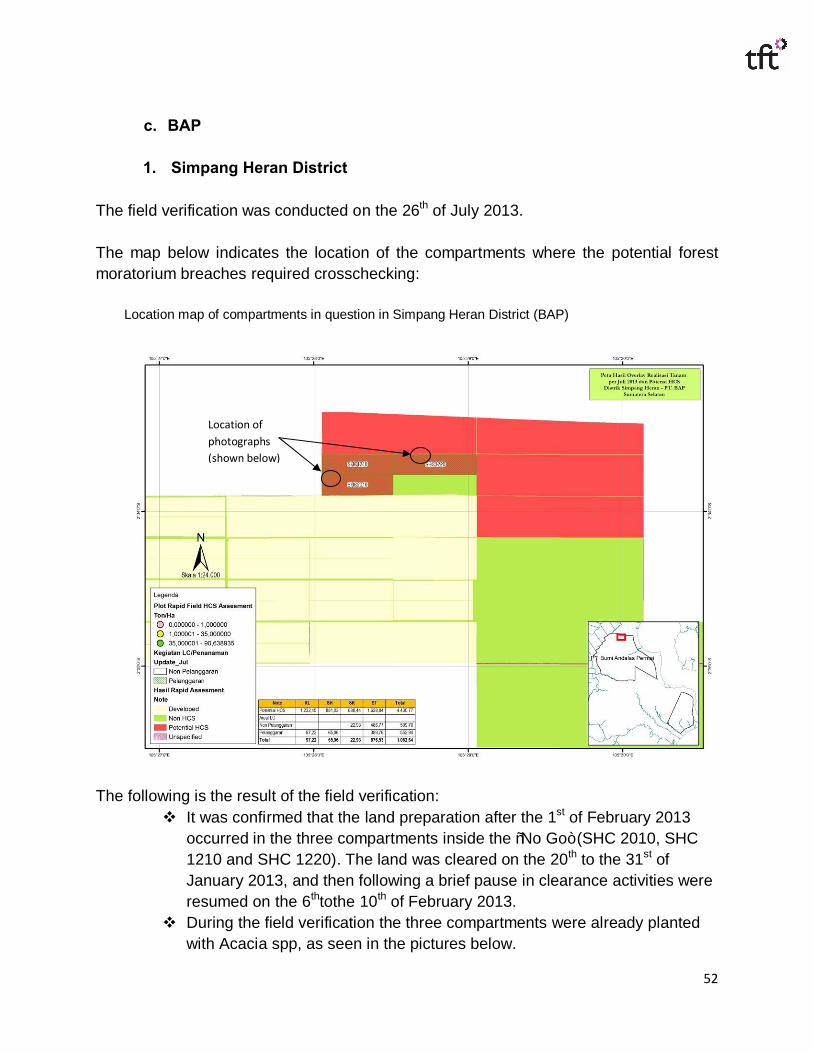
The field verification was conducted on the 26th of July 2013. The map below indicates the location of the compartments where the potential forest moratorium breaches required crosschecking:
Location map of compartments in question in Simpang Heran District (BAP)
The following is the result of the field verification:
v It was confirmed that the land preparation after the 1st of February 2013 occurred in the three compartments inside the “No Go” (SHC 2010, SHC 1210 and SHC 1220). The land was cleared on the 20th to the 31st of January 2013, and then following a brief pause in clearance activities were resumed on the 6thtothe 10th of February 2013.
v During the field verification the three compartments were already planted with Acacia spp, as seen in the pictures below.
Location of photographs (shown below)
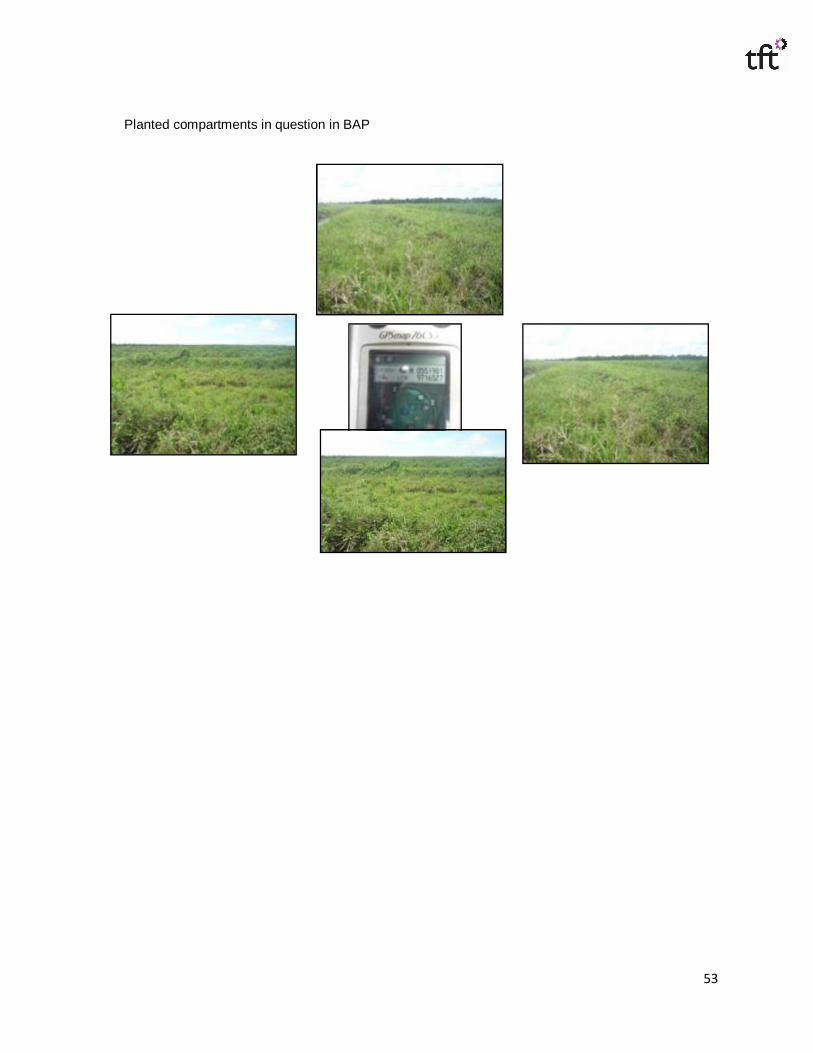
53
Planted compartments in question in BAP