Embed Size (px)
Citation preview

1
PT SARATOGA INVESTAMA SEDAYA TBK
PT SARATOGA INVESTAMA SEDAYA Tbk.
Aug 2014

2
Saratoga, Indonesia’s Leading Active Investment Company
Infrastructure Consumer
Power Roads Telecomm-
unications Automotive Property
PT Unitras Pertama Edwin Soeryadjaya Sandiaga S. Uno Public
29.2% 31.5% 29.2% 10.2%
Natural Resources
Agriculture Oil & Gas Metals &
Mining
Leading active investment company in Indonesia with estimated NAV of IDR 21.8tn (USD 1.8bn)
Listed on the IDX in 2013 with current market cap of IDR 13.6tn (USD 1.13bn)
Edwin Soeryadjaya and Sandiaga Uno founded and invested through the Company since 1998
Focus on early-stage, growth-stage, and special situation opportunities
Actively engage and work closely with investee companies’ management teams in unlocking value of investments
Invested across key sectors of the Indonesian economy: Consumer, Infrastructure and Natural Resources
Data presented are as of 30 June 2014
IDR/USD as of 30 June 2014 = 11,969
Source: Company information

3
Our Investment Strategy
Investment Mandate Our Value Proposition
Good proxy to the Indonesian
economy
Three key target sectors:
– Consumer
– Infrastructure
– Natural resources and
agriculture
Blue-chip listed companies
offering potential for strong
growth with mitigation of
portfolio downside risk
Smaller early-stage investments
with large upside potential Track Record
Partnerships
• Leading active investment company in Indonesia
• Focus on GROWTH, STRENGTH and REPUTATION
• Partner of choice for investors aspiring to participate in Indonesia’s growth
OUR VISION
Our Operating Model
Acquire platforms in strategic sectors
Organic and/or inorganic growth of
investments
Monetization of investments
4
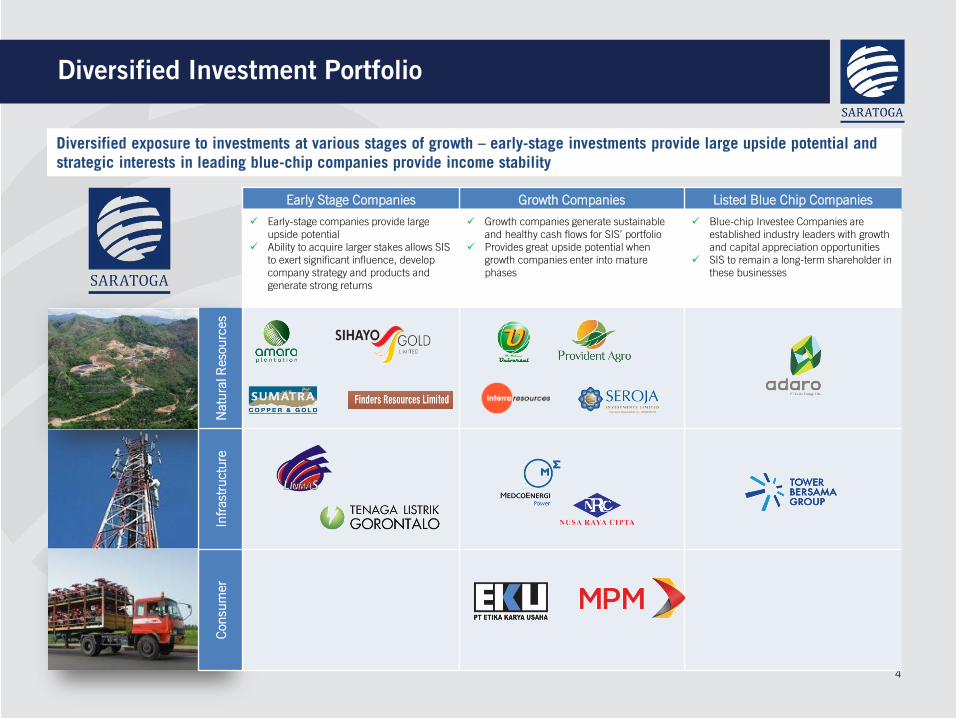
Early Stage Companies Growth Companies Listed Blue Chip Companies
Early-stage companies provide large
upside potential
Ability to acquire larger stakes allows SIS
to exert significant influence, develop
company strategy and products and
generate strong returns
Growth companies generate sustainable
and healthy cash flows for SIS’ portfolio
Provides great upside potential when
growth companies enter into mature
phases
Blue-chip Investee Companies are
established industry leaders with growth
and capital appreciation opportunities
SIS to remain a long-term shareholder in
these businesses
Natu
ral R
esou
rces
Infr
astr
uctu
re
Con
su
mer
Diversified Investment Portfolio
Diversified exposure to investments at various stages of growth – early-stage investments provide large upside potential and
strategic interests in leading blue-chip companies provide income stability

5
Net Asset Value
Investments Effective
Ownership
Valuation
Method Ticker
2wks VWAP
Market Price
Valuation
(IDR bn)
Valuation
(USD m)
PT Adaro Energy Tbk 16.4% Market Value ADRO IDR1199 6285 525 PT Provident Agro Tbk 44.7% Market Value PALM IDR490 1541 129 PT Mitra Pinasthika Mustika Tbk 47.6% Market Value MPMX IDR1237 2629 220 PT Tower Bersama Infrastructure Tbk 30.1% Market Value TBIG IDR7896 11393 952 Seroja Investment Limited 23.3% Market Value SER:SP SGD0.08 70 6 PT Nusa Raya Cipta Tbk 7.0% Market Value NRCA IDR793 138 12 Sumatra Copper and Gold plc 18.8% Market Value SUM:AU AUD0.06 49 4 Sihayo Gold Limited 14.9% Market Value SIH:AU AUD0.02 32 3 Finders Resources Limited 6.9% Market Value FND:AU AUD0.17 92 8 Interra Resources Limited 17.8% Market Value ITRR:SP SGD0.40 295 25 PT Etika Karya Usaha 29.4% Book Value 91 8 PT Tenaga Listrik Gorontalo 46.3% Book Value 74 6 PT Medco Power Indonesia 12.3% Book Value 257 22 PT Agro Maju Raya 25.0% Book Value 224 19 PT Lintas Marga Sedaya 18.0% Book Value 271 23 PT Sinar Mentari Prima 50.0% Book Value 85 7 PT Tri Wahana Universal 35.0% Book Value 241 20 PT Pulau Seroja Jaya 9.6% Book Value 27 2 Others* 554 46 Sum of investee companies 24,347 2,034
- Debt as of 30 June 2014 2,816 235
+ Cash Balance as of 30 June 2014 261 22
Net Asset Value for SIS as of 30 June 2014 21,792 1,821
Notes:
Market prices are updated as of 30 June 2014. Book values, cash, and debt are according to H1 2014 financial numbers which are unaudited
IDR/USD as of 30 June 2014= IDR 11,969 / 1 USD
*Mainly consist of investment in MDM (non-trade receivables) and advances for investment
Source: Company information

6
INVESTMENT HIGHLIGHTS

7
Our Founders
Our Management Team
Experienced Founders and Management Team
• Our founders and management team’s long-standing experience and network of contacts in the Indonesian investment
landscape and multiple sourcing channels provide us with business opportunities that are not available to others
• Proven track record in adding value to and growing our investee companies through stronger access to potential business
partners, financing channels and improved corporate governance
EDWIN SOERYADJAYA
President Commissioner
Joined PT Astra International in 1978 and worked within the family
business for over 15 years, serving as Vice President and Director
Ernst & Young Indonesia Entrepreneur Of the Year in 2010
SANDIAGA S. UNO
President Director
Holds or has held positions as an elected member of the Indonesian
Economic Committee and vice president of Micro, Small and Medium
Enterprises and Cooperatives of the Indonesian Chamber of
Commerce and Industry and Chairman of the Indonesian Young
Entrepreneurs Association
MICHAEL SOERYADJAYA
Business Development Director
JERRY NGO
Finance Director
Appointed Director in 2013
Commissioner of PT Multi Pinasthika Mustika Rent since 2012 and Director of PT
Bareika Capital since 2010
Appointed Independent Director in 2013, CFO since 2012
Previously Executive Director of Institutional Banking at PT ANZ Bank Indonesia
and held a number of senior positions at Standard Chartered Bank in Singapore,
London and Vietnam
Portfolio Executives
Budianto Purwahjo
Yuliantina Wangsawiguna
Kumari
Ellie Turjandi
Herman Setya Budi
Arif Qasimi Al Bone
Supported by 52 full-time employees at the parent-level company
Investee Companies Financial advisors Fund
Investee Companies offer us opportunities to
partner with them for larger transactions and
often refer other opportunities to us
The Fund’s global network of limited partners
provides an extensive base of referrals
We frequently meet with investment banks and
other parties that are representing entities
seeking a purchaser or strategic investment
partner
Our Multiple Sourcing Channels

8
Robust track record of strong asset value growth
510 2,293 2,155
8,002
2,309
11,401
4,245
8,248
4,838
7,838
5,494 5,913
90
190 585
3,891
842
4,035
2,452
8,074
2,188
8,337
319
421
790
1,871
2,458
639
1,037
1,568
2,265
1,764
1,470
2,964
1,871
1,239
2,293
3,382
8,002
4,781
15,292
7,773
12,283
9,844
17,382
12,518
18,579
2008
book
value
2008
market
value
2009
book
value
2009
market
value
2010
book
value
2010
market
value
2011
book
value
2011
market
value
2012
book
value
2012
market
value
2013
book
value
2013
market
value
(IDR bn) Other MPM TBIG Adaro
SIS’ investment portfolio has grown significantly and steadily since 2008 in terms of book value as well as market
value, with growth coming from an increasing number of investee companies
Notes:
All financial numbers are based on their nominal values as of 31 December 2008, 2009, 2010, 2011, 2012 and 2013 no adjustments have been made for time value or inflation.
The book value of our investments includes the carrying value of our investments and advances for investments.
The book value of our investment in Adaro Energy includes the book value of our investment in PT Adaro Strategic Capital and PT Adaro Strategic Lestari.
The book value of our investment in Tower Bersama includes the book value of our investment in PT Saratoga Infrastruktur
The market value of our effective shareholding calculated using two week volume weighted average price as of 31 December 2008, 2009, 2010, 2011, 2012 and 2013.
Source: Company financials, Bloomberg

9
Conservative Leverage
The Company calculates the net asset valuation of its investments on the basis of:
• For listed companies: the market value of the proportionate shares that are held by SIS
• For unlisted companies: the book value of SIS’ shareholding in the company
Where:
• Market value is derived from the 2 week volume weighted average share price.
• Book value is derived from investment at cost adjusted by accumulated profit or loss to arrive at the
ending balance
Strong Debt to Net Asset Value and Total Asset of 0.13x and 0.12x show substantial equity coverage
Note: Financial numbers for the quarter ended 30 June 2014 are unaudited
Source: Company financials
Note: Please refer to page 5 for asset value breakdown
Please refer to page 16 for debt breakdown
Gross asset value = NAV + cash
23 22
207
0
50
100
150
200
250
2014 2015 2016
US
D M
illio
ns
Maturity Profile
- Interest
- Principal93% listed,
7% unlisted 2,817
21,791
24,347
Debt Net AssetValue
Gross AssetValue
Debt & Gross/Net Asset Values as of 30 June 2014 (in IDRbn)

10
Diversified Sources of Cash
So
urc
es o
f C
ash
Investment Income
Dividend Income
Adaro Energy
IDR 145 bio* (US$ 12.7m)
Tower Bersama
IDR 72 bio* (US$ 6.3m)
Fixed Income
Operating Income
Sale of Shares on Investee Companies in Monetization phase**
IDR 17,677 bio*** (US$ 1,477m)
Sale of Shares of other Listed Investee Companies****
IDR 4,846 bio*** (US$ 405m)
Monetize Unlisted Investee Companies*****
IDR 1,823bio*** (US$ 152m)
SIS has multiple internal sources of cash and liquidity
Notes:
Financial numbers for the quarter ended 30 June 2014 are unaudited
Values for listed and unlisted companies are based on market cap and book value respectively
IDR/USD as of 30 June 2014= IDR 11,969 / 1 USD
* Source: Company financials as of 31 December 2013
** Consist of PT Adaro Energy Tbk and PT Tower Bersama Infrastructure Tbk
*** Source: Company financials as of 30 June 2014
**** Consist of PT Provident Agro Tbk, PT Mitra Pinasthika Mustika Tbk, Seroja Investment Limited,
PT Nusa Raya Cipta Tbk, Sumatra Copper and Gold plc, Sihayo Gold Limited, Finders Resources
Limited and Interra Resources Limited
***** Consist of PT Etika Karya Usaha, PT Tenaga Listrik Gorontalo, PT Medco Power Indonesia, PT
Agro Maju Raya, PT Lintas Marga Sedaya, PT Sinar Mentari Prima, PT Tri Wahana Universal and PT
Pulau Seroja Jaya

11
Sound investment strategy and corporate governance framework
SIS is highly committed to ensuring that its investments satisfy its strict corporate governance framework and also cooperates
with the International Finance Corporation to develop similar practices in investee companies
ENVIRONMENTAL
− Energy and water use
− Land clearance practices
− Emissions
− Levels of natural resources utilization
− Air and water pollution
− Waste management
− Activities in sensitive habitats
SOCIAL
− Local community relationships
− Minimum working age
− Minimum wage levels
− Health and safety record and procedures
− Union representation
− Security force usage
− Historical discrimination
− Relationships with NGOs
GOVERNANCE
− Anti-corruption policies
− Accounting and legal compliance
− Related party transactions
− Criminal conduct
− Pending or threatened litigation
− Historical transparency
INVESTMENT COMMITTEE
Provide independent recommendations on systems,
procedures and implementation thereof in areas
related to investment, capitalization of investment
and divestments activities, monitoring of investment
performance and active monitoring of investment risk
profile
NOMINATION AND REMUNERATION
COMMITTEE
Provide independent recommendations on the
systems and procedures related to succession
programs and identification of candidates for the
Board of Commissioners and Board of Directors
Provide independent recommendations on the
determination of remuneration of members of the
Board of Commissioners and Board of Directors
AUDIT COMMITTEE
Assist in implementing supervisory function,
especially in financial information management,
effectiveness of internal control systems,
effectiveness of internal and independent audit,
implementation of risk management and compliance
with prevailing laws and regulations
INVESTMENT
CONSIDERATIONS

12
FINANCIAL OVERVIEW

13
0
500
1,000
1,500
2,000
2,500
3,000
3,500
4,000
2011 2012 2013 1H2013
1H2014
IDR
Billio
n
Revenue - net
Results of Operations
• Given associate nature of most investments, our revenue is mainly derived from the two consolidated
entities of PT Tri Wahana Universal (TWU), an oil refinery company, and PT Sinar Mentari Prima
(SMP), a floating storage and offloading vessel company.
• Net share profit from associates amounting to IDR 933bn in 2013 and IDR 1,953bn in 2012 as
presented in the consolidated financial statements include one-off items due to the change in
accounting methods. The above profit contribution from investee companies shows the underlying
profit contribution from investee companies if these one-off items are excluded. There is no one – off
item in 1H 2014.
Note: Financial numbers for the quarter ended 30 June 2014 are unaudited
Source: Company financials
118 210 265
147 150
168
314 322
67 171
569
373
50
79
180
855 897
637
293
501
2011 2012 2013 1H 20131H 2014
Underlying Profit Contribution from Investee Companies
(IDR billion)
NaturalResources
Infrastructure
Consumer

14
2,816
11,742
Debt Asset
Parent-Only Debt & Asset as of 30 June 2014
3,943
15,769
Debt Asset
Consolidated Debt & Asset as of 30 June 2014
-
2,000
4,000
6,000
8,000
10,000
12,000
14,000
16,000
18,000
2011 2012 2013 1H2014
IDR
billio
n
Consolidated Total Equity
-
2,000
4,000
6,000
8,000
10,000
12,000
14,000
16,000
18,000
2011 2012 2013 1H2014
IDR
billio
n
Consolidated Total Liability
-
2,000
4,000
6,000
8,000
10,000
12,000
14,000
16,000
18,000
2011 2012 2013 1H2014
IDR
bil
lio
n
Consolidated Total Assets
Financial Positions
Debt / Equity = 0.25x Debt / Equity = 0.24x
*Parent-only include SIS and intermediate holding companies
Notes:
Due to reclassification of investment at end 2013, assets and liability were overstated and normalized back in 2014
Financial numbers for the quarter ended 30 June 2014 are unaudited
Source: Company financials
15
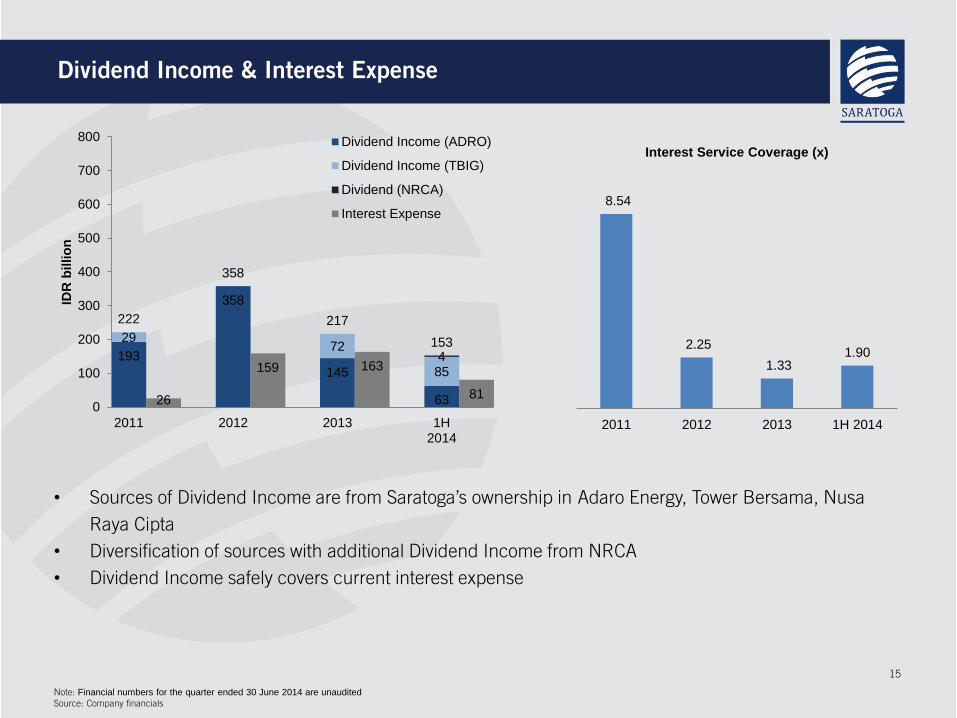
Dividend Income & Interest Expense
• Sources of Dividend Income are from Saratoga’s ownership in Adaro Energy, Tower Bersama, Nusa
Raya Cipta
• Diversification of sources with additional Dividend Income from NRCA
• Dividend Income safely covers current interest expense
Note: Financial numbers for the quarter ended 30 June 2014 are unaudited
Source: Company financials
193
358
145
63
29 72
85 4
222
358
217
153
26
159 163
81 0
100
200
300
400
500
600
700
800
2011 2012 2013 1H2014
IDR
billio
n
Dividend Income (ADRO)
Dividend Income (TBIG)
Dividend (NRCA)
Interest Expense
1.90 1.33
2.25
8.54
1H 2014201320122011
Interest Service Coverage (x)

16
Borrowings
Entity Date Lender(s) Facility Maturity Interest Rate Outstanding
(in IDRbn)
PT Saratoga Investama Sedaya Tbk October 2011 HSBC, UOB, Bank Central
Asia, Bank Ekonomi
Rahardja, Bank Permata,
Bank UOB Indonesia
USD300m
syndicated loan
5 years USD:
- Onshore bank: LIBOR + 5.2%
- Offshore bank: LIBOR + 4.7%
Rupiah:
JIBOR + 4%
IDR 1,043
May 2013 ING USD80m bank loan 60 months LIBOR + 4.7% IDR 479
May 2013 DBS USD80m bank loan 5 years LIBOR + 4.7% IDR 688
May 2013 Permata USD10m bank loan 12 months LIBOR + 5.5%
JIBOR + 12.5%
IDR 50
Unamortized transaction cost (IDR 37)
SUB-TOTAL (SIS) IDR 2,223
PT Wahana Anugerah Sejahtera December
2012
ING USD50m bank loan Earlier of 60 months
or 8 November 2016
LIBOR + 5% IDR 598
Unamortized transaction cost (IDR 5)
SUB-TOTAL (SIS + Intermediate Holding Companies) IDR 2,817
PT Sinar Mentari Prima March 2011 Bank UOB Indonesia USD24m bank loan Earlier of 5.25 years
or 30 April 2016
LIBOR + 2.75% IDR 134
PT Tri Wahana Universal June 2013 HSBC, SCB USD150m
syndicated loan
- Facility A:
Working capital
- Facility B: Loan
- Facility C: SBLC
Facility A – 5 years
Facility B – 5 years,
repaid in 58 monthly
instalments
Facility C – 5 years
Facility A:
- Onshore: LIBOR + 3.5%
- Offshore: LIBOR + 3.1%
Facility B:
- Onshore: LIBOR + 4.25%
- Offshore: LIBOR + 3.1%
IDR 1,032
Unamortized transaction cost (IDR 39)
TOTAL (SIS + Intermediate Holding Companies + Other Consolidated Operating Companies) IDR 3,943
Notes:
Data presented are as of 30 June 2014
Financial numbers ended 30 June 2014 are unaudited
Source: Company information
17
INVESTEE COMPANIES
ADARO ENERGY

18
Overview of PT Adaro Energy Tbk
Company overview
Second largest thermal coal producer in
Indonesia and operates the largest single
coal mine in Indonesia
First vertically integrated coal producer in
Indonesia, spanning coal mining, processing,
transportation, storage, trading, and power.
Significant supplier to the global seaborne
thermal coal market and Indonesia’s largest
coal producer, with mines in Tutupan, Wara
and Paringin
Coal resources and reserves calculated in
compliance with Australasian JORC Code are
estimated to be 4.9bn tonnes and 1.1bn
tonnes respectively
Key historical financials (IDRbn)
2013 1Q
2014
Sales 34,343 10,007
Gross profit 7,727 2,906
Net income 2,417 1,556
Equity 38,944 37,941
Assets 82,078 78,628
Market capitalization 34,865 31,346
Key 1Q 2014 operating data
Production volume (m
tonnes) 14
Sales volume (m tonnes) 13.9
Overburden removal
(m bank cubic meters) 68.2
Outlook
Indonesia’s
extensive coal
resources
Ideally placed to capitalize on Indonesia’s abundant supply of thermal coal and
meet the increasing demand for coal, particularly in Asia
Strong demand
Because of its low ash, sulfur and nitrogen content, Adaro Energy’s coal is
trademarked and marketed as “Envirocoal” and has a high demand in the
global export market
Production volume has increased significantly from 36.1m tonnes in 2007 to
52.3 m tonnes in 2013. Production guidance for 2014 is 54-56 m tonnes.
Expansion of
power operations
Currently constructing what will become the largest coal-fired power plant in
Southeast Asia, a 2 x 1,000 MW plant in Central Java
Also investing in independent power producers in Kalimantan and Java in
conjunction with reputable global investors in the energy sector
Expansion into power will provide Adaro Energy with the opportunity to take
advantage of possible supply synergies and pricing stability
Diversified
operations
Diversified sources of coal with multiple mines in Indonesia in both Kalimantan
and Sumatra
Source diversity complemented by product diversity provided by Adaro Energy’s
investments in both thermal and coking coal mines
Experienced
management team
Managed by five well-respected Indonesian families
– Edwin Soeryadjaya is the President Commissioner
– Sandiaga S. Uno is Director, General Affairs
Other drivers
Other drivers for growth include:
– Significant cost savings achieved by vertical integration of transportation
systems and infrastructure
– Reduction of operational cost and elimination of third party margins by
assigning 50% of Adaro Energy’s production to subsidiaries within the
supply chain
As at 31 Mar 2014:
Invested: IDR 978bn
Value of stake: IDR
5.1tn
Effective interest: 16.4%
2010 2011 2013 2002 2003 2004 2005 2006 2007 2008 2009 2012
Held interest in entity which acquired 40% of both PT
Adaro Indonesia and PT Indonesia Bulk Terminal for
USD 45.2m
Listing of Adaro
Energy on IDX
Acquired a further 11% of PT Adaro Indonesia
for USD10.3m and 10% of PT Indonesia Bulk
Terminal for USD 0.25m Sold 0.8% of Adaro
Energy for IDR 203bn LBO conducted
SIS’ first investment of
23.2% of Adaro Energy for
IDR 478bn
Acquired a further 0.9% of
Adaro Energy at IDR 1,370
per share
Partnership with BHP
Billiton for Maruwai coal
mine
Acquired a further
1% of Adaro Energy
at IDR 1,573 per
share
Awarded Central
Java 2x1,000
contract

19
Largest Coal Producer in the Southern Hemisphere
Strong production capabilities
47.7 47.2
52.3
44
46
48
50
52
54
2011 2012 2013
Mt
2013 largest producing concession in Southern Hemisphere
52.3 50.0
37.0
30.0 28.0 23.0
15.1
AdaroIndonesia
A B C D E F
Mt
Diversified customer base with long-term contracts
Customer type by % volume (FY2013) Geographical breakdown of customers by revenue (FY2013)
87.0%
2.0%
11.0%
Power Cement Others
21.0%
4.0%
7.0%
7.0%
17.0% 7.0%
14.0%
3.0%
10.0%
8.0% 2.0%
Indonesia Philippines Malaysia
Hong Kong India South Korea
Japan America China
Source: PT Adaro Energy Tbk Institutional Investor Day 2014 presentation

20
0
100
200
300
400
500
600
700
800
900
Jan
-11
Ma
y-1
1
Se
p-1
1
Jan
-12
Ma
y-1
2
Se
p-1
2
Jan
-13
Ma
y-1
3
Se
p-1
3
Jan
-14
Ma
y-1
4
IDR
Billio
n
ADRO Share Daily Traded Value
Shares of PT Adaro Energy Tbk
• ADRO is included in LQ45 index
• Saratoga’s share ownership in Adaro Energy as of 30 June 2014 = 5,240m shares
• 2 weeks VWAP Price of ADRO shares of 30 June 2014 = IDR 1,199
• Market value of Saratoga’s ADRO shares as of 30 June 2014 = IDR 6.3tn
8
9
0
Buy Hold Sell
Analyst Recommendations
Average daily
traded volume
(100d) = IDR 71bn
(USD 6.1m)
0
500
1000
1500
2000
2500
3000
Jan
-11
Ma
y-1
1
Se
p-1
1
Jan
-12
Ma
y-1
2
Se
p-1
2
Jan
-13
Ma
y-1
3
Se
p-1
3
Jan
-14
Ma
y-1
4
ADRO Share Price (IDR) - 2 weeks
VWAP
Source: Bloomberg, Reuters as at 30 June 2014

21
INVESTEE COMPANIES
TOWER BERSAMA

22
Overview of PT Tower Bersama Infrastructure Tbk
One of two leading independent tower
businesses in Indonesia, with over
10,572 telecommunication sites
serving over 17,222 tenants in
Indonesia as of 31 March 2014
Principal business is leasing space for
antennas and other equipment for
wireless signal transmission at tower
sites and shelter-only sites under
long-term lease agreements
As at 31 Mar 2014:
Invested: IDR 2.3tn
Value of stake: IDR 8.8tn
Effective interest: 30.3%
Company overview Outlook
Geographic
reach
Has sites across most provinces in Indonesia, with majority located in high population
density areas such as Java, Sumatra and Bali
Existing footprint coupled with strong relationships with large Indonesian telecom
operators allows Tower Bersama to adapt quickly for growth in high-demand
locations
Stable cash
flows
Long-term contracts with ten of the leading telecommunications operators in
Indonesia, including the four largest in terms of revenues – Telkom, Telkomsel,
Indosat and XL
Revenues are derived from long-term lease agreements with tenants
Length of tower site lease agreements of generally ten years and length of Distributed
Antenna Systems network license agreements of generally five to eight years to
provide stable cash flows
Attractive
regulatory
dynamics
Indonesian regulations allow foreign investment only in listed companies in this sector
Limited capital available to private companies allows SIS to source attractive entry
valuations for add-on acquisitions
Limited opportunities for foreign capital to invest in listed companies results in
attractive exit opportunities
Strong
management
team
Management team has a successful track record of growing the company both
organically and inorganically and to efficiently integrate acquired towers in the
company’s tower portfolio
– Edwin Soeryadjaya has been President Commissioner since March 2010
– Herman Setya Budi (President Director)
– Budianto Purwahjo (Director)
Favourable
growth
prospects
Continued demand for additional towers in Indonesia supported by rising cellular
penetration and 3G/4G upgrades
Opportunity to continue stable organic growth, complemented by opportunistic
inorganic growth
Attractive towers portfolio mainly consists of high-rise towers which support rising co-
location
Key historical financials (IDRbn)
2013 1Q 2014
Sales 2,691 781
Gross profit 2,295 661
EBITDA 2,205 641
Net income 1,352 640
Equity 4,114 4,117
Assets 18,719 19,392
Market capitalization 27,820 28,779
Key Q1 2014 operating data
Telecommunication sites 10,572
Tenants 17,222
Tenancy ratio 1.71x
2010 2011 2013 2004 2005 2006 2007 2008 2009 2012
Founders acquired Telenet
Internusa with Provident Capital
Provided additional financing by acquiring PT
Mobile-8 Telecom Tbk’s tower assets with
founders
Sold 4.6% of Tower
Bersama as part of IPO
First invested in Tower
Bersama with IDR 27bn
Acquired 5.6% of Tower
Bersama for IDR 825bn
Tower Bersama acquired 2,500
towers from Indosat
Listing of Tower
Bersama
Sold stake in Tower
Bersama for IDR
496bn
Sold stake in Tower
Bersama for IDR
926bn

23
A Leading Telecommunication Infrastructure Solution and Services
Firm
Note: Top 4 Indonesian telecommunications companies are Telkom Indo, Telkomsel, XL and Indosat
Sources: PT Tower Bersama Infrastructure Tbk IDX Investor Summit presentation, Annual report 2013
Diversified revenue sources (FY2013) Tower tenancies
Robust revenue growth
27.5%
23.5% 12.1%
11.8%
10.5%
6.0% 4.2%
2.8% 1.7%
Telkomsel Indosat Telkom Indo
XL Axiata Hutchison Axis
Bakrie Tel Smartfren Others
0.0
0.5
1.0
1.5
2.0
2.5
3.0
Th
ou
sa
nd
s
IDRtn
Strong EBITDA growth
0.0
0.5
1.0
1.5
2.0
2.5
Th
ou
sa
nd
s
IDRtn
Tower portfolio mix (30 Jun 2013)
45%
28%
19%
2% 0% 6%
Ground based (>65m) Ground based (51-65m)
Ground based (32-50m) Ground based (<32m)
Rooftop based (32-50m) Rooftop based (<32m)
7.0
13.7
16.6
1.63
1.75 1.73
1
1.1
1.2
1.3
1.4
1.5
1.6
1.7
1.8
0
5
10
15
20
25
2011 2012 2013
Th
ou
sa
nd
s
Total tenancies (LHS) Tenancy ratio (RHS)
74.9% of revenue from
top 4 Indonesian telcos
‘000 (x)

24
0
1,000
2,000
3,000
4,000
5,000
6,000
7,000
8,000
IDR
Billio
n
TBIG Share Daily Traded Value
Shares of PT Tower Bersama Infrastructure Tbk
• TBIG is included in LQ45* since January 2014
• Saratoga’s share ownership in Tower Bersama as of 30 June 2014 = 1,443m shares
• 2 week VWAP Price of TBIG shares as of 30 June 2014 = IDR 7,896
• Market value of Saratoga’s TBIG shares as of 30 June 2014 = IDR 11.4tn
8
6
0
Buy Hold Sell
Analyst Recommendations
* Capitalization-weighted index of the 45 most heavily traded stocks on the Indonesia Stock Exchange.
Source: Bloomberg, Reuters as at 30 June 2014
Average daily
traded volume
(100d) = IDR
14.9bn (USD 1.3m)
0
200
400
600
800
1000
1200
TBIG Share Price (IDR) - 2 weeks VWAP

25
INVESTEE COMPANIES
MITRA PINASTHIKA MUSTIKA

26
Overview of PT Mitra Pinasthika Mustika Tbk
Founded in 1988 as a master distributor for Honda motorcycles in East
Java and East Nusa Tenggara
Now a diversified automotive company, with leading positions in terms
of market share in five segments of the Indonesian automotive industry
− Motorcycle retail business is conducted under retail outlets
branded as “MPMMotor”
− Total of eleven subsidiaries that are involved in the motorcycle
distribution business, consumer parts business, auto-services
business and the financial services business respectively
2011 2013 2010 2012
Acquired
50% of MPM
for IDR
260bn
Facilitated a IDR 910bn
investment in MPM in the form of
convertible bonds, and subscribed
to additional shares for IDR
318.5bn
MPM
listed on
IDX
Added car rental services
to MPM via acquisition
and rebranding of ANJ
Rent
Capital call
of IDR
150bn
Company overview Outlook
Market leading
positions
Operates businesses in the distribution, retail, consumer parts, auto
services and financial services segments of the automotive industry
Achieved market leading positions in its operating geographies
Extensive
nationwide
network of
customer access
points
Extensive network of customer access points with:
– 288 retail distributorships under subsidiary PT Mitra Pinasthika Mulia in
East Java and East Nusa Tenggara
– 38 Honda motorcycle MPMMotor retail outlets
– 28 master distributors with arrangements with PT Federal Karyatama
– 22 MPMRent branches and service points
– 47 PT Mitra Pinasthika Mustika Finance branches
– 31 PT Sasana Artha Finance branches
Nationwide presence provides platform to reach out to and service existing
and potential customers, supporting cross-selling of products and services
Experienced and
well-connected
management
team and
shareholders
Senior management has extensive operational know-how and long-standing
relationships in the Indonesian automotive industry
– Edwin Soeryadjaya is currently President Commissioner of MPM
– Michael W. P. Soeryadjaya is Commissioner at MPMRent
– Sandiaga S. Uno is Member of Nomination & Remuneration Committee
Meaningful
organic growth of
its existing
businesses
New sales of two-wheel vehicles enjoyed strong growth of 23% to reach
905,175 units in 2013, majority of which had been contributed from sales in
East Java and East Nusa Tenggara with a market share of 67%. This
represents a two-fold growth compared to 10% growth in entire motorcycle
industry new sales.
Expanded number of its retail outlets from 38 to 40
Increased sales volume of lubricant products from 45.3m liters in 2010 to
60.6m liters in 2013
Evolving principal
business
Shifted the mix of its business towards principal-based businesses such as
motorcycle retail sales and consumer parts, and away from agency
businesses, allowing more control over the growth and expansion of its
business and providing access to potentially higher margins.
Key historical financials (IDRbn)
2013 1Q 2014
Sales 13,879 3,642
Gross profit 2,024 551
Net income 564 157
Equity 4,395 4,564
Assets 11,220 12,212
Key 1Q 2014 operating data
Motorcycle sales (unit) 216,113
Oil Sales Volume (‘000 liter) 16,678
Rental fleet size (unit) 14,573

27
0
5
10
15
20
25
30
35
Jun
-13
Jul-
13
Au
g-1
3
Se
p-1
3
Oct-
13
Nov-1
3
Dec-1
3
Jan
-14
Fe
b-1
4
Ma
r-1
4
Ap
r-14
Ma
y-1
4
IDR
bil
lio
n
MPMX Share Traded Value
3
Buy Hold Sell
Analyst Recommendations
Shares of PT Mitra Pinasthika Mustika Tbk
• MPMX was added into the MSCI Small Cap Indices since November 2013
• Saratoga’s share ownership in Mitra Pinasthika Mustika as of 30 June 2014 = 2,125m shares
• 2 weeks VWAP Price of MPM shares as of 30 June 2014 = IDR 1,237
• Market value of Saratoga’s MPM shares as of 30 June 2014 = IDR 2.6tn
Source: Bloomberg as at 30 June 2014
Average daily traded
volume (100d) = IDR
1.9bn (USD 0.2m)
-
200
400
600
800
1,000
1,200
1,400
1,600
Jun
-13
Jul-
13
Au
g-1
3
Se
p-1
3
Oct-
13
Nov-1
3
Dec-1
3
Jan
-14
Fe
b-1
4
Ma
r-1
4
Ap
r-14
Ma
y-1
4
MPMX Share Price (IDR) - 2 weeks VWAP

28
APPENDIX – SIS

29
Current Shareholding Structure
Companies contributing 70-80% of SIS’ net
profit
Companies consolidated into SIS
Companies not consolidated into SIS
Operating companies
Companies directly held by SIS
Companies indirectly held by SIS
Companies directly held by SSB
PT Adaro
Strategic Capital
25.0%
PT Adaro
Strategic Lestari
29.8%
PT Adaro
Strategic
Investments
74.9% 25.1%
PT Adaro Energy
Tbk
43.9%
4.9%
PT Wana Bhakti
Sukses Mineral
PT Bumi Hijau
Asri
PT Tri Wahana
Universal PT Sarana Asri
PT Etika Karya
Usaha
49.0%
60.0% 47.5%
73.7% 99.9%
PT Saratoga
Sentra Business
(SSB)
Sumatra Copper
and Gold Plc. Sihayo Gold Plc.
Interra Resources
Ltd.
Finders
Resources Ltd.
Seroja Investment
Ltd.
PT Nugraha Eka
Kencana
PT Nusa Raya
Cipta Tbk. PT Interra Indo
Resources
PT Baskhara
Utama Sedaya
PT Lintas Marga
Sedaya
PT Mitra
Pinasthika
Mustika Tbk.
PT Sukses
Indonesia
PT Satria Sukses
Makmur
PT DBS Vickers
Securities
Indonesia
PT Provident
Agro Tbk.
PT Mutiara
Agam
PT Agro Maju
Raya
PT Karunia Barito
Sejahtera
PT Anugerah
Bumi Nusantara
Abadi
PT Kalimantan
Mentari
Khatulistiwa
PT Laju Kencana
Murni
PT Pulau Seroja
Jaya
Seroja Shipping
Services Pte.,
Ltd.
Trans LK Marine
Singapore
40.0%
99.9%
7.0%
46.7%
PT Bangun Daya
Perkasa
PT Tenaga
Listrik
Gorontalo
PT Saratoga
Power
PT Medco Power
Indonesia
PT Sinar Mentari
Prima
PT Pelayaran
Antarbuwana
Pertala
PT Wahana
Anugerah
Sejahtera
PT Saratoga
Infrastruktur
PT Tower
Bersama
Infrastructure
Tbk.
PT Telenet
Internusa
PT Saratoga Investama Sedaya Tbk
32.6% 99.9%
99.7% 14.4%
40.0%
99.9% 18.8% 13.0% 17.8% 7.5% 23.3%
60.0%
1.0%
33.6%
44.7%
99.9%
0.01%
25.0%
19.7%
0.3%
99.7%
92.5% 50.0%
51.0% 24.1%
30.0% 50.0%
30.0% 50.0%
100.0%
100.0%
48.9% 48.0%
99.8%
50.0%
30.1%
0.5%
99.5%
Data is as of 30 May 2014
Source: Company information
99.9%

30
Management Structure
INVESTMENT COMMITTEE
Chairman: Edwin Soeryadjaya (non-
voting)
Member: Sandiaga S. Uno
Member: Michael W. P. Soeryadjaya
Member: Jerry Go Ngo
NOMINATION AND REMUNERATION
COMMITTEE
Chairman: Anangga W. Roosdiono
Member: Edwin Soeryadjaya
Member: Handianto Ganis
AUDIT COMMITTEE
Chairman: Sidharta Utama
Member: Mustofa
Member: Ludovicus Sensi W.
BOARD OF COMMISSIONERS
President Commissioner: Edwin Soeryadjaya
Commissioner: Joyce Soeryadjaya Kerr
Commissioner: Indra Cahya Uno
Independent Commissioner: Sidharta Utama
Independent Commissioner: Anangga W. Roosdiono
S.H.
BOARD OF DIRECTORS
President Director: Sandiaga S. Uno
Director: Michael W.P. Soeryadjaya
Non-Affiliated Director: Jerry Go Ngo

31
APPENDIX – INDONESIA OVERVIEW

32
Key investment sectors underpin compelling economic growth in Indonesia
Healthy GDP per capita growth …supported by a predominantly young population
…with further growth expected with growing FDI A growing consuming class…
Source: Business Monitor International
5.0 6.8
5.3
-0.1 -1.9
-4.6 -3.0
0.1
-0.6
1.9
11.7
8.0 9.6
13.0 11.2
15.7
21.8
-10.0
-5.0
0.0
5.0
10.0
15.0
20.0
25.0
19
95
19
96
19
97
19
98
19
99
20
00
20
01
20
02
20
03
20
04
20
05
20
06
20
07
20
08
20
09
20
10
20
11
US
Db
n
Net FDI inflows
53.3% 29.5%
17.2%
Indonesian demographic profile (2011)
0-29
30-49
50 and above
45 85
135 170
195
180
145 110
240
265 280 280
0
50
100
150
200
250
300
2010 2020 2030 with 5-6% GDP
growth
2030 with 7% GDP
growth
Indonesians (m) Consuming class
Below consuming class
Indonesia’s resilient and long-term economic growth is driven by strong fundamentals and demographics
2 3 3 5 5 7 8 9 10 11 13 15 17 21 24 27 30 33 37
17% 15%
16%
50%
13%
25% 18%
11% 16%
7%
17% 19%
15%
20% 16%
11% 14%
10% 11%
-
5
10
15
20
25
30
35
40
19
95
19
96
19
97
19
98
19
99
20
00
20
01
20
02
20
03
20
04
20
05
20
06
20
07
20
08
20
09
20
10
20
11
20
12
20
13
IDR
m
GDP Per Capita
% change yoy
Source: Business Monitor International
Source: Business Monitor International
Source: Mckinsey
Note: Consuming class defined as individuals with annual net income of above $3,600 at 2005
purchasing power parity

33
PT Saratoga Investama Sedaya Tbk. Correspondence Address:
Menara Karya 15th Floor
Jl. H.R. Rasuna Said Kav. 1-2
Jakarta 12950
For further information, please contact the following individuals below:
Jerry Ngo: [email protected]
Carlson Lau: [email protected]
Leona Karnali: [email protected]