Embed Size (px)
Citation preview
April 2019
PT Medikaloka Hermina Tbk
1Q 2019 Presentation
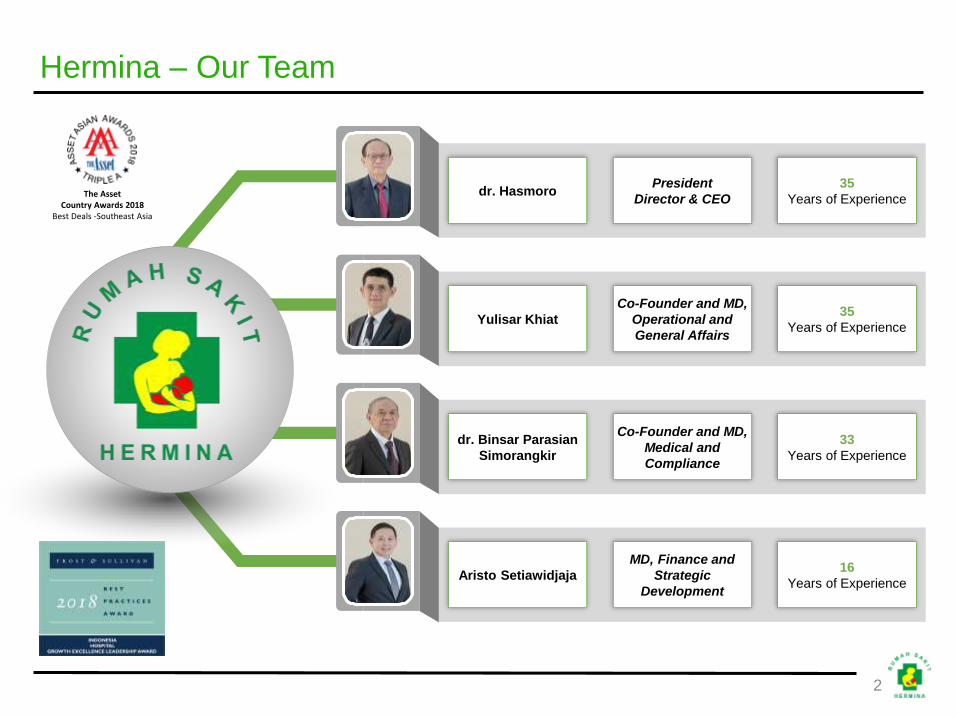
Hermina – Our Team
Aristo Setiawidjaja16
Years of Experience
MD, Finance and
Strategic
Development
dr. Binsar Parasian
Simorangkir
33
Years of Experience
Co-Founder and MD,
Medical and
Compliance
Yulisar Khiat35
Years of Experience
Co-Founder and MD,
Operational and
General Affairs
dr. Hasmoro35
Years of Experience
President
Director & CEO
2
The AssetCountry Awards 2018
Best Deals -Southeast Asia
1. Company Overview
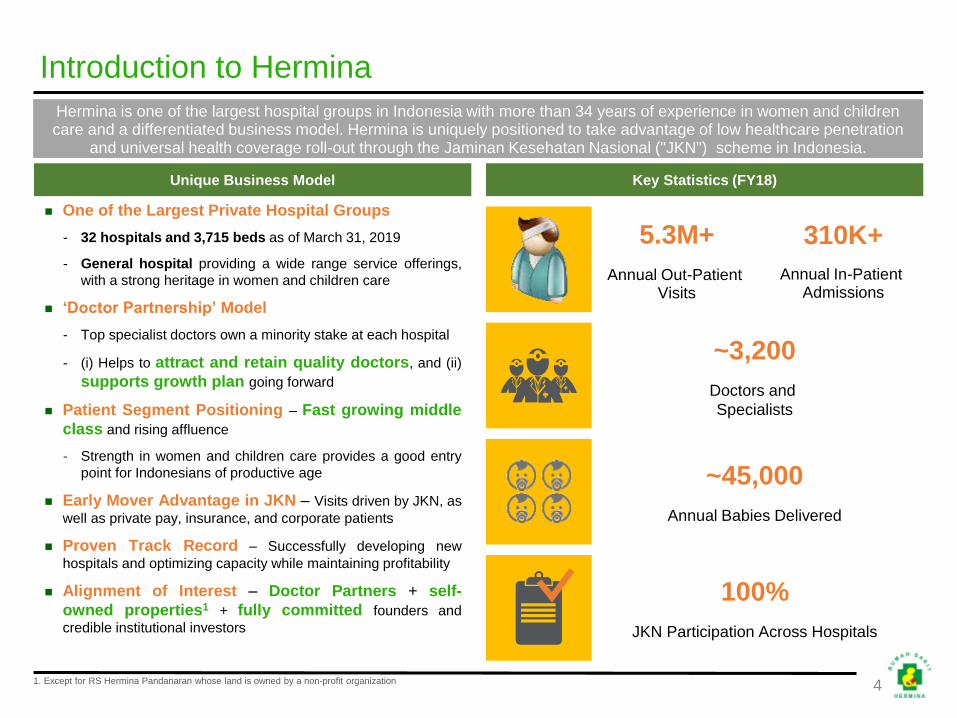
Introduction to Hermina
Hermina is one of the largest hospital groups in Indonesia with more than 34 years of experience in women and children care and a differentiated business model. Hermina is uniquely positioned to take advantage of low healthcare penetration
and universal health coverage roll-out through the Jaminan Kesehatan Nasional ("JKN") scheme in Indonesia.
5.3M+
Annual Out-Patient Visits
310K+
Annual In-Patient Admissions
Unique Business Model
◼ One of the Largest Private Hospital Groups
- 32 hospitals and 3,715 beds as of March 31, 2019
- General hospital providing a wide range service offerings,
with a strong heritage in women and children care
◼ ‘Doctor Partnership’ Model
- Top specialist doctors own a minority stake at each hospital
- (i) Helps to attract and retain quality doctors, and (ii)
supports growth plan going forward
◼ Patient Segment Positioning – Fast growing middle
class and rising affluence
- Strength in women and children care provides a good entry
point for Indonesians of productive age
◼ Early Mover Advantage in JKN – Visits driven by JKN, as
well as private pay, insurance, and corporate patients
◼ Proven Track Record – Successfully developing new
hospitals and optimizing capacity while maintaining profitability
◼ Alignment of Interest – Doctor Partners + self-
owned properties1 + fully committed founders and
credible institutional investors
Key Statistics (FY18)
~3,200
Doctors and
Specialists
~45,000
Annual Babies Delivered
100%
JKN Participation Across Hospitals
1. Except for RS Hermina Pandanaran whose land is owned by a non-profit organization 4
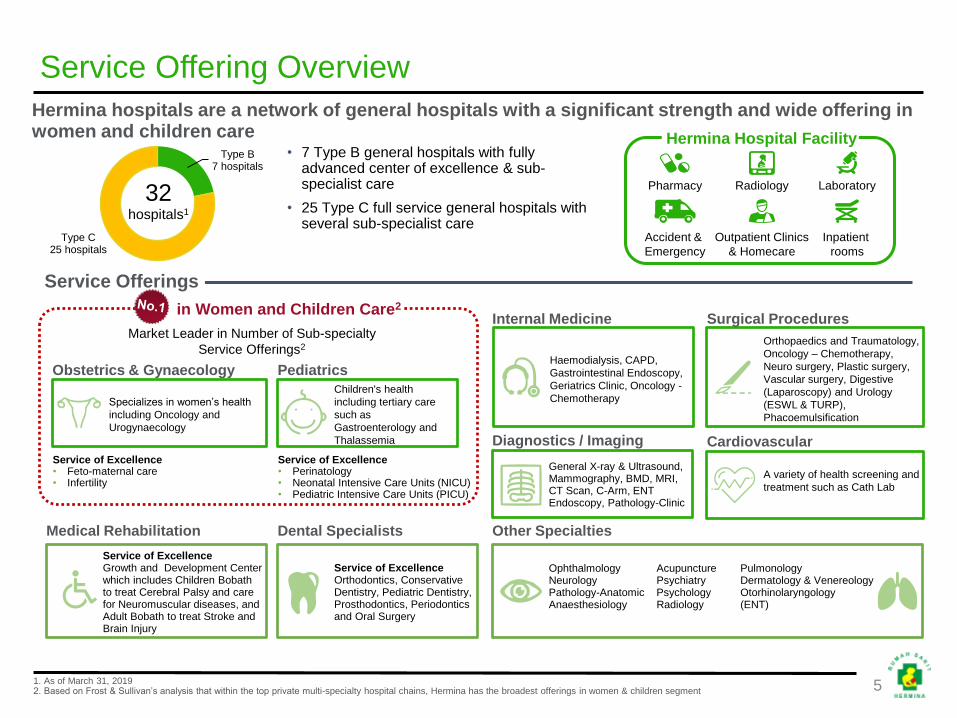
1. As of March 31, 20192. Based on Frost & Sullivan’s analysis that within the top private multi-specialty hospital chains, Hermina has the broadest offerings in women & children segment
Hermina hospitals are a network of general hospitals with a significant strength and wide offering in women and children care
Service Offering Overview
Type B 7 hospitals
Type C 25 hospitals
Hermina Hospital Facility• 7 Type B general hospitals with fully
advanced center of excellence & sub-specialist care
• 25 Type C full service general hospitals with several sub-specialist care
Pharmacy
Accident &
Emergency
Radiology
Outpatient Clinics
& Homecare
Laboratory
Inpatient
rooms
General X-ray & Ultrasound, Mammography, BMD, MRI, CT Scan, C-Arm, ENT Endoscopy, Pathology-Clinic
Diagnostics / Imaging
Haemodialysis, CAPD,
Gastrointestinal Endoscopy,
Geriatrics Clinic, Oncology -
Chemotherapy
Internal Medicine
Orthopaedics and Traumatology,
Oncology – Chemotherapy,
Neuro surgery, Plastic surgery,
Vascular surgery, Digestive
(Laparoscopy) and Urology
(ESWL & TURP),
Phacoemulsification
Surgical Procedures
A variety of health screening and
treatment such as Cath Lab
Cardiovascular
Service Offerings
Children's health
including tertiary care
such as
Gastroenterology and
Thalassemia
Pediatrics
Specializes in women’s health
including Oncology and
Urogynaecology
Obstetrics & Gynaecology
32hospitals1
Service of ExcellenceGrowth and Development Center which includes Children Bobathto treat Cerebral Palsy and care for Neuromuscular diseases, and Adult Bobath to treat Stroke and Brain Injury
Medical Rehabilitation
Service of Excellence Orthodontics, Conservative Dentistry, Pediatric Dentistry, Prosthodontics, Periodontics and Oral Surgery
Dental Specialists
Ophthalmology Acupuncture PulmonologyNeurology Psychiatry Dermatology & VenereologyPathology-Anatomic Psychology Otorhinolaryngology Anaesthesiology Radiology (ENT)
Other Specialties
Service of Excellence• Perinatology• Neonatal Intensive Care Units (NICU)• Pediatric Intensive Care Units (PICU)
Service of Excellence• Feto-maternal care• Infertility
in Women and Children Care2
Market Leader in Number of Sub-specialty
Service Offerings2
5
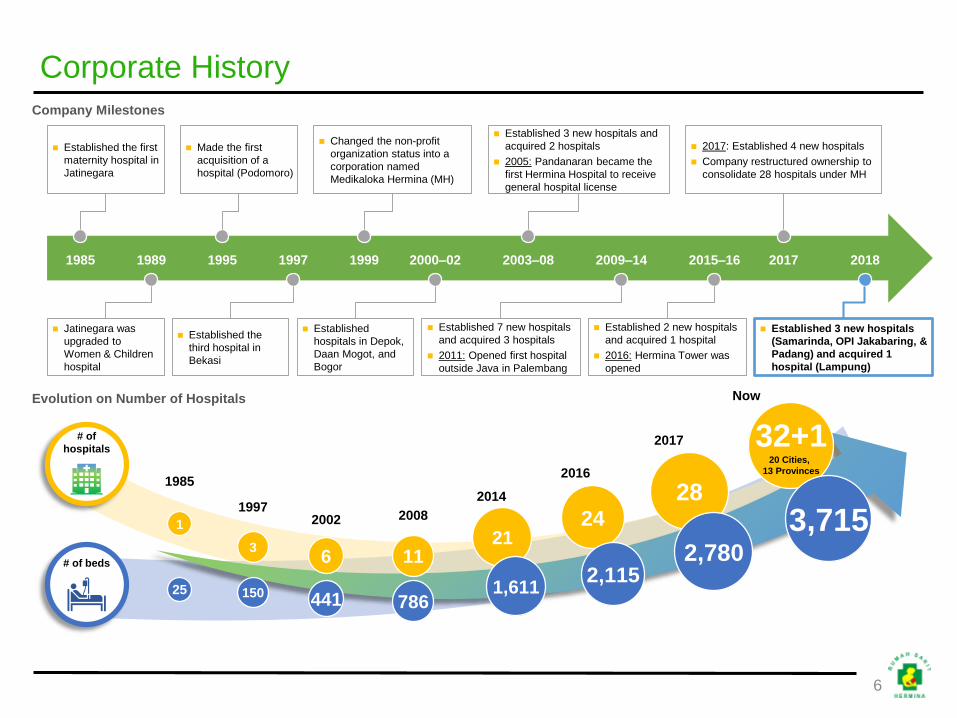
Corporate History
# of beds
# of
hospitals32+1
20 Cities,
13 Provinces
Now
20141997
2002 2008
2016
3
150
6
441
11
786
21
1,611
24
2,115
3,7151
1985
25
1985 1989 1995 1999 2000–02 2003–08 2009–14 2015–16 2017
◼ Established 3 new hospitals and
acquired 2 hospitals
◼ 2005: Pandanaran became the
first Hermina Hospital to receive
general hospital license
◼ 2017: Established 4 new hospitals
◼ Company restructured ownership to
consolidate 28 hospitals under MH
◼ Made the first
acquisition of a
hospital (Podomoro)
◼ Established the first
maternity hospital in
Jatinegara
1997
◼ Changed the non-profit
organization status into a
corporation named
Medikaloka Hermina (MH)
◼ Established 7 new hospitals
and acquired 3 hospitals
◼ 2011: Opened first hospital
outside Java in Palembang
◼ Established
hospitals in Depok,
Daan Mogot, and
Bogor
◼ Jatinegara was
upgraded to
Women & Children
hospital
◼ Established the
third hospital in
Bekasi
◼ Established 2 new hospitals
and acquired 1 hospital
◼ 2016: Hermina Tower was
opened
Company Milestones
Evolution on Number of Hospitals
6
◼ Established 3 new hospitals
(Samarinda, OPI Jakabaring, &
Padang) and acquired 1
hospital (Lampung)
2018
2017
28
2,780
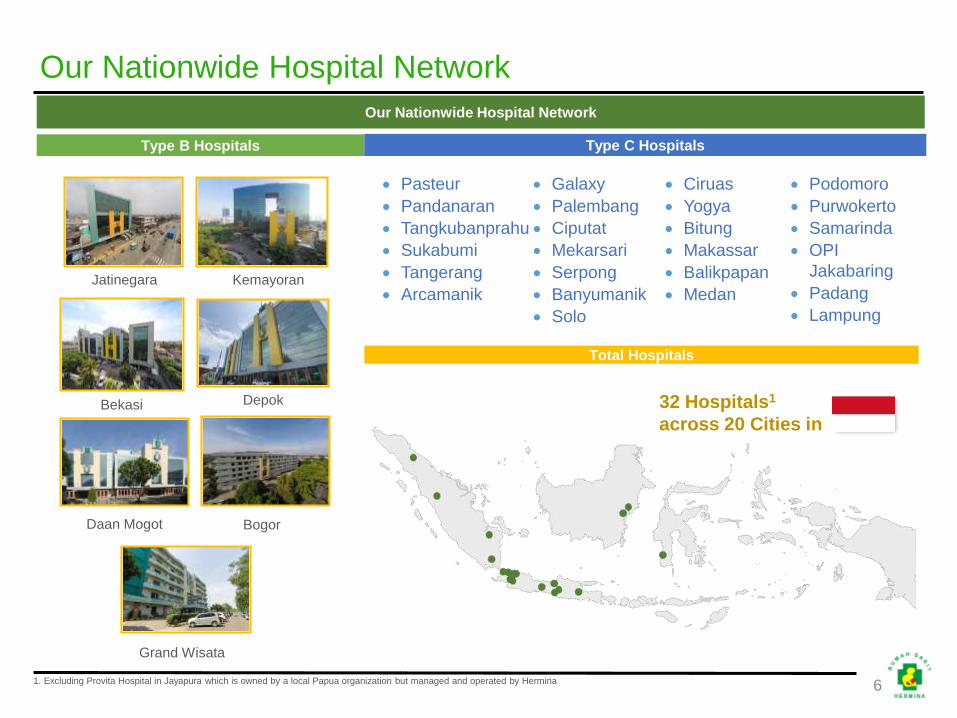
Our Nationwide Hospital Network
Type B Hospitals Type C Hospitals
Total Hospitals
• Pasteur
• Pandanaran
• Tangkubanprahu
• Sukabumi
• Tangerang
• Arcamanik
• Galaxy
• Palembang
• Ciputat
• Mekarsari
• Serpong
• Banyumanik
• Solo
• Ciruas
• Yogya
• Bitung
• Makassar
• Balikpapan
• Medan
• Podomoro
• Purwokerto
• Samarinda
• OPI
Jakabaring
• Padang
• Lampung
Jatinegara
Depok
Kemayoran
Daan Mogot
Bekasi
Bogor
Our Nationwide Hospital Network
61. Excluding Provita Hospital in Jayapura which is owned by a local Papua organization but managed and operated by Hermina
32 Hospitals1
across 20 Cities in
Grand Wisata

2. Financial Update
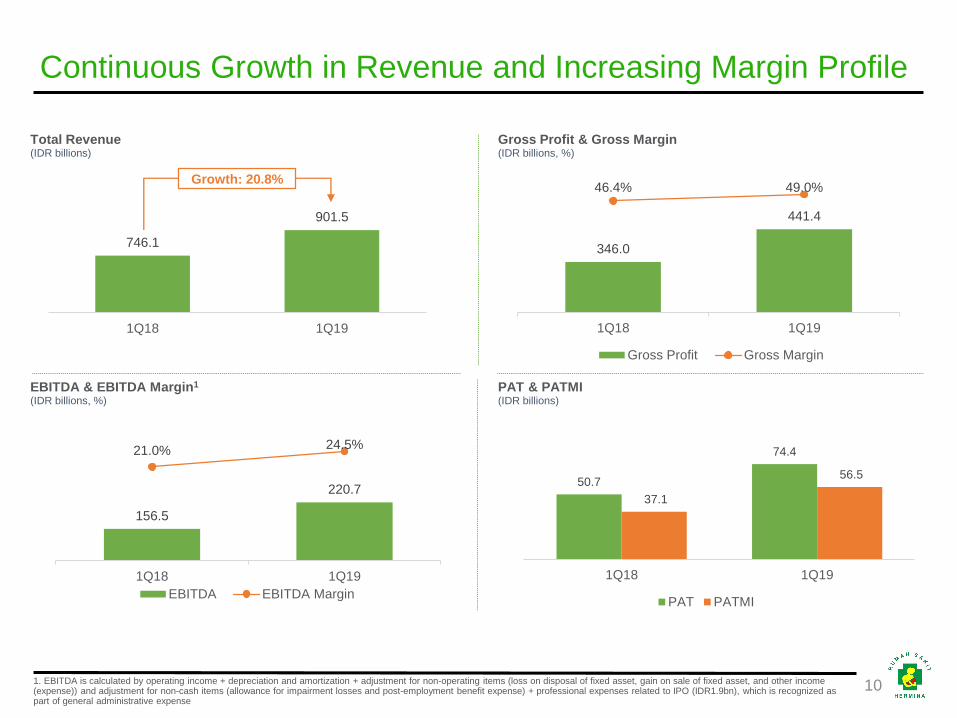
156.5
220.7
21.0% 24.5%
0.0%
5.0%
10.0%
15.0%
20.0%
25.0%
80.0
180.0
280.0
1Q18 1Q19
EBITDA EBITDA Margin
346.0
441.4
46.4% 49.0%
0.0%
10.0%
20.0%
30.0%
40.0%
50.0%
200.0
300.0
400.0
500.0
1Q18 1Q19
Gross Profit Gross Margin
746.1
901.5
1Q18 1Q19
Growth: 20.8%
Total Revenue(IDR billions)
EBITDA & EBITDA Margin1
(IDR billions, %)
1. EBITDA is calculated by operating income + depreciation and amortization + adjustment for non-operating items (loss on disposal of fixed asset, gain on sale of fixed asset, and other income (expense)) and adjustment for non-cash items (allowance for impairment losses and post-employment benefit expense) + professional expenses related to IPO (IDR1.9bn), which is recognized as part of general administrative expense
Gross Profit & Gross Margin(IDR billions, %)
10
PAT & PATMI(IDR billions)
50.7
74.4
37.1
56.5
0.0
20.0
40.0
60.0
80.0
1Q18 1Q19
PAT PATMI
Continuous Growth in Revenue and Increasing Margin Profile
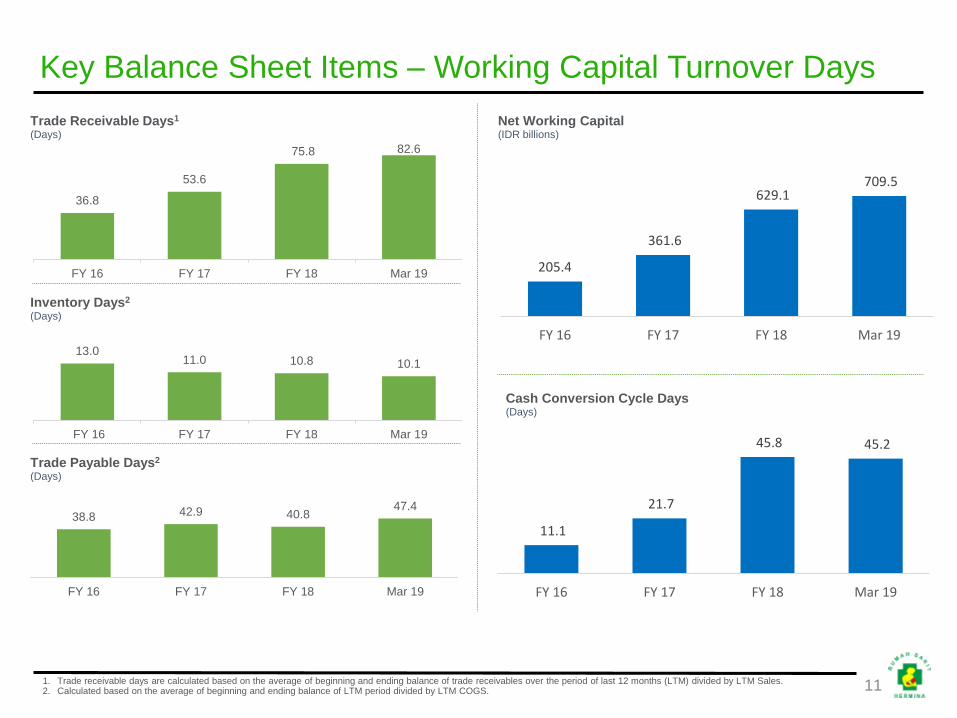
Key Balance Sheet Items – Working Capital Turnover Days
Trade Receivable Days1
(Days)
Net Working Capital(IDR billions)
Trade Payable Days2
(Days)
Cash Conversion Cycle Days(Days)
Inventory Days2
(Days)
111. Trade receivable days are calculated based on the average of beginning and ending balance of trade receivables over the period of last 12 months (LTM) divided by LTM Sales.2. Calculated based on the average of beginning and ending balance of LTM period divided by LTM COGS.
36.8
53.6
75.8 82.6
FY 16 FY 17 FY 18 Mar 19
38.8 42.9 40.847.4
FY 16 FY 17 FY 18 Mar 19
13.0 11.0 10.8 10.1
FY 16 FY 17 FY 18 Mar 19
205.4
361.6
629.1 709.5
FY 16 FY 17 FY 18 Mar 19
11.1
21.7
45.8 45.2
FY 16 FY 17 FY 18 Mar 19
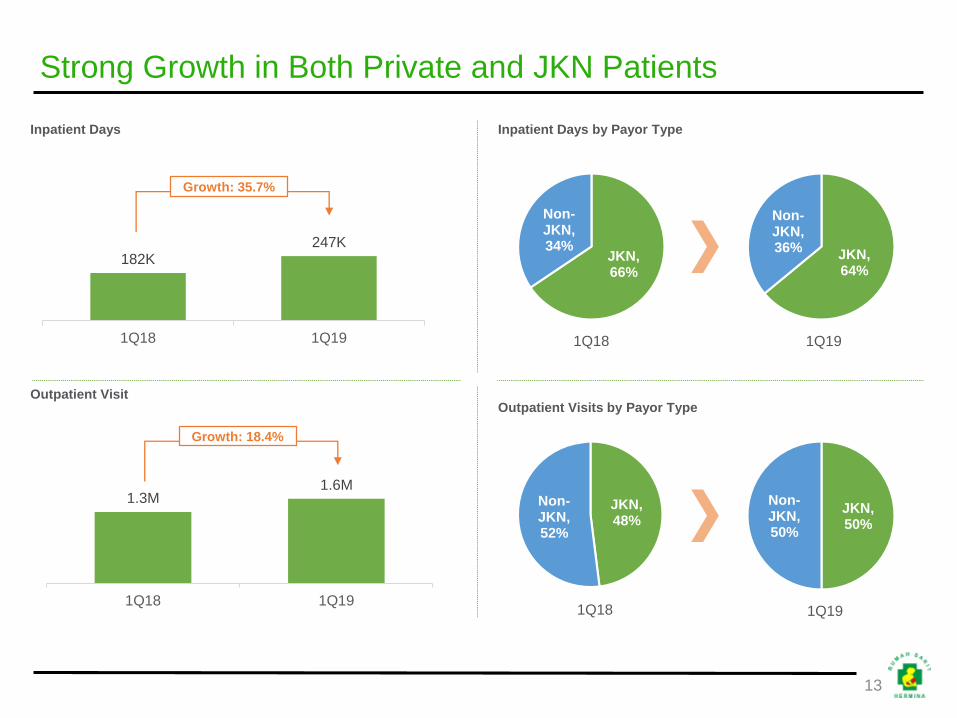
182K247K
1Q18 1Q19
Inpatient Days Inpatient Days by Payor Type
Outpatient VisitOutpatient Visits by Payor Type
1Q18 1Q19
1Q18 1Q19
13
Growth: 35.7%
1.3M1.6M
1Q18 1Q19
Growth: 18.4%
JKN, 66%
Non-JKN, 34%
JKN, 64%
Non-JKN, 36%
JKN, 48%
Non-JKN, 52%
JKN, 50%
Non-JKN, 50%
Strong Growth in Both Private and JKN Patients
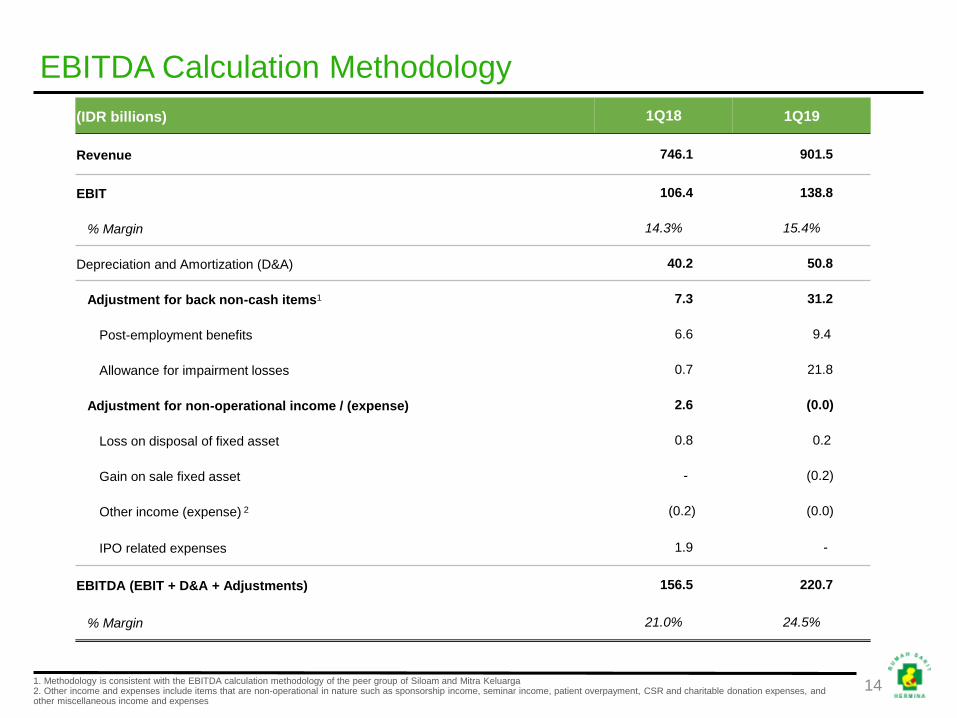
EBITDA Calculation Methodology
(IDR billions) 1Q18 1Q19
Revenue 746.1 901.5
EBIT 106.4 138.8
% Margin 14.3% 15.4%
Depreciation and Amortization (D&A) 40.2 50.8
Adjustment for back non-cash items1 7.3 31.2
Post-employment benefits 6.6 9.4
Allowance for impairment losses 0.7 21.8
Adjustment for non-operational income / (expense) 2.6 (0.0)
Loss on disposal of fixed asset 0.8 0.2
Gain on sale fixed asset - (0.2)
Other income (expense) 2 (0.2) (0.0)
IPO related expenses 1.9 -
EBITDA (EBIT + D&A + Adjustments) 156.5 220.7
% Margin 21.0% 24.5%
141. Methodology is consistent with the EBITDA calculation methodology of the peer group of Siloam and Mitra Keluarga2. Other income and expenses include items that are non-operational in nature such as sponsorship income, seminar income, patient overpayment, CSR and charitable donation expenses, and other miscellaneous income and expenses
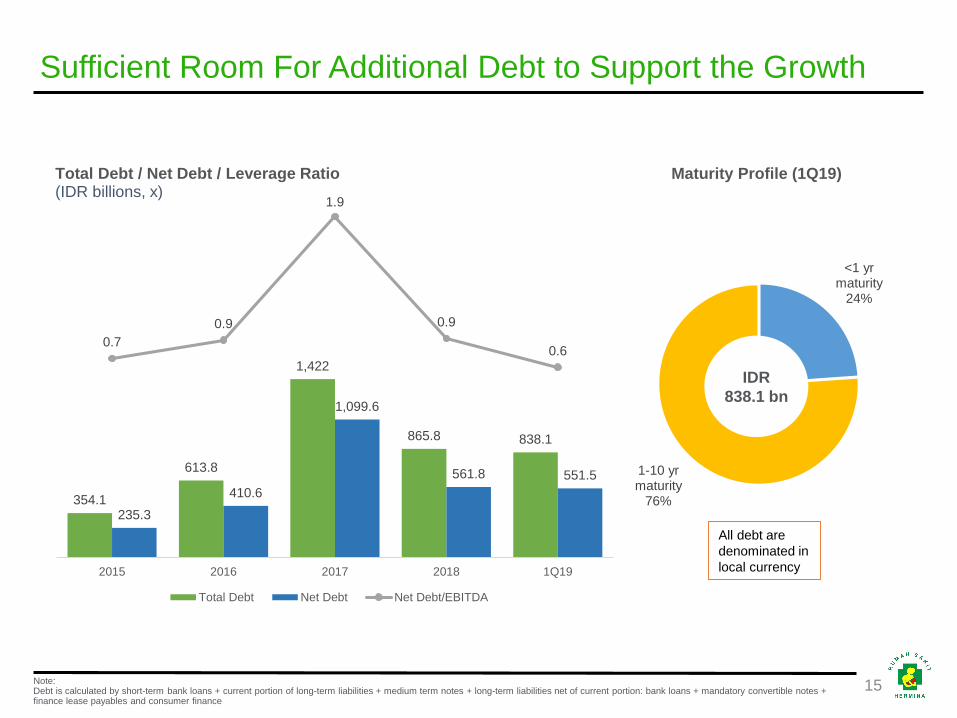
Total Debt / Net Debt / Leverage Ratio(IDR billions, x)
Note: Debt is calculated by short-term bank loans + current portion of long-term liabilities + medium term notes + long-term liabilities net of current portion: bank loans + mandatory convertible notes + finance lease payables and consumer finance
15
Maturity Profile (1Q19)
354.1
613.8
1,422
865.8 838.1
235.3
410.6
1,099.6
561.8 551.5
0.7
0.9
1.9
0.9
0.6
-1.0
-0.5
0.0
0.5
1.0
1.5
2.0
0.0
500.0
1000.0
1500.0
2000.0
2500.0
2015 2016 2017 2018 1Q19
Total Debt Net Debt Net Debt/EBITDA
<1 yr maturity
24%
1-10 yr maturity
76%
IDR
838.1 bn
All debt are
denominated in
local currency
Sufficient Room For Additional Debt to Support the Growth
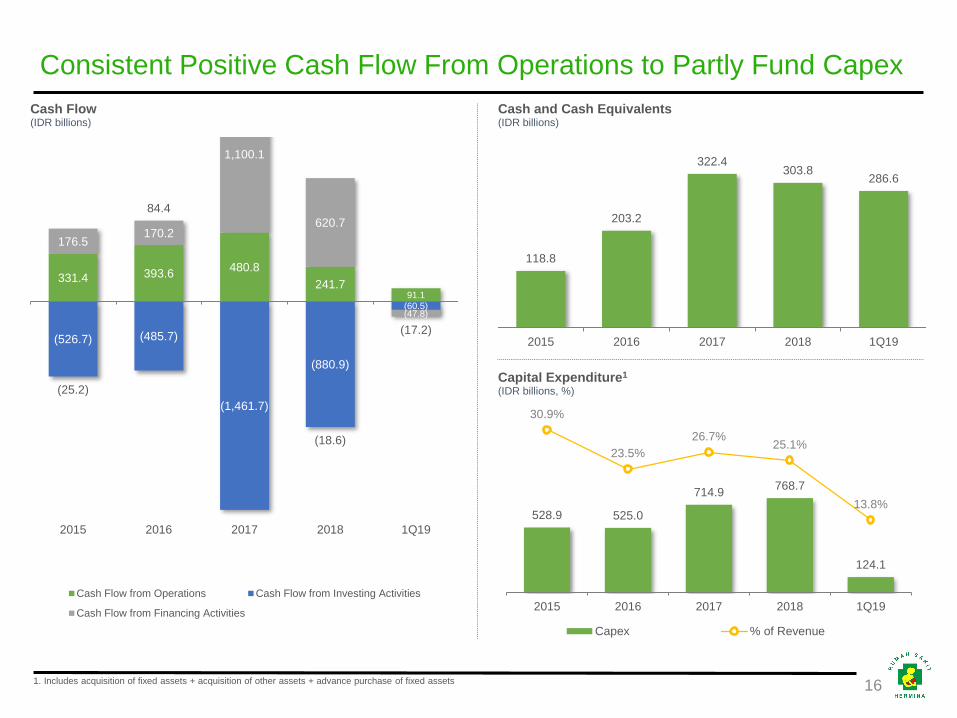
Cash Flow(IDR billions)
Cash and Cash Equivalents(IDR billions)
Capital Expenditure1
(IDR billions, %)
118.8
203.2
322.4 303.8
286.6
2015 2016 2017 2018 1Q19
331.4 393.6 480.8
241.791.1
(526.7) (485.7)
(1,461.7)
(880.9)
(60.5)
176.5 170.2
1,100.1
620.7
(47.8)
(25.2)
84.4
(18.6)
(17.2)
2015 2016 2017 2018 1Q19
Cash Flow from Operations Cash Flow from Investing Activities
Cash Flow from Financing Activities
528.9 525.0
714.9 768.7
124.1
30.9%
23.5%
26.7% 25.1%
13.8%
0.0%
5.0%
10.0%
15.0%
20.0%
25.0%
30.0%
35.0%
0%
10000%
20000%
30000%
40000%
50000%
60000%
70000%
80000%
90000%
100000%
110000%
120000%
130000%
140000%
150000%
2015 2016 2017 2018 1Q19
Capex % of Revenue
1. Includes acquisition of fixed assets + acquisition of other assets + advance purchase of fixed assets 16
Consistent Positive Cash Flow From Operations to Partly Fund Capex

3. Hospital Development
18
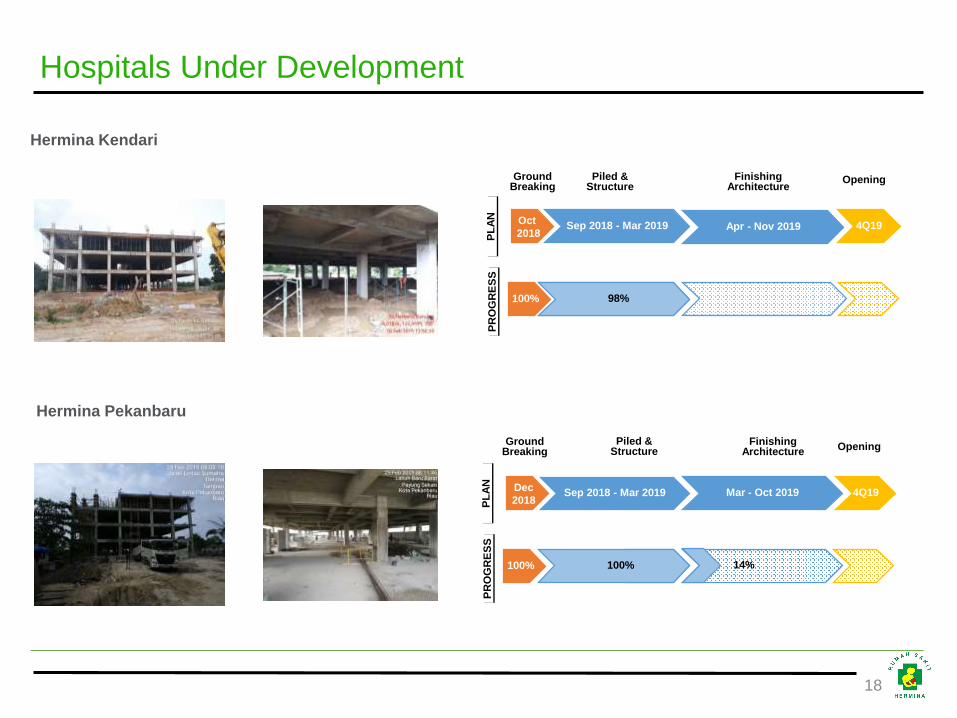
Hospitals Under Development
Hermina Kendari
Oct
2018Apr - Nov 2019Sep 2018 - Mar 2019 4Q19
OpeningGroundBreaking
Piled & Structure
Finishing Architecture
PL
AN
100%
PR
OG
RE
SS
98%
Hermina Pekanbaru
Dec
2018Mar - Oct 2019Sep 2018 - Mar 2019 4Q19
OpeningGround
BreakingPiled &
StructureFinishing
Architecture
PL
AN
100% 100%
PR
OG
RE
SS
14%

PT Medikaloka Hermina Tbkwww.herminahospitals.com