Embed Size (px)
Citation preview

PT. Indosat Tbk.
Full Year 2016 Results
2PT Indosat Tbk – FY 2016 Results
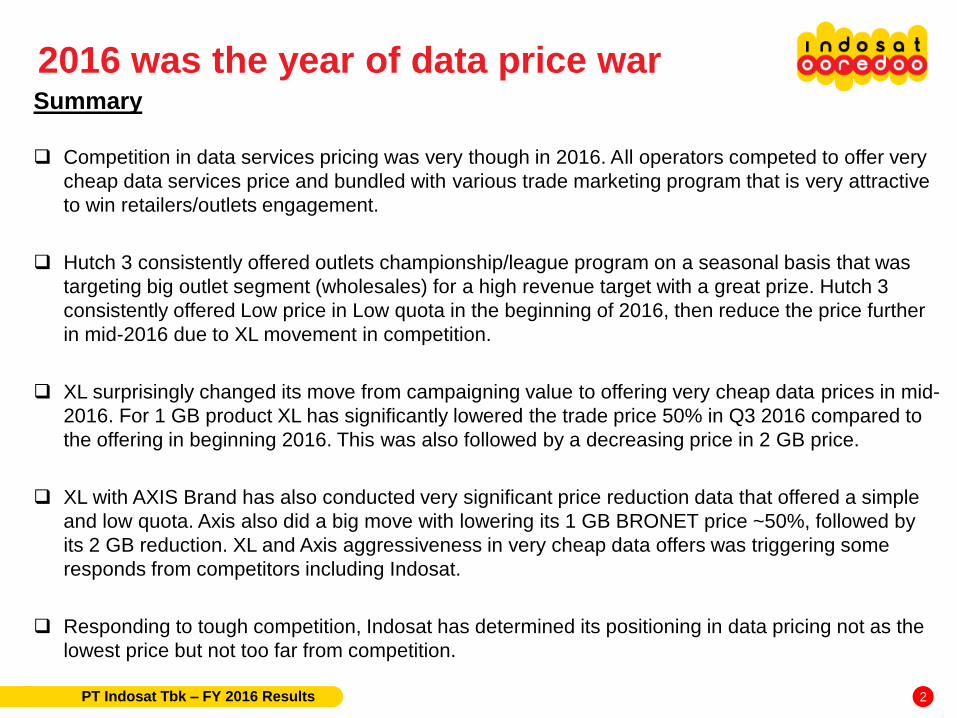
2016 was the year of data price warSummary
Competition in data services pricing was very though in 2016. All operators competed to offer very
cheap data services price and bundled with various trade marketing program that is very attractive
to win retailers/outlets engagement.
Hutch 3 consistently offered outlets championship/league program on a seasonal basis that was
targeting big outlet segment (wholesales) for a high revenue target with a great prize. Hutch 3
consistently offered Low price in Low quota in the beginning of 2016, then reduce the price further
in mid-2016 due to XL movement in competition.
XL surprisingly changed its move from campaigning value to offering very cheap data prices in mid-
2016. For 1 GB product XL has significantly lowered the trade price 50% in Q3 2016 compared to
the offering in beginning 2016. This was also followed by a decreasing price in 2 GB price.
XL with AXIS Brand has also conducted very significant price reduction data that offered a simple
and low quota. Axis also did a big move with lowering its 1 GB BRONET price ~50%, followed by
its 2 GB reduction. XL and Axis aggressiveness in very cheap data offers was triggering some
responds from competitors including Indosat.
Responding to tough competition, Indosat has determined its positioning in data pricing not as the
lowest price but not too far from competition.

3PT Indosat Tbk – FY 2016 Results
Facing 2017
It seems that facing 2017 all operators began to try to increase the price
of data services.
Hutch 3 has started to increase in offering its 1 GB in Feb 2017. The
same increase also happened for 2 GB package.
XL also increased its 1 GB price, followed by increasing its 2 GB price.
Indosat also has planned to increase data price as a strategic move in
improving profitability as well as strengthening Indosat positioning in the
competition.

Financial and
Operational Highlights

5
FY16 YoY Overview
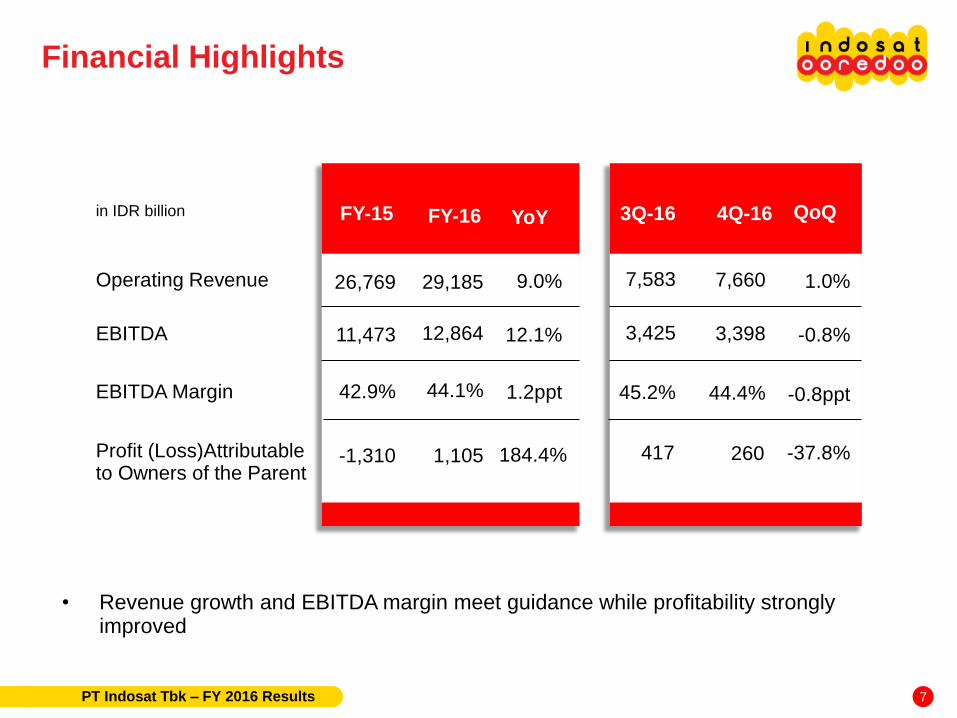
Consolidated Revenue increased 9.0% from IDR 26,769 billion to IDR 29,185 billion
EBITDA increased 12.1% from IDR 11,473 billion to IDR 12,864 billion, EBITDA Margin reached 44.1%
Profit Attributable to Owners of The Parent increased from a loss of IDR 1,310 billion to a profit of IDR 1,105 billion
Free Cash Flow increased from IDR 1,561 billion to IDR 2,460 billion
PT Indosat Tbk – FY 2016 Results

6
4Q16 QoQ Overview
Consolidated Revenue increased 1.0% from IDR 7,583 billion to IDR 7,660 billion
EBITDA decreased 0.8% from IDR 3,425 billion to IDR 3,398 billion, EBITDA Margin reached 44.4%
Profit Attributable to Owners of The Parent decreased 37.8% from IDR 417 billion to IDR 260 billion
Free Cash Flow decreased from IDR 1,307 billion to a negative IDR186 billion
PT Indosat Tbk – FY 2016 Results
Operating Revenue
EBITDA
EBITDA Margin
Profit (Loss)Attributable to Owners of the Parent
29,185
FY-15 FY-16 YoY
9.0%
12,864 12.1%
44.1% 1.2ppt
1,105 184.4%
7,660
3Q-16 4Q-16 QoQ
1.0%
3,398 -0.8%
44.4% -0.8ppt
260 -37.8%
in IDR billion
26,769
11,473
42.9%
-1,310
Financial Highlights
7
• Revenue growth and EBITDA margin meet guidance while profitability strongly improved
7,583
3,425
45.2%
417
PT Indosat Tbk – FY 2016 Results

997909
989 1,044 1,190
286228
226238
266
in IDR billion
+1.0% QoQ+6.6% YoY
CellularFixed DataFixed Voice
+11.8% / -6.9%
+14.0% / +19.3%
-1.5% / +5.1%
QoQ / YoY
4Q-15 1Q-16
Operating Revenue Breakdown
5,904
Segment Revenue Overview
2Q-16
7,187
8
5,676
6,813
3Q-16
• Quarterly cellular revenue in 4Q-16 declined after peak season in 3Q-16• Initiative in fixed data segment to provide IT service that was launched back in 1Q-16
continued to deliver a result to support revenue growth.
4Q-16
5,914
7,129
PT Indosat Tbk – FY 2016 Results
6,301
7,583
6,204
7,660

Voice
SMS
Data
VAS
1.1%
FY-16YoY
-0.4%
46.7%
39.1%
-1.4%
4Q-16QoQ
-3.3%
3.0%
0.0%Digital business initiatives pushed VAS revenue growth
Cellular Revenue Performance
9
- Marketing initiative focus on voice service was able to generate growth in voice revenue YoY while data messaging service replaced traditional SMS.
PT Indosat Tbk – FY 2016 Results
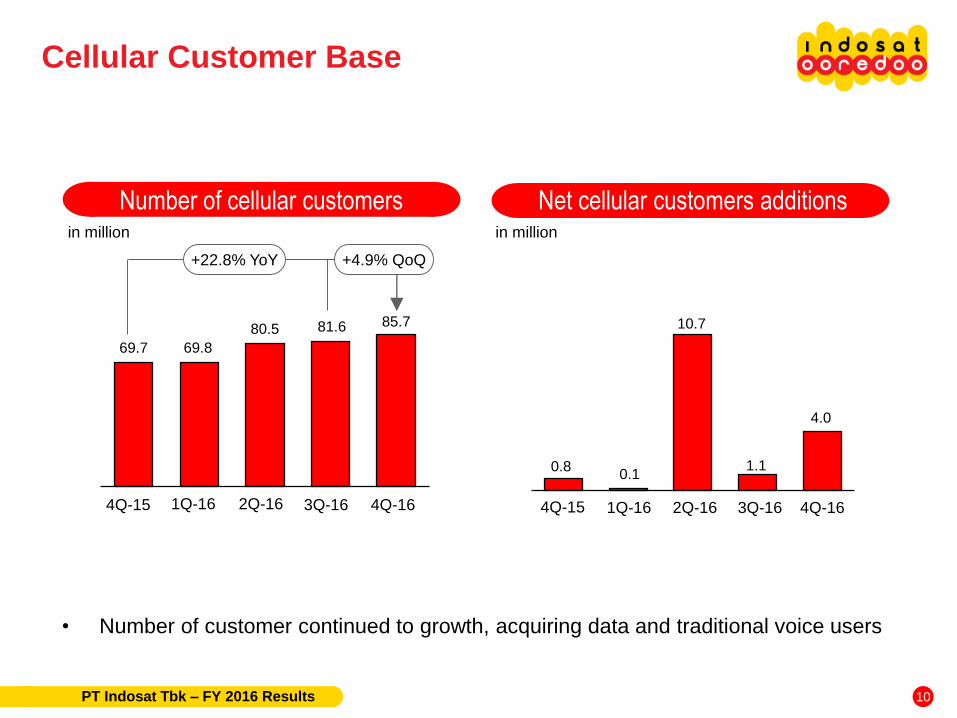
69.7 69.8
80.5 81.6 85.7
4Q-15
+22.8% YoY +4.9% QoQ
Number of cellular customersin million
4Q-15
in million
0.80.1
10.7
1.1
4.0
1Q-16 1Q-16
Net cellular customers additions
• Number of customer continued to growth, acquiring data and traditional voice users
2Q-16 2Q-16
Cellular Customer Base
10
3Q-16 3Q-164Q-16 4Q-16
PT Indosat Tbk – FY 2016 Results

ARPU and ARPM Voice Traffic and MOU
• A combination of high ARPU in Java and lower ARPU in ex-Java resulting a well managed ARPU level QoQ.
• Voice traffic maintained high coming from ex-Java area
7669 71
66 68
135 137126 124 123
15.6 14.5 15.6 16.6 16.6
+6.1% YoY
4Q-15
-0.3% QoQ
Voice Traffic
in billion minutes (Voice Traffic)
in minute/subscriber (MOU)
MOU
27.9 26.4 25.5 24.2 24.5
+1.3% QoQ-12.2% YoY
4Q-15
ARPU
in thousand IDR (ARPU)
ARPM
1Q-161Q-16 2Q-16 2Q-16
in IDR (ARPM)
ARPU maintained
11
3Q-16 3Q-164Q-16 4Q-16
PT Indosat Tbk – FY 2016 Results

Data Usage SMS Delivered
• Increase in data traffic driven by increase in number of data user and consumption per user
• SMS traffic continued to decline as trend shifting toward messaging application.
59
5255
4944
57,276 63,987
93,641
146,060
188,101
in TByte
+28.8% QoQ+228.4% YoY
4Q-15
in billion
-26.7% YoY -11.1% QoQ
1Q-16 4Q-152Q-16 1Q-16
Strong Data Usage
2Q-16
12
3Q-16 3Q-164Q-16 4Q-16
PT Indosat Tbk – FY 2016 Results

• Moderated operational expenses• Continued improvement in operational process
Cost of Service (CoS)
Depreciation and Amortization
Personnel
Marketing
as percentage of revenue
General and Administration
Total Expenses
Total Operating Expenses
Operational expenses
4Q-15
42.1%
35.1%
7.6%
6.8%
3.0%
94.7%
59.6%
13
1Q-16
40.4%
32.6%
7.8%
4.7%
3.7%
89.1%
56.5%
2Q-16
41.4%
31.3%
7.3%
4.9%
3.2%
88.1%
56.8%
PT Indosat Tbk – FY 2016 Results
3Q-16
40.6%
29.9%
6.8%
4.0%
3.5%
84.8%
54.9%
4Q-16
40.9%
29.4%
7.2%
3.5%
4.0%
85.1%
55.6%

2,906 2,961 3,0803,425 3,398
EBITDA and EBITDA margin
-0.8% QoQ+17.0% YoY
EBITDA
in IDR billion
EBITDA Margin
4Q-15
EBITDA margin in line with guidance
1Q-16
EBITDA performance
2Q-16
40.4%
14
43.5%
3Q-16 4Q-16
43.2%
PT Indosat Tbk – FY 2016 Results
45.2% 44.4%

Net profit
Improvement in operational level combinewith stable currency movement and lowUSD debt resulted positive net profit
-2,008
-1,310
1,105
+184.4% YoY+34.8% YoY
FY-16FY-15FY-14*
in IDR billion
* Restated due to implementation of PSAK 24 (revised 2013) effective 1 January 2015
Net profit
15PT Indosat Tbk – FY 2016 Results

2.73
2.42
1.84
27,346 27,72123,725
2.38
2.10
1.70
23,866 24,098 21,874
Gross debt* and gross debt/EBITDA Net debt* and net debt/EBITDA
• Currency mixed has improved and shall continue toward lower USD debt portionfollowed by further downward debt level
* IDR 4.05tn, IDR 3.97tn and IDR 3.51tn of obligation under finance lease are included in FY14, FY15 and FY16 respectively
FY-15FY-14 FY-16
-14.4% YoY
Gross Debt
in IDR billion
Gross Debt/EBITDA
FY-16FY-14 FY-15
Net Debt Net Debt/EBITDA
in IDR billion
Balance sheet
-9.2% YoY
16PT Indosat Tbk – FY 2016 Results

37.6
24.4
29.725.2
21.1 2,699
1,6632,117 1,910
1,603
Free cash flow Capex and Capex/Revenue
• Capex disbursement for FY-2016 was in line with guidance
in IDR billion
-1,392
463
8771,307
-186
4Q-15*
4Q-15
Capex
in IDR billion
Capex/Revenue1Q-16
1Q-16
2Q-16
2Q-16
Free cash flow & Capex
17
3Q-16
3Q-16
in %
4Q-16
4Q-16
* Reclassification from repayment of obligation under finance lease
PT Indosat Tbk – FY 2016 Results

Number of BTS Data User
• 4G coverage has reached 112 cities and counting• Data users are steadily growing with 1.7Gb/month usage on average.
23,596 23,714 23,793 23,859 24,042
23,730 25,068 25,816 26,273 27,724
3,361 3,544 3,724 4,080 4,717
+4.2% QoQ+11.4% YoY
3Q-16
2G3G
In million
4Q-15
52,326
1Q-16 4Q-15 1Q-16 2Q-16
34.031.2
35.139.4 40.5
+2.8% QoQ+19.1% YoY
Network & Data User
2Q-16
50,687
4G
18
3Q-164Q-16
53,333
4Q-16
PT Indosat Tbk – FY 2016 Results
54,212 56,483

Management focus
& Key updates

Management Focus
20
● Continue to transform Indosat Ooredoo to
become the leading digital telco in
Indonesia, both from a product offering
perspective as well as the way it interacts
with its stake holders
● Continue to build operational excellence
and efficiency as part of the company
culture
● To explore industry synergies to become
more efficient and effective
● To further strengthen the corporate (b2b)
offering to build a stable base through
connectivity and services.
PT Indosat Tbk – FY 2016 Results
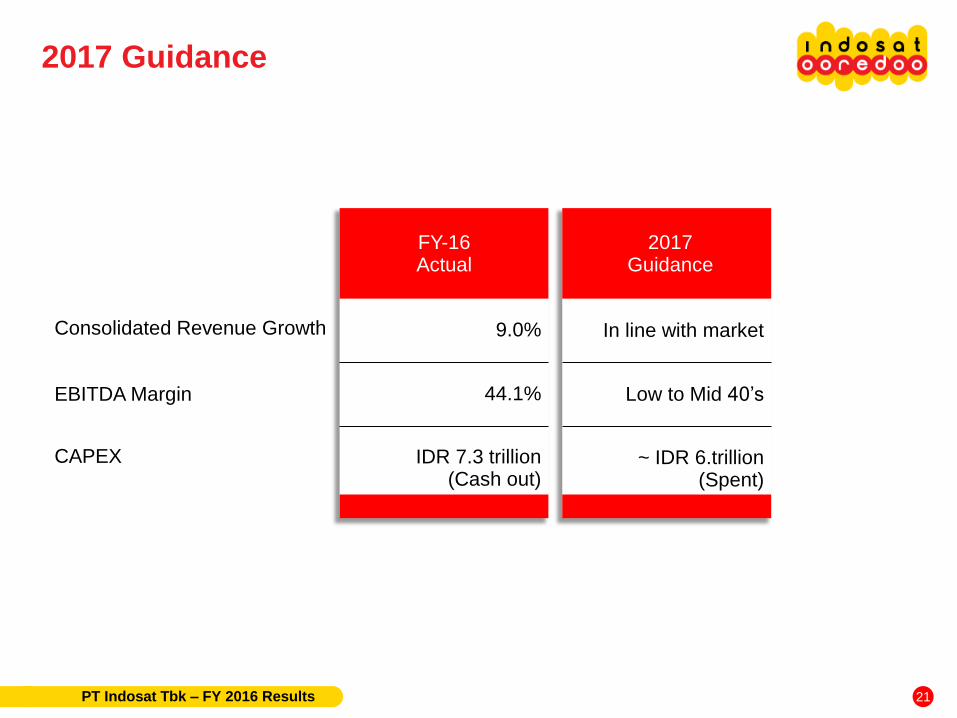
FY-16 Actual
2017 Guidance
Consolidated Revenue Growth 9.0% In line with market
EBITDA Margin 44.1% Low to Mid 40’s
CAPEX IDR 7.3 trillion(Cash out)
~ IDR 6.trillion(Spent)
2017 Guidance
21PT Indosat Tbk – FY 2016 Results

Thank YouInvestor Relations & Corporate SecretaryJl. Medan Merdeka Barat No. 21Jakarta - 10110Tel: +62 21 [email protected]

Supplemental
Information
On September 16, 2014, the South Jakarta Attorney Office (“Kejaksaan
Negeri Jakarta Selatan”), without preliminary notification, executed the
Supreme Court’s Decision on Mr. Indar Atmanto. The execution was
done based on a quotation of the Supreme Court’s Decision, which
states, among others, that (i) Mr. Indar Atmanto is found guilty and
sentenced to eight years imprisonment and charged with penalty of
Rp300,000,000,- (if the penalty is not paid, Mr. Indar Atmanto would
serve an additional six months imprisonment), and (ii) IM2 pay the
losses sustained by the State amounting to Rp1,358,343,346,674,-.
Subsequently, on January 16, 2015, Mr.Indar Atmanto and/or his lawyer
or IM2 received the document on the Supreme Court’s decision
regarding the litigation case. As of the issuance date of the consolidated
financial statements, Mr. Indar Atmanto and IM2 plan to conduct further
legal act by submitting a reconsideration request peninjauan kembali
(”PK”).
On March 16, 2015, Mr. Indar Atmanto’s submission of Judicial Review
[Peninjauan Kembali (”PK”)] was officially registered at the Corruption
Court under No. 08/AKTA.PID.SUS/PK/TPK/2015/PN.Jkt.Pst.
On November 4, 2015, the Supreme Court’s official website announced
that the Judicial Review filed by Mr. Indar Atmanto was rejected based
on Supreme Court’s decision dated October 20, 2015. However, no
detailed information regarding the exact content of such Supreme
Court’s decision was available. As of the issuance date of the interim
consolidated financial statements, the official copy of such Supreme
Court’s decision hasn’t been received.
IM2 case development
24PT Indosat Tbk – FY 2016 Results

On January 17, 2017, S&P Global Ratings affirmed its 'BB+' long-term corporate credit
rating on PT Indosat Tbk. The outlook remains positive. At the same time, they affirmed
their 'axBBB+' long-term ASEAN regional scale rating on the Indonesia-based
telecommunications company.
On 1 December 2016, PEFINDO has affirmed its “idAAA” rating for PT Indosat Tbk
(ISAT)’s Bonds VII Year 2009 Serie B of IDR600 billion and its “idAAA(sy)” rating for ISAT’s
Sukuk Ijarah IV Year 2009 Serie B of IDR172 billion that will mature on December 8, 2016.
ISAT should be able to repay the maturing Bond and Sukuk Ijarah using its internal fund.
As of September 30, 2016, it had cash and cash equivalents amounting to IDR2.4 trillion.
On 13 December 2016, Moody's Investors Service has affirmed Indosat Tbk. (P.T.)'s Ba1
corporate family rating, combines The company's standalone credit strength, which
reflects its established market position, their expectation of moderate growth in the
cellular market, and an improving macro environment. However, competition, especially in
mobile data space, will continue to pressure EBITDA margins although we expect them to
remain high for the rating level around 50%.
On 9 August 2016, Fitch Ratings Indonesia has assigned National Long-Term Ratings of
'AAA(idn)' to PT Indosat Tbk's (Indosat Ooredoo: Long-Term IDR BBB/National Rating
AAA(idn)/Stable) IDR3,172bn senior unsecured bonds and IDR288bn sukuk ijarah issues.
The issues are launched from Indosat Ooredoo's IDR9trn bond programme and IDR1trn
sukuk ijarah programme - affirmed at 'AAA(idn)' on 15 March 2016 - and are consequently
rated at the same level as the programmes.
Credit ratings
25PT Indosat Tbk – FY 2016 Results

1.88 0.27 0.27
5.94
2.56
3.62
0.95 1.10
2.08
0.12 0.36 0.81
0.26
In IDR trillion
20202019 202220182017
IDR
USD in IDR
2021 2024
* Excluding obligation under capital lease
2023
Debt maturity profile*
26PT Indosat Tbk – FY 2016 Results
2025 2026

Number of BTS
2 x 10.0
900 Mhz
2 x 7.5
2 x 7.5
Indosat
Telkomsel
XL Axiata
2 x 20.0
1800 Mhz
2 x 22.5
2 x 22.5
2 x 10.0
2100 Mhz
2 x 15.0
2 x 15.0
in Mhz
Hutchison - 2 x 10.0 2 x 10.0
2 x 2.5
850 Mhz
2 x 4.5
-
-
15.0*
2300 Mhz
15.0
-
-
* Indosat/IM2: West Java exclude Bogor, Depok & Bekasi
Spectrum overview
27
2020 2020 2020 2019 & 2026 2019Valid until
PT Indosat Tbk – FY 2016 Results

• PT Indosat Tbk ( “Indosat” or “Company” ) cautions investors that certain statements contained in this document state its management's intentions, hopes, beliefs, expectations, or predictions of the future are forward-looking statements
• The Company wishes to caution the reader that forward-looking statements are not historical facts and are only estimates or predictions. Actual results may differ materially from those projected as a result of risks and uncertainties including, but not limited to:
• The Company’s ability to manage domestic and international growth and maintain a high level of customer service
• Future sales growth
• Market acceptance of the Company’s product and service offerings
• The Company’s ability to secure adequate financing or equity capital to fund our operations
• Network expansion
• Performance of the Company’s network and equipment
• The Company’s ability to enter into strategic alliances or transactions
• Cooperation of incumbent local exchange carriers in provisioning lines and interconnecting our equipment
• Regulatory approval processes
• Changes in technology
• Price competition
• Other market conditions and associated risks
• The company undertakes no obligation to update publicly any forward-looking statements, whether as a result of future events, new information, or otherwise
Disclaimer
28PT Indosat Tbk – FY 2016 Results