Embed Size (px)
Citation preview
Walden UniversityScholarWorks
Walden Dissertations and Doctoral Studies Walden Dissertations and Doctoral StudiesCollection
2018
Psychological Uncertainty, Stress, Frustration andtheir Relationship with CounterproductiveWorkplace BehaviorJoan M. NorwoodWalden University
Follow this and additional works at: https://scholarworks.waldenu.edu/dissertations
Part of the Social and Behavioral Sciences Commons
This Dissertation is brought to you for free and open access by the Walden Dissertations and Doctoral Studies Collection at ScholarWorks. It has beenaccepted for inclusion in Walden Dissertations and Doctoral Studies by an authorized administrator of ScholarWorks. For more information, pleasecontact [email protected].
Walden University
College of Social and Behavioral Sciences
This is to certify that the doctoral dissertation by
Joan M. Norwood
has been found to be complete and satisfactory in all respects, and that any and all revisions required by the review committee have been made.
Review Committee
Dr. Jason Etchegaray, Committee Chairperson, Psychology Faculty Dr. Lori Lacivita, Committee Member, Psychology Faculty Dr. James Brown, University Reviewer, Psychology Faculty
Chief Academic Officer Eric Riedel, Ph.D.
Walden University 2018
Abstract
Psychological Uncertainty, Stress, Frustration and, and their Relationship with
Counterproductive Workplace Behavior
by
Joan M. Norwood
Dissertation Submitted in Partial Fulfillment
of the Requirements for the Degree of
Doctor of Philosophy
Organizational Psychology
Walden University
August 2018
Abstract
The overall problem this research addresses is the costly impact of counterproductive
work behaviors. The purpose of this study was to examine whether uncertainty, stress, or
frustration are related to variability, or in predicting counterproductive work behaviors.
Wavering economic conditions have steadily altered work environments, and with
continuous work changes are growing feelings of uncertainty, concerns of employee and
organizational safety, performance, and overall wellbeing. The social exchange theory
and the workplace social exchange network were used in this study to better understand
employee relationships and response behaviors. Research questions compared the
relationships among perceived uncertainty, stress, frustration, and levels of
counterproductive work behaviors. For this study, a sample of 180 volunteers completed
the Psychological Uncertainty Scale, the Perceived Stress Scale-10, the Frustration Scale,
and the Counterproductive Work Behavior Checklist-10. Volunteers were recruited via
invitation by Findparticipants.com. and SurveyMonkey® hosted the data collection. This
non-experimental, quantitative study employed a survey design, and multiple linear
regression analysis were used to test the hypotheses. Regression analyses indicated a
significant relationship between frustration and counterproductive work behaviors (t =
4.269, p < .001); however, the relationship of uncertainty and stress with
counterproductive behaviors was not statistically significant. Predicting employee
negative behaviors and gaining a better understanding of factors with negative influences
on work behavior allows leadership the opportunity to develop more sustainable
strategies designed to influence and encourage positive social change.
Psychological Uncertainty, Stress, Frustration, and their relationship with
Counterproductive Workplace Behavior
by
Joan M. Norwood
Dissertation Submitted in Partial Fulfillment
of the Requirements for the Degree of
Doctor of Philosophy
Organizational Psychology
Walden University
August 2018
Dedication
I dedicate this study first to God, who through faith and prayer guided me through
this arduous and monumental task, to my husband for his patience, dedication, love and
encouragement, to my parents who both passed away during my journey and although
bittersweet, I know are very proud. I would also like to thank my children and family for
their understanding and support. I thank you all for motivating me throughout this entire
process!
Acknowledgments
A journey of this magnitude could not be accomplished without the assistance and
guidance from others. I thank Dr. Etchegaray for providing a supportive learning
environment, encouraging me to excel, to endeavor to persevere, and in helping me to
reach this point in my academic career. I would also like to acknowledge my doctoral
committee members Dr. LaCivita and Dr. James Brown for steering in the right direction,
a big thank-you all for inspiring me to become a better scholar!
i
Table of Contents
List of Tables ..................................................................................................................... vi
List of Figures ................................................................................................................... vii
Chapter 1: Introduction to the Study ....................................................................................1
Introduction ....................................................................................................................1
Uncertainty .............................................................................................................. 5
Stress ..................................................................................................................... 6
Organizational Frustration ...................................................................................... 7
Economic Factors.................................................................................................... 8
Background of the Study ...............................................................................................9
Problem Statement .......................................................................................................10
Purpose of the Study ....................................................................................................12
Research Questions and Hypotheses ...........................................................................12
Theoretical Framework ................................................................................................13
Nature of the Study ......................................................................................................15
Operational Definitions ................................................................................................16
Counterproductive Workplace Behavior .............................................................. 16
Frustration ............................................................................................................. 16
Stress ................................................................................................................... 17
Uncertainty ............................................................................................................ 17
Assumptions, Scope and Delimitations, and Limitations ............................................17
Assumptions .......................................................................................................... 17
ii
Scope and Delimitations ....................................................................................... 18
Limitations ............................................................................................................ 18
Significance of the Study .............................................................................................20
Contribution to Organizational Practice ............................................................... 20
Implications for Social Change ............................................................................. 21
Summary and Transition ..............................................................................................22
Chapter 2: Literature Review .............................................................................................24
Introduction ..................................................................................................................24
Strategy for Literature Review.....................................................................................27
Theoretical Framework ................................................................................................28
Social Exchange Theory ....................................................................................... 28
Workplace Social Exchange Network .................................................................. 32
Perceived Organizational Support ........................................................................ 34
Counterproductive Work Behaviors ............................................................................36
Role Conflict and Ambiguity ................................................................................ 41
Emotional Abuse in the Workplace ...................................................................... 42
Workplace Exclusion ............................................................................................ 43
Employee Deviance .............................................................................................. 45
Sabotage ................................................................................................................ 47
Retrospective Studies on Counterproductive Work Behaviors ............................ 49
Perceptions of Psychological Uncertainty ............................................................ 52
Stress ..........................................................................................................................56
iii
Economic Stress, Stressors and Strains ................................................................ 56
Psychological Reactions to Stress ......................................................................... 59
Stress, Psychological and Physical Workplace Link ............................................ 60
Stress and Work Conditions.................................................................................. 63
Stress and Health................................................................................................... 64
Work Frustrations ........................................................................................................69
Subjective Well-Being and Personality ................................................................ 74
Psychosocial Factor .............................................................................................. 76
Organizational Outcomes...................................................................................... 78
Summary and Transition ..............................................................................................82
Chapter 3: Research Method ..............................................................................................86
Introduction ..................................................................................................................86
Research Design and Rationale ...................................................................................86
Methodology ................................................................................................................87
Population ............................................................................................................. 87
Procedures ............................................................................................................. 88
Instrumentation and Operationalization of Constructs ................................................90
Measures ............................................................................................................... 90
Operational Definitions of Variables ...........................................................................97
Data Analysis Plan .......................................................................................................99
Threats to Validity .....................................................................................................101
Measures for the Ethical Protection and Security of Participants ..............................102
iv
Summary and Transition ............................................................................................104
Chapter 4: Results ............................................................................................................105
Introduction ................................................................................................................105
Data Collection ..........................................................................................................106
Scales ................................................................................................................. 108
Outliers ................................................................................................................ 109
Reliability ............................................................................................................ 109
Summary of Demographic Information .............................................................. 110
Threats to External Validity ................................................................................ 112
Descriptive Statistics of Study Variables ............................................................ 113
The Assumptions of Multiple Regression..................................................................116
Testing the Assumptions ..................................................................................... 116
RQ1 – Results ..................................................................................................... 121
RQ2 – Results ..................................................................................................... 124
Summary ....................................................................................................................127
Chapter 5: Discussion, Recommendations, Conclusions .................................................129
Introduction ................................................................................................................129
Interpretation of the Findings.....................................................................................130
Limitations of the Study.............................................................................................135
Self-Report Measure ........................................................................................... 135
Scales ................................................................................................................. 136
Generalizability ................................................................................................... 137
v
Participant Pool ................................................................................................... 137
Recommendations ......................................................................................................138
Implications................................................................................................................139
Positive Social Change ....................................................................................... 139
Conclusion .................................................................................................................140
References ........................................................................................................................142
Appendix A: Counterproductive Work Behavior Checklist ............................................176
Appendix B: Psychological Uncertainty Scale ................................................................177
Appendix C: Perceived Stress Scale ................................................................................178
Appendix D : Frustration Scale........................................................................................180
Appendix E: Demographic Questionnaire .......................................................................181
vi
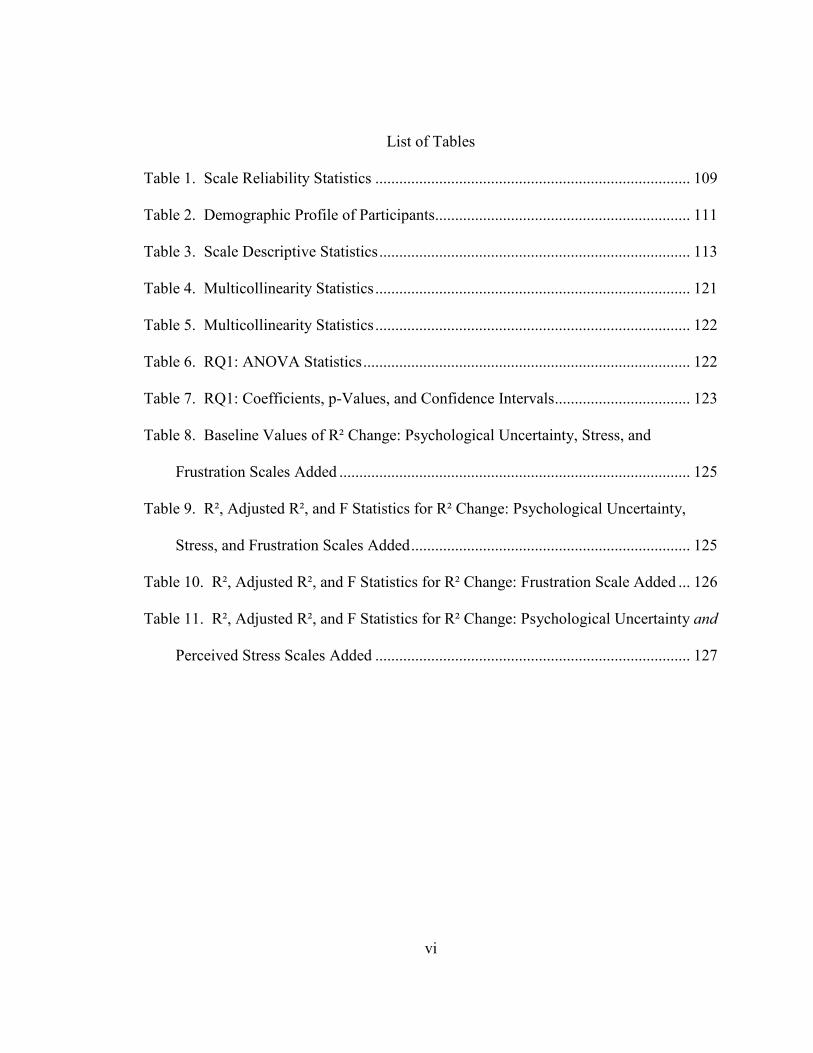
List of Tables
Table 1. Scale Reliability Statistics ............................................................................... 109
Table 2. Demographic Profile of Participants................................................................ 111
Table 3. Scale Descriptive Statistics .............................................................................. 113
Table 4. Multicollinearity Statistics ............................................................................... 121
Table 5. Multicollinearity Statistics ............................................................................... 122
Table 6. RQ1: ANOVA Statistics .................................................................................. 122
Table 7. RQ1: Coefficients, p-Values, and Confidence Intervals .................................. 123
Table 8. Baseline Values of R² Change: Psychological Uncertainty, Stress, and
Frustration Scales Added ........................................................................................ 125
Table 9. R², Adjusted R², and F Statistics for R² Change: Psychological Uncertainty,
Stress, and Frustration Scales Added ...................................................................... 125
Table 10. R², Adjusted R², and F Statistics for R² Change: Frustration Scale Added ... 126
Table 11. R², Adjusted R², and F Statistics for R² Change: Psychological Uncertainty and
Perceived Stress Scales Added ............................................................................... 127
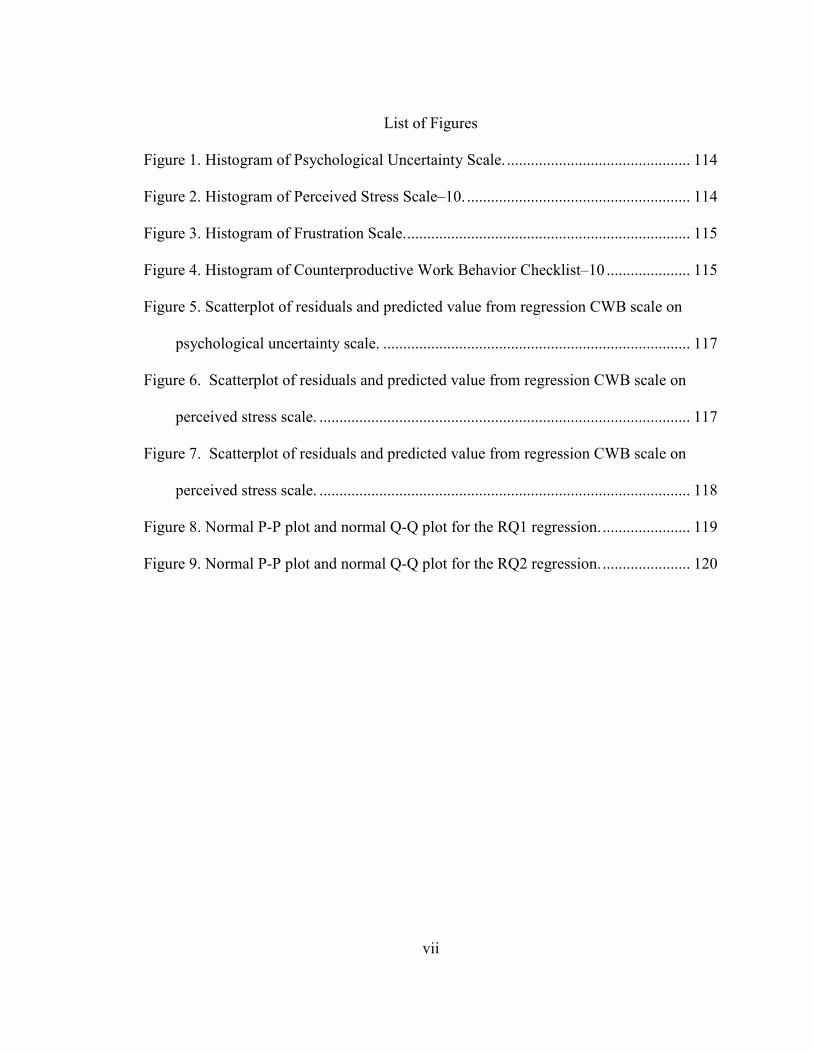
vii
List of Figures
Figure 1. Histogram of Psychological Uncertainty Scale. .............................................. 114
Figure 2. Histogram of Perceived Stress Scale–10. ........................................................ 114
Figure 3. Histogram of Frustration Scale. ....................................................................... 115
Figure 4. Histogram of Counterproductive Work Behavior Checklist–10 ..................... 115
Figure 5. Scatterplot of residuals and predicted value from regression CWB scale on
psychological uncertainty scale. ............................................................................. 117
Figure 6. Scatterplot of residuals and predicted value from regression CWB scale on
perceived stress scale. ............................................................................................. 117
Figure 7. Scatterplot of residuals and predicted value from regression CWB scale on
perceived stress scale. ............................................................................................. 118
Figure 8. Normal P-P plot and normal Q-Q plot for the RQ1 regression. ...................... 119
Figure 9. Normal P-P plot and normal Q-Q plot for the RQ2 regression. ...................... 120
1
Chapter 1: Introduction to the Study
Introduction
Counterproductive work behaviors (CWBs) are detrimental to organizational
functioning and individual wellbeing. Studies such as this dissertation are needed to
further aid in predicting employee negative behaviors and allow for gaining a better
understanding of factors which may have negative influences on individuals’ while at
work. Researchers found that employee CWBs are costly and can harm organizations and
stakeholders (Fox & Spector, 2005; Ramshida & Manikandan, 2013). Increases in stress
levels, frustration, rising health issues, frequently redesigned work responsibilities, and
changes in pay may shape work behaviors. Organizational leaders and human resource
professionals can benefit from research such as this by implementing programs and
strategies that help to change an employee’s behavior (Stephan, Patterson, & Kelly,
2013). For example, organizations can facilitate positive behavior through social change
mechanisms such as motivation, opportunity, and capability (Stephan et al., 2013). The
potential positive social change implications of this study are to help in providing
leadership a mechanism by which they can further develop more sustainable strategies
designed to influence and encourage positive work behavior.
Cohen (2016) notes that various factors may contribute to CWBs which are
directed toward organizations (e.g., purposely doing work incorrectly and destroying
organization’s property), or toward other people (e.g., insulting others, or shouting at
someone). There is a gap in knowledge and clarity in negative psychological influences
on American workers impacted by a decline in the economic climate, and related
2
behaviors. Waves of uncertainty concerning job security have impacted relationships
between supervisors and subordinates, between peer coworkers, and between employees
and their organizations (Probst, 2005). The prospect of unemployment,
underemployment, and job insecurity have created an atmosphere of added anxiety for
many Americans (Probst, 2005). These are not new phenomena; they were of concern in
the past and continue to pose similar challenges for many (Probst, 2005).
Researchers found that when employees experience job insecurity, or changes in
job status, and job loss, the end results are likely to be serious, negative, and widespread
(Probst, 2005). During the initial appraisal phase employees make an assessment of the
situation to determine its importance for their personal well-being (Richtner, Näswall,
DeCuyper, Sverke, Witte, & Hellgren, 2013). Job insecurity consequences include those
which primarily affect the individual such as decreased health, and those that influence
organizational functioning including decreased performance (Richtner et al., 2013).
More recently researchers investigated the role of self-identity (e.g., how
employees define themselves in relation to others) in relations between interpersonal
unfairness, and CWBs (Yang, Johnson, Zhang, Spector, & Xu, 2013). Self-identity “an
important self-regulatory and resource variable, was proposed to moderate unfairness-
CWB relations” (Yang et al., 2013, p. 189). Judge and Hulin (1993) noted in earlier
studies that an enduring characteristic of the American perspective, is that they view
work as an important feature in the process of creating a personal identity. Interpersonal
unfairness constitutes a job demand that overburdens employees’ affective, cognitive, and
physical resources (Yang et al., 2013). When employees are exposed to interpersonal
3
unfairness it greatly reduces their resources as they try to cope with the affective and
cognitive ramifications of the unfair exchange (Yang et al., 2013). “One of the
consequences of being exposed to job demands and the resource depletion that
accompanies it is a greater likelihood of counterproductive behavior” (Yang et al., 2013,
p. 191). Yang et al. (2013) further examined identity as a person-based resource that
could aid in offsetting the demands created by interpersonal unfairness, thus minimizing
the likelihood that CWB is elicited.
Organizational restructuring generates increased feelings of job insecurity among
today’s employees (Karkoulian, Mukaddam, McCarthy, & Messarra, 2013). Researchers
have shown increasing interest in workers’ psychological hazard exposures and work-
related stress with the onset of groundbreaking severe economic recession (Houdmont,
Kerr, & Addley, 2012). Houdmount et al. (2012) further noted that not much is known
about changes in psychological hazard exposures and work-related stress and the start of
grave economic recession.
Researchers have suggested that “job insecurity, underemployment, and
unemployment all seem to indicate that economic stressors have negative implications for
the psychological and physical health and wellbeing of affected workers” (Probst, 2005,
p. 279). The unpredictability of economic conditions has created increased acquisitions,
mergers, downsizing, and other modifications that induce feelings of job insecurity
among employees (Karkoulian et al., 2013). Extending investigations can help in the
effort to identify and minimize negative influences, and costly negative outcomes for
individuals and organizations, as well as for their families and communities. CWBs have
4
become a well-recognized issue among organizational researchers and the public; the
examination of various factors (e.g., stressors, gender) and their influence on work
behaviors extend our knowledge base (Spector & Zhou, 2014).
Researchers have characterized CWBs as a set of distinguishable acts that are
volitional in nature and cause harm or are intended to harm organizations and their
stakeholders (Spector & Fox, 2005). More recently researchers identify CWBs as
negative forms of outcome behaviors that are discretionary in nature, and that detract
from organizational functioning (Reynolds, Shoss, & Jundt, 2015). Negative outcome
behaviors include interpersonal aggression/conflict, increased workloads for others,
destruction/loss of property, and diminished organizational performance, among others
(Reynolds et al., 2015)
Researchers who set some of the groundwork in organizational behaviors adopted
the Robinson and Bennett (1995) typology differentiating between behaviors that target
the organization, and those which target people (Bennett & Robinson, 2000; Fox &
Spector, 1999; Fox et al., 2001). The prevalence of workplace deviance (e.g., physical
violence, sabotage of equipment) pose a significant threat to organizations (Bennett &
Robinson, 2000). The scope of contributing conditions has increased to include a broader
range of job stressors that stimulate the occurrence of a variety of negative emotions
(Chen & Spector, 1992; Fox et al., 2001).
Interestingly, much of the investigations on CWBs are based in the study of
human aggression (Spector et al., 2006). Researchers in various branches of psychology
such as personality, clinical psychology, and organizational psychology investigate
5
aggressiveness because of its many social implications (Antei, Birău, Chraif, Burtăverde,
& Mihăilă, 2013). Researchers seek to better understand these phenomena by
investigating various forms of aggression such as hostile aggression and instrumental
aggression, and across different contexts such as work (Antei et al., 2013). Deviant
behavior is an umbrella heading that describes CWBs under various labels such as
aggression, unethical behavior, delinquency, retaliation, revenge, violence, emotional
abuse, bullying, and misconduct (Fida, Paciello, Tramontano, & Fontane, 2015). Deviant
behaviors at work are harmful to organizations and their stakeholders (Fida et al., 2015).
Spector and Fox (2005) note in their stressor-emotion model of CWB that these
behaviors can emerge from various precipitating conditions in the perpetrator and
situation. Organizations continue to face ongoing challenges and concerns including how
uncertainty in the work environment impacts employees’ behaviors and satisfaction
(Kamel & Hashish, 2015).
Uncertainty
Most organizational leaders seek strategies which minimize employee perceived
uncertainty and increases job satisfaction (Kamel & Hashish, 2015). “There is
speculation, promoting the basic needs for autonomy, competence, and relatedness and
decreasing uncertainty at work determine the extent to which employees are satisfied
with their job” (Kamel & Hashish, 2015, p.8). Researchers found that uncertainty during
change leads workers to wonder about their futures (Schweiger & DeNisi, 1991).
Uncertainty related to change can have harmful effects on the employees’ work
experience, as well as their attitudes and work performance (Cullen, Edwards, Casper, &
6
Gue, 2014). Additionally, change-related communication has an influence on the success
of workplace change (Cullen et al., 2014). Cullen et al. (2014) further argued that
individuals’ perceptions of work environment and predispositions are crucial for
understanding how employees perceive organizational support that have an influence on
their job attitudes and performance. Individuals who are uncertain about how change will
affect their opportunities feel added stress (Bordia, Hunt, Paulsen, Tourish, & DiFonzo,
2004). Change may also affect advancement opportunities, chances for much needed
training, or job loss when the process is completed, and this period of not knowing can be
very stressful (Bordia et al., 2004). Uncertainty created by the rapid pace of change
increases stress at work, and this poses a major challenge to workers’ health and to the
success of organizations (Velciu, Drăgoiu, & Mladen, 2010).
Stress
Stress during current organizational change creates considerable strains on
organizations, workers and families, as well as communities (Sinclair, Sears, Zajack, &
Probst, 2010). Sert, Elci, Uslu, & Sener (2014) stated that understanding stress and its
relationship with other variables is important because of the negative consequences for
employees and organizations. Probst (2005) outlined predictors of economic stress at
work that described four categories: organizational change characteristics, worker
characteristics, employment characteristics, and economic factors.
Probst (2005) further discussed the role that individual differences moderators and
organizational level moderators have in either mitigating or exacerbating the
consequences of economic stress. The existing turbulent state that persists has had a
7
profound impact on employee well-being. Employees who face the prospect of job cuts
can experience a spike in symptoms of poor psychological health including anxiety, and
depression the longer the situation continues (Weinberg & Cooper, 2012). When viewed
from a psychological perspective, the prospect of uncertainty is challenging one to face
(Weinberg & Cooper, 2012). As the process of job cuts continues, the pressure created by
losing coworkers increases the workload for those that remain which in turn can increase
stress, and strain impacting health (Weinberg & Cooper, 2012). Individuals who
experience something opposite to her or his wants or desires can lead to deep frustration
(Andalib, Darun, & Azizan, 2013). Andalib et al. stated that frustration is also
experienced whenever an individual is forced to respond to something the individual
wishes to avoid.
Organizational Frustration
Palmer (2010) identified five key organizational frustrations that have a negative
impact: waste of time meetings, mis-leadership, blurred vision, silo mentality, and
unfairness. Researchers exploring how job embeddedness in the context of abusive
supervision can impact frustration, found that employees with abusive supervisors were
more inclined to be frustrated with their jobs, and engaged in more deviant behavior
(Avey, Wu, & Holley, 2015). Spector broadly defined organizational frustration as “both
interference with goal attainment or goal-oriented activity and the interference with goal
maintenance (Spector, 1978, p. 816). Spector (1978) noted that behavioral reactions have
been attributed to frustrations, these are not new phenomena, and they continue to plague
organizations. “Other people’s reactions exert a strong impact on people’s thoughts,
8
emotions, motives, and behavior, as well as their physical and psychological well-being”
(Richman & Leary, 2009, p. 365). Additionally, the economic crisis might change job
attitudes such as job satisfaction, and organizational commitment (Markovits, Boer, &
Van Dick, 2014). “Economic crisis is a threatening contextual circumstance that
influences individuals’ approaches in life and evaluations of their work situations”
(Markovits et al., 2014, p. 413).
Economic Factors
The lack of secure employment increased doubling between 2004 and 2011
(Overell, 2013). Antecedents of economic stress include rates of unemployment which
appear to be unrelenting and employee perceptions of job insecurity continues to rise
(Probst, 2005). Work conditions will continue to evolve as will empirical investigations
which seek ways to help improve the social change challenges that organizations and
individuals will face through the coming years. Voydanoff (1990) investigated economic
distress and family relations. Voydanoff identified four components as sources of
economic distress in families, and they include employment instability, employment
uncertainty, economic deprivation, and economic strain.
The economic climate and tentative recovery have sparked revolutionary changes
and modifications in work environments. The changes have undoubtedly affected
organizations (e.g. downsizing), and employees (e.g. unemployment) in a variety of ways
and have caused employees to become increasingly more skeptical and less trusting
(Tesvich & Morrow, 2010). Employee layoffs and hiring freezes create an atmosphere in
which some employees are increasingly more disillusioned and dissatisfied (Tesvich &
9
Morrow, 2010).
As organizations continue to transition, so will traditional business practices that
undergo substantial transformations with consequences and rippling effects (Weinberg &
Cooper, 2012). Work environments that become increasingly uncertain, stressful and
frustrating, significantly influence how employees perceive change initiatives (Weinberg
& Cooper, 2012). It is quite apparent that individuals need to work to pay for everyday
living expense such as food, shelter, medical, transportation, bills, and other necessities
(Weinberg & Cooper, 2012). During transformational change, relative stress, frustrations,
and uncertainty can bring out some unhealthy attitudes and related behaviors (Weinberg
& Cooper, 2012). Negative behaviors can spill over to all social environments including
family and communities with escalating consequences. An opportunity exists for
extending literature which examines influences on employee’s work behaviors, and
strategies which can help eliminate debilitating and costly negative effects (Weinberg &
Cooper, 2012).
Background of the Study
CWBs are comprised of actions that harm or are intended to harm organizations
or people in organizations (Fox & Spector, 2005). Some observed problems include
deviance (Robinson & Bennett, 1995); workplace incivility (Anderson & Pearson, 1999);
aggression (Newman & Baron, 2005); and bullying (Weinberg & Cooper, 2012). This
study focused on uncertainty (Schweiger & DeNisi, 1991); stress (Sinclair, Sears, Zajack,
& Probst, 2010); and frustration (Spector, 1978) as antecedents of CWBs in automotive
organizations throughout the United States. “Workplace deviant behavior is pervasive
10
and brings harmful implications to individuals, groups, and organizations” (Alias, Rasdi,
Ismail, & Samah, 2013, p. 161). A gap exists in studies which investigate predictors that
contribute to deviant behaviors in the workplace. Researchers have encouraged future
investigations that consider predictors which contribute to deviant behavior in private
organizations as well as public organizations (Alia et al., 2013). This study is needed so
that leadership and human resource professionals can be in a better position to understand
and develop appropriate policies and procedures to eradicate deviant behavior (Alias et
al., 2013).
Problem Statement
The overall problem this research study investigated was CWBs that harm
employees and the organizations with harmful consequences and related costs (Sulea,
2010). The research problem that was addressed is the need to better understand the
reasons for CWBs in work environments, and to identify predictors (Sulea, 2010).
Researchers describe, analyzed, and provided examples of CWBs in various conceptual
forms (Fox et al., 2001; Martinko, Gundlach, & Douglas, 2002). Studies on the predictors
of CWBs include responses from individuals to frustration. This area of research has
received strong empirical support maintaining the position that employee deviance is an
emotional reaction to the experience of job related frustration stress (Fox et al., 2001).
Bennett and Robinson also found a strong correlation between frustration and
interpersonal CWBs.
Studies such as this one can provide valuable information to organizational
leadership who can then develop more consistent and sustainable strategies designed to
11
minimize negative occurrences (Alias et al., 2013). I focused on a broader approach by
investigating two dimensions of counterproductive work behaviors: interpersonal and
organizational (Bennett & Robinson, 2000), and related categories (Spector et al., 2006).
Much of research on workplace behavior has concentrated on factors which pave the way
to effective employee functioning; ineffective or destructive actions are ubiquitous in
present day organizations (Spector & Fox, 2005).
Assessing additional predictors such as employee uncertainty, stress, and
frustration and their relationship with different types of CWBs is an important aspect of
organizational performance studies (Alias et al., 2013). Data that is collected from self-
reported rationalizations and justifications for engaging in CWBs provides valuable
insight (Wanek, 1999). Work performance is of interest to organizations worldwide, and
a topic of great interest to researchers in various fields of study such as those in
management, occupational health, and work and organizational psychology (Koopmans
et al. 2011).
A meaningful gap exists in research that investigate predictors that contribute to
deviant behaviors in the workplace (Alias et al., 2013). Future investigations should
consider more predictors that contribute to deviant behavior in private organizations as
well as public organizations (Alias et al., 2013). This study is needed to gain more insight
of organizational climate, and factors such as uncertainty, stress, and frustration that have
an association with levels of CWBs in the United States during economic undulations.
This investigation allows organizational leaders the opportunity to develop sustainable
initiatives and strategies that influence and encourage positive social change.
12
Purpose of the Study
The purpose of this study was to quantitatively examine the correlation among the
independent variables of perceived uncertainty, stress, and/or frustration, and the
dependent variable CWBs. This study investigated negative influences on workplace
behavior and expanded our understanding of CWB and its costly impact on organizations
and individuals (Alias et al., 2013).
Research Questions and Hypotheses
The research questions for this study were derived from the review of existing
literature on workplace psychological uncertainty, perceived stress, frustration and
CWBs. Is there a correlation between the independent variables (IV’s) of psychological
uncertainty, as measured by Rafferty, Alannah, and Griggin’s (2006) psychological
uncertainty scale; perceived stress, as measured by Cohen, Kamarack, and Mermelstein’s
(1983) perceived stress scale; and frustration, as measured by Peters, O’Connor, and
Rudolph’s (1980) frustration scale; with the dependent variable (DV) of CWB, as
measured by Spector, Bauer, and Fox’s (2010) counterproductive work behavior
checklist?
Reacher Question 1: Does perceived employee uncertainty, stress, and/or
frustration predict CWBs during periods of organizational transformations, and
throughout their work careers?
Ho1: Perceived employee uncertainty, stress, and/or frustration does not
predict their CWBs during periods of organizational transformations, and
throughout their work careers.
13
Hα1: Perceived employee uncertainty, stress, and/or frustration predicts their
CWBs during periods of organizational transformations, and throughout their work
careers.
Research Question 2: Are perceived employee uncertainty, stress, and/or
frustration scores useful in explaining variability in CWBs during periods of
organizational transformations, and throughout their work careers?
Ho2: Perceived employee uncertainty, stress, and/or frustration scores are not
useful in explaining variability in CWBs during periods of organizational
transformations, and throughout their work careers.
Hα2: Perceived employee uncertainty, stress, and/or frustration scores are useful
in explaining variability in CWBs during periods of organizational transformations, and
throughout their work careers.
Theoretical Framework
The theoretical framework for this dissertation is based in social exchange, and
the process of interpersonal relationships in organizations. The social exchange
framework (SET) is used in this study to better understand employee interactions, and
response behaviors. It is a platform from which to build a better understanding of how
organizational practices influence employee attitudes. Homans’s (1958) social exchange
theory (SET) which influenced the study of human relationships (Treviño, 2006) is the
theoretical framework used in this study. The social exchange theory is utilized in many
organizational studies to gain a better understanding of factors that have an impact on
social relationships and behaviors in work environments (Cropanzano & Mitchell, 2005;
14
Cohen-Charach & Muller, 2007; Colquitt et al., 2013; Chernyak-Hai & Tziner, 2014).
Additionally, the SET influenced the thinking of social scientists, Blau for example,
acknowledged the influence that George C. Homans had on his work despite some
fundamental differences in approach (Blau, 1986).
In the context of this study, SET allows an understanding of different forms of
exchange, and how individual perceptions of exchange orientations such as positive or
negative treatment influence work related behaviors (Cropanzano & Mitchell, 2005).
Furthermore, this framework serves as a guideline to better understand work behaviors
that have a negative impact on organizations, and their stakeholders. Key elements in the
conceptual frame work of this study focuses on the work relationships and the correlation
among independent variables of uncertainty, stress, and frustration, and levels of CWBs
the dependent variable. The SET framework is a relevant paradigm that can be referenced
when organizational leaders and human resource professionals are developing strategies
to enhance positive work relationships, behaviors, and organizational outcomes.
The rationale for carrying out this research project rests on studies and well
documented findings on workplace behaviors, and the costly impact that CWBs have on
organizations and individuals (e.g., Spector, Fox, Penny, Bruursema, Goh, & Kessler,
2006; Vickers, 2013; Porath, Gerbasi, & Schorch, 2015). “Counterproductive work
behavior may be understood within the framework of Social Exchange Theory”
(Chernyak-Hai & Tziner, 2014, p. 2). SET is being used in this study to gain a better
understanding of workplace behavior. The tools chosen in this study are informed by SET
to examine the interaction between employees and their employer (Cropanzano &
15
Mitchell, 2005). Colquitt et al. (2013) in a more recent meta-analysis notes that the past
decade has seen a surge of social exchange theory as the main medium for examining
reactions to justice in many organizational research studies. Of interest and worthy of
mention is Schneider’s (1987) seminal work in which he presented an alternative model
for understanding the etiology of organizational behavior. The attraction, selection,
attrition (ASA) framework suggests that organizations are dependent on the people in
them for its existence, and that the people are functions of an ASA cycle. Schneider
(1987) argued that it is the attributes of people as opposed to the nature of the external
environment, or organizational technology, or organizational structure that are the core
determinants of organizational behavior.
Nature of the Study
This quantitative study was guided by the research question and hypotheses based
on a review of existing literature. A web-based survey design was used. Surveys were
self- administered, and close-ended questionaries’ were administered to participants who
were recruited from FindParticipants.com, and SurveyMonkey was used to collect and
provided quantitative descriptions of the variables for statistical analysis. Survey design
allowed for a quantitative or numeric description of trends, attitudes, or opinions of the
population; and from sample results, researchers can generalize or make assertions about
the population (Creswell, 2003).
Data were collected from a sample of automotive industry workers across the
United States after Instructional Review Board (IRB) approval was received. Correlations
were computed to examine the relationships between the predictor variables of
16
uncertainty, stress, and frustration, and the criterion variable of CWB. The choice of
statistical analysis rested in the purpose of this study, which is to investigate the
relationships between the variables, and investigate whether each of the predictor
variables explained variances in the criterion variable (Mertler & Vannatta, 2010).
Demographic variables included as control variables in the study were: gender, age,
employment status, race/ethnicity, position, tenure, and race/ethnicity (see Appendix F).
Data analysis was conducted utilizing the statistical package for social sciences (SPSS)
version 21.0.
Operational Definitions
The constructs described in this study encompass a range of feelings, attitudes and
responses associated with work related behavior. The operational definitions are as
follows:
Counterproductive Workplace Behavior
Describes any negative overlapping work behaviors which impinge on others in
the work environment (Fox & Spector, 2005), and for the present study this term is used
to describe a broad range of negative behaviors in the workplace such as
aggression/abuse, deviance, sabotage, theft, and withdrawal.
Frustration
Describes circumstances in which individuals make an appraisal of the situation
they are in and conditions which block important goal attainment (Spector,
1999), and it is in this sense that it is used in this present study.
17
Stress
Stress describes as emotional responses depending on perspective, for
some it may have a more harmful and emotional impact than on others, and in turbulent
times it can bring out unhealthy extremes in human’s attitudes and behavior (Weinberg &
Cooper, 2012), for the present study this term is used to describe emotional response.
Uncertainty
Uncertainty is defined as “an individual's perceived inability to predict something
accurately” (Milliken, 1987, p. 136), for the present study this term is used to describe
individual unpredictability of change events.
Assumptions, Scope and Delimitations, and Limitations
Assumptions
Assumptions in research are statements that the researcher believes to be valid,
but proof of the statements does not exist (Silverman, 2000). The assumptions relevant to
this study included: (a) internet accessibility, (b) participant honesty, and (c) that the
research method is appropriate for designated variables.
The first assumption was that all participants have computer knowledge.
Participants had internet access. Participants answered the survey questions using a
computer with internet access.
Second, this study assumed that the participants completed the questionnaires
truthfully and to the best of their ability. The assumption is that the participants were
forthcoming and honest in their responses. Participant honesty is a pivotal aspect of this
18
study because measures are designed to tap individuals’ appraisals of CWBs.
FindParticipants.com® collection methods allowed for collecting responses anonymously
and notified participants of their anonymity. Because of this collection method
participants had no incentive for responding dishonestly supporting this assumption. The
final assumption is that the quantitative method is an appropriate method to measure the
variables related to this study. Some of the variables frequently measured in studies
include gender, age, and attitudes or behaviors (Creswell, 2003). The purpose for using
variables quantitatively is either to relate variables as in a survey, or to compare samples
or groups in terms of outcome (Creswell, 2003).
Scope and Delimitations
Delimitations are defining boundaries of the study and are used to narrow the
scope of a study (Creswell, 2003; Silverman, 2000). Specific aspects of the research
problem that were addressed in this study were employee perceptions of uncertainty,
stress, and frustration, and their relationship with CWBs. The focus of this study was
chosen because of the high cost to organizations and individuals. The population for this
study was restricted to employed automotive workers residing within the United States
without regard to specific position in the industry.
Limitations
Limitations are provided to identify potential weaknesses of the study at the
proposal stage (Creswell, 2003). Limitations of this study that may have exerted a
potential impact on findings, can be explained from the perspective of internal and
external validity. External validity addresses concerns with the inferences and
19
generalizations that can be made beyond the study itself. This study as with most survey
research is not without limitations. The true demographics of the population in this study
are unknown. A convenience sampling strategy rather than a scientifically derived
random selection of the population was used. However, even though the results may not
be generalizable, they should indicate some potential problems and areas that need
further study. Second, with self-report measures there is a risk that transient mood state
may contribute a consistent but artificial bias across measures (Podsakoff & Organ,
1986).
The reliance on cross-sectional, self-report methodology can be problematic, as
stated in prior studies (Fox, Spector, & Miles, 2001). Fox et al. (2001) noted it is a
continuous concern in organizational research that the use of a single source of data, such
as self-report questionnaires, may reflect an overstatement of relationships among
variables. However, in line with Fox, Spector, and Miles’ research, and because my focus
was on affective and behavioral responses to perceived rather than objective
environment, the arduous task of obtaining uncontaminated measures of CWB, coupled
with ethical concerns with the potential of putting participants at risk in the collection of
evidence of CWB, this study followed guidelines set in prior studies, and utilized
anonymous self-reports which provided the nearest available approximation of these
relations.
Internal validity concerns the validity of results internal to study, it concerns
causality. No causal claims were made in this descriptive study. Taken into perspective,
the results add to the knowledge base of research on workplace behavior. Future research
20
on CWB should include more cross-sectional and longitudinal studies in the effort to gain
additional insight on the relationship of variables and the direction of effects (Meier &
Spector, 2013).
Significance of the Study
CWB can be damaging to organizations. The hypothesized correlation between
employee perceptions of uncertainty, stress, and frustration with overall levels of CWB
aid in identifying developing patterns throughout the work force within the United States.
In the wake of the financial crisis which began in 2007 U.S. unemployment increased
from 4.7% to 10 % (Goodwin, Harris, Nelson, Roach, & Torras, 2013). Predicting factors
correlated with CWB provides human resource departments a resource to tap into when
executing strategies to better manage employees. If supported, extending research on the
work behaviors of the population can inform human resource professionals and
organizational leaders when implementing human resource strategies. This study
provides information on the way uncertainty, stress, frustration relate to CWB. The value
of tools to predict job performance in personnel selection are well established; however, a
gap exists for tools used to predict counterproductive work behaviors because these have
been less well researched (Fine, 2012).
Contribution to Organizational Practice
CWBs can be widespread and are problematic for organizations (Ramshida &
Manikandan, 2013). The significance of this study is to identify what role if any
employee’s uncertainty, stress, and frustration have with levels of CWB. This
information can aid in the advancement of strategies designed to encourage more
21
positive and productive employee behavior. Organizations that experience problems with
employee behavior can benefit from extending research predictions (Sulea, 2010).
Implications for Social Change
The current research study supports positive social change directed at extending
the understanding of negative psychological influences on work behaviors, and
implications for practice through reduction of uncertainty, stress, frustration, and CWB.
Organizational leaders and human resource professionals can employ programs and
strategies that help change people’s behaviors thus improving society (Stephan,
Patterson, & Kelly, 2013). Businesses can facilitate positive behavior through social
change mechanisms such as: motivation, opportunity, and capability (Stephan et al.,
2013). Organizational leaders can motivate individuals to change by communicating and
incentivizing capability (Stephan et al., 2013). Organizational leaders can create
opportunities, create transparency, and set up empowering structures and resources, and
enable individuals to change by building confidence, educating, and by providing training
(Stephan et al., 2013). Social change is for the most part a long-term uncertain process
(Stephan, et al., 2013). Therefore, to be successful at achieving goals change strategies
need to set in motion sufficient funding and personnel (Stephan et al., 2013). Researchers
suggest that implementing intervention strategies needs to involve timing, and steps that
should be taken to create positive social change (Stephan et al., 2013). First,
organizations should prepare by building motivation, capability, and opportunity on both
the project level and the individual level (Stephan et al, 2013.). Second, organizations
should create change by sustaining and energizing motivation, and developing capability
22
and opportunity (Stephan et al., 2013). And lastly, organizations should maintain
behavior change by sustaining motivation to “keep” with the new behavior, and by
supporting capabilities and institutionalizing opportunities (Stephan et al., 2013, p. 75).
Summary and Transition
The purpose of this study was to assist in predicting CWB and provide additional
insight as to the relationships among factors and their influence on questionable work
behaviors. The economic climate and tentative recovery have sparked revolutionary
changes and modifications in work environments. Changes have undoubtedly affected
organizations and employees in a variety of ways prompting employees to become
increasingly more skeptical, and less trusting (Tesvich & Morrow, 2010). Never-ending
work changes, growing concerns of uncertainty, concerns of employee and organizational
safety all impact employee performance and overall wellbeing. Self-reports were
gathered from a cross section of employees in the automotive industry to gain clarity of
the influences on employee behaviors during change. It has been established that negative
psychological influences can impact work environments (Tesvich Morrow, 2010).
Improving proactive strategies, revitalizing strategies that are already in place, and
goodwill community relationships can help encourage more positive work behaviors, and
more positive community interactions.
Chapter 2 addresses a review of existing literature on perceived uncertainty, work
related stress, frustration and CWBs. The chapter commences with a description of the
social exchange theory which is the theoretical foundation for this study with discussions
of psychological, and psychosocial responses, and their role in perceived uncertainty,
23
stress related responses, as well as the role of frustration and associations with levels of
CWBs. Chapter 2 includes studies with opposing views as well as implications of past
research and influences on this investigation. Major sections of Chapter 2 include: the
social exchange theory framework, CWB, perceptions of uncertainty, work related stress,
work frustration, subjective wellbeing, organizational outcomes, and economic decline.
Chapter 3 describes the methodology and design utilized to study the research
questions. This chapter reviews the use of regression analysis as a valid measure in
analyzing the relationships between perceived uncertainty, work stress, frustration, and
counterproductive work behavior. The chapter also includes a description of the sample
population, the process and procedures, the measures used, ethical considerations, and
analysis of data collected. Chapter 4 presents the results and calculations of the
descriptive statistics and multiple regression analyses used to address the research
questions and hypotheses. Chapter 5 concludes this study, and contains the interpretations
of the findings, the limitations of study, recommendations, implications and conclusions.
24
Chapter 2: Literature Review
Introduction
The research problem addressed is the need to gain more insight on questionable
work behaviors and to identify predictors (Sulea, 2010). This information can then help
organizational leaders and human resource professionals develop strategies that help
lessen occurrences. The purpose of the current research was to quantitatively examine the
correlation among the IV’s: perceived uncertainty, stress, and/or frustration, and the DV:
CWBs. This study investigated negative influences on workplace behavior and expand
our understanding of CWB and its costly impact on organizations and individuals (Alias
et al., 2013).
This chapter discusses the evolution of the social exchange theory, the workplace
social exchange network, and perceived organizational support. A discussion of CWBs
includes: role conflict and ambiguity, emotional abuse in the workplace, workplace
exclusion, employee deviance, and sabotage. Retrospective studies on CWBs were
reviewed. Perceptions of psychological uncertainty work related stress, and work
frustrations were reviewed and their relationship with CWBs. Research which investigate
the psychological and psychosocial responses in work environments and their role in
related behaviors were integrated into this chapter. A discussion of opposing research
which challenge some of the results of research in this area were included in order to
have an objective discussion. The chapter concludes a review of how prior research has
influenced this current investigation. Researchers identified a number of macroeconomic
influences some direct such as individual responses to the economic situation, and others
25
indirect such as changes within organizations due to the economy that impact workers
(Sinclair, Sears, Probst, & Zajack, 2010). As global economic fluctuations continue the
potential risks for workers and organizations may increase even more (Sinclair et al.,
2010). Researchers have reported increases in workplace stress, and related violence in
the workplace and campuses in the past few decades (Hunt, Hugley, & Burke, 2012).
Literature related to the scope of the study topic include: uncertainty in the
workplace (Schweiger & Denise, 1991; Kamel & Hashish, 2015); economic stress,
stressors and strains (Beehr & Glazer, 2005; Weinberg & Cooper, 2012; Sert, Elci, Uslu,
& Sener, 2014); work frustrations (Schaufeli, Leiter, & Maslach, 2008; Avey, Wu, &
Holley, 2015); and CWB (Fox & Spector, 2005; Reynolds, Shoss, & Jundt, 2015).
Publications regarding waning economic conditions and the American worker as well as
economic stress and employee well-being, and perceived organizational support, have all
contributed to organizational research (Pew research, 2010; Sinclair, Sears, Probst, &
Zajack, 2010; Shore, Coyle-Shapiro, & Tetrick, 2012). Additional studies on social
exchange, communication climate, change communication, and relationships with
employee perception have also made valuable contributions in organizational behavior
(McMillan & Albrecht, 2010).
Stress which is a worldwide problem can adversely affect the bottom line of
organizations in all industries (Hunt, Hugley, & Burke, 2012). As stress levels increase
employee burnout also increases dramatically, and productivity levels deteriorates
(Dobson, 2010). Such things as hiring freezes, salary freezes, furloughs, and layoffs
exacerbate stress levels in companies, and on campuses worldwide (Dobson). Frustration
26
levels at work, and effects on work behaviors are of interest to organizational leaders and
researchers. Additionally, researchers suggest a relationship between job insecurity and
impaired work-related well-being because it frustrates employees’ psychological needs
(Vander Elst, Van den Broeck, DeWitte, & DeCuyper, 2012). Job security may also be
considered as a demotivating factor frustrating various needs (Vander Elst et al., 2012).
Keenan and Newton (1984) demonstrated in earlier studies that self-reported
frustration at work was associated with the dependent variables of anger reactions, latent
hostility, job dissatisfaction, and work-related anxiety. Keenan and Newton also found
that frustration mostly consisted of interference with an individual’s ability to carry out
his or her day-to-day duties effectively. Keenan and Newton further suggested that
organizational climate, role stress, and social support all contributed to the levels of
environmental frustration felt.
Today’s businesses need to better understand factors that influence employees,
and employee-orientated work outcomes (Kanten & Ülker, 2013). Employee perceptions
of work environments has significant implications for both individuals and organizations
(Kanten & Ülker, 2013). Employees who perceive that the organization is non-
supportive, or unwelcoming are more likely to exhibit negative or CWB (Wolf, Dulmus,
& Maguin, 2012).
CWB include acts of aggression, hostility, sabotage, theft, and withdrawal
(Spector & Fox, 2005). Studies conducted during organizational change provide
additional understanding and insight. Studies further provide the clarity needed to
revitalize and improve areas of human resource strategies as well as employee
27
interactions in different contexts, and ultimately make way for improved organizational
and social wellbeing. Researchers argued that a sustainable workforce is developed and
nurtured through employment practices that encourage a relationship between work-life
balance and wellbeing to employment experiences (Kossek, Valcour, & Lirio, 2014).
“Employment practices that sustain work-life balance and wellbeing in workplace
experiences are critical pathways to long term workforce effectiveness” (Kossek et al.,
2014, p. 296). Organizations should promote work-life balance by encouraging
employees to take time off and keep their hours under control (Kossek et al., 2014).
Organizations should also encourage employees’ professional and personal development
(Kossek et al.). And organizations should support the local community (Kossek et al.,
2014).
Strategy for Literature Review
This literature review includes empirical studies of employee perceptions and
influences on work behaviors which are located both in peer reviewed journals, and in
medical journals. A search of literature was conducted via digital technology which
included several databases such as PsycARTICLES, CINAHL Plus, ERIC, SocINDEX,
SAGE Premier, Google Scholar, and Business Source Complete. Additionally, print
versions of articles, and several related books were also referenced. Terms used in the
literature search included: psychological uncertainty, economic stress, work stress,
frustration, organizational change, counterproductive work behaviors, social exchange
theory, employee deviance, workplace incivility, and aggression among others. Experts in
the field were also contacted via e-mail for permission to use instruments. This study also
28
includes past research as well as current research conducted between 2009-2016.
Literature was chosen based on significance and relationship to research design, and
current relation to the topic.
Theoretical Framework
Social Exchange Theory
McMillan and Albrecht (2010) stated that the social exchange theory (SET)
framework is frequently referenced in employee-organization investigations, but a better
understanding is also needed of the important roles that communication climate and
change communication hold in organizational research. Researchers more recently
investigated perceived organizational politics and employee morale, and the mediating
role of social exchange perceptions (Bodla, Afza, & Danish, 2015). Researchers proposed
that “if employees feel that behavior of their supervisor and organization is unfair,
politicized and based on favoritism, their social exchange perceptions are disturbed which
results in the reduction of their commitment and job satisfaction” (Bodla et al., 2015, p.
67).
Eisenberger, Huntington, Hutchison, and Sowa (1986) presented evidence that
employees form global beliefs regarding the degree to which organizations values their
contribution and cares about their wellbeing. Findings supported the SET view that
individuals who were committed to the organization were heavily influenced by their
perception of the organizations commitment to them (Eisenberger et al., 1986). In its
early stages, the SET had several prominent figures which helped lay the groundwork for
this distinct approach to include: George Homans, John Thibaut, Harold Kelley, and
29
Peter Blau among others (Emerson, 1976). Homans’s earlier ideas continue to inspire
scholars who have extended studies in the area of social relationships (Treviño, 2006).
Treviño noted that major writings of Homans included the Human Group (1950), Social
Behavior: Its Elementary Forms (1961, 1974), and Social Behavior as Exchange (1958).
Currently several interrelated issues of sociological theory such as structural exchange
theory, rational choice theory, network exchange theory, distributive justice, and
metatheoretical considerations of deductive reductionism have some origins in Homan’s
work (Treviño, 2006).
To gain a better understanding of SET a look at its origins is helpful. While
studying social behavior as exchange Homans' work focused on rewards and costs
between at least two individuals, and he also used propositions to explain behavior in
certain given situations (Cook & Rice, 2003). Homans’ in 1974 restated his general
propositions and titled them (Treviño, 2006, pp. 33-34): (a) the success proposition which
suggests that the more frequently certain actions by individuals are rewarded it increases
the probability that the same action will be repeated, (b) the stimulus proposition which
suggests that if previous occurrences of a given stimulus, or set of stimuli were ones in
which an action was rewarded then the more similar present stimuli are to those in the
past will increase the probability that individuals will perform the same action or similar
ones; (c) the value proposition which suggests that the more value an individual places on
the end result, increases the probability that they will repeat the same action; (d) the
deprivation-satiation proposition suggests that that the more frequent previous actions are
rewarded it diminishes the value of that reward for them; (e) the aggression-approval
30
proposition has two parts, first it suggests that individuals whose actions were not
rewarded as expected, or who received an unexpected punishment may cause them to
become angry, and more inclined to behave aggressively the results of which become
more valued, and secondly when individuals get the reward they expected or one more
than was expected for their action, or is not punished as expected they are more likely to
perform approved behavior, and behavior becomes more valuable to them; (f) the
rationality proposition suggests that in selecting between alternative actions an individual
will choose that one for which they perceive the value, V, of the result multiplied by the
probability, p, of getting the result, is the greater.
Though Blau's work followed in the footsteps of Homan's to a certain extent, for
example rewards and costs; his model considers social exchange between groups as well
as those between individuals (Cook & Rice, 2003). "Social exchange involves the
principle that one person does another a favor, and while there is a general expectation of
some future return, its exact nature is definitely not stipulated in advance" (Blau, 2008, p.
93). In the workplace exchange relationships develop gradually and involve a measure of
trust. However, trust can be diminished in certain situations when one coworker helps
another repeatedly, and help is not reciprocated this can result in the coworker
safeguarding themselves from future losses by discontinuing to render assistance (Blau,
2008). On the other hand, if assistance is reciprocated this would be considered a sign of
trust ensuring future assistance even possibly increasing favors (Blau, 2008). To strike a
balance in social exchange, and key to interactions is a level of trustworthiness, and
reciprocation this increases the exchange relationships between individuals (Blau, 2008).
31
Blau further states that “only social exchange tends to engender feelings of personal
obligation, gratitude, and trust; purely economic exchange as such does not” (p. 94).
Additionally, other researchers such as Homans made noteworthy contributions to
industrial sociology particularly in the area of leadership in organizations, his
contribution stemmed out of his fieldwork as a naval officer (Appold, 2006).
Emerson's (1962) work is a combination of both Homan's and Blau's models
where the behavioral support of his micro level theory has footings in reinforcement
principles (Cook & Rice, 2003). Additionally, Emerson argued that the social exchange
theory is "a frame of reference within which many theories, some micro and some more
macro, can speak to one another, whether in argument or mutual support" (Emerson,
1976, p. 336). Social exchange embodies a series of interactions with increased
associated obligations (Emerson, 1976). According to Emerson, the exchange theory
should be viewed instead as a set of ideas or concepts that provides examples of the
movement of resources through social process, and whose specified limit is defined by an
assumption that the resource will continue to be available as long as there is a valued
return contingent upon it; “psychologists call this contingent return reinforcement,
economists simply call this reciprocally contingent flow exchange” (Emmerson, 1976, p.
359).
One of the basic principles of SET describes how relationships develop over time
into trusting, loyal, and mutual committedness (Cropanzano & Mitchell, 2005). In
organizational research, the focus has been on relationships which evolve over time, and
the differences involved (Cropanzano & Mitchell, 2005). Social exchange which was
32
introduced early on by Homans (1958) paved the way for different theories that all still
find common ground in the basic tenet that social exchange encompasses actions that are
dependent on the rewarding reactions of others, and that evolve for mutually and
rewarding transactions, and relationships over time (Cropanzano & Mitchell, 2005). The
rational for choosing this theory includes a review of prior organizational studies
anchored in social exchange theory which explore various aspects of work relationships
some positive such as fair treatment, and some labeled as negative such as workplace
exclusion, and the different roles individuals play (Scott, Restubog, & Zagenczyk, 2012).
The SET relates to the present study in that it helps to better understand CWB
(Hai & Tziner, 2014). Social exchange helps to explain exchange relationships, and why
individuals behave the way they do. Furthermore, the social exchange framework aids
researchers by providing additional insight that helps organizational leaders, and human
resource professionals develop sustainable strategies that enhance positive work
environments that are safer and more productive. Research questions build upon existing
theory by providing a medium by which we can view the socialization challenges faced
by individuals when organizations undergo changes. Cole, Schaninger jr., and Harris
(2002) presented the workplace social exchange network (WSEN) a noteworthy construct
to aid in better understanding exchange relationships in the workplace. This is a
multilevel theoretical approach integrating three exchanges.
Workplace Social Exchange Network
Researchers in earlier investigations presented the WSEN framework that draws
from multiple streams of social exchange research (Cole et al., 2002). The WSEN
33
framework references information from various studies of social exchange that examine
interactions between individuals, and their organization, between individuals and their
supervisor, and between individuals and their workgroups (Cole et al., 2002). Cole et al.
argued that investigating exchanges simultaneously aids in the effort to better understand
the dynamics at work including influences on employee choices to reciprocate with
certain behaviors, and attitudes. Exchange relationships that figure prominently in
organizational studies include supervisor-employee exchange, better known as leader-
member exchange (LMX), and the organization-employee exchange, a concept which
encompasses perceived organizational support (POS) both relationships have been
associated with performance, and attitudes (Settoon, Bennett, & Linden, 1996). Lastly,
the team member exchange (TMX) relationship which figures prominently in
organizational studies (Cole et al., 2002).
Researchers described team member exchange as “an employee’s willingness to
exert extra-role behaviors which helps other team members and the team accomplish
goals” (Cole et al., 2002, p. 151). In line with recommendations for a more holistic
approach one which incorporates and investigates exchange relationships in work settings
the workplace social exchange network approach takes into consideration multilevel
employee exchanges (Cole et al., 2002). For example, with their supervisor, with their
work team, and with the overall organization. This theoretical approach offers additional
insight as to the dynamics at play in organizational settings, and some of the influences
on work relationships (Cole et al., 2002). Of the workplace relationships leader-member
exchange is reportedly to be the most investigated noting that the relationships
34
between supervisors and subordinates can have positive influences on work experiences
(Gerstner & Day, 1997).
Exchange relationships between workers and their supervisors, and between
workers and the organizations have been topics of numerous empirical studies seeking to
clarify different relationships at work (Settoon, Bennett, & Linden, 1996). Investigations
included the question of whether exchange relationships among workers, and their
employer, and their supervisors accounted for differences in employee behaviors. Settoon
et al.’s (1996) results indicated that “Structural equation modeling results considered on
the combined criteria of fit and parsimony showed that these two exchange relationships
were differentially related to employee behaviors” (Settoon et al., 1996, p. 224).
Setton et al. (1996) demonstrated that perceived organizational support was more
strongly correlated with organizational commitment than was leader-member exchange,
and that leader-member exchange was found to have a higher relationship with
citizenship behaviors than perceived organizational support. Investigations such as these
underscore the importance of gaining clarity as to the complexity of exchange
relationships, and their associations with different employee attitudes and behaviors both
of which are broader in scope and meaning than described in an organization’s standard
operating procedures (Setton et al., 1996).
Perceived Organizational Support
Perceived organizational support (POS) is viewed as a significant social exchange
mechanism in an organizational context (Wu & Liu, 2014). POS refers to worldwide
beliefs held by employees regarding the degree to which their organization finds their
35
contributions worthwhile, and cares about their ell-being (Wu & Liu, 2014).
Organizational researchers investigate various correlations between perceived
organizational support and employee work outcomes. There is evidence that employees
who perceive a high level of organizational support believe that their organization cares
about their well-being, and this a critical factor in individuals’ work attitudes and
behaviors (Wu & Liu, 2014).
Eisenberger, Huntington, Hutchison, and Sowa’s (1986) earlier research on
organizational support theory (OST) demonstrated that individuals tend to “(a) form
global beliefs concerning the extent to which the organization values their contributions
and cares about their well-being; (b) such perceived organizational support reduces
absenteeism; and (c) the relation between organizational support and absenteeism is
greater for employees with a strong ideology than those with a weak ideology” (p. 504).
Eisenberger et al. (1986) developed the concept of POS early on characterizing an
individual’s perception regarding the degree to which an organization finds his/her
contributions important, and cares about his/her well-being (Eisenberger et al., 1986).
Employees may perceive organizational generosity, and form general opinions
concerning the organization’s favorability of him/her which in turn prompts expectations
that it could be advantageous in different situations (Shore, Coyle-Shapiro, & Tetrick,
2012). Employee’s form various opinions regarding organizational fairness, and
“Organizational fairness is thought to have a cumulative effect on POS, reflecting a
concern for the welfare of employees and, in particular, procedural justice” (Shore et al.,
2012, p. 6).
36
A meta-analysis conducted by Rhoades and Eisenberger (2002) suggested three
major work-experience antecedents of POS: organizational rewards and working
conditions, support received from supervisors, and procedural justice. Individuals make
assessments of those who represent the organization and their behavior towards them and
develop an opinion about that treatment from this point (LaMastro, 1999). Certain
individuals might form their sense of perceived organizational support on such factors as
the organization members’ willingness to provide them with added assistance, or by
being provided with specialized equipment needed to complete a project (LaMastro,
1999). While others might consider additional training in a particular area of interest a
sign of organizational support (LaMastro, 1999). Subjective well-being and personality
also have important roles in the way individuals evaluate their lives, and how they react
to events taking place.
Major sections of Chapter 2 include a discussion of CWBs and various sub
categories; for example: role conflict and ambiguity, emotional abuse in the workplace,
workplace exclusion, employee deviance, sabotage, and retrospective studies on CWBs.
Subsections review various negative behaviors and related consequences. Reviews of
CWBs help in better understanding behaviors that are harmful to organizations and
individuals. Additional areas include employee health and well-being, work frustration,
subjective well-being and personality, organizational outcomes, and economic decline.
Counterproductive Work Behaviors
CWBs are dysfunctional behaviors that are conceptualized in several ways by
various researchers (Anjum & Parvez, 2013). A closer look at behaviors labeled as
37
counterproductive reveals agreement among researchers on how they are defined (Anjum
& Parvez, 2013). Fox and Spector (2005) described counterproductive work behaviors
CWB as phenomena that prove costly to organizations and its members. These behaviors
are comprised of acts that harm or are intended to harm organizations or people in
organizations (Spector & Fox, 2005). A number of early investigations on CWBs
included those of Spector and Fox’s (2005) stressor/emotion model of CWB, and
Pearson, Anderson, and Porath’s (2005) investigation on workplace incivility. More
recent investigations include Aquino and Thau’s (2012) study on workplace victimization
among others. Chernyak-Hai and Tziner (2014) suggested that by accessing the
psychological antecedents of CWBs we may be better able to uncover the motivational
aspects of such behavior.
Early on researchers described CWBs in general terms with overlapping
characteristics in common, and a number of related but distinct constructs (Spector &
Fox, 2005). The primary characteristic of CWB is that the act is purposeful and not
accidental, and that the employee makes a conscious decision to behave in such a manner
that is intended to inflict harm or harms by purposeful action (Spector & Fox, 2005).
“Specific CWBs include abusive behavior against others, aggression (both physical and
verbal), purposely doing work incorrectly, sabotage, theft, and withdrawal (e.g., absence,
lateness, and turnover)” (Spector & Fox, 2005, p. 152).
A report in Risk Management described that “the fastest growing crime in the
United States, employee theft and fraud costs U.S. businesses nearly $50 billion annually,
costs the average business between 1% and 2 % of annual sales, and is responsible for
38
nearly 20 % of all business failures” (Coffin, 2003, p. 8). Today's workplace is often
viewed unfavorably than in prior years. Different forms of aggressive behaviors and
violence that were not being reported as often appear to be on the rise, and are of concern
because of the serious nature and impact it has on employees and organizations (Mitchell
& Ambrose, 2012).
Aggressive behaviors including forms of violence in work environments are
harmful and may result in: “less efficiency, less productivity and profitability; increased
absenteeism; increased staff turnover; increased counseling and mediation costs;
increased workers’ compensation claims; even possible legal action" (Commission for
Occupational Safety and Health, 2010, p. 2). Everyone in the workplace is potentially at
risk, and it is important for organizations to recognize potential problems and minimize
risk for everyone (Commission for Occupational Safety and Health, 2010). Exactly what
motivates individuals to react destructively as opposed to constructively is not crystal
clear (Mitchell & Ambrose, 2012).
CWBs can arise from various existing conditions either in the perpetrator or
situation and can include individual employee characteristics and the characteristics of
the workplace (Fox & Spector, 2005). Some investigators study the characteristics of the
perpetrator while some focus on the victims, and yet others study the dynamic interplay
between the two (Fox & Spector, 2005). Fox and Spector demonstrated that factors
associated with job stress such as a lack of control, excessive workloads, poor relations
with coworkers and supervisors, and work/family conflicts are linked to harmful
behaviors.
39
Questionable behaviors include acts of aggression which are described by
researchers as “form of behavior directed by one or more individuals in a workplace
toward the goal of harming one or more others in the workplace” (Newman & Baron,
2005). More recent investigations by Hershcovis, Reich, Parker, and Bozeman’s (2012)
examined how employees’ deviant responses to workplace aggression maybe formed by
the social context in which aggressive acts take place. Hershcovis et al. investigated a
perpetrator/victim perspective. Participants were recruited from various industries via an
on-line recruiting system, and questionnaires were used. Regression analysis was
performed to test their hypothesis, and results of their study provided evidence that the
perpetrator’s power and interdependence with the victim combine to influence when
victims retaliate” (Hershcovis et al., 2012, p. 12).
Heacox and Sorenson (2004) found strong relationships between organizational
frustration and aggressive behaviors. Variables in the study included both organizational
variables and person variables (Heacox & Sorenson, 2004). Organizational variables
included such things as work constraints, role conflict and role ambiguity, and
organizational warmth and support (Heacox & Sorenson, 2004). Person variables
included such things as locus of control and gender which predicted the levels of
frustration that participants experienced, that in turn predicted supervisor and self-
reported aggression (Heacox & Sorenson, 2004). This multi–level approach used by
Heacox and Sorenson included a confidential anonymous survey of the work
environment, and multiple regression analyses were conducted to test hypothesis. Results
reaffirmed the significant effect of frustration on consequential aggressive behaviors.
40
Organizations have struggled with employee behaviors that cause harm from the
beginning of the industrial revolution to the present day (Klotz & Buckley, 2013).
Klotz and Buckley suggested that CWBs aimed at the organization will be a prevalent
phenomenon in the workplace for the foreseeable future. A review of CWBs
demonstrated that the way employees can cause harm to their organizations is fast
becoming more sophisticated as workplaces become more complex (Klotx & Buckley,
2013). In today’s technologically advanced workplace employees often possess the
technological know-how, and autonomy to harm their employers in more covert ways
(Klotz & Buckley, 2013). As organizations continue to become increasingly complex, it
is also likely that managers and management researchers will encounter more forms of
employee deviance in the coming future (Klotz & Buckley, 2013).
This conceptual framework has been applied and articulated by researchers in
prior studies that investigated CWBs’ costly effects on individuals and organizations.
This current research benefits from this framework in that it extends research that
evaluates what the relationship is if any uncertainty, stress, and frustration have with the
costly impact of CWBs during change in a flailing economy.
Many variables associated with CWBs have been investigated by organizational
researchers to include role conflict and ambiguity, emotional abuse in the workplace,
workplace exclusion, employee deviance, and sabotage among others. Role conflict
occurs when two or more employees have different interpretations of work
responsibilities (Judeh, 2011). Role ambiguity can be experienced by individuals whose
position or job is not clearly defined (Judeh, 2011).
41
Role Conflict and Ambiguity
Role conflict defined earlier by researchers is “dimensions of congruency-
incongruency or compatibility-incompatibility in the requirements of the role, where
congruency or compatibility is judged relative to a set of standards or conditions which
impinge upon role performance” (Rizzo, House, & Lirtzman, 1970, p. 155). Role
ambiguity is described “in terms of (a) the predictability of the outcome or responses to
one’s behavior and (b) the existence or clarity of behavioral requirements, often in terms
of inputs from the environment, which would serve to guide behavior that is appropriate”
(Rizzo et al., 1970, pp. 155-156). Rizzo et al. found positive relationships between high
role conflicts and low job satisfaction, and between high job pressure and high general
fatigue. Both role conflict and role ambiguity are suggested to pose limitations for
employees.
Another definition of role ambiguity describes the “existence of a lack of clarity
in the roles an employee is expected to fulfill” (Judeh, 2011, p. 173). Role ambiguity is
the perception that the information necessary to perform one’s job is lacking, thus leading
the perceiver to feel helpless, or is the result when inadequate information or knowledge
to do a job exists (Judeh, 2011). Additionally, role ambiguity was found to be associated
with increased tension and indicators of burnout and negative job-related attitudes
(Newton & Jimmieson, 2008).
Role conflict exists when two or more employees have different perspectives
regarding their job which makes them experience conflicting demands and expectations,
and this prompts them to make incompatible decisions resulting in role conflict (Judeh,
42
2011). Yet conflict can also have a positive effect when it leads to organizational
development, but beyond a certain stage conflict can lead to organizational
ineffectiveness (Judeh, 2011). Consistent with earlier research findings role conflict was
found to increase levels of emotional exhaustion and lower job-related attitudes (Newton
& Jimmieson, 2008).
Emotional abuse is another area of concern for organizations and individuals.
Emotional abuse in the workplace has steadily gained significant interest in the United
States (Carden & Boyd, 2013). Bullying is a form of emotional abuse and is described as:
mistreatment serious enough to endanger a targeted individuals’ health, risking his or her
job and career, and strain relationships with acquaintances and family (Carden & Boyd,
2013).
Emotional Abuse in the Workplace
Researchers described emotional abuse as abusive behavior that targets
individuals with “hostile verbal and nonverbal behaviors, excluding physical contact,
directed by one or more persons towards another that are aimed at undermining the other
to ensure compliance” (Keashly, Trott & Maclean, 1994, p. 342). Mobbing described by
researchers in prior studies, is another form of abuse that is the “hostile and unethical
communication which is directed in a systematic way by one or a number of persons
mainly towards an individual” and can include such situations where one is being
ridiculed in front of others, or being snubbed by co-workers (Leymann, 1990, p.
120).Working with individuals whose behaviors are degrading or hostile can be stressful,
and ongoing exposure to such behavior on a regular basis can influence reactions that
43
prove costly to organizations (Keashly et al., 1994). Keashly et al. further stated that the
economic climate, and nature of ones’ job may restrict employee’s option to resign as an
alternative for dealing with an abusive workplace.
Workplace bullying has become a significant problem in work environments in
the United States (Carden & Boyd, 2013). An online survey conducted by the Workplace
Bullying Institute with 1,604 respondents, revealed that 39% of the respondents reported
being bullied, and 58% of the respondents reported that they were currently being bullied
(Workplace Bullying Institute, 2012). Examples of bullying behavior include unsolicited
criticism, unfair treatment, isolation, humiliation, excessive monitoring, and receiver of
targeted jokes (Carden & Boyd, 2013). With the potential impact that these behaviors
have on employees, and organizations during periods of high stress and anxiety it is
important that we continue to seek strategies to minimize their occurrence.
Another form of emotional abuse in the workplace is workplace exclusion.
Exclusionary behavior may be a way for some individuals to protect and preserve social
functioning (Scott, Restubog, & Zagenczyk, 2013). Exclusionary behavior because of its
subtle nature allows individuals the opportunity to express their dissatisfaction with
others without having a direct confrontation (Scott et al., 2013). Scott et al. noted that
organizational leaders should strive to minimize anti-social behavior, and that they should
maintain a culture in which civility and positive communication are the norm.
Workplace Exclusion
Workplace exclusion is associated workplace aggression, and includes bullying,
incivility, and social undermining which are “conceptually distinct, but operationally
44
similar” (Aquino & Thau, 2009; Hershcovis, Reich, Parker, & Bozeman, 2012, p.2).
Researchers have had a growing interest in the notion that individuals may play a part in
their own mistreatment (Scott, Restubog, & Zagenczyk, 2012). This assertion has been
established in victim prescription literature with origins in criminology (Scott et al.,
2012). Though Scott et al.’s research focused on incivility as a precursor to exclusion in
the workplace, they also noted that there are various other individual-specific variables
that could be labeled as unfriendly or detrimental to relationships. For example, one
could be perceived as negative, disagreeable, or an unapproachable person (Scott et al.,
2012).
Researchers also suggested that this dynamic also exists in work environments,
where employees whose aggressive, hostile, and disagreeable behavior is liable to elicit
aggressive or retaliatory responses (Aquino & Bradfield, 2000; Hershcovis, Turner,
Barling, Arnold, Dupré, Inness, LeBlanc, & Sivanathan, 2007). Furthermore, researchers
argued that in situations where individuals display incivility it can lead others to question
their willingness to be involved in mutually beneficial social exchange, so resulting in
less than favorable outcomes (Scott et al., 2012). Individuals who are disagreeable and
who pose a threat to the stability and survival of the group could potentially be excluded
(Scott et al., 2012).
Exchange relationships and well-being at work, as well as factors that have
influence on work behaviors are important considerations in the process toward
minimizing negative influences and promoting more positive work environments. Biggo
and Cortese (2013) noted that well-being at work is viewed by several authors to be the
45
end result of the interaction between individual characteristics and those of the work
environment. A theory worthy of mention in the investigation work stressors and CWBs
is the affective events theory (AET). Weiss and Cropanzano (1996) “argued that
workplace events trigger affective responses which after being accumulated over time
will influence workplace attitudes such as job satisfaction, organizational trust, and
commitment” (as cited in Glasø, Løkke, Holmdal, & Einarsen, 2011, p. 199). Employees
who experience increased negative emotions in relationship to work stressors may react
emotionally with anger, frustration, and fatigue thus increasing the chance of their
involvement in CWBs (Sprung & Jex, 2012). Sources of pressures at work such as
changing environments add to challenges that individuals and organizations face
(Weinberg & Cooper, 2012). Employee deviance another form of CWB, describes such
acts as theft, withholding effort, and maltreatment of co-workers (O’Neill, Lewis, &
Carswell, 2011). All of these acts pose pressing issues for organizations and underscore
the significance that identifying antecedents of deviant behaviors hold for organizations
(O’Neill, Lewis, & Carswell, 2011).
Employee Deviance
Employee deviance, a form of CWB, has negative impacts on organizational
functioning. When employees are first hired, they go through an orientation phase, during
the orientation phase employees are made aware of what behaviors are expected, training
procedures are outlined, and the organizations’ mission statement is stated, so when
employees deviate from company policies it creates problems (Bennette, Aquino, Reed
II, & Thau, 2005). Employee deviance is described as “the voluntary behavior of
46
organizational members which has the potential to cause harm to the organization or to
those within, and in doing so violates significant performance enhancing norms”
(Bennette et al., 2005, p. 111). Krischer, Penney, and Hunter (2010) investigated whether
two forms of CWBs: production deviance and withdrawal served as coping mechanisms
to mitigate the impact of low distributive and procedural justice on emotional exhaustion.
Krischer et al. suggested that some coping behaviors however, can be viewed as
counterproductive from an organizational perspective; for example, taking longer breaks
or intentionally working slowly.
For organizations whose goal is to reduce production deviance and withdrawal
behaviors, a closer look at what drives these behaviors should be a priority (Krischeret
al., 2010). Krischer et al. suggested that employees may engage in some CWB because it
may help in reducing emotional exhaustion. On one hand, counterproductive work
behavior is viewed as harmful to organizations (Krischer et al., 2010). While on the other
hand CWB may beneficial for employees, this poses an interesting paradox for
practitioners (Krischer et al., 2010). Should organizations provide employees with other
ways to cope with such things as perceived injustice, then employees may be less
inclined to engage in these forms of counterproductive work behaviors (Krischer et al.,
2010). For example, organizations could provide access to venues such as exercise
facilities or programs or encourage employees to take breaks if they feel overwhelmed
and distressed to reduce negative physiological arousal related to perceived stressors
(Krischer et al., 2010).
O’Neill, Lewis, and Carswell (2011) evaluated whether employee personality and
47
justice perceptions predicted workplace deviance. Their results suggested that personality
variables appeared to be slightly more predictive of deviance than were justice variables
(O’Neill et al., 2011). These findings are of significance because of the financial costs of
developing interventions (O’Neill et al., 2011). For example, individuals could be
screened prior to employment for personality traits that reflect an inclination for them to
avoid deviant behaviors (O’Neill et al., 2011). Current employees could be identified and
sent for remedial training such as personal development and coaching (O’Neill et al.,
2011). Identifying antecedents of deviant behaviors in the workplace is an important
research priority (O’Neill et al., 2011). Organizations may benefit more from screening
applicants for relevant traits than from organizational change involving policies and
procedures in their effort to minimize workplace deviance (O’Neill et al., 2011). In
addition to workplace deviance is workplace sabotage which is also detrimental to
organizational functioning. In Ambrose, Seabright, and Schminke’s (2002) study on
sabotage, they hypothesized that injustice would be the most common cause of sabotage.
Ambrose et al.’s research noted that literature listed five possible motives for sabotage:
powerlessness, frustration, facilitation of work, boredom/fun, and injustice. The end goal
of sabotage is to restore equity, to make up for an outcome that was deserved and
expected but was not received.
Sabotage
Researchers who evaluate employee sabotage have provided valuable insight as to
the various forms of such behavior (Harris & Ogbonna, 2012). For example, the motives
of employee sabotage in the service industry were investigated to evaluate the variety of
48
reasons why service workers consciously choose to engage in behaviors designed to harm
service (Harris & Ogbonna, 2012). Harris and Ogbonna suggested that the personality
traits (e.g., conscientiousness, agreeableness, and emotional stability) are partially
responsible for influencing their motive to engage in these behaviors.
Ambrose, Seabright and Schminke (2002) investigated sabotage from different
perspectives, for example, some researchers evaluated relationships between perceived
unfairness and sabotage, yet others the relationships between organizational justice and
workplace deviance. Workplace sabotage is defined as “behavior intended to damage,
disrupt, or subvert the organization’s operations for the personal purpose of the saboteur
by creating unfavorable publicity, embarrassment, delays in production, damage to
property, the destruction of working relationships, or the harming of employees or
customers” (Crino, 1994, p. 312).
Five possible motives suggested by Ambrose et al. (2002) as to why employees
engage in these types of behaviors include, but are not limited to: powerlessness,
organizational frustration, facilitation of work, boredom or fun, and injustice. Sabotage
resulting from powerlessness involves an effort to achieve a form of control for its own
good, and it benefits the individual or the workgroup not the organization (Ambrose et
al., 2002). In organizational frustration, it is the emotional state that drives frustration, for
example, when goal attainment is blocked (Ambrose et al., 2002). Facilitation of work
entails a goal to make the work easier, for example, bending the rules to get the work
done (Ambrose et al., 2002). Boredom or fun involves a motive for sabotage such as
when engaging in activity for the fun of it, and injustice refers to instances in which
49
individuals feel that they have been treated unfairly (Ambrose et al., 2002). Among other
related CWB is employee withdrawal which includes behaviors such as: unnecessary
absenteeism, tardiness, and engaging in non-work-related conversations (Edger &
Eisenberger, 2008). Edger and Eisenberger suggested that individuals who perceive that
their organizations value their services will not engage in these types of behaviors.
Earlier studies on CWBs included those on aggression (Baron & Newman, 1996,
1998; Baron, Newman, & Geddes, 1999). Additionally, Fox and Spector (2005)
investigated various forms of CWBs to include the actions of actors, and individuals who
were targeted; they focused on antecedents and consequences of actions. A look at
retrospective studies on CWBs aids in better understanding negative behaviors which are
steadily rising.
Retrospective Studies on Counterproductive Work Behaviors
Earlier studies on CWBs included various areas of concern such as aggression and
emotion in the workplace, and employee deviance (Newman & Baron, 2005; Bennett,
Aquino, Reed, & Thau, 2005). Fox and Spector (2005) stated the growing interest in
CWBs in past research studies. CWBs have gained renewed interest much of which has
been prompted by mass media coverage, given to increases in incidents of workplace
violence. Milder forms of workplace violence are reportedly more prevalent, yet
experiences of workplace incivility and other forms of CWBs appeared to be increasing
with relative frequency (Fox & Spector, 2005).
The umbrella term CWBs are a compilation of various conceptualizations that
overlap where slight differences are indistinguishable (Fox & Spector, 2005). CWBs has
50
been studied both from an actor’s perspective and from the targets perspective focusing
on antecedents, and consequences of actions (Fox & Spector, 2005). Researchers who
studied organizational behavior including investigations of aggression and emotions also
looked at the extent that these behaviors involved efforts made by individuals to harm
others, or the organizations for which they work (Baron & Neuman, 1996, 1998; Baron,
Neuman, & Geddes, 1999). Studies on aggression in the workplace included various
forms (e.g., bullying, abusiveness, and harassment, among others) used to identify
questionable acts by individuals (Neuman & Baron, 2005).
Additionally, the consequences of supervisors who are aggressive with employees
also have negative impacts. These types of experienced behaviors can be very stressful,
challenging, and threatening for employees because of the control supervisors have over
things that are important to their work lives (Tepper, 2007). Researchers further
demonstrated that supervisor aggression has provoked destructive reactions from
employees (Inness, Barling, & Turner, 2005; Mitchell & Ambrose, 2007; Tepper, Henle,
Lembert, Giacalone, & Duffy, 2008) while a few demonstrated constructive reactions
(Keasly, Trott, & MacLean, 1994; Tepper, Duffy, & Shaw, 2001; Tepper, Moss,
Lockhart, & Carr, 2007).
The reasons for differences in reactions is not quite crystal clear, yet the
significant impact that supervisor aggressions have had in the United States has been
estimated to cost corporation billions annually (Tepper, Duffy, Henle, & Lambert, 2006).
Mitchell and Ambrose (2012) examined the way employees reacted to perceived
supervisor aggression to gain a better understanding of what prompted the employees to
51
react constructively or destructively to aggression. “The findings across three studies
suggested locus of control (LOC), fear of retaliation from the aggressive supervisor, and
behavioral modeling of coworkers’ impact the degree to which victims engage in
destructive or constructive reactions” (Mitchell & Ambrose, 2012 p. 1165). Various
factors can influence either constructive or destructive responses by employees.
Conflict and role ambiguity are conceptualized as potential obstacles for
employees, and have significant associations with low job satisfaction, high job pressure,
and high general fatigue (Rizzo, House, & Lirtzman, 1970). When low job satisfaction,
high job pressure, and high general fatigue are experienced by employees they can
influence subsequent reactionary behaviors (Rizzo et al., 1970). Employees who engage
in actions that harm other members or the organizations, are of concern, and are
important topics of investigations in industrial and organizational psychology for several
reasons (Dalal, 2005; Vardi & Weitz, 2004). Negative behaviors at work including some
previously mentioned: sabotage, theft, withdrawal behavior, harassment, and drug use at
work (Gruys & Sackett, 2003; Robinson & Bennett, 1995; Spector et al., 2006) hinder
organizational functioning. “Given the serious nature of these behaviors it should be no
surprise that research has found that CWBs have important implications for the well-
being of organizations and their members” (Bowling & Eschleman, 2010 p. 91).
Various areas of investigations examined the main effects of individual difference
variables such as personality traits (Berry, Ones, & Sackett, 2007), yet others examined
the main effects of work stressors (Brunk-Lee & Spector, 2006). “As a response to
ineffective coping with stressors, CWBs are likely to increase in response to increases in
52
work stressors” (Bowling & Eschleman, 2010, p. 92). Examples include psychologically
withdrawing from one’s environment, or responding in a hostile fashion, or using drugs
(Carver, Scheier, & Weintraub, 1989; Bennett & Robinson, 2000). Studies related to the
research questions in this study include those conducted on perceived uncertainty,
perceived stress, frustration, and CWBs.
Perceptions of Psychological Uncertainty
Unprecedented increases in the level and duration of unemployment in the United
States have increased levels of uncertainty (Ravn & Sterk, 2012). “The unemployment
rate in September 2012 remains close to 8% having surpassed 10% in late 2009, and the
number of unemployed workers who have been out of work for 6 months or more now
accounts for more than 40% of the total unemployed” (Rave & Sterk, 2012, p. 1). In
another vein of research of work uncertainty, Leach, Hagger-Johnson, Dierner, Wall,
Turner, Dawson and Grote (2012) investigated a self-report measure of work uncertainty
in any setting to assist the progress of research, and decision making regarding the design
of work.
Leach et al.’s (2012) goal was to develop a short and easily administered measure
to access employee perceptions of work uncertainty. Items in the scale corresponded to
common work factors such as equipment reliability and task predictability (Leach et al.,
2012). The data were collected from three diverse samples in the study, and the
researchers argued that the scales provide the means by which to examine uncertainty in
manufacturing and non-manufacturing environments (Leach et al., 2012). Findings in the
study reflected “good internal consistency and construct validity for a multi-dimensional
53
measure comprising three distinct scales: resource, task, and input/output uncertainty”
(Leach et al. 2012, p. 95).
Schweiger and Denisi (1991) proposed early on that when employees are
uncertain about their futures, it can be very stressful for them. Employees in these
situations may try to lessen feelings of uncertainty by relying on less formal methods of
information gathering such as rumors mills or other means of communications (Napier,
Simmons, & Stratton, 1989). Rosnow (1988) stated that these types of information
gathering methods do not necessarily reduce anxiety, but instead often provide less
reliable information that is often exaggerated and lacking in accuracy.
Uncertainty which occurs during organizational change can be an outcome of the
breakdown in communicating to employees what changes are being made, and this can
leave them feeling uncertain about their future (Schweiger & Denisi, 1991). Buono and
Bowditch (1989) suggested a correlation between information provided via the rumor
mill or grapevine and CWBs. Researchers proposed that communicating with employees
the anticipated effects of change is one way to deal with the uncertainty and anxieties that
may result in dysfunctional outcomes such as: stress, job dissatisfaction, low trust in the
organization and commitment to it, and intentions to leave the organization (Ashford,
Lee, & Bobko, 1989; Bastien, 1987).
Schweiger and Denisi (1991 in opposing research argued that even though
arguments exist for communicating with employees as soon as possible there are also a
number of considerations that managers should first take into account. For example,
information may be lacking on all the details concerning changes until later into process,
54
and managers may be hesitant to communicate inaccurate information so as not to create
an atmosphere where employees feel they have been deceived (Schweiger & Denisi,
1991). Buono and Bowditch (1989) further proposed that management should refrain
from communicating realistically with employees during change because of the chance
that these communications might draw the attention of competitors. Buono and Bowditch
stated this might result in employees leaving the organization earlier rather than
weathering through changes.
Rafferty and Griffin’s (2006) development of organizational change measures,
and psychological uncertainty scale assesses individuals’ perceptions on the frequency,
impact, and planning of change. Rafferty and Griffin suggested ways that these change
characteristics may have some influence on individuals’ appraisal of the uncertainty
associated with change, and eventually job satisfaction and turnover intentions. Lazarus
and Folkman’s (1984) cognitive phenomenological model of stress and coping was
referenced by Rafferty and Griffin as part of their investigation on how these change
characteristics may influence the appraisals one makes of the uncertainty associated with
change, and eventual relationships with job satisfaction and turnover intentions.
A repeated cross-sectional design was adopted by Rafferty and Griffin (2006),
and measures of organizational change and psychological uncertainty were administered
via survey method to participants, data collected were analyzed. Results of the study
revealed that “individuals’ perceptions of these three aspects of change (e.g., frequency,
impact, and planning) were related, in expected and meaningful ways, to job satisfaction
and turnover intentions” (Rafferty, Allanah, & Griffin, 2006, p. 1159). Uncertainty is
55
considered one of the more common psychological states that can be experienced by
employees during organizational change (Bordia, Hunt, Paulsen, Tourish, & DiFonzo,
2004). The restructuring process can also prompt employees to feel a great deal of
uncertainty because they are unsure of what the organization’s priority will be, if they
will be affected by it, or if adjustments will be made in employment contracts (Jungsik,
Song, & Seongsoo, 2013). More recently, Cullen, Edwards, Casper and Gue’s (2014)
study supported the role that perceived organizational support has in the relationship
between employees’ ability and perceptions of change related uncertainty and employees’
satisfaction and performance.
Organizational environments are becoming more complex and organizational
leaders are met with mounting challenges and uncertain futures (Ganta & Manukonda,
2014). Uncertainty and change provokes fear and anxiety in workers, and when workers
are fearful their stress level increases (Ganta & Manukonda, 2014). Ganta and
Manukonda noted that organizations must develop trained leaders with a clear vision to
guide and motivate others during uncertain times. While psychologists are divided on
whether workplace stress is a result of workplace experiences, or other factors, it is more
commonly viewed that people experiencing stress can demonstrate decreased workplace
performance (Patching & Best, 2014). Stressors which are characterized as physical or
psychological stimuli in the environment can negatively influence reactions and are
further described by researchers Beehr and McGarth (1992) and McGrath and Beehr
(1990) as stress-producing environmental circumstances or stress-producing events and
conditions (SPECs).
56
Stress
Economic Stress, Stressors and Strains
Mulki, Jaramillo, Malhorta and Locander (2012), examined how salespeople
resistance to change, and a manager’s decisiveness affect an individuals’ felt stress and
turnover intentions. Results of the study suggested that when employees believe that their
supervisor is indecisive over important decisions they lose confidence, feel vulnerable,
and are likely to develop stress (Mulki et al., 2012). Individuals may manage change in
different ways, some ignore change initiatives, yet others resist passively by not reacting
and continue to do things the way they have done in the past (Mulki et al., 2012). Others
might actively resist change, act subversively, and become involved in behaviors that are
damaging to the organization (Mulki et al., 2012). Employees may also build alliances
with other likeminded individuals which could negatively impact organizational
functioning (Mulki et al., 2012).
Resistance that builds can be very stressful to employees and can create an
atmosphere in which they consider moving to another organization (Mulki et al., 2012).
A leader who is trusted by employees, and who does not waver in making decisions,
reaffirms the employees’ beliefs in the organization and its goals (Mulki et al., 2012).
Decisive leaders can inspire their employees convincing them that change is worth
pursuing (Mulki et al., 2012). Decisive leaders can also effectively manage change
initiatives because of the clarity they provide in decision making (Mulki et al., 2012).
The economic crisis can create alarming circumstances that influence individuals’
approaches in life and assessments of their work situations (Markovits, Boer, & Van
57
Dick, 2014). Employment situations are severely impacted during economic crisis
prompting less positive and more negative job conditions (Markovitis et al., 2014). The
looming economic crisis steadily deteriorates one’s economic and employment status
which has negative effects on attitudes (Markovitis et al., 2014).
Increases in economic stress are comprised of both objective and subjective
components for both employees as well as their families (Probst, 2005). Probst stated
early on that the prevalence of unemployment, underemployment, and job insecurity has
continued to rise, and along with it related stressors. Stressors which are characterized as
physical or psychological stimuli in the environment can negatively influence reactions
and were further described by Beehr and McGarth (1992) and McGrath and Beehr (1990)
as stress-producing environmental circumstances or stress-producing events and
conditions (SPECs). Opposing views suggested that stressors can also have some positive
effects as well; for example, they can enhance productivity, thus allow opportunities for
promotions and additional responsibilities (Beehr & Glazer, 2005).
Among negative effects are anxiety and depression which are manifested when
individuals lack positive coping skills that can lead to potential strains (Beehr & Glazer,
2005). Beehr and Glazer (2005) identified three categories of strains, they include:
psychological, physiological, and behavioral strains. Psychological strains involve forms
of impaired cognitive functioning (e.g., anxiety, depression, burnout) that can be
experienced by individuals in the workplace (Beehr & Glazer, 2005). Physical strains
include actual body reactions (e.g., aches and pains, high blood pressure, coronary heart
disease) which can impact an individuals’ ability to work (Beehr & Glazer, 2005). Lastly,
58
behavioral strains include unhealthy behavior such as smoking, alcohol consumption, or
thoughts of suicide (Beehr & Glazer, 2005).
Some of the negative behavioral reactions to stressors and strains were also
associated with negative organizational outcomes (Beehr & Glazer, 2005). Stressors
leading to psychological strains, or physical strains, and behavioral strains are described
as having a domino effect. For example, in situations where individuals perceive role
overload at work anxiety (psychological strain) can lead to a lack of sleep (physical
strain), and in turn can lead to the use of sleep medication ultimately impacting work
performance (Beehr & Glazer, 2005).
When assessing changes in work environments it can lead to a range of emotions
and reactions with either positive or negative outcomes (Weinberg & Cooper, 2012). For
example, uncertainty in work environments appears to feed perceptions of threat
associated with unhealthy attitudes and behavior in individuals (Weinberg & Cooper,
2012). Prior to responding to demands in the environment be it physical, or psychological
individuals first appraise the situation, and how it pertains to them, or how significant it is
(Weinberg & Cooper, 2012).
Reviewing on a continuum those things which promote positive-well-being at one
end to those things associated with strain and distress on the other, allows us an
opportunity to make better valuations of benefits as well as detriments and allows us to
better recognize the presence or absence of healthy or unhealthy experiences (Weinberg
& Cooper, 2012, p. 42). Strains that cause distress in individuals are the negative
psychological experiences that one has on a regular basis, for example, the uncertainty of
59
maintaining employment amidst waves of job cuts, or the increases in workloads created
by the termination of co-workers have been associated with strains (Weinberg &
Cooper, 2012). Strains can also lead to difficulties in relationships at work, or at home
and challenges an individuals' ability to cope (Weinberg & Cooper, 2012).
Changes in behavior related to strain for some individuals can lead to avoidance
and withdrawal from interaction with others (Weinberg & Cooper, 2012). Additionally,
the quality of social interaction might also be affected so much so that irritation, anger,
incidences of bullying, and frustration with customers, clients and colleagues occur with
increased frequency (Weinberg & Cooper, 2012). Organizations can also experience
strain, particularly when faced with increases in low morale rates, reduced commitment,
increases in error rates, and complaints, all of which present significant challenges to
achievement of goals (Weinberg & Cooper, 2012). In addition to strains other factors are
associated with contributing to employee frustrations, for example the lack of progress in
career movement (particularly for younger workers), job security, and the lack of
transparency in communication to name a few (Society for Human Resource
Management, 2011). Mitchell-McCoy and Evans (2005) stated that a common indicator
of psychological stress is task performance, and individuals can overcome its negative
impact as long as the stressor is not severe, the duration of performance is not prolonged,
or the task does not require maximum cognitive capacity.
Psychological Reactions to Stress
Patching and Best (2014) stated that while psychologists are divided on whether
workplace stress is a result of workplace experiences, or other factors, its more
60
commonly accepted that people experiencing stress can demonstrate decreased workplace
performance. From a human performance perspective, it’s significantly more important to
have systems and procedures that contribute to avoidance of undue work environment-
caused stress (Patching & Best, 2014). Beehr and Glazer (2005) provided examples of
employee reactions to stress that resulted in negative consequences for organizations, to
include: organizational commitment, turnover intentions, and organizational justice
among others.
Of these reactions, organizational commitment appears to be the most widely
investigated construct, and is comprised of three components: affective, continuance, and
normative commitment (Meyer, Allen, & Smith, 1993). In summary, affective
commitment is an individuals' intention to remain with the organization because they
want to, for those with continuance commitment they stay with the organization because
they need to and have no choice, and those with normative commitment stay with the
organization because they feel a sense of obligation (Meyer, Allen & Smith, 1993, p.
539). Future studies are needed to further explore health related issues, and changes in
employees' psychosocial factors that may be associated with work related stress during
economic undulations (Houdmont, Kerr, & Addley, 2012).
Stress, Psychological and Physical Workplace Link
Researchers in earlier studies elaborated on stress and noted that stress can occur
when “environmental demands tax or exceed the adaptive capabilities of the organism
resulting in psychological or physiological changes” (Mitchell-McCoy & Evans, 2005, p.
220). The physical characteristics of work settings (e.g., lighting, noise) were associated
61
with certain stress related issues, and the physiological markers of stress can occur
without subjective consciousness of environmental demands (Mitchell-McCoy & Evans,
2005). Physiological markers included such things as elevated cardiovascular activity and
heightened physiological arousal among other symptoms (Mitchell-McCoy & Evans,
2005). Careers can sometimes affect people so intensely that “it is not so much that
certain people have a job, but rather that their job has them, and ‘burnout’ can be the
eventual consequence” (Patching & Best, 2014, p. 683). Ineffective coping skills leads a
person to likely perceive that they no longer possess the resources to manage the
expectations and demands placed on them, and this state is known as psychological stress
(Patching & Best, 2014). Stress is primarily controlled by a primitive region of the brain
close to the brain stem known as the limbic hypothalamic system (LHS) (Patching &
Best, 2014). The hippocampus, which deals with emotional memory, the hypothalamus,
which controls certain metabolic processes of the autonomous nervous system by
secreting neuro-hormones, and the amygdala, an almond shaped brain part, which
primarily controls our response to intense emotions such as aggression and fear comprise
the main components of the LHS system (Patching & Best, 2014). The LHS regulates
vitally important body functions taking in information from our senses even before we
are consciously aware of it (Patching & Best, 2014).
Mitchell-McCoy and Evans (2005) noted that the most pervasive index of
psychological stress in the workplace is self-reports of negative affect which
encompasses assessments of stress, fatigue, tension, workload pressure, and other forms
of anxiety. Another common indicator of psychological stress is task performance, and in
62
this category, individuals can overcome its negative impact if the stressor is not severe,
the duration of performance is not prolonged, or the task does not require maximum
cognitive capacity (Mitchell-McCoy & Evans, 2005). Mitchell-McCoy and Evans stated
that in addition to self-reports of negative affect and task performance, physical stressors
that are uncontrolled can spiral into a lack of motivation related to learned helplessness.
Mitchell-McCoy and Evans further stated that uncontrolled stressors can also have a
negative effect on social relationships. The physical work environment includes risk
factors that can elevate stress levels in some individuals; risk elements include such
things as ambient conditions, resources, views, and visual access from the workspace
among others (Mitchell-McCoy & Evans, 2005). Environmental stressors result in
psychological or physiological changes, influencing motivation and performance affect
social interaction, and may lead to negative affect (Mitchell-McCoy & Evans, 2005).
The National Institute for Occupational Safety and Health (NIOSH) is the Federal
agency tasked with conducting research, and then making recommendations for the
prevention of work-related illness and injury (NIOSH, 2013). Researchers’ investigations
include stress related issues at work, and its effect on worker safety and health; and
methods to minimize its impact in work environments (NIOSH, 1999). A number of
researchers and the NIOSH pointed out in prior studies that the nature of work
environments is changing at whirlwind speed, and job stress will continue to pose a threat
to the health and well-being of workers and organizations (NIOSH, 1999). Researchers
have also proposed that differences in personal characteristics (e.g., personality and
coping styles) are the most important in influencing perceptions of what is stressful, and
63
what may be perceived a stressful situation for some individuals, may not be for others
(NIOSH, 1999). Individual differences cannot be disregarded, nor the associations
between certain work conditions (e.g. job overload), and increased levels of stress for
most individuals (NIOSH, 1999).
Stress and Work Conditions
The NIOSH (1999) outlined several work conditions that may lead to stress for
individuals. The first work condition that may lead to stress for some individuals includes
the design of tasks such as heavier workloads, or the lack of rest breaks, excessive work
hours, and underutilized worker skills (NIOSH, 1999). The second work condition that
may lead to stress for individuals is management style (e.g., poor communication, lack of
worker participation in decision making process), and lack of family friendly policies
(NIOSH, 1999). The third work condition that may lead to stress for individuals is
interpersonal relationships such as poor social environment, or lack of support or
assistance from coworkers and supervisors (NIOSH, 1999). The fourth work condition
that may lead to stress for individuals includes work roles such as conflicting or job
ambiguity (NIOSH, 1999). The fifth work condition that may lead to stress for
individuals includes career concerns such as job insecurity, or a lack of opportunity for
advancement or promotion, and rapidly changing work conditions for which workers are
unprepared (NIOSH, 1999). And the sixth work condition that may lead to stress for
some individuals includes environmental conditions such as overcrowding, noise, air
pollution, or ergonomic problems (e.g., designs to reduce worker fatigue and discomfort)
(NIOSH, 1999).
64
Beehr and Glazer (2005) stated that stressors and their relationship with employee
well-being were of concern, they can be very costly for organizations and even reach
beyond to other environments. Psychological reactions to stressors have been grouped by
researches into various categories. Categories included those outside the organization
(e.g., traffic to and from work, family), and those from within the organization (e.g., job
security), or work-related responsibilities (e.g., task related) even stressors related to
different work roles (Beehr & Glazer, 2005). Stress and health are of concern because it
impacts individuals’ and organizational effectiveness (Beehr & Glazer, 2005).
Stress and Health
Humans are equipped with a mechanism in the brain which when presented with
stress it sets off an alarm that prepares the body for defensive action (NIOSH, 1999).
When the alarm system is alerted the nervous system is awakened and hormones released
act to sharpen the senses, quicken the pulse, deepen respiration, and tense muscles
(NIOSH, 1999). This is better known as the fight or flight response, and it is biological in
nature therefore everyone is preprogrammed (NIOSH, 1999). The duration of unresolved
stressful situations can increase risk of injury or disease, and there are several studies
which have investigated stress-related problems and its relationships with a variety of
ailments (NIOSH, 1999). Among the stress-related problems are unhealthy relationships
with family and friends and increases in situations that are quick to develop such as: job
stress, cardiovascular disease, musculoskeletal disorders, and psychological disorders
(NIOSH, 1999).
Early warning signs of job stress include: headache, sleep deprivation, difficulty
65
in concentrating, short temper, upset temper, job dissatisfaction, and low morale (NIOSH,
1999). Researchers suggested that psychologically demanding jobs increases the chances
of cardiovascular disease due in part to the lack of control individuals have over the
processes involved in their job (NIOSH, 1999). Individuals are also at risk of developing
musculoskeletal disorders related to job stress (e.g., back and upper back extremity)
(NIOSH, 1999). Mental health problems such as burnout, depression, and other
psychological problems have also been associated with various job stress levels
(NIOSH, 1999). Furthermore, researchers have suggested that stressful working
conditions may also be associated with increases in incidences of workplace injury, as
well as suicides, cancer, ulcers, and impaired immune function (NIOSH, 1999).
Smith, Karsh, Carayon, and Conway (2003) stated in previous investigations the
impact that employee health and well-being could have on organizations. Today it has
attracted even more societal attention partially due to the rising medical costs associated
with stress-related illnesses. Researchers examining the neurochemical responses of the
body to stress, made note that the hypothalamic-pituitary-adrenocortical (HPA) axis and
the sympathetic-adreno-medullary (SAM) systems are greatly involved in the association
between stressors and health (Dienstbier, 1989). Selye (1936) described that when
individuals perceive harmful or threatening situations the hypothalamus is activated.
When the hypothalamus is activated it reacts in two ways: first, it activates the HPA
system (e.g., alarm, resistance, exhaustion), and secondly as Cannon (1932) described
this in turn activates the SAM system by triggering one of the earliest responses to stress
through the sympathetic nervous system known as the fight-or flight response (as cited in
66
Nixon, Mazzola, Bauer, Krueger, & Spector, 2003).
The triggering of the sympathetic arousal then stimulates the adrenal medulla,
which secrets hormones that then cause elevated pulse rates, increased blood pressure,
and sweating among other physiological symptoms (e.g., stomach distress, headache,
backache, and other musculoskeletal pain) (as cited in Nixon et al., 2003). Physical
symptoms are manifestations of physical strain which are more likely than not are
responses to environmental stressors at work (Nixon et al., 2003. Employee health related
issues pose potential negative organizational outcomes.
Strategies to improve stress levels in organizations included providing stress
management training to employees, and an employee assistance program (EAP) to help
enhance the coping abilities of individuals who are dealing with overwhelming work
situations (NIOSH, 1999). At the time of this prior research study, nearly one-half of the
large organizations in the United States were said to have provided some form of stress
management training for their workforce (NIOSH, 1999). Updated data is needed to
ascertain the number of organizations that maintain these programs, and if they have
increased in numbers, more importantly the effectiveness of such programs.
The Globe Newswire reported that although the U.S. unemployment rate may
continue to decline stress levels are increasing among workers; more than 8 in 10
Americans who are employed reported that they are stressed out due to heavier
workloads, and low pay according to the data provided by the 2013 Work Stress Survey
conducted by Harris Interactive for Everest College (as cited in Corinthian College Inc.,
2013). The survey that was conducted among employed individuals found that
67
approximately 83% of Americans were stressed by a minimum of one thing at work, and
this was an increase from 2012 when 73% reported being stressed (Corinthian College,
Inc., 2013). The Everest College’s 2013 Work Stress Survey was conducted by telephone
within the United States by Harris Interactive between February 21 and March 3, 2013
(Corinthian College, Inc., 2013). Among the 1,019 employed U.S. adults were ages 18+
(Corinthian College, Inc., 2013). Results were weighted for age, sex, geographic region,
and race when necessary to align them with their actual proportions in the population
(Corinthian College Inc., 2013, para. 2).
Perhaps a combination of approaches to stress management (e.g., community-
based efforts working in concert with organizational efforts) can help minimize negative
impacts. There are “no standardized approaches or simple how-to manual that exists for
developing a stress prevention program; program design and appropriate solutions can be
influenced by a number of factors, such as, the size, and complexity of the organization,
resources, and unique types of stress faced by the organization” (NIOSH, 1999, p. 16).
Steps toward a stress prevention program previously outlined, included building
awareness, commitment by top management and support for the program, employee
participation in all phases, training for staff and use of consultants, and most importantly
communication, these still hold true in today’s organizations (NIOSH, 1999).
The side effects of prolonged stress on the human body have been studied for
quite some time by the medical profession, stress is significant area of study for
organizational leaders, HR professionals, and researchers in the area of industrial and
organizational psychology (Kenexa High Performance Institute, 2011). The impact that
68
workplace stress has on both productivity and personal well-being have been well
documented; for example, the European Agency for Safety and Health at Work reported
that between 50%-60% of employee absences to be stress related (Kenexa High
Performance Institute, 2011). While the recession has generally increased reports of
stress levels there are some industries (e.g., manufacturing) that have reported lower
levels (Kenexa High Performance Institute, 2011).
In a study conducted by researchers at the Kenexa High Performance Institute
(2011) work/life conflict was found to be the leading cause of workplace stress followed
by leader effectiveness, and compensation, yet other factors included working in an
innovative climate, team cohesiveness, cooperation and having up-to-date technology. In
addition to stress, increased levels of frustration were also associated with having
influences on employees (Keenan & Newton, 1984). Lewandowski (2003) stated that
sources of workplace frustration may stem from within the organization (e.g., role
conflict and ambiguity, value conflicts, and feelings of isolation). These factors
contributed to workplace frustration and subsequent employee burnout, and as employees
and organizations continue to face mounting challenges investigations of such factors
increases awareness of workplace concerns and the need for continued improvement
(Lewandowski, 2003). Stress and its relationship with CWB were demonstrated to pose
threats to individual health and the health of organizations (National Institute for
Occupational Safety and Health, 1999). The National Institute for Occupational Safety
and Health (NIOSH) is a federal agency responsible for conducting research and making
recommendations to minimize work related illnesses, the data are collected from various
69
sources (e.g., workers, families) in the effort toward prevention (NIOSH, 1999). More
recent literature in the area of employee-customer interactions proposed that stressful
encounters contributed to negative outcomes for service employees (Zhang, Redfern,
Newman, & Ferreira-Meyers, 2016). Zhang et al. demonstrated that customer-related
social stressors (CSS) led to emotional exhaustion, which in turn, related to CWB for
service employees. Differences in thoughts often lead employees to different conflicts,
and conflicts can ultimately lead to frustration (Andalib, Darun, & Azizan, 2013).
Keenan and Newton (1984) found that self-reported frustration in organizations
was related with anger reactions, latent hostility, job dissatisfaction, and work-related
anxiety. Employees can experience frustration when they are forced to respond to
something that they want to avoid (Andalib et al., 2013). Employees can also experience
frustration when the organizations they work for treats them as working machines rather
than valuing them as human beings (Andalib et al., 2013).
Work Frustrations
Human beings cannot avoid emotions and therefore employees deal with
emotions in their work life as well (Andalib et al., 2013). Employees are influenced by
their perceptions, ideologies, beliefs, and concepts (Andalib et al., 2013). Differences in
thoughts often lead employees to different conflicts, and conflict can ultimately lead to
frustration (Andalib et al., 2013). For example, a difficult boss, non-supporting co-
workers, and obligatory rules may frustrate employees because it hinders their wish for
freedom from annoyance (Andalib et al., 2013). Frustration can be a result of various
conflicts in the work environment that can be segmented into two categories: process and
70
episode (Andalib et al., 2013). Process frustration occurs when individuals feel blocked
in an important part of life such as learning, and work (e.g., lacking in salary and benefits
at work), or love (Andalib et al., 2013). Episode frustration occurs when a temporary
interfering problem, or condition exists in the work environment (e.g., issues with
inconsistent supervisors, irrational and biased behavior) changing an otherwise happy
employee into an unhappy one that gradually becomes frustrated caught in the process
(Andalib et al., 2013).
Frustration is defined as “hindrance with goal attainment or goal-oriented activity
and the interference with goal maintenance” (Spector, 1978, p. 816). Researchers that
investigated factors contributing to workers’ frustrations have evaluated workplace
problems associated with burnout (Lewandowski, 2003). Burnout which is a metaphor
for energy depletion “refers to the smothering of a fire or the extinguishing of a candle”
(Schaufeli, Leiter, & Maslach, 2009, p. 205).
Employees who experienced extended burnout periods can fall short of their
ability to make meaningful contributions to the organization (Schaufeli et al., 2009).
Researchers have proposed two factors in work life that may account for burnout’s
persistence, the first, is a continuous imbalance of demands over resources which occurs
when resources fail to keep pace with demands. (Aiken, Clarke, Sloane, Sochalski, &
Silber, 2002; Bakker & Demerouti, 2007). The second factor relates to motives as
opposed to energy. Hemingway and Maclagan (2004) stated that employees in the
twenty-first century are skeptical of organizational missions, visions, and values. Value
conflicts increase as organizations and employees lessen their commitment to each other
71
(Schaufeli et al., 2009).
Keenan and Newton’s (1984) study investigated frustration in organizations and
relationships to role stress, climate, and psychological strain. Multiple regression analysis
indicated that organizational climate, role stress, and social support can all contribute to
the level of environmental frustration (Keenan & Newton, 1984). Some of the root
sources of frustration related to burnout were suggested to originate within the
organization; however, individual characteristics can also be contributing factors
affecting one's ability or inability to effectively cope with high stress work situations
(Lewandowski, 2003). Reactions to frustrations in organizational settings may also
include some aggressive behaviors (Heacox & Sorenson, 2004).
Spector (1978) hypothesized that those individuals who are frustrated with their
work situation may react aggressively against other individuals, or against the
organization. These behaviors can then escalate into workplace violence where
individuals can be seriously injured or killed (Heacox & Sorenson, 2004). Aggressive
behaviors associated with organizational frustration were described in a study conducted
in the United States by Heacox and Sorenson (2004). Heacox and Sorenson hypothesized
that several situational variables (e.g., role conflict and ambiguity, work constraints, and
organizational warmth and support) were perceived by workers as roots causes of these
behaviors. Earlier research by Spector (1978) noted that behavioral reactions attributed to
frustration were not new phenomena. Behavioral reactions attributed to frustration
continue to plague some work environments to this day. The correlation between
organizational characteristics and frustration was supported by Heacox and Sorenson’s
72
(2004) study. The level of frustration experienced by employees were predicted with
situational variables (e.g., role ambiguity, role conflict, work constraints, and warmth and
support) (Heacox & Sorenson, 2004). Heacox and Sorenson confirmed relationships
between organizational characteristics, and employee reactions such as overt acts of
aggression. Workers, who perceived high levels of constraints, role conflict, or
ambiguity, and/or low levels of warmth and support at work, would be more likely to
engage in CWB (Heacox & Sorenson, 2004).
Furthermore, Heacox and Sorenson (2004) hypothesized that person variables
function as moderating variables between organizational characteristics and frustration,
and between frustration and aggressive behaviors by employees. Person variables
included such things as locus of control and gender. Locus of control is described as “a
generalized expectancy that rewards, reinforcements or outcomes in life are controlled
either by one’s own actions (internality) or by other forces (externality)” (Spector, 1988,
p. 335).
Constantly changing work environments can bring about added stress and
frustration that have been associated with various negative attitudes, and behaviors
(Weinberg & Cooper, 2012). The strength and amounts of frustration are considered
important factors in the study of employee behaviors (Spector, 1978). Spector noted that
frustration can lead to emotional states. Spector described two important characteristics in
investigations: (a) that the emotion is aversive, and that (b) it results in elevated levels of
psychological arousal.
In an elevated arousal state, there is an increase in intensity of the response that is
73
provoked (Spector, 1978). The behavioral aspect was suggested to have at least four
classes of reactions influenced by frustration, and they include: finding alternate means to
goal attainment, aggressive behavior, withdrawal from the situation, or choosing to
abandon the goal altogether (Spector, 1978). Spector noted that much of research on
frustration is related to either an aggressive component, or the impact of frustration on
performance.
Frustration’s relationship with aggressive behaviors is well documented in studies
(Buss, 1963; Spector, Penner, & Hawkins, 1975), and researchers have proposed that
frustration is most likely to occur when others repeatedly impede the attainment of an
important goal, or no punishment is ascribed for the aggressive behavior (Spector, 1978).
Spector outlined variables that individuals might perceive as hindering goal attainment
and that lead to frustration. Spector stated that variables that may hinder goal attainment
include: other individuals at work and the structure of working environments (e.g.,
organizational procedures and rules. Additionally, researchers using an adaptation of
O’Connor et al.'s (1984) scale found situational constraints to be positively associated
with perceptions of frustration, and perceived frustration to be positively associated to
counterproductive reactions (Storms & Spector, 1987, p. 232). These observations
demonstrated the association between perceived frustration and CWBs during stressful
organizational change when anxiety levels may be abnormally high. Eder (2008)
suggested that having a positive relationship with one’s organization helps to reduce
some of the negative effects.
Spector (1978) discussed how organizational change can lead to severe frustration
74
for workers by interfering with task performance and individual needs or goals. Reactions
such as turnover intentions, abandonment of production goals, and poor job performance
may increase (Spector, 1978). Spector suggested that to lessen negative reactions
employee participation in the change process may be part of the solution.
Participation was suggested to have three effects on frustration: first, employees
who participate in the change process may have some influence on the form it takes, so
that the change does not hinder attainment of personal goals and needs (Spector, 1978).
Second, when employees have clarity, and understand the reasons for change and is
involved the frustration that arises is reasonably negative, and impact is greatly
minimized (Spector, 1978). Lastly, Spector argued that employees need to have a sense
of control over their work environment, a lack of control could lead to frustration, so by
including their participation it could help avoid frustration particularly for individuals
with control needs. Attention has also been devoted to gaining a better understanding of
the effects of change events, and the impact that positive/negative employees can have
(Avey, Wernsing, & Luthans, 2008).
Subjective Well-Being and Personality
Subjective well-being (SWB) encompasses how people assess their lives both at
the current moment, and over longer periods (Diener, Oishi, & Lucas, 2003).
Assessments included how individual react to changes when they take place, or moods at
the time, judgments formed about such things as satisfaction with their life, and other
areas including family and work (Diener et al., 2003). Though everyone's self-assessment
and judgments may vary over time, researchers continued to study these undulations
75
examining the longer-term mean level differences that existed between individuals and
societies (Diener et al., 2003).
There are several theoretical traditions that have enhanced our understanding of
SWB (Diener et al., 2003). For example, Humanistic psychology has sparked interest in
positive psychology (Diener et al., 2003). “The field of subjective well-being (SWB)
comprises the scientific analysis of how people evaluate their lives-both at the moment
and for longer periods such as for the year” (Diener et al., 2003, p. 404). Diener et al.
demonstrated that SWB is moderately stable over time, and rebounds after major life
events and is frequently strongly associated with stable personality traits. How
individuals feel and think about their lives is necessary to gaining insight on well-being in
any society that attaches importance not only to the opinions of experts or leaders, but to
all individuals in the society (Diener et al., 2003).
Avey, Wernsing, and Luthans’s (2008) study was devoted to gaining a better
understanding of the effects of change events and the impact that positive/negative
employees have. Empirical investigations that reviewed what impact if any employee’s
resistance can have on change events, and those who may have a more positive impact,
provided a wealth of information (Avey et al., 2008). Employees need to be able to adapt
and incorporate healthy strategies in their efforts to attain redefined goals (Avey et al.,
2008).
Extending investigations on personality traits and individual differences can
provide additional insight. Feedback from participants has identified certain individual
characteristics such as positive emotions, communication, management of difficulties and
76
conflicts, socio-emotional skills, and values that may have some influence on perceptions
(Biggio & Cortese, 2013). Feedback in research has been a proven resource to aid
researchers in their effort to recognize and understand differences (Biggo & Cortese,
2013). Individual differences include differences in the perceptions, well-being,
interactions between individuals and the organization, and the quality of relationships
between individuals and coworkers (Biggo & Cortese, 2013). Strategies derived from
such constructive feedback provide organizations with invaluable information that they
can utilize in helping employees find healthier ways to cope with work stress and
frustration thus facilitating employee, and organizational well-being (Biggo & Coetese,
2013).
Another area of concern, and one that is related to employee health and behavior
is the psychosocial factor (Houdmont, Kerr, & Addley, 2012). There is not a great deal of
research which explores changes in workers’ psychosocial hazard exposures, work
related stress, and stress related absence related with the onset of economic recession
(Houdmont et al., 2012). Houdmont et al.’s investigation demonstrated that exposure to
psychosocial hazards to be greater during economic recession than prior to its onset. The
findings of Houdmount et al.’s study underscores the need for more investigations on
psychosocial risk management as a strategy to promote worker health in times when
organizations may be solely focused on their own survival rather than improving the
psychosocial work environment.
Psychosocial Factor
Employees are human beings who work to provide support in the economic
77
system of a nation, and of the world, or improve individual lifestyle and living standards
(Andalib, Darun, & Azizan, 2013). Human beings cannot avoid emotions, and deal with
their emotions both at work and their personal life, influenced by perceptions, ideologies,
beliefs, and concepts (Andalib et al., 2013). Differences in the thoughts of individuals
often lead employees to various conflicts (Andalib et al., 2013). Conflict can lead to
internal anxiety, peer tension, unhealthy working atmosphere, and ultimately frustration
(Andalib et al., 2013). “Frustration is a state of mind which leads one to such a blockage
that is captured by all negative vibrations of emotion” (Andalib et al., 2013, p. 2).
Houdmont and Addley’s (2012) investigations provided information on levels of
psychosocial hazard exposures, work-related stress, and stress related absence that may
be experienced at increased levels during periods of economic decline when compared to
prior levels. These observations signify that exposures to psychosocial hazards are greater
during economic decline than prior to its onset (Houdmont & Addley, 2012). Perceptions
of economic stress have been linked with negative job attitudes, work
withdrawal, and impaired health (Houdmont & Addley, 2012).
Probst (2005) suggested a correlation between negative job attitudes,
compromised health, and economic stress. Surveys conducted during periods of
economic downturn suggested that workers characteristically perceive the economic state
of affairs as having a direct impact on psychosocial work conditions, and mental health
“the findings highlight the need for a focus on psychosocial risk management as a means
to promote worker health in times when organizations might be tempted to focus on
survival rather than improving the psychosocial work environment” (Mind/Populus,
78
2010, p. 101).
Individual reactions to organizational strains vary; what remains relatively the
same is the potential threat, and costs to organizations (Beehr & Glazer, 2005). Reactions
can impact the quality and quantity of productivity, achievement of goals, interpersonal
conflicts, absenteeism, and disrupt organizational functioning (Beehr & Glazer, 2005).
Uncertainties in the workplace, and the presence of added stress for individuals are not
easily avoided during change events (Nixon, Mazzola, Bauer, Krueger & Spector, 2011).
The effects on employees’ health and wellbeing has gained the interest of many along
with rising medical costs (Nixon et al., 2011).
Along with concerns of employees’ health are concerns regarding organizational
outcomes. Grdinovac and Yancy (2012) explored how organizations adapted to the
most recent recession. Organizational commitment was at the top of the list of when
considering organizational outcome (Grdinovac & Yancey).
Organizational Outcomes
Beehr and Glazer (2005) described organizational outcome as employees’
reactions to stress which causes more damage to the organization than it does to the
individual themselves. Negative reactions such as a lack of organizational commitment,
changes in work performance, and perceptions of organizational justice related to stress,
can all impact organizations and prove costly (Beehr & Glazer, 2005). Psychological,
physiological, and behavioral organizational strains have also been associated with
employee reactions and negative organizational outcomes (Beehr & Glazer, 2005).
Organizational commitment is important particularly when companies are
79
severely impacted by economic change, and they may have to employ management
practices that appear uncaring and callous to their employees (Grdinovac & Yancy,
2012). Such practices include downsizing which damages relational psychological
contracts (Grdinovac & Yancy, 2012). On the other hand, companies that employ
management practices that appear caring and humane to their employees, such as
executive pay reductions, will enhance relational psychological contract. Organizational
commitment was positively associated to job performance, and related employees’ work
behavior, it was also related to how satisfied employees are with their jobs (Grdinovac &
Yancey, 2012). Grdinovac and Yancey further stated that the recent recession may pave
the way for organizations to win the loyalty and trust of their employees. Employees who
are treated fairly would likely remember their company’s treatment during tough times
(Grdinovac & Yancey, 2012).
Fluctuations in economic conditions have caused rippling effects on businesses
around the world, and organizations are finding that they must take drastic steps in order
to successfully overcome challenges (Fapohunda, 2012). The expanding economic
decline links countries around the world who have all felt it’s long reaching negative
impact through massive downsizing, and unemployment left in its wake (Fapohunda,
2012). Effective human resource management is met with challenges related to the
current economic crisis; for example, in areas related to conflict resolution the dynamics
involved dictate a need to better understand factors that help promote healthier responses
to stress and frustration (Fapohunda, 2012). Building stronger transparent relationships
between organizations and individuals would aid in the effort to improve work
80
relationships (Fapohunda, 2012).
Surveys conducted on how economic conditions have influenced individual
perceptions of change events include one conducted by Pew Research (2010). Pew
Research found that more than half 54% of the respondents said that we were still in a
recession compared to 41% who said we were beginning to come out of the recession,
and 3% that said the recession was over. Additionally, about 48% said that their
household was worse now than before the recession, and one-in-five 21% said they were
better off, the rest said there was no change (Pew Research, 2010). Most Americans 70%
said that they believed that the recession has imposed major changes on the U.S.
economy, and 61% said changes were temporary (Pew Research, 2010). A better
understanding of factors which influence perceptions, work relationships, and behaviors
during a recessionary period is important in seeking healthier adaptive coping methods
for employees.
Investigations related to organizational functioning includes different
perspectives. Researchers in various disciplines addressed the problem, strengths, and
weaknesses inherent in their approaches in various ways. For example, in Rafferty and
Griffin’s (2006) study on perceptions of organizational change, strengths of the study
included the separate measurement of change perceptions, and employee attitudes as to
reduce the effects of common method variance. While in Ostroff, Kinicki, and Clark’s
(2002) study, they reported that the temporal separation of administration of measures is
a valid approach to reducing response bias associated with common method variance.
Hershcovis, Reich, Parker, and Bozeman (2012), demonstrated the value of
81
investigating aggression dependent on the features of a specific relationship rather than
from an individual’s perspective such as someone at work; yet a potential limitation of
this study was the use of self-reports. In recognition of the possible threat to validity
associated with common method bias, Hershcovis et al. employed several strategies
recommended by Podsakoff, Mackenzie, Podsakoff, and Lee (2003). “First, to diagnose
the presence of common method bias, they conducted a Harman’s single factor test;
second, they assured participants of the anonymity of their responses; third, they
controlled for negative affectivity and social desirability; fourth, they compared their
hypothesized measurement model to a model that included a common method
factor, and the latter had significantly worse fit” (Hershcovis, et al., 2012, p.15).
The rationale for selection of the variables in this study included organizational
studies which have investigated change and its influence on work behaviors. For
example, researchers in one study identified three distinct change characteristics: the
frequency, impact, and planning of change (Rafferty, Allanah, E., & Griffin, 2006). In
other studies, researchers demonstrated that stress and change have posed various
challenges for worker’s health (Velciu, Drăgoiu, & Mladen, 2010). Additionally,
Chernyak-Hai & Tziner’s (2014) investigation extended research in the area of CWB and
used the Social Exchange Theory as a framework for gaining a better understanding of
these negative work behaviors.
There is not an overwhelming body of investigations of the American workplace
or influences on the costly effects of CWB, and this area of study needs to be extended.
Interest continues to mount concerning factors influencing the behavior of individuals in
82
work environments, and the potential impact it has on the wellbeing of others and
organizational outcomes (Fox & Spector, 2005). The term CWBs are used to describe
negative behaviors and related classes, and encompass individual characteristics, and
those of the workplace, as well as several personality variables such as conscientiousness,
locus of control, narcissism, trait anger (e.g., mild to intense rage), anger, and Type A
impatience-irritability (Fox & Spector, 2005).
Summary and Transition
The current review explored research in the areas of perceived uncertainty, stress,
frustration, and correlations with CWBs. Uncertainty coupled with persistent stress and
frustration can wreak havoc on the physiological, psychological, and emotional well-
being of workers, coworkers, organizations, and even extend out into communities.
Additionally, there are several work stressors (e.g., interpersonal conflict, organizational
constraints) which are suggested to have relationships with interpersonal and
organizational forms of CWBs (Hershcovis, Reich, Parker, & Bozeman, 2007; Penny &
Spector, 2005).
Investigations of stressors such as interpersonal conflict, organizational injustice
and the amount of workload (Hershcovis, Reich, Parker, & Bozeman, 2007; Chen &
Spector, 1992; Nixon, Mazzola, Bauer, Krueger, & Spector, 2011) are suggested to have
positive relationships with CWBs. Studies on work stressors and relationships with
CWBs have provided theoretical mechanisms such as the affective events theory (AET)
by which we have gained a better understanding of stressors that lead to CWBs (Weiss, &
Corpanzano, 1996). Weiss and Corpanzano suggested that emotions were a primary link
83
between work experiences and employee behavior. The suggestion that prolonged
exposure to work stressors may lead to negative emotional reactions such as anger,
frustration, and fatigue has significant implications for employees and organizations
(Nixon, Mazzola, Bauer, Krueger, & Spector, 2011). Smith, Karsh, Crayon, and Conway
(2003) stated that in addition to job stressors and its relationship with work behaviors,
employee health and well-being was also gaining increased societal attention due in part
to the medical costs associated with stress-related illness.
Researchers described that the neurochemical responses triggered by stress in the
human body have been investigated to a great extent, and while there will still be ongoing
investigations the major components of the process are thought to be identified;
empirical evidence showed that the hypothalamic-pituitary-adrenocortical (HPA) axis,
and the sympathetic-adrenome-dullary (SAM) systems are greatly involved in the
association between stressors and health (Dienstbier, 1989; Frankenhaeuser, 1991).
Szabo, Tache, and Somogy (2012) noted the contribution of Selye (1936) to medical
research involving stress. For example, when an employee perceives a situation as
harmful or threatening the hypothalamus is activated, and then responds in two ways:
first, it activates the hypothalamic-pituitary-adrenocortical (HPA) system through the
three stages of the general adaptation syndrome (e.g., alarm, resistance, exhaustion)
(Selye, 1936). The activation of the hypothalamus in turn also activates the sympathetic-
adreno-medullary (SAM) system by triggering one of the earliest responses to stress
through the sympathetic nervous system, a reaction known as the fight-or-flight response
(Cannon, 1932). This study is needed to further investigate associations between
84
perceptions of uncertainty, stress, and frustrations, and the costly effects that increased
CWBs have on organizations in the United States during periods of economic undulation.
There is a gap in knowledge and clarity in the area of negative influences on
American workers impacted by a decline in economic climate, and related levels of
CWBs because this has not yet been explored. The design for this study was chosen
based on a review of existing psychological literature in the areas of perceived
uncertainty, stress, frustration, as well as CWBs which have been investigated from
different perspectives spanning over the past two decades (Fox & Spector, 2005). CWBs
is an umbrella term that describes behaviors at work that harm employees and
organizations (Fox & Spector, 2005). Theories presented by researchers on CWBs
included the stressor emotion model (Spector & Fox, 2005), and causal/reasoning theory
(Martinko, Gundlach, & Douglas, 2000) which further suggested relationships between
environment factors and emotional experiences.
Researchers who focused investigations on CWBs aimed at organizations (CWB-
O) suggested that future studies should explore “whether theories and findings of the
twentieth century’s examinations of CWB-O continue to accurately describe motives and
outcomes of new types of workplace deviance in the twenty-first century” (Klotz &
Buckley, 2013, p. 128). Although a large body of work exists on counterproductive
workplace behavior, few studies were found which examined relationships between
uncertainty, stress and frustration and incidences of CWBs in the United States. This
study fills a gap that exists and extends knowledge in the area of the costly effect of
CWBs by American workers in an uncertain climate. The design for this study was
85
chosen based on a review of existing psychological literature in the areas of perceived
uncertainty, stress, frustration, and CWBs. The next chapter discusses the methodology,
setting, sample, and analysis that was used to conduct the study.
86
Chapter 3: Research Method
Introduction
The purpose of this study was to examine whether uncertainty, stress, or
frustration are related to variability, or in predicting CWBs. Researchers have found that
employee CWBs are costly and can harm organizations and stakeholders (Fox & Spector,
2005; Ramshida & Manikandan, 2013). Researchers encourage future investigations to
consider more predictors that contribute to deviant behavior in private organizations as
well as public organizations (Alias et al., 2013). This chapter includes a detailed
description of the research design and rationale, and methodology. Additionally,
measures and instruments, analysis plans, and ethical considerations are included.
Research Design and Rationale
The design for this study examined the research questions associated with
relationships among uncertainty, stress, frustration, and CWBs in auto industry workers.
The independent variables are uncertainty, stress, and frustration. The dependent variable
is counterproductive work behavior. Multiple regression analysis aided in differences and
relationships among variables.
Additionally, the design for this study was correlational with a cross-sectional
survey method. Surveys took the participants approximately 30 minutes to complete, and
a shut off date and time (e.g., beginning at 8 am on the first day and ending at midnight
on the last day) was provided. The survey design choice is consistent with research
designs needed to advance knowledge in the discipline; it allows for the collection of
pertinent information related with the problem statement. The problem statements
87
speculated that there is a relationship between the independent variables of uncertainty,
stress, and frustration, and the dependent variable of CWB. Both FindParticipant.com and
SurveyMonkey were approved by the institutional review board (IRB).
FindParticipants.com was used to recruit the participants; then the survey was hosted on
the SurveyMonkey platform. The collection time was 4 months.
Additional research relevant to the topic of study reported use of survey design.
Anjum and Parvez (2013) conducted a study that demonstrated use of a survey method to
collect Minnesota Job Satisfaction, Interpersonal Conflict, and CWB data from 400 blue
collar and white-collar workers. Anjum and Parvez were able to demonstrate through
statistical analysis of data collected, that significant differences exist in the magnitude of
CWBs in blue and white-collar workers. Likewise, this study investigated CWB as a
variable and used a survey design.
Methodology
Population
Participants in this study consisted of a sample of culturally diverse individuals
representing all areas of the automotive industry across the United States. A population of
500 was sought from a pool of automotive workers in the United States; however, due to
the limited number of participants/volunteers who met the criterion set forth in this study,
the proposal was revised to reflect that surveys were sent to approximately 300
volunteers who met the criteria. Online professional survey platforms named Find
Participants.com and SurveyMonkey.com were used to reach the participants for this
study. The participants were individuals who volunteered for the study, were currently
88
working in all areas of the auto industry across the United States, and who were recruited
via Find Participants.com.
Procedures
Prior to the collection of survey information from participants, and in line with the
appropriate steps required in data collection, approval authorization was first obtained
from Walden’s Institutional Review Board (IRB Approval # 02-23-17-0091-335).
Demographics: A demographic questionnaire at the end of the survey assessed basic
information regarding the participants’ gender, age, employment status, position, tenure,
and ethnicity. Findparticipants.com sent recruitment e-mails to potential participants,
which included the researcher’s conditions of participation. FindParticipants did not
survey the participants; they simply provided the forum for researchers to connect with
participants who had already volunteered to be contacted for research. FindParticipants
does not release any identifying information about participants, or information that would
allow participants to be identified to any other user including researchers. Auto industry
workers were recruited/encouraged via an invitation by Find Participants.com a
professional online survey link. All information pertaining to the survey, and the survey
was accessible to participants online. As an introduction to the survey, the informed
consent explained the study; additionally, anonymity regarding participation was
included. Risks and benefits to participate outlined, and contact information was
provided.
Participants were selected for the following reasons, the population is accessible,
they are of age to provide informed consent, it is presumed that they have experienced
89
both positive and negative life events, they have the reading comprehension necessary to
complete the questionnaires, and they are employed in the U.S., and have access to the
internet. Online survey is consistent with methodology used in previous CWB research,
consisting of survey data collected from employees (e.g., Cohen, Panter, & Turan, 2013).
Information on how respondents were recruited via Find Participants.com is available at
their website.
Because the number of participants who met the criteria of the study was 300,
according to Raosoft’s (2004) sample size calculator, with a margin of error set at 5%, a
confidence level of 95%, a population size of 300, and a response distribution of 50%, the
recommended sample size was 169. The sample size is very important, and among the
considerations for the sample size in this study is the need to have sufficient statistical
power as well as the expense of the collection. The American Psychological Association
(2010) suggests that we should also look at effect size. The effect size (e.g., Cohen’s d
and r²) shows how much of a role the conditions of the independent variable play in
determining scores on the dependent variable (Jackson, 2010). Cohen’s (1988)
conventions was used to interpret effect size; a correlation coefficient of .50 represents a
strong/large correlation. The significance level (α) is an observed difference between two
descriptive statistics that is unlikely to have occurred by chance (Jackson, 2010). Most
researchers adopt a .05 level of significance (Jackson, 2010). A significance set at the .05
level means that a difference as big or bigger than what is observed between the sample
and the population could have occurred by chance only 5 times or fewer out of 100
(Jackson, 2010).
90
All response data were analyzed using the statistical package for social sciences
(SPSS) version 21, and measures reliability were assessed and reported. Data collected
was stored in SurveyMonkey.com initially, and then exported to SPSS version 21
graduate package for analysis. Data is stored on a disk in a secure location in compliance
with Walden University’s guideline requirements.
“Statistical power depends on three classes of parameters: (1) the significance
level (i.e., the Type I error probability) α of the test; (2) the size (s) of the sample (s) used
for the test; and (3) an effect size parameter” (Faul, Erdfelder, Lang, & Buchner, 2007, p.
176; University of Wisconsin, n. d.). Type I errors occur when the researcher rejects a
null hypothesis that is true, and the risk of committing a type I error is minimized by
selecting an alpha level (usually .05 or .01 (Gravetter & Wallnau, 2004). Type II errors
which are represented by the Greek letter ß occur when the researcher fails to reject the
null hypothesis that is really false (Gravetter & Wallnau, 2004).
Instrumentation and Operationalization of Constructs
Measures
Psychological Uncertainty Scale. The psychological uncertainty scale was
developed by Rafferty and Griffin’s (2006) study, and was based on work by Milliken
(1987) to measure individual’s appraisal of the uncertainty associated with organizational
change. This measure was selected based on the use by researchers who investigate
organizational change, and the influence on individuals’ appraisal of uncertainty
associated with change, and their response to change (Dahl, 2010; Lattuch & Young, 2010;
Rafferty & Griffin, 2006). This study was conducted in a large Australian public-
91
sector organization and utilized a repeated cross-sectional design (Rafferty & Griffin).
Change items were administered to more than 200 employees in two pilot studies.
Items used to assess an individuals’ perception of change were developed
following semi structured interviews with employees (Rafferty & Griffin, 2006).
Followed by the change items that were administered to 200 employees in two pilot
studies (Rafferty & Griffin, 2006). A process of iterative development was put into effect
resulting in the modification of items, so that items that did not load onto their
hypothesized factor in the first pilot study were removed or modified (Hinkin, 1995,
1998). The modified items were then administered to participants in the second pilot
study (Rafferty & Griffin, 2006). This process resulted in a three-item change measure,
and a four-item measure of psychological uncertainty (Rafferty & Griffin, 2006). An
example item includes: “I am often uncertain about how to respond to change” (Rafferty
& Griffin, 2006, p. 1157). A 7 -point Likert scale was utilized, with responses from (1)
strongly disagree) to (7) strongly agree; lower scores indicate less experienced
uncertainty; higher scores indicate more experienced uncertainty (Rafferty & Griffin,
2006). This scale had a Cronbach’s alpha of .88 in Sample 1 and .91 in Sample 2
(Rafferty & Griffin, 2006). Hypothesis results reflected that hypothesis 1A was supported
as the planning of change was significantly negatively associated with psychological
uncertainty (ß = -.17, p < .01). Hypothesis 1B was also supported as the frequency of
change was positively associated with uncertainty (ß = .55, p < .001). It is noted however,
hypothesis 1C was not supported as transformational change was not significantly
associated with uncertainty (ß = .10, p > .05). Hypothesis 2A was supported as
92
uncertainty was negatively related to satisfaction (ß = -.15, p < .01), and positively
related to turnover intentions (ß =.17, p < .01). This instrument appears to measure what
it says it does. Permission was obtained from the scales developers.
Perceived Stress Scale. The perceived stress scale (PSS-10) used in this survey is
an instrument developed by Cohen, Kamarck, and Mermelstein (1983). Cohen et al.’s
(1983) PSS-10 was “designed to measure the degree to which situations is appraised as
stressful” (pg. 385). This measure was selected because it is widely used globally as a
measure of perceived stress (Fireman & Santuzzi, 2012). Reliability was determined
using three samples, two of college students and one in a community smoking-cessation
program (Cohen et al., 1983). The respondents were 322 in sample I, 144 in sample II,
and 64 in sample III (Cohen et al., 1983). Coefficient alpha reliability for the PSS was
.84, .85, and .86 respectively. For a state measure, test-retest correlations should be much
higher for short test intervals; the PSS was administered on two occasions separated by
two days to 82 college students, the test-retest correlation in this sample was .85 (Cohen
et al., 1983). Construct validity PSS scores were moderately related to responses of
stress, and potential stress according to frequency (Cohen & Williamson, 1988). Content
and face validity of the PSS was supported by evidence in Cohen et al. (1983), and Cohen
and Williamson (1988).
Fireman and Santuzzi’s (2012) study on bullying, and its correlation with
emotional stress found the PSS to have an internal reliability value of .850. The perceived
stress scale (PSS) has various versions; however, this study used the 10-item scale
(Cohen et al., 1983). For scoring purposes, the PSS scores are obtained by reversing
93
responses (e.g., 0 = 4, 1 = 3, 2 = 2, 3 = 1, & 4 = 0) to the four positively stated items
(items 4, 5, 7, & 8) and then summing across all scale items. A short 4 item scale can be
made from questions 2, 4, 5, and 10 of the PSS-10 item scale (Cohen et al., 1983).
The PSS-10’s items tap into how unpredictable, uncontrollable, and overloading
respondents find their lives (Cohen et al., 1983). Participants respond on a 5-point Likert
type scale ranging from 0 (never) to 4 (very often); of the 10 items, and 4 items are
worded in a positive direction, these are reversed scored. The responses are then summed
to form a psychological stress score with the higher scores indicating greater
psychological stress. Cohen and Janicki-Deverts (2012) assessed psychological stress in
three national surveys administered in 1983, 2006, and 2009. The Harris Poll Survey was
comprised of 960 males and 1,427 female respondents residing in the United States, 18
years of age and older. The eNation Survey administered in 2006 and 2009 consisted of
2,000 adults 18 years of age or older residing in the United States. Internal reliabilities
(Cronbach’s α’s) for the PSS-10 were .78 in a Harris Poll sample, and .91 in the 2006 and
2009 eNation samples (Cohen & Janick-Deverts, 2012, p.1324).
The data collected from these samples were used to compare the stress levels of
individuals in the United States, and how unpredictable, uncontrollable, and overloading
participants find their lives (Cohen & Janicki-Deverts, 2012). The responses were then
summed to get a psychological stress score, and higher scores were indicators of greater
stress (Cohen & Janicki-Deverts, 2012). Internal reliabilities (Cronbach’s α) for the PSS-
10 were .78 in the Harris Poll sample, and .91 in both the 2006 and 2009 eNation samples
(Cohen & Janicki-Deverts, 2012). This instrument appears to measure what it says it
94
does. Permission was obtained from the scales developers to use in this study.
Frustration Scale. The frustration scale (FS) was developed by Peters, O'Connor,
and Rudolf (1980) to assess job-associated frustration. This measurement was selected
based on its usage by various researchers (e.g., Peters, O’Connor, & Rudolph, 1980;
Spector, Dwyer, & Jex, 1988; Avey, Wu, & Holley, 2015) who seek to better understand
and predict behaviors in organizations. Avey et al.’s (2015) study focused on how job
embeddedness could influence job frustration, and subsequent citizenship withdrawal,
and deviance behavior. Example items included: (a) Trying to get this job done was a
very frustrating experience; (b) Being frustrated comes with this job; and (c) Overall, I
experienced very little frustration on this job (Avey et al. 2015). This scale demonstrated
adequate internal reliability (α =.70). Participants respond to each item on a 7-point
Likert type scale, and responses are summed so that a high score indicates more
experienced frustration. The validity of this measure was demonstrated in a large sample
(N = 1450) drawn from three managerial levels of a national convenience store
organization (O’Connor, Peters, Weekley, Frank, & Ernkrantz, 1984). O’Connor et al.’s
(1984) analysis demonstrated a strong correlation reliability estimate of .68 between
frustration and situational constraints.
In a sample of graduate and undergraduate students the alpha coefficient was .76.
The three-item Peters and O’Connor (1980) measure was used to measure secretarial
frustration on the job. A sample of 191 female secretaries from the University of South
Florida were asked to complete the survey, and the alpha coefficient for the frustration
measure in this study was .83. Omar and Ahmad (2014) in a more recent study measured
95
team frustration in a sample of 292 participants. The researchers used the three-item
instrument developed by Peters, O’Connor and Rudolph (1980). The original items were
modified to reflect frustrations experienced by team members (Omar & Ahmad, 2014).
The results reflected team member frustration had a Cronbach alpha of 0.70, and the
construct reliability estimates for all latent variables exceeded 0.70 indicating good
internal consistency. Respondents respond to each item on a 7-point Likert scale, and
responses are summed so that a high score indicates more experienced frustration.
Permission was obtained from the scales developers to use in this study.
Counterproductive Work Behavior Checklist. This measure was selected based
on its usage by researchers investigating workplace behaviors (e.g., Spector, Bauer, &
Fox, 2010), this scale was adopted from previously established scales. The shorter 10-
item version of the Counterproductive Workplace Behavior Checklist (CWB-C; Spector
et al., 2006) consists of 5 items targeting the organization, and 5 items targeting people
(Spector et al., 2010). Spector et al.’s (2010) study was comprised of 259 participants,
both employees and their supervisors were recruited from classes at a large public
university in the southeastern United States. The internal consistency reliability estimates
(coefficient alpha) in Spector et al.’s (2010) study averaged .78 for the two employee
forms (agreement and frequency) and averaged .89 for the two supervisor forms. A copy
of the CWB-C 10 was secured after directly contacting Dr. Spector via email inquiry.
Permission to use the instrument in this study was granted by Dr. Spector. There isn’t a
way to set a certain time limit to take surveys; however, a cutoff date and time (e.g., four
weeks, beginning at 8 am on the first day and ending at midnight on the last day).
96
Other versions of the CWB-C used by researchers include that of Cohen, Panter,
and Turan’s (2013) investigation which suggested that among the variables that predict
CWBs are gender, age, intention to turnover, interpersonal conflict at work, negative
affect at work, and guilt proneness. Cohen et al.’s (2013) study used the longer 32-item
CWB-C scale, and items were found to be internally consistent (α =.97). These scales can
also be used to indicate the behavior of others such as coworkers or subordinates (Spector
& Fox, 2001). Responses on all scales are made on a 5-point frequency scale; never, once
or twice, once or twice per month, once or twice per week, and every day (Fox &
Spector, 2001). To score the CWB-C sum the responses to appropriate items where 1 =
the least frequent response, and 5 = the most frequent response (Spector, Fox, Penney,
Bruursema, Goh, & Kessler, 2006; Spector, Bauer, & Fox, 2010).
Additionally, in prior studies, Fox and Spector (1999) investigated the situational,
dispositional, and affective antecedents of CWBs both personal and organizational.
Participants in this study were 185 full-time employees from eight corporations in Florida
and Illinois (Fox & Spector, 1999). The CWB-C scale used is a measure developed from
the Job Reactions Survey (Spector, 1975). Fox and Spector (1999) reported a Cronbach’s
α of .86 in this earlier version of the CWB measure. Organizational CWB was related to
constraints, locus of control, job satisfaction and frustration (r .37, .32, .45, and .36,
respectively), and Personal CWB was related to constraints, locus of control, and
frustration (r .26, .19, and .23, respectively). As demonstrated by Fox and Spector’s
(1999) study, the CWB-C had a Cronbach’s α of .86. “Using structural equation
modeling, the plausibility of this model was strongly supported, with goodness of fit
97
indices of 0.97 and 0.98, and all paths significant” (Fox & Spector, 1999, p. 926).
More recently, Anjum and Parvez (2013) used a version of the CWB-C scale to
compare blue collar and white-collar workers’ counterproductive behavior at work. This
scale is divided into five subscales abuse (nine items), sabotage (three items), production
deviance (three items) theft (five items), and withdrawal (four items) (Anjum & Parvez).
The reliability statistics of the dimensions were reported as: “abuse (α = 0.771), sabotage
(α = 0.812), production deviance (α = 0.836), theft (α = 0.831) and withdrawal (α =
0.883); the overall reliability (Cronbach’s alpha) of this scale (all/32 items) in this study
is reported as .84 which shows that the internal consistency is high, and the scale is
reliable” (Anjum & Parvez, 2013, p. 423).
Operational Definitions of Variables
In this study, psychological uncertainty was operationalized as responses on
Rafferty, Allanah, and Griffin’s (2006) psychological uncertainty scale related to: (a) the
unpredictability of changing work environments, (b) responding to change, (c) effect of
change on work unit, and (d) severity of change. A 7-point Likert scale is utilized to
assess uncertainty with responses ranging from 1 (strongly disagreed) to 7 (strongly
agree), and employees are asked to respond to these items keeping in mind the changes
that occurred in their work environment in the past month (Rafferty & Griffin, 2006). An
example item is the following: “I am often uncertain about how to respond to change”
(Rafferty, Allanah, & Griffin, 2006, p. 1157).
Perceived stress was operationalized as responses on Cohen, Kamarck, and
Mermelstein’s (1983) perceived stress scale (PSS-10) related to: (a) unexpected events,
98
(b) lack of controlling important things in one’s life, (c) ability to handle one’s personal
problems, and (d) anger over things outside of one’s control. The questions in the PSS-10
asked about feelings and thoughts during the last three months (Cohen et al., 1983).
“Participants respond on a 5-point scale ranging from 0 (never) to 4 (very often); of the
10 items, 4 items are worded in a positive direction, so they are reversed scored” (e.g., 0
= 4, 1 = 3, 2 = 2, 3 = 1 & 4 = 0) (Cohen & Janicki-Deverts, 2012, p. 1323). “The
responses to the 10 items are then summed to produce a psychological stress score with
higher scores indicating greater psychological stress” (Cohen & Janicki-Deverts, 2012, p.
1323). An example item is the following: In the last month how often have you felt you
were on top of things (Cohen et al., 1983)?
Frustrations were operationalized as responses on Peters, O’Connor, and Rudolf’s
(1980) frustration scale related to: (a) levels of frustration/trying to get a job done, (b)
being frustrated comes with this job, (c) overall, very little frustration experienced on this
job. Participants respond to each item on a 7-point Likert scale with responses ranging
from 1 (not frustrating) to 7 (extremely frustrating), and responses are summed so that a
high score indicates more experienced frustration (Peters, O’Connor, & Rudolf, 1980).
An example item is the following: Trying to get this job done was a very frustrating
experience (Peters et al., 1980).
Counterproductive work behaviors were operationalized as self-reported
responses on Spector, Bauer, & Fox’s (2010) counterproductive work behavior checklist
related to a person’s behavior: 5 items targeting the organization and 5 items targeting
people. Responses were made on a 5-point frequency scale: Never, Once or twice, Once
99
or twice per month, Once or twice per week, Everyday (Spector et al., 2010). An example
item is the following: How often have you done each of the following on your present
job: insulted or made fun of someone about their job performance (Spector et al., 2010)?
Data Analysis Plan
All survey response data were analyzed using the statistical package for social
sciences (SPSS) version 21, and measures reliability were assessed and reported. Data
cleaning addressed data problems. This process involved dealing with data problems once
they took place, and entailed repeated rounds of screening, diagnosing, and editing of
suspected abnormalities (Van den Broeck, Cunningham, Eeckles, & Herbst, 2005). Van
den Broeck et al. described a data cleaning framework that involved a screening process
(e.g., lack/excess of data, outliners, strange patterns, suspect analysis results), and
diagnosis (e.g., errors/ missing data, true extreme, true abnormalities, no diagnosis, still
suspect), and editing (e.g., correction, deletion, leave unchanged). The data were
analyzed for problems, and adjustments were made as indicated in Chapter 4.
The research questions for this study were derived from the review of existing
literature on workplace psychological uncertainty, perceived stress, frustration and
CWBs. Is there a correlation between the independent variables (IV’s) psychological
uncertainty, as measured by Rafferty et al.’s (2006) psychological uncertainty scale;
perceived stress, as measured by Cohen et al.’s (1983) perceived stress scale; and
frustration, as measured by Peters et al.’s (1980) frustration scale; with the dependent
variable (DV) CWB, as measured by Spector et al.’s (2006) counterproductive work
behavior checklist.
100
Reacher Question 1: Does perceived employee uncertainty, stress, and/or frustration
predict CWBs during periods of organizational transformations, and throughout their
work careers?
Ho1: Perceived employee uncertainty, stress, and/or frustration does not
predict their CWBs during periods of organizational transformations, and
throughout their work careers.
Hα1: Perceived employee uncertainty, stress, and/or frustration predicts their
CWBs during periods of organizational transformations, and throughout their work
careers.
Research Question 2: Are perceived employee uncertainty, stress, and/or
frustration scores useful in explaining variability in CWBs during periods of
organizational transformations, and throughout their work careers?
Ho2: Perceived employee uncertainty, stress, and/or frustration scores are not
useful in explaining variability in CWBs during periods of organizational
transformations, and throughout their work careers.
Hα2: Perceived employee uncertainty, stress, and/or frustration scores are useful
in explaining variability in CWBs during periods of organizational transformations, and
throughout their work careers.
Descriptive statistics provided a description of the sample population, and graphs
of relative contributions of high and low perceptions of uncertainty, stress, frustrations
and CWBs experienced. Frequency distributions were used to summarize the data, and
frequency tables depicted the data analysis. The measure of central tendency described
101
what was average or typical of the distribution of data. Multiple regression analysis
combined several predictor variables into a single regression equation. Predictor variables
(e.g., psychological uncertainty, perceived stress, and frustration) were entered into
analysis simultaneously. Age and gender were analyzed for their potential influence on
the responses. The rationale for inclusion of potential confounding variables was that
they could adversely affect the relation between the independent variables and the
dependent variable (e.g., the social environment for males and females was quite
different and age as well).
To make a determination if the observed validity coefficient is statistically
significant there are two columns in the sample table which represent the lower and upper
limits to the confidence interval (e.g., 95%). If the interval includes zero, the mean
validity coefficient is not significant (Aamodt, Surrette, & Cohen, 2007). By using
confidence intervals, findings can be communicated in a sentence (Aamodt et al., 2007).
Threats to Validity
One threat to external validity in this study included effects of selection (e.g.,
sample does not reflect the general population). This can be addressed via randomization.
Threats to external validity also included as non-representative research model; the
participants in this study would be unrepresentative of those people who need to be
understood; this precluded generalization from one to the other.
Threats to internal validity included temporal ambiguity (e.g., does the
independent variable come before the dependent variable); in this study, understanding
the variables under study was important in addressing this issue. Short-term changes and
102
their effects on participant’s behavior can change for a number of reasons. For example,
participants can go from being in a good mood to being in a bad one, or hunger, boredom,
and even inattention can have an effect. Such participant led factors can be hard to
control, reducing the internal validity of a study.
Threats to construct validity included inadequate preoperational explication of
constructs (e.g., poor construct definition). Another threat was construct confounding in
which operations usually involved more than one construct, failing to describe all the
constructs thereby resulting in incomplete construct inferences. An additional threat
mono-operation bias can lead to the underrepresentation of the construct and
measurement of irrelevant constructs.
Measures for the Ethical Protection and Security of Participants
Authorization was received from Walden University’s Institution Review Board
(IRB # 02-23-17-0091335). Data collection by SurveyMonkey.com and
FindParticipants.com adopted appropriate data collection, encryption, storage and
processing practices and security measures to protect against unauthorized access,
alteration, disclosure or destruction of your personal information, username, password,
transaction information and data stored on their site. It essentially worked through a
cryptographic system that secured a connection between a client and a server. Many
websites use this protocol to obtain confidential user information, and it is supported in
all modern browsers. The informed consent form outlined background information on the
study, and the procedures involved for participation, a review of confidentiality, the
voluntary nature of participation, and ethical concerns.
103
Data collected was stored in SurveyMonkey and FindParticipants.com initially,
and then was exported to SPSS version 21 graduate package for analysis. Data were then
stored on a disk in a secure location in compliance with Walden University’s guideline
requirements.
Anonymity. The records of this study will be kept strictly anonymous. In any
reports that may be published no information will be included that make it possible to
identify a participant. Research records are kept in a secure location, and only the
researcher (s) has access to these records for a minimum of five years.
Individuals who indicated that they agreed to the outlined conditions for
participation in the study received forms via SurveyMonkey.com and
FindParticipants.com online platform. This included an instruction sheet for completing
all attached forms as well as a designated date for completing and emailing all
information back to the researcher. A demographic questionnaire also inquired as to the
gender, age, employment status, position, tenure, and ethnicity of participant. Any
participant who was interested in receiving the results of the study could indicate so by
checking the appropriate box, and the results shared when available. Potential
participants were also informed that they were free to withdraw from this study at any
time during the process without consequence. No physical risks or benefits are associated
with participation in the study. However, there was the potential for emotional upset as
participants reflect on certain behaviors. Participants were informed that they were not
obligated to complete any part of the study in which they felt uncomfortable. Informed
consent was obtained when the researcher received a copy of the informed consent form
104
which signified that the participant agreed and understood the conditions of
the study.
Summary and Transition
A survey design was appropriate for this study because it investigated
relationships between variables. Participant’s self-report scores on the perceived
uncertainty scale, reflected the perceived level of uncertainty (Rafferty, Allanah, &
Griffin, 2006); scores on the PSS-10 reflected levels of perceived stress (Cohen &
Janicki-Devert, 2012); scores on the FS reflected perceived frustration Peters, O’Connor,
& Rudolf, 1980); and scores on the CWB-C 10 reflected levels of reported
counterproductive workplace behaviors (Spector, Bauer, & Fox, 2010).
The research that was conducted investigated employees’ perceptions of
uncertainty, perceived stress, frustration, and relationships with levels of reported
counterproductive work behavior. The results provide a better understanding of variables,
and assist in the prediction of perceptions of uncertainty, stress and frustrations’
relationship with worker’s behaviors in the United States. Additionally, the results
extended research that quantitatively examines perceptions relationship with
counterproductive work behaviors. The next chapter presents the results of this study.
105
Chapter 4: Results
Introduction
The purpose of this study was to examine whether uncertainty, stress, or
frustration are related to counterproductive work behaviors (CWBs). The research
questions that guided this study stem from the review of existing literature on workplace
psychological uncertainty, perceived stress, frustration and CWBs. The research
questions and hypotheses asked whether there is a correlation between the independent
variables (IVs) psychological uncertainty, perceived stress, and frustration, with the
dependent variable (DV) CWBs?
Research Question 1: Does perceived employee uncertainty, stress, and/or frustration
predict CWBs during periods of organizational transformations, and throughout their
work careers?
Ho1: Perceived employee uncertainty, stress, and/or frustration does not
predict their CWBs during periods of organizational transformations, and
throughout their work careers.
Hα1: Perceived employee uncertainty, stress, and/or frustration predicts their
CWBs during periods of organizational transformations, and throughout their work
careers.
Research Question 2: Are perceived employee uncertainty, stress, and/or
frustration scores useful in explaining variability in CWBs during periods of
organizational transformations, and throughout their work careers?
Ho2: Perceived employee uncertainty, stress, and/or frustration scores are not
106
useful in explaining variability in CWBs during periods of organizational
transformations, and throughout their work careers.
Hα2: Perceived employee uncertainty, stress, and/or frustration scores are useful
in explaining variability in CWBs during periods of organizational transformations, and
throughout their work careers.
In this chapter, the treatment of data, time frame for data collection, as well as
actual recruitment, and response rates were described. The treatment of data is described
after they were downloaded from SurveyMonkey (the collection site), to include the data
screening, instrument reliabilities, the demographic characteristics of the sample, and the
results of statistical analyses.
Data Collection
Data were collected over a period of 4 months from a pool of automotive
employees working in various departments and organizations across the United States.
After concluding the data-collection procedures, data were downloaded from
SurveyMonkey into Excel files. Extra lengths were taken to get participation. The process
included listing the criteria for participation in the recruitment stage, sending out
invitations which outlined the survey, as well as providing the link for the survey. The
true demographics of this population are unknown, it is impractical, in terms of time,
finances and effort to collect data on every person in the target population. Additionally,
two internet collection sites were utilized to recruit volunteers, and the participants out of
the population who met the requirements did not exceed 300. Participants/volunteers who
took the time to take this survey have a voice that should be heard. Though the results
107
may not be generalizable, they should indicate some potential problems and areas that
need further study. Participants were recruited from a pool of automotive workers in the
United States; however, due to the limited number of participants in this industry area,
surveys were distributed to approximately 300 volunteers who met the criteria.
FindParticipants.com recruited volunteers and SurveyMonkey hosted the data collection.
Workers were recruited via an invitation by Findparticipants.com. Invitations included
the researcher’s conditions of participation.
Because this study included sample data rather than population census data, it is a
statistical error to which the model was exposed. This study’s sample size could give
meaningful results. For example, surveying people working in the automobile industry
who are affected negatively by their work environment, provided data which can be used
to design larger confirmatory studies. Of the 300 invitations, 180 returned the survey.
Five of the 180 participants did not answer all questions; only one response was missing
for each and so were still included thus yielding 60% return rate (Fryrear, 2015). All
information pertaining to the survey was accessible to participants online. As an
introduction to the survey, the informed consent explained the study; additionally,
anonymity regarding participation was included. Risks and benefits to participate were
outlined, and contact information was provided.
Data were exported from SurveyMonkey into Excel files and then uploaded into
the Statistical Package for the Social Sciences (SPSS) for statistical analyses. The
responses downloaded from SurveyMonkey to Excel were answers to the psychological
uncertainty scale, the perceived stress scale (PSS), the frustration scale, the
108
counterproductive work behavior checklist (CWB-C), and responses to the demographic
questionnaire. The Excel file was then imported into SPSS. SurveyMonkey assigned a
unique identifier to each respondent. Anonymity was retained at each point, as names
were not gathered. When the file was downloaded into Excel and cleaned, the unique
identifiers were no longer needed. The file downloaded into SPSS contained no
identifiers as none were necessary for the current analysis.
Data were then screened for missing responses to individual items on the
psychological uncertainty scale, the perceived stress scale, the frustration scale, and the
counterproductive work behavior checklist. Only five of the 180 participants did not
answer all questions. Each of the five participants with missing data were only missing
one response, and so were still included in the analysis. No patterns to the missing data
existed. The missing responses were each to a different question. Missing responses to
the five items were replaced with the item mean for those who did respond on the
respective scales (Little & Rubin, 1987).
Scales
The next step included the scoring of the psychological uncertainty scale, the
perceived stress scale, the frustration scale, and the counterproductive work behavior
checklist. Items included in the scales were summed. Any reverse items that were stated
in a positive manner (such that a higher score meant less frustration or less perceived
stress) were reversed scored to be consistent with all other scales and scale items. In all
cases, after reverse scoring, a higher scale value meant a greater level of psychological
uncertainty, more perceived stress, greater frustration, and more CWB.
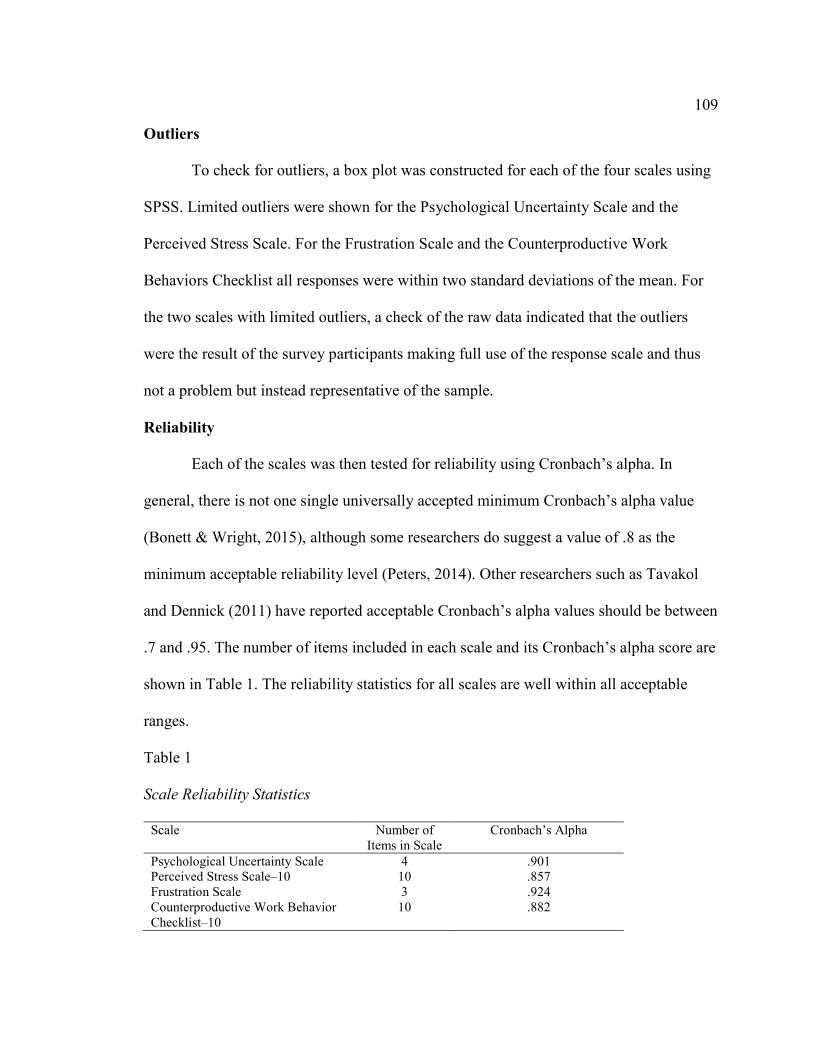
109
Outliers
To check for outliers, a box plot was constructed for each of the four scales using
SPSS. Limited outliers were shown for the Psychological Uncertainty Scale and the
Perceived Stress Scale. For the Frustration Scale and the Counterproductive Work
Behaviors Checklist all responses were within two standard deviations of the mean. For
the two scales with limited outliers, a check of the raw data indicated that the outliers
were the result of the survey participants making full use of the response scale and thus
not a problem but instead representative of the sample.
Reliability
Each of the scales was then tested for reliability using Cronbach’s alpha. In
general, there is not one single universally accepted minimum Cronbach’s alpha value
(Bonett & Wright, 2015), although some researchers do suggest a value of .8 as the
minimum acceptable reliability level (Peters, 2014). Other researchers such as Tavakol
and Dennick (2011) have reported acceptable Cronbach’s alpha values should be between
.7 and .95. The number of items included in each scale and its Cronbach’s alpha score are
shown in Table 1. The reliability statistics for all scales are well within all acceptable
ranges.
Table 1
Scale Reliability Statistics
Scale Number of
Items in Scale Cronbach’s Alpha
Psychological Uncertainty Scale 4 .901 Perceived Stress Scale–10 10 .857 Frustration Scale 3 .924 Counterproductive Work Behavior Checklist–10
10 .882
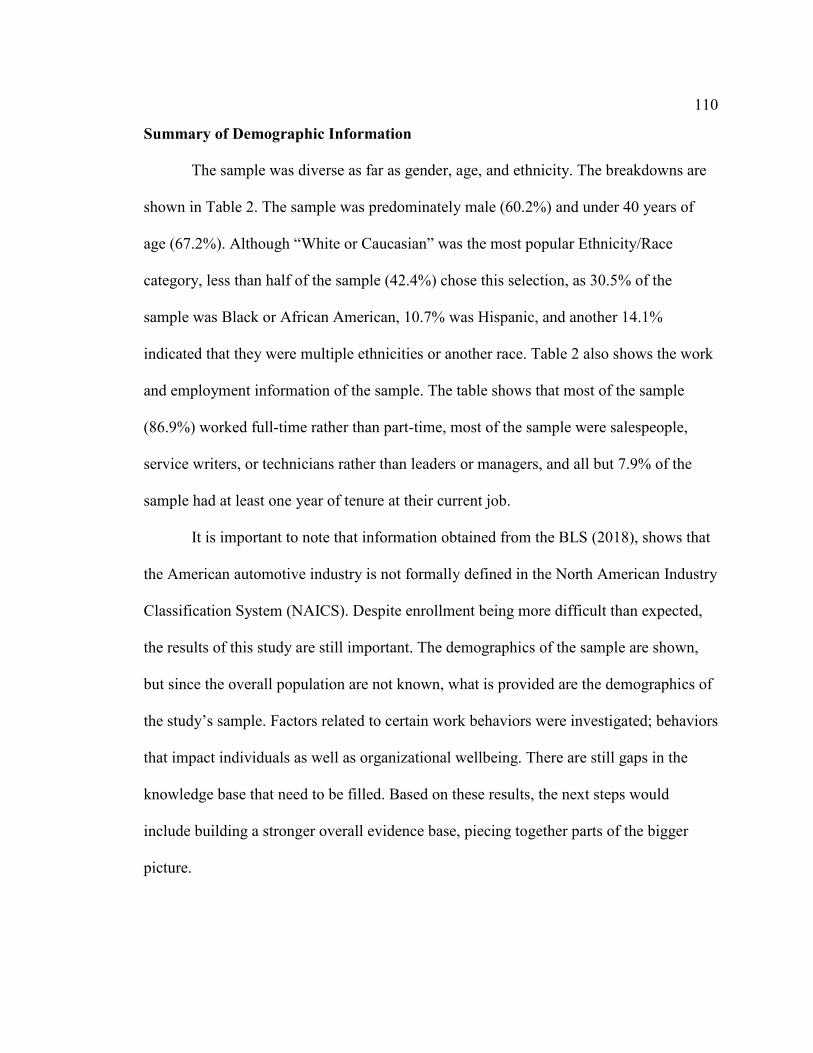
110
Summary of Demographic Information
The sample was diverse as far as gender, age, and ethnicity. The breakdowns are
shown in Table 2. The sample was predominately male (60.2%) and under 40 years of
age (67.2%). Although “White or Caucasian” was the most popular Ethnicity/Race
category, less than half of the sample (42.4%) chose this selection, as 30.5% of the
sample was Black or African American, 10.7% was Hispanic, and another 14.1%
indicated that they were multiple ethnicities or another race. Table 2 also shows the work
and employment information of the sample. The table shows that most of the sample
(86.9%) worked full-time rather than part-time, most of the sample were salespeople,
service writers, or technicians rather than leaders or managers, and all but 7.9% of the
sample had at least one year of tenure at their current job.
It is important to note that information obtained from the BLS (2018), shows that
the American automotive industry is not formally defined in the North American Industry
Classification System (NAICS). Despite enrollment being more difficult than expected,
the results of this study are still important. The demographics of the sample are shown,
but since the overall population are not known, what is provided are the demographics of
the study’s sample. Factors related to certain work behaviors were investigated; behaviors
that impact individuals as well as organizational wellbeing. There are still gaps in the
knowledge base that need to be filled. Based on these results, the next steps would
include building a stronger overall evidence base, piecing together parts of the bigger
picture.
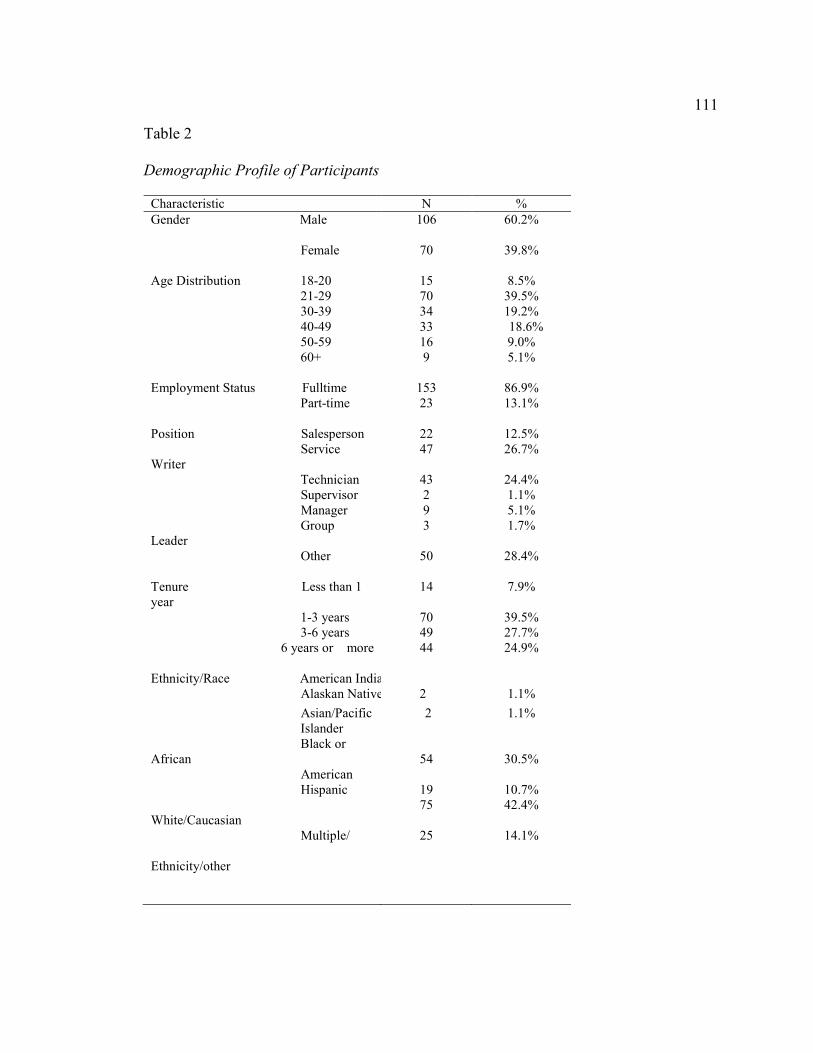
111
Table 2
Demographic Profile of Participants
Characteristic N % Gender Male 106 60.2% Female 70 39.8%
Age Distribution 18-20 15 8.5% 21-29 70 39.5% 30-39 34 19.2% 40-49 33 18.6% 50-59 16 9.0% 60+ 9 5.1% Employment Status Fulltime 153 86.9% Part-time 23 13.1% Position Salesperson 22 12.5% Service Writer
47 26.7%
Technician 43 24.4% Supervisor 2 1.1% Manager 9 5.1% Group Leader
3 1.7%
Other 50 28.4% Tenure Less than 1 year
14 7.9%
1-3 years 70 39.5% 3-6 years 49 27.7%
6 years or more 44 24.9% Ethnicity/Race American Indian/ Alaskan Native
2
1.1%
Asian/Pacific 2 1.1% Islander Black or African American
54
30.5%
Hispanic 19 10.7% White/Caucasian
75 42.4%
Multiple/ 25 14.1% Ethnicity/other
112
Threats to External Validity
The target population included the automotive industry, retail, as well as
manufacturing. The retail sector included not only sales representatives, but other
departments within that sector (e.g., dealerships, used and new cars, managers,
supervisors, group leaders, auto repair technicians, service writers, oil changers, office
personnel, etc.). Manufacturing workers were from all areas as well (e.g., floor assembly,
managers, supervisors, office, etc.). FindParticipants.com facilitated the invitation to
participants and included participants employed in the automotive industry in the United
States, (in all areas of the industry, sales, factory, etc.). Potential participants were a
minimum of 18 years of age and employed full or part-time. Invitations were sent to all
volunteers who matched the criteria. Surveys were hosted by SurveyMonkey.com a web-
based survey provider.
A total of 300 individuals employed in some facet of the automobile industry
volunteered to participate in the survey. Workers in this industry were considered the
target population for the study, even though the actual number of workers in the
automobile industry is much higher. Individuals who work in this industry and who
volunteered for this study, have a voice that should be heard; particularly when they are
having negative experiences in the workplace that need to be addressed.
According to the Bureau of Labor Statistics (BLS), the current employment
statistics survey data extracted on February 26, 2018, reflected that employment, hours,
and earnings for U.S. workers in the motor vehicles and parts industry was 959.0 in
December 2017, and 953.9 in January 2018. Each month current employment statistics
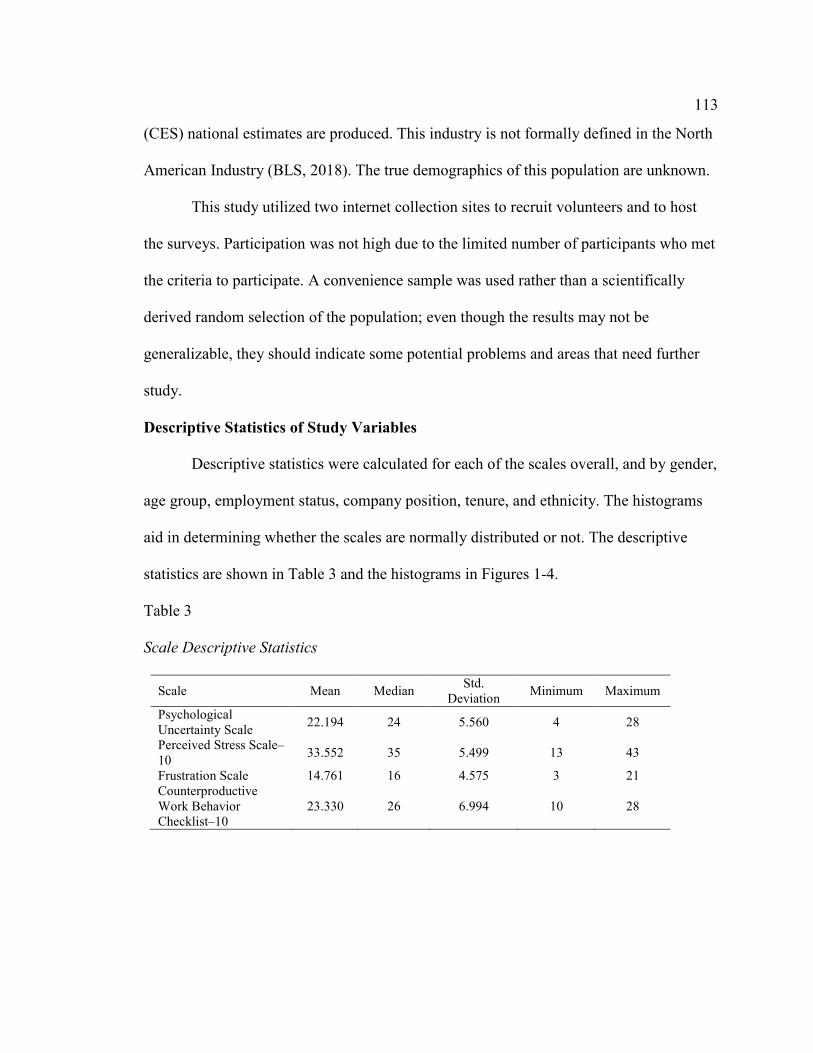
113
(CES) national estimates are produced. This industry is not formally defined in the North
American Industry (BLS, 2018). The true demographics of this population are unknown.
This study utilized two internet collection sites to recruit volunteers and to host
the surveys. Participation was not high due to the limited number of participants who met
the criteria to participate. A convenience sample was used rather than a scientifically
derived random selection of the population; even though the results may not be
generalizable, they should indicate some potential problems and areas that need further
study.
Descriptive Statistics of Study Variables
Descriptive statistics were calculated for each of the scales overall, and by gender,
age group, employment status, company position, tenure, and ethnicity. The histograms
aid in determining whether the scales are normally distributed or not. The descriptive
statistics are shown in Table 3 and the histograms in Figures 1-4.
Table 3 Scale Descriptive Statistics
Scale Mean Median Std.
Deviation Minimum Maximum
Psychological Uncertainty Scale
22.194 24 5.560 4 28
Perceived Stress Scale–10
33.552 35 5.499 13 43
Frustration Scale 14.761 16 4.575 3 21 Counterproductive Work Behavior Checklist–10
23.330 26 6.994 10 28
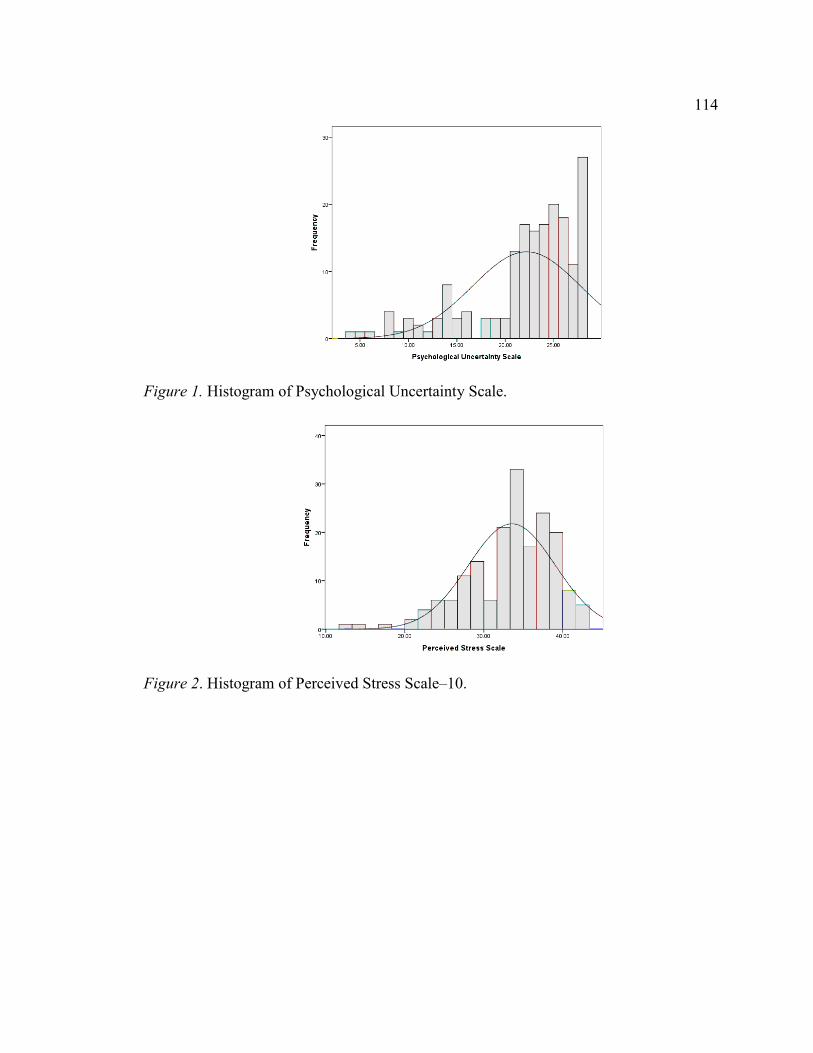
114
Figure 1. Histogram of Psychological Uncertainty Scale.
Figure 2. Histogram of Perceived Stress Scale–10.
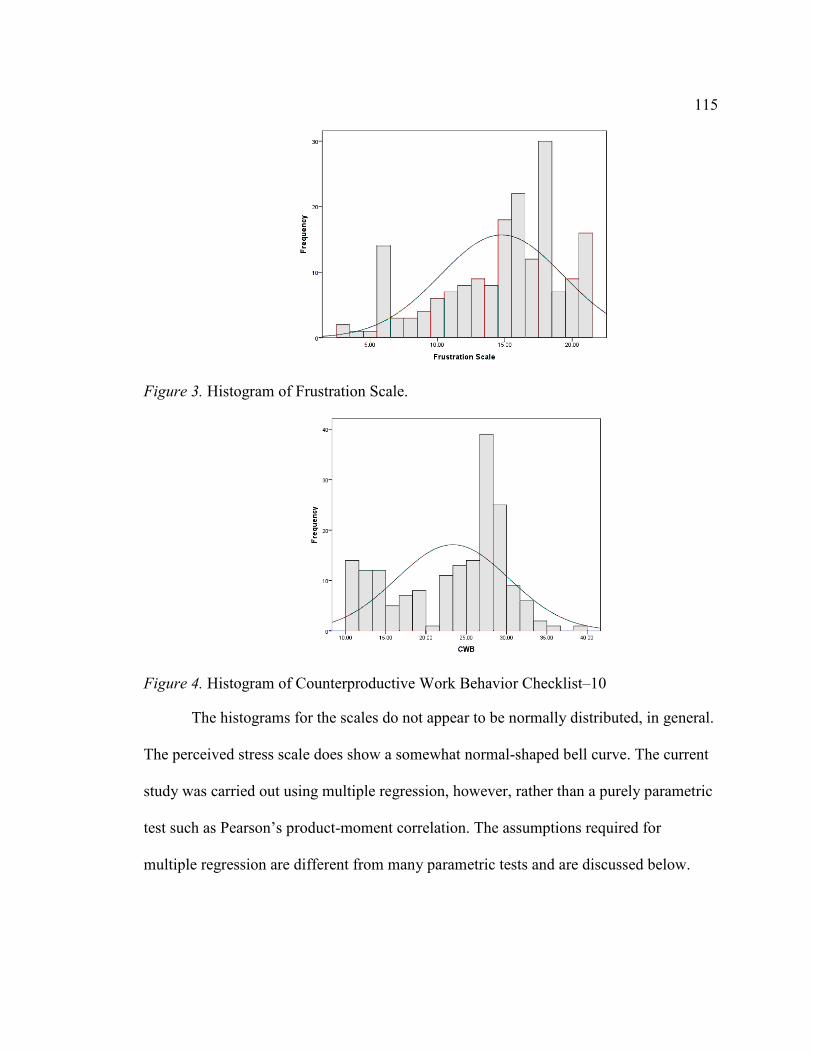
115
Figure 3. Histogram of Frustration Scale.
Figure 4. Histogram of Counterproductive Work Behavior Checklist–10
The histograms for the scales do not appear to be normally distributed, in general.
The perceived stress scale does show a somewhat normal-shaped bell curve. The current
study was carried out using multiple regression, however, rather than a purely parametric
test such as Pearson’s product-moment correlation. The assumptions required for
multiple regression are different from many parametric tests and are discussed below.
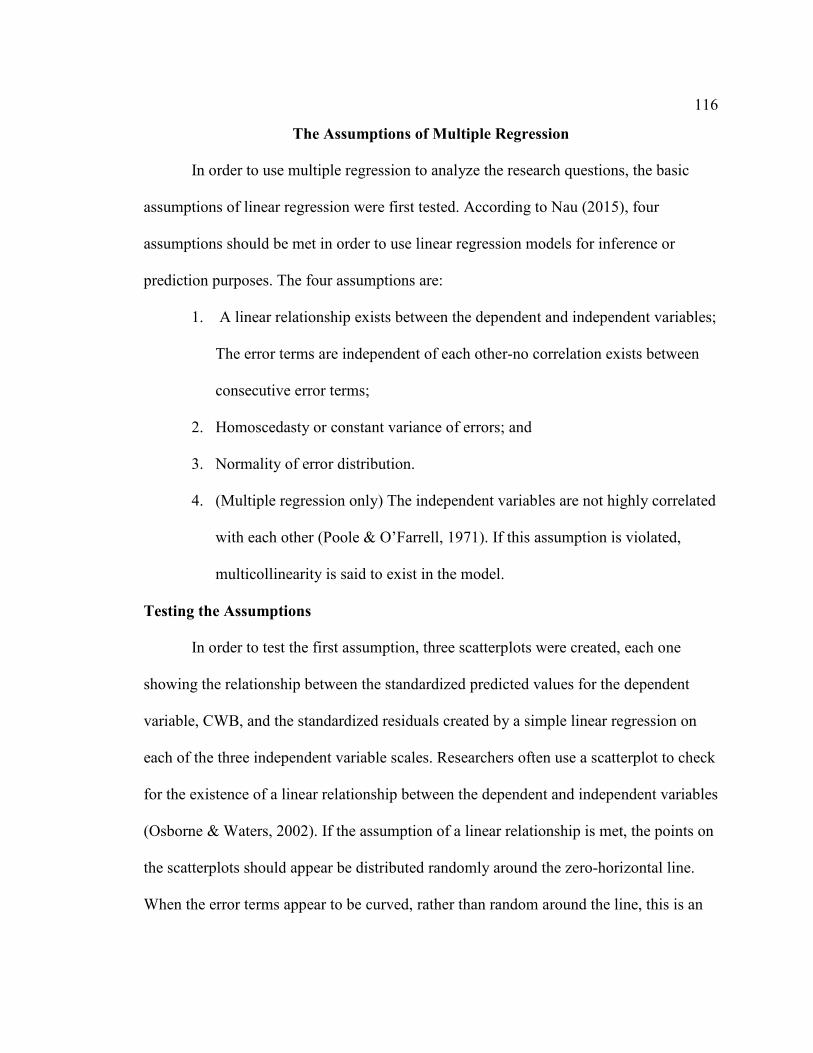
116
The Assumptions of Multiple Regression
In order to use multiple regression to analyze the research questions, the basic
assumptions of linear regression were first tested. According to Nau (2015), four
assumptions should be met in order to use linear regression models for inference or
prediction purposes. The four assumptions are:
1. A linear relationship exists between the dependent and independent variables;
The error terms are independent of each other-no correlation exists between
consecutive error terms;
2. Homoscedasty or constant variance of errors; and
3. Normality of error distribution.
4. (Multiple regression only) The independent variables are not highly correlated
with each other (Poole & O’Farrell, 1971). If this assumption is violated,
multicollinearity is said to exist in the model.
Testing the Assumptions
In order to test the first assumption, three scatterplots were created, each one
showing the relationship between the standardized predicted values for the dependent
variable, CWB, and the standardized residuals created by a simple linear regression on
each of the three independent variable scales. Researchers often use a scatterplot to check
for the existence of a linear relationship between the dependent and independent variables
(Osborne & Waters, 2002). If the assumption of a linear relationship is met, the points on
the scatterplots should appear be distributed randomly around the zero-horizontal line.
When the error terms appear to be curved, rather than random around the line, this is an
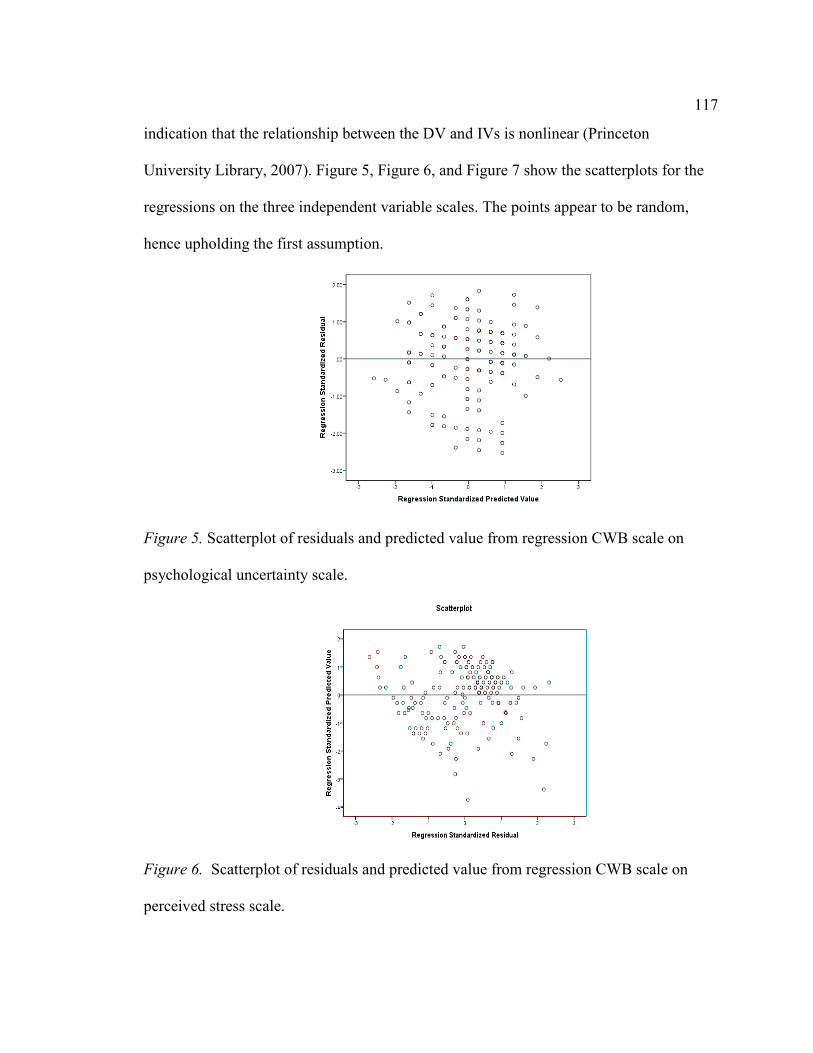
117
indication that the relationship between the DV and IVs is nonlinear (Princeton
University Library, 2007). Figure 5, Figure 6, and Figure 7 show the scatterplots for the
regressions on the three independent variable scales. The points appear to be random,
hence upholding the first assumption.
Figure 5. Scatterplot of residuals and predicted value from regression CWB scale on
psychological uncertainty scale.
Figure 6. Scatterplot of residuals and predicted value from regression CWB scale on
perceived stress scale.
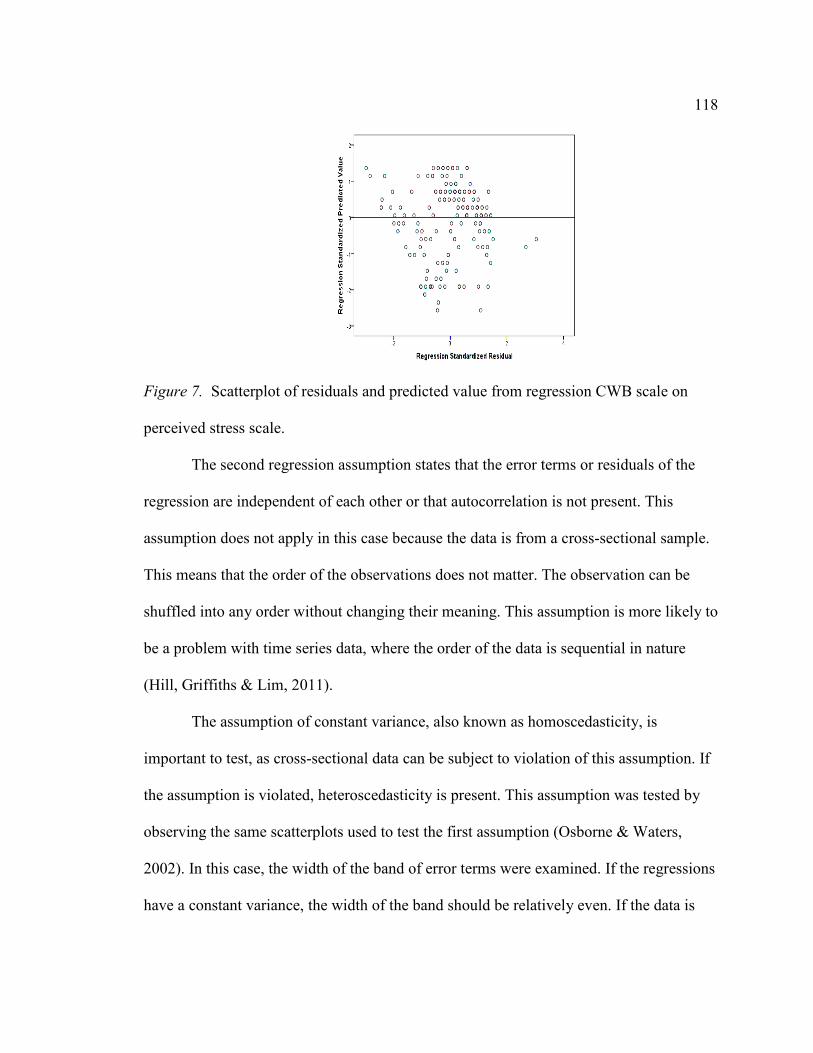
118
Figure 7. Scatterplot of residuals and predicted value from regression CWB scale on
perceived stress scale.
The second regression assumption states that the error terms or residuals of the
regression are independent of each other or that autocorrelation is not present. This
assumption does not apply in this case because the data is from a cross-sectional sample.
This means that the order of the observations does not matter. The observation can be
shuffled into any order without changing their meaning. This assumption is more likely to
be a problem with time series data, where the order of the data is sequential in nature
(Hill, Griffiths & Lim, 2011).
The assumption of constant variance, also known as homoscedasticity, is
important to test, as cross-sectional data can be subject to violation of this assumption. If
the assumption is violated, heteroscedasticity is present. This assumption was tested by
observing the same scatterplots used to test the first assumption (Osborne & Waters,
2002). In this case, the width of the band of error terms were examined. If the regressions
have a constant variance, the width of the band should be relatively even. If the data is
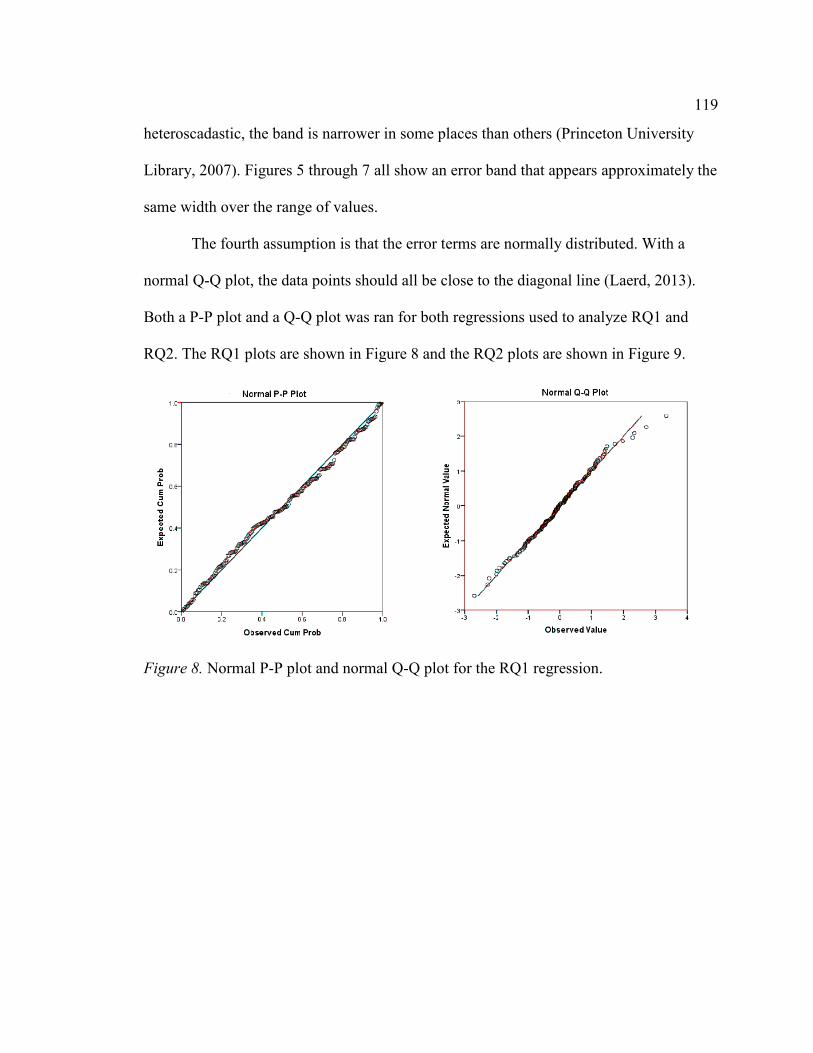
119
heteroscadastic, the band is narrower in some places than others (Princeton University
Library, 2007). Figures 5 through 7 all show an error band that appears approximately the
same width over the range of values.
The fourth assumption is that the error terms are normally distributed. With a
normal Q-Q plot, the data points should all be close to the diagonal line (Laerd, 2013).
Both a P-P plot and a Q-Q plot was ran for both regressions used to analyze RQ1 and
RQ2. The RQ1 plots are shown in Figure 8 and the RQ2 plots are shown in Figure 9.
Figure 8. Normal P-P plot and normal Q-Q plot for the RQ1 regression.
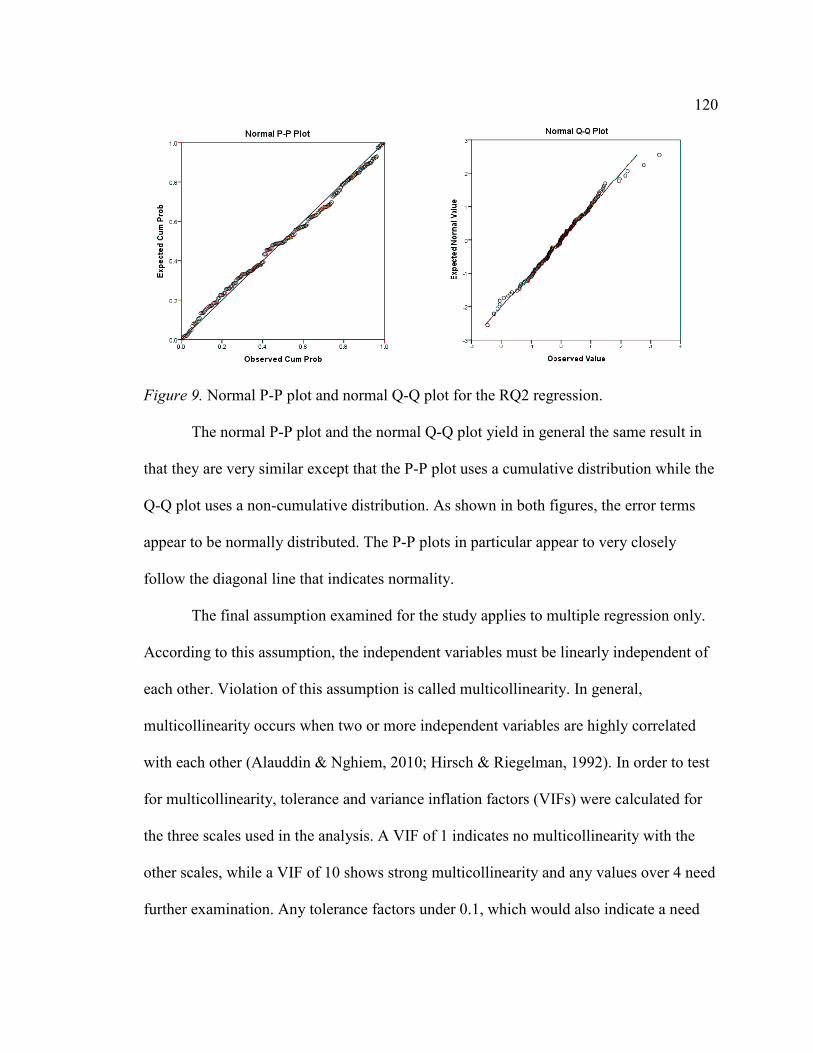
120
Figure 9. Normal P-P plot and normal Q-Q plot for the RQ2 regression.
The normal P-P plot and the normal Q-Q plot yield in general the same result in
that they are very similar except that the P-P plot uses a cumulative distribution while the
Q-Q plot uses a non-cumulative distribution. As shown in both figures, the error terms
appear to be normally distributed. The P-P plots in particular appear to very closely
follow the diagonal line that indicates normality.
The final assumption examined for the study applies to multiple regression only.
According to this assumption, the independent variables must be linearly independent of
each other. Violation of this assumption is called multicollinearity. In general,
multicollinearity occurs when two or more independent variables are highly correlated
with each other (Alauddin & Nghiem, 2010; Hirsch & Riegelman, 1992). In order to test
for multicollinearity, tolerance and variance inflation factors (VIFs) were calculated for
the three scales used in the analysis. A VIF of 1 indicates no multicollinearity with the
other scales, while a VIF of 10 shows strong multicollinearity and any values over 4 need
further examination. Any tolerance factors under 0.1, which would also indicate a need
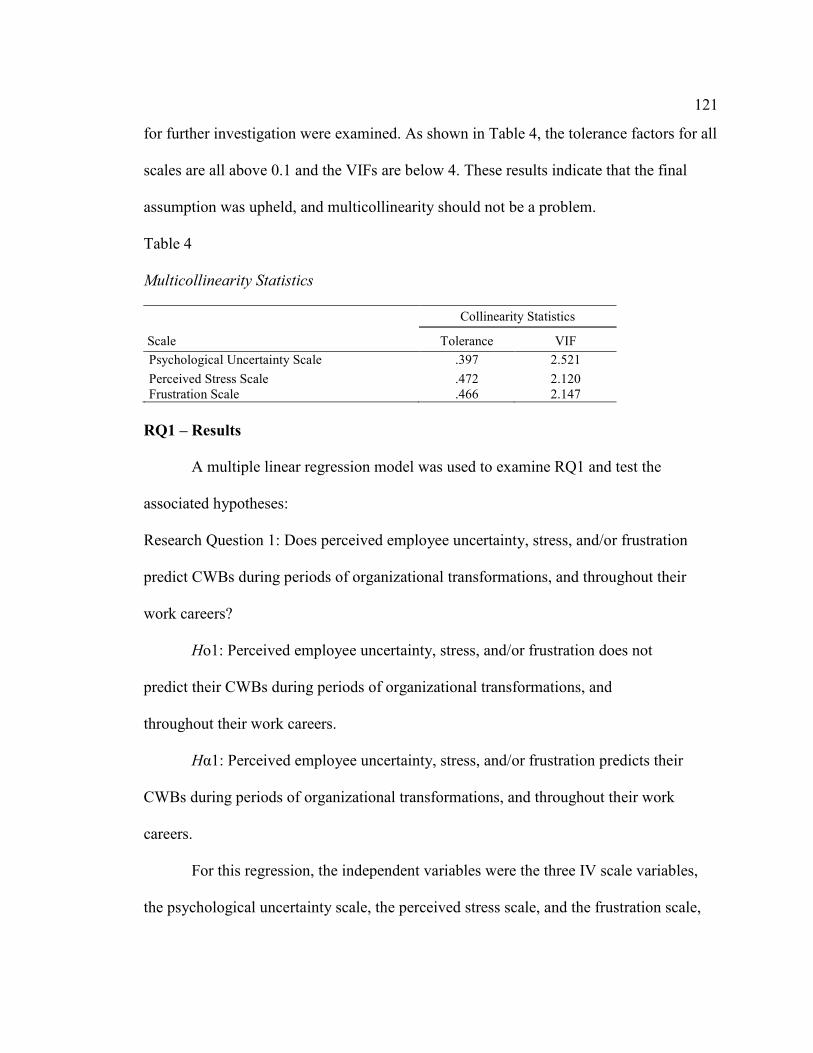
121
for further investigation were examined. As shown in Table 4, the tolerance factors for all
scales are all above 0.1 and the VIFs are below 4. These results indicate that the final
assumption was upheld, and multicollinearity should not be a problem.
Table 4 Multicollinearity Statistics
Scale
Collinearity Statistics
Tolerance VIF
Psychological Uncertainty Scale .397 2.521
Perceived Stress Scale .472 2.120 Frustration Scale .466 2.147
RQ1 – Results
A multiple linear regression model was used to examine RQ1 and test the
associated hypotheses:
Research Question 1: Does perceived employee uncertainty, stress, and/or frustration
predict CWBs during periods of organizational transformations, and throughout their
work careers?
Ho1: Perceived employee uncertainty, stress, and/or frustration does not
predict their CWBs during periods of organizational transformations, and
throughout their work careers.
Hα1: Perceived employee uncertainty, stress, and/or frustration predicts their
CWBs during periods of organizational transformations, and throughout their work
careers.
For this regression, the independent variables were the three IV scale variables,
the psychological uncertainty scale, the perceived stress scale, and the frustration scale,
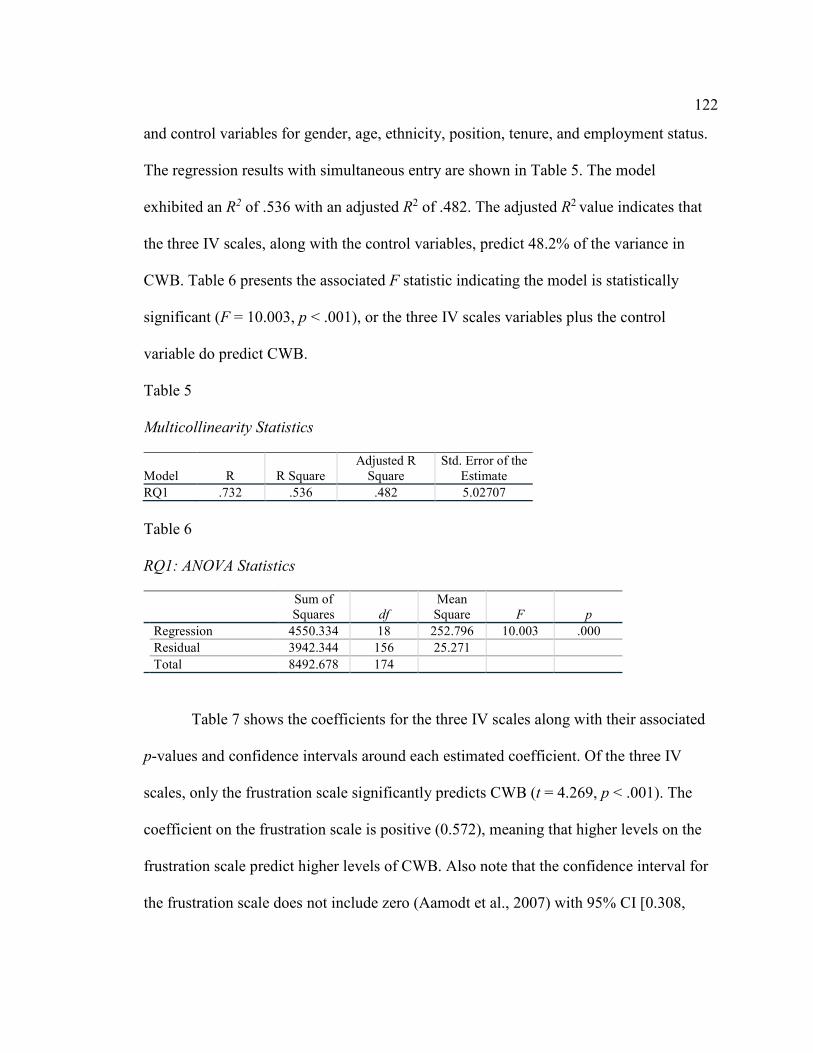
122
and control variables for gender, age, ethnicity, position, tenure, and employment status.
The regression results with simultaneous entry are shown in Table 5. The model
exhibited an R2 of .536 with an adjusted R2 of .482. The adjusted R2 value indicates that
the three IV scales, along with the control variables, predict 48.2% of the variance in
CWB. Table 6 presents the associated F statistic indicating the model is statistically
significant (F = 10.003, p < .001), or the three IV scales variables plus the control
variable do predict CWB.
Table 5 Multicollinearity Statistics
Model R R Square Adjusted R
Square Std. Error of the
Estimate RQ1 .732 .536 .482 5.02707
Table 6 RQ1: ANOVA Statistics
Sum of Squares df
Mean Square F p
Regression 4550.334 18 252.796 10.003 .000 Residual 3942.344 156 25.271 Total 8492.678 174
Table 7 shows the coefficients for the three IV scales along with their associated
p-values and confidence intervals around each estimated coefficient. Of the three IV
scales, only the frustration scale significantly predicts CWB (t = 4.269, p < .001). The
coefficient on the frustration scale is positive (0.572), meaning that higher levels on the
frustration scale predict higher levels of CWB. Also note that the confidence interval for
the frustration scale does not include zero (Aamodt et al., 2007) with 95% CI [0.308,
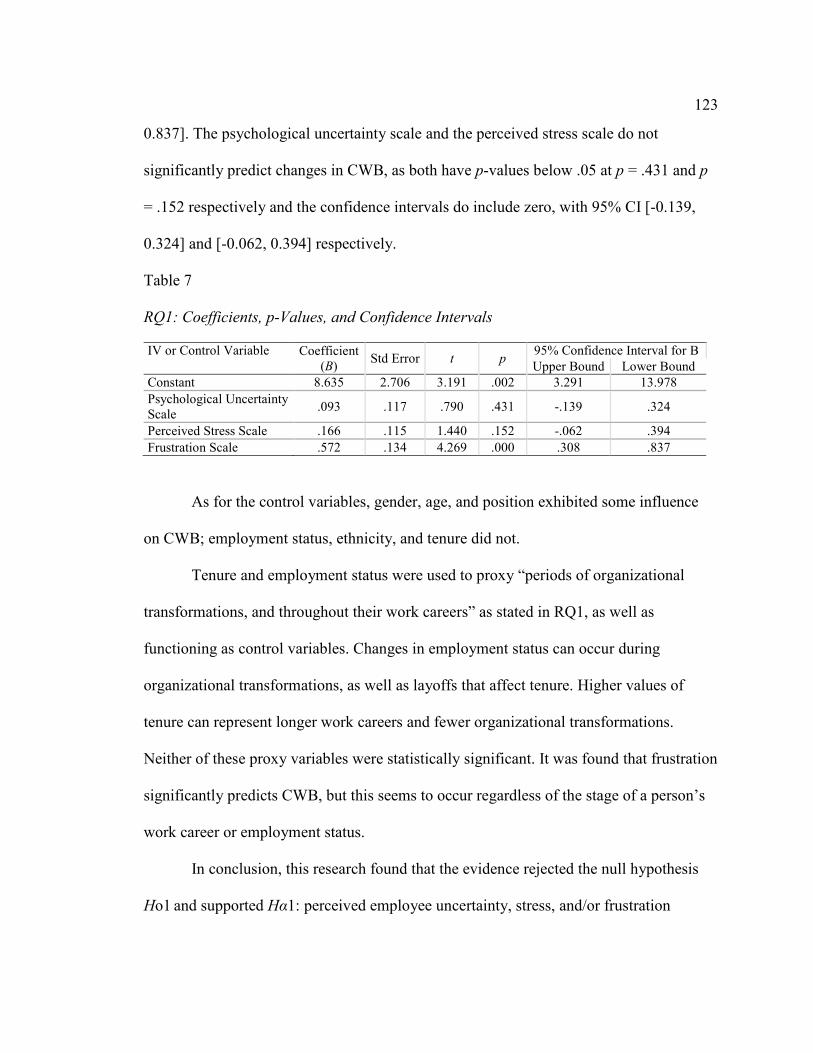
123
0.837]. The psychological uncertainty scale and the perceived stress scale do not
significantly predict changes in CWB, as both have p-values below .05 at p = .431 and p
= .152 respectively and the confidence intervals do include zero, with 95% CI [-0.139,
0.324] and [-0.062, 0.394] respectively.
Table 7 RQ1: Coefficients, p-Values, and Confidence Intervals
IV or Control Variable Coefficient (B)
Std Error t p 95% Confidence Interval for B Upper Bound Lower Bound
Constant 8.635 2.706 3.191 .002 3.291 13.978 Psychological Uncertainty Scale
.093 .117 .790 .431 -.139 .324
Perceived Stress Scale .166 .115 1.440 .152 -.062 .394 Frustration Scale .572 .134 4.269 .000 .308 .837
As for the control variables, gender, age, and position exhibited some influence
on CWB; employment status, ethnicity, and tenure did not.
Tenure and employment status were used to proxy “periods of organizational
transformations, and throughout their work careers” as stated in RQ1, as well as
functioning as control variables. Changes in employment status can occur during
organizational transformations, as well as layoffs that affect tenure. Higher values of
tenure can represent longer work careers and fewer organizational transformations.
Neither of these proxy variables were statistically significant. It was found that frustration
significantly predicts CWB, but this seems to occur regardless of the stage of a person’s
work career or employment status.
In conclusion, this research found that the evidence rejected the null hypothesis
Ho1 and supported Hα1: perceived employee uncertainty, stress, and/or frustration
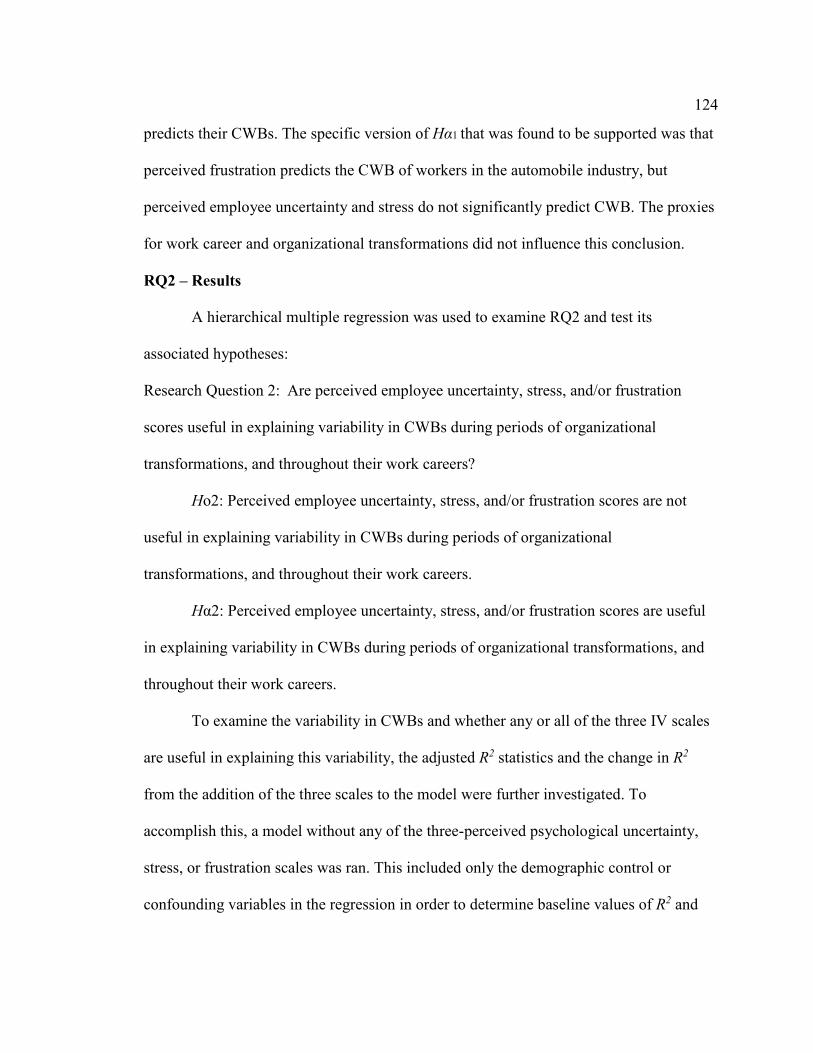
124
predicts their CWBs. The specific version of Hα1 that was found to be supported was that
perceived frustration predicts the CWB of workers in the automobile industry, but
perceived employee uncertainty and stress do not significantly predict CWB. The proxies
for work career and organizational transformations did not influence this conclusion.
RQ2 – Results
A hierarchical multiple regression was used to examine RQ2 and test its
associated hypotheses:
Research Question 2: Are perceived employee uncertainty, stress, and/or frustration
scores useful in explaining variability in CWBs during periods of organizational
transformations, and throughout their work careers?
Ho2: Perceived employee uncertainty, stress, and/or frustration scores are not
useful in explaining variability in CWBs during periods of organizational
transformations, and throughout their work careers.
Hα2: Perceived employee uncertainty, stress, and/or frustration scores are useful
in explaining variability in CWBs during periods of organizational transformations, and
throughout their work careers.
To examine the variability in CWBs and whether any or all of the three IV scales
are useful in explaining this variability, the adjusted R2 statistics and the change in R2
from the addition of the three scales to the model were further investigated. To
accomplish this, a model without any of the three-perceived psychological uncertainty,
stress, or frustration scales was ran. This included only the demographic control or
confounding variables in the regression in order to determine baseline values of R2 and
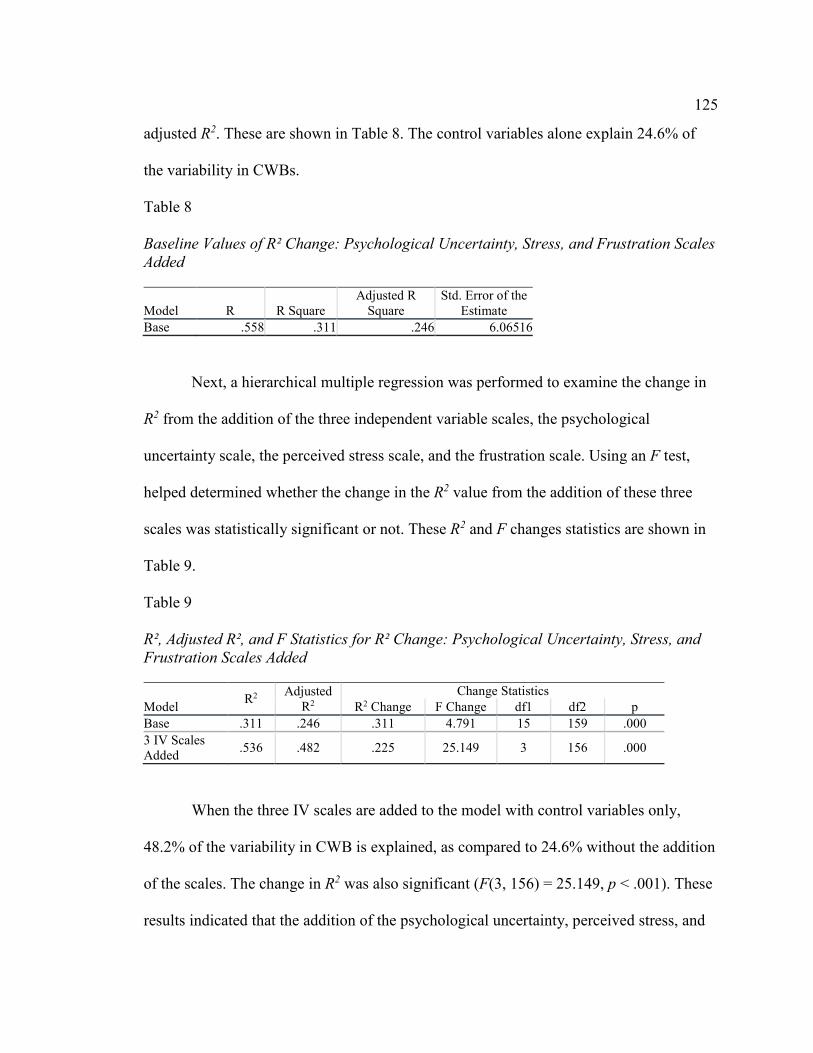
125
adjusted R2. These are shown in Table 8. The control variables alone explain 24.6% of
the variability in CWBs.
Table 8 Baseline Values of R² Change: Psychological Uncertainty, Stress, and Frustration Scales
Added
Model R R Square Adjusted R
Square Std. Error of the
Estimate Base .558 .311 .246 6.06516
Next, a hierarchical multiple regression was performed to examine the change in
R2 from the addition of the three independent variable scales, the psychological
uncertainty scale, the perceived stress scale, and the frustration scale. Using an F test,
helped determined whether the change in the R2 value from the addition of these three
scales was statistically significant or not. These R2 and F changes statistics are shown in
Table 9.
Table 9 R², Adjusted R², and F Statistics for R² Change: Psychological Uncertainty, Stress, and
Frustration Scales Added
Model R2
Adjusted R2
Change Statistics R2 Change F Change df1 df2 p
Base .311 .246 .311 4.791 15 159 .000 3 IV Scales Added
.536 .482 .225 25.149 3 156 .000
When the three IV scales are added to the model with control variables only,
48.2% of the variability in CWB is explained, as compared to 24.6% without the addition
of the scales. The change in R2 was also significant (F(3, 156) = 25.149, p < .001). These
results indicated that the addition of the psychological uncertainty, perceived stress, and
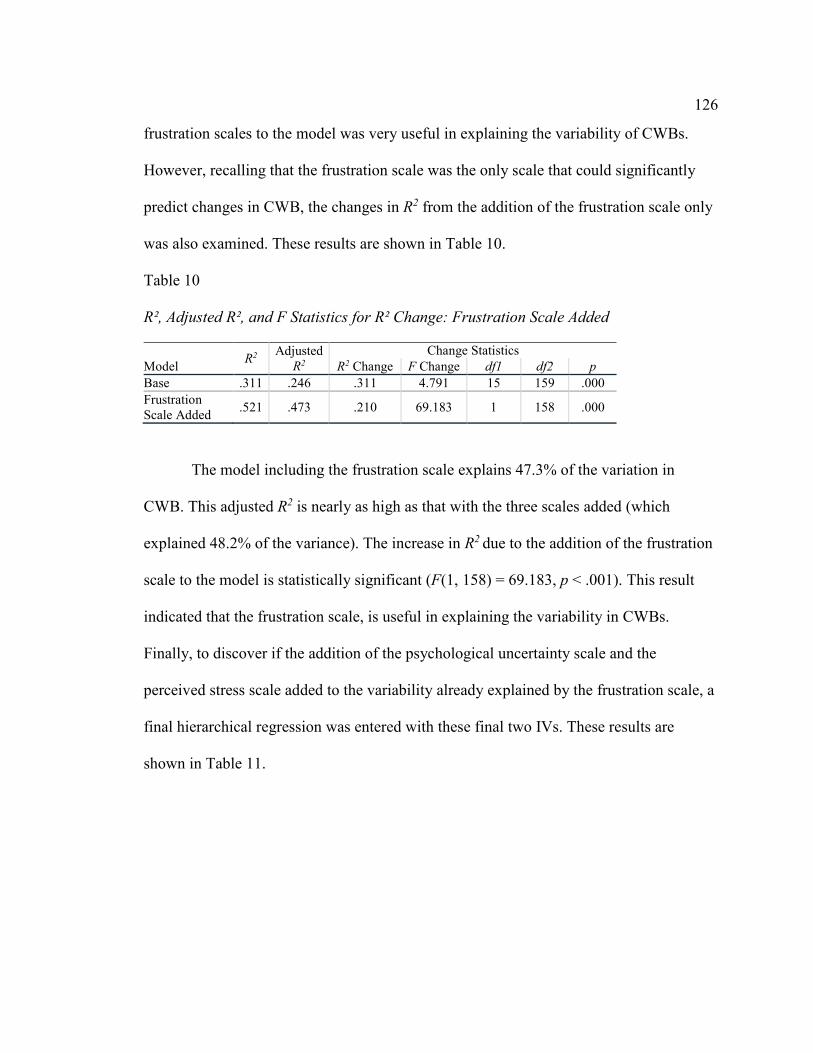
126
frustration scales to the model was very useful in explaining the variability of CWBs.
However, recalling that the frustration scale was the only scale that could significantly
predict changes in CWB, the changes in R2 from the addition of the frustration scale only
was also examined. These results are shown in Table 10.
Table 10 R², Adjusted R², and F Statistics for R² Change: Frustration Scale Added
Model R2
Adjusted R2
Change Statistics R2 Change F Change df1 df2 p
Base .311 .246 .311 4.791 15 159 .000 Frustration Scale Added
.521 .473 .210 69.183 1 158 .000
The model including the frustration scale explains 47.3% of the variation in
CWB. This adjusted R2 is nearly as high as that with the three scales added (which
explained 48.2% of the variance). The increase in R2 due to the addition of the frustration
scale to the model is statistically significant (F(1, 158) = 69.183, p < .001). This result
indicated that the frustration scale, is useful in explaining the variability in CWBs.
Finally, to discover if the addition of the psychological uncertainty scale and the
perceived stress scale added to the variability already explained by the frustration scale, a
final hierarchical regression was entered with these final two IVs. These results are
shown in Table 11.
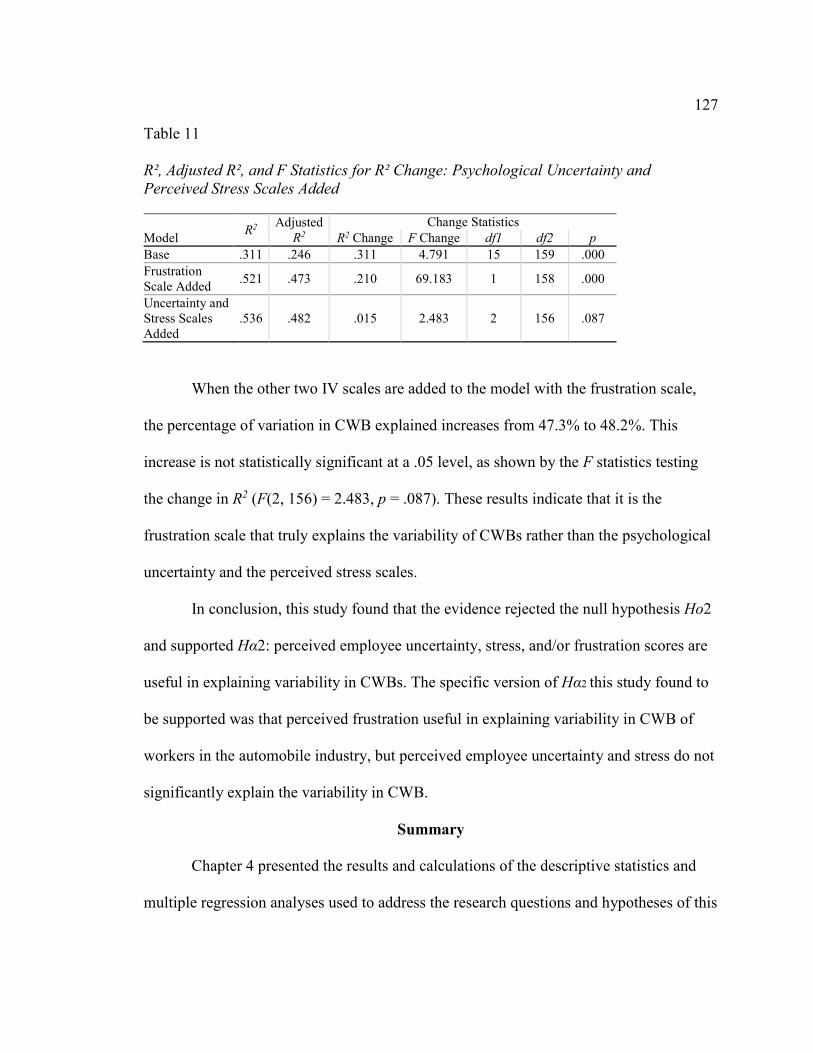
127
Table 11 R², Adjusted R², and F Statistics for R² Change: Psychological Uncertainty and
Perceived Stress Scales Added
Model R2
Adjusted R2
Change Statistics R2 Change F Change df1 df2 p
Base .311 .246 .311 4.791 15 159 .000 Frustration Scale Added
.521 .473 .210 69.183 1 158 .000
Uncertainty and Stress Scales Added
.536 .482 .015 2.483 2 156 .087
When the other two IV scales are added to the model with the frustration scale,
the percentage of variation in CWB explained increases from 47.3% to 48.2%. This
increase is not statistically significant at a .05 level, as shown by the F statistics testing
the change in R2 (F(2, 156) = 2.483, p = .087). These results indicate that it is the
frustration scale that truly explains the variability of CWBs rather than the psychological
uncertainty and the perceived stress scales.
In conclusion, this study found that the evidence rejected the null hypothesis Ho2
and supported Hα2: perceived employee uncertainty, stress, and/or frustration scores are
useful in explaining variability in CWBs. The specific version of Hα2 this study found to
be supported was that perceived frustration useful in explaining variability in CWB of
workers in the automobile industry, but perceived employee uncertainty and stress do not
significantly explain the variability in CWB.
Summary
Chapter 4 presented the results and calculations of the descriptive statistics and
multiple regression analyses used to address the research questions and hypotheses of this
128
study. In order to test RQ1, multiple linear regression analysis was performed. Although
the results of the multiple regression analysis showed that the psychological uncertainty
scale and the perceived stress scale were not statistically significant predictors of CWB,
the frustration scale was a significant predictor. To test RQ2, a hierarchical multiple
regression analysis was performed. Results of this analysis found perceived frustration
useful in explaining variability in CWBs of workers in the automobile industry, but
perceived employee uncertainty and stress did not significantly explain variability in
CWBs. In summary, evidence supported both Hα1 and Hα2. Thus, the null hypotheses
were rejected, and the alternative hypotheses were supported for both the prediction of
CWBs and variability in CWBs questions. Chapter 5 concludes this study, and contains
the interpretations of the findings, the limitations of study, recommendations,
implications, and conclusions.
129
Chapter 5: Discussion, Recommendations, Conclusions
Introduction
Two research questions guided this study. First, does perceived employee
uncertainty, stress, and/or frustration predict counterproductive work behaviors (CWBs)
during periods of organizational transformations, and throughout their work careers?
Second, are perceived employee uncertainty, stress, and/or frustration scores useful in
explaining variability in CWBs during periods of organizational transformations and
throughout their work careers? Null and alternative hypotheses were presented for each
question, and an analysis of the data was completed to address the hypotheses.
The intent of the study was to determine if there were correlations in perceived
uncertainty, stress, and/or frustration, and the self-reported instances of CWBs. The
notion of searching for correlation in a collection of individual perceptions of uncertainty,
stress, and/or frustration to instances of CWBs has been supported by past research.
Cullen, Edwards, Casper, and Gue’s (2014) study demonstrated the role that perceived
organizational support has in the relationship between employees’ ability and perceptions
of change-related uncertainty, and employees’ satisfaction and performance. Researchers
also demonstrated correlations between negative perceptions of the work environment
and increased levels of workplace deviance, and that CWBs tend to increase when
employees feel that they have been treated unjustly (Robinson & Bennett, 1995; Spector
& Fox, 2001). Furthermore, Heacox and Sorenson (2004) found strong relationships
between organizational frustration and aggressive behavior; and Patching and Best (2014)
found stress to be correlated with decreased work performance. Zhang, Redfern,
130
Newman, and Ferreira-Meyers (2014) demonstrated that customer-related social stressors
led to emotional exhaustion, which in turn, related to CWB for service employees.
Chapter 4 included a detailed description of the statistical analysis. Prior to
performing the analysis, any reverse items that were stated in a positive manner were
reversed scored to be consistent with all other scales and scale items. The data were
collected in electronic form from a final sample of 180 participants. Multiple regression
analysis was performed to examine hypothesis 1 and examine whether any or all of the
IVs predicted the DV. The IVs and DV scale items were summed by scoring items
included in the scales. Hierarchical multiple regression analysis was then performed to
examine hypothesis 2, and to further examine whether any or all three of the IV scales are
useful in explaining variability in the DV. The null hypotheses were rejected for both
hypotheses 1 and 2.
Interpretation of the Findings
The interpretation of findings and research conclusions are discussed in this
section. As outlined in Chapter 2, CWBs have been associated with a host of work
problems, including anger reactions, latent hostility, job dissatisfaction, work-related
anxiety (Keenan & Newton, 1984), and negative perceptions of work environments
(Wolf, Dulmus & Maguin, 2012). In the workplace, Fox and Spector (2005)
demonstrated how CWBs can arise from various existing conditions either in the
perpetrator or situation and can include individual employee characteristics and the
characteristics of the workplace. Additionally, other researchers (Heacox & Sorenson,
2004) found strong relations between organizational frustration and aggressive behaviors,
131
and that uncertainty is a major source of psychological strain during organizational
change (Bordia, Hunt, Paulsen, Tourish, & DiFonzo, 2004).
The study sought to understand the predictive role that uncertainty, stress, and
frustration could play in explaining the occurrence of CWBs. Diehl, Richter, and
Sarnecki (2016) argued that poor socio-economic conditions, specifically, weak rule of
law, low human development, and high-income inequity, as salient sources of
uncertainty. Fox, Spector, and Miles (2001) had examined CWBs in response to job
stressors and organizational justice and had reported that organizational constraints,
interpersonal conflict, and perceived injustice are job stressors, CWB is a behavioral
strain response, and negative emotion mediates the stressor-strain relationship.
While the psychological uncertainty scale and the perceived stress scale do not
significantly predict changes in CWB, as both have p-values below .05 at p = .431 and p
= .152 respectively, and the confidence intervals do include zero, with 95% CI [-0.139,
0.324] and [-0.062, 0.394] respectively, the role of frustration is more apparent and
worthy of further study. Behavioral and other outcomes that were correlated with
experienced frustration included job satisfaction, work anxiety, physical health
symptoms, employee withdrawal behavior, aggression, hostility, and sabotage (Spector,
Fox, & Domagalski, 2006). The present study confirmed this relationship. Null
hypotheses 1 and 2 were rejected, indicating that support was indicated for the role of
uncertainty, stress, and frustration in predicting and explaining variability in CWB.
Of the three IV scales, the specific version of Hα1 that was found to be supported
was that the frustration scale significantly predicts CWB (t = 4.269, p < .001). A
132
hierarchical multiple regression was used to examine Hα2 and determine whether any or
all of the three IV scales were useful in explaining this variability. I further examined the
adjusted R2 statistics and the change in R2 from the addition of the three scales to the
model. The increase in R2 due to the addition of the frustration scale to the model was
statistically significant (F(1, 158) = 69.183, p < .001). This result indicated that the
frustration scale is useful in explaining the variability in CWBs.
The data analysis supported the alternative hypothesis Hα1, showing that
psychological uncertainty, perceived stress, and frustration are factors that do predict
CWBs. Alternative hypothesis Hα2 was also supported, and multiple regression analysis
showed that the IV’s are useful in explaining variability in CWBs.
These findings are consistent with predictions of the social exchange theory
(SET). The SET has been used as a framework for understanding CWB. Chernyk-Hai
and Tziner’s (2014) supported the hypotheses that indicates relationships between
organizational distributive justice, overall and ethical climate, and CWB. This is in line
with previous research applying SET in the work environment which supported the
notion that transactional and relational breach has varying effects on CWB (Janssen,
2000). Therefore, both hypotheses were supported.
As for the control variables, gender, age, and position exhibited some influence
on CWB; employment status, ethnicity, and tenure did not. Although not a focus in this
study, females showed a higher level of CWB than males. Gender differences as
previously noted by researchers (see Öcel & Aydin, 2010) still need to be clarified.
Gender. With regard to the control variables, previous literature indicated that
133
females engaged in less CWB than men (Cohen, Panter, & Turan, 2013). While other
researchers found no gender differences in relation to counterproductive behaviors
(Nyarko, Ansah-Nyarko, & Semph, 2014). Spector and Zhou (2014) stated that gender
differences in CWB have been understudied. Results of Spector and Zhou’s research
suggested that the gender differences in acts considered CWB are rather small, noting
that men who engaged in more acts than women did so only when they have certain
personality characteristics, or perceptions of higher levels of job stressors. In contrast,
this study’s findings suggested that females, as previously mentioned, showed a higher
level of CWB than males. It is possible that personality differences may be related to
these findings as well. These finding have practical implications for the field, by
extending investigations of the moderating role of gender in CWB as suggested by
Spector and Zhou (2014). The question is, what can be done by organizational leadership
to minimize negative behaviors in both male and female employees and help advance
employer/employee relations?
Age. Researchers in previous studies (see Cohen, Panter, & Turan, 2012) found
that older workers engaged less in counterproductive work behavior than younger
workers. This study’s findings also suggested that older workers have lower levels of
CWB. Contrary to this study’s findings, Nyarko, Ansah-Nyarko, and Sempah’s (2014)
predictions found that older workers exhibited more counterproductive work behaviors
than younger workers. The reason cited for these findings, researchers remarked, is that
this outcome might be attributed to the perceptions that the older workers’ have regarding
retirement, or having less responsibility, and have nothing to lose (Nyarko et al., 2014).
134
Findings may be related to geographical location, as well as other correlates of CWB.
Position. Anjum and Parvez’s (2014) study proposed that blue collar workers
who usually perform lower level jobs are more prone to counterproductive behavior than
white collar workers who earn more, enjoy more autonomy, and have more freedom. As
far as position, this study found that those employees holding a type of leadership
position (e.g., manager, group leader, supervisor) were shown to exhibit lower CWB than
employees with other type of positions. Contrary to the findings of both study’s,
researchers demonstrated that abusive supervision can negatively affect employee
attitudes and employees’ willingness to engage in positive behaviors (see Tepper, Duffy,
Hobbler, Zellars, Tepper, & Duffy, 2002). In the same vein, Mitchell and Ambrose’s
(2007) results suggested that abusive supervision is positively associated with workplace
deviance.
Theoretical framework. In line with the SET (Chernyak-Hai & Tziner, 2014) it
was proposed that the perceptions employees have of appropriate workplace environment
and rewards, appear to play a primary role in the determination of certain behaviors at
their place of employment. The main premise of the social exchange is that it involves a
series of interactions that generate obligations (Emerson, 1976). Factors that may predict
CWBs include: personal traits and abilities (e.g., Berry, Ones, Sackett, 2007); job
experience (e.g., Kulas, McInnerney, Demuth & Jadwinski, 2007); and work stressors
such as conditions at work, harsh supervision, role ambiguity, and interpersonal
conflicts (e.g., Burk-Lee, & Spector, 2006; Mitchell & Ambrose, 2007; Spector & Fox,
2005).
135
Among prior organizational studies that have used the social exchange
perspective in research are: Chernyak-Hai & Tziner (2014); Ensher, Thomas, and
Murphy (2001); and Deckop, Cirka, and Anderson (2003). The findings of this study
supported hypotheses Hα1 and Hα2, the results demonstrated that the SET has the
construct to explain factors relating to counterproductive behaviors; perceptions of
uncertainty, stress, and frustration do predict CWBs; and that uncertainty, stress, and
frustration scores are useful in explaining variability in CWB of workers. This study
examined counterproductive work behaviors using a single theory. Although many
studies have applied the SET independently, other theories such as the Affective Events
Theory could be added to the study to bolster the theoretical foundation (see Lyons &
Scott, 2012; Matta, Erol-Korkmaz, Johnson & Bicaksiz, 2014). The Affective Events
Theory, for example, could be used to explain negative affective states such as anger,
hostility, and frustration that induce individuals’ engaging in CWBs (Lyons & Scott,
2012).
Limitations of the Study
Self-Report Measure
The chief foundation of this quantitative research effort is the evaluation of
perceived behavior by the participants in their corresponding workplace. The data was
gathered using a survey method; therefore, the perceptions of behaviors reported were not
by behavioral experts. Additionally, the reliance on cross-sectional, self-report
methodology can be problematic, as stated in prior studies (Fox, Spector, & Miles, 2001).
Fox, Spector, and Miles (2001) stated that it is a continuous concern in
136
organizational research that the use of a single source of data, such as self-report
questionnaires, may reflect an overstatement of relationships among variables. However,
because of the arduous task of obtaining uncontaminated measures of counterproductive
behavior, coupled with ethical concerns about the potential of putting participants at risk
in the collection of evidence of CWB, anonymous self-reports provide the nearest
available approximation of these relations (Fox et al., 2001).
As noted in a previous chapter, there are limitations to this study, including the
true demographics and factors related to self-report measures. The first limitation was
that the true demographics of the population in this study are unknown, this study
included sample data rather than population census data, therefore the researcher was
unable to determine whether the sample is representative or not. A convenience sample
rather than a scientifically derived random selection of the population was used and even
though the results may not be generalizable, they should indicate some potential
problems and areas that need further study.
Another limitation in the current study was trustworthiness. With anonymity and
confidentiality assured, participants were more prone to respond than in cases where they
may not have been inclined to do so. Data collected from these questionnaires can
provide data for larger confirmatory studies.
Scales
Uncertainty, stress, frustration, and counterproductive work behavior were
measured using multi-item scales. Findings from analysis for the variables showed that
the reliability statistics for all four scales were well within all acceptable ranges. A four-
137
item scale measured psychological uncertainty; a ten-item scale measured perceived
stress; a three-item scale measured frustration; and a ten-item scale measured CWB (see
Table 1).
Generalizability
One of the potential limitations to this study was generalizability. Specific to this
study is the concern that the use of an online participation pool may not produce a
general representation of the demographic population, and therefore, generalizability
cannot be assumed (Brenner, 2002). According to the Bureau of Labor Statistics (2018),
the current employment statistics survey data extracted on February 26, 2018, reflected
that employment, hours, and earnings for U.S. workers in the motor vehicles and parts
industry was 959.0 in December 2017, and 953.9 in January 2018. Each month current
employment statistics (CES) national estimates are produced. This industry is not
formally defined in the North American Industry (BLS, 2018). The true demographics of
this population are unknown, so the researcher was unable to determine whether the
sample is representative or not. A convenience sample rather than a scientifically derived
random selection of the population was used. However, even though the results may not
be generalizable, they should indicate some potential problems and areas that need
further study.
Participant Pool
Obtaining data from an online participant pool as opposed to a single organization
was identified as a potential limitation to this study. However, online surveys are
consistent with methodology used in previous CWB research consisting of data collected
138
from employees (e.g., Cohen, Panter, & Turan, 2013). With the advent of internet
sampling, participants were recruited via a developed target sampling method employed
by FindParticipants.com who then invited participants according to criteria outlined by
this study. Therefore, the use of an online sample was not deemed to be a limitation in
this study.
Recommendations
This study adds to the empirical data that can identify factors known to be related
to CWBs; however, more research is needed. Further extending our knowledge base of
psychological factors that may influence workplace behaviors is important in
implementing strategies that may help to minimize CWBs. This study focused on
affective and behavioral responses to perceived rather than objective work environments.
The variables in this study included perceived uncertainty, stress, frustration and their
relationship with counterproductive work behaviors. As frustration was found to be a
significant predictor of CWBs, it would be beneficial to further extend empirical studies
in this area. Studies such as this one provides valuable information to organizational
leadership, who can then develop more consistent and sustainable strategies designed to
minimize negative occurrences (Alias, Rasdi, Ismail, & Samah, 2013).
Additionally, more research is needed that examines employee relationships and
behavior at all levels in the organization. It is also recommended to not only examine
factors related to CWBs, but also expand research that gathers data on variables that may
lessen occurrences. Further examination of variables which promote the well-being of
employees (e.g., job satisfaction, communication, empowerment, motivation,
139
transparency, and social support among others) would be a benefit to organizations and
may help improve workplace behaviors. Employee perceptions of work environments has
significant implications for both organizations and individuals (Kanten & Ülker, 2013).
Implications
The results from this study propose valuable data that can be related to positive
social change in organizations and for employees. The results of this study suggest that
employee perceived frustration is significantly related to CWBs. This information can be
used by organizational leaders to refresh and update programs/policies and strategies that
help change people’s behaviors at work, and potentially change behaviors that extend
from the workplace to impact families and communities.
Positive Social Change
Business leaders can facilitate positive behavior through social change
mechanisms such as: motivation, opportunity, and capability (Stephan, Patterson, &
Kelly, 2013). Furthermore, leaders can create opportunities, create transparency, set up
empowering structures and resources, and enable individuals to change by building
confidence, educating, and providing training (Stephan et al., 2013). Social change is for
the most part a long-term uncertain process as previously noted; therefore, in order to be
successful at achieving goals, change strategies need to set in motion sufficient funding
and personnel (Stephan et al., 2013).
Stephen et al. (2013) proposed that implementing intervention strategies needs to
involve timing, and steps that should be taken to create positive social change. First,
organizations should prepare by building motivation, capability, and opportunity on both
140
the project level and the individual level (Stephan et al., 2013). Second, organizations
should create change by sustaining and energizing motivation, and developing capability
and opportunity (Stephan et al., 2013). Lastly, organizations should maintain behavior
change by sustaining motivation to “keep” with the new behavior, and by supporting
capabilities and institutionalizing opportunities (Stephan et al., 2013, p. 75).
Organizational leaders that recognize the need to take steps to better manage the
emotional effects on employees, can improve the quality of the workplace environment.
An area for improvement involves properly training managers on how to lessen
frustration in their relationships with employees, community socialization opportunities
can also have a positive effect. Leaders that invest in human capital will ultimately affect
social change for the organization. The findings from this study could be beneficial to
organizations, as well as to the well-being of employees their families, and the
communities in which they live.
Conclusion
The purpose of understanding individual employee factors as they relate to CWBs
is to provide organizations with additional insight, and the opportunity to improve
employee affective behavioral responses to perceived work environments. CWBs can be
costly to organizations and can also have a negative impact on employees and their
families and extend into the communities in which they live. Overall, the potential for
social change from the findings of this study are contingent on the support, training, and
strategies organizations employ to raise awareness. Furthermore, the fair administration
of policy that employees perceive as positive action can lead to a more satisfying
141
workplace. Organizational leaders need to be diligent in maintaining and keeping current
the policies and practices that are instrumental in minimizing questionable behaviors. The
results of this study demonstrated a statistically significant relationship existed between
employee perceived frustration and CWBs. Organizational leaders and human resource
practitioners should consider the implementation of strategies to include community
resources that will work in concert to better manage employee emotions and related
behaviors. Human capital is a significant resource for organizations; encompassing the
knowledge, abilities, and experience of the workforce. Special consideration in this area
is of the utmost importance for the success and health of organizations, as well as the
health, and satisfaction of its members.
142
References
Aamodt, M. G., Surrette, M. A., & Cohen, D. (2007). Understanding statistics: A
guide for I/O psychologists and human resource professionals. Belmont, CA:
Wadsworth.
Aiken, L. H., Clarke, S. P., Sloane, D. M., Sochalski, J. A., Busse, R., Clarke, H.,
Giovannetti, P., Hunt, J., Rafferty, A. M., & Shamian, J. (2001). Nurses' reports
on hospital care in five countries. Health Affairs, 20(3), 43-53.
doi:10.1377/hlthaff.20.3.43
Alauddin, M., & Nghiem, H. S. (2010). Do instructional attributes pose multicollinearity
problems? An empirical exploration. Economic Analysis and Policy, 40, 351 –
361. doi:10.1016/S0313-5926(10)50034-1
Alias, M., Rasdi, R. M., Ismail, M., & Samah, B. A. (2013). Predictors of workplace
deviant behaviour: HRD agenda for Malaysian support personnel. European
Journal of Training and Development, 37(2), 161-182.
doi:10.1108/03090591311301671
Ambrose, M. L., Seabright, M. A., & Schminke, M. (2002). Sabotage in the workplace:
The role of organizational injustice. Organizational Behavior and Human
Decision Processes, 89, 947-965. doi:10.1016/S0749-5978(02)00037-7
Andalib, T. W., Darun, M. D., & Azizan, A. (2013). Frustration of employees: Reasons,
dimensions and resolving techniques (E-ISSN:2289-5973). Retrieved from
http://worldconferences.net
143
Anderson, L. M. & Pearson, C. M. (1999). Tit for tat? the spiraling effect of incivility in
the workplace. Academy of Management Review, 24(3), 452-471.
doi:10.5465/AMR.1999.2202131
Anitei, M., Birău, M. Chraif, M., Burtăverde, V. & Mihăilă, T. (2014). Social context
differences in aggressive behavior perception between police officers working in
offices and police officers working in the field. Procedia-Social and Behavioral
Sciences 127, 872-877. doi: 10.1016/j.sbspro.2014.03.371
Anjum, M. A., & Parvez, A. (2013). Counterproductive behavior at work: A comparison
of blue collar and white-collar workers. Pakistan Journal of Commerce and
Social Sciences, 7(3), 417-434. Retrieved from
http://www.jespk.net/publications/134.pdf
Appold, S.J. (2006). Elements and identity: Homans as an industrial sociologist. In A.
Javier Treviño (Ed.). George C. Homans: History, theory, and method (pp. 101-
134). Boulder, London: Paradigm.
Aquino, K., & Thau, S. (2009). Workplace victimization: Aggression from the target’s
perspective. Annual Review of Psychology, 60, 717–741.
doi:10.1146/annurev.psych.60.110707.163703
Ashford, S. J., Lee, C. & Bobko, P. (1989). Content, causes, and consequences of job
insecurity: A theory-based measure and substantive test) Academy of
Management Journal, 32(4), 803-829. doi:10.2307/256569
144
Avey, J. B., Wernsing, T. S., & Luthans, F. (2008). Can positive employees help positive
organizational change? Impact of psychological capital and emotions on relevant
attitudes and behaviors. Journal of Applied Behavioral Science, 44(48), 48-70.
doi:10.1177/0021886307311470
Avey, J. B., Wu, K., & Holley, E. (2015). The influence of abusive supervision and job
embeddedness on citizenship and deviance. Journal of Business Ethics, 129(3),
721-731. doi:10.1007/s10551-014-2192-x
Bakker, A.B. and Demerouti, E. (2007). The job demands resources model: State-of-the-
art. Journal of Managerial Psychology, 22, 309-328.
doi:10.1108/02683940710733115
Baron, R. A., & Neuman, J. H. (1996). Workplace violence and workplace aggression:
Evidence on their relative frequency and potential causes. Aggressive Behavior,
22(3), 161-173. doi:10.1016/S0149-2063(99)80066-X
Baron, R. A., & Neuman, J. H. (1998). Workplace aggression-the iceberg beneath the
tip of workplace violence: Evidence on its forms, frequency, and targets. Public
Administration Quarterly, 21(4), 446-464. Retrieved from
www.jstor.org/stable/40861725
Baron, R. A., Neuman, J. H., & Geddes, D. (1999). Social and personal determinants of
workplace aggression: Evidence for the impact of perceived injustice and the
type A behavior pattern. Aggressive Behavior, 25(4), 281-296.
doi:10.1002/(SICI)1098-2337
145
Beehr, T. A., & Glazer, S. (2005). Organizational role stress. In J. Barling, E.K.
Kelloway, & Frone, M.R. (Eds.), Handbook of work stress (pp. 7-33). Thousand
Oaks, CA: Sage.
Beehr, T. A., & Newman, J. E. (1978). Job stress, employee health, and organizational
effectiveness: A facet analysis, model, and literature review. Personnel
Psychology, 31(4), 665-699. doi:10.1111/j.1744-6570.1978.tb02118.x
Beehr, T.A. & McGrath, J.E. (1992). Social support, occupational stress and anxiety.
Anxiety, Stress and Coping, 5(1), 7-19. doi:10.1080/10615809208250484
Bennett, R. J., & Robinson, S. L. (2000). Development of a measure of workplace
deviance. Journal of Applied Psychology, 85(3), 349-360.
doi:10.1037/0021-9010.85.3.349
Bennett, R. J., Aquino, K., Reed, A. II., & Thau, S. (2005). The normative nature of
employee deviance and the impact of moral identity. In S. Fox, P.E. Spector
(Eds.), Counterproductive work behavior: Investigations of actors and targets
(pp. 107-125). Washington, DC: American Psychological Association.
Berry, C. M., Ones, D. S., & Sackett, P. R. (2007). Interpersonal deviance, organizational
deviance, and their common correlates: A review and meta-analysis. Journal of
Applied Psychology, 92, 410-424. doi:10.1037/0021-9010.92.2.410
Biggio, G., & Cortese, C. G. (2013). Well-being in the workplace through interaction
between individual characteristics and organizational context. International
Journal of Qualitative Study on Health and Well-Being, 1-13.
doi:10.3402/qhw.v8i0.19823
146
Blau, P. M. (2008). Exchange & power in social life. New Brunswick, NJ:
Transaction.
Bodla, M. A., Afza, T., & Danish, R. Q. (2015). Perceived organizational politics and
employee morale: Mediating role of social exchange perceptions in Pakistani
organizations. European online Journal of Natural and Social Sciences, 4(1), 66-
75. Retrieved from https://www.researchgate.net
Bonett, D., & Wright, T. (2015). Cronbach's alpha reliability: Interval estimation,
hypothesis testing, and sample size planning. Journal of Organizational
Behavior, 36(1), 3-15. doi:10.1002/job.1960
Bordia, P., Hunt, E., Paulsen, N., Tourish, D., & DiFonzo, N. (2004). Uncertainty during
organizational change: Is it all about control? European Journal of Work and
Organizational Psychology, 13(3), 345-365. doi:10.1080/13594320444000128
Bowling, N. A., Eschleman, K. J. (2010). Employee personality as a moderator of the
relationships between work stressors and counterproductive work behavior.
Journal of Occupational Health Psychology, 15(1), 91-103.
doi:10.1037/a0017326
Brenner, V. (2002). Generalizability issues in internet-based survey research:
Implications for the internet addiction controversy. In B. Batinic, U.-D. Reips,
M. Bosnjak, & A. Werner (Eds.): Online Social Sciences (pp.117-136). Seattle,
WA: Hogrefe & Huber.
147
Bruk-Lee, V., & Spector, P. E. (2006). The social stressors-counterproductive
work behaviors link: Are conflicts with supervisors and coworkers the same?
Journal of Occupational Health Psychology, 11(2), 145-156. doi:10.1037/1076-
8998.11.2.145
Buono, A. F., & Bowditch, J. L. (1989). The human side of mergers and acquisitions. San
Fransisco, CA: Jossey Bass.
Bureau of Labor Statistics. (2013). The employment situation: February 2013. Retrieved
from http://www.bls.gov/news.release/archives/empsit_03082013.pdf
Bureau of Labor Statistics. (2014). The employment situation summary. Retrieved from
http://www.bls.gov/news.release/empsit.nr0.htm
Bureau of Labor Statistics. (2018). Automotive industry: Employment, earnings, and
hours. Retrieved from https://www.bls.gov/iag/tgs/iagauto.htm
Buss, A. H. (1963). Physical aggression in relation to different frustrations. Journal of
Abnormal & Social Psychology, 67(1), 1-7. doi:10.1037/h0040505
Cannon, W.B. (1932). The wisdom of the body (2nd ed.). New York: Norton.
Carden, L. L., & Boyd, R. O. (2013). Workplace bullying: Utilizing a risk management
framework to address bullying in the workplace. Southern Journal of Business
and Ethics, 5, 8-17. Retrieved from
http://search.proquest.com/docview/1467933254?accountid=14872
Carver, C. S., Scheier, M. F., & Weintraub, J. K. (1989). Assessing coping strategies: A
theoretically based approach. Journal of Personality and Social Psychology,
56(2), 267-283. doi:10.1037/0022-3514.56.2.267
148
Center for Advanced Human Resource Studies. (2011). Perception is reality: How
employees perceive what motivates HR practices affects their engagement,
behavior and performance. Center for Advanced Human Resource Studies, 1-6.
Retrieved from http://digitalcommons.ilr.cornell.edu/cahrs_researchlink/16/
Chen, P. Y., & Spector, P. E. (1992). Relationships of work stressors with aggression,
withdrawal, theft and substance use: An exploratory study. Journal of
Occupational & Organizational Psychology, 65(3), 177-184.
doi:10.1111/j.2044-8325.1992.tb00495.x
Chernyak-Hai, L. & Tziner, A. (2014). Relationships between counterproductive work
behavior, perceived justice and climate, occupational status, and leader-member
exchange. Journal of Work and Occupational Psychology, 30, 1-12.
doi:http://dx.doi.org/10.5093/tr2014a1
Coffin, B. (2003). Breaking the silence on white collar crime. Risk Management, 50(9), 8.
Retrieved from http://cf.rims.org/Magazine/PrintTemplate.cfm?AID=2090
Cohen, A. (2016). Are they among us? A conceptual framework of the relationship
between the dark triad personality and counterproductive work behaviors
(CWBs). Human Resource Management Review, 26, 69-85.
doi:10.1016/j.hrmr.2015.07.003
Cohen, J. (1988). Statistical power analysis for the behavioral sciences (2nd ed.), St.
Paul, MN: West.
149
Cohen, S., & Janicki-Deverts, D. (2012). Who’s stressed? Distributions of psychological
stress in the United States in probability samples from 1983, 2006, and 2009.
Journal of Applied Social Psychology, 42(6), 1320-1334. doi:10.1111/j.1559-
1816.2012.00900.x
Cohen, S., Kamarck, T., & Mermelstein, R. (1983). A global measure of perceived stress.
Journal of Health and Social Behavior, 24, 385-396. doi:10.2307/2136404
Cohen, S., & Williamson, G. (1988). Perceived stress in a probability sample of the U.S.
In S. Spacapam & S. Oskamp (Eds.), The social psychology of health: Claremont
Symposium on Applied Social Psychology (pp. 31-67). Newbury Park, CA: Sage
Cohen, T.R., Panter, A.T., & Turan, N. (2013), Predicting counterproductive work
behavior from guilt proneness, Journal of Business Ethics, 114, 45-53.
doi:10.1007/s10551-012-1326-2
Cohen-Charash, Y., & Mueller, J. S. (2007). Does perceived unfairness exacerbate or
mitigate interpersonal counterproductive work behaviors related to envy? Journal
of Applied Psychology, 3, 666-680. doi:10.1037/0021-9010.92.3.666
Cole, M. S., Schaninger, W. S. & Harris, S. G. (2002). The workplace social
exchange network. Group & Organization Management, 27(1), 142-167.
doi:10.1177/1059601102027001008
Colquitt, J. A., Rodell, J. B., Zapata, C. P., Wesson, M. J., Scott, B. A., Long, D. M., &
Conlon, D. E. (2013). Justice at the millennium, a decade later: A meta-analytic
test of social exchange and affect-based perspectives. Journal of Applied
Psychology, 98(2), 199-236. doi:10.1037/a0031757
150
Commission for Occupational Safety and Health (2010). Code of practice: Violence,
aggression and bullying at work. Commission for Occupational Safety and
Health, 1-37. Retrieved from https://www.commerce.wa.gov.au
Cook, K. S., & Rice, E. (2003). Social exchange theory. Handbook of Social
Psychology, (pp. 53-76). Retrieved from http://www.communicationcache.com
Corinthian Colleges, Inc. (2013). Workplace stress on the rise with 83% of Americans
frazzled by something at work. Retrieved from http://globenewswire.com
Creswell, J. W. (2003). Research design. Qualitative, quantitative, and mixed methods
approaches (2nd ed.). Thousand Oaks, CA: Sage.
Crino, M. D. (1994). Employee sabotage: A random or preventable phenomenon?
Journal of Managerial Issues, 6(3), 311-330. Retrieved from
www.jstor.org/stable/40604030
Cropanzano, R. & Mitchell, M. S. (2005). Social exchange theory: An interdisciplinary
review. Journal of Management, 31(6), 874-900. doi:10.1177/0149206305279602
Cullen, K., Edwards, B., Casper, W., & Gue, K. (2014). Employees' adaptability and
perceptions of change-related uncertainty: Implications for perceived
organizational support, job satisfaction, and performance. Journal of Business &
Psychology, 29(2), 269-280. doi:10.1007/s10869-013-9312-y
Dahl, M.S. (2011). Organizational change and employee stress. Management Science,
57(2). doi:10.1287/mnsc.1100.1273
151
Deckop, J. R., Cirka, C. C., & Andersson, L. M. (2003). Doing unto others: The
reciprocity of helping behavior in organizations. Journal of Business
Ethics, 47(2), 101. doi:10.1023/A:1026060419167
Diehl, M.R., Ritchter, A., & Samecki, A. (2006). Variations in employee performance in
response to organizational justice. Journal of Management, 20(10), 1-30.
doi:10.1177/0149206316671581
Diener, E., Oishi, S. & Lucas, R. E. (2003). Personality, culture, and subjective well-
being: Emotional and cognitive evaluations of life. Annual Review of Psychology,
54, 403-425. doi:10.1146/annurev.psych.54.101601.145056
Dienstbier, R. A. (1989). Arousal and physiological toughness: Implications for mental
and physical health. Psychological Review, 96(1), 84-100. doi:10.1037/0033-
295X.96.1.84
Dobson, S. (2010, October 4), ‘Stress levels high as recession recedes: Surveys’. The
Canadian HR Reporter. Retrieved from http://www.hrreporter.com
Eder, P., & Eisenberger, R. (2008). Perceived organizational support: Reducing the
negative influence of coworker withdrawal behavior. Journal of Management, 34,
55-68. doi:10.1177/0149206307309259
Eisenberger, R., Huntington, R., Hutchison, S., & Sowa, D. (1986). Perceived
organizational support. Journal of Applied Psychology, 71(3), 500-507. Retrieved
from http://dx.doi.org/10.1037/0021-9010.71.3.500
Emerson, R. M. (1976) Social exchange theory. Annual Review of Sociology, 2, 335-362.
doi:10.1146/annurev.so.02.080176.002003
152
Ensher, E. A., Craig, T., & Murphy, S. E. (2001). Comparison of traditional, step-ahead,
and peer mentoring on proteges' support, satisfaction, and perceptions of career
success: A social exchange perspective. Journal of Business and
Psychology, 15(3), 419. doi:10.1023/A:1007870600459
Fapohunda T. M. (2012). The global recession: Impact and strategies for human
resources management in Nigeria. International Journal of Economics and
Management Sciences, 1(6), 7-12. Retrieved from https://www.omicsonline.org
Faul, F., Erdfelder, E., Lang, A.-G., & Buchner, A. (2007). G*Power 3: A flexible
statistical power analysis program for the social, behavioral, and biomedical
sciences. Behavior Research Methods, 39, 175-191. doi:10.3758/BFo3193146
Fida, R, Paciello M., Tramontano, C., Fontaine, RG Barbaranelli, C., & Farnese, ML.
(2015). An integrative approach to understanding counterproductive work
behavior: The roles of stressors, negative emotion and moral disengagement.
Journal of Business Ethics, 130, 131-144. doi:10.1007/s10551-014-2209-5
Find Participants (n.d.). How does find participants work? Retrieved from
https://www.findparticipants.com/how
Fine, S. (2012). Estimating the economic impact of personnel selection tools on
counterproductive work behaviors. Economic and Business Letters, 1(4), 1-9.
Retrieved from http://www.oalib.com/paper/2045215#.Wqlxn-jwbIU
Fireman, A. M., & Santuzzi, A. M. (2012). The emotional impact of workplace bullying.
Retrieved from http://www.kon.org/urc/v11/fireman.html
153
Fox, S., & Spector, P. E. (1999). A model of work frustration-aggression. Journal of
Organizational Behavior, 20(6), 915. doi:10.1002/(SICI)1099-
1379(199911)20:6<915::AID-JOB918>3.0.CO;2-6
Fox, S., Spector, P. E., & Miles, D. (2001). Counterproductive work behavior (CWB) in
response to job stressors and organizational justice: Some mediator and moderator
tests for autonomy and emotions. Journal of Vocational Behavior, 59, 1-19.
doi:10.1006/jvbe.2001.1803
Fox, S., & Spector, P. E. (2005). Counterproductive work behavior: Investigations of
actors and targets. Washington, DC: American Psychological Association.
Frankenhaeuser, M. (1991). The psychophysiology of workload, stress, and health:
Comparison between the sexes. Annals of Behavioral Medicine,13, 197-204.
doi:10.1007/978-1-349-14163-0_7
Fryrear, A. (2015). Re: Survey response rates. Retrieved from
https://www.surveygizmo.com/survey-blog/survey-response-rates/
Ganta, V. C., & Manukonda, J. K. (2014). Leadership during change and uncertainty in
organizations. International Journal of Organizational Behaviour & Management
Perspectives, 3(3), 1183-1190. doi:10.1080/14697010701563379
Gerstner, C. R., & Day, D. V. (1997). Meta-analytic review of leader-member exchange
theory: Correlates and construct issues. Journal of Applied Psychology, 82(6),
827-844. doi:10.1037/0021-9010.82.6.827
154
Glasø, L., Vie, T., Holmdal, G., & Einarsen, S. (2011). An application of affective events
theory to workplace bullying: The role of emotions, trait anxiety, and trait anger.
European Psychologist, 16(3), 198-208. doi:10.1027/1016-9040/a000026
Goodwin, N., Harris, J., Nelson J., Roach, B., & Torras M. (2013). The financial crisis
and the great recession. Macroeconomics in Context (pp.337-356). Retrieved from
http://www.ase.tufts.edu/gdae/publications/textbooks/macroeconomics.html
Gravetter, F. J., & Wallnau, L. B. (2004). Statistics for the behavioral sciences (6th ed.).
Belmont, CA: Wadsworth.
Grdinovac, J. A., & Yancey, G. B. (2012). How organizational adaptations to recession
relate to organizational commitment. Psychologist-Manager Journal, 15(1), 6-24.
doi:10.1080/10887156.2012.649089
Gruys, M. L., & Sackett, P. R. (2003). The dimensionality of counterproductive work
behavior. International Journal of Selection and Assessment, 11, 30–42.
doi:10.1111/1468-2389.00224
Hai, C., & Tziner, A. (2014). Relationships between counterproductive work behavior,
perceived justice and climate, occupational status, and leader-member exchange.
Journal of Work and Organizational Psychology 30, 1-12. doi:10.5093/tr2014a1
Harris, L. C., & Ogbonna, E. (2012). Motives for service sabotage: an empirical study of
front-line workers. Service Industries Journal, 32(13), 2027-2046.
doi:10.1080/02642069.2011.582496
155
Heacox, N. J., & Sorenson, R. C. (2004). Organizational frustration and aggressive
behaviors. Journal of Emotional Abuse, 4(3/4), 95-118.
doi:10.1300/J135v04n03_07
Hemingway, C.A. & Maclagan, P.W. (2004). Managers’ personal values as drivers of
corporate social responsibility. Journal of Business Ethics, 50, pp. 33-44.
doi:10.1023/B:BUSI.0000020964.80208.c9
Hershcovis, M.S., Turner, N., Barling, J., Arnold, K.A., Dupré, K.E., Inness, M.,
LeBlanc, M.M., Sivanathan, N. (2007). Predicting workplace aggression: A meta-
analysis. Journal of Applied Psychology, 92, 228-238.
doi: 10.1037/0021-9010.92.1.228
Hershcovis, M., Reich, T. C., Parker, S. K., & Bozeman, J. (2012). The relationship
between workplace aggression and target deviant behaviour: The moderating
roles of power and task interdependence. Work & Stress, 26(1), 1-20.
doi:10.1080/02678373.2012.660770
Hill, R.C., Griffiths, W.E., & Lim, G.C. (2011). Principles of econometrics. Hoboken,
NJ: John Wiley & Sons, Inc.
Hinkin, T.R. (1995). A review of scale development practices in the study of
organizations. Journal of Management, 21(5), 967-988. Retrieved from
https://scholarship.sha.cornell.edu
Hinkin, T. R. (1998). A brief tutorial on the development of measures for use in survey
questionnaires. doi:10.1177/109442819800100106
156
Hirsch, R. P., & Riegelman, R. K. (1992). Statistical First Aid: Interpretation of Health
Research Data. Boston: Blackwell Scientific Publications.
Houdmont, J. Kerr, R. & Addley, K. (2012). Psychosocial factors and economic
recession: The stormont study. Occupational Medicine, 62, 98-104.
doi:10.1093/occmed/kqr216
Hunt, M.L., Hughey, A. W., & Burke, M.G. (2012). Stress and violence in the workplace
and on campus. Industry & Higher Education, 26(1), 43-51.
doi:10.5367/ihe.2012.0076
Inness, M., Barling, J., & Turner, N. (2005). Understanding supervisor-targeted
aggression: A within-person, between-jobs design. Journal of Applied
Psychology, 90(4), 731-739. doi:10.1037/0021-9010.90.4.731
Jackson, S. L. (2010). Statistics plain and simple (2nd ed.). Belmont, CA: Wadsworth
Cinage Learning.
Judeh, M. (2011). Role ambiguity and role conflict as mediators of the relationship
between orientation and organizational commitment. International Business
Research, 4(3), 171-181. doi:10.5539/ibr.v4n3p171
Judge, T. A., & Hulin, C. L. (1993). Job satisfaction as a reflection of disposition: A
multiple source causal analysis. Organizational Behavior and Human Decision
Processes, 56, 388-421. doi:10.1006/obhd.1993.1061
157
Jungsik, K., Song, E., & Seongsoo, L. (2013). Organizational change and employee
organizational identification: Mediation of perceived uncertainty. Social Behavior
& Personality: An International Journal, 41(6), 1019-1034.
doi:10.2224/sbp.2013.41.6.1019
Kamel, N. F., & Abou Hashish, E. A. (2015). The relationship between psychological
need satisfaction, job affective wellbeing and work uncertainty among the
academic nursing educators. Journal of Nursing Education and Practice, 5(8), 99.
doi:10.5430/jnep.v5n8p99
Kanten, P. & Ülker, F.R. (2013). The effect of organizational climate on
counterproductive behaviors: An empirical study on the employees of
manufacturing enterprises. The Macrotheme Review 2(4), 144-160. Retrieved
from http://macrotheme.com
Karkoulian, S., Mukaddam, W., McCarthy, R., & Leila, C. M. (2013). Job insecurity: A
whirlpool of chronic powerlessness. Education, Business and Society:
Contemporary Middle Eastern Issues, 6(1), 55-70.
doi:10.1108/17537981311314727
Keashly, L., Trott, V., & MacLean, L. M. (1994). Abusive behavior in the workplace: A
preliminary investigation. Violence and Victims, 9(4), 341-357. Retrieved from
https://www.researchgate.net
Keenan, A., & Newton, T. J. (1984). Frustration in organizations: Relationships to role
stress, climate, and psychological strain. Journal of Occupational Psychology, 57,
57-65. doi:10.1111/j.2044-8325.1984.tb00148.x
158
Kenexa High Performance Institute. (2011). Stress: the global economic downturn has
taken its toll on employees: What's the Impact for organizations? Retrieved from
http://khpi.com/documents/KHPI-WorkTrends-Report-Stress
Klotz, A. C., & Buckley, M. R. (2013). A historical perspective of counterproductive
work behavior targeting the organization. Journal of Management History, 19(1),
114-132. doi:10.1108/17511341311286222
Koopmans, L., Bernaards, C. M., Hildebrandt, V. H., Schaufeli, W. B., de Vet Henrica,
C. W., & van der Beek, A. J. (2011). Conceptual frameworks of individual work
performance: a systematic review. Journal of Occupational and Environmental
Medicine, 53(8), 856-866. doi:10.1097/JOM.0b013e318226a763
Krischer, M. M., Penney, L.M., & Hunter, E.M. (2010). Can counterproductive work
behaviors be productive? CWB as emotion focused coping. Journal of
Occupational Health Psychology, 15(2), 154-166. doi:10.1037/a0018349
Kossek, E. E., Valcour, M. & Lirio, P. (2014). The sustainable workforce. In P. Y. Chen
& C.L. Cooper (Eds.), Organizational strategies for promoting work-life balance
and wellbeing: A complete reference guide (pp. 295-319). John Wiley & Sons,
Inc. doi:10.1002/9781118539415.wbwell030
Kulas, J. T., McInnerney, J.E., Demuth, R.F., & Jadwinski, V. (2007). Employee
satisfaction and theft: Testing climate perceptions as a mediator. The Journal of
Psychology, 141, 389-402. doi:10.3200/JRLP.141.4.389-402
159
Laerd (2013). Testing for normality using SPSS statistics. Retrieved from:
https://statistics.laerd.com/spss-tutorials/testing-for-normality-using-spss-
statistics.php
LaMastro, V. (1999). Commitment and perceived organizational support. National
Forum of Applied Educational Research Journal, 12(3), 1-13.
doi:10.1108/02683940710757209
Lattuch, F., & Young, S. (2011). Young professionals' perceptions toward organizational
change. Leadership & Organization Development Journal, 32(6), 605-627.
doi:http://dx.doi.org/10.1108/01437731111161085
Lazarus, R. S., & Folkman, S. (1984). Stress, appraisal, and coping. New York:
Springer.
Leach, D., Hagger-Johnson, G., Doerner, N., Wall, T., Turner, N., Dawson, J., & Grote,
G. (2013). Developing a measure of work uncertainty. Journal of Occupational &
Organizational Psychology, 86(1), 85-99. doi:10.1111/joop.12000
Lewandowski, C. A. (2003). Organizational factors contributing to worker frustration:
The precursor to burnout. Journal of Sociology and Social Welfare, 30(4), 175-
185. Retrieved from https://scholarworks.wmich.edu
Leymann, H., PhD. (1990). Mobbing and psychological terror at workplaces. Violence
and Victims, 5(2), 119-26. Retrieved from
http://search.proquest.com/docview/208553663?accountid=14872
Linkedin (n.d.). Retrieved form
https://www.linkedin.com/home?trk=nav_responsive_tab_home
160
Little, R. J. A., & Rubin, D. B. (1987). Statistical analysis with missing data. New York,
NY: Wiley.
Lyons, B. J., & Scott, B.A. (2012). Integrating social exchange and affective explanations
for the receipt of help and harm: A social network approach. Organizational
Behavior and Human Decision Processes, 117, 66-79.
doi:10.1016/j.obhdp.2011.10.002
Markovits, Y., Boer, D., & Van Dick, R. (2014). Economic crisis and the employee: The
effects of economic crisis on employee, job satisfaction, commitment, and self-
regulation. European Management Journal, 32(3), 413-422
doi:10.1016/j.emj.2013.09.005
Martinko, M. J., Gundlach, M. J., & Douglas, S. C. (2002). Toward an integrative theory
of counterproductive workplace behavior: A causal reasoning perspective.
International Journal of Selection and Assessment, 10(1/2), 36-50.
doi: 10.1111/1468-2389.00192
Matta, F. K., Erol-Korkmaz, H. T., Johnson, R. E., & Bicaksiz, P. (2014). Significant
work events and counterproductive work behavior: The role of fairness, emotions,
and emotion regulation. Journal of Organizational Behavior, 35(7), 920-944.
doi:10.1002/job.1934
McGrath, J. E., & Beehr, T. A. (1990). Time and the stress process: Some temporal
issues in the conceptualization and measurement of stress. Stress Medicine, 6, 93–
104. doi:10.1002/smi.2460060205
161
McMillan, K., & Albrecht, S. (2010). Measuring social exchange constructs in
organizations. Communication Methods and Measures, 4(3), 201-220.
doi:10.1080/19312450903378909
Meier, L. L., & Spector, P. E. (2013). Reciprocal effects of work stressors and
counterproductive work behavior: A five-wave longitudinal study. Journal of
Applied Psychology, 98(3), 529-539. doi:10.1037/a0031732
Mertler, C. A., & Vannatta, R. A. (2010). Advanced and multivariate statistical methods
(4th ed.). Glendale, CA: Pyrczak Publishing.
Meyer, J. P., Allen, N. J., & Smith, C. A. (1993). Commitment to organizations and
occupations: Extension and test of a three-component conceptualization. Journal
of Applied Psychology, 78(4), 538-551. doi:10.1037/0021-9010.78.4.538
Milliken, F. J. (1987). Three types of perceived uncertainty about the environment: State,
effect, and response uncertainty. Academy of Management Review, 12(1), 133-
143. doi:10.5465/AMR.1987.4306502
Mind/Populus (2010). Work health and stress survey. Retrieved from:
http://populuslimited.com/uploads/download_pdf-210310-Mind-Workplace-
Health-and-Stress-Survey-March-2010.pdf
Mitchell, M. S., & Ambrose, M. (2007). Abusive supervision and workplace deviance
and the moderating effects of negative reciprocity beliefs. Journal of Applied
Psychology, 92, 1159–1168. doi:10.1037/0021- 9010.92.4.1159
162
Mitchell, M. S., & Ambrose, M. L. (2012). Employees' behavioral reactions to
supervisor aggression: An examination of individual and situational factors.
Journal of Applied Psychology, 97(6), 1148-1170. doi:10.1037/a0029452
Mitchell-McCoy, J. & Evans, G. W. (2005). Physical work environment. In J. Barling,
E.K. Kelloway, & Frone, M.R. (Eds.), Handbook of work stress (pp.219 -245).
Thousand Oaks, California: Sage Publications.
Mulki, J. P., Jaramillo, F., Malhorta, S., & Locander, W. B. (2012). Reluctant employees
and felt stress: The moderating impact of manager decisiveness. Journal of
Business Research, 65, 77-83. doi:10.1016/j.jbusres.2011.01.019
National Institute for Occupational Safety and Health. (1999). Stress at work. Retrieved
http://www.cdc.gov/niosh/docs/99-101/#a
National Institute for Occupational Safety and Health. (2013). Retrieved from
http://www.cdc.gov/niosh/about.html
Napier, N. K., Simmons, G., & Stratton, K. (1989). Communication during a merger: The
experience of two banks. Human Resource Planning, 12(2), 105-122.
doi:10.1007/978-3-322-83820-9_11
Nau. (2015). Statistical forecasting: notes on regression and time series analysis.
Retrieved from: http://people.duke.edu/~rnau/testing.htm
Neuman, J. H., & Baron, R. A. (2005). Aggression in the workplace: A social
psychological perspective. In Fox S., & Spector, P. E. (Eds.), Counterproductive
work behavior: Investigations of actors and targets (pp. 13-40). Washington, DC:
American Psychological Association.
163
Newton, C. J., & Jimmieson, N. L. (2008). Role stressors, participative control, and
subjective fit with organizational values: Main and moderating effects on
employee outcomes. Journal of Management and Organization, 14(1), 20-39.
Retrieved from https://www.researchgate.net
Nixon, A. E., Mazzola, J. J., Bauer, J., Krueger, J. R., & Spector, P. E. (2011). Can work
make you sick? A meta-analysis of the relationships between job stressors and
physical symptoms. Work & Stress, 25(1), 1-22.
doi:10.1080/02678373.2011.569175
Nyarko, K., Ansah, Ansah-Nyarko, M., & Sempah, D.B. (2014). Organizational injustice
and interpersonal conflict on counterproductive work behavior. European Journal
of Business and Management 6(21), 117-123. Retrieved from
https://www.researchgate.net
Öcel, H. & Aydin, O. (2010). The effects of belief in a just world and gender on
counterproductive work behaviors. Turkish Journal of Psychology, 66, 84-86.
Retrieved from https://www.researchgate.net
O’Connor, E. J., Peters, L. H., Pooyan, A. Weekly, J., Frank, B., & Erenkrantz, B.
(1984). Situational constraint effects on performance, affective reactions, and
turnover: A field replication and extension. Journal of Applied Psychology, 69(4),
663-672. doi:10.1037/0021-9010.69.4.663
Omar, Z., & Ahmad, A. (2014). Factors contributing to research team effectiveness:
Testing a model of team effectiveness in an academic setting. International
Journal of Higher Education, 3 (3), 10-26. doi:10.5430/ijhe.v3n3p10
164
O’Neill, T.A., Lewis, R., & Carswell, J.J. (2011). Employee personality, justice
perceptions, and the prediction of workplace deviance. Personality and Individual
Differences, 51(5), 595-600. doi:10.1016/j.paid.2011.05.025
Osborne, J. & Waters, E. (2002). Four assumptions of multiple regression that
researchers should always test. Practical Assessment, Research & Evaluation
8(2). Retrieved from http://pareonline.net
Ostroff, C., Kinicki, A. J., & Clark, M. A. (2002). Substantive and operational issues of
response bias across levels of analysis: An example of climate-satisfaction
relationships. Journal of Applied Psychology, 87(2), 355-368.
doi:10.1037//0021-9010.87.2.355
Overell, S. (2013). Job insecurity in the wake of a recession. Employment Relations
Comment. Retrieved from http://www.acas.org.uk/media/pdf/2/1/Job-insecurity-
in-the-wake-of-a-recession.pdf
Palmer, B. (2010). What’s wrong with work: The 5 frustrations of work and how to fix
them for good. Chichester, West Sussex: Wiley.
Park, H. M. (2015). Linear regression models for panel data using SAS, Stata, LIMDEP,
and SPSS. IU Scholar Works. The Trustees of Indiana University. Retrieved from:
http://hdl.handle.net/2022/19739
Patching, A. & Best, R. (2014). An investigation into psychological stress detection and
management in organizations operating in project and construction management.
Procedia-Social and Behavioral Sciences 119, 682-691.
doi:10.1016/j.sbspro.2014.03.076
165
Pearson, C. M., Anderson, L. M., & Porath, C. L. (2005). Workplace incivility. In S. Fox,
P. E. Spector (Eds.), Counterproductive work behavior: Investigations of actors
and targets (pp. 177-200). Washington, DC US: American Psychological
Association.
Penney, L. M., & Spector, P. E. (2005). Job stress, incivility, and counterproductive work
behavior (CWB): The moderating role of negative affectivity. Journal of
Organizational Behavior, 26, 777–796. doi:10.1002/job.336
Peters, G. J. Y. (2014). The alpha and the omega of scale reliability and validity: Why
and how to abandon Cronbach’s alpha and the route towards more comprehensive
assessment of scale quality. The European Health Psychologist, 16, 56–69.
doi:10.17605/OSF.IO/TNRXV
Peters, L. H., O'Connor, E. J., & Rudolf, C. J. (1980). Frustration scale. American
Psychological Association. doi:10.1037/t08834-000
Pew Research Center. (2010). How the great recession has changed life in America.
Retrieved from http://www.pewsocialtrends.org
Podsakoff, P. M., MacKenzie, S. B., Jeong-Yeon, L., & Podsakoff, N. P. (2003).
Common method biases in behavioral research: A critical review of the literature
and recommended remedies. Journal of Applied Psychology, 88(5), 879-903.
doi: 10.1037/0021-9010.88.5.879
Podsakoff, P. M., & Organ, D. W. (1986). Self-Reports in organizational research:
problems and prospects. Journal of Management, 12(4), 531-544.
doi: 10.1177/014920638601200408
166
Poole, M., & O’Farrell, P. (1971). The assumptions of the linear regression model.
Transactions of the Institute of British Geographers, 52, 145-158. Retrieved from:
http://www.jstor.org/stable/621706
Porath, C. L., Gerbasi, A., & Schorch, S. L. (2015). The effects of civility on advice,
leadership, and performance. Journal of Applied Psychology, 100(5), 1527-1541.
doi:10.1037/ap10000016
Porath, C. L., & Pearson, C. M. (2004). On the nature, consequences and remedies of
workplace incivility: No time for "Nice"? Think again.
doi:10.5465/AME.2005.15841946
Princeton University Library. (2007). Introduction to regression. Data and statistics
services. Retrieved from:
http://dss.princeton.edu/online_help/analysis/regression_intro.htm
Probst, T. M. (2005). Economic stressors. In J. Barling, K. Kelloway, & M. Frones
(Eds.), Handbook of Work Stress (pp. 267-297). Thousand Oaks, CA: Sage.
Rafferty, A. E., Allanah, E. & Griffin M. A. (2006). Psychological uncertainty scale.
doi: 10.1037/t09073-000
Rafferty, A. E., Allanah, E., & Griffin M. A. (2006). Perceptions of organizational
change: A stress and coping perspective. Journal of Applied Psychology, 91(5),
1154-1162. doi:10.1037/0021-9010.91.5.1154
167
Ramshida, A.P., & Manikandan, K. (2013). Organizational commitment as a mediator of
counterproductive work behavior and organizational culture. Journal of Social
Science & Interdisciplinary Research, 2(2), 59-69. Retrieved from
http://www.indianresearchjournals.com/pdf/IJSSIR/2013/February/6.pdf
Raosoft. (2004). Sample size calculator. Retrieved from
http://www.raosoft.com/samplesize.html
Ravn, M. O., & Sterk, V. (2012). Job uncertainty and deep recessions. St. Louis: Federal
Reserve Bank of St Louis. doi:10.1016/j.jmoneco.2017.07.003
Reynolds, C.A., Shoss, M.K., & Jundt, S.D. (2015). In the eye of the beholder: A multi-
stakeholder perspective of organizational citizenship and counterproductive work
behaviors. Human Resource Management Review 25(1), 80-93.
doi:10.1016/j.hrmr.2014.06.002
Rhoades, L., & Eisenberger, R. (2002). Perceived organizational support: A review of
the literature. Journal of Applied Psychology, 87(4), 698-714.
doi:10.1037//0021-9010.87.4.698
Richman, L. S., & Leary, M. R. (2009). Reactions to discrimination, stigmatization,
ostracism, and other forms of interpersonal rejection: A multimotive model.
Psychological Review, 116(2), 365-383. doi:10.1037/a0015250
Richter, A., Näswall, K., De Cuyper, N., Sverke, M., De Witte, H., & Hellgren, J. (2013).
Coping with job insecurity. Career Development International, 18(5), 484-502.
doi:10.1108/CDI-06-2013-0081
168
Rizzo, J. R., House, R. J., & Lirtzman, S. I. (1970). Role conflict and ambiguity in
complex organizations. Science Quarterly, 15(2), 150-163. doi:10.2307/2391486
Robinson, S. L., & Bennett, R. J. (1995). A typology of deviant of workplace behaviors:
A multi-dimensional scaling study. Academy of Management Journal, 38, 555-
572. doi:10.2307/256693
Rosnow, R. L. (1988). Rumor as communication: A contextual approach. Journal of
Communication 1, 12-28. doi:10.1111/j.1460-2466.1988.tb02033.x
Schaufeli, W. B., Leiter, M. P., & Maslach, C. (2009). Burnout: 35 years of research and
practice. Career Development International, 14(3), 204-220.
doi 10.1108/13620430910966406
Schneider, B. (1987). The people make the place. Personnel Psychology, 40(3),
437-453. doi:10.1111/j.1744-6570.1987.tb00609.x
Schweiger, D. M., & Denisi, A. S. (1991). Communication with employees following a
merger: A longitudinal field experiment. Academy of Management Journal, 34
(1), 110-135. doi:10.2307/256304
Scott, K. L., Restubog, S. L.D., & Zagenczyk, T. J. (2012). A social exchange-based
model of the antecedents of workplace exclusion. Journal of Applied Psychology,
1-12. doi:10.1037/a0030135
Sert, A. Elci, M., Uslu, T., & Sener, I. (2014). The effects of organizational justice and
ethical climate on perceived work-related stress. Procedia-Social and Behavioral
Sciences 150, 1187-1198. doi:10.1016/j.sbspro.2014.09.134
169
Settoon, P. R., Bennett, N., & Linden, R. C. (1996). Social exchange in organizations:
Perceived organizational support, leader-member exchange, and employee
reciprocity. Journal of Applied Psychology, 81(3), 219-227.
doi:10.1037/0021-9010.81.3.219
Shore, L. M., Soyle-Shapiro, J. A-M., & Tetrick, L. E. (2012). Expanding the boundaries
and challenging the assumptions of the employee-organization relationship
literature. In L. M., Shore, J. A-M. Coyle-Shapiro, & L. E. Tetrick (Eds.). The
employee-organization relationship: Applications for the 21st century (pp.1-19).
New York: Routledge.
Silverman, S. J. (2000). Proposals that work: A guide for planning dissertations and
grant proposals (4th ed.). New York, NY: Sage.
Sinclair, R., Sears, L., Zajack, M., & Probst, T. (2010). A multilevel model of
economic stress and employee well-being. In Houdmont, J., Leka, S.,
(Eds.), Contemporary Occupational Health Psychology: Global Perspectives on
Research and Practice (pp. 1-20). Chichester, UK: Wiley-Blackwell.
Smith, M.J., Karsh, B., Carayon, P., & Conway, F.T. (2003). Controlling occupational
safety and health hazards. In J.C., Quick & L.E. Tetrick (Eds.), Handbook of
occupational health psychology (pp. 163_189). Washington, DC: American
Psychological Association.
Society for Human Resource Management. (2011). Workplace visions: Employee job
satisfaction: The external forces influencing employee attitudes. Retrieved from
https://blog.shrm.org
170
Spector, P. E. (1975). Relationships of organizational frustration with reported behavioral
reactions of employees. Journal of Applied Psychology, 60(5), 635-637.
doi:10.1037/h0077157
Spector, P. E. (1978). Organizational frustration: A model and review of the literature. e.
Personnel Psychology, 31, 815-829. doi:10.1111/j.1744-6570.1978.tb02125.x
Spector, P. E. (2001). Science briefs: Counterproductive work behavior: The secret side
of organizational life. Psychological Science Agenda. pp. 8-9.
doi:10.1037/e322212004-008.
Spector, P.E., Bauer, J.A., Fox, S. (2010), Measurement artifacts in the assessment of
counterproductive work behaviors and organizational citizenship behavior: Do we
know what we think we know? Journal of Applied Psychology, 95(4), 781-790.
doi:10.1037/a0019477
Spector, P. E., Dwyer, S. J., & Jex, S. M. (1988). Relation of job stressors to affective,
health, and performance outcomes: A comparison of multiple data sources.
Journal of Applied Psychology, 73(1), 11-19. doi:10.1037/0021-9010.73.1.11
Spector, P. E., & Fox, S. (2001). Counterproductive work behavior checklist (CWB-C).
Retrieved from http://shell.cas.usf.edu/~spector/scales/cwbcpage.html
Spector, P.E., & Fox, S. (2005). The stressor-emotion model of counterproductive work
behavior. In S. Fox & P.E. Spector (Eds.), Counterproductive work behaviors:
Investigations of actors and targets (pp. 151-174). Washington, DC: APA
171
Spector, P.E., & Fox, S. (2010). Counterproductive work behavior and organizational
citizenship behavior: Are they opposite forms of active behavior? Applied
Psychology: An International Review, 59(1), 21-39.
doi:10.1111/j.1464-0597.2009.00414.x
Spector, P.E., Fox, S., & Domagalski, T. (2006). Emotions, violence, and
counterproductive work behavior. In E.K., Kelloway, J., Barling, & J.J., Hurrell,
jr. (Eds).), Handbook of workplace violence (pp. 29-46). Thousand Oaks, CA:
Sage Publications, Inc.
Spector, P. E., Fox, S., Penney, L. M., Bruursema, K., Goh, A., & Kessler, S. (2006). The
dimensionality of counterproductivity: Are all counterproductive behaviors
created equal? Journal of Vocational Behavior, 68, 446-460.
doi: 10.1016/j.jvb.2005.10.005
Spector, P. E., Penner, L. A., & Hawkins, H. L. (1975). The effects of thwarting of
aggression on subsequent aggression. Social Behavior & Personality: An
International Journal, 3(2), 233-241. doi:10.2224/sbp.1975.3.2.233
Spector, P.E. & Zhou, Z.E. (2014). The moderating role of gender in relationships of
stressors and personality with counterproductive work behavior. Journal of
Business Psychology, 29, 669-681. doi 10.1007/s10869-013-9307-8
Sprung, J. M., Jex, S. M. (2012). Work locus of control as a moderator of the relationship
between work stressors and counterproductive work behavior. International
Journal of Stress Management, 19(4), 272-291. doi:10.1037/a0030320
172
Stephan, U., Patterson M., & Kelly, C. (2013). Business-driven social change: A
systematic review of the evidence. Network for Business Sustainability. Retrieved
from https://www.sheffield.ac.uk
Storms, P. L. & Spector, P. E. (1987). Relationships of organizational frustration with
reported behavioral reactions: the moderating effect of locus of control. Journal of
Occupational Psychology, 60, 227-234. doi:10.1111/j.2044-8325.1987.tb00255.x
Sulea, C. (2010). Counterproductive behaviors in organizations. Retrieved from
http://www.ohpedu.ro/en/articles/counterproductive-behavior/
SurveyMonkey® (n.d.). Survey platform. Retrieved from
https://www.surveymonkey.com
Szabo, S., Tache, Y., & Somogyi, A. (2012). The legacy of Hans Selye and the origins of
stress research: A retrospective 75 years after his landmark brief “letter” to the
editor of nature. doi:10.3109/10253890.2012.710919
Tavakol, M., & Dennick, R. (2011). Making sense of Cronbach's alpha. International
Journal of Medical Education, 253-255. doi:10.5116/ijme.4dfb.8dfd
Tepper, B. J. (2007). Abusive supervision in work organizations: Review, synthesis, and
research agenda. Journal of Management, 33, 261–289.
doi:10.1177/0149206307300812
Tepper, B. J., Duffy, M. K., Henle, C. A., & Lambert, L. S. (2006). Procedural injustice,
victim precipitation, and abusive supervision. Personnel Psychology, 59, 101–
123. doi:10.1111/j.1744-6570.2006.00725.x
173
Tepper, B. J., Duffy, M. K., & Shaw, J. D. (2001). Personality moderators of the
relationship between abusive supervision and subordinates’ resistance.
Journal of Applied Psychology, 86, 974–983. doi:10.1037/0021- 9010.86.5.974
Tepper, B. J., Henle, C., Lambert, L., Giacalone, R., & Duffy, M. K. (2008). Abusive
supervision and subordinates’ organizational deviance. Journal of Applied
Psychology, 93, 721–732. doi:10.1037/0021- 9010.93.4.721
Tepper, B. J., Moss, S. E., Lockhart, D. E., & Carr, J. C. (2007). Abusive supervision,
upward maintenance communications, and subordinates’ psychological distress.
Academy of Management Journal, 50, 1169– 1180. doi:10.2307/20159918
Tesvich, L. K., & Morrow, C. (2010). HR's challenge: Engaging employee’s post-
recession. Retrieved from http://blog.linkageinc.com
Trevino, A. J. (2006). Introduction: The sentiments and activities of George C. Homans.
In A. Javier Treviño (Ed.), George C. Homans: History, Theory, and Method (pp.
1-2). Boulder, CO: Paradigm Publishers.
Vander Elst, T., Van den brock, DeWitt, & DeCuyper (2012). The mediating role of
frustration of psychological needs in the relationship between job insecurity and
work-related well-being. Work & Stress, 26(3), 252-271.
doi.org/10.1080/02678373.2012.703900
Vardi, Y., & Weitz, E. (2004). Misbehaviors in organizations: Theory, research, and
management. New Jersey: Lawrence Erlbaum Associates, Inc.
174
Velciu, M., & Drăgoiu, I. C., & Mladen, L. (2010). Stress in a changing world of work.
European Journal of Interdisciplinary Studies, 2(1), 16-22. Retrieved from
http://www.ejist.ro
Voydanoff, P. (1990). Economic distress and family relations: A review of the eighties.
Journal of Marriage and the Family, 52, 1099-1115. doi:10.2307/353321
Wanek, J. E. (1999). Integrity and honesty testing: What do we know? How do we use it?
International Journal of Selection & Assessment, 7(4), 183. doi:10.1111/1468-
2389.00118
Weinberg, A. & Cooper, C. (2012). Stress in turbulent times. Palgrave-Macmillan,
Hampshire, UK.
Weiss, H. M., & Cropanzano, R. (1996). Affective events theory: A theoretical
discussion of the structure, causes and consequences of affective experiences at
work. Research in Organizational Behavior, 18, 1-74. Retrieved from
https://www.researchgate.net
Wolf, D.A.P., Dulmus, C.N. & Maguin, E. (2012). Empirically supported treatment’s
impact on organizational culture and climate. Research on Social Work Practice
22(6), 665–671. doi:10.1177/1049731512448934
Workplace Bullying Institute Research Studies (2012). Effectiveness of bullied target
resolution strategies. Retrieved from http://www.workplacebullying.org
175
Wu, C., & Liu, N. (2014). Perceived organizational support, organizational commitment
and service-oriented organizational citizenship behaviors. International Journal of
Business and Information, 9(1), 61-88. Retrieved from https://search-proquest-
com.ezp.waldenulibrary.org
Yang, L., Johnson, R. E., Zhang, X., Spector, P. E., & Xu, S. (2013). Relations of
interpersonal unfairness with counterproductive work behavior: The moderating
role of employee self-identity. Journal of Business and Psychology, 28(2), 189-
202. doi:10.1007/s10869-012-9271-8
Zhang, R., Redfern, K., Newman, M. A., & Ferreira‐Meyers, K. (2016). If you are
emotionally intelligent: The effects of customer‐related social stressors on
counterproductive work behavior for front‐line service employees. International
Journal of Selection and Assessment, 24(3), 260-271. doi:10.1111/ijsa.12145
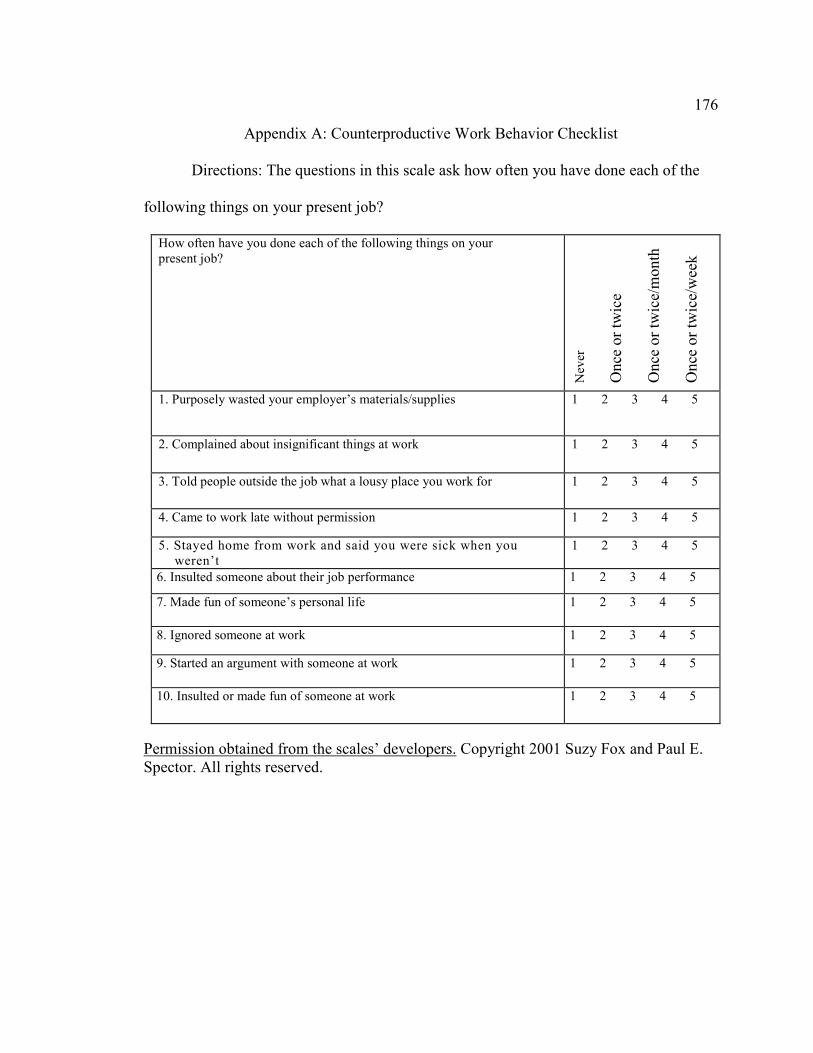
176
Appendix A: Counterproductive Work Behavior Checklist
Directions: The questions in this scale ask how often you have done each of the
following things on your present job?
How often have you done each of the following things on your present job?
Nev
er
Onc
e or
tw
ice
Onc
e or
tw
ice/
mon
th
Onc
e or
tw
ice/
wee
k
1. Purposely wasted your employer’s materials/supplies 1 2 3 4 5
2. Complained about insignificant things at work 1 2 3 4 5
3. Told people outside the job what a lousy place you work for 1 2 3 4 5
4. Came to work late without permission 1 2 3 4 5
5. Stayed home from work and said you were sick when you weren’t
1 2 3 4 5
6. Insulted someone about their job performance 1 2 3 4 5
7. Made fun of someone’s personal life 1 2 3 4 5
8. Ignored someone at work 1 2 3 4 5
9. Started an argument with someone at work 1 2 3 4 5
10. Insulted or made fun of someone at work 1 2 3 4 5
Permission obtained from the scales’ developers. Copyright 2001 Suzy Fox and Paul E. Spector. All rights reserved.
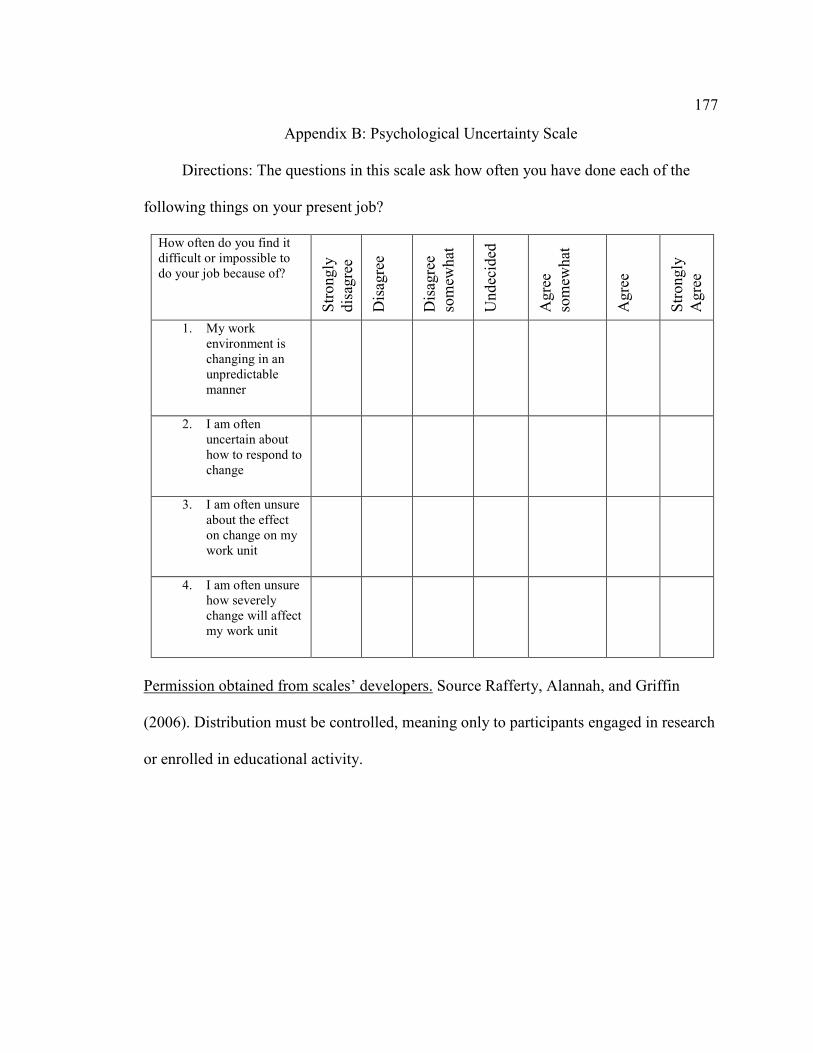
177
Appendix B: Psychological Uncertainty Scale
Directions: The questions in this scale ask how often you have done each of the
following things on your present job?
How often do you find it difficult or impossible to do your job because of?
Str
ongl
y di
sagr
ee
Dis
agre
e
Dis
agre
e so
mew
hat
Und
ecid
ed
Agr
ee
som
ewha
t
Agr
ee
Str
ongl
y A
gree
1. My work environment is changing in an unpredictable manner
2. I am often uncertain about how to respond to change
3. I am often unsure about the effect on change on my work unit
4. I am often unsure how severely change will affect my work unit
Permission obtained from scales’ developers. Source Rafferty, Alannah, and Griffin
(2006). Distribution must be controlled, meaning only to participants engaged in research
or enrolled in educational activity.
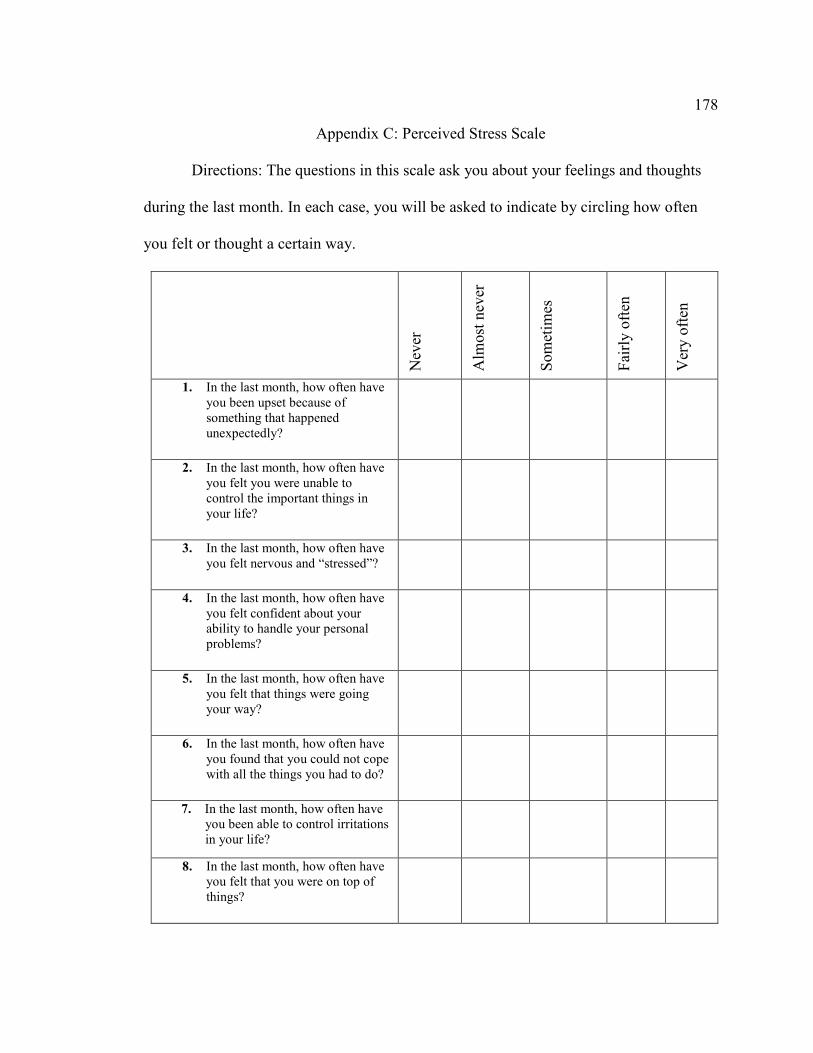
178
Appendix C: Perceived Stress Scale
Directions: The questions in this scale ask you about your feelings and thoughts
during the last month. In each case, you will be asked to indicate by circling how often
you felt or thought a certain way.
Nev
er
Alm
ost
neve
r
Som
etim
es
Fai
rly
ofte
n
Ver
y of
ten
1. In the last month, how often have you been upset because of something that happened unexpectedly?
2. In the last month, how often have you felt you were unable to control the important things in your life?
3. In the last month, how often have you felt nervous and “stressed”?
4. In the last month, how often have you felt confident about your ability to handle your personal problems?
5. In the last month, how often have you felt that things were going your way?
6. In the last month, how often have you found that you could not cope with all the things you had to do?
7. In the last month, how often have you been able to control irritations in your life?
8. In the last month, how often have you felt that you were on top of things?
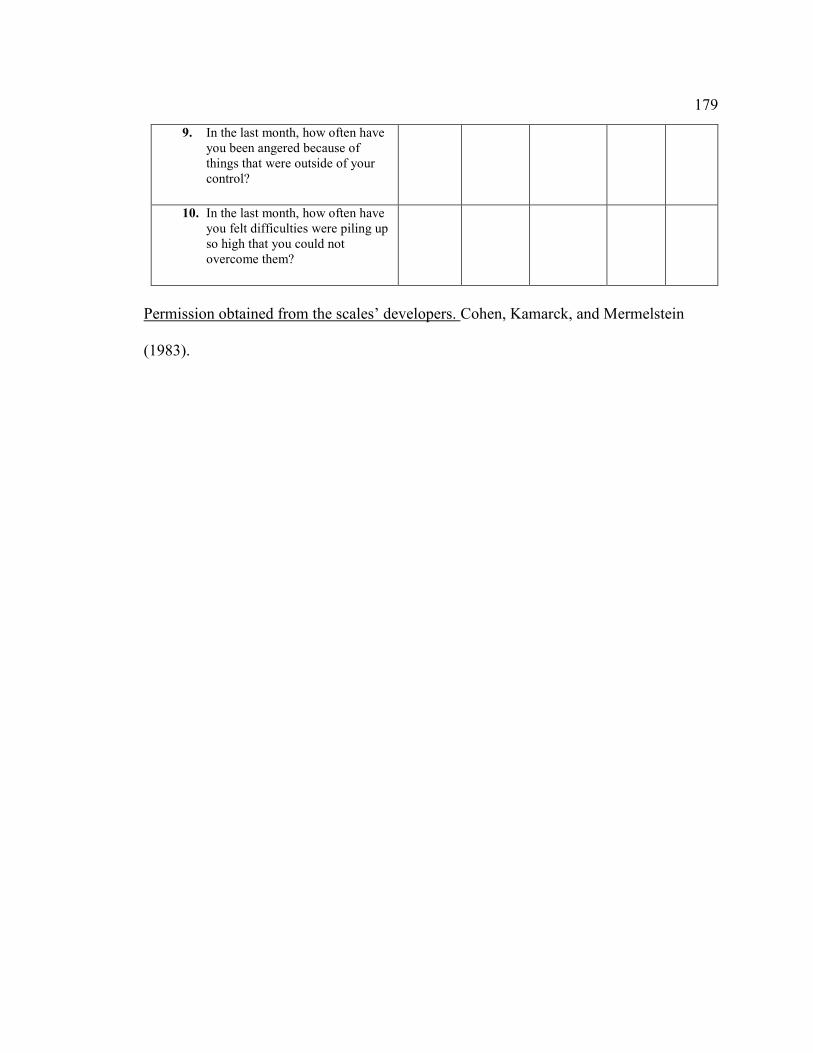
179
9. In the last month, how often have you been angered because of things that were outside of your control?
10. In the last month, how often have you felt difficulties were piling up so high that you could not overcome them?
Permission obtained from the scales’ developers. Cohen, Kamarck, and Mermelstein
(1983).
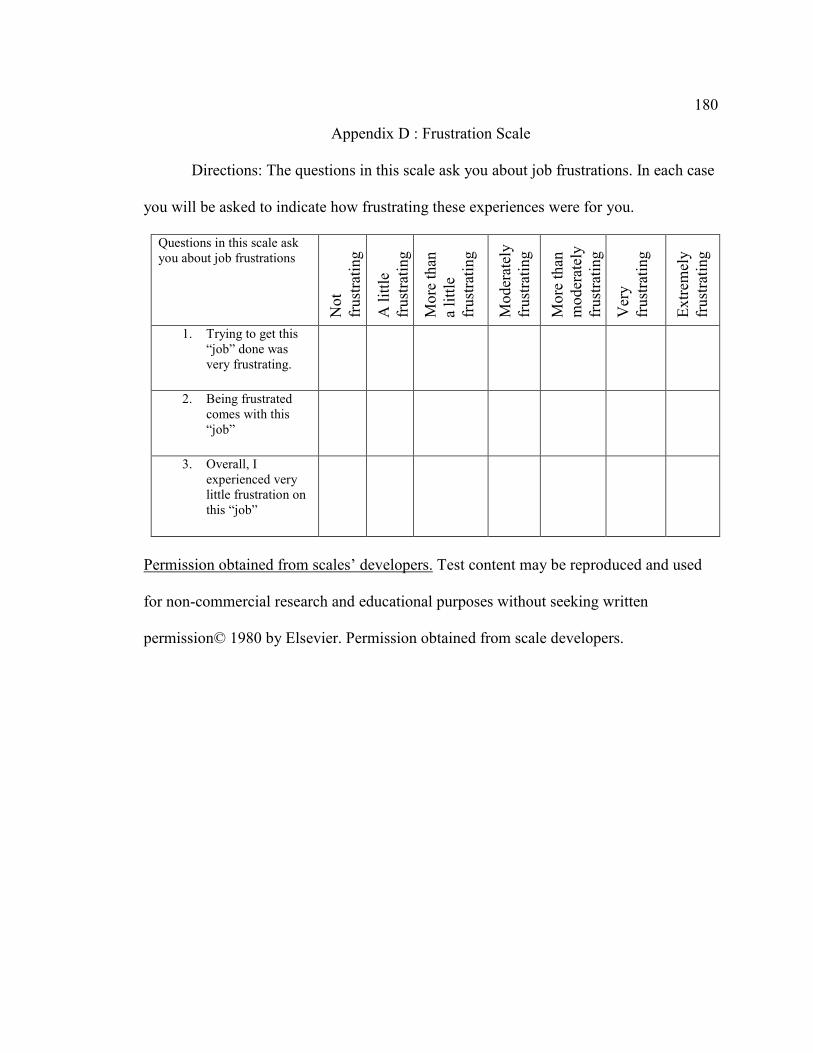
180
Appendix D : Frustration Scale
Directions: The questions in this scale ask you about job frustrations. In each case
you will be asked to indicate how frustrating these experiences were for you.
Questions in this scale ask you about job frustrations
Not
fr
ustr
atin
g
A l
ittl
e fr
ustr
atin
g
Mor
e th
an
a li
ttle
fr
ustr
atin
g
Mod
erat
ely
frus
trat
ing
Mor
e th
an
mod
erat
ely
frus
trat
ing
Ver
y fr
ustr
atin
g
Ext
rem
ely
frus
trat
ing
1. Trying to get this “job” done was very frustrating.
2. Being frustrated comes with this “job”
3. Overall, I experienced very little frustration on this “job”
Permission obtained from scales’ developers. Test content may be reproduced and used
for non-commercial research and educational purposes without seeking written
permission© 1980 by Elsevier. Permission obtained from scale developers.
181
Appendix E: Demographic Questionnaire
Directions: Completion of the demographic questionnaire is significant for
determining the influence of a variety of factors on the results of the study. These records
will remain strictly anonymous. Any reports that may be published will not include any
identifying information (e.g., name, address, employers’ name address, etc.) of the
participants in this study. Research will not link individual responses with participant’s
identities. Please check the appropriate line.
Gender.
_____ Male
_____ Female
Age Bracket.
_____ 18-20
_____ 21-29
_____ 30-39
_____ 40-49
_____ 50-59
_____ 60 or older
Employment Status.
_____ Employed working full-time
_____ Employed working part-time
182
Position in Auto Industry.
_____ Salesperson
_____ Service Writer
_____ Auto Technician
_____ Supervisor
_____ Manager
_____ Group Leader
_____ Other
Tenure in that position.
_____ Less than 1 year
_____ 1-3 years
_____ 3-6 years
_____ 6 years or more
Race/ Ethnicity.
_____ American Indian or Alaskan Native
_____ Asian/Pacific Islander
_____ Black or African American
_____ Hispanic/Latino
_____ White/ Multiple ethnicity/Other


![cdn.confessionsoftheprofessions.com€¦ · of freelancers find "income uncertainty" their biggest frustration.[l] You can avoid this uncertainty by marketing regularly. Here are](https://img.pdfslide.us/doc/110x75/5f9d4efa9878ab7bfd69eb95/cdnconfess-of-freelancers-find-income-uncertainty-their-biggest-frustrationl.jpg)