Embed Size (px)
Citation preview

Psoriasis:
A Study of the Skin Transcriptome and Microbiome
A Thesis
Submitted to the Faculty
of
Drexel University
by
Ceylan Ece Tanes
in partial fulfillment of the
requirements for the degree
of
Doctor of Philosophy
June 2015

2
© Copyright 2015
Ceylan Ece Tanes. All Rights Reserved

This thesis is dedicated to my parents Yalcin and Sabahat Tanes and my sister Zeynep Tanes.
Their encouragements and unconditional support has kept me going.

Acknowledgements
I would like to thank my advisor Dr. Aydin Tozeren for his unwavering support and guidance
throughout my research. His efforts and patience has shaped me into the scientist that I am
today, for which I am most grateful. I would like to thank my committee members: Dr. Uri
Hershberg, Dr. Ahmet Sacan, Dr. Suresh Joshi and Dr. Gail Rosen for their support. Their
involvement in my research has left a lasting impact on the course of my career. I would like to
thank my colleagues at the Center for Integrated Bioinformatics: Latifa Jackson and Max Shestov
for their valuable discussions. I would like to thank my friends for always being there for me
through thick and thin. A special thanks goes to Pablo Huang for his help of countless hours of
proofreading and his encouragement during the hardest times. Finally, I would like to
acknowledge my parents Yalcin and Sabahat Tanes and my beloved sister Zeynep Tanes for their
encouragement and unconditional support. Without their sacrifices, I would not be here.

5
Table of Contents
Acknowledgements.......................................................................................................................... 4
Table of Contents ............................................................................................................................. 5
List of Tables .................................................................................................................................... 7
List of Figures ................................................................................................................................... 9
Abstract .......................................................................................................................................... 12
Introduction ................................................................................................................................... 15
Motivation ................................................................................................................................. 15
Background Information ............................................................................................................ 16
Skin Disorders and Psoriasis ................................................................................................... 16
DNA Microarrays .................................................................................................................... 17
Sequencing Technologies ....................................................................................................... 19
Specific Aim I: Analyzing Psoriasis Transcriptome ......................................................................... 21
Introduction ............................................................................................................................... 21
Methods ..................................................................................................................................... 24
Microarray Datasets ............................................................................................................... 24
Gene Signatures of the Host .................................................................................................. 25
Functional Analysis of Gene Signatures ................................................................................. 28
Signature Comparison between Psoriasis and Wound Healing ............................................. 29
Signature Comparison between Affymetrix and PIQOR Platforms ....................................... 29
Results ........................................................................................................................................ 30
Host Gene Signatures for Skin Diseases ................................................................................. 31
Biomarker Genes with Drastic Expression Changes in Psoriasis ............................................ 33
Functional Annotation of Gene Signatures ............................................................................ 35
Expression Similarities between Psoriasis and Wound Healing ............................................ 37
Comparison of Gene Signatures between Affymetrix and PIQOR Datasets .......................... 40
Discussion .................................................................................................................................. 41
Specific Aim II: Functional Perturbations in Psoriasis Microbiome ............................................... 45
Introduction ............................................................................................................................... 45
Methods ..................................................................................................................................... 47
Obtaining the Microbiome Datasets ...................................................................................... 47

6
Processing the Microbiome Reads ......................................................................................... 49
Metagenome Prediction ........................................................................................................ 50
Commonly Altered Genes between the Host and the Microbiome ...................................... 50
Results ........................................................................................................................................ 51
Significantly Altered OTUs ..................................................................................................... 52
Metagenome Predictions ....................................................................................................... 56
Significantly Altered Pathways in Psoriasis Microbiome ....................................................... 60
Orthologous Genes that are Commonly Altered between Host and the Microbiome.......... 60
Altered KEGG Pathway Expression for Bacterial Invasion of Epithelial Cells in Relation to
Skin Disease Host Genes ........................................................................................................ 61
Discussion .................................................................................................................................. 63
Specific Aim III: Positive Selection Signals in Psoriasis ................................................................... 67
Introduction ............................................................................................................................... 67
Methods ..................................................................................................................................... 70
Identifying Gene Lists ............................................................................................................. 70
Obtaining Population Level Data ........................................................................................... 71
Population Differences .......................................................................................................... 72
Polymorphism Annotations ................................................................................................... 73
Results ........................................................................................................................................ 73
Functional Annotation of the HLA Region ............................................................................. 74
Allele Frequency Distributions of HLA sub-Region ................................................................ 76
Polymorphisms on the HLA that are Under Positive Selection .............................................. 77
Discussion .................................................................................................................................. 82
Conclusions .................................................................................................................................... 85
Future Work ................................................................................................................................... 89
Bibliography ................................................................................................................................... 90
Appendices ..................................................................................................................................... 99
Appendix A ................................................................................................................................. 99
Appendix B ............................................................................................................................... 100
Appendix C ............................................................................................................................... 101
Curriculum Vitae .......................................................................................................................... 104

7
List of Tables
Table 1 Summary of skin condition transcriptome datasets obtained from NCBI GEO database
obtained before January 1st 2014. The numbers of control (C), active uninvolved (U) and active
lesion (A) skin biopsy samples are presented for each dataset. Only the skin biopsies are
included in this study. Inclusion criteria such as age, severity of the condition and treatment
status are also included. The samples are hybridized onto Affymetrix HGU133+2 platform with
the exception of GSE63741 dataset which is hybridized onto PIQOR Skin 2.0 Microarray. a For the
Merkel cell carcinoma dataset, U stands for tumor biopsies that tested negative for MCPyV and
A stands for tumor biopsies that tested positive for MCPyV. b For the wound healing dataset, C
stands for acute wound; U stands for biopsy at day 3 of healing process; and A stands for biopsy
at day 7 of healing process………………………………………………………………………………………………………25
Table 2 Gene signatures obtained from host microarray dataset comparisons. A: Active, U:
Uninvolved, C: Control; UP: upregulated; DWN: downregulated. The numbers in the table
indicate the number of genes with significantly altered expression in a comparison. The numbers
of consensus genes for multiple Affymetrix datasets in the same comparison are shown in bold.
All the datasets except for GSE63741 have been hybridized onto Affymetrix HGU 133 Plus 2 chip.
Grey boxes indicate comparisons for which transcriptome data did not exist…………………………..30
Table 3 Common significant enrichments (Benjamini<0.01) between datasets hybridized onto
PIQOR and Affymetrix platforms. The values represent the percentage of significant genes
within the corresponding term. Up: upregulated genes, down: downregulated genes, KEGG:
Kyoto Encyclopedia of Genes and Genomes, GO: Gene Ontology, BP: Biological Process, MF:
Molecular Function…………………………………………………………………………………………………………………..40
Table 4: The number of distinct tissue samples with 16S rRNA sequence datasets presented by
the Human Microbiome Project (HMP) and American Gut Project (AGP). The 16S rRNA
sequence reads obtained from skin swabs of active psoriasis lesions, uninvolved contralateral
skin from psoriatic patients and subjects that don't have any skin conditions (Control) were
included in the analysis. The remaining samples used for further analysis after quality control
steps (Usable Samples) as well as the total number of samples in the dataset before the quality
control step (Total) are reported………………………………………………………………………………………………47
Table 5 Average Nearest Sequenced Taxon Index (NSTI) for the microbiome datasets based on
the phylogenetic distance for each organism in the OTU tableto its nearest relative sequenced
reference genome. All values were within an acceptable range for accurate prediction…………..56

8
Table 6 KEGG pathways that have significantly different (P<0.01) abundance levels in psoriasis
microbiome compared to controls calculated with PICRUST. The significance was only observed
in the microbiome comparisons between uninvolved skin (U) and healthy controls (C). The table
shows for each listed KEGG pathway, the p value calculated using the Mann-Whitney U test and
the abundance fold changes……………………………………………………………………………………………………59
Table 7: Significantly over- and under-represented genes in psoriasis in the host and the
microbiome for the A/C and A/U comparisons (p<0.01 for host and p<0.05 for microbiome).
No commonalities were observed for the U/C comparison. The table reflects the fold changes of
the commonly altered genes in the microbiome and the host, and p values resulting from Mann-
Whitney U test. A: Active involved skin, U: Active uninvolved skin, C: control skin, FC: fold
change………………………………………………………………………………………………………………………………………60
Table 8: The HLA region coordinates on chromosome 6 partitioned according to their
functional class annotations as described in Shiina et al. The coordinates are based on the hg19
build of the genome. The number of SNPs included in the phased genotypes of the HapMap
populations as well as the number of phased SNPs that have ancestral annotations according to
the EPO pipeline. ……………………………………………………………………………………………………………………..70
Table 9: Kyoto Encyclopedia of Genes and Genomes (KEGG) pathways that are enriched with
all HLA genes and sub-classes of genes. The terms are significant (Benjamini < 0.01) in at least 1
gene list. The terms are listed as most commonly enriched to region specific terms. The values
represent the ratio of genes in the term that overlap with the gene list. The cells that are left
blank signifies that the corresponding term is not enriched for that gene list. There were no
terms enriched for extended class II region, hence its corresponding column is not shown………74
Table 10: Diseases that are associated with the genes under positive selection (iHS Benjamini <
0.01) in at least one HapMap population. The diseases associated with the gene under positive
selection are separated as autoimmune, infection, inherited, cancer and other. Genes are sorted
according to their genomic positions. The associated diseases are obtained through the
MalaCards database.…………………………………………………………………………………………………………………80

9
List of Figures
Figure 1 Flowchart of microarray analysis steps. The raw microarray samples are downloaded
and normalized. Significant genes are obtained through statistical analysis and processed though
functional annotation datasets..……………………………………………………………………………………………….29
Figure 2 Soerensen Coefficient for Pairs of Comparisons. Soerensen similarity coefficient
calculated for the a) 200 upregulated and b) 200 downregulated genes with the highest fold
change for each pair of gene signatures. Coefficient ranges in value from 0 (no overlap, shown in
black) to 1 (perfect overlap, shown in white). The conditions under study are as follows:
psoriasis (PS), atopic dermatitis (AD), allergic contact dermatitis (ACD), Merkel cell carcinoma
(MCC) and wound healing (WND). A: Active involved, U: active uninvolved, C: healthy control
samples……………………………………………………………………………………………………………………………………31
Figure 3 Top genes in psoriasis signature and the corresponding log 2 transformed fold
changes in all comparisons. The upregulated genes are indicated with shades of red and the
downregulated genes are indicated with shades of blue. The genes with epidermal
differentiation complex (EDC), antimicrobial and lipid processing functions are marked in black.
PS: psoriasis, AD: atopic dermatitis, ACD: allergic contact dermatitis, SA: sarcoidosis, MCC:
Merkel cell carcinoma, WND: wound healing. A: Active involved, U: active uninvolved, C: healthy
control samples…………………………………………………………………………………………………………………………33
Figure 4 Significantly upregulated (pink) and downregulated (blue) KEGG pathways
(Benjamini<0.05) of the psoriasis microarray datasets of the host. The width of each slice is
proportional to the ratio of significant genes in the pathway. The pathways are categorized
according to KEGG-BRITE hierarchy (inner circle). Pathways significantly altered in other skin
conditions are marked outside of the corresponding pathway slices. PS:psoriasis, AD:atopic
dermatitis, ACD:allergic contact dermatitis, MCC:Merkel cell carcinoma, WND:wound healing..35
Figure 5 Number of genes that are common between the consensus psoriasis gene signatures
(A/C/ and A/U) and wound healing gene signatures (A/C and U/C) for a) upregulated and b)
downregulated genes. The genes in the color coded regions have been annotated with GP-BP
Level 5 terms. The top 5 enrichments are reported in their corresponding colored boxes. The
colored regions that don’t have associated annotations provided did not have any significant
enrichments (Benjamini < 0.01). ………………………………………………………………………………………………37

10
Figure 6 Psoriasis (A/C, A/U) and wound (A/C, U/C) upregulated genes (Benjamini<0.01 and
fold change>1.5) overlapped with the KEGG pathway cytokine-cytokine receptor interaction
pathway. The cytokines that are commonly upregulated as well as the ones that are exclusive to
one conditions can be seen. PS_AC: psoriasis A/C consensus gene signature, PS_AU: psoriasis
A/U consensus gene signature, WND_AC: wound healing reconstructive stage gene signature,
WND_UC: wound healing inflammatory stage gene signature………………………………………………….38
Figure 7 Flowchart of microbiome analysis steps. The 16S rRNA sequence reads were
downloaded, passed through quality control steps and assigned to OTUs. The metagenome was
predicted through PICRUST package. ……………………………………………………………………………………….51
Figure 8: Average bacterial phylum level abundance of microbiome in patients with psoriasis
and healthy controls from different body sites. Actinobacteria, Firmicutes and Proteobacteria
dominate the phyla in each body site. ……………………………………………………………………………………..52
Figure 9 Bacterial class level abundance of microbiome in patients with psoriasis and healthy
controls for only the elbow samples based on the Human Microbiome Project data. Bacterial
classes that have more than 10% abundance in more than 1 sample were labeled in the bar
graph. The rest of the classes are categorized as “other”. The classes that are shown were
annotated with their phylum memberships..…………………………………………………………………………….52
Figure 10: The OTUs significantly altered (Benjamini<0.05) in psoriasis lesions compared to
healthy controls in the human skin microbiome for the pooled samples from all body sites. All
the OTUs were lower in abundance in psoriasis lesions. The OTUs that are statistically significant
(q<0.05) for the non-singleton body sites (elbow, knee, back, leg, forearm) are labeled with red
stars.…………………………………………………………………………………………………………………………………………54
Figure 11: The OTUs significantly altered (p<0.01) in psoriasis lesions compared to healthy
controls in the human skin microbiome. The nodes are labeled with Green Genes OTU
numbers, the phyla, and the most specific level of categorization that is available with the OTUs
such as species (s), genus (g) and family (f). The abundance perturbations are noted with an up
pointing arrow for higher abundance in psoriasis and down pointing arrow for lower abundance
OTUs. The colors represent the body site where the OTU is significant (red:elbow, blue:knee)..55
Figure 12 the orthologous genes that are consistently altered in the microbiome comparisons.
The values represent the log2 transformed fold changes of the metagenome predicted through
PICRUST software package. The high abundance genes are indicated with shades of red and the
low abundance genes are indicated with shades of blue………………………………………………………….58

11
Figure 13 Bacterial invasion of epithelial cells KEGG pathway annotated with the up and
downregulated gene signatures for psoriasis. The genes targeted by bacteria (blue) and viruses
(red) obtained from PHISTO database are indicated with lines under the gene boxes/ The
virulence factors obtained from VfDB database are indicated with red stars. The over and
underrepresented microbial genes obtained from metagenome analysis of the psoriasis
microbiome are marked with red arrows. PS: psoriasis, up: upregulated genes, down:
downregulated genes, target_bac: bacterial target, target_vir: viral target………………………………61
Figure 14 Flowchart of the analysis shows the steps taken to obtain the SNPs that are under
positive selection in the HLA region for each population as well as identifying the SNPs that have
significantly different population histories…………………………………………..……………………………………73
Figure 15: Heatmaps of pairwise SNP allele frequency distribution comparisons using the
Kolmogorov-Smirnov (KS) test for each cluster. The values represent the -log10 of the Benjamini
FDR corrected KS-test p values. The comparisons that are not significant (Benjamini>0.05) are in
black.………………………………………………………………………………………………………………………………………..76
Figure 16: Superposition of –log10 of the Benjamini corrected iHS p-values of all HapMap
populations along the HLA region. The horizontal red line represents cutoff for significance
(Benjamini<0.01). Class I region shows evidence of positive selection with European (CEU, TSI)
specificity, non-specific ethnic background positive selection in Class III, African (LWK, YRI)
specificity in the Class II region and no positive selection in extended Class II region………………..78
Figure 17: The SNPs with significantly different evolutionary backgrounds between at least
two populations belonging to different geographical regions (Benjamini<0.01). The
standardized ratio of integrated site-specific EHH from pairwise populations (Rsb) on the HLA
region were calculated. Each box represents a gene annotated with the SNPs that have
significantly different evolutionary backgrounds. The genes are labeled with the HLA sub-regions
they belong to.………………………………………………………………………………………………………………………….79

12
Abstract
Psoriasis: A Study of the Skin Transcriptome and Microbiome
Ceylan Ece Tanes
Aydin Tozeren, PhD
Psoriasis is a complex autoimmune skin disorder characterized by dry, scaly plaques and painful
flares. Even though genetic contribution and environmental factors are suspected, the exact
trigger of psoriasis is not well understood. The chronic condition of the disease and the lack of
effective and definitive treatments are burdens on the patients. Recent emergence of
transcriptome and genomic datasets for the host, as well as the taxonomic datasets for the
microbiome has enabled the use of bioinformatics approaches to investigate altered gene
circuits in psoriasis.
As a first step, open source microarray datasets of psoriasis were analyzed in context of other
skin conditions. The analysis showed that upregulated genes in the psoriasis transcriptome
included those involved in epidermal differentiation complex and antimicrobial processes, while
the top downregulated genes were involved in lipid metabolism. The Kyoto Encyclopedia of
Genes and Genomes (KEGG) pathways that were enriched with significantly altered genes point
to the upregulation of both innate and adaptive immune responses. The psoriasis gene
signature was distinctive from other inflammatory skin conditions and it resembled the wound
healing process in terms of keratinization and immune response signals.

13
On the microbiome side, over-abundance of opportunistic bacteria on the psoriasis microbiome
was observed compared to controls. Virulence genes were consistently in high abundance
across different body sites. Bacterial invasion of epithelial cells gene pathway was crowded with
both significantly altered genes on the host side and high-abundance orthologs on the
microbiome side. The findings suggested bacterial involvement in the initiation or maintenance
of psoriasis flares.
Genetic components also play a role in susceptibility to psoriasis. Human Leukocyte Antigen
(HLA) is one of the regions that has previously been associated with psoriasis through Genome
Wide Association studies. The Single Nucleotide Polymorphisms (SNPs) typed in the HapMap
dataset (11 ethnic populations) within the HLA region have been analyzed using extended
haplotype homozygosity based tests to identify positive selection on polymorphisms that have
not yet reached fixation. Results showed regional specificity of positive selection signals on the
sub-classes of HLA. The positive selection signals in Class I sub-region showed European ancestry
specificity with intronic SNPs on a psoriasis related gene PSORS1C1 as well as on TCF19, MUC22,
TRIM10, and TRIM15. The region specific selection signals were also seen in the Class III region
for the East Asian populations and in the Class II region for African ancestry populations. Similar
to single population tests, the cross population tests showed that the significant SNPs were
concentrated in the Class II region for African ancestry populations, whereas for European
ancestry populations, they were concentrated in the Class I region. The results show how
positive selection of a SNP can encourage genetic hitchhiking of the susceptibility SNPs for a
disease along with a SNP that is under positive selection.

14
This research thesis bridges large scale transcriptome datasets of the host and operational
taxonomy unit abundance datasets of the microbiome, opening up new avenues for drug
repositioning studies by pointing out specific host-microbiome genes as drug targets.

15
Introduction
Motivation
This research is dedicated to investigating psoriasis as a complex disease through gene
expression, microbiome, and genetic susceptibility analysis. Although the literature contains
psoriasis research using these approaches individually, the bridge between the three
perspectives is still lacking. There is hence a need to integrate between multiple microarray
datasets to investigate psoriasis in the broad spectrum of skin conditions and bridging them with
microbiome functional perturbations. The combination of the results from the two analyses can
provide a comprehensive perspective of the cross-talk between host and the microbiome.
Furthermore the genomic aspect of psoriasis can be identified by positive selection regions in
the highly disease and psoriasis associated HLA region.
Psoriasis has an extensive number of open source datasets available for meta-analysis, however
the datasets that have been curated for this study for both microarray and microbiome will
continue to expand over time. Therefore, the methodology and approach described in this
thesis will have the ability to incorporate new datasets and study other autoimmune conditions
as they become available in the future.
16
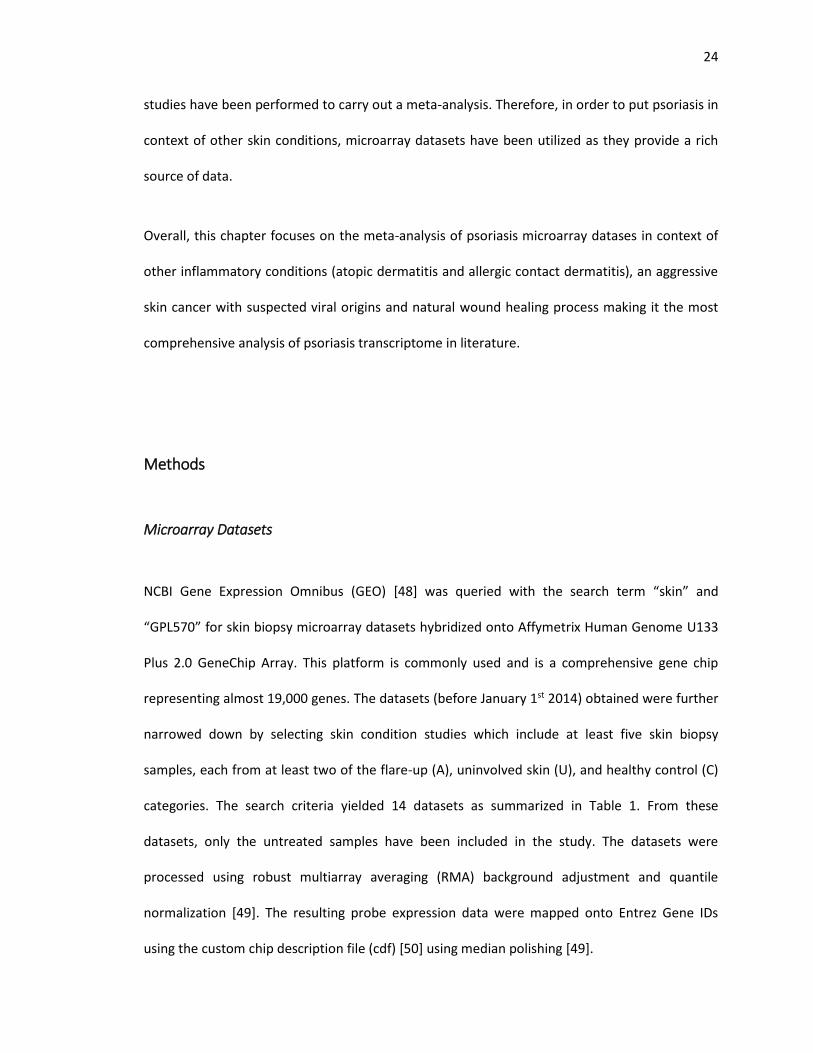
Background Information
Skin Disorders and Psoriasis
Autoimmune disorders currently affect 5% of the Western population and are on the rise, with
more than seventy subtypes [1]. Current drugs on the market prescribed to manage
autoimmune diseases are of the anti-inflammatory type used primarily to subdue the symptoms
and does not provide complete treatment. These disorders are hypothesized to arise when the
immune system reacts to self, in addition to non-self antigens through the relaxation of negative
selection for T-cells and B-cells. This results in the accumulation of clones that recognize major
histocompatibility complex (MHC) molecules. The resulting inflammation damages and can
eventually destroy the affected tissues [2]. In our lab, inflammatory bowel disease has been
extensively studied using transcriptome data to provide a deeper understanding of autoimmune
disease mechanisms [3].
The skin is an organ commonly affected by autoimmune conditions, either as the primary target
such as psoriasis, atopic dermatitis, and allergic contact dermatitis, or through secondary
manifestations such as dermatomyositis or sarcoidosis. Due to their chronic nature, they have
negative effects on the quality of life of the patient in terms of economic burden, pain
management, social discrimination, and mental status [4, 5].
Among the skin related autoimmune conditions, psoriasis has a 1.4 – 3% prevalence across
Europe and the United States [6]. It is a chronic inflammatory condition in which the
keratinocytes proliferate and differentiate resulting in skin thickening [7]. Even though the exact
trigger for psoriasis is not fully understood, genetic disposition [8] and environmental conditions

17
[9] are known risk factors. Psoriatic patients (approximately 70%) have a peak onset between
the ages of 16-22 [10]. The symptoms for psoriasis can be alleviated with anti-inflammatory
drugs, topical treatments, and dietary regimen [11, 12]. Psoriasis treatment adherence is
challenging due to concerns regarding long-term safety and drug efficacy [6]. The chronic nature
of the disease calls for life-long maintenance and high healthcare cost [13]. Approximately 20%
of patients with psoriasis are also diagnosed with psoriatic arthritis within a decade of initial
diagnosis [6]. Comorbidities including cardiovascular conditions [14, 15], psoriatic arthritis [16],
type II diabetes [17], and inflammatory bowel disease [18] cause additional long term physical
and economical strain for the patient [19].
In order to study psoriasis, high throughput technologies are required to understand the
complex and multi-level nature of the disease. Microarray technologies that quantify the
amount of mRNA in the samples are used to observe gene expression changes in the
hyperproliferating keratinocytes in the context of other skin conditions. SNPchip microarrays are
used to detect the polymorphisms in different populations. The genotypes can be utilized to
better understand the susceptibility differences observed across populations. Finally, high
throughput sequencing technologies are useful in confirming suspected microbiome
contributions to the psoriasis phenotype. Understanding the pathology of psoriasis through
transcriptomic and genomic datasets will aid in creating better, more effective treatments to
increase patient quality of life and decrease associated life-long economic burdens.
DNA Microarrays
DNA microarrays are high throughput technologies to detect the relative concentration of
nucleic acid sequences that are extracted from a sample of interest. In DNA microarrays, short

18
nucleic acid sequences, called probes, are bound to a platform. They rely on DNA base pairing
between the probes and the tested sequences. Relative concentrations are calculated from
fluorescent labeling techniques. This technology has been used for manufacturing high
throughput gene expression, transcription binding, and genotyping platforms [20].
Gene expression levels in a sample are detected using mRNA microarrays. One of the major
companies that produce microarrays is Affymetrix. Their core technology identifies and
synthesizes species specific 25 nucleotide length oligonucleotide sequences onto the microarray
platform surface. The RNA segments extracted from the samples of interest are processed and
labeled with fluorescent markers. The microarray platform is washed with the extracted
sequences to promote hybridization and fluorescence intensities are subsequently quantified by
confocal microscopy. The intensities correlate directly to corresponding gene expression levels
[20].
The single nucleotide polymorphism genotyping platforms manufactured by Affymetrix rely on a
similar method where pairs of oligonucleotides are used to represent the alleles on the genome.
Each pair of oligonucleotides differ at only one position in the middle of the sequence that
represent the two alleles of a SNP. The DNA is extracted from the samples, labeled with
fluorescent markers, and hybridized onto the platform synthesized with the oligonucleotides.
The image that is captured from the fluorescent labeling can then determine if the sample of
interest is homozygous in one of the two alleles or heterozygous.
Both the expression and genotyping arrays have been utilized in this research to understand the
psoriasis phenotype. The expression arrays have been utilized to detect mRNA perturbations in

19
psoriasis skin. Genotype data from the HapMap project [21] have been used to discover the
genetic contribution to the susceptibility differences observed in psoriasis.
Sequencing Technologies
Since the draft of the human genome in 2001, sequencing technologies have improved to
provide more sequence reads per run at a significantly lower cost. This has paved the way for
large scale efforts such as the 1000 Genomes Project [22] and Human Microbiome Project [23].
Through these efforts, genomes of bacteria and model organisms have been decoded. Besides
genomic characterization of organisms in their healthy state, sequencing technologies have also
made it possible to depict disease states. Various projects have been funded such as decoding
the genome of cancer patients [24] and sequencing the microbiome communities of patients
with autoimmune disorders [25]. Whereas microarrays can only test for what they are designed
to detect, sequencing allows for the detection of less annotated regions of the genome and can
therefore be used to detect novel biomarkers [26].
Current sequencing technologies follow the same essential steps with slight variations
depending on the manufacturer. First, adapters are ligated at the ends of the DNA fragments to
be sequenced. The fragments are then amplified on a solid surface such as a glass slide or a
microbead by a polymerase mediated process. The nucleotides that are added are detected
automatically using fluorescence. The detection procedure varies for different technologies and
ranges from measuring bioluminescent signals to four-color imaging of single molecular events
[26, 27].

20
One application of sequencing technologies is for detecting the bacterial composition of an
environment by sequencing 16S ribosomal RNA. 16S rRNA is a component of the ribosome that
is present in every organism. It is made up of conserved regions that can be selectively targeted
during sequencing, but it is also composed of variable regions ideal for differentiating between
organisms. Depending on the capabilities of the technology used, sequencing one or more of the
variable regions makes it possible to record the bacterial composition of an environment when
mapped against a 16S library. To date 16S sequencing has been utilized to categorize bacteria
into their appropriate taxonomy using sequence similarity instead of phenotypic traits. It has
also been used to identify novel bacterial species and diagnose culture negative infections [28].

21
Specific Aim I: Analyzing Psoriasis Transcriptome
The primary aim of this chapter is to uncover statistically significant gene expression alterations
in psoriasis lesions compared to uninvolved skin and healthy controls. My hypothesis is that the
meta-analysis of multiple psoriasis microarray datasets will aid in generating a robust gene
expression signature for psoriasis. Psoriasis will likely share gene expression markers with other
inflammatory skin conditions, while having a set of distinct genes that can be used as
biomarkers. Higher level functional annotations of skin conditions will provide similarities
between the conditions pointing to common inflammatory responses in the skin conditions of
interest.
Introduction
Psoriasis is a complex inflammatory condition characterized by keratinocyte hyperproliferation,
epidermal differentiation, and immune cell infiltration [7]. It has also been defined as aberrant
wound healing due to uncontrolled thickening of the epidermis [29]. To understand the disease
as a whole, a systemic approach using microarray expression analysis of psoriasis lesions in
context with other skin conditions is necessary.
Various microarray studies have been conducted to investigate the lesional and non-lesional
psoriasis expression profiles compared to healthy controls. Inflammatory signatures altered in
psoriasis lesions have been identified such as TNF-alpha, IFN-gamma signaling [30], and Th17
immune response [31]. Among the genes that have psoriasis associated SNPs positioned on

22
them, the highest expression was seen in neutrophils, signifying a genetic component for the
inflammatory response [32]. Meta-analysis of the psoriasis microarray datasets revealed that
the gene signature is most consistent within the same microarray platform [33, 34]. The studies
selected in this chapter were hybridized onto the widely used and comprehensive Affymetrix
HGU133+2 microarray platform. The results were later compared to a study hybridized onto
PIQOR platform for validation.
Since psoriasis only effects humans and primates [35], animal models have not been insightful
on the full spectrum of the disease. Comparing microarray gene signatures of human psoriasis
biopsies and mouse disease models showed that even though there are expression similarities
between the progression of the disease in terms of keratinization and epidermal differentiation,
each mouse model had slight variations on psoriasis inflammatory signatures [36]. In general,
there have been conflicting studies on the correlation of mouse and human inflammatory
signatures [37, 38]. In order to evaluate the most genuine representation of psoriasis flares, this
chapter will only focus on the expression profiles of human skin biopsies.
Psoriasis and atopic dermatitis are the two most common autoimmune skin conditions. Small
inflammatory expression differences could be observed between psoriasis and atopic dermatitis
[39]. Meta-analysis of psoriasis, atopic dermatitis, nickel allergy, and acne transcriptome
signatures showed a unifying gene signature that was T cell mediated but with different sets of
chemokines upregulated for each condition [40, 41]. For example, while psoriasis was Th17
mediated, atopic dermatitis was Th2 mediated. However they both had neutrophil
chemoattractant expressions in common [39]. The results were further confirmed with a
microarray study including five inflammatory skin conditions where IL-17 and TNF-alpha signals
were exclusively predominant in psoriasis lesions [42]. Among the comparative studies in

23
literature, a microarray meta-analysis of multiple skin conditions is needed to reach a unifying
conclusion about the commonalities and differences between psoriasis and other skin
conditions.
Wound healing is significantly accelerated in patients with psoriasis compared to healthy
controls [43]. The two conditions also show similarities with respect to increased keratinocyte
proliferation and differentiation. During wound healing, chemoattractants are released to
regulate neutrophils and IL-8 is essential in re-epithelialization signaling [44]. Due to their
similarities, when gene targets and biomarkers are selected for psoriasis, it is crucial to analyze
wound healing transcriptome alongside of inflammatory skin conditions to differentiate
between which altered genes are beneficial for the organism to heal wounds and the genes that
result in an aberrant wound healing response such as psoriasis.
Merkel cell carcinoma is an aggressive cutaneous cancer with mortality rate greater than 30%. It
has been observed that 75% of Merkel Cell carcinomas contain Merkel cell polyomavirus. Clonal
integration of the virus to the host cells implicates viral origins of the cancer [45]. Psoriasis and
atopic dermatitis are autoimmune conditions that have suspected bacterial involvements [46].
Therefore the Merkel Cell carcinoma dataset was included in the analysis even though the
pathology of the disease varies from autoimmune definition.
Since the development of microarray technologies, sequencing has become cheaper and
available, making way for high-throughput complementary DNA sequencing (RNA-seq) as an
alternative to microarray studies. RNA-seq study by Bingshan et al. has expanded the psoriasis
transcriptome, especially in the immune system process [47]. Even though RNA-seq data would
provide a more sensitive analysis of the expression profiles of skin conditions, not enough
24
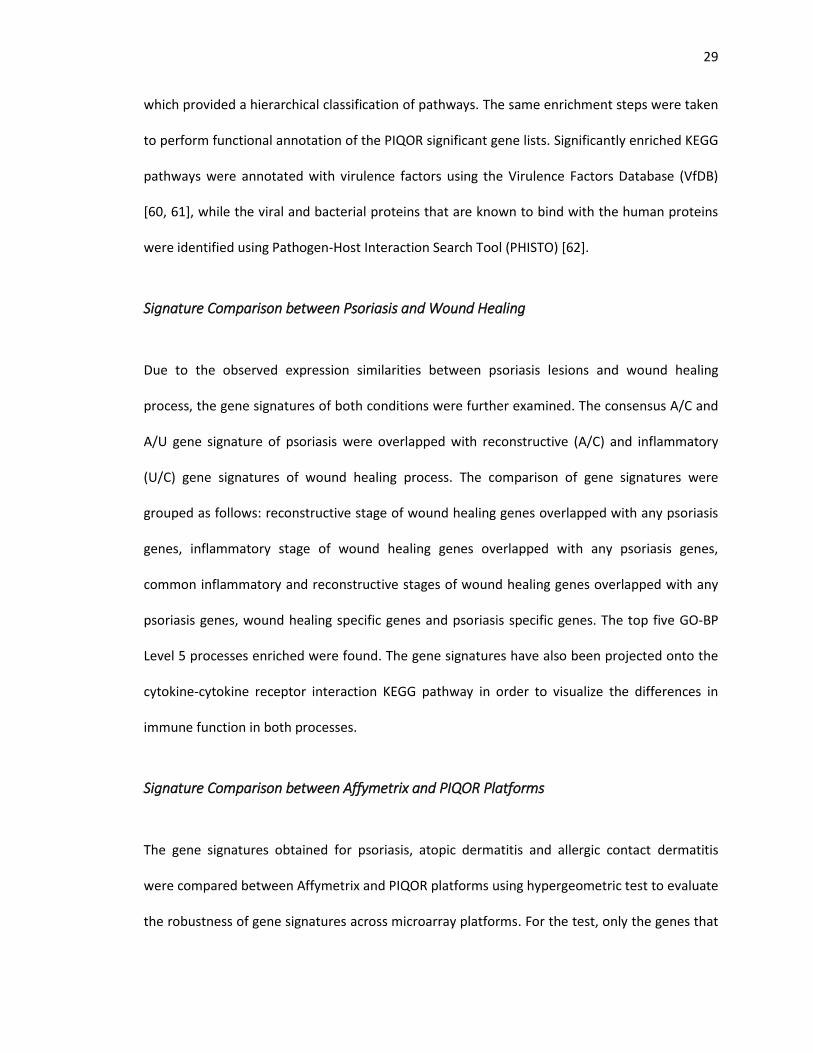
studies have been performed to carry out a meta-analysis. Therefore, in order to put psoriasis in
context of other skin conditions, microarray datasets have been utilized as they provide a rich
source of data.
Overall, this chapter focuses on the meta-analysis of psoriasis microarray datases in context of
other inflammatory conditions (atopic dermatitis and allergic contact dermatitis), an aggressive
skin cancer with suspected viral origins and natural wound healing process making it the most
comprehensive analysis of psoriasis transcriptome in literature.
Methods
Microarray Datasets
NCBI Gene Expression Omnibus (GEO) [48] was queried with the search term “skin” and
“GPL570” for skin biopsy microarray datasets hybridized onto Affymetrix Human Genome U133
Plus 2.0 GeneChip Array. This platform is commonly used and is a comprehensive gene chip
representing almost 19,000 genes. The datasets (before January 1st 2014) obtained were further
narrowed down by selecting skin condition studies which include at least five skin biopsy
samples, each from at least two of the flare-up (A), uninvolved skin (U), and healthy control (C)
categories. The search criteria yielded 14 datasets as summarized in Table 1. From these
datasets, only the untreated samples have been included in the study. The datasets were
processed using robust multiarray averaging (RMA) background adjustment and quantile
normalization [49]. The resulting probe expression data were mapped onto Entrez Gene IDs
using the custom chip description file (cdf) [50] using median polishing [49].

25
The microarray dataset GSE63741 hybridized onto PIQOR Skin 2.0 platform was also included in
the analysis due to its extensive coverage of inflammatory skin conditions [42]. The dataset
represented 30 samples each from healthy controls, as well as psoriasis, atopic dermatitis, and
allergic contact dermatitis patients. In this chapter the dataset has been used to compare the
robustness of expression profiles across platforms as well as validate the gene signatures
obtained for each skin condition. The normalized expression values for the dataset were
downloaded from NCBI GEO [48] for further processing.
Gene Signatures of the Host
For the Affymetrix datasets, gene signatures were obtained for the following comparisons:
active involved versus active uninvolved samples (A/U), active involved versus healthy controls
(A/C), and active uninvolved versus healthy controls (U/C). Lists of significantly upregulated and
downregulated genes were obtained for each comparison using (a) Significance Analysis of
Microarray (SAM) [51] and (b) Rank Product (RP) method [52]. Significant gene lists determined
from the analyses had a q-value cutoff of 0.01 and fold change cutoff above 1.5. The
intersection of the SAM and RP tests were considered as the gene signature for a given
comparison in a single dataset. A consensus gene list was obtained with rth ordered p-value
meta-analysis method [53] over multiple datasets by finding the genes that are significant in
more than half of the datasets.

26
GSE # Condition Publication C U A Age Treatment Criteria for Eligibility
Severity Biopsy diameter
14905 Psoriasis Yao et al., 2008 21 28 33 - - moderate to severe -
13355 Plaque Psoriasis
Swidell et al., 2009 64 58 58 21-69 (PS) 18-45 (C)
No systemic treatments 2 weeks prior, no topical treatments 1 week prior to study
≥1% of body effected
6 mm
34248 Plaque Psoriasis
Bigler et al., 2013 0 14 14 19-55 No treatment moderate to severe ≥10% of body effected PASI ≥10
5 mm
41663 Plaque Psoriasis
Bigler et al., 2013 0 15 15 19-55 No treatment moderate to severe ≥10% of body effected PASI ≥10
-
41662 Plaque Psoriasis
Bigler et al., 2013 0 24 24 19-55 No treatment moderate to severe ≥10% of body effected PASI ≥10
6 mm
30999 Plaque Psoriasis
Suarez-Farinaz et al, 2012.
0 85 85 -
No systemic treatments 4 weeks prior, no topical treatments 2 weeks, no biological agent 3 months prior to study
moderate to severe ≥10% of body effected
4 mm
63741 Plaque Psoriasis
D’Erme et al., 2015 30 0 30 - No treatment - -
32924 Atopic dermatitis
Suarez-Farinaz et al., 2011
8 12 13 16-81 No treatment 4 weeks prior to study
SCORAD 28-97.5 11-63% of body effected
-
36842 Atopic dermatitis
Gittler et al., 2012 15 8 16 20-67 No treatment 4 weeks prior to study
SCORAD 40-63 -
27887 Atopic dermatitis
Tintle et al., 2011 0 8 9 24-51 Patients allowed to use emollients
SCORAD 28-97.5 4-6 mm

27
16161 Atopic dermatitis
Guttman-Yassky et al, 2009.
9 0 9 28-54 (AD) 24-69 (C)
No treatment 4 weeks prior to study
SCORAD 20-70 -
63741 Atopic dermatitis
D’Erme et al., 2015 30 0 30 - No treatment - -
6281 Allergic contact dermatitis
Pedersen et al., 2007
16 9 9 33-49 (ACD) 31-55 (C)
No immunosuppressants during study
At least 2+ reaction to 5% nickel sulfate
4 mm
63741 Allergic contact dermatitis
D’Erme et al., 2015 30 0 30 - No treatment - -
39612a Merkel cell carcinoma
Harms et al., 2013 64 16 19 59-88 - Stage I-III -
28914b Wound healing
Nuutila et al., 2012 6 6 5 20-75 NA NA 3 mm
Table 2 Summary of skin condition transcriptome datasets obtained from NCBI GEO database obtained before January 1st 2014. The numbers of control (C), active uninvolved (U) and active lesion (A) skin biopsy samples are presented for each dataset. Only the skin biopsies are included in this study. Inclusion criteria such as age, severity of the condition and treatment status are also included. The samples are hybridized onto Affymetrix HGU133+2 platform with the exception of GSE63741 dataset which is hybridized onto PIQOR Skin 2.0 Microarray. a For the Merkel cell carcinoma dataset, U stands for tumor biopsies that tested negative for MCPyV and A stands for tumor biopsies that tested positive for MCPyV. b For the wound healing dataset, C stands for acute wound; U stands for biopsy at day 3 of healing process; and A stands for biopsy at day 7 of healing process.

28
The average rank of a significant gene for a given comparison was calculated based on the SAM
fold changes in order to find the set of consistently upregulated and downregulated genes
across multiple datasets of a condition. The top 25 genes from the significantly upregulated and
downregulated psoriasis ranked sets were used as biomarker genes and their functional
memberships were further characterized. The fold changes were clustered using hierarchical
clustering to determine if the genes can be used to distinguish psoriasis from other skin
conditions.
The expression values of the disease samples hybridized onto PIQOR platform were compared
against the control samples using SAM and RP methods in order to get significantly altered
genes with a Benjamini cutoff of 0.01 and fold change cutoff of 1.5. The overlap of the two
methods composed the disease profiles for the PIQOR platform, consistent with the steps taken
to analyze Affymetrix datasets.
Functional Analysis of Gene Signatures
The pair wise gene signature intersections were quantified with Soerensen coefficient
(SC=2∥A∩B∥/(∥A∥+∥B∥), where A and B are two separate sets) [54] to test the similarity
between different conditions as well as the consistency between the datasets of the same
condition. The Bioconductor GOstats package [55] was used for statistical enrichment of Gene
Ontology Biological Process (GO-BP) [56] and the Kyoto Encyclopedia of Genes and Genomes
(KEGG) pathways [57] in consensus signatures. The p-values were corrected with the Benjamini-
Hocheberg method [58] to account for false discovery. The representative condition
enrichments were obtained by assigning the smallest identified p-value from the three
comparisons (A/C, A/U, U/C). KEGG pathways were mapped into their BRITE categories [59],
29
which provided a hierarchical classification of pathways. The same enrichment steps were taken
to perform functional annotation of the PIQOR significant gene lists. Significantly enriched KEGG
pathways were annotated with virulence factors using the Virulence Factors Database (VfDB)
[60, 61], while the viral and bacterial proteins that are known to bind with the human proteins
were identified using Pathogen-Host Interaction Search Tool (PHISTO) [62].
Signature Comparison between Psoriasis and Wound Healing
Due to the observed expression similarities between psoriasis lesions and wound healing
process, the gene signatures of both conditions were further examined. The consensus A/C and
A/U gene signature of psoriasis were overlapped with reconstructive (A/C) and inflammatory
(U/C) gene signatures of wound healing process. The comparison of gene signatures were
grouped as follows: reconstructive stage of wound healing genes overlapped with any psoriasis
genes, inflammatory stage of wound healing genes overlapped with any psoriasis genes,
common inflammatory and reconstructive stages of wound healing genes overlapped with any
psoriasis genes, wound healing specific genes and psoriasis specific genes. The top five GO-BP
Level 5 processes enriched were found. The gene signatures have also been projected onto the
cytokine-cytokine receptor interaction KEGG pathway in order to visualize the differences in
immune function in both processes.
Signature Comparison between Affymetrix and PIQOR Platforms
The gene signatures obtained for psoriasis, atopic dermatitis and allergic contact dermatitis
were compared between Affymetrix and PIQOR platforms using hypergeometric test to evaluate
the robustness of gene signatures across microarray platforms. For the test, only the genes that

30
are represented on both platforms have been considered. The KEGG, GO-BP and GO-MF
enrichments (Benjamini < 0.01) of the gene signatures obtained from both platforms were also
compared.
Results
Fourteen publicly available microarray datasets were analyzed for the host consisting of 977
samples (Table 1). Each skin condition included samples from healthy controls (C), active
uninvolved (U), and active involved (A) stages. Transcriptome datasets for five different skin
conditions were utilized: psoriasis (PS) [19, 30, 34, 36], atopic dermatitis (AD) [63-66], allergic
contact dermatitis (ACD) [67], Merkel cell carcinoma (MCC) [68], and wound healing (WND) [69].
Figure 1 Flowchart of microarray analysis steps. The raw microarray samples are downloaded and normalized. Significant genes are obtained through statistical analysis and processed though functional annotation datasets.

31
Host Gene Signatures for Skin Diseases
The microarray datasets shown in Table 1 were normalized and analyzed as described in
Methods and summarized in Figure 1. The numbers of significant genes obtained for each
microarray dataset, as well as the consensus signatures over all datasets for a given disease are
shown in Table 2. Psoriasis signatures were highly similar across the six datasets yielding 801
consensus upregulated and 578 downregulated genes in active/control (A/C) comparison among
the 18,959 genes on the microarray chip. MCC had the largest significant gene list, a common
feature of signatures associated with cancer [70].
A/C A/U U/C
Condition Dataset UP DWN UP DWN UP DWN
PS
GSE14905 1376 1317 1101 936 182 244
GSE13355 1008 880 929 666 11 7
GSE34248 956 1081
GSE41663 1074 1266
GSE41662 1359 1584
GSE30999 1265 1187
consensus 801 578 907 836 4 1
GSE63741 197 169
AD
GSE32924 705 514 0 0 217 272
GSE36842 2280 2175 0 0 1217 1513
GSE27887 0 0
GSE16161 759 720
consensus 644 551 0 0 66 165
GSE63741 104 72
ACD GSE6281 790 1103 311 106 219 379
GSE63741 168 139 MCC GSE39612 2592 2873 538 566 2594 3108
WND GSE28914 505 394 4 1 659 405
Table 2 Gene signatures obtained from host microarray dataset comparisons. A: Active, U: Uninvolved, C: Control; UP: upregulated; DWN: downregulated. The numbers in the table indicate the number of genes with significantly altered expression in a comparison. The numbers of consensus genes for multiple Affymetrix datasets in the same comparison are shown in bold. All the datasets except for GSE63741 have been hybridized onto Affymetrix HGU 133 Plus 2 chip. Grey boxes indicate comparisons for which transcriptome data did not exist.

32
Similarity of gene signatures across datasets was considered by calculating the Soerensen
coefficient (SC) [54] for the top 200 most significant genes from sets of pairwise gene signatures.
Heatmap diagrams in Figure 2 point to high levels of similarity between the six psoriasis datasets
in A/U and A/C comparisons. Averaging over the six datasets, SC was equal to 0.65 for
upregulated and 0.45 for downregulated genes. Approximately half of the top 200 genes for
psoriasis and for process of wound healing were the same. In contrast, atopic dermatitis gene
signatures for A/C and U/C comparisons were more heterogeneous. Moreover there was little
overlap between gene signatures of allergic contact dermatitis and Merkel cell carcinoma.
Figure 2 Soerensen Coefficient for Pairs of Comparisons. Soerensen similarity coefficient calculated for the a) 200 upregulated and b) 200 downregulated genes with the highest fold change for each pair of gene signatures. Coefficient ranges in value from 0 (no overlap, shown in black) to 1 (perfect overlap, shown in white). The conditions under study are as follows: psoriasis (PS), atopic dermatitis (AD), allergic contact dermatitis (ACD), Merkel cell carcinoma (MCC) and wound healing (WND). A: Active involved, U: active uninvolved, C: healthy control samples
33
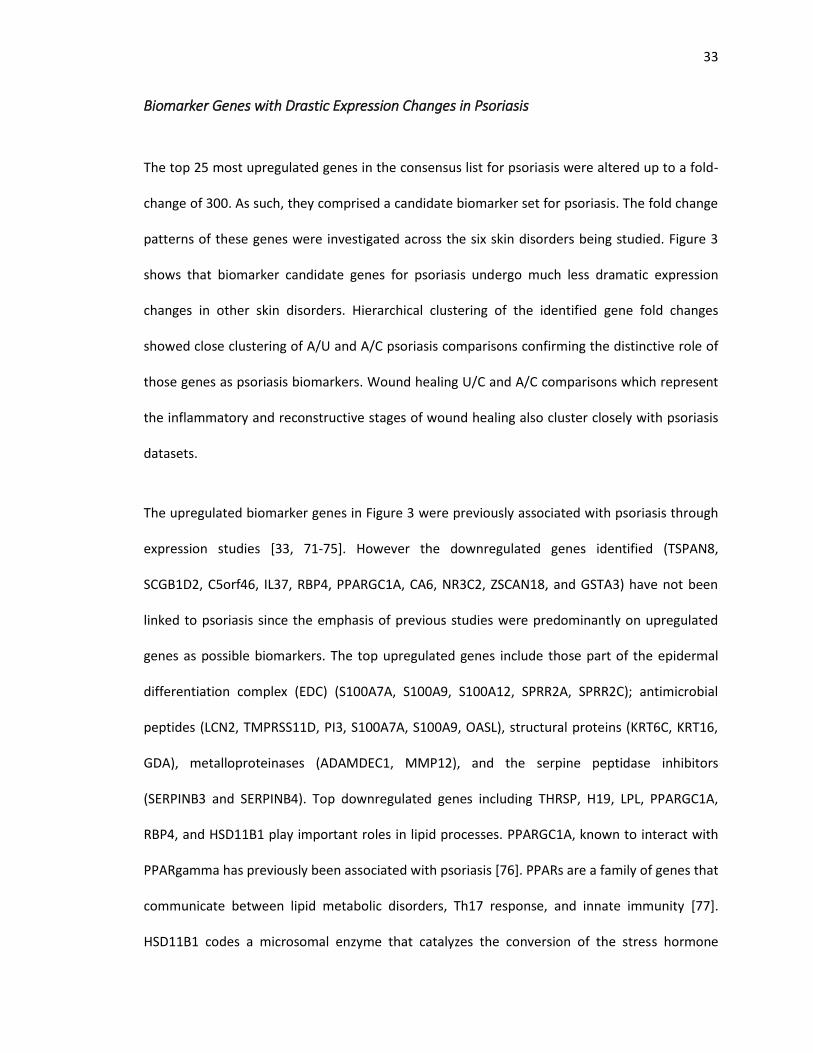
Biomarker Genes with Drastic Expression Changes in Psoriasis
The top 25 most upregulated genes in the consensus list for psoriasis were altered up to a fold-
change of 300. As such, they comprised a candidate biomarker set for psoriasis. The fold change
patterns of these genes were investigated across the six skin disorders being studied. Figure 3
shows that biomarker candidate genes for psoriasis undergo much less dramatic expression
changes in other skin disorders. Hierarchical clustering of the identified gene fold changes
showed close clustering of A/U and A/C psoriasis comparisons confirming the distinctive role of
those genes as psoriasis biomarkers. Wound healing U/C and A/C comparisons which represent
the inflammatory and reconstructive stages of wound healing also cluster closely with psoriasis
datasets.
The upregulated biomarker genes in Figure 3 were previously associated with psoriasis through
expression studies [33, 71-75]. However the downregulated genes identified (TSPAN8,
SCGB1D2, C5orf46, IL37, RBP4, PPARGC1A, CA6, NR3C2, ZSCAN18, and GSTA3) have not been
linked to psoriasis since the emphasis of previous studies were predominantly on upregulated
genes as possible biomarkers. The top upregulated genes include those part of the epidermal
differentiation complex (EDC) (S100A7A, S100A9, S100A12, SPRR2A, SPRR2C); antimicrobial
peptides (LCN2, TMPRSS11D, PI3, S100A7A, S100A9, OASL), structural proteins (KRT6C, KRT16,
GDA), metalloproteinases (ADAMDEC1, MMP12), and the serpine peptidase inhibitors
(SERPINB3 and SERPINB4). Top downregulated genes including THRSP, H19, LPL, PPARGC1A,
RBP4, and HSD11B1 play important roles in lipid processes. PPARGC1A, known to interact with
PPARgamma has previously been associated with psoriasis [76]. PPARs are a family of genes that
communicate between lipid metabolic disorders, Th17 response, and innate immunity [77].
HSD11B1 codes a microsomal enzyme that catalyzes the conversion of the stress hormone

34
cortisol to the inactive metabolite cortisone. The downregulated biomarkers showed similarities
to Merkel cell carcinoma and wound healing.
Figure 3 Top genes in psoriasis signature and the corresponding log 2 transformed fold changes in all comparisons. The upregulated genes are indicated with shades of red and the downregulated genes are indicated with shades of blue. The genes with epidermal differentiation complex (EDC), antimicrobial and lipid processing functions are marked in black. PS: psoriasis, AD: atopic dermatitis, ACD: allergic contact dermatitis, SA: sarcoidosis, MCC: Merkel cell carcinoma, WND: wound healing. A: Active involved, U: active uninvolved, C: healthy control samples

35
Functional Annotation of Gene Signatures
The consensus gene lists obtained for each skin condition were annotated using statistical
enrichment of KEGG pathways [57] and GO-BP [56]. Figure 4 shows KEGG pathways enriched
with significantly upregulated (pink) and significantly downregulated (blue) genes in psoriasis,
with a Benjamini cutoff of 0.05. The outer edge of the figure shows the pathways enriched for
the other five skin conditions. The three most upregulated KEGG pathways for psoriasis are
cytokine-cytokine receptor interaction, cell cycle, and NOD-like receptor signaling pathways.
These three pathways illustrate the involvement of the innate and adaptive immune system
mechanisms in psoriasis, as well as increased cell overturn in the progression of the flares.
Functional enrichment of other skin conditions revealed adaptive and innate inflammatory
pathways that are also commonly upregulated with psoriasis. The downregulated pathways in
psoriasis include organismal pathways such as the PPAR signaling pathway, which is a hormone-
signaling pathway activated by fatty acids. The significantly downregulated pathways are
typically psoriasis specific and show less commonality with other conditions.
Overall, the pathway enrichment results confirm previous findings [78, 79] and reveal new
psoriasis enrichment results, including cytosolic DNA sensing and RIG-I like receptor signaling. In
addition, as shown in Figure 4, a number of disease pathways were statistically enriched with
psoriasis significant genes. These disease pathways include rheumatoid arthritis, malaria, and
cardiovascular disease. The KEGG disease pathways annotated with psoriasis gene signatures
can be seen in Appendix A and Appendix B. The latter of which were previously linked to
psoriasis in the literature [19, 33]. Furthermore, malaria treatment has a risk of triggering

36
psoriasis [80]. Genes marked in these disease pathways shed light on the molecular mechanisms
linking psoriasis to its comorbidities.
Figure 4 Significantly upregulated (pink) and downregulated (blue) KEGG pathways (Benjamini<0.05) of the psoriasis microarray datasets of the host. The width of each slice is proportional to the ratio of significant genes in the pathway. The pathways are categorized according to KEGG-BRITE hierarchy (inner circle). Pathways significantly altered in other skin conditions are marked outside of the corresponding pathway slices. PS: psoriasis, AD: atopic dermatitis, ACD: allergic contact dermatitis, MCC: Merkel cell carcinoma, WND: wound healing

37
Functional enrichment analysis of the disease signatures for GO-BP [56] terms show
upregulation of type I interferon signaling in all skin conditions except Merkel cell carcinoma.
The GO annotations for downregulated genes show clear functional segregation, in which terms
related to muscle development and cell adhesion are downregulated in psoriasis. Keratinization
shows heterogeneity with respect to skin disease subtype, where it is upregulated in psoriasis
and wound healing and downregulated in atopic dermatitis and Merkel cell carcinoma. GO-BP
term for defense response to virus is enriched in significant gene lists for psoriasis, atopic
dermatitis, allergic contact dermatitis, and sarcoidosis, pointing to potential pathogenic
involvement in autoimmune conditions.
Expression Similarities between Psoriasis and Wound Healing
As observed in Figure 3, the fold change profiles of the reconstructive (A/C) and inflammatory
(U/C) stages of the wound healing process clustered with psoriasis biomarker profiles. This was
further investigated by comparing significantly expressed genes involved in wound healing and
psoriasis gene signatures. The overlapping number of genes between the profiles and their top
five significant GO-BP Level 5 enriched terms can be seen in Figure 5. There are 448 genes
associated with wound healing that overlap between either A/C or A/U psoriasis gene
signatures. The GO-BP annotations of these genes show functional differences depending on
which wound gene signature they overlap with. The psoriasis gene signature that overlaps
exclusively with A/C wound signature is mainly related to keratinization and epidermis
development. This is consistent with epidermal regeneration that is observed in wound healing
and high keratinization of psoriasis lesions. The genes that overlap with the U/C wound
signature exclusively are related to T cell regulatory functions such as CD80, CD83, IL2RG and
IL4R. The genes that are exclusive to wound healing have further regulation of inflammatory

38
response such as IL10, IL6, TNFRSF1B and TLR8. Finally the genes that are common between
psoriasis gene signatures and both stages of wound healing have genes related to mitosis. This
correlates to the high cell overturn that is observed in both conditions. The genes that are
common for downregulated genes did not show functional coherence except for psoriasis
exclusive genes, which were related to muscle development.
Figure 5 Number of genes that are common between the consensus psoriasis gene signatures (A/C/ and A/U) and wound healing gene signatures (A/C and U/C) for a) upregulated and b) downregulated genes. The genes in the color coded regions have been annotated with GP-BP Level 5 terms. The top five enrichments are reported in their corresponding colored boxes. The colored regions that don’t have associated annotations provided did not have any significant enrichments (Benjamini < 0.01).

39
The psoriasis and wound healing gene signatures have been projected onto the cytokine-
cytokine receptor interaction pathway to visualize the expression of cytokines in both conditions
as illustrated in Figure 6. Cytokines CXCL1, CXCL2, IL7R, and IL1B were expressed commonly
between psoriasis and wound healing, whereas CXCL5, CXCL6, CCR1, IL6, IL10, IL24, and IL1A
were expressed exclusively in wound healing, and CXCL9, CXCL11, IL12, IL19, IL20, IL26, and
TNFSF10 were expressed exclusively in psoriasis lesions.
Figure 6 Psoriasis (A/C, A/U) and wound (A/C, U/C) upregulated genes (Benjamini < 0.01 and fold change > 1.5) overlapped with the KEGG pathway cytokine-cytokine receptor interaction pathway. The cytokines that are commonly upregulated as well as the ones that are exclusive to one conditions can be seen. PS_AC: psoriasis A/C consensus gene signature, PS_AU: psoriasis A/U consensus gene signature, WND_AC: wound healing reconstructive stage gene signature, WND_UC: wound healing inflammatory stage gene signature.

40
Comparison of Gene Signatures between Affymetrix and PIQOR Datasets
Even though Affymetrix Human Genome U133 Plus 2 is a comprehensive microarray chip that is
widely used, other microarray technologies such as PIQOR have been used for skin studies. In
order to assess the robustness of gene signatures across platforms, a study hybridized onto
PIQOR array was analyzed. The microarray chip used for the GEO dataset GSE63741 [42] is
PIQOR Skin 2.0 Microarray which represents 1542 skin specific genes. When the consensus gene
signatures obtained from Affymetrix datasets were compared against PIQOR gene signatures for
each condition, the hypergeometric tests were all significant with p-values smaller than 3e-4.
This signifies that, among the genes that were common between the two platforms, the mRNA
perturbations observed were equivalent.
Between the two microarray platforms, there were discrepancies with the functional
annotations done through KEGG and GO databases, most likely due to the reduced number of
genes that the PIQOR chip covers. The details of the terms enriched can be seen in Table 3. For
example if the upregulated gene signatures of psoriasis are considered, even though there were
18 pathways that were enriched with Affymetrix obtained genes and four pathways that were
enriched with PIQOR obtained genes, the only consensus between the two platforms were
NOD-like receptor signaling pathway. There was a higher number of overlap for the GO-BP
functional enrichments. For the psoriasis upregulated genes, the commonly enriched terms
included keratinization, type I interferon-mediated signaling pathway, negative regulation of
viral genome replication, and regulation of response to stress.

41
Database Direction Term PIQOR Affymetrix
KEGG up NOD-like receptor signaling pathway 0.12 0.27
GO-MF up interleukin-1 receptor binding 0.25 0.38
GO-MF up serine-type endopeptidase inhibitor activity 0.08 0.15
GO-MF up peptidase inhibitor activity 0.06 0.13
GO-MF up endopeptidase regulator activity 0.06 0.13
GO-MF down glutathione transferase activity 0.30 0.35
GO-MF down heparin binding 0.06 0.13
GO-BP up keratinization 0.36 0.50
GO-BP up type I interferon-mediated signaling pathway 0.32 0.49
GO-BP up peptide cross-linking 0.29 0.25
GO-BP up response to type I interferon 0.17 0.30
GO-BP up negative regulation of viral genome replication 0.16 0.37
GO-BP up interferon-gamma-mediated signaling pathway 0.14 0.27
GO-BP up negative regulation of endopeptidase activity 0.09 0.22
GO-BP up regulation of response to stress 0.04 0.11
GO-BP down extracellular matrix organization 0.07 0.13
Table 3 Common significant enrichments (Benjamini < 0.01) between datasets hybridized onto PIQOR and Affymetrix platforms. The values represent the percentage of significant genes within the corresponding term. Up: upregulated genes, down: downregulated genes, KEGG: Kyoto Encyclopedia of Genes and Genomes, GO: Gene Ontology, BP: Biological Process, MF: Molecular Function
Discussion
Psoriasis is a complex autoimmune condition with a high economic and psychological burden on
the patients. Microarray studies conducted on various skin conditions allow for a systems
approach to mRNA perturbations. In this chapter, multiple psoriasis microarray studies have
been analyzed in context of other skin conditions to compare and contrast their expression
profiles.
We find that psoriasis has robust and consistent upregulation of gene circuit patterns across a
multitude of microarray datasets. Psoriasis signature was specific enough that the top
upregulated genes could differentiate psoriasis accurately from other skin diseases based on

42
unsupervised clustering of fold changes. Psoriasis lesions, when compared to healthy controls,
shared inflammatory and reconstructive processes with the process of wound healing, as
evidenced by the shared upregulated biomarkers.
Host pathways significantly enriched with upregulated genes in psoriasis corresponded to the
immune system, cellular processes, environmental information processing, genetic information
processing, and metabolic categories. Upregulated psoriasis genes were also significantly
enriched in disease pathways of psoriasis comorbidities such as rheumatoid arthritis. For
example, proteins related to the Th17 response [81] in rheumatoid arthritis pathway such as
CXCL1, IL8, CCL20, CCL2, and CD80/86 are also upregulated in psoriasis. Shared inflammatory
features in psoriasis and arthritis [82] suggest the presence of a cascade eventually causing joint
degeneration [83]. Genes contributing to joint cartilage destruction such as MMP1/3 and CTSL
are upregulated across psoriasis datasets. The genes that are commonly upregulated should be
further investigated to better understand the link between psoriasis and its comorbidities.
Host pathways enriched with downregulated psoriasis genes include a number of disease
pathways such as dilated or hypertrophic cardiomyopathy as presented in Appendix A. In these
pathways, genes coding the transmembrane protein sarcoglycan and contractility proteins actin,
troponin, tropomyosin, and desmin are downregulated in psoriasis. The consequences of the
downregulation of sets of transmembrane proteins in psoriasis are yet to be fully explored.
This chapter shows genes involved in antimicrobial function are consistently upregulated in
psoriasis. These findings are consistent with the skin's role as the major physical barrier between
self and non-self, with these antimicrobial genes providing the first line of defense against
bacterial and viral pathogens [84]. Antimicrobial genes provide defense against a multitude of

43
pathogens: gram positive and gram negative bacteria as well as viral agents [46, 85]. The
upregulation in the antimicrobial peptides on the skin correlates with recent studies on
perturbed skin microbial flora in psoriasis and other skin diseases [86-88]. Biopsy studies show
bacterial presence in the lower levels of the skin [87] and in the blood of patients with psoriasis
[89], suggesting pathogenic invasion. The upregulated Th17 response is crucial in host response
to viral infection [90].
Psoriasis has been defined as aberrant wound healing due to abnormal thickening of the
epidermis [29]. As with psoriasis, wound healing has an inflammatory and a reconstructive
component. The results of this chapter show that there are differences in the immune responses
mounted between psoriasis and wound healing processes. Understanding the differences
between the two can be beneficial in developing psoriasis drugs with more mild side effects. For
example an immunosuppressive agent, Sirolimus, has been investigated to treat psoriasis with
positive results [91]. However one of the side effects is impaired wound healing and wound
dehiscence [92]. Treatments with wound healing specific genes and agonists for psoriasis
specific genes can mitigate the side effects of therapies and provide a healthier inflammatory
response. IL-10 which is exclusive to wound healing has been associated with decreased
inflammatory response in wound healing and reduced scar formation [93]. IL10 treatment for
psoriasis has already been underway to test its effectiveness [94]. Even though IL6 expression
was exclusive to wound healing in our analysis and can possibly be a drug target for psoriasis
treatment, there is evidence of IL6 expression in both psoriasis and wound healing in literature
[95, 96]. It is claimed that the high expression of the gene prevents T cells from responding to
regulation in psoriasis. As for the psoriasis specific genes, there are already prescriptions for IL-
12 agonist [97]. IL-20 has been explored as psoriasis treatment with no efficacy [Clinical Trials:

44
NCT01261767]. On the other hand IL-19, CXCL9 and CXCL11 have not yet been explored as drug
targets.

45
Specific Aim II: Functional Perturbations in Psoriasis Microbiome
The primary aim of this chapter is to identify the microbiome perturbations of the psoriatic skin
compared to healthy control to identify the bacterial Operational Taxonomic Units (OTUs) and
the functional perturbations that are significantly altered in psoriatic lesions. The microbiome of
each individual is likely to contribute to the psoriasis phenotype. The second hypothesis is that
the functional changes in the microbiome will be mirrored by the processes occurring in the
host skin. Despite the varying OTUs across the sampled body sites, core orthologs in the
psoriasis microbiome is expected to become altered.
Introduction
Psoriasis has been evaluated through genetic, epigenetic, transcriptome, and microbiome
assays. However, the functional perturbations of the host and the microbiome has not yet been
bridged. In this chapter the transcriptome gene signature of the host along with the functional
perturbations on the microbiome side are studied to further the understanding of the host-
microbiome interactions on psoriatic skin.
Bacterial culture based studies showed correlations of certain bacterial infections and increased
severity of psoriasis. A study done by Gudjonsson et al showed that patients with psoriasis were
more likely to contract Streptococcus infections, which in turn exacerbated plaque psoriasis
[98]. A similar study demonstrated that even though the prevalence of H. pylori was not higher
in psoriasis than in the control group, those infected by it had a greater severity of plaque

46
psoriasis [99]. The strain of the bacteria colonization is also significant in the severity of psoriasis
plaques. Patients with psoriasis that were colonized with enterotoxin positive Staphylococcus
aureus bacteria had higher severity scores than toxin negative psoriasis patients or patients
without S. aureus colonization [100]. These observations were further supported clinically, with
patients showing better recovery when they were prescribed antibiotics as part of their
treatment regimen [99]. Even though culture based studies capture the perturbations of well-
known pathogens, they can miss the effects of non-culturable bacteria on psoriasis severity or
pathogenesis. It is also unclear whether skin microbiome perturbations have an effect on the
abundance of virulence factors known to cause human disease.
In stark contrast to culture-based studies, recent advancements in high throughput sequencing
technologies and enhanced RNA extraction methods have enabled large-scale 16S based
microbiome studies, evaluating alterations in bacterial abundance on psoriatic skin. The current
16S microbiome studies have concluded that the diversity and composition of bacterial flora is
altered on psoriasis flares. Phylum level abundance differences can be observed for Firmicutes,
Actinobacteria, and Proteobacteria [86, 87, 101]. The studies that focus on analyzing
Operational Taxonomic Units (OTUs) alone do not allude the undergoing functional differences
of the microbiome. The microbiome differences between individuals [102] also make it difficult
to evaluate the contributions of low-abundance bacteria.
Even though whole genome shotgun metagenomics sequencing of the skin microbiome would
provide a more complete picture of bacterial abundance and diversity, such a study has not yet
been reported and the skin microbiome studies have been limited to 16S data. This is due to the
low number of reference genomes for the skin isolates, difficulty in culturing certain skin specific
bacteria, and the challenges in obtaining sterile host DNA samples [102]. Therefore this chapter

47
focuses on extrapolating 16S OTU level abundance data using the database of decoded bacterial
genomes to predict the ortholog composition of the samples. This provides a preview of the
functional perturbations that are observed on the skin and is applicable to study cross talk
interactions in other skin diseases with suspected microbiome involvement such as atopic
dermatitis [101]. A follow up study can be conducted once robust methods have been
developed for skin whole genome shotgun metagenomics sequencing.
Methods
Obtaining the Microbiome Datasets
NCBI Short Read Archive (SRA) [103] was queried with the search terms “skin metagenome
psoriasis” or “skin microbiome psoriasis”. This resulted in two datasets (before June 2014)
belonging to the Human Microbiome Project [23, 25] and the American Gut Project [104]. The
number of samples present in each of these datasets is recorded in Table 4.
Analogous to the samples obtained for the microarrays in Chapter 1, the Human Microbiome
Project samples represented swabs from active psoriasis lesions (A), uninvolved contralateral
skin (U), and from subjects without any skin conditions (C). The dataset represented samples
from 14 body sites. Among the body sites of origin only the elbow, knee, back, forearm, and leg
had five or more samples each from at least two categories (A, U or C). Skin microbiome
composition is highly dependent on the body site [102]. Therefore the analyses were conducted
separately for each body site containing enough samples. The V1-3 regions of the 16S rRNA
bacterial sequences were extracted and sequenced with Roche 454 GS FLX System. Eligible

48
patients had moderate to severe psoriasis. The control samples were age matched to patients
with psoriasis (18-75 years). Eligibility criteria excluded subjects with systemic antibiotics,
corticosteroids, cytokine treatments, large consumption of probiotics one month prior to the
study, and topical antibiotic or steroid applications one week prior.
American Gut Project samples consisted of swabs from subjects with no skin condition (C) and
with psoriasis (U). The samples were collected from the hands and forehead. However only the
forehead samples had more than five samples in both C and U categories. 16S rRNA reads from
bacterial rDNA V4 regions sequenced on Illumina MiSeq platforms were downloaded from the
NCBI Short Read Archive (SRA) database [103].
Body
Site
Number of Samples (Usable Samples / Total) Dataset 16S Region
Control Uninvolved
Psoriasis
Active
Psoriasis
Total
Elbow 35/37 21/22 23/23 79/82 HMP V1-3
Knee 28/28 11/11 11/11 50/50 HMP V1-3
Back 0 12/13 12/13 24/26 HMP V1-3
Leg 0 8/8 8/8 16/16 HMP V1-3
Forearm 1/1 7/7 7/7 15/15 HMP V1-3
Other 12/15 15/15 15/15 42/45 HMP V1-3
Forehead 46/69 5/5 0 51/74 AGP V4
Total 122/150 79/81 76/77 277/308
Table 4: The number of distinct tissue samples with 16S rRNA sequence datasets presented by the Human Microbiome Project (HMP) and American Gut Project (AGP). The 16S rRNA sequence reads obtained from skin swabs of active psoriasis lesions, uninvolved contralateral skin from psoriatic patients, and subjects without any skin conditions (Control) were included in the analysis. The remaining samples used for further analysis after quality control steps (Usable Samples) as well as the total number of samples in the dataset before the quality control step (Total) are reported.
49
Processing the Microbiome Reads
From the samples that were included in this study, low quality sequences were filtered with the
Quantitative Insights into Microbial Ecology (QIIME) [105] tool. Since the two datasets were
sequenced with different technologies, optimal quality control procedures were followed as
described in QIIME pipelines for each dataset. The sequences from HMP samples, sequenced
with the Roche 454 platform, were selected for further processing if they were above an
average Phred score of 25, and if the sequence lengths were between 200 and 1000 amino
acids. For the AGP dataset, sequenced with the Illumina MiSeq platform, the quality threshold
was set at a Phred score of 20. The sequences were truncated after every three consecutive low
quality reads. After the truncation step, if 75% of the consecutive reads passed the quality
threshold, the sequence was kept for further processing.
The sequences retained after the quality control step were assigned Operational Taxonomic
Units (OTUs) with 97% identity using the 16S reference database: Green Genes version 13_5
[106]. The samples in the AGP dataset were then rarefied with an OTU threshold of 15,000.
Samples in the HMP were rarefied to an OTU threshold of 1500 to have uniform sequencing
depth. These threshold values were chosen to retain sufficient samples while preserving
diversity of the skin flora.
The abundance of the OTUs in active psoriasis samples were compared to healthy control
samples with Mann-Whitney U test for all the body sites combined. The significance test was
then repeated for each body site separately to see the contribution of individual body sites to
the OTU significance.

50
Metagenome Prediction
The OTU tables for each body site were fed into the Phylogenetic Investigation of Communities
by Reconstruction of Unobserved States (PICRUST) [107] pipeline for further analysis. The
abundances were normalized with this pipeline to account for 16S copy number variations for
each OTU. The metagenomes were then inferred by multiplying the normalized OTU
abundances with the precalculated gene content predictions. The process resulted in
estimations of the ortholog gene contents of the microbiome and subsequent categorization by
KEGG pathways. The accuracy of the metagenome predictions were calculated with Nearest
Sequenced Taxon Index (NSTI) scores. The ortholog genes that were significantly altered in A/C,
A/U, and U/C comparisons were identified using Mann-Whitney U test with a p-value threshold
of 0.01. Mann-Whitney U test [108] was also used for A/C, A/U, and U/C comparisons for each
body site to identify the KEGG Pathways with significantly different abundance levels.
The fold change of the metagenome predictions of the mentioned comparisons were calculated
to evaluate the set of orthologs that are commonly altered across body sites. The resulting fold
changes of each comparison were ranked. The top ranking 25 high and 25 low abundance
orthologs were visualized.
Commonly Altered Genes between the Host and the Microbiome
Expression profiles of the host have been obtained from the meta-analysis of psoriasis studies
hybridized onto the Affymetrix platform, as described in the previous chapter. Gene signatures
from active involved versus active uninvolved (A/U), active involved versus healthy controls
(A/C), and active uninvolved versus healthy controls (U/C) comparisons have been used in this

51
chapter. The gene expression of psoriatic skin does not correlate with body site or age onset
[109], therefore the psoriasis samples from microarray have been annotated as either
uninvolved (U) or active (A) regardless of body site.
To find the genes that were commonly altered between the host and the microbiome, the
corresponding Entrez IDs of the KEGG orthologs were extracted from the KEGG database. The
genes that have been significantly altered (p < 0.01) both in the host and the microbiome were
recorded.
Results
Psoriasis is an autoimmune condition with suspected microbial involvement. In an effort to
explore the perturbations of bacterial composition, the 16S sequences extracted from the
psoriasis lesions, uninvolved and healthy skin, have been sequenced in previous studies as part
of the Human Microbiome Project [25] and the American Gut Project [104]. This chapter utilizes
the mentioned studies and the annotated bacterial genomes to extrapolate from OTU
abundances to microbial gene contents and functional perturbations in psoriasis lesions.
Alterations of the microbiome’s orthologous gene content in psoriasis lesions were analyzed
using QIIME [105] and PICRUST [107] packages. The overview of the methods is illustrated on
the flowchart in Figure 7.

52
Figure 7 Flowchart of microbiome analysis steps. The 16S rRNA sequence reads were downloaded, passed through quality control steps and assigned to OTUs. The metagenome was predicted through PICRUST package. The host gene expression signatures obtained for the first specific aim have been used to find the commonly altered genes in both the host and the microbiome.
Significantly Altered OTUs
After the quality control steps, OTUs were assigned through the QIIME software package. The
average relative frequencies of the phyla that are found in the microbiome are shown in Figure
8. The majority of the skin microbiome phyla in both control subjects and microbiome samples
consisted of Proteobacteria, Firmicutes, and Actinobacteria. Even though the abundance levels
of the phyla showed minor perturbations, the differences were not statistically significant
between psoriasis and healthy control samples for individual body sites. Figure 9 shows the class
level breakdown of the samples collected from the elbow. There are ten main classes of bacteria
that are commonly present in all samples with varying abundance levels. The abundance
perturbations of these major phyla or classes in any of the body sites were not significant
according to the Mann-Whitney U test with a p-value of 0.01.

53
Figure 8: Average bacterial phylum level abundance of microbiome in patients with active psoriasis, contralateral uninvolved skin and healthy controls from different body sites. The phyla Actinobacteria, Firmicutes and Proteobacteria dominate each body site.
Figure 9 Bacterial class level abundance of microbiome in patients with psoriasis and healthy controls for only the elbow samples based on the Human Microbiome Project data. Bacterial classes that have more than 10% abundance in more than one sample were labeled in the bar graph. The rest of the classes are categorized as “other”. The bacterial classes that are shown were annotated with their respective phylum memberships.

54
Significant differences in bacterial OTU abundance can be observed between psoriasis lesions
and healthy skin as quantified by the non-parametric Mann-Whitney U test and corrected for
false discovery rate with the Benjamini false discovery rate correction method. When the
samples from each studied body site were pooled and tested for significance, all but two OTUs
belonged to the phylum Proteobacteria. Within the Proteobacteria phylum, multiple OTUs
belonging to the Methylobacteriaceae family had significantly lower abundance in psoriasis
microbiome. The combined phylogenetic tree of the significantly altered OTUs can be seen in
Figure 10. Most of the body sites in the HMP dataset had less than five samples for each
category. Therefore the same significance test was repeated excluding the body sites that didn’t
have enough samples. When the test was repeated with only the pooled samples from elbow,
knee, back, leg, and forearm body sites, the OTUs belonging to the family Methylobacteriaceae
continued to be in low abundance in psoriasis active flares compared to healthy controls.

55
Figure 10: The OTUs significantly altered (Benjamini < 0.05) in psoriasis lesions compared to
healthy controls in the human skin microbiome for the pooled samples from all body sites. All the
OTUs were lower in abundance in psoriasis lesions. The OTUs that are statistically significant
(Benjamini < 0.05) for the non-singleton body sites (elbow, knee, back, leg, forearm) are labeled with
red stars.
Due to the bacterial composition differences across body sites [102], the significance of the
OTUs were tested separately for each body site. Most differences involved higher abundance of
OTUs on the knee and lower abundance in the elbow for psoriasis lesions compared to healthy
controls. The OTUs, such as the ones belonging to the genus Corynebacterium and
Staphylococcus were known opportunistic bacteria with respect to infection. Although there
was no OTU commonly altered in more than one skin site, their toxonomy converged at a higher
phylum level. They belonged to the phyla Firmicutes, Proteobacteria, and Actinobacteria. The
OTUs that are altered in specific body sites are visualized in Figure 11.

56
Figure 11: The OTUs significantly altered (p<0.01) in psoriasis lesions compared to healthy controls
in the human skin microbiome. The nodes are labeled with Green Genes OTU numbers, the phyla,
and the most specific level of categorization that is available with the OTUs such as species (s), genus
(g), and family (f). The abundance perturbations are noted with an up arrow for higher abundance in
psoriasis and a down arrow for lower abundance OTUs. The colors represent the body site where the
OTU is significant (red: elbow, blue: knee).
Metagenome Predictions
OTU level abundance data alone does not indicate functional alterations that are present in the
microbiome. Ideally, whole genome shotgun metagenomics of the microbiome need to be
carried out in order to map the composition of the genes. However, such data is not yet
available due to technical limitations of sequencing technologies and DNA extraction methods
[102]. Nonetheless, the genomes that have already been decoded can provide an estimation of
the gene content of the microbiome [107]. This idea has been implemented in the PICRUST
software package and utilized in this study.
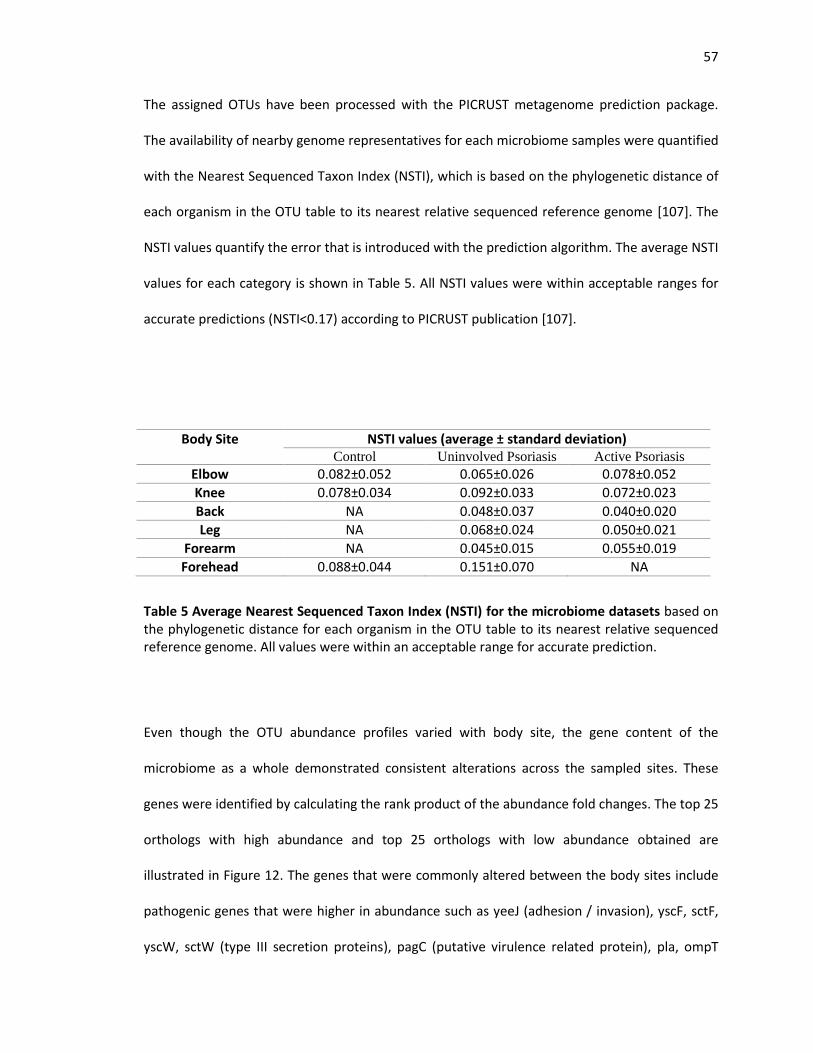
57
The assigned OTUs have been processed with the PICRUST metagenome prediction package.
The availability of nearby genome representatives for each microbiome samples were quantified
with the Nearest Sequenced Taxon Index (NSTI), which is based on the phylogenetic distance of
each organism in the OTU table to its nearest relative sequenced reference genome [107]. The
NSTI values quantify the error that is introduced with the prediction algorithm. The average NSTI
values for each category is shown in Table 5. All NSTI values were within acceptable ranges for
accurate predictions (NSTI<0.17) according to PICRUST publication [107].
Body Site NSTI values (average ± standard deviation) Control Uninvolved Psoriasis Active Psoriasis
Elbow 0.082±0.052 0.065±0.026 0.078±0.052
Knee 0.078±0.034 0.092±0.033 0.072±0.023
Back NA 0.048±0.037 0.040±0.020
Leg NA 0.068±0.024 0.050±0.021
Forearm NA 0.045±0.015 0.055±0.019
Forehead 0.088±0.044 0.151±0.070 NA
Table 5 Average Nearest Sequenced Taxon Index (NSTI) for the microbiome datasets based on the phylogenetic distance for each organism in the OTU table to its nearest relative sequenced reference genome. All values were within an acceptable range for accurate prediction.
Even though the OTU abundance profiles varied with body site, the gene content of the
microbiome as a whole demonstrated consistent alterations across the sampled sites. These
genes were identified by calculating the rank product of the abundance fold changes. The top 25
orthologs with high abundance and top 25 orthologs with low abundance obtained are
illustrated in Figure 12. The genes that were commonly altered between the body sites include
pathogenic genes that were higher in abundance such as yeeJ (adhesion / invasion), yscF, sctF,
yscW, sctW (type III secretion proteins), pagC (putative virulence related protein), pla, ompT

58
(plasminogen related genes), gspS (type II secretion proteins), and acfC (accessory colonization
factor). On the other hand, iga (Type V secretion system) and rtxB (Type I secretion system)
were in lower abundance in psoriasis microbiome.
The rest of the genes were involved in various metabolic processes. For example, the high
abundance orthologs RRM1 (ribonucleoside-diphosphate reductase subunit 1) and yjjG (5’-
nucleotidase) and lower abundance orthologs NUDT2 (bis(5’ nuxleosidyl)-tetraphosphatase) are
part of the pyrimidine and purine metabolism pathways. ACLY is involved in citrare cycle.
Orthologs that belong to the fructooligosaccharide transport system (msmE, msmF, msmG)
were in lower abundance.

59
Figure 12 the orthologous genes that are consistently altered in the microbiome comparisons. The values represent the log2 transformed fold changes of the metagenome predicted through PICRUST software package. The high abundance genes are indicated with shades of red and the low abundance genes are indicated with shades of blue.

60
Significantly Altered Pathways in Psoriasis Microbiome
The pathways with top altered abundance in psoriasis microbiome were identified using the
Mann-Whitney U test [108]. Statistical significance of vibrio cholera infection, amoebiasis and
beta-lactam resistance pathways suggest an increase in disease causing orthologs in the
psoriasis microbiome. (Table 6). Other pathways with increased gene abundance were xylene
degradation and sporulation.
Body Site Comparison KEGG Pathway P value Fold Change
Elbow U/C Vibrio cholera infection 0.0047 1.10
Knee U/C Xylene degradation 0.0087 1.30
Forehead U/C Sporulation 0.0064 1.63
Forehead U/C Amoebiasis 0.0086 2.32
Forehead U/C Beta-Lactam resistance 0.0094 1.83
Table 6 KEGG pathways that have significantly different (p < 0.01) abundance levels in psoriasis microbiome compared to controls calculated with PICRUST [107]. The significance was only observed in the microbiome comparisons between uninvolved skin (U) and healthy controls (C). The table shows for each listed KEGG pathway, the p-value calculated using the Mann-Whitney U test and the abundance fold changes.
Orthologous Genes that are Commonly Altered between Host and the Microbiome
The orthologs that were commonly altered both on the host and the microbiome pointed to
common processes in psoriasis. Orthologous genes with significant abundance changes in
psoriasis microbiome and the host compared to healthy controls are shown in Table 7. ATOX1 is
a copper chaperone that also functions as antioxidant. AMD1 is involved in polyamine synthesis,

61
GMPPB catalyzes the conversion of mannose1phosphate to GDPmannose, and AKR1B10 is a
member of the aldo/keto reductase superfamily.
Comparison Symbol Body Site
FC Microbiome
FC Host
KEGG Pathways
AC ATOX1 elbow 0.71 1.94 Mineral absorption
AU
AMD1 knee 0.61 1.89 Cysteine and methionine metabolism, Arginine and proline metabolism
GMPPB knee 0.66 1.67
Fructose and mannose metabolism, Amino sugar and nucleotide sugar metabolism, Biosynthesis of secondary metabolites
AKR1B10 forearm 0.17 20.82
Pentose and glucuronate interconversions, Fructose and mannose metabolism, Galactose metabolism, Glycerolipid metabolism
Table 7: Significantly over- and under-represented genes in psoriasis in the host and the
microbiome for the A/C and A/U comparisons (p<0.01 for host and p<0.05 for microbiome).
No commonalities were observed for the U/C comparison. The table reflects the fold changes of
the commonly altered genes in the microbiome and the host, and p-values resulting from Mann-
Whitney U test. A: active involved skin, U: active uninvolved skin, C: control skin, FC: fold
change.
Altered KEGG Pathway Expression for Bacterial Invasion of Epithelial Cells in Relation to Skin
Disease Host Genes
Bacterial invasion of epithelial cells KEGG pathway [57] depicts mechanisms that bacteria use to
hijack the actin structure of the cell. Using the Virulence Factor Database (VfDB) [60], bacterial
genes with pathogenic potential were identified within the pathway, enabling the annotation of
crosstalk linkages between the host and the psoriasis microbiome. Figure 13 shows the
pathway, annotated with color markers for upregulated and downregulated genes. Host genes

62
Cbl, SHC1, and ARP 2/3 were upregulated in psoriasis whereas Dynamin, SHC4, PI3K, and Septin
were downregulated. The pathogenic orthologs that bind to fibronectin (FnBPA, FnBPB, Pfb,
Sfb1, invasin) used by Staphylococcus, Streptococcus, and Yersinia species were in high
abundance in psoriasis microbiome, potentially indicating an increase in virulence factors in the
psoriasis microbiome.
Figure 13 Bacterial invasion of epithelial cells KEGG pathway annotated with the up and downregulated gene signatures for psoriasis. The genes targeted by bacteria (blue) and viruses (red) obtained from PHISTO database are indicated with lines under the gene boxes. The virulence factors obtained from VfDB database are indicated with red stars. The over and underrepresented microbial genes obtained from metagenome analysis of the psoriasis microbiome are marked with red arrows. PS: psoriasis, up: upregulated genes, down: downregulated genes, target_bac: bacterial target, target_vir: viral target.

63
Discussion
Psoriasis is an autoimmune disease with suspected microbial involvement. The gene contents of
skin microbiome were predicted from 16S sequencing data in order to understand the
functional perturbations in psoriasis flares across different body sites. The altered metagenome
was compared with the microarray gene signatures obtained in Specific Aim 1 to draw parallels
between the two sides of the coin.
The OTUs that were significantly altered were members of the phyla, Proteobacteria, Firmicutes,
Actinobacteria, and Bacteriodetes. The higher abundances of opportunistic pathogens belonging
to these phyla in psoriasis microbiome suggest pathogenic contributions to the maintenance of
the psoriatic lesions. For example, Staphylococcus epidermidis had significantly higher
abundance in knee psoriasis microbiome compared to healthy controls. Even though it is usually
labeled as a skin commensal, recent evidence shows that due to intravenous catheter insertions
S. epidermidis is responsible for 22% of the bloodstream infections of the intensive care unit
patients and is capable of forming biofilms on medical device surfaces [110]. Streptococcus
genus, which had high abundance in the knee psoriasis microbiome, is notorious for having
pathogenic strains. Another opportunistic pathogen with high abundance was Anaerococcus,
which has been observed in chronic diabetic wounds, suggesting the involvement of bacteria in
chronic skin conditions [111]. The pathogenic membership of the bacteria can only be
determined accurately with strain level information which can’t be obtained with 16S data.
However, the genus level information was suggestive of pathogenic contributions to psoriasis.
The OTUs that were significantly altered in the psoriasis microbiome such as Kochuria,
Methylobacterium, and Schlegelella are commonly found in soil [112, 113]. Soil associated

64
bacteria have previously been found on the hand microbiome of Tanzanian women and not on
women residing in the United States. This implicates the effect of environment in shaping the
microbial skin communities [114]. The abundance differences of soil associated bacteria on
psoriasis lesions suggests involvement of environmental factors in psoriasis.
Pathogenic contributions can also be observed in the commonly altered bacterial orthologs
across different body sites. While selected members of Type II and Type III Secretion Systems
were among the higher abundance orthologs, Type I and Type V Secretion System orthologs
were in lower abundance. Type III secretion system utilizes needle like proteins to secrete
bacterial proteins to its host. The highly abundant orthologs in psoriasis YscF is a protein that
influences the host immune response [115] and is recognized by Toll-like receptors [116]. As
mentioned in the first chapter, Toll-like receptor pathway is upregulated in the host psoriasis
gene signature. Another high abundance protein YscW is responsible for inducing
immunodeficiency during infection as shown in mice [117]. It is also required for the biogenesis
of bacterial protein secretion [118]. Type II secretion system is composed of gated channels in
the outer membrane and require pilotin proteins to assemble around the channels [119]. A
pilotin protein GspS was consistently altered in the psoriasis microbiome. The virulence
membrane protein pagC was also highly abundant in psoriasis microbiome. It is regulated by
phoP-phoQ and is an essential protein in the pathogenesis process [120]. It is also indirectly
involved in the serum resistance of bacteria [121]. Finally, the genes related to plasminogen
were in high abundance such as pla and ompT. During infection, pla cleaves the host protein
plasminogen activator inhibitor (PAI-1). The gene PAI-1 regulates plasminogen which dissolves
fibrin in clots and degrades laminin. However coagulation activates immune response and may
help restrain bacteria. Hence, cleaving PAI-1 helps the bacteria hinder the immune system of the

65
host [122]. The pathogenic genes that were consistently in high abundance in the psoriasis
microbiome suggest mechanisms as to how the immune system may be triggered due to
dysbiosis of the microbiome.
On the host side, bacterial invasion of epithelial cells pathway was crowded with significantly
altered psoriasis genes, consistent with the microbiome signatures observed. For example, the
ARP2/3 complex was elevated in psoriasis. The complex, involved in actin polymerization, has
been associated with cell crawling motility with the help of N-WASP and WAVE [123], especially
for migration of immune cells [124]. ARP2/3 is also significant in organizing tight junctions and
maintaining epidermal integrity [125]. ARP2/3 upregulation potentially points to hijacking the
host mechanism of bacterial protein transport using actin structures [126, 127]. The high
abundance of microbiome genes in this pathway also suggest microbiome involvement. A
pathogenic component to psoriasis is also suggested by the shared immune response with
Staphylococcus [128, 129] and Streptococcus [130] skin invasions. Together, these results point
to a pivotal role the microbial agents play in the initiation and maintenance of psoriatic
phenotypes.
The genes that are commonly altered between the host and the microbiome involved metabolic
genes. GMPPB and AKR1B10 are both involved in the fructose and mannose metabolism
pathway. They were upregulated in the host and were in low abundance in psoriasis
microbiome. This finding suggests metabolic competition of the host and the microbiome on the
skin. Another metabolic gene commonly altered was AMD1, which is an intermediary enzyme to
produce spermidine. This polyamine spermidine, responsible for keratinocyte proliferation, was
shown to be significantly higher in psoriasis patients [131]. The analysis also showed that
microbiome mirrors and complements the oxidative stress of the host. The gene ATOX1 plays a

66
role in copper homeostasis. The alteration of the gene’s expression can be resulting in elevated
copper levels in the serum of psoriasis patients [132].
The OTU and metagenome alterations in the psoriasis microbiome allude to a higher abundance
of virulence factors, which can be responsible for triggering or the maintaining the immune
response observed in psoriasis flares. The metabolic contributions of the microbiome and the
crosstalk should be further evaluated with metabolic analyses.
67
Specific Aim III: Positive Selection Signals in Psoriasis
The goal of this chapter is to map the selection patterns on the HLA region for populations with
different ethnic backgrounds. Due to the geographic differences, populations are subject to
different evolutionary pressures. The HLA region is highly involved with immune response and is
linked to psoriasis phenotype. I hypothesize that there are population subtype specific regions
that are under positive selection. Those regions can be the key to explaining the susceptibility
differences that are observed in psoriasis prevalence.
Introduction
Susceptibility to disease is dependent on population history in many cases. GWA studies provide
insight into genetic loci responsible for disease pathogenesis. National databases curate GWAS
results in order to provide a global view of disease associated polymorphisms [133, 134]. Human
Leukocyte Antigen (HLA) region, a 4 Mb long region located on the chromosomal position 6p21,
is crowded with immune genes [135] and multiple polymorphisms [136], which creates and
extensive repertoire for pathogen identification during immune defense. The region is
associated with a multitude of conditions through GWA studies. These associations mainly
consist of autoimmune disorders such as psoriasis [137], rheumatoid arthritis [138] and
ulcerative colitis [139] as well as infectious diseases such as Hepatitis B [140]and HIV [141, 142].
However, GWA studies are typically limited to a small number of patient ethnic population as
representative subjects, which do not capture susceptibility differences between ethnic
populations. In this study we investigated the interplay between the SNPs, diseases and

68
population subtypes within the HLA region using open access genomics datasets and
computational tools.
Psoriasis has a strong genetic component. Twin studies show that genetic factors explain 68% of
the variation in psoriasis susceptibility and concordance is higher in monozygotic twins than
dizygotic twins [143]. Online Mendelian Inheritance in Man (OMIM) [144] has curated 15
regions associated with psoriasis including the HLA region. Within the different HLA haplotypes,
HLA-Cw6 and HLA-Bw7 have specifically been associated with psoriasis susceptibility [145].
Prevalence differences in psoriasis can be observed in people with different ethnic and genetic
background. A study done on the United States psoriasis patient population shows that
Caucasians have the highest prevalence of 3.6%, followed by African Americans with 1.9% and
Hispanics with 1.4% prevalence [146]. The susceptibility differences are also reflected in global
studies with lowest incidence in Taiwan (0%) and highest in Denmark (8.5%) [4]. These observed
susceptibility differences between ethnic populations lead to questions about the selection
pressures behind the genetic component of diseases. This can be achieved by understanding the
population history of the highly disease associated HLA region in different ethnic populations.
Identifying disease causing SNPs in the HLA region in GWAS studies can be misleading due to
high linkage disequilibrium (LD) in the region [147, 148]. Recombination hotspots have been
established using linkage disequilibrium based tests in North European [149-151], East Asian
[152] and African [153] populations. An integrative study has shown that recombination
hotspots vary for different populations, which explains the high diversity of haplotypes [148] as
well as the susceptibility differences between populations. This is a comparative study that
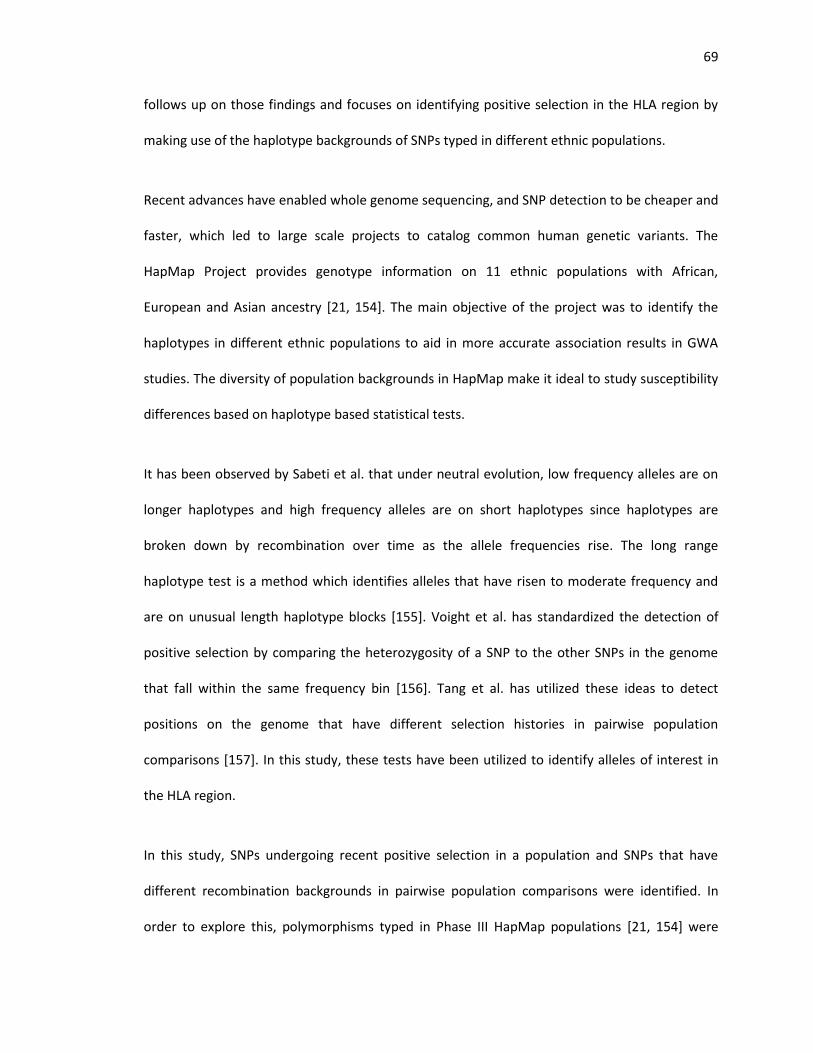
69
follows up on those findings and focuses on identifying positive selection in the HLA region by
making use of the haplotype backgrounds of SNPs typed in different ethnic populations.
Recent advances have enabled whole genome sequencing, and SNP detection to be cheaper and
faster, which led to large scale projects to catalog common human genetic variants. The
HapMap Project provides genotype information on 11 ethnic populations with African,
European and Asian ancestry [21, 154]. The main objective of the project was to identify the
haplotypes in different ethnic populations to aid in more accurate association results in GWA
studies. The diversity of population backgrounds in HapMap make it ideal to study susceptibility
differences based on haplotype based statistical tests.
It has been observed by Sabeti et al. that under neutral evolution, low frequency alleles are on
longer haplotypes and high frequency alleles are on short haplotypes since haplotypes are
broken down by recombination over time as the allele frequencies rise. The long range
haplotype test is a method which identifies alleles that have risen to moderate frequency and
are on unusual length haplotype blocks [155]. Voight et al. has standardized the detection of
positive selection by comparing the heterozygosity of a SNP to the other SNPs in the genome
that fall within the same frequency bin [156]. Tang et al. has utilized these ideas to detect
positions on the genome that have different selection histories in pairwise population
comparisons [157]. In this study, these tests have been utilized to identify alleles of interest in
the HLA region.
In this study, SNPs undergoing recent positive selection in a population and SNPs that have
different recombination backgrounds in pairwise population comparisons were identified. In
order to explore this, polymorphisms typed in Phase III HapMap populations [21, 154] were

70
analyzed. Pairwise population comparisons were conducted to find SNPs that were statistically
significant between populations in order to illuminate prevalence differences. The resulting
regions of interest were annotated with disease associations through literature searches. The
results are novel as it produces new insights into the effect of positive selection on disease
susceptibility in different populations as well as annotation of the HLA region with different
evolutionary histories through pairwise population comparisons.
Methods
Identifying Gene Lists
Genes in the HLA region and their sub-region annotations of class I, class II, extended class II and
class III were obtained from Shiina et al. [158]. The genomic coordinates of these sub-regions
obtained from the hg19 build of the human genome [159] can be seen in Table 8. The
Bioconductor GOstats package [55] was used for statistical enrichment of Gene Ontology
Biological Process (GO-BP), Gene Ontology Molecular Function (GO-MF) [56] and the Kyoto
Encyclopedia of Genes and Genomes (KEGG) pathways [57] for the genes in the whole HLA
region and genes in each sub-region.

71
HLA class Genic Region (hg19) on Chr 6
# of SNPs in Phased Data
# of SNPs with Ancestral Allele Information
Class I 29680000-31480000 2723 1611
Class III 31480000-32400000 1216 1161
Class II 32400000-33100000 1141 766
Class II extended 33100000-33378000 204 201
Total 29680000-33378000 5284 3739
Table 8: The HLA region coordinates on chromosome 6 partitioned according to their
functional class annotations as described in Shiina et al. The coordinates are based on the hg19
build of the genome. The number of SNPs included in the phased genotypes of the HapMap
populations as well as the number of phased SNPs that have ancestral annotations according to
the EPO pipeline.
Obtaining Population Level Data
The phased genotypes and frequency data were downloaded for each ethnic population typed
in Phase III of the HapMap [21, 154] project. The HapMap database includes populations with
East Asian ancestry (Japanese in Tokyo-JPT (91 samples), Han Chinese in Beijing-CHB (90
samples), Chinese in Denver-CHD (100 samples)), European ancestry (Europeans of Northern
and Western Ancestry-CEU (180 samples) and Toscana- TSI(100 samples)), African ancestry
(Yorubans-YRI (180 samples), Masaai-MKK (180 samples), Luhya-LWK (100 samples), and African
Americans-ASW(90 samples)) and other ethnic groups (Gujaratis in Houston-GIH (100 samples),
and Mexicans in Los Angeles-MEX(90 samples)), making it ideal for identifying susceptibility
SNPs. The SNP positions were lifted over from hg18 to hg19 build using UCSC tools [160]. The
hg19 build of the human ancestral genome was acquired from the 6-way primate genome
alignment using the Enredo-Pecan-Ortheus (EPO) pipeline [22, 161, 162].

72
Population Differences
The SNPs that are common between all populations were extracted from the frequency data.
For each pair of populations, pairwise allele frequency distribution for each subclass as well as
for the whole HLA region were calculated with Kolmogorov-Smirnov (KS) test [163]. The p values
were corrected for false discovery rate (FDR) using Benjamini-Hocheberg correction [58]. The
same test was carried out for 20 concatenated autosomal loci that are under neutral selection
as described by Wall et al. [164] in order to observe neutral estimate of allelic variation and to
establish that the frequency differences seen at the HLA regions are not a result of demographic
forces but signify selection.
For a population, the Integrated Extended Haplotype Homozygosity (IHH) [155] and the
Integrated Site-specific EHH (iES) [157] of the ancestral and derived alleles were calculated for
each typed SNP in order to find the transmission of extended haplotypes without
recombination. The IHH of a SNP was standardized with respect to the results from the whole
genome that fall within the same 0.025 frequency bin using the Standardized IHH (iHS) test
[156]. SNPs with a minor allele frequency of 0.05 were discarded from the analysis since the iHS
method is not applicable for alleles that are fixed or almost fixed in a population. Finally
standardized ratio of iES from pairwise populations (Rsb) were calculated for each SNP [157].
The resulting p values of the iHS and Rsb tests were adjusted for multiple testing using
Benjamini-Hochberg FDR correction [58]. The HLA region of interest was then extracted from
the whole genome analyses.

73
Polymorphism Annotations
The SNPs were annotated according to their location as intergenic, intron, coding, UTR and
promoter [165]. The intergenic SNPs were annotated with genes present within a 20 Kb
upstream and downstream window. The SNPs that are under positive selection and the genes
they are on are also cross-referenced with diseases they are associated with through MalaCards
[166] and National Human Genome Research Institute GWAS Catalog [133].
Results
This study presents a systematic approach to detect positive selection in the extended HLA
region in order to explain demographic susceptibility differences of HLA linked conditions. The
SNPs that are associated with a condition can be hitchhiking on the haplotype blocks that are
under selection. By detecting the driving SNPs on the haplotype blocks, more information on the
hitchhiking SNPs can be obtained.
The analysis utilizes genotypes of 11 HapMap populations [21, 154] consisting of 2022
haplotypes with 12622 typed SNPs in the HLA region. Among these typed SNPs, 5284 of them
have phased data and 3739 have ancestral alleles deduced from the EPO pipeline [22, 161, 162].
The definitions of the sub-classes of the HLA region as well as the breakdown of the number of
SNPs typed in each sub-region can be seen in Table 8. The phased data of the SNPs are then
used to find positive selection in each HapMap population, as well as to find SNPs that have
significantly different population histories. The resulting SNPs of interest are then annotated

74
with diseases they are associated with through GWA studies. The overall workflow is
summarized in Figure 14.
Figure 14 Flowchart of the analysis shows the steps taken to obtain the SNPs that are under
positive selection in the HLA region for each population as well as identifying the SNPs that have
significantly different population histories.
Functional Annotation of the HLA Region
The HLA is a dense genic region with exclusive immune function. This is represented by the
functional annotations of genes in this region through Gene Ontology [56] and KEGG pathways
[57]. The KEGG annotations are represented in the Table 9. KEGG pathways that are enriched
with genes in the HLA region are involved in autoimmune conditions such as type-I diabetes,
asthma and rheumatoid arthritis as well as infections such as Leshmanaiasis, Staphylococcus
aureus and Toxoplasmosis. The biological processes they are involved in include interferon-
gamma-mediated signaling pathway, antigen processing and presentation and positive
regulation of immune response. Top molecular function terms that are enriched with HLA genes
include peptide antigen binding, MHC class II receptor activity and amide binding. The

75
annotations are primarily for the Class I and Class II, while Class III and extended Class II region
do not have any significant terms associated with them.
Pathways Class I Class II all HLA
Antigen processing and presentation 0.08 0.18 0.33
Allograft rejection 0.16 0.32 0.51
Autoimmune thyroid disease 0.12 0.23 0.35
Cell adhesion molecules (CAMs) 0.05 0.09 0.14
Graft-versus-host disease 0.15 0.29 0.46
Phagosome 0.05 0.09 0.14
Type I diabetes mellitus 0.14 0.28 0.47
Viral myocarditis 0.09 0.17 0.26
Asthma 0.40 0.43
Endocytosis 0.03 0.04
Intestinal immune network for IgA production 0.25 0.25
Leishmaniasis 0.17 0.18
Natural killer cell mediated cytotoxicity 0.04 0.06
Rheumatoid arthritis 0.13 0.16
Staphylococcus aureus infection 0.22 0.27
Systemic lupus erythematosus 0.09 0.11
Toxoplasmosis 0.09 0.12
ABC transporters 0.05
Hematopoietic cell lineage 0.03
Primary immunodeficiency 0.06
Proteasome 0.05
Spliceosome
Table 9: Kyoto Encyclopedia of Genes and Genomes (KEGG) pathways that are enriched with all HLA genes and sub-classes of genes. The terms are significant (Benjamini < 0.01) in at least 1 gene list. The terms are listed as most commonly enriched to region specific terms. The values represent the ratio of genes in the term that overlap with the gene list. The cells that are left blank signifies that the corresponding term is not enriched for that gene list. There were no terms enriched for extended class II region, hence its corresponding column is not shown.

76
Allele Frequency Distributions of HLA sub-Region
The allele frequency distributions of the HLA region were compared between populations with
Kolmogorov-Smirnov (KS) test in order to find the populations that have distinguishing patterns
of allele histories. The –log10 of the Benjamini corrected p values of pairwise tests are
represented as heatmaps in Figure 15. The results for the whole HLA region show significantly
different allele frequency distributions for CEU, TSI and JPT populations compared to all other
ethnic populations. When the HLS region is broken down into sub-regions, it is seen that each
sub-region has a different population history, Class I region being the greatest contributor to
frequency distribution diversity between populations. European ancestry (CEU and TSI)
difference is apparent in Class I region whereas East Asian (JPT+CHB+CHD) and CEU difference
dominates in the Class II region. In the extended Class II region, regional coherence patterns can
be observed where the allele frequency distributions are similar within African, East Asian and
European descent populations. When the test is applied to neutrally evolving autosomal regions
in the genome [164], there were no significant differences between the populations. This
signifies that the allele frequency distribution variations are not a result of population
demography but can explain different selection signals in populations.
77
All HLA Region Class I Class III
Class II Class II-Extended
Figure 15: Heatmaps of pairwise SNP allele frequency distribution comparisons using the
Kolmogorov-Smirnov (KS) test for each cluster. The values represent the -log10 of the Benjamini
FDR corrected KS-test p values. The comparisons that are not significant (Benjamini >0.05) are in
black.
Polymorphisms on the HLA that are Under Positive Selection
To further investigate the selection signals, recent positive selection on the HLA variants that
have not yet reached fixation have been calculated with the iHS test. The –log10 of the
corrected p values for different ethnic populations have been overlapped on the scatter plot in
Figure 15. A complete and more detailed annotations of the significant SNPs, as well as the
genes they fall within are provided in Appendix C. The tests are also able to detect if the
selection is on the ancestral or the derived allele. With the exception of five SNPs, selection
signals are on derived alleles. Similar to the results obtained from the KS heatmaps, there are

78
European ancestry specific selection peaks in Class I region. Coding and intronic SNPs that are on
PSORS1C1, TCF19, MUC22, TRIM10 and TRIM15 are under positive selection with a Benjamini
cutoff of 0.01. The polymorphisms with the highest significance value, rs3130557, is driving the
selection in both CEU and TSI populations. The SNP is located on the intronic region on the
PSORS1C1 gene. In the Class III region, there is positive selection signals for the East Asian
populations, especially on the genes NOTCH4, C6orf10 and BTNL2. The driving polymorphism
across populations are rs3132946, rs3830041, rs8192565 and rs12055568 which are intronic or
promoter SNPs on the NOTCH4 gene. The East Asian specificity continues on to the Class II genes
with positive selection on TAP2. There is African ancestry specific positive selection signals on
Class II genes, specifically HLA-DOA and HLA-DPA, both HLA class II alpha chain paralogues
expressed in antigen presenting cells. The driving SNPs in this region are rs3129304, rs3129303
and rs10947368 which are found on 3’ UTR and coding region of the HLA-DOA gene. The SNPs of
interest from the iHS test and the genes that they fall under have been annotated through the
MalaCards database and summarized in Table 10. The associations range from autoimmune
conditions such as psoriasis, rheumatoid arthritis and celiac disease to infections such as HIV-I.
The tests were followed up with pairwise population comparisons of haplotype background
using the Rsb test. The SNPs that are statistically significant between populations from different
geographical backgrounds are visualized in Figure 17. The results from the iHS test have been
confirmed with the Rsb test. The SNPs that distinguished between ethnic regions were on
PSORS1C1, NOTCH4, C6orf10 and HLA-DOA. The SNP rs3130557 on PSORS1C1 gene that is under
positive selection for the European populations show differences in ASW and TSI populations.
The SNPs that are on HLA-DOA gene under positive selection for the LWK population also shows
significant difference with the TSI population. These SNPs can be responsible for the

79
susceptibility differences that is observed between populations for the diseases associated with
the genes.
Figure 16: Superposition of –log10 of the Benjamini corrected iHS p-values of all HapMap
populations along the HLA region. The horizontal red line represents cutoff for significance
(Benjamini < 0.01). Class I region shows evidence of positive selection with European (CEU, TSI)
specificity, non-specific ethnic background positive selection in Class III, African (LWK, YRI)
specificity in the Class II region and no positive selection in extended Class II region.

80
Figure 17: The SNPs with significantly different evolutionary backgrounds between at least
two populations belonging to different geographical regions (Benjamini < 0.01). The
standardized ratio of integrated site-specific EHH from pairwise populations (Rsb) on the HLA
region were calculated. Each box represents a gene annotated with the SNPs that have
significantly different evolutionary backgrounds. The genes are labeled with the HLA sub-regions
they belong to.
Overall, the study shows that there are discrete patterns of selection for populations that
belong to different geographical regions. Selections signals are concentrated in the Class I region
for the European descent populations and Class II for the African descent populations.

81
Gene
Associated Disease
autoimmune infection inherited cancer other
Cla
ss I
TRIM31
lymphocytic choriomeningitis
TRIM26
endodermal sinus tumor seizure disorder
HCG22
follicular lymphoma
CDSN guttate psoriasis
hypotrichosis simplex, peeling skin syndrome
C6orf15
follicular lymphoma
PSORS1C1 psoriasis, epidermal necrolysis, stevens-johnson
syndrome, rheumatoid arthritis
CCHCR1 psoriasis
TCF19
tetraploidy
PSORS1C3 psoriasis
POU5F1
Pineoblastoma, germinoma, teratoma
seborrheic keratosis
Cla
ss I
II
DDX39B rheumatoid arthritis
LST1
hyperbilirubinemia
PRRC2A rheumatoid arthritis, diabetes mellitus
coronary artery aneurysm
APOM type 2 diabetes mellitus
limb ischemia
CSNK2B egg allergy
NOTCH4
salivary gland tumor schizophrenia,
pseudobulbar palsy
BTNL2 sarcoidosis, wegener's granulomatosis
Cla
ss I
I
TAP2 wegener-like granulomatosis, ankylosing spondylitis,
cardiac sarcoidosis, celiac echinococcosis
type I bare lymphocyte syndrome
melanoma
HLA-DOA
HIV-I
HLA-DPA1 chronic berylliosis, wegener's granulomatosis, myelitis,
neonatal lupus erythematosus, rheumatoid arthritis rubella
pulmonary hypertension
HLA-DPB1
dysplasia
Table 10: Diseases that are associated with the genes under positive selection (iHS Benjamini < 0.01) in at least one HapMap population. The
diseases associated with the gene under positive selection are separated as autoimmune, infection, inherited, cancer and other. Genes are
sorted according to their genomic positions. The associated diseases are obtained through the MalaCards database.

82
Discussion
Psoriasis is a skin condition with a strong genetic component. HLA region has shown associations
with the condition through GWAS studies. In this chapter, the SNPs that are undergoing positive
selection in the HLA region have been identified through haplotype based statistical methods.
The overall results showed partitioning of the positive selection signals according to ethnic
background of populations. Positive selection on the Class I region was observed exclusively in
populations with European background. Genes that are on the MHC Class I region are mainly to
differentiate self from non-self. Hence they are highly associated with autoimmune conditions.
Positive selection on the Class II region could be observed in populations with African ancestry.
Genes on this region are necessary for establishing an immune response. The positive selection
patterns are consistent with the infection based evolutionary pressures that are present in the
African ancestry populations [167].
The SNPs that are on the intronic region of PSORS1C1 are undergoing positive selection in the
European ancestry populations. The gene has been associated with psoriasis [168] and its
comorbidity rheumatoid arthritis [169]. These results are consistent with the observation that
psoriasis has a higher prevalence in the Caucasian ethnic population than African ancestry
populations [4]. The driving SNP with the highest p value for positive selection signal is also on
the PSORS1C1 gene. The SNP rs3130557 is associated with multiple autoimmune conditions
such as ulcerative colitis [170], Crohn’s [171] and coeliac diseases [134] as well as association
with glycemic traits [172]. It also shows significant difference between the TSI and ASW
populations according to the cross population test performed. The positive selection in the
83
region may be the driving force behind the high psoriasis rates in the Caucasian population
through genetic hitchhiking.
The gene undergoing positive selection in the East Asian ancestry populations is NOTCH4. It is a
gene that is responsible for cell fate regulation. NOTCH4 has been associated with schizophrenia
in the Chinese Zhuang and Chinese Han population for the SNP rs3131296 [173]. Even though
that SNP is not significant in our analysis, it is within 20kb of the positively selected region. This
may again indicate that the SNP that is associated with a condition may be a result of positive
selection in the neighboring regions for a population.
Genes that are under positive selection in the African population comprise of HLA-DOA. It is a
gene that is expressed in B cells. Even though the nucleotide sequences are well conserved
among these species in order to conserve function [174], positive selection has been observed
in the African ancestry population. It has also been associated with HIV [166] which poses as a
recent environmental pressure in the geographical region.
A limitation of this method is the dependence of the calculations on the ancestral genome build.
The ancestral genome obtained from the EPO pipeline is not mapped for genes such as HLA-C
and HLA-B genes potentially due to the high variance in those genes. Therefore the selection
signatures on the coding regions of those genes could not be obtained. However, positive
selection detected on the non-coding regions can contribute to the regulation of the genes and
provide equally valuable information.

84
Overall, the positive selection signatures on the HLA region can help understand the driving
pressures behind susceptibility to conditions in different ethnic populations, including a complex
disease with genetic origins such as psoriasis.

85
Conclusions
Psoriasis is a complex disease with genetic and environmental dimensions. Psoriasis is linked to
a combination of multiple risk factors such as the genetic susceptibility polymorphisms in the
HLA region and the suspected microbial involvement. In order to understand the interplay
between the different factors, an integrated survey of the high throughput datasets need to be
conducted. This thesis presents the first study to integrate the microarray and microbiome
results for psoriasis in order to evaluate the cross talk between the host and the microbiome. It
is also the first study to provide a metagenome analysis of the skin microbiome even if the gene
content was predicted from 16S abundance data.
In this thesis, psoriasis transcriptome was studied using open source mRNA microarray datasets
which provided a large cohort of samples to analyze psoriasis in the context of other
inflammatory skin conditions, skin cancer, and wound healing. Psoriasis transcriptome was
highly consistent across different studies which suggests that the manifestation of the disease is
uniform across different patient cohorts and the technologies that have been used were
reliable. The genes that are consistently altered across different datasets provided a distinctive
signature for psoriasis from other inflammatory skin conditions. On the other hand,
transcriptome similarities could be observed between psoriasis and wound healing. This was
consistent with clinical observations that psoriasis is a disease of hyper-proliferating
keratinocytes with an inflammatory component. The pathways that were enriched with
significantly altered psoriasis genes showed inflammatory signatures. The genes that are
exclusive to either psoriasis or wound healing such as IL-19, CXCL9, and CXCL11 can be explored
as drug targets. This would reduce the side effects and balance between the healthy

86
inflammatory responses needed for healing and the inflammatory response that is responsible
for the autoimmune aspect. Psoriasis gene signature also suggested a pathogenic component to
the disease. Its gene signature overlapped with pathogenic KEGG pathways such as bacterial
invasion of epithelial cells. The upregulation of immune response and antimicrobial genes as
well as their overlap with pathogenic pathways required a microbiome analysis to illuminate the
role of crosstalk between the host and the microbiome in the maintenance of psoriatic flares.
The microbiome of psoriasis has been evaluated through multiple 16S studies to compare the
psoriasis flares as well as healthy control cohorts. Even though 16S data is very useful in
understanding the bacterial composition of the skin, 16S alone does not answer questions about
the functional perturbations. Until the DNA extraction and technologies are developed to
reliably conduct a metagenomics analysis of the skin microbiome, 16S and previously annotated
bacterial genomes can be used to predict the genomic content of a microbial community. This
thesis provides a novel approach to understand the functional perturbations caused by the
microbiome in psoriasis flares. The results from the analysis of open source 16S psoriasis
datasets show overabundance of opportunistic bacteria such as the OTUs belonging to the
genera Corynebacterium and Staphylococcus in the psoriasis microbiome. The functional
perturbations that are common across different body sites show an overabundance of virulence
factors in the psoriasis microbiome such as yeeJ (adhesion / invasion), yscF, sctF, yscW, sctW
(type III secretion proteins), pagC (putative virulence related protein), pla, ompT (plasminogen
related genes), gspS (type II secretion proteins), and acfC. The overabundance of the virulence
factors and their intersection with the bacterial invasion of epithelial cells pathway suggests
virulence factors affecting the pathogenesis or maintenance of the psoriasis flares.

87
Aside from the environmental factors affecting psoriasis, genetic factors also play great part in
the susceptibility to psoriasis. Extended HLA is a 4 Mb long region located on the chromosomal
position 6p21. It is a gene dense region with critical immune functions for initiating the adaptive
immune response and distinguishing self from non-self. Single nucleotide polymorphisms (SNPs)
and genes in this region have been associated in literature with many conditions, including
psoriasis. In order to identify susceptibility SNPs in the HLA region, the SNPs typed in the
HapMap data (11 ethnic populations) within the HLA region have been analyzed using extended
haplotype homozygosity based tests to identify positive selection on polymorphisms that have
not yet reached fixation. Results show regional specificity of positive selection signals on the
sub-classes of HLA. The positive selection signals in Class I sub-region show European ancestry
specificity with intronic SNPs on genes PSORS1C1, TCF19, MUC22, TRIM10 and TRIM15. In the
Class III region, there is positive selection signals for the East Asian populations, especially on
the genes NOTCH4, C6orf10 and BTNL2. Finally, there is African ancestry specific positive
selection signals on Class II genes, specifically HLA-DOA and HLA-DPA; both HLA class II alpha
chain paralogues expressed in antigen presenting cells. The cross population tests show there
are more haplotype differences within the same geographical populations than between. Similar
to single population tests, cross population test results show that the significant SNPs are
concentrated in the Class II region for African ancestry populations, whereas for European
ancestry populations, they are concentrated in the Class I region.
Three techniques were developed and applied in this thesis to explore a complex skin condition.
The methods used in the microarray analysis of psoriasis revealed that psoriasis had consistent
gene signatures that showed upregulation of immune function, keratinization, and antimicrobial
activity. The microbiome analysis showed that there were composition differences in psoriasis

88
patients compared to healthy cohorts. The analysis also demonstrated that the functional
perturbations presented an overabundance of virulence factors. Scanning the HLA region for
positive selection across populations with different ethnic backgrounds indicated that there are
region specific signals for each class of HLA genes. Together, these approaches comprise a
systems biology approach to tackle complex diseases. The methods that are explored in this
thesis can be applied to other conditions to better understand their mechanisms, explore the
environmental effects, and identify new drug targets.

89
Future Work
This research describes a pipeline to evaluate the gene expression and microbiome
perturbations linked to psoriasis as well as the genetic implications of a complex disease. The
explained pipeline can be extended to evaluate other autoimmune disease and complex
conditions as more open source data accumulates.
The biomarkers for psoriasis expression in the host that have been identified through
computational analysis need to be validated for accuracy and efficacy in patient population. The
microbiome genes identified through metagenome prediction in the second chapter also need
to be validated through deep sequencing, preferably for the same patient population. These
require a large patient cohort, IRB approval and assay development, which is beyond the scope
of the project.

90
Bibliography
1. Lleo, A., et al., Definition of human autoimmunity--autoantibodies versus autoimmune disease. Autoimmun Rev, 2010. 9(5): p. A259-66.
2. Cho, J.H. and P.K. Gregersen, Genomics and the multifactorial nature of human autoimmune disease. N Engl J Med, 2011. 365(17): p. 1612-23.
3. Clark, P.M., et al., Bioinformatics analysis reveals transcriptome and microRNA signatures and drug repositioning targets for IBD and other autoimmune diseases. Inflamm Bowel Dis, 2012. 18(12): p. 2315-33.
4. Parisi, R., et al., Global epidemiology of psoriasis: a systematic review of incidence and prevalence. J Invest Dermatol, 2013. 133(2): p. 377-85.
5. Lewis-Jones, S., Quality of life and childhood atopic dermatitis: the misery of living with childhood eczema. Int J Clin Pract, 2006. 60(8): p. 984-92.
6. Lebwohl, M.G., et al., Patient perspectives in the management of psoriasis: Results from the population-based Multinational Assessment of Psoriasis and Psoriatic Arthritis Survey. J Am Acad Dermatol, 2014. 70(5): p. 871-881 e30.
7. Raychaudhuri, S.K., E. Maverakis, and S.P. Raychaudhuri, Diagnosis and classification of psoriasis. Autoimmun Rev, 2014. 13(4-5): p. 490-5.
8. Elder, J.T., et al., Molecular dissection of psoriasis: integrating genetics and biology. J Invest Dermatol, 2010. 130(5): p. 1213-26.
9. Wolk, K., et al., Excessive body weight and smoking associates with a high risk of onset of plaque psoriasis. Acta Derm Venereol, 2009. 89(5): p. 492-7.
10. Queiro, R., et al., Age at disease onset: a key factor for understanding psoriatic disease. Rheumatology (Oxford), 2013.
11. Nguyen, T. and R. Zuniga, Skin conditions: new drugs for managing skin disorders. FP Essent, 2013. 407: p. 11-6.
12. Naldi, L., et al., Diet and physical exercise in psoriasis: a randomized controlled trial. Br J Dermatol, 2014. 170(3): p. 634-42.
13. Fowler, J.F., et al., The impact of psoriasis on health care costs and patient work loss. J Am Acad Dermatol, 2008. 59(5): p. 772-80.
14. Gelfand, J.M., et al., Risk of myocardial infarction in patients with psoriasis. JAMA, 2006. 296(14): p. 1735-41.
15. Shaharyar, S., et al., Subclinical cardiovascular disease in plaque psoriasis: association or causal link? Atherosclerosis, 2014. 232(1): p. 72-8.
16. Rahman, P. and J.T. Elder, Genetic epidemiology of psoriasis and psoriatic arthritis. Ann Rheum Dis, 2005. 64 Suppl 2: p. ii37-9; discussion ii40-1.
17. Lee, M.S., R.Y. Lin, and M.S. Lai, Increased risk of diabetes mellitus in relation to the severity of psoriasis, concomitant medication, and comorbidity: a nationwide population-based cohort study. J Am Acad Dermatol, 2014. 70(4): p. 691-8.
18. Zippi, M., et al., Biological therapy for dermatological manifestations of inflammatory bowel disease. World J Clin Cases, 2013. 1(2): p. 74-78.
19. Suarez-Farinas, M., et al., Expanding the psoriasis disease profile: interrogation of the skin and serum of patients with moderate-to-severe psoriasis. J Invest Dermatol, 2012. 132(11): p. 2552-64.

91
20. Bumgarner, R., Overview of DNA microarrays: types, applications, and their future. Curr Protoc Mol Biol, 2013. Chapter 22: p. Unit 22 1.
21. International HapMap, C., The International HapMap Project. Nature, 2003. 426(6968): p. 789-96.
22. Genomes Project, C., et al., An integrated map of genetic variation from 1,092 human genomes. Nature, 2012. 491(7422): p. 56-65.
23. Peterson, J., et al., The NIH Human Microbiome Project. Genome Res, 2009. 19(12): p. 2317-23.
24. Akbani, R., et al., A pan-cancer proteomic perspective on The Cancer Genome Atlas. Nat Commun, 2014. 5: p. 3887.
25. Alekseyenko, A.V., et al., Community differentiation of the cutaneous microbiota in psoriasis. Microbiome, 2013. 1(1): p. 31.
26. Mardis, E.R., A decade's perspective on DNA sequencing technology. Nature, 2011. 470(7333): p. 198-203.
27. Metzker, M.L., Sequencing technologies - the next generation. Nat Rev Genet, 2010. 11(1): p. 31-46.
28. Woo, P.C., et al., Then and now: use of 16S rDNA gene sequencing for bacterial identification and discovery of novel bacteria in clinical microbiology laboratories. Clin Microbiol Infect, 2008. 14(10): p. 908-34.
29. Nickoloff, B.J., et al., Lessons learned from psoriatic plaques concerning mechanisms of tissue repair, remodeling, and inflammation. J Investig Dermatol Symp Proc, 2006. 11(1): p. 16-29.
30. Yao, Y., et al., Type I interferon: potential therapeutic target for psoriasis? PLoS One, 2008. 3(7): p. e2737.
31. Johnston, A., et al., Early tissue responses in psoriasis to the anti-TNF-alpha biologic etanercept suggest reduced IL-17R expression and signalling. Br J Dermatol, 2014.
32. Swindell, W.R., et al., Cellular dissection of psoriasis for transcriptome analyses and the post-GWAS era. BMC Med Genomics, 2014. 7: p. 27.
33. Tian, S., et al., Meta-analysis derived (MAD) transcriptome of psoriasis defines the "core" pathogenesis of disease. PLoS One, 2012. 7(9): p. e44274.
34. Bigler, J., et al., Cross-study homogeneity of psoriasis gene expression in skin across a large expression range. PLoS One, 2013. 8(1): p. e52242.
35. Lowe, N.J., et al., Psoriasiform dermatosis in a rhesus monkey. J Invest Dermatol, 1981. 76(2): p. 141-3.
36. Swindell, W.R., et al., Genome-wide expression profiling of five mouse models identifies similarities and differences with human psoriasis. PLoS One, 2011. 6(4): p. e18266.
37. Seok, J., et al., Genomic responses in mouse models poorly mimic human inflammatory diseases. Proc Natl Acad Sci U S A, 2013. 110(9): p. 3507-12.
38. Takao, K. and T. Miyakawa, Genomic responses in mouse models greatly mimic human inflammatory diseases. Proc Natl Acad Sci U S A, 2015. 112(4): p. 1167-72.
39. Choy, D.F., et al., Comparative transcriptomic analyses of atopic dermatitis and psoriasis reveal shared neutrophilic inflammation. J Allergy Clin Immunol, 2012. 130(6): p. 1335-43 e5.
40. Noh, M., et al., MAP17 is associated with the T-helper cell cytokine-induced down-regulation of filaggrin transcription in human keratinocytes. Exp Dermatol, 2010. 19(4): p. 355-62.
41. Kamsteeg, M., et al., Molecular diagnostics of psoriasis, atopic dermatitis, allergic contact dermatitis and irritant contact dermatitis. Br J Dermatol, 2010. 162(3): p. 568-78.
92
42. D'Erme, A.M., et al., IL-36gamma (IL-1F9) Is a Biomarker for Psoriasis Skin Lesions. J Invest Dermatol, 2015. 135(4): p. 1025-32.
43. Morhenn, V.B., T.E. Nelson, and D.L. Gruol, The rate of wound healing is increased in psoriasis. J Dermatol Sci, 2013. 72(2): p. 87-92.
44. Gillitzer, R. and M. Goebeler, Chemokines in cutaneous wound healing. J Leukoc Biol, 2001. 69(4): p. 513-21.
45. Spurgeon, M.E. and P.F. Lambert, Merkel cell polyomavirus: a newly discovered human virus with oncogenic potential. Virology, 2013. 435(1): p. 118-30.
46. Schauber, J. and R.L. Gallo, Antimicrobial peptides and the skin immune defense system. J Allergy Clin Immunol, 2009. 124(3 Suppl 2): p. R13-8.
47. Li, B., et al., Transcriptome Analysis of Psoriasis in a Large Case-Control Sample: RNA-Seq Provides Insights into Disease Mechanisms. J Invest Dermatol, 2014.
48. Edgar, R., M. Domrachev, and A.E. Lash, Gene Expression Omnibus: NCBI gene expression and hybridization array data repository. Nucleic Acids Res, 2002. 30(1): p. 207-10.
49. Gautier, L., et al., affy--analysis of Affymetrix GeneChip data at the probe level. Bioinformatics, 2004. 20(3): p. 307-15.
50. Dai, M., et al., Evolving gene/transcript definitions significantly alter the interpretation of GeneChip data. Nucleic Acids Res, 2005. 33(20): p. e175.
51. Tusher, V.G., R. Tibshirani, and G. Chu, Significance analysis of microarrays applied to the ionizing radiation response. Proc Natl Acad Sci U S A, 2001. 98(9): p. 5116-21.
52. Breitling, R., et al., Rank products: a simple, yet powerful, new method to detect differentially regulated genes in replicated microarray experiments. FEBS Lett, 2004. 573(1-3): p. 83-92.
53. Chang, L.C., et al., Meta-analysis methods for combining multiple expression profiles: comparisons, statistical characterization and an application guideline. BMC Bioinformatics, 2013. 14: p. 368.
54. Dice, L.R., Measures of the Amount of Ecologic Association Between Species. Ecology, 1945. 26(3): p. 297.
55. Falcon, S. and R. Gentleman, Using GOstats to test gene lists for GO term association. Bioinformatics, 2007. 23(2): p. 257-8.
56. Ashburner, M., et al., Gene ontology: tool for the unification of biology. The Gene Ontology Consortium. Nat Genet, 2000. 25(1): p. 25-9.
57. Kanehisa, M. and S. Goto, KEGG: kyoto encyclopedia of genes and genomes. Nucleic Acids Res, 2000. 28(1): p. 27-30.
58. Hochberg, Y. and Y. Benjamini, More powerful procedures for multiple significance testing. Stat Med, 1990. 9(7): p. 811-8.
59. Kanehisa, M., et al., Data, information, knowledge and principle: back to metabolism in KEGG. Nucleic Acids Res, 2014. 42(Database issue): p. D199-205.
60. Chen, L., et al., VFDB: a reference database for bacterial virulence factors. Nucleic Acids Res, 2005. 33(Database issue): p. D325-8.
61. Chen, L., et al., VFDB 2012 update: toward the genetic diversity and molecular evolution of bacterial virulence factors. Nucleic Acids Res, 2012. 40(Database issue): p. D641-5.
62. Durmus Tekir, S., et al., PHISTO: pathogen-host interaction search tool. Bioinformatics, 2013. 29(10): p. 1357-8.
63. Suarez-Farinas, M., et al., Nonlesional atopic dermatitis skin is characterized by broad terminal differentiation defects and variable immune abnormalities. J Allergy Clin Immunol, 2011. 127(4): p. 954-64 e1-4.

93
64. Gittler, J.K., et al., Progressive activation of T(H)2/T(H)22 cytokines and selective epidermal proteins characterizes acute and chronic atopic dermatitis. J Allergy Clin Immunol, 2012. 130(6): p. 1344-54.
65. Tintle, S., et al., Reversal of atopic dermatitis with narrow-band UVB phototherapy and biomarkers for therapeutic response. J Allergy Clin Immunol, 2011. 128(3): p. 583-93 e1-4.
66. Guttman-Yassky, E., et al., Broad defects in epidermal cornification in atopic dermatitis identified through genomic analysis. J Allergy Clin Immunol, 2009. 124(6): p. 1235-1244 e58.
67. Pedersen, M.B., et al., Gene expression time course in the human skin during elicitation of allergic contact dermatitis. J Invest Dermatol, 2007. 127(11): p. 2585-95.
68. Harms, P.W., et al., Distinct gene expression profiles of viral- and nonviral-associated merkel cell carcinoma revealed by transcriptome analysis. J Invest Dermatol, 2013. 133(4): p. 936-45.
69. Nuutila, K., et al., Human skin transcriptome during superficial cutaneous wound healing. Wound Repair Regen, 2012. 20(6): p. 830-9.
70. Dawany, N.B., W.N. Dampier, and A. Tozeren, Large-scale integration of microarray data reveals genes and pathways common to multiple cancer types. Int J Cancer, 2011. 128(12): p. 2881-91.
71. Guo, P., et al., Gene expression profile based classification models of psoriasis. Genomics, 2014. 103(1): p. 48-55.
72. Gudjonsson, J.E., et al., Assessment of the psoriatic transcriptome in a large sample: additional regulated genes and comparisons with in vitro models. J Invest Dermatol, 2010. 130(7): p. 1829-40.
73. de Koning, H.D., et al., Expression profile of cornified envelope structural proteins and keratinocyte differentiation-regulating proteins during skin barrier repair. Br J Dermatol, 2012. 166(6): p. 1245-54.
74. Carrier, Y., et al., Inter-regulation of Th17 cytokines and the IL-36 cytokines in vitro and in vivo: implications in psoriasis pathogenesis. J Invest Dermatol, 2011. 131(12): p. 2428-37.
75. Lessard, J.C., et al., Keratin 16 regulates innate immunity in response to epidermal barrier breach. Proc Natl Acad Sci U S A, 2013. 110(48): p. 19537-42.
76. Hegazy, R.A., et al., Psoriasis and metabolic syndrome: is peroxisome proliferator-activated receptor-gamma part of the missing link? Eur J Dermatol, 2012. 22(5): p. 622-8.
77. Lima Ede, A., et al., Peroxisome proliferator-activated receptor agonists (PPARs): a promising prospect in the treatment of psoriasis and psoriatic arthritis. An Bras Dermatol, 2013. 88(6): p. 1029-35.
78. Lu, X., et al., Transcriptional regulatory network for psoriasis. J Dermatol, 2013. 40(1): p. 48-53.
79. Filkor, K., et al., Genome wide transcriptome analysis of dendritic cells identifies genes with altered expression in psoriasis. PLoS One, 2013. 8(9): p. e73435.
80. Gravani, A., et al., Synthetic antimalarial drugs and the triggering of psoriasis - do we need disease-specific guidelines for the management of patients with psoriasis at risk of malaria? Int J Dermatol, 2014. 53(3): p. 327-30.
81. Pan, H.F., et al., Expression profiles of Th17 pathway related genes in human systemic lupus erythematosus. Mol Biol Rep, 2013. 40(1): p. 391-9.
82. Kirkham, B.W., A. Kavanaugh, and K. Reich, Interleukin-17A: a unique pathway in immune-mediated diseases: psoriasis, psoriatic arthritis and rheumatoid arthritis. Immunology, 2014. 141(2): p. 133-42.

94
83. de Vlam, K., A.B. Gottlieb, and P.J. Mease, Current Concepts in Psoriatic Arthritis: Pathogenesis and Management. Acta Derm Venereol, 2014.
84. Koster, M.I. and D.R. Roop, Mechanisms regulating epithelial stratification. Annu Rev Cell Dev Biol, 2007. 23: p. 93-113.
85. Gallo, R.L. and L.V. Hooper, Epithelial antimicrobial defence of the skin and intestine. Nat Rev Immunol, 2012. 12(7): p. 503-16.
86. Gao, Z., et al., Substantial alterations of the cutaneous bacterial biota in psoriatic lesions. PLoS One, 2008. 3(7): p. e2719.
87. Fahlen, A., et al., Comparison of bacterial microbiota in skin biopsies from normal and psoriatic skin. Arch Dermatol Res, 2012. 304(1): p. 15-22.
88. Zeeuwen, P.L., et al., Microbiome and skin diseases. Curr Opin Allergy Clin Immunol, 2013. 13(5): p. 514-20.
89. Munz, O.H., et al., Evidence for the presence of bacteria in the blood of psoriasis patients. Arch Dermatol Res, 2010. 302(7): p. 495-8.
90. Jie, Z., et al., Intrahepatic innate lymphoid cells secrete IL-17A and IL-17F that are crucial for T cell priming in viral infection. J Immunol, 2014. 192(7): p. 3289-300.
91. Reitamo, S., et al., Efficacy of sirolimus (rapamycin) administered concomitantly with a subtherapeutic dose of cyclosporin in the treatment of severe psoriasis: a randomized controlled trial. Br J Dermatol, 2001. 145(3): p. 438-45.
92. Sandrini, S., et al., Steroid withdrawal five days after renal transplantation allows for the prevention of wound-healing complications associated with sirolimus therapy. Clin Transplant, 2009. 23(1): p. 16-22.
93. Peranteau, W.H., et al., IL-10 overexpression decreases inflammatory mediators and promotes regenerative healing in an adult model of scar formation. J Invest Dermatol, 2008. 128(7): p. 1852-60.
94. Asadullah, K., et al., Interleukin 10 treatment of psoriasis: clinical results of a phase 2 trial. Arch Dermatol, 1999. 135(2): p. 187-92.
95. Lin, Z.Q., et al., Essential involvement of IL-6 in the skin wound-healing process as evidenced by delayed wound healing in IL-6-deficient mice. J Leukoc Biol, 2003. 73(6): p. 713-21.
96. Goodman, W.A., et al., IL-6 signaling in psoriasis prevents immune suppression by regulatory T cells. J Immunol, 2009. 183(5): p. 3170-6.
97. Yeilding, N., et al., Development of the IL-12/23 antagonist ustekinumab in psoriasis: past, present, and future perspectives. Ann N Y Acad Sci, 2011. 1222: p. 30-9.
98. Gudjonsson, J.E., et al., Streptococcal throat infections and exacerbation of chronic plaque psoriasis: a prospective study. Br J Dermatol, 2003. 149(3): p. 530-4.
99. Campanati, A., et al., Helicobacter pylori infection in psoriasis: results of a clinical study and review of the literature. Int J Dermatol, 2015.
100. Tomi, N.S., B. Kranke, and E. Aberer, Staphylococcal toxins in patients with psoriasis, atopic dermatitis, and erythroderma, and in healthy control subjects. J Am Acad Dermatol, 2005. 53(1): p. 67-72.
101. Dekio, I., et al., Characterization of skin microbiota in patients with atopic dermatitis and in normal subjects using 16S rRNA gene-based comprehensive analysis. J Med Microbiol, 2007. 56(Pt 12): p. 1675-83.
102. Grice, E.A. and J.A. Segre, The skin microbiome. Nat Rev Microbiol, 2011. 9(4): p. 244-53. 103. Wheeler, D.L., et al., Database resources of the National Center for Biotechnology
Information. Nucleic Acids Res, 2008. 36(Database issue): p. D13-21.

95
104. AmGut. The American Gut Project. [cited 2014 August]; Available from: http://humanfoodproject.com/americangut/.
105. Caporaso, J.G., et al., QIIME allows analysis of high-throughput community sequencing data. Nat Methods, 2010. 7(5): p. 335-6.
106. DeSantis, T.Z., et al., Greengenes, a chimera-checked 16S rRNA gene database and workbench compatible with ARB. Appl Environ Microbiol, 2006. 72(7): p. 5069-72.
107. Langille, M.G., et al., Predictive functional profiling of microbial communities using 16S rRNA marker gene sequences. Nat Biotechnol, 2013. 31(9): p. 814-21.
108. Sawilowsky, S.S., Mann-Whitney U Test (Wilcoxon Rank-Sum Test). Encyclopedia of Measurement and Statistics. SAGE Publications, Inc. 2007, Thousand Oaks, CA: SAGE Publications, Inc. 566-568.
109. Quekenborn-Trinquet, V., et al., Gene expression profiles in psoriasis: analysis of impact of body site location and clinical severity. Br J Dermatol, 2005. 152(3): p. 489-504.
110. Otto, M., Staphylococcus epidermidis--the 'accidental' pathogen. Nat Rev Microbiol, 2009. 7(8): p. 555-67.
111. Murphy, E.C. and I.M. Frick, Gram-positive anaerobic cocci--commensals and opportunistic pathogens. FEMS Microbiol Rev, 2013. 37(4): p. 520-53.
112. Giri, D.D., et al., Salt stress tolerance of methylotrophic bacteria Methylophilus sp. and Methylobacterium sp. isolated from coal mine spoils. Pol J Microbiol, 2013. 62(3): p. 273-80.
113. Chou, Y.J., et al., Schlegelella aquatica sp. nov., a novel thermophilic bacterium isolated from a hot spring. Int J Syst Evol Microbiol, 2006. 56(Pt 12): p. 2793-7.
114. Hospodsky, D., et al., Hand bacterial communities vary across two different human populations. Microbiology, 2014. 160(Pt 6): p. 1144-52.
115. Osei-Owusu, P., et al., The N terminus of type III secretion needle protein YscF from Yersinia pestis functions to modulate innate immune responses. Infect Immun, 2015. 83(4): p. 1507-22.
116. Jessen, D.L., et al., Type III secretion needle proteins induce cell signaling and cytokine secretion via Toll-like receptors. Infect Immun, 2014. 82(6): p. 2300-9.
117. Bi, Y., et al., Yersinia pestis and host macrophages: immunodeficiency of mouse macrophages induced by YscW. Immunology, 2009. 128(1 Suppl): p. e406-17.
118. Burghout, P., et al., Role of the pilot protein YscW in the biogenesis of the YscC secretin in Yersinia enterocolitica. J Bacteriol, 2004. 186(16): p. 5366-75.
119. Korotkov, K.V. and W.G. Hol, Crystal structure of the pilotin from the enterohemorrhagic Escherichia coli type II secretion system. J Struct Biol, 2013. 182(2): p. 186-91.
120. Pulkkinen, W.S. and S.I. Miller, A Salmonella typhimurium virulence protein is similar to a Yersinia enterocolitica invasion protein and a bacteriophage lambda outer membrane protein. J Bacteriol, 1991. 173(1): p. 86-93.
121. Nishio, M., et al., Identification of the outer-membrane protein PagC required for the serum resistance phenotype in Salmonella enterica serovar Choleraesuis. Microbiology, 2005. 151(Pt 3): p. 863-73.
122. Haiko, J., et al., The omptins of Yersinia pestis and Salmonella enterica cleave the reactive center loop of plasminogen activator inhibitor 1. J Bacteriol, 2010. 192(18): p. 4553-61.
123. Koestler, S.A., et al., Arp2/3 complex is essential for actin network treadmilling as well as for targeting of capping protein and cofilin. Mol Biol Cell, 2013. 24(18): p. 2861-75.
124. Kwon, K.W., H. Park, and J. Doh, Migration of T cells on surfaces containing complex nanotopography. PLoS One, 2013. 8(9): p. e73960.

96
125. Zhou, K., et al., Actin-related protein2/3 complex regulates tight junctions and terminal differentiation to promote epidermal barrier formation. Proc Natl Acad Sci U S A, 2013. 110(40): p. E3820-9.
126. McGhie, E.J., et al., Salmonella takes control: effector-driven manipulation of the host. Curr Opin Microbiol, 2009. 12(1): p. 117-24.
127. Hauck, C.R. and K. Ohlsen, Sticky connections: extracellular matrix protein recognition and integrin-mediated cellular invasion by Staphylococcus aureus. Curr Opin Microbiol, 2006. 9(1): p. 5-11.
128. Kasraie, S., et al., Macrophages from patients with atopic dermatitis show a reduced CXCL10 expression in response to staphylococcal alpha-toxin. Allergy, 2012. 67(1): p. 41-9.
129. Myles, I.A., et al., Signaling via the IL-20 receptor inhibits cutaneous production of IL-1beta and IL-17A to promote infection with methicillin-resistant Staphylococcus aureus. Nat Immunol, 2013. 14(8): p. 804-11.
130. Ferran, M., et al., Streptococcus induces circulating CLA(+) memory T-cell-dependent epidermal cell activation in psoriasis. J Invest Dermatol, 2013. 133(4): p. 999-1007.
131. Broshtilova, V., V. Lozanov, and L. Miteva, Polyamine metabolism changes in psoriasis. Indian J Dermatol, 2013. 58(4): p. 306-9.
132. Sheikh, G., et al., Comparison of levels of serum copper, zinc, albumin, globulin and alkaline phosphatase in psoriatic patients and controls: A hospital based casecontrol study. Indian Dermatol Online J, 2015. 6(2): p. 81-3.
133. Welter, D., et al., The NHGRI GWAS Catalog, a curated resource of SNP-trait associations. Nucleic Acids Res, 2014. 42(Database issue): p. D1001-6.
134. Beck, T., et al., GWAS Central: a comprehensive resource for the comparison and interrogation of genome-wide association studies. Eur J Hum Genet, 2014. 22(7): p. 949-52.
135. Fooksman, D.R., Organizing MHC Class II Presentation. Front Immunol, 2014. 5: p. 158. 136. Cagliani, R., et al., Balancing selection is common in the extended MHC region but most
alleles with opposite risk profile for autoimmune diseases are neutrally evolving. BMC Evol Biol, 2011. 11: p. 171.
137. Das, S., et al., Fine mapping of eight psoriasis susceptibility loci. Eur J Hum Genet, 2014. 138. Okada, Y., et al., Genetics of rheumatoid arthritis contributes to biology and drug
discovery. Nature, 2014. 506(7488): p. 376-81. 139. Asano, K., et al., A genome-wide association study identifies three new susceptibility loci
for ulcerative colitis in the Japanese population. Nat Genet, 2009. 41(12): p. 1325-9. 140. Kim, Y.J., et al., A genome-wide association study identified new variants associated with
the risk of chronic hepatitis B. Hum Mol Genet, 2013. 22(20): p. 4233-8. 141. International, H.I.V.C.S., et al., The major genetic determinants of HIV-1 control affect HLA
class I peptide presentation. Science, 2010. 330(6010): p. 1551-7. 142. Fellay, J., et al., Common genetic variation and the control of HIV-1 in humans. PLoS
Genet, 2009. 5(12): p. e1000791. 143. Lonnberg, A.S., et al., Heritability of psoriasis in a large twin sample. Br J Dermatol, 2013.
169(2): p. 412-6. 144. McKusick-Nathans Institute of Genetic Medicine, J.H.U. Online Mendelian Inheritence in
Man, OMIM. Available from: http://omim.org. 145. Chandra, A., et al., Genetic and epigenetic basis of psoriasis pathogenesis. Mol Immunol,
2015. 64(2): p. 313-23. 146. Rachakonda, T., C. Schupp, and A. Armstrong, Psoriasis prevalence among adults in the
United States. J Am Acad Dermatol, 2014. 70(3): p. 512.

97
147. Fernando, M.M., et al., Defining the role of the MHC in autoimmunity: a review and pooled analysis. PLoS Genet, 2008. 4(4): p. e1000024.
148. Lam, T.H., et al., Population-specific recombination sites within the human MHC region. Heredity (Edinb), 2013. 111(2): p. 131-8.
149. McEvoy, B.P., et al., Geographical structure and differential natural selection among North European populations. Genome Res, 2009. 19(5): p. 804-14.
150. Walsh, E.C., et al., An integrated haplotype map of the human major histocompatibility complex. Am J Hum Genet, 2003. 73(3): p. 580-90.
151. Miretti, M.M., et al., A high-resolution linkage-disequilibrium map of the human major histocompatibility complex and first generation of tag single-nucleotide polymorphisms. Am J Hum Genet, 2005. 76(4): p. 634-46.
152. Suo, C., et al., Natural positive selection and north-south genetic diversity in East Asia. Eur J Hum Genet, 2012. 20(1): p. 102-10.
153. Bhatia, G., et al., Genome-wide comparison of African-ancestry populations from CARe and other cohorts reveals signals of natural selection. Am J Hum Genet, 2011. 89(3): p. 368-81.
154. International HapMap, C., et al., Integrating common and rare genetic variation in diverse human populations. Nature, 2010. 467(7311): p. 52-8.
155. Sabeti, P.C., et al., Detecting recent positive selection in the human genome from haplotype structure. Nature, 2002. 419(6909): p. 832-7.
156. Voight, B.F., et al., A map of recent positive selection in the human genome. PLoS Biol, 2006. 4(3): p. e72.
157. Tang, K., K.R. Thornton, and M. Stoneking, A new approach for using genome scans to detect recent positive selection in the human genome. PLoS Biol, 2007. 5(7): p. e171.
158. Shiina, T., et al., The HLA genomic loci map: expression, interaction, diversity and disease. J Hum Genet, 2009. 54(1): p. 15-39.
159. Cunningham, F., et al., Ensembl 2015. Nucleic Acids Res, 2015. 43(Database issue): p. D662-9.
160. Kent, W.J., et al., The human genome browser at UCSC. Genome Res, 2002. 12(6): p. 996-1006.
161. Paten, B., et al., Enredo and Pecan: genome-wide mammalian consistency-based multiple alignment with paralogs. Genome Res, 2008. 18(11): p. 1814-28.
162. Paten, B., et al., Genome-wide nucleotide-level mammalian ancestor reconstruction. Genome Res, 2008. 18(11): p. 1829-43.
163. Fuerst, P.A., R. Chakraborty, and M. Nei, Statistical studies on protein polymorphism in natural populations. I. Distribution of single locus heterozygosity. Genetics, 1977. 86(2 Pt. 1): p. 455-83.
164. Wall, J.D., et al., A novel DNA sequence database for analyzing human demographic history. Genome Res, 2008. 18(8): p. 1354-61.
165. Obenchain, V., et al., VariantAnnotation: a Bioconductor package for exploration and annotation of genetic variants. Bioinformatics, 2014. 30(14): p. 2076-8.
166. Rappaport, N., et al., MalaCards: an integrated compendium for diseases and their annotation. Database (Oxford), 2013. 2013: p. bat018.
167. Leish, G.E.N.C., et al., Common variants in the HLA-DRB1-HLA-DQA1 HLA class II region are associated with susceptibility to visceral leishmaniasis. Nat Genet, 2013. 45(2): p. 208-13.
168. Holm, S.J., et al., Polymorphisms in the SEEK1 and SPR1 genes on 6p21.3 associate with psoriasis in the Swedish population. Exp Dermatol, 2003. 12(4): p. 435-44.
98
169. Sun, H., et al., PSORS1C1 may be involved in rheumatoid arthritis. Immunol Lett, 2013. 153(1-2): p. 9-14.
170. Anderson, C.A., et al., Meta-analysis identifies 29 additional ulcerative colitis risk loci, increasing the number of confirmed associations to 47. Nat Genet, 2011. 43(3): p. 246-52.
171. Franke, A., et al., Genome-wide meta-analysis increases to 71 the number of confirmed Crohn's disease susceptibility loci. Nat Genet, 2010. 42(12): p. 1118-25.
172. Dupuis, J., et al., New genetic loci implicated in fasting glucose homeostasis and their impact on type 2 diabetes risk. Nat Genet, 2010. 42(2): p. 105-16.
173. Su, L., et al., Association between the NOTCH4 gene rs3131296 polymorphism with schizophrenia risk in the Chinese Zhuang population and Chinese Han population. Acta Neuropsychiatr, 2014. 26(4): p. 240-5.
174. Naruse, T.K., et al., Limited polymorphism in the HLA-DOA gene. Tissue Antigens, 1999. 53(4 Pt 1): p. 359-65.

99
Appendices
Appendix A
Psoriasis upregulated genes (Benjamini < 0.01 and fold change > 1.5) overlapped with
Rheumatoid Arthritis KEGG pathway. Genes belonging to IL-17 immune response are commonly
altered between psoriasis and rheumatoid arthritis. AC_down: psoriasis A/C consensus
downregulated gene signature, AC_up: psoriasis A/C consensus upregulated gene signature,
AU_down: psoriasis A/U downregulated consensus gene signature, AU_up: psoriasis A/U
upregulated consensus gene signature.

100
Appendix B
Psoriasis upregulated genes (Benjamini < 0.01 and fold change > 1.5) overlapped with Dilated
Cardiomyopathy KEGG pathway. The pathway is crowded with downregulated genes in psoriasis
transcriptome. AC_down: psoriasis A/C consensus downregulated gene signature, AC_up:
psoriasis A/C consensus upregulated gene signature, AU_down: psoriasis A/U downregulated
consensus gene signature, AU_up: psoriasis A/U upregulated consensus gene signature.

101
Appendix C
The average frequencies of the HLA alleles that are under positive selection (iHS Benjamini < 0.01) in at least one population. The SNPs under
positive selection are in bold. The SNPs are labeled according to the sub-regions they are located on (Class I, Class III, Class II). The allele column
represents if the selection is on the ancestral allele (A) or derived allele (D). The SNPs are sorted according to their genomic positions. They are
also annotated with the gene they are located on (intron, coding, UTR, promoter) or around (intergenic within 20K basepairs). The iHS is not
calculated for frequencies above 0.95 and below 0.05. The SNPs that don't have any frequency data for a population are left blank.
Average Frequencies of the Alleles under Selection For intergenic SNPs
SNPs
Allele
mkk lwk yri asw chb jpt chd ceu tsi gih mex position location Gene
Symbol Preceding
Gene Following
Gene
Cla
ss I
rs9261434 D 0.042 0.023 0.044 0.026 0.004 0.033 0.009 0.106 0.123 0.079 0.052 30087776 intergenic
TRIM40 TRIM31
rs3094134 D 0.005 0 0.009 0 0.015 0.009 0.093 0.108 0.03 0.043 30122154 coding TRIM10
rs1573296 D 0.042 0.005 0
0 0
0.111 0.049
0.026 30127805 intron TRIM10
rs2523729 D 0.022 0.064 0.058 0.035 0 0
0.111 0.049
0.017 30137387 intron TRIM15
rs9261538 D 0.005
0.009
0.015 0.009 0.088 0.103 0.035 0.043 30143491 intergenic
TRIM26 TRIM10, TRIM15
rs3129988 D
0 0.009 0 0
0.084 0.059 0.005 0.026 30769478
rs1264361 D 0.01 0.023 0.02 0.053
0.007 0.005 0.128 0.049 0.015 0.043 30777498
rs886424 D 0.01 0.023 0.021 0.053 0 0.007 0.005 0.128 0.05 0.015 0.043 30782002
rs1264353 D
0.024
0 0
0.172
30787762
rs1264350 D 0.013 0.027 0.02 0.061 0.004 0.044 0.037 0.125 0.083 0.005 0.043 30796545
rs1634721 D 0.006 0.018 0.003
0 0
0.116 0.044
0.026 30977680 intron MUC22
rs9357105 D
0.014
0.066 0.117 0.101 0 0.005 0.005 0.009 31003923 intergenic
HCG22 MUC22
rs3130544 D 0.018 0.003
0 0
0.115 0.054
0.026 31058340

102
rs2256962 D
0.018
0.102 0.054 0.005 0.035 31065620 intergenic
CDSN, PSORS1C1,
C6orf15
rs2233956 D 0.029 0.023 0.01 0.053 0.009 0.026 0.028 0.204 0.137 0.208 0.086 31081205 promoter PSORS1C
1
rs4410768 D 0.026 0.041 0.003 0.018 0.106 0.022 0.014 0.009 0.005 0.094 0.009 31089708 intron PSORS1C
1
rs3130557 D 0.032 0.024 0.035 0 0
0.115 0.069
0.026 31094703 intron PSORS1C
1
rs28732100 D 0.022
0.018 0.009 0.029 0.028 0.084 0.049 0.198 0.017 31104593 intron PSORS1C
1
rs2233952 D
0 0.035 0.031 0.069 0.046 0.133 0.098 0.059 0.086 31105891 intron PSORS1C
1
rs1265097 D 0.101
0.222 0.102 0.022 0.102 0.043 0.099 0.167 0.126 0.245 31106459 coding PSORS1C
1
rs1265083 D 0.022 0.009 0.054
0 0
0.004 0.015
0.069 31111347 intron CCHCR1
rs130072 D 0.019 0.05 0.082 0.026 0.022 0.077 0.041 0.071 0.137 0.1 0.147 31112484 coding CCHCR1
rs7750641 D 0.013 0.023 0.003
0.004 0.004 0.005 0.112 0.059 0.005 0.034 31129310 coding TCF19
rs2073724 D 0.019 0.05 0.092 0.035 0.022 0.077 0.041 0.071 0.137 0.099 0.147 31129707 coding TCF19
rs17190776 D 0.019 0.05 0.092 0.035 0.022 0.077 0.041 0.071 0.137 0.099 0.147 31130865 threeUTR TCF19
rs3130933 D 0.048
0 0.026 0.062 0.029 0.009 0.159 0.093 0.03 0.043 31132085 intergenic NA PSORS1C3,
POU5F1 CCHCR1,
TCF19
Cla
ss III
rs9267487 D 0.157 0.068 0.017 0.061 0.018 0.033 0.018 0.066 0.064 0.163 0.121 31511350 promoter DDX39B
rs28732144 D 0.105 0.055 0.003 0.018
0.018 0.014 0.058 0.029 0.158 0.034 31556205 intron LST1
rs17207190 D 0.099 0.055 0.003 0.018
0.018 0.009 0.053 0.029 0.15 0.034 31569520 intergenic
AIF1, PRRC2A
NCR3, LTB, LST1
rs35502919 D
0.018
0.058 0.01
31604355 coding PRRC2A
rs3117582 D 0.048 0.014 0.041 0.026 0 0
0.08 0.064
0.026 31620520 intron APOM
rs3132449 D 0.049 0.023 0.044 0.026
0.08 0.064
0.035 31626013 intergenic
CSNK2B, C6orf47, LY6G5B, GPANK1, LY6G5C
APOM, BAG6
rs9267531 D 0.045 0.023 0.048 0.026 0 0
0.08 0.064
0.034 31636742 threeUTR CSNK2B
rs2854050 D 0.042 0.037 0.027 0.035 0.221 0.199 0.174 0.062 0.034 0.069 0.123 32185605 intron NOTCH4
rs2071282 D 0.005 0.003
0.102 0.062 0.032 0.004
0.01 0.018 32188943 coding NOTCH4
rs3132946 D
0.007 0.018 0 0.018 0.009 0.168 0.074 0.03 0.052 32190028 intron NOTCH4
rs3830041 D 0.256 0.2 0.218 0.123 0.195 0.12 0.092 0.084 0.108 0.183 0.121 32191339 intron NOTCH4
rs8192565 D 0.035 0.005 0.031 0.079 0.133 0.088 0.096 0.075 0.113 0.153 0.052 32191607 intron NOTCH4
rs12055568 D 0.074 0.046 0.007
0.128 0.193 0.197 0.013 0.039 0.005 0.121 32192083 promoter NOTCH4

103
rs549182 D 0.105 0.138 0.106 0.096 0.15 0.106 0.069 0.009 0.044 0.11 0.086 32205045 intergenic
NOTCH4
rs549270 D 0.125 0.164 0.126 0.158 0.15 0.109 0.087 0.013 0.07 0.149 0.138 32205072 intergenic
NOTCH4
rs2073047 A
0
0.084 0.15 0.156 0
0.026 32335899 intron C6orf10
rs2076535 D 0.003 0.005
0.181 0.077 0.018 0.004 0.005 0.054 0.017 32339511 fiveUTR C6orf10
rs3763309 D 0.077 0.041 0.071 0.088 0.084 0.102 0.11 0.265 0.162 0.198 0.267 32375973 promoter BTNL2
rs3763310 D
0
0.066 0.047 0.046 0
32376103 promoter BTNL2
rs3763312 D 0.077 0.036 0.071 0.088 0.085 0.103 0.11 0.265 0.158 0.198 0.267 32376348 promoter BTNL2
Cla
ss II
rs9784876 A 0.154 0.195 0.272 0.246 0.106 0.018 0.009 0.058 0.094 0.104 0.086 32788878 intron TAP2
rs4148876 D 0.064
0 0.018 0.167 0.085 0.042 0.093 0.049 0.035 0.103 32796793 intron TAP2
rs2228391 D 0.006 0.005
0.049 0.089 0.087
0.045 32797773 coding TAP2
rs3128935 D 0.157 0.359 0.293 0.228 0.164 0.172 0.165 0.04 0.054 0.104 0.095 32972404 threeUTR HLA-DOA
rs3129304 D 0.053 0.252 0.219 0.205 0.04 0.084 0.041 0.159 0.114 0.03 0.371 32973743 threeUTR HLA-DOA
rs3129303 D 0.074 0.264 0.221 0.211 0.04 0.088 0.046 0.159 0.114 0.03 0.371 32973878 threeUTR HLA-DOA
rs10947368 D 0.051 0.243 0.221 0.105 0 0
0
32975341 coding HLA-DOA
rs364950 A 0.087 0.405 0.299 0.193 0 0
0.04 0.044
0.034 32975896 coding HLA-DOA
rs404557 D 0.087 0.405 0.306 0.193 0 0
0.04 0.044
0.034 32976927 intron HLA-DOA
rs3763342 A 0.201 0.366 0.4 0.36 0.354 0.233 0.192 0.133 0.213 0.273 0.172 32978997 promoter HLA-DOA
rs3763341 A 0.125 0.268 0.226 0.184 0.353 0.19 0.154 0.106 0.153 0.267 0.112 32979020 promoter HLA-DOA
rs2116263 D 0.056 0.255 0.243 0.158 0.465 0.471 0.573 0.031 0.02 0.079 0.017 33025493 intergenic
HLA-DPA1, HLA-DPB1
rs4551215 D 0.099 0.257 0.252 0.184 0.465 0.533 0.61 0.04 0.025 0.149 0.026 33025700 intergenic
HLA-DPA1, HLA-DPB1
rs4582419 D 0.055 0.257 0.245 0.184 0.478 0.537 0.602 0.045 0.025 0.149 0.034 33040138 intron HLA-DPA1

104
Curriculum Vitae
Education
Drexel University, Philadelphia, PA 2011-2015
Ph.D. Candidate in Biomedical Engineering
Johns Hopkins University, Baltimore, MD 2007-2011
B.S. in Biomedical Engineering
Minor in Computer Science
Cumulative GPA: 3.37
Research Experience
Graduate Research Associate 09/2011 - present
Drexel University, Philadelphia, PA
Advisor: Aydin Tozeren, Ph.D.
Thesis: Psoriasis and Skin Disorders: A Study of Transcriptome and Microbiome
Deployed open-source microarray analysis workflows in R Bioconductor package to
evaluate mRNA expression similarities between skin autoimmune conditions.
Performed 16S NGS analysis to explore skin microbiome composition using QIIME
package.
Investigated microbiome-host interactions in psoriasis pathogenesis by metagenome
functional prediction of microbiome using PICRUST software package.
Developed, maintained and optimized population genetics workflow to identify positive selection in HLA genic region in 11 ethnic populations.
Inspected expression profiles of biomarker pairs in different types of lung cancer using
microarray datasets.
Undergraduate Research Assistant 09/2008 – 12/2009
Johns Hopkins University, Baltimore, MD
Explored the regulation of extravasation genes in cancer leukocytes after treating them
with engineered metabolic oligosaccharides (sialic acid precursors specifically) and three
dimensional growth substrate.
Employment Experience
Software Engineer Intern 06/2010-08/2010
Infinite Biomedical Technologies, Baltimore, MD
105
Developed file sharing web applications to improve physician collaboration and decision
making.
Modified web applications to ensure compatibility with mobile phones and different
browsers.
Biomedical Intern 07/2008-08/2008
Anatolia Health Center affiliated with Johns Hopkins Medicine, Istanbul Turkey
Calibrated biomedical devices and t for the hospital including defibrillators, patient
monitors, infusion pumps, ECG, patient beds and pulse oximeters.
Trained 4 new interns in calibration control methods in 2 weeks.
Publications
C. Tanes, and A. Tozeren. Crosstalk between host and microbiome in psoriasis: a system
analysis based on genomics datasets. (in prep)
C. Tanes, and A. Tozeren. HLA region SNPs and their modulation of population subtypes in
disease. (in prep)
L. Jackson, C. Tanes, and A. Tozeren. Addiction Drugs Cluster Functionally in the Genome
with Concomitant Variation in Human Populations (submitted)
K. Chen, K. Wu, S. Cai, W. Zhang, J. Zhou, J. Wang, A. Ertel, Z. Li, H. Rui, A. Quong, M.P.
Lisanti, A. Tozeren, C. Tanes, S. Addya, M. Gormley, C. Wang, S.B. McMahon, and R.G.
Pestell. Dachshund binds p53 to block the growth of lung adenocarcinoma cells. Cancer Res.
2013 Jun 1;73(11):3262-74.
Conference Abstracts and Presentations
C. Tanes, L. Jackson and A. Tozeren. Epidermal Differentiation Complex Exhibits
Population Subtype Differences in SNP Frequencies. Poster session presented at: 64th Annual
Meeting of the American Society of Human Genetics; 2014 October 18-22; San Diego, CA.
L. Jackson, C. Tanes and F. Jackson. Genomic Analysis of Blood-mediated Disorders in
African Americans. Poster session presented at: 64th Annual Meeting of the American Society
of Human Genetics; 2014 October 18-22; San Diego, CA.
T. Purwin, Y. Lan, C. Tanes, and A. Tozeren. Integrative Analysis of Autoimmune Diseases
and Possible Drug Targets. Poster session presented at: Drexel University's 16th Annual
Research Day; 2012 April 19; Philadelphia, PA.
Leadership Experience
Bioinformatics Mentor, Mastery Charter Schools 01/2014-06/2014
Judge, 9th Annual DNA Day Essay Contest, American Society of Human Genetics
04/2014
Vice President, Turkish Student Association, Drexel University 2011 - 2012
President, Turkish Student Association, Johns Hopkins University 2009 - 2011

106
Teaching Experience
Graduate Teaching Assistant / Lab Instructor 01/2012 - present
Drexel University, Philadelphia, PA
1. Quantitative Systems Biology
2. Genome Information Engineering
3. Computational Bioengineering
Coordinated and weekly lab sections to help students utilize MATLAB to tackle
bioinformatics problems.
Created weekly assignments and solutions.
Mentored students in efficient code writing in MATLAB and Python.
Lectured on microarray analysis, ordinary differential equations and sequence alignment
Graduate Teaching Assistant 01/2012 - present
Drexel University, Philadelphia, PA
1. Biosimulations
2. Biocomputational Languages
3. Programming and Modeling for Biomedical Engineering II
4. Programming and Modeling for Biomedical Engineering I
Undergraduate Course Assistant / Lab Leader 01/2010-05/2011
Johns Hopkins University, Baltimore, MD
Introduction to Programming with JAVA
Professional Societies
Society for Mathematical Biology 2013 - present
Society for Molecular Biology and Evolution (SMBE) 2014 - present
American Society for Human Genetics 2014 - present
Honors and Awards
Graduate Travel Subsidy, Drexel University: $250 awarded to attend ASHG Meeting
2014
Nominated for Outstanding Teaching Assistant Award, Drexel University
2012 & 2014
Calhoun Fellowship awarded for academic excellence, Drexel University
2011 - present
International Scholarship awarded for academic excellence, Johns Hopkins University
2007 - 2011
Dean’s List, Johns Hopkins University
Spring 2008 & 2010

107
Other Skills
Computer programs: R, MATLAB, Python, Java , C, C++, asp.net MVC, Linux environment
Bioinformatics: Bioconductor package, microarray analysis, gene expression analysis, gene set enrichment analysis, next-generation sequencing, QIIME, BLAST, sequence alignment, clustering, agent based modeling, big data mining, principal component analysis, SVM, naïve Bayes, neural networks
Lab: cell culture, RNA extraction, cDNA synthesis, qPCR, LD50 assay, glycolipid detection with flow cytometry and resorcinol assays
Languages: Turkish (native speaker), German (intermediate), Japanese (beginner)


![Psoriasis in Children and Adolescents: Diagnosis ......Guttate psoriasis is the second most common type of psoriasis in children [21, 29]. Griffiths and Barker defined guttate psoriasis](https://img.pdfslide.us/doc/110x75/5f501dea60f5a266c60b268c/psoriasis-in-children-and-adolescents-diagnosis-guttate-psoriasis-is-the.jpg)