Embed Size (px)
Citation preview

1
PSMPSMPSMPSMPSMPSMPSMPSM The High Road toMeasurement Maturity
subtitled:Applying PSM with Vengeance
Speaker: Kevin DomzalskiOrganizational Process
Optimization Lead
July 2005 2
2005 PSM Users’ Group Conference – Keystone, CO
PSMPSMPSMPSMPSMPSMPSMPSM Topic Introduction
!Our Process Improvement Timeline"1989 – Achieved SW-CMM Level 1"1992 – Achieved SW-CMM Level 2"1995 – Achieved SW-CMM Level 3"1997 – Achieved SE-CMM & P-CMM Level 2"2000 – Achieved SE-CMM Level 3"2000 – Failed Attempt at SW-CMM Level 4
o Failed both Key Process Areas (KPAs)"2001 – The Process Recovery Year
o Major Process Set Update Undertakeno Hired Consultants from SSCI (Card, Bowers, etc.)o Implemented PSM Principles & Methodso Formed Organizational Metrics Analysis Group (MAG)
"2002 – Achieved SW-CMM Levels 4 (May) & 5 (Dec)"2003 – Achieved CMMI Level 5!

2
2005 PSM Users’ Group Conference – Keystone, CO
PSMPSMPSMPSMPSMPSMPSMPSMImprovement Opportunities:
"The organization’s standard process is seen as being too complex, while at the same time not always containing the “how-to” information necessary to ensure consistent implementation of the process and the collection of valid data" “The OMs [Operating Manuals] are overwhelming.”" “Processes are too complex at systems and software level in
OMs… compliance with 500+ requirements… no noticeable improvement.”
General Observations from 2000 Assessment
2005 PSM Users’ Group Conference – Keystone, CO
PSMPSMPSMPSMPSMPSMPSMPSMImprovement Opportunities:
"The number of stable organizational trends is relatively small; the correct things are being done, but the statistical evidence that the trends truly exist across the organization remains weak
"The implications of process and technology change are not yet fully understood in quantitative terms
General Observations from 2000 Assessment

3
July 2005 5
2005 PSM Users’ Group Conference – Keystone, CO
PSMPSMPSMPSMPSMPSMPSMPSMLevel 4 KPA Ratings from 2000 Assessment
Goal Fully Satisfied
Goal Not Satisfied
Managed KPAs (CMM Level-4)
Software Quality Management
Quantitative Process Management
Goal 1 Goal 2 Goal 3
2005 PSM Users’ Group Conference – Keystone, CO
PSMPSMPSMPSMPSMPSMPSMPSMImprovement Opportunities (QPM) :
"Some required data/metrics are not considered by some programs to provide value …
"The criticism on the metrics is that “they are too late and not sharp enough an indicator to tell us what we really need to do in the short-term”.
"Quantitative management charts are occasionally viewed by practitioners, but not as matter of course …
"The organization’s process capability baseline is not well understood ...
Specific Findings from 2000 Assessment Team

4
2005 PSM Users’ Group Conference – Keystone, CO
PSMPSMPSMPSMPSMPSMPSMPSMSpecific Findings from 2000 Assessment Team
Improvement Opportunities (SQM) :
"Trend lines … are “noisy” because of variability, small number of data points, application domain differences, differing levelsof process deployment in programs, “seasonal” variation in different phases, etc.
"Some OQMP goals, e.g., 50% defect density reduction, may not be met for various reasons, such as missing data for initial baseline in Jan 1999, operational definition issues, customer priorities, etc.
"There are no plans for taking corrective action to achieve the OQMP goals or re-planning to establish revised goals.
"Many programs do not manage to their plans for actually achieving the OQMP/PQMP quality goals.
July 2005 8
2005 PSM Users’ Group Conference – Keystone, CO
PSMPSMPSMPSMPSMPSMPSMPSM
2001 – The Process Recovery Year

5
July 2005 9
2005 PSM Users’ Group Conference – Keystone, CO
PSMPSMPSMPSMPSMPSMPSMPSM"CMMI-focused Approach Adopted
o Process Subsets Broken Into CMMI-based Domainso Not a One-to-One Mapping to CMMI Process Areas (PAs)
"Process Document Hierarchy Definedo Process Documents Broken Into “Chewable” Subsets
"Processes Re-Designed by “Process Users”o Standard Process Document Templates Employedo Hired Consultants (if local “domain experts” unavailable)
"Resulting Process Set Web-Deployedo Allowed easier access by all userso Enabled easier update and deployment
"Process Change Request Process Web-Deployedo Allowed Process Users To Make Improvement Suggestions
Major Process Set Update Undertaken
July 2005 10
2005 PSM Users’ Group Conference – Keystone, CO
PSMPSMPSMPSMPSMPSMPSMPSM Process Document Structure
CN - Method to communicate an interim change to an existing policy, process or procedure or a new policy, process or procedure that has not been released to DOLLS.
PL - High level policy statement defining the Functional and/or Organizational conduct of operations and assigning authority and responsibility for implementation.
PS - Summary descriptions of a process. May include diagrams of process flows where it adds value to understanding the process.
PD - Detailed step-by-step procedural instructions of what precisely has to be done to achieve a specific output.
FM - Form that cannot be altered that identifies specific information for insertion and for which completion results require retention.
CK - Checklist or other Aide to complement a Process or a Procedure document.
PL
PS
PD
FM
TM
CK
RF
TR
CN
TR - Types of training material to include: Formal course material developed by the company, job aides, conference / brown bag presentations, etc.
TM - Template that can be used by a project as a starting point.
RF - Reference Doc to complement a Process or a Procedure document.

6
July 2005 11
2005 PSM Users’ Group Conference – Keystone, CO
PSMPSMPSMPSMPSMPSMPSMPSM Process Document Context
Source Code Updated Source Code
Version Desc. Doc.
Updated Documents
Development Plans,Users Manual,Requirements Docs
ChangeManagement
Process
S/W Maint EnvCM System
Development Tools
Delivery &Installation
Process
Customer
Design Docs
DRs
Test Docs
ProjectLibrary
Delivery &Installation
Process
DR SDF
Executable Media
Input Process(es)Output Process(es)Input Artifacts
Output ArtifactsControlling Process
Resources
Process
For more information visit www.idef.com
July 2005 12
2005 PSM Users’ Group Conference – Keystone, CO
PSMPSMPSMPSMPSMPSMPSMPSM Formed Metrics Analysis Group
•Metrics Analysis Group (MAG) Charter"Develop Measurement & Analysis Process Roadmap"Develop Metrics Analysis Methodologies, Models &
Measures To Support Quantitative Management Activities"Assist Projects With Startup of Metrics Collection &
Analysis Activities"Perform Organizational Metrics Analyses"Report Results to Projects & Organizational Process
Groups"Sponsor Process Action Teams"Sponsor Causal Analysis Teams"Support Other Process Groups"Support Development & Implementation of Metrics-
Related Training

7
July 2005 13
2005 PSM Users’ Group Conference – Keystone, CO
PSMPSMPSMPSMPSMPSMPSMPSM"David Card (PSM Co-Author & SSCI)
o Measurement & Analysiso Quantitative Process Managemento Software Quality Managemento Organizational Process Performanceo Causal Analysis & Resolution
"Leila Bowers (SSCI)o Organizational Process Focuso Organizational Process Definitiono Project Planningo Project Monitor & Controlo Risk Management
"Other Consultants & University PhDso Modernized Development Technologies
Hired Industry & Academia Consultants
July 2005 14
2005 PSM Users’ Group Conference – Keystone, CO
PSMPSMPSMPSMPSMPSMPSMPSMImplemented PSM Principles & Methods
"Measurement Process Modelo Developed, Documented & Web-Published Measurement &
Analysis Process Model Roadmapo Included Ties To Level-4/5 Activities
# Definition of Causal Analysis Team (CAT) Activitieso Developed Measurement-Related Training Program
# Quantitative Management Awareness (all Employees)# Inspection Data Analysis (all Engineers)# Causal Analysis (Leads & CAT members)# Statistical Process Control Techniques (Leads & CAT members)# Private Project OJT Sessions (as needed)# Metrics Analysis Workshops (as needed)
8
July 2005 15
2005 PSM Users’ Group Conference – Keystone, CO
PSMPSMPSMPSMPSMPSMPSMPSMMeasurement & Analysis Process Roadmap
Reduce defects
Reduce defects
July 2005 16
2005 PSM Users’ Group Conference – Keystone, CO
PSMPSMPSMPSMPSMPSMPSMPSMImplemented PSM Principles & Methods
(Continued)
"Measurement Construct Definitionso Adopted PSM Construct Model & Terminology
# Leveraged Heavily Off Dave Card’s Expertise# Goal-Driven Measurement Selection Implemented
o Defined Standardized Set of Base & Derived Measures# Defined Over 400 Base & Derived Measures in 20 Categories# Prioritized & Down-Selected for Quantitative Management# Annual Metrics Reviews Held With Relevant Stakeholders
o Developed Standard Metrics Template for Projects# Initial Measurement Requirements Determined by Project Type# Then Measurement Requirements Tailorable Via PCR Process
o Updated Tooling to Automate Collection Wherever Possible# Approx. 75% of Engineering Measurement Collection Handled
Semi-Automatically With Button Push in Source Application

9
July 2005 17
2005 PSM Users’ Group Conference – Keystone, CO
PSMPSMPSMPSMPSMPSMPSMPSM Measurement Construct Model
Interpretation Estimate or evaluation that provides a basis for decision making
Indicator
Model
DerivedMeasure
Value resulting from applying the algorithm to two or more measures
Algorithm combining measures and decision criteria
DerivedMeasure
Operations mapping an attribute to a scaleMethod
BaseMeasure
Function Algorithm combining two or more base measures
Value resulting from applying the method to one attribute
AttributeAttribute Property relevant to information needs Entities
Information NeedsInformationProduct
Source: Adapted from ISO/IEC 15939, Software Measurement Process Framework. Geneva:International Organization for Standardization, 2002.
Method
BaseMeasure
July 2005 18
2005 PSM Users’ Group Conference – Keystone, CO
PSMPSMPSMPSMPSMPSMPSMPSMImplemented PSM Principles & Methods
(Continued)
"Measurement Planso Developed Standard Template for Project Plans
# Mandatory Annual Re-Publication for Project Plans# Project Plan Adherence Tracked by Quality Assurance Group# Plan Re-Publication Aging Tracked by Metrics Analysis Group
• 90-day, 60-day, 30-day Update Warning Emails Issued to Projectso Developed Standard Organization Plan
# Annual (At a Minimum) Stakeholder Involvement Reviews# Mandatory Annual Full Publication# Mandatory Quarterly Appendices Updates# Web-Published For Easy Access by All Company Employees

10
July 2005 19
2005 PSM Users’ Group Conference – Keystone, CO
PSMPSMPSMPSMPSMPSMPSMPSM Measurement Plans(Organizational Level)
CMMI Capability
LevelsOPF OPD OT OPP OID PP PMC SAM IPM RSKM QPM REQM RD TS PI VER VAL CM PPQA MA DAR CAR
5
4
3
2
Current Capability Profile as of Dec '03 Class A SCAMPI (SE/SW)
SupportProcess Management Project Management Engineering
July 2005 20
2005 PSM Users’ Group Conference – Keystone, CO
PSMPSMPSMPSMPSMPSMPSMPSMCMMI
Capability Levels
RD TS PI
BAE Objectives
Reduce the density of defects in requirements documents.
Improve the efficiency of the software design and code processes.
Reduce the density of defects in Test Plans and Procedures.
BAE SYSTEMS Processes
Develop Systems Requirements - (OM.12.13.14A001)Derive Software Requirements - (OM.12.13.14A002) Derive Hardware Requirements - (OM.12.13.14A003)
Design System - (OM.12.13.14A004) Design Software - (OM.12.13.14A005) Design Hardware - (OM.12.13.14A006) Code and Test Software - (OM.12.13.14A007)S t P t d M f t i
Integrate and Test Hardware - (OM.12.13.14A011) Integrate and Test Software - (OM.12.13.14A010) Product Integration - (OM.12.13.14A012)
5
Develop Systems RequirementsDerive Software Requirements• Systemic Defects • Pareto of types of defects• Analysis of Lessons Learned• Analysis of Defect Injection & Detection Profiles
Design System Design SoftwareCode and Unit Test Software• Systemic Defects • Pareto of types of defects• Analysis of Lessons Learned• Analysis of Defect Injection & Detection Profiles
Integrate and Test Software• Systemic Defects • Pareto of types of defects• Analysis of Lessons Learned• Analysis of Defect Injection & Detection Profiles
4
Develop Systems RequirementsDerive Software Requirements• Analysis of Defect Profile, Defect Injection, and Phase Containment
Design SystemDesign SoftwareCode and Unit Test Software• Analysis of Defect Profile, Defect Injection, and Phase Containment
Integrate and Test Software• Analysis of Defect Profile, Defect Injection and Phase Containment• Reliability Model (failure intensity model)
3
Develop Systems RequirementsDerive Software Requirements• Defect Leakage (Requirements to Design) & Phase Containment• Defect Profile • Number of operational and minor defects
All Collectively• Process Health Scores• Monthly Customer Satisfaction Scores
Each Individually• Number of PCRs• Number of PCARs• Lessons Learned
Design SystemDesign Software• Defect Leakage & Phase Containment• Defect Profile • Prediction of completion using X-curve• Number of operational and minor defects
Code and Unit Test Software• LOC by category (adapted, added, generated, removed, reused) • Number of operational and minor defects• Defect density• Post delivery defect (DR) density
All Collectively• Process Health Scores• Monthly Customer Satisfaction Scores
Integrate and Test Software• Defect Leakage & Phase Containment• Defect Profile
All Collectively• Process Health Scores• Monthly Customer Satisfaction Scores
Each Individually • Number of PCRs• Number of PCARs• Lessons Learned
2
Develop Systems RequirementsDerive Software Requirements• Number of Requirements, Number of DRs• Number of allocated/ validated/ derived requirements• Requirements volatility measured by added, deleted, modified, clarified, untestable• Categorization of Defects / DRs
Each Individually• Action Items, Budget, Schedule
All Individually • Total Number of DRs, defects• LOC• Categorization of Defects / DRs • Action Items, Budget, Schedule
Integrate and Test Software Product Integration• DRs written during Integration and Test by type • Total number of requirements verified and test cases / test steps executed and passed
Each Individually • Action Items, Budget, Schedule
2
Develop Systems RequirementsDerive Software Requirements• Number of Requirements, Number of DRs• Number of allocated/ validated/ derived requirements• Requirements volatility measured by added, deleted, modified, clarified, untestable• Categorization of Defects / DRs
Each Individually• Action Items, Budget, Schedule
Measurement Plans(Organizational Level)

11
July 2005 21
2005 PSM Users’ Group Conference – Keystone, CO
PSMPSMPSMPSMPSMPSMPSMPSMCMMI
Capability Levels
RD TS PI
BAE Objectives
Reduce the density of defects in requirements documents.
Improve the efficiency of the software design and code processes.
Reduce the density of defects in Test Plans and Procedures.
BAE SYSTEMS Processes
Develop Systems Requirements - (OM.12.13.14A001)Derive Software Requirements - (OM.12.13.14A002) Derive Hardware Requirements - (OM.12.13.14A003)
Design System - (OM.12.13.14A004) Design Software - (OM.12.13.14A005) Design Hardware - (OM.12.13.14A006) Code and Test Software - (OM.12.13.14A007)S t P t d M f t i
Integrate and Test Hardware - (OM.12.13.14A011) Integrate and Test Software - (OM.12.13.14A010) Product Integration - (OM.12.13.14A012)
5
Develop Systems RequirementsDerive Software Requirements• Systemic Defects • Pareto of types of defects• Analysis of Lessons Learned• Analysis of Defect Injection & Detection Profiles
Design System Design SoftwareCode and Unit Test Software• Systemic Defects • Pareto of types of defects• Analysis of Lessons Learned• Analysis of Defect Injection & Detection Profiles
Integrate and Test Software• Systemic Defects • Pareto of types of defects• Analysis of Lessons Learned• Analysis of Defect Injection & Detection Profiles
4
Develop Systems RequirementsDerive Software Requirements• Analysis of Defect Profile, Defect Injection, and Phase Containment
Design SystemDesign SoftwareCode and Unit Test Software• Analysis of Defect Profile, Defect Injection, and Phase Containment
Integrate and Test Software• Analysis of Defect Profile, Defect Injection and Phase Containment• Reliability Model (failure intensity model)
3
Develop Systems RequirementsDerive Software Requirements• Defect Leakage (Requirements to Design) & Phase Containment• Defect Profile • Number of operational and minor defects
All Collectively• Process Health Scores• Monthly Customer Satisfaction Scores
Each Individually• Number of PCRs• Number of PCARs• Lessons Learned
Design SystemDesign Software• Defect Leakage & Phase Containment• Defect Profile • Prediction of completion using X-curve• Number of operational and minor defects
Code and Unit Test Software• LOC by category (adapted, added, generated, removed, reused) • Number of operational and minor defects• Defect density• Post delivery defect (DR) density
All Collectively• Process Health Scores• Monthly Customer Satisfaction Scores
Integrate and Test Software• Defect Leakage & Phase Containment• Defect Profile
All Collectively• Process Health Scores• Monthly Customer Satisfaction Scores
Each Individually • Number of PCRs• Number of PCARs• Lessons Learned
2
Develop Systems RequirementsDerive Software Requirements• Number of Requirements, Number of DRs• Number of allocated/ validated/ derived requirements• Requirements volatility measured by added, deleted, modified, clarified, untestable• Categorization of Defects / DRs
Each Individually• Action Items, Budget, Schedule
All Individually • Total Number of DRs, defects• LOC• Categorization of Defects / DRs • Action Items, Budget, Schedule
Integrate and Test Software Product Integration• DRs written during Integration and Test by type • Total number of requirements verified and test cases / test steps executed and passed
Each Individually • Action Items, Budget, Schedule
3
Develop Systems RequirementsDerive Software Requirements• Defect Leakage (Requirements to Design) & Phase Containment• Defect Profile • Number of operational and minor defects
All Collectively• Process Health Scores• Monthly Customer Satisfaction Scores
Each Individually• Number of PCRs• Number of PCARs• Lessons Learned
Measurement Plans(Organizational Level)
July 2005 22
2005 PSM Users’ Group Conference – Keystone, CO
PSMPSMPSMPSMPSMPSMPSMPSMCMMI
Capability Levels
RD TS PI
BAE Objectives
Reduce the density of defects in requirements documents.
Improve the efficiency of the software design and code processes.
Reduce the density of defects in Test Plans and Procedures.
BAE SYSTEMS Processes
Develop Systems Requirements - (OM.12.13.14A001)Derive Software Requirements - (OM.12.13.14A002) Derive Hardware Requirements - (OM.12.13.14A003)
Design System - (OM.12.13.14A004) Design Software - (OM.12.13.14A005) Design Hardware - (OM.12.13.14A006) Code and Test Software - (OM.12.13.14A007)S t P t d M f t i
Integrate and Test Hardware - (OM.12.13.14A011) Integrate and Test Software - (OM.12.13.14A010) Product Integration - (OM.12.13.14A012)
5
Develop Systems RequirementsDerive Software Requirements• Systemic Defects • Pareto of types of defects• Analysis of Lessons Learned• Analysis of Defect Injection & Detection Profiles
Design System Design SoftwareCode and Unit Test Software• Systemic Defects • Pareto of types of defects• Analysis of Lessons Learned• Analysis of Defect Injection & Detection Profiles
Integrate and Test Software• Systemic Defects • Pareto of types of defects• Analysis of Lessons Learned• Analysis of Defect Injection & Detection Profiles
4
Develop Systems RequirementsDerive Software Requirements• Analysis of Defect Profile, Defect Injection, and Phase Containment
Design SystemDesign SoftwareCode and Unit Test Software• Analysis of Defect Profile, Defect Injection, and Phase Containment
Integrate and Test Software• Analysis of Defect Profile, Defect Injection and Phase Containment• Reliability Model (failure intensity model)
3
Develop Systems RequirementsDerive Software Requirements• Defect Leakage (Requirements to Design) & Phase Containment• Defect Profile • Number of operational and minor defects
All Collectively• Process Health Scores• Monthly Customer Satisfaction Scores
Each Individually• Number of PCRs• Number of PCARs• Lessons Learned
Design SystemDesign Software• Defect Leakage & Phase Containment• Defect Profile • Prediction of completion using X-curve• Number of operational and minor defects
Code and Unit Test Software• LOC by category (adapted, added, generated, removed, reused) • Number of operational and minor defects• Defect density• Post delivery defect (DR) density
All Collectively• Process Health Scores• Monthly Customer Satisfaction Scores
Integrate and Test Software• Defect Leakage & Phase Containment• Defect Profile
All Collectively• Process Health Scores• Monthly Customer Satisfaction Scores
Each Individually • Number of PCRs• Number of PCARs• Lessons Learned
2
Develop Systems RequirementsDerive Software Requirements• Number of Requirements, Number of DRs• Number of allocated/ validated/ derived requirements• Requirements volatility measured by added, deleted, modified, clarified, untestable• Categorization of Defects / DRs
Each Individually• Action Items, Budget, Schedule
All Individually • Total Number of DRs, defects• LOC• Categorization of Defects / DRs • Action Items, Budget, Schedule
Integrate and Test Software Product Integration• DRs written during Integration and Test by type • Total number of requirements verified and test cases / test steps executed and passed
Each Individually • Action Items, Budget, Schedule
4
Develop Systems RequirementsDerive Software Requirements• Analysis of Defect Profile, Defect Injection, and Phase Containment
Measurement Plans(Organizational Level)

12
July 2005 23
2005 PSM Users’ Group Conference – Keystone, CO
PSMPSMPSMPSMPSMPSMPSMPSMCMMI
Capability Levels
RD TS PI
BAE Objectives
Reduce the density of defects in requirements documents.
Improve the efficiency of the software design and code processes.
Reduce the density of defects in Test Plans and Procedures.
BAE SYSTEMS Processes
Develop Systems Requirements - (OM.12.13.14A001)Derive Software Requirements - (OM.12.13.14A002) Derive Hardware Requirements - (OM.12.13.14A003)
Design System - (OM.12.13.14A004) Design Software - (OM.12.13.14A005) Design Hardware - (OM.12.13.14A006) Code and Test Software - (OM.12.13.14A007)S t P t d M f t i
Integrate and Test Hardware - (OM.12.13.14A011) Integrate and Test Software - (OM.12.13.14A010) Product Integration - (OM.12.13.14A012)
5
Develop Systems RequirementsDerive Software Requirements• Systemic Defects • Pareto of types of defects• Analysis of Lessons Learned• Analysis of Defect Injection & Detection Profiles
Design System Design SoftwareCode and Unit Test Software• Systemic Defects • Pareto of types of defects• Analysis of Lessons Learned• Analysis of Defect Injection & Detection Profiles
Integrate and Test Software• Systemic Defects • Pareto of types of defects• Analysis of Lessons Learned• Analysis of Defect Injection & Detection Profiles
4
Develop Systems RequirementsDerive Software Requirements• Analysis of Defect Profile, Defect Injection, and Phase Containment
Design SystemDesign SoftwareCode and Unit Test Software• Analysis of Defect Profile, Defect Injection, and Phase Containment
Integrate and Test Software• Analysis of Defect Profile, Defect Injection and Phase Containment• Reliability Model (failure intensity model)
3
Develop Systems RequirementsDerive Software Requirements• Defect Leakage (Requirements to Design) & Phase Containment• Defect Profile • Number of operational and minor defects
All Collectively• Process Health Scores• Monthly Customer Satisfaction Scores
Each Individually• Number of PCRs• Number of PCARs• Lessons Learned
Design SystemDesign Software• Defect Leakage & Phase Containment• Defect Profile • Prediction of completion using X-curve• Number of operational and minor defects
Code and Unit Test Software• LOC by category (adapted, added, generated, removed, reused) • Number of operational and minor defects• Defect density• Post delivery defect (DR) density
All Collectively• Process Health Scores• Monthly Customer Satisfaction Scores
Integrate and Test Software• Defect Leakage & Phase Containment• Defect Profile
All Collectively• Process Health Scores• Monthly Customer Satisfaction Scores
Each Individually • Number of PCRs• Number of PCARs• Lessons Learned
2
Develop Systems RequirementsDerive Software Requirements• Number of Requirements, Number of DRs• Number of allocated/ validated/ derived requirements• Requirements volatility measured by added, deleted, modified, clarified, untestable• Categorization of Defects / DRs
Each Individually• Action Items, Budget, Schedule
All Individually • Total Number of DRs, defects• LOC• Categorization of Defects / DRs • Action Items, Budget, Schedule
Integrate and Test Software Product Integration• DRs written during Integration and Test by type • Total number of requirements verified and test cases / test steps executed and passed
Each Individually • Action Items, Budget, Schedule
5
Develop Systems RequirementsDerive Software Requirements• Systemic Defects • Pareto of types of defects• Analysis of Lessons Learned• Analysis of Defect Injection & Detection Profiles
Measurement Plans(Organizational Level)
July 2005 24
2005 PSM Users’ Group Conference – Keystone, CO
PSMPSMPSMPSMPSMPSMPSMPSM
3.5
Achieve design defect leakage of no greater than XX% for projects completing development in 2005 (includes defects identified during the requirements phase)*
Design Defect Leakage Reduction
5
3.4
Achieve development defect leakage of no greater than XX% for projects completing Integration Test in 2005 (includes defects identified during the requirements and design phases).
Development Defect Leakage Reduction
4
3.3
Reduce post-delivery defect density of software products from the 2004 baseline of X.XX DRs/KSLOC to maximum of X.XX DRs/KSLOC (includes critical DRs identified during test and operation).
Post-Delivery Defect Density Reduction
3
3.2Achieve an SPI of no lower than .XX with a stretch goal of .XX on all contracts.
Schedule Performance
2
3.1Achieve a CPI of no lower than .XX with a stretch goal of .XX on all contracts.
Cost Performance1
ParaGoal DescriptionTitleOrg
Measurement Plans(Organizational Level)

13
July 2005 25
2005 PSM Users’ Group Conference – Keystone, CO
PSMPSMPSMPSMPSMPSMPSMPSM
Inspect XX% of requirements, XX% of design, and XX% of code. Conduct unit and integration testing on XX% of code.
Plan(s) to Achieve Goal:
Since v4.0 is built on software baselines established by v3.1, v3.2, v3.3, and v3.5, the goal for v4.0 is to reduce post-delivery defect density by XX% from the average post-delivery defect density for v3.1, v3.2, v3.3, and v3.5 combined.
Project Goal:
Reduce post-delivery defect density of software products from the 2004 baseline of X.XX DRs/KSLOC to maximum of X.XX DRs/KSLOC (includes critical DRs identified during test and operation).
Organizational Goal:
SoftwareCritical Product:
May 24, 2005Date:
Project:
Measurement Plans(Project Level)
July 2005 26
2005 PSM Users’ Group Conference – Keystone, CO
PSMPSMPSMPSMPSMPSMPSMPSMImplemented PSM Principles & Methods
(Continued)
"Measurement Analysis & Reportingo Standard Project Metrics Template Includes Canned Charts for Each
Metrics Category# 62 Canned Charts Forced Standardization Across Projects
o Developed Metrics Chart by Project Type Cross Reference# Identified Required Indicator Charts by Project Type# Identified Start/Frequency of Review For Each Canned Chart# Identified Level of Reporting For Each Canned Chart
o Selected Standard Analysis Tool (NWA Quality Analyst Tool)# Developed Standardized Queries & Data Formats in Projects’
Source Data Stores to Speed Up Project Startup Activities# Implemented QM Workshop to Train/Mentor New Analysts

14
July 2005 27
2005 PSM Users’ Group Conference – Keystone, CO
PSMPSMPSMPSMPSMPSMPSMPSM Metrics Chart By Project Type
Category Tab Name Chart Title Start of Chart Usage
Minimum Frequency of Update
Level of Reporting
1 2 3 4 5 6 7Major Milestones Summary MILE (None) Project Start Monthly MAG Use Only X X X X X X X
Project Staffing Effort STAFF-C1Planned vs Actual and Forecast Staffing Profile
Project Start MonthlyFunctional Managers, Program Manager, Director
X X X X X X X
Overall Project Scheduling SCHED-C1 Total Inchstone Status S-Curve Project Start Monthly
Functional Managers, Program Manager, Director, Vice President
X X X X
Test Schedules(Optional Use1)
TestSCHED-C1Integration Testing Completion Projection X-Chart
Start of Integration Phase Monthly
Systems Functional Manager, Program Manager, Director
X X X
System Requirements Volatility (& Testability)
SyREQVOL-C1 (Upper)
System Requirements Unfunded Volatility - Monthly
Initial Baselining of System Requirements
Monthly
Systems Functional Manager, Systems Manager, Chief Engineer
X X X
System Requirements Volatility (& Testability)
SyREQVOL-C1 (Lower)
System Requirements Unfunded Volatility - Cumulative
Initial Baselining of System Requirements
Monthly
Systems Functional Manager, Systems Manager, Chief Engineer
X X X
System Requirements Volatility (& Testability)
SyREQVOL-C2 (Upper-Left)
System Requirements Volatility - Growth & Testability Gap Closure
Initial Baselining of System Requirements - Optional Use1
MonthlyProject & MAG Metrics Analysts, Systems Manager
X X X
ProjectType
July 2005 28
2005 PSM Users’ Group Conference – Keystone, CO
PSMPSMPSMPSMPSMPSMPSMPSMImplemented PSM Principles & Methods
(Continued)
"Measurement Evaluationo Standardized Project Metrics Auditing
# Monthly Audit Results Reported To Projects# Monthly Report Presented to Organization Process Group
• Metrics Submittal Compliance (Level 1 Audit)• Metrics Data Integrity Check (Level 2 Audit)• Metrics Submittal Lateness• Causal Analysis Team Health Status
o Mission Assurance Personnel Perform Audits# Project Audits Performed by MAG & Quality Assurance (QA)# Over 50% of Metrics Submittal Audits Are Project Self-Audits
• Performed by Project’s QA Representative
15
July 2005 29
2005 PSM Users’ Group Conference – Keystone, CO
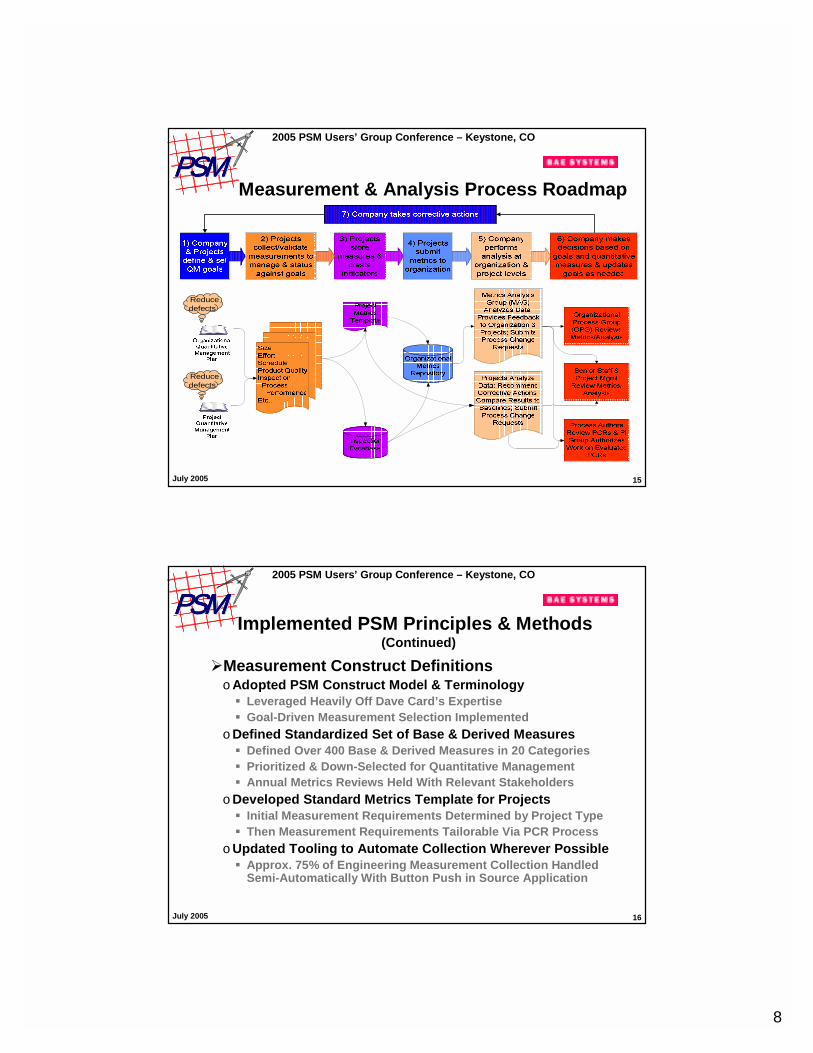
PSMPSMPSMPSMPSMPSMPSMPSMProject Metrics Submittal (Level-1) Audit Results
May-04 Jun-04 Jul-04 Aug-04 Sep-04 Oct-04 Nov-04 Dec-04 Jan-05 Feb-05 Mar-05 Apr-05Blue Yellow Green Green Yellow Green Green Green Green Green Green BlueBlue Blue Blue Blue Blue Blue Blue Blue Blue Blue Blue Blue
Green Green Blue Blue Blue Blue Blue Blue Blue Blue Blue BlueBlue Blue Blue Blue Blue Blue Blue Blue Blue Blue Blue BlueBlue Blue Green Green Blue Blue Blue Blue Blue Blue Blue Blue
Grey Blue Blue GreyBlue Blue Grey Blue Blue Blue
Yellow Green Yellow Green Green Green Green Blue Green Green Green GreenGreen Blue Green Green Green Blue Blue Blue Blue Blue Blue BlueGreen Blue Green Green Green Green Green Green Green Green Green GreenGreen Green Green Green Green Green Green Green Green Green Green GreenBlue Blue Green Blue Blue Blue Blue Blue Blue Blue Blue Blue
Green Green Green Green Green Green Green Green Blue Blue Blue BlueGreen Green Blue BlueBlue Blue Blue Blue
Green Grey Grey GreyGreen Green Green Blue Blue Blue Blue Green Green Green Green BlueGreen Green Green Green Green Green Blue Green Green Green GreenGreen Green Green Green Green Blue Blue Blue Green Green Green Green
Grey Blue Blue BlueGrey Blue Blue Blue
BlueGreenYellow
RedGrey
< 80% CompliantNot EvaluatedNot Applicable
80% to 89.9% Compliant90% to 99.9% Compliant
100% Compliant
July 2005 30
2005 PSM Users’ Group Conference – Keystone, CO
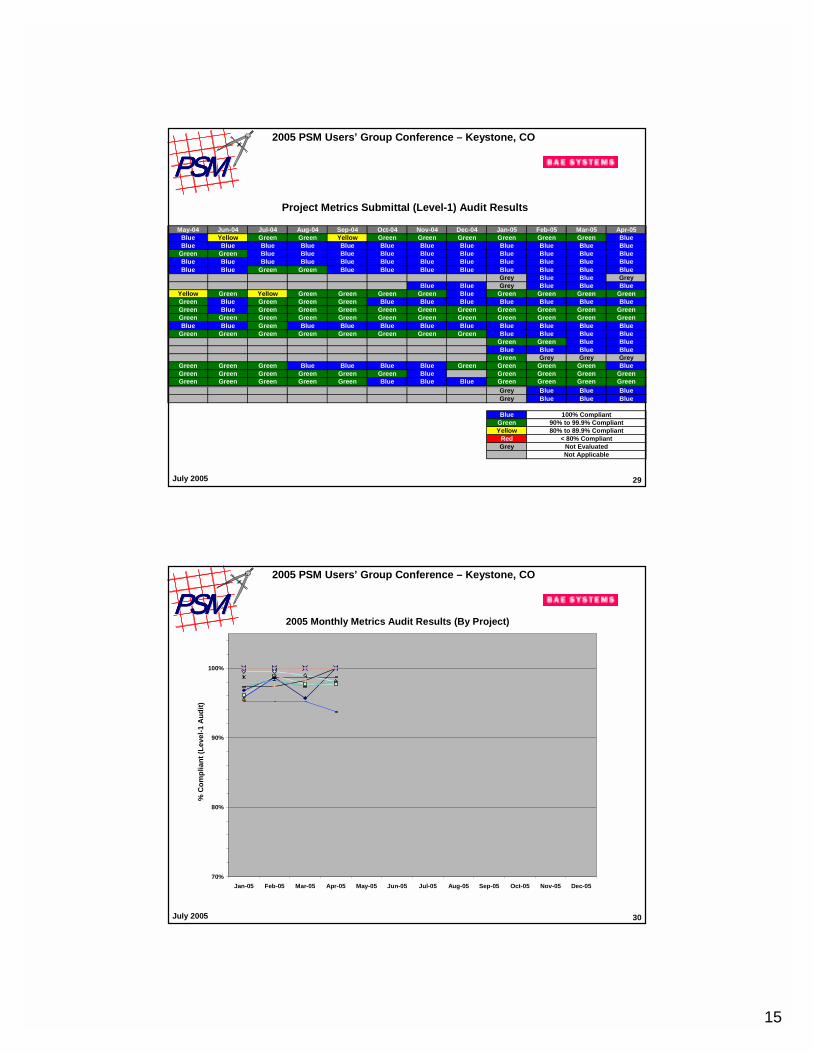
PSMPSMPSMPSMPSMPSMPSMPSM2005 Monthly Metrics Audit Results (By Project)
70%
80%
90%
100%
Jan-05 Feb-05 Mar-05 Apr-05 May-05 Jun-05 Jul-05 Aug-05 Sep-05 Oct-05 Nov-05 Dec-05
% C
ompl
iant
(Lev
el-1
Aud
it)

16
July 2005 31
2005 PSM Users’ Group Conference – Keystone, CO
PSMPSMPSMPSMPSMPSMPSMPSMMAG Report - Monthly Average Days Late
0.0
0.5
1.0
1.5
2.0
2.5
3.0
3.5
Aug-03
Sep-03
Oct-03
Nov-03
Dec-03
Jan-04
Feb-04
Mar-04
Apr-04
May-04
Jun-04
Jul-04
Aug-04
Sep-04
Oct-04
Nov-04
Dec-04
Jan-05
Feb-05
Mar-05
Apr-05
Submittal Data Covering Month
Mon
thly
Ave
rage
Day
s La
te
Average Days Late
Poly. (Average Days Late)
Proposal Impact
Submittal Dates Mis-Published
Submittal Dates Mis-Published
July 2005 32
2005 PSM Users’ Group Conference – Keystone, CO
PSMPSMPSMPSMPSMPSMPSMPSMDevelopment Defect Leakage Reduction Goal (2003-2005)
Baseline Q1 2003 Q2 2003 Q3 2003 Q4 2003 Q1 2004 Q2 2004 Q3 2004 Q4 2004 Q1 2005 Q2 2005 Q3 2005 Q4 2005
Dev
elop
men
t Def
ect L
eaka
ge P
erce
ntag
e
Year-to-Date Development Leakage Stand-alone Quarterly Development LeakageMax. Development Leakage Reduction Goal

17
July 2005 33
2005 PSM Users’ Group Conference – Keystone, CO
PSMPSMPSMPSMPSMPSMPSMPSMDesign Defect Leakage Reduction Goal (2003-2005)
56.3% 4.0% 30.5% 31.9% 34.7% 20.9% 25.9% 28.9% 35.3% 14.7%
Baseline Q1 2003 Q2 2003 Q3 2003 Q4 2003 Q1 2004 Q2 2004 Q3 2004 Q4 2004 Q1 2005 Q2 2005 Q3 2005 Q4 2005
Des
ign
Def
ect L
eaka
ge P
erce
ntag
e
Year-to-Date Design Leakage Design Leakage Goal Stand-Alone Quarterly Design Leakage
July 2005 34
2005 PSM Users’ Group Conference – Keystone, CO
PSMPSMPSMPSMPSMPSMPSMPSMPost Delivery Defect Density Reduction Goal (2002-2005)
Baseli
ne
Q1 200
2
Q2 200
2
Q3 200
2
Q4 200
2
Q1 200
3
Q2 200
3
Q3 200
3
Q4 200
3
Q1 200
4
Q2 200
4
Q3 200
4
Q4 200
4
Q1 200
5
Q2 200
5
Q3 200
5
Q4 200
5
Pos
t-Del
iver
y D
efec
t Den
sity
(Def
ects
/KS
LO
Recorded Quarter Defect Density
Post-Delivery Defect Density Reduction Goal
4-Quarter Moving Average

18
July 2005 35
2005 PSM Users’ Group Conference – Keystone, CO
PSMPSMPSMPSMPSMPSMPSMPSM Concluding Remarks
!High Maturity Measurement Practices Include Rigorous Adoption of:"Goal-Driven Measurement Selection
"Standardized Measurement & Analysis Processes
"Standardized Measurement Constructs
"Organizational & Project Measurement Plans
"Non-Invasive Measurement Collection Practices
"Standardized (& Automated) Reporting
"Continuous Evaluation of Projects’ Measurement Collection, Analysis & Reporting Processes
"Periodic Review of Measurement Business Value
"Increased Consulting with Industry Experts!
July 2005 36
2005 PSM Users’ Group Conference – Keystone, CO
PSMPSMPSMPSMPSMPSMPSMPSMQuestions?

19
July 2005 37
2005 PSM Users’ Group Conference – Keystone, CO
PSMPSMPSMPSMPSMPSMPSMPSM Speaker’s Bio
Kevin Domzalski is a seasoned engineer and member of the Process Improvement Group at BAE SYSTEMS National Security Solutions headquartered in San Diego, California, where he currently fulfills the role of Organizational Process Optimization Lead overseeing CMMI Level-5 practices.
He joined BAE Systems in 1983 (then General Dynamics Electronics Division), has served in several capacities in Software and Systems Engineering and has worked as an automotive industry consultant in Process Engineering during a 5-year hiatus from BAE Systems between 1993 and 1998.
Kevin also supports the Metrics Analysis Group (MAG) activities part-time where he performs metrics analyses on project and organizational measurements and metrics indicators. From 2002 through 2004 Kevin led the MAG activities during which time he was awarded two of his company’s Bronze-Level Chairman’s Awards for Innovation.
He has developed and teaches many company courses including Inspection Training, Inspection Data Analysis and Quantitative Management Awareness, and teaches the Systems Engineering Software Overview course at the University of California at San Diego (UCSD) Extension Studies Program as a adjunct faculty member and member of the UCSD Systems Engineering Program Advisory Committee.