Embed Size (px)
Citation preview
Page 1
Command, Control, Communications
& Information Systems
PSM PRESENTATIONEngineering Process and
Tools Organization (EP&TO)
Dr. Aaron N. Silver
(720) 858-5258
Cost-Effective Process Modeling & Simulation Using the Balanced Scorecard & Raytheon Six Sigma Methodology
July 18, 2003
Seventh Annual PSM Conference
Keystone, Colorado
Page 2
Command, Control, Communications
& Information SystemsPROCESS MODELING
COST EFFECTIVE PROCESS MODELING & SIMULATION USING THEBALANCED SCORECARD & RAYTHEON SIX SIGMA METHODOLOGY
Dr. Aaron N. SilverRaytheon Systems CompanyIIS: Intelligence & lnformation SystemsDenver Site OperationsEngineering Process & Tools Organization (EP&TO)16800 East CentreTech ParkwayBuilding S77, M/S 3026Aurora, CO 80011
Phone: (720) 858-5258Fax: (720) 858-5953
title01.stg
Page 3
Command, Control, Communications
& Information Systems
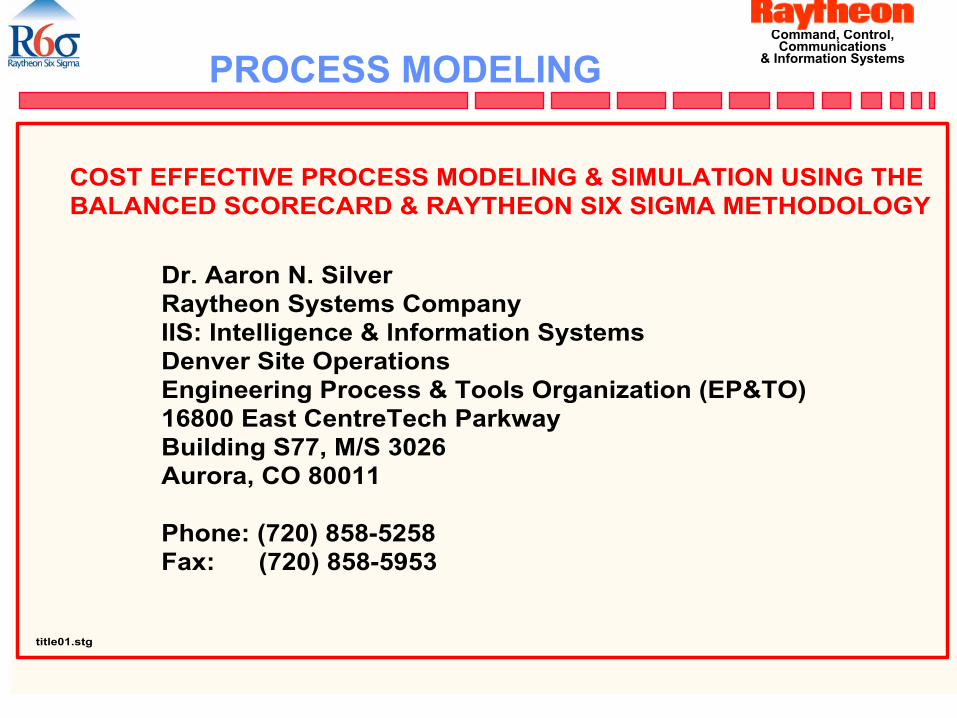
LeadLag
FinancialStrategic Objective
Measurement ProcessStrategic Objective Measurement
Customer Learning
• Growth Orientation&
Financial StrengthCashRevenue -2004MarginAnnual growthROIC
• Process Improvement Defect RateROI on ImprovementsProductivity Improvement (O/H)• Integrated Planning &
Forecasting% Functional Groups in PlansPerformance to Plan• FEOTB - Market, Capture,
Propose Funnel of OpportunitiesBalance of Business PortfolioCapture RateROIC
• Develop Business Solutions /Products & Services Product Development Cycle Time
% License & Maintenance Fees / Sales
• Meet Commitments, ExpectationsEasy to do Business with
Gate 5 reviewsComposite award fee SPICPI
Strategic Objective Measurement
• Protect, Expand, Diversify Customer Base
# of New Acquisition SourcesMarket Share
Strategic Objective Measurement• Share Best Practices and
Lessons Learned Build / Reuse RatioGate II Completion
• Focused People Strategy Strategic Job Coverage Ratio# Successors / Critical PositionsRetention Rate
• Skill Development Critical Skill / Need RatioSkill Training PlanPerformance to Plan
• Investment - People, Assets,Technology
Targeted R&D to SalesActual R&D to SalesROIC
BALANCED SCORECARD
Negotiation metric
Page 4
Command, Control, Communications
& Information Systems
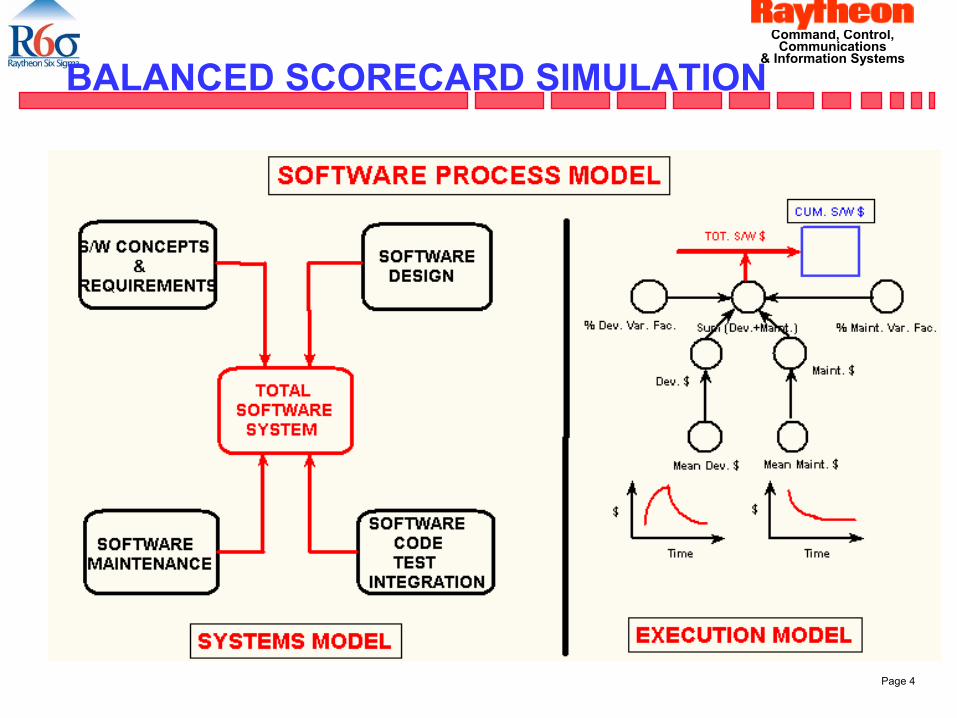
BALANCED SCORECARD SIMULATION
Page 5
Command, Control, Communications
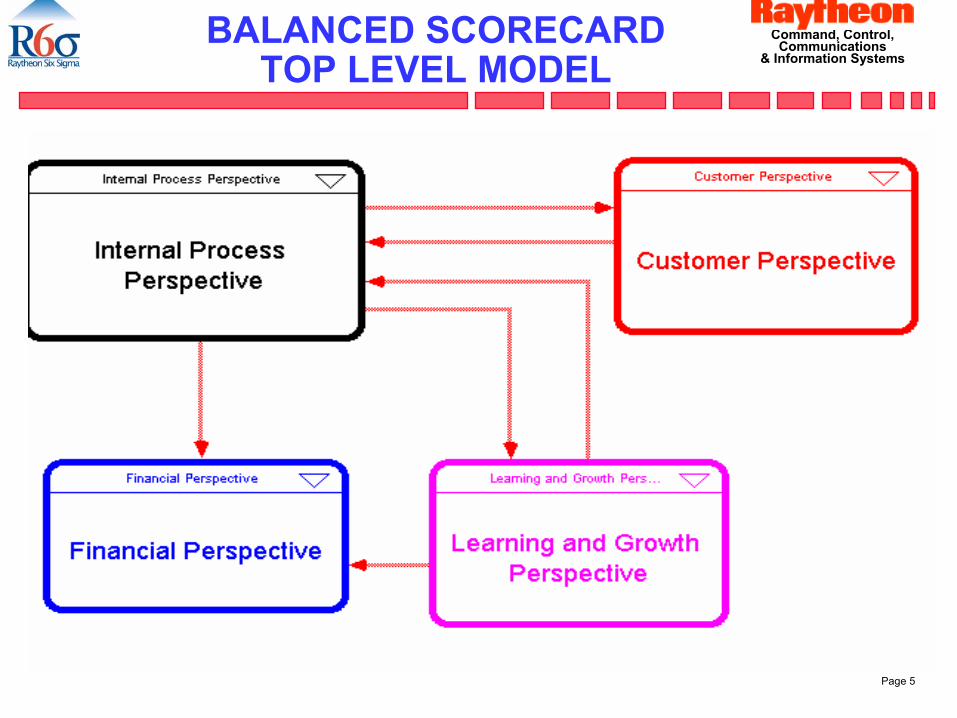
& Information SystemsBALANCED SCORECARD
TOP LEVEL MODEL
Page 6
Command, Control, Communications
& Information Systems
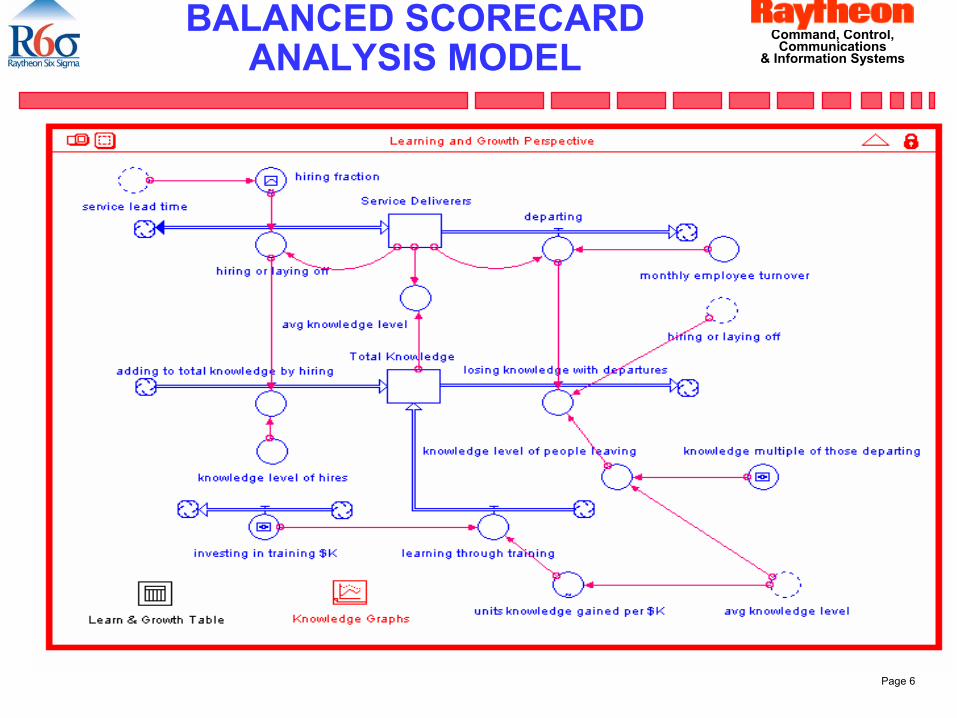
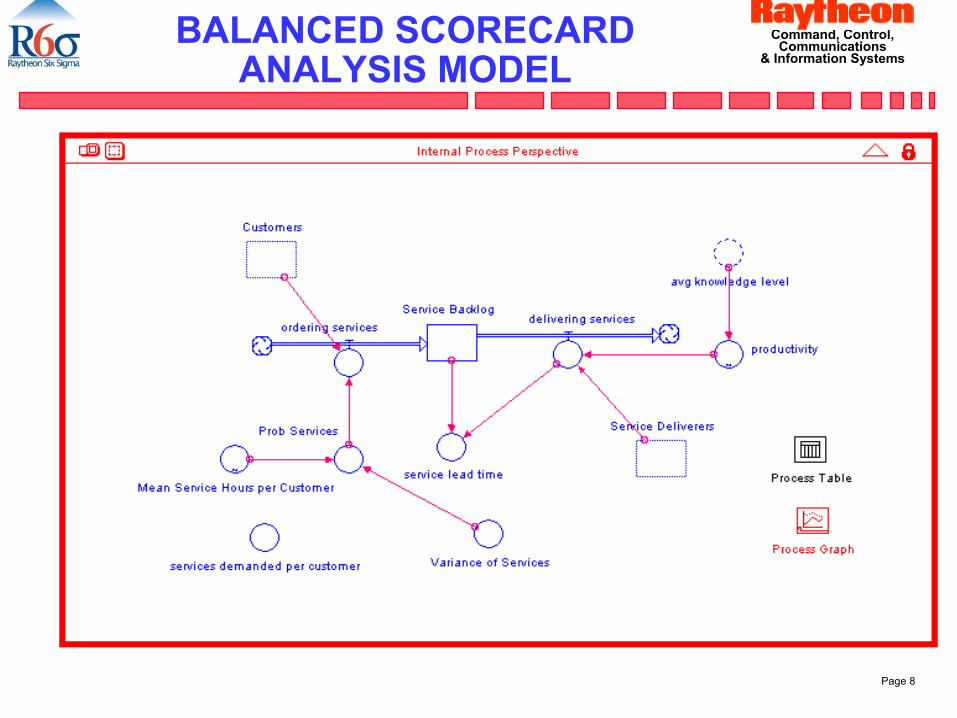
BALANCED SCORECARD ANALYSIS MODEL
Page 7
Command, Control, Communications
& Information SystemsBALANCED SCORECARD
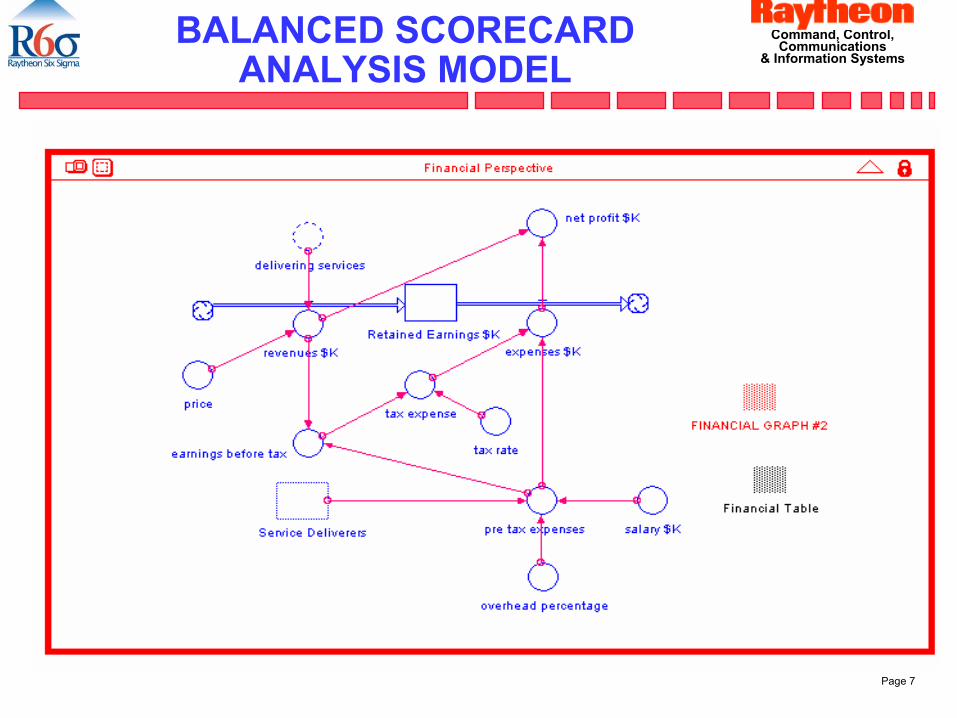
ANALYSIS MODEL
Page 8
Command, Control, Communications
& Information SystemsBALANCED SCORECARD
ANALYSIS MODEL
Page 9
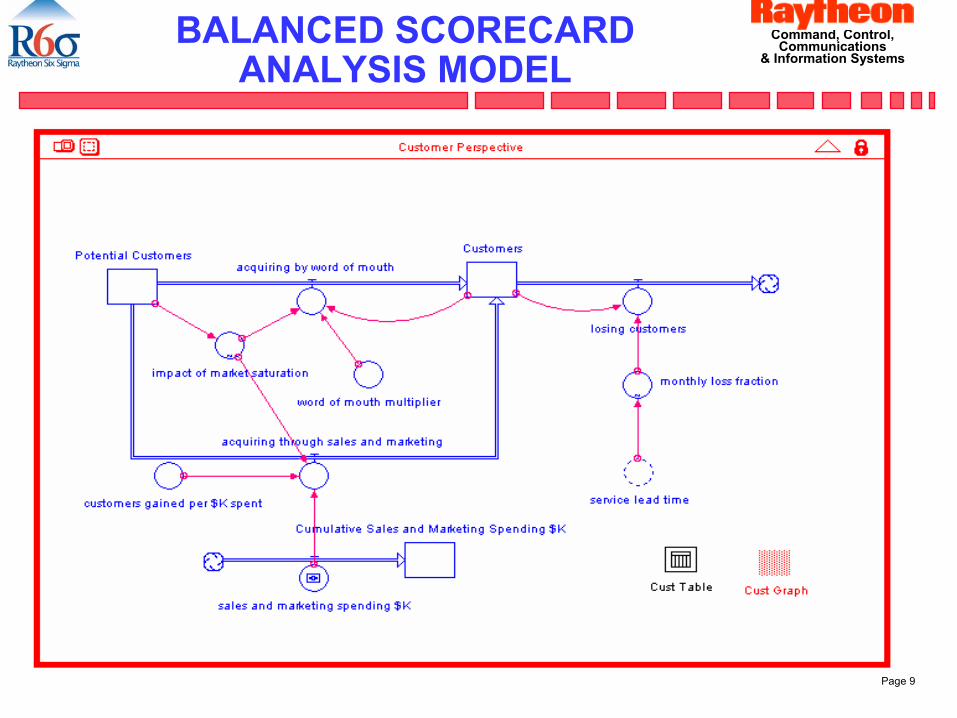
Command, Control, Communications
& Information SystemsBALANCED SCORECARD
ANALYSIS MODEL
Page 10
Command, Control, Communications
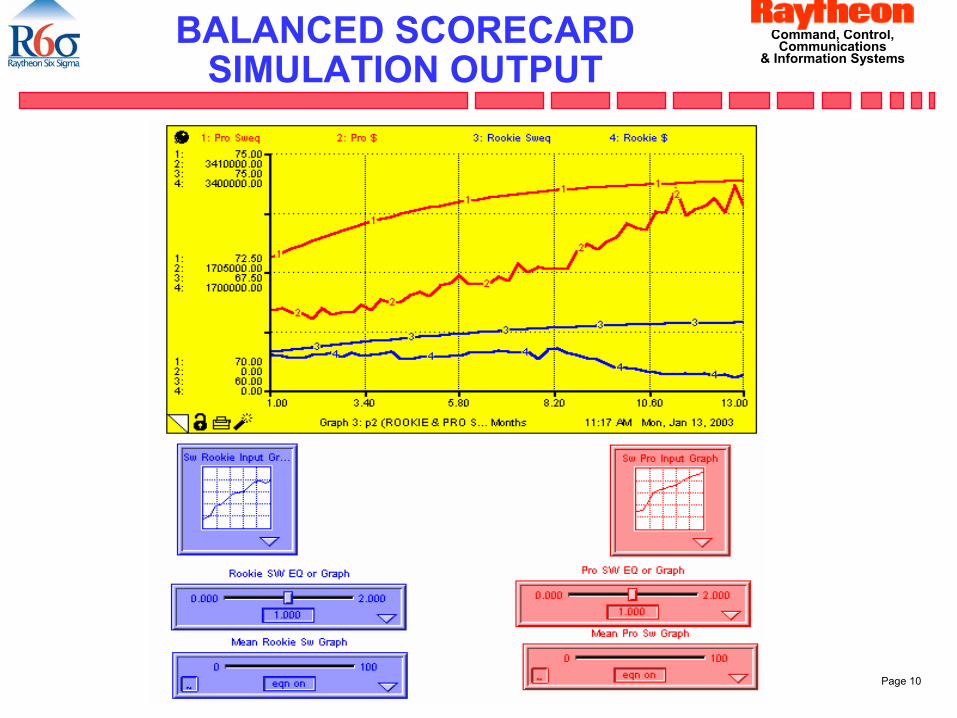
& Information SystemsBALANCED SCORECARD
SIMULATION OUTPUT
Page 11
Command, Control, Communications
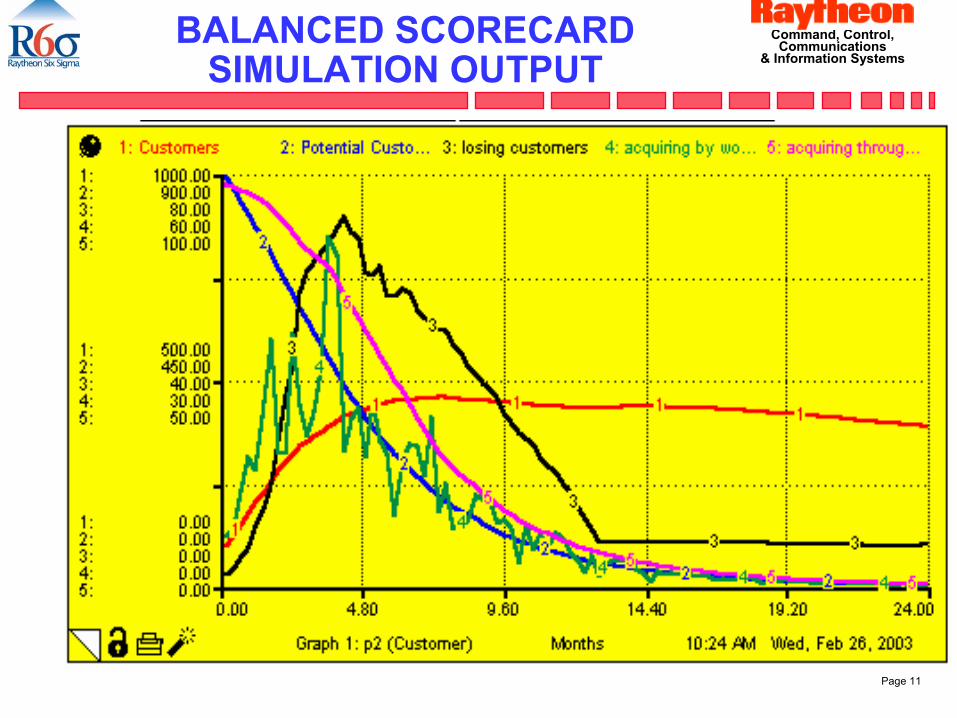
& Information SystemsBALANCED SCORECARD
SIMULATION OUTPUT
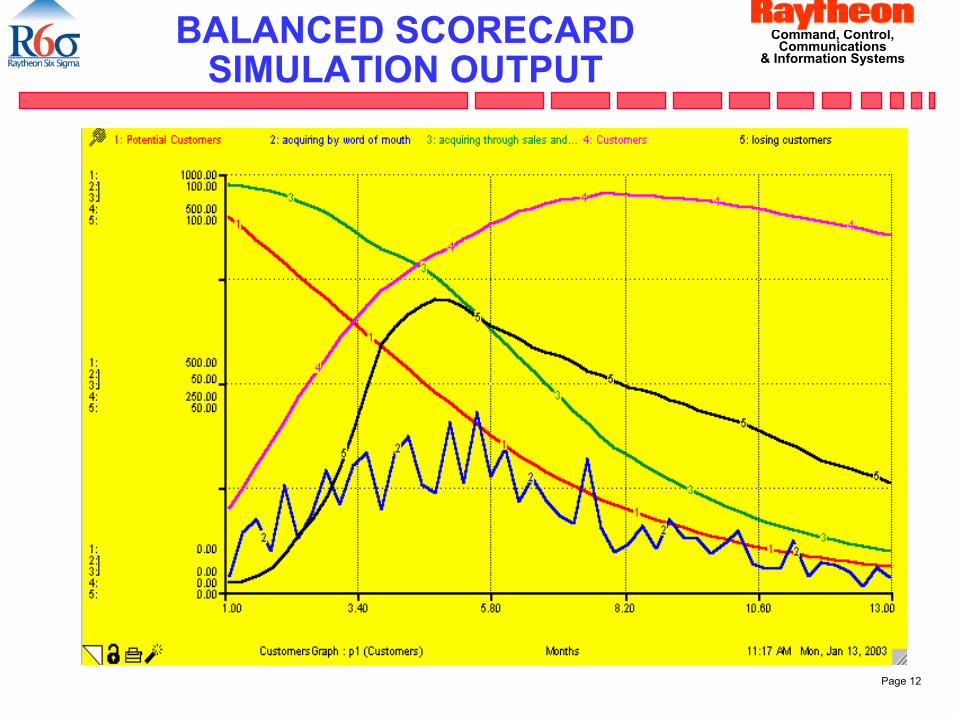
Page 12
Command, Control, Communications
& Information SystemsBALANCED SCORECARD
SIMULATION OUTPUT
Page 13
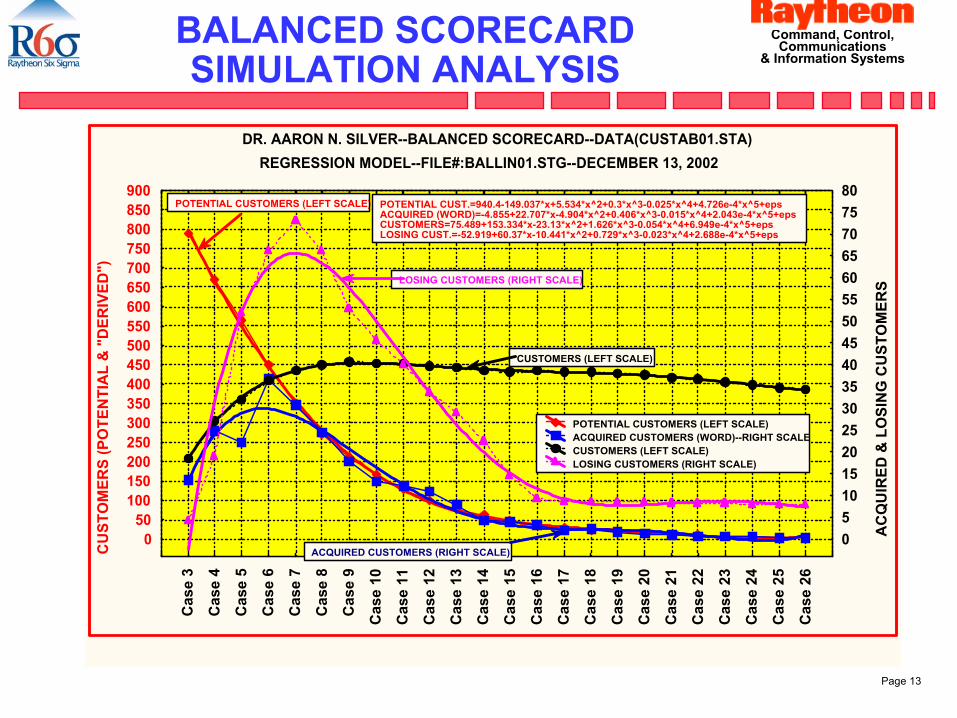
Command, Control, Communications
& Information SystemsBALANCED SCORECARD SIMULATION ANALYSIS
DR. AARON N. SILVER--BALANCED SCORECARD--DATA(CUSTAB01.STA)REGRESSION MODEL--FILE#:BALLIN01.STG--DECEMBER 13, 2002
CU
STO
MER
S (P
OTE
NTI
AL
& "
DER
IVED
")
AC
QU
IRED
& L
OSI
NG
CU
STO
MER
S
05101520253035404550556065707580
050
100150200250300350400450500550600650700750800850900
Cas
e 3
Cas
e 4
Cas
e 5
Cas
e 6
Cas
e 7
Cas
e 8
Cas
e 9
Cas
e 10
Cas
e 11
Cas
e 12
Cas
e 13
Cas
e 14
Cas
e 15
Cas
e 16
Cas
e 17
Cas
e 18
Cas
e 19
Cas
e 20
Cas
e 21
Cas
e 22
Cas
e 23
Cas
e 24
Cas
e 25
Cas
e 26
POTENTIAL CUST.=940.4-149.037*x+5.534*x^2+0.3*x^3-0.025*x^4+4.726e-4*x^5+epsACQUIRED (WORD)=-4.855+22.707*x-4.904*x^2+0.406*x^3-0.015*x^4+2.043e-4*x^5+epsCUSTOMERS=75.489+153.334*x-23.13*x^2+1.626*x^3-0.054*x^4+6.949e-4*x^5+epsLOSING CUST.=-52.919+60.37*x-10.441*x^2+0.729*x^3-0.023*x^4+2.688e-4*x^5+eps
POTENTIAL CUSTOMERS (LEFT SCALE)ACQUIRED CUSTOMERS (WORD)--RIGHT SCALECUSTOMERS (LEFT SCALE)LOSING CUSTOMERS (RIGHT SCALE)
LOSING CUSTOMERS (RIGHT SCALE)
CUSTOMERS (LEFT SCALE)
POTENTIAL CUSTOMERS (LEFT SCALE)
ACQUIRED CUSTOMERS (RIGHT SCALE)
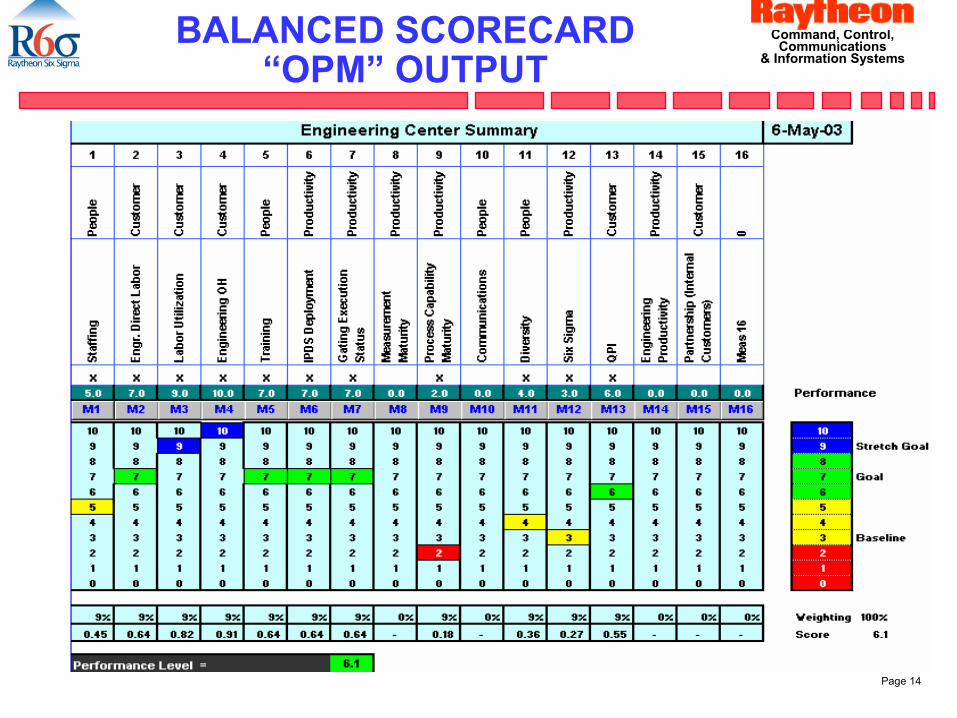
Page 14
Command, Control, Communications
& Information SystemsBALANCED SCORECARD
“OPM” OUTPUT
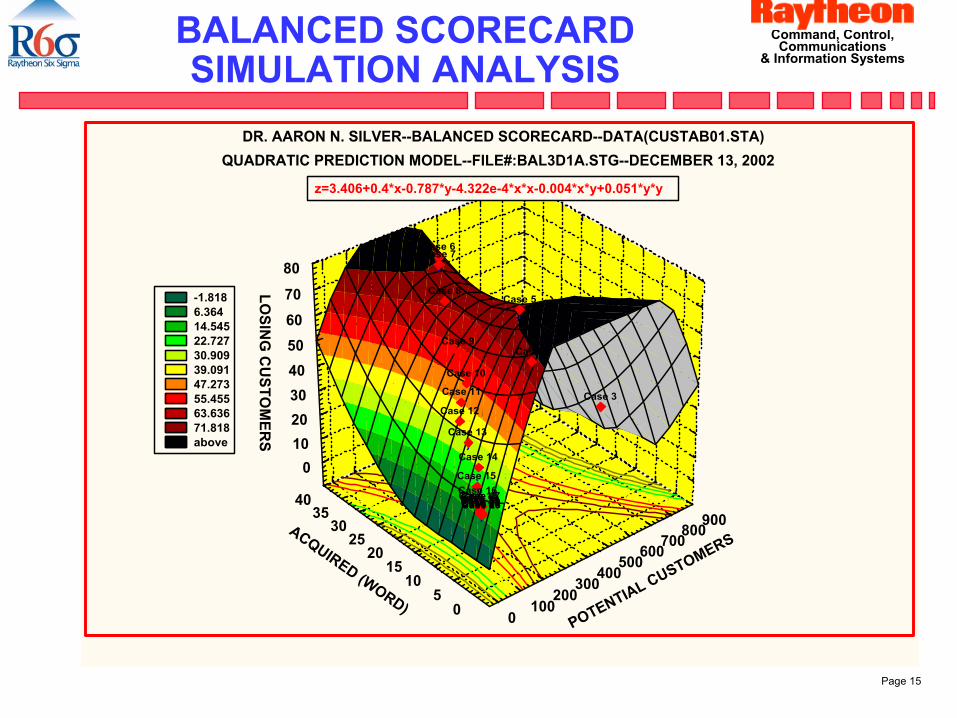
Page 15
Command, Control, Communications
& Information SystemsBALANCED SCORECARD SIMULATION ANALYSIS
DR. AARON N. SILVER--BALANCED SCORECARD--DATA(CUSTAB01.STA)QUADRATIC PREDICTION MODEL--FILE#:BAL3D1A.STG--DECEMBER 13, 2002
Case 3
Case 4
Case 5
Case 6Case 7
Case 8
Case 9
Case 10
Case 11
Case 12
Case 13
Case 14
Case 15Case 16Case 17Case 18Case 19Case 20Case 21Case 22Case 23Case 24Case 25Case 26
0100
200300
400500
600700
800900
05
1015
2025
3035
40
010203040506070
80
z=3.406+0.4*x-0.787*y-4.322e-4*x*x-0.004*x*y+0.051*y*y
-1.818 6.364 14.545 22.727 30.909 39.091 47.273 55.455 63.636 71.818 above
LOSIN
G C
USTO
MER
S
ACQUIRED (WORD)POTENTIAL CUSTOMERS
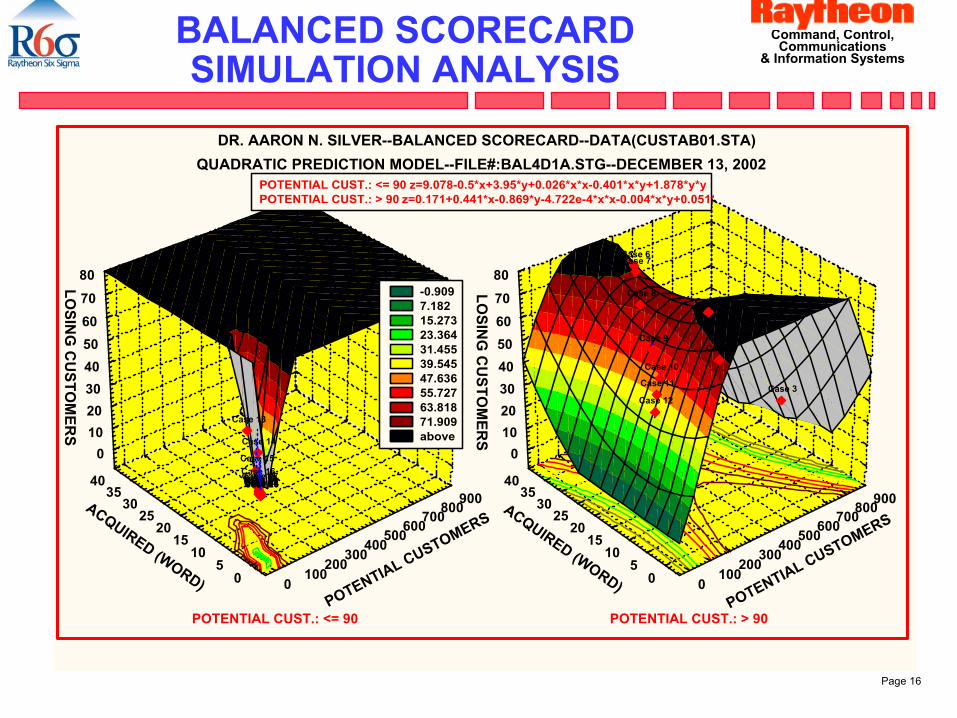
Page 16
Command, Control, Communications
& Information SystemsBALANCED SCORECARD SIMULATION ANALYSIS
DR. AARON N. SILVER--BALANCED SCORECARD--DATA(CUSTAB01.STA)QUADRATIC PREDICTION MODEL--FILE#:BAL4D1A.STG--DECEMBER 13, 2002
POTENTIAL CUST.: <= 90
Case 13
Case 14
Case 15Case 16Case 17Case 18Case 19Case 20Case 21Case 22Case 23Case 24Case 25Case 26
0100
200300
400500
600700800900
05
1015
2025
3035
40
01020304050607080
POTENTIAL CUST.: > 90
Case 3
Case 4
Case 5
Case 6Case 7
Case 8
Case 9
Case 10
Case 11
Case 12
0100
200300
400500
600700800900
05
1015
2025
3035
40
01020304050607080
POTENTIAL CUST.: <= 90 z=9.078-0.5*x+3.95*y+0.026*x*x-0.401*x*y+1.878*y*yPOTENTIAL CUST.: > 90 z=0.171+0.441*x-0.869*y-4.722e-4*x*x-0.004*x*y+0.051*
-0.909 7.182 15.273 23.364 31.455 39.545 47.636 55.727 63.818 71.909 above
LOSIN
G C
USTO
MER
S
LOSIN
G C
USTO
MER
S
ACQUIRED (WORD)
ACQUIRED (WORD)POTENTIAL CUSTOMERS
POTENTIAL CUSTOMERS