Embed Size (px)
Citation preview
1
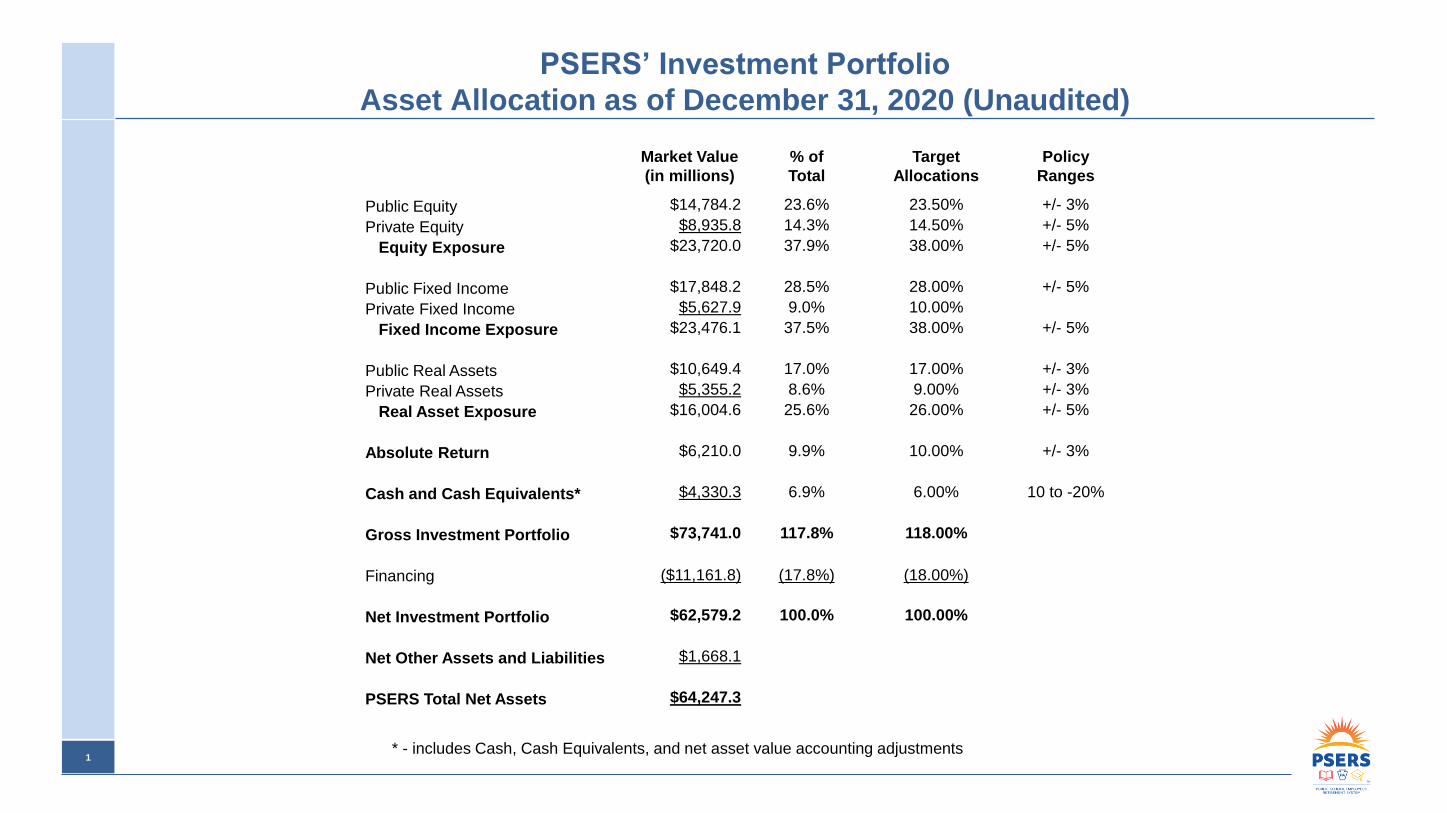
PSERS’ Investment Portfolio
Asset Allocation as of December 31, 2020 (Unaudited)
Market Value
(in millions)
% of
Total
Target
Allocations
Policy
Ranges
Public Equity $14,784.2 23.6% 23.50% +/- 3%
Private Equity $8,935.8 14.3% 14.50% +/- 5%
Equity Exposure $23,720.0 37.9% 38.00% +/- 5%
Public Fixed Income $17,848.2 28.5% 28.00% +/- 5%
Private Fixed Income $5,627.9 9.0% 10.00%
Fixed Income Exposure $23,476.1 37.5% 38.00% +/- 5%
Public Real Assets $10,649.4 17.0% 17.00% +/- 3%
Private Real Assets $5,355.2 8.6% 9.00% +/- 3%
Real Asset Exposure $16,004.6 25.6% 26.00% +/- 5%
Absolute Return $6,210.0 9.9% 10.00% +/- 3%
Cash and Cash Equivalents* $4,330.3 6.9% 6.00% 10 to -20%
Gross Investment Portfolio $73,741.0 117.8% 118.00%
Financing ($11,161.8) (17.8%) (18.00%)
Net Investment Portfolio $62,579.2 100.0% 100.00%
Net Other Assets and Liabilities $1,668.1
PSERS Total Net Assets $64,247.3
* - includes Cash, Cash Equivalents, and net asset value accounting adjustments
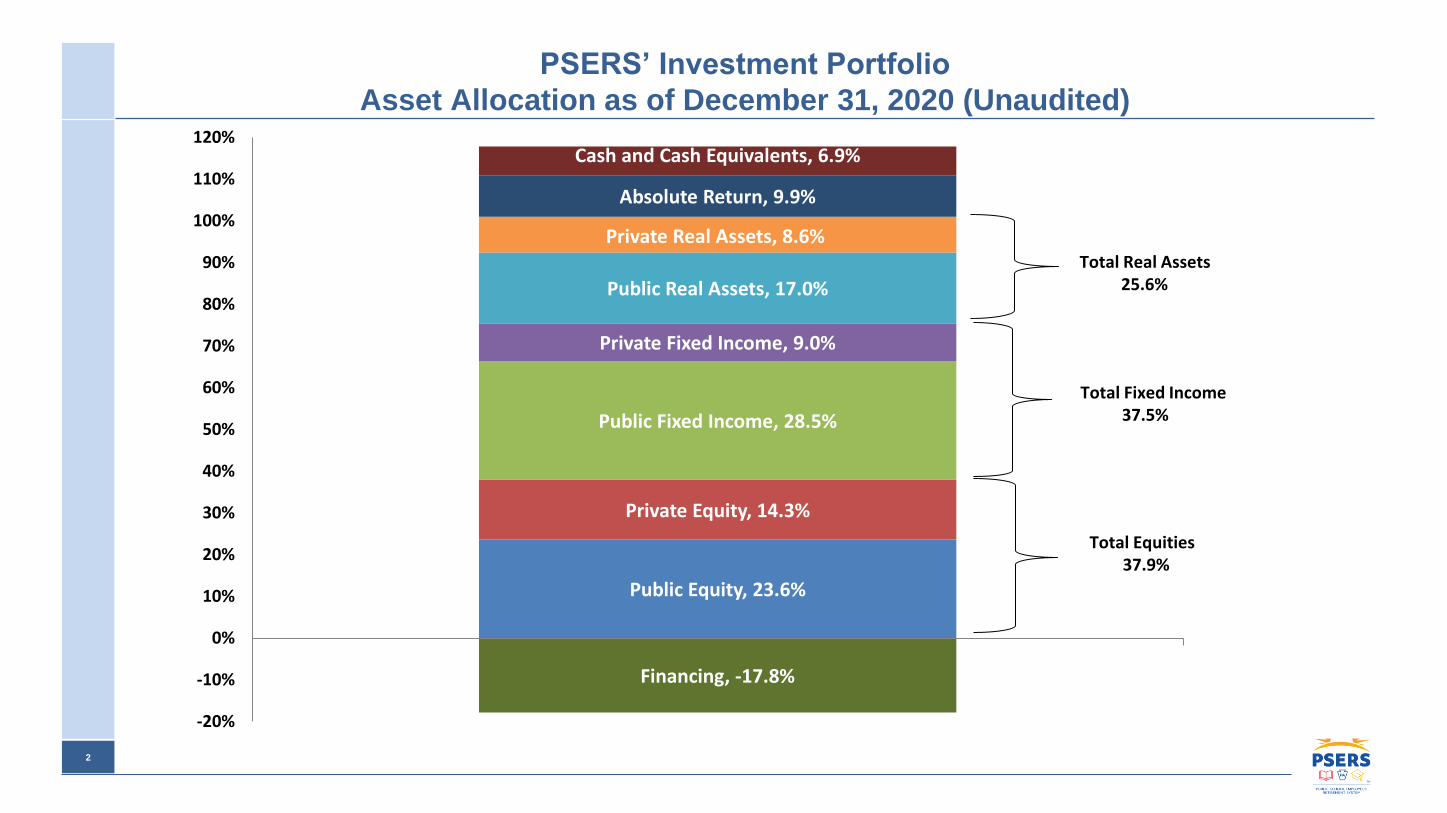
2
PSERS’ Investment Portfolio
Asset Allocation as of December 31, 2020 (Unaudited)
Public Equity, 23.6%
Private Equity, 14.3%
Public Fixed Income, 28.5%
Private Fixed Income, 9.0%
Public Real Assets, 17.0%
Private Real Assets, 8.6%
Absolute Return, 9.9%
Cash and Cash Equivalents, 6.9%
Financing, -17.8%
-20%
-10%
0%
10%
20%
30%
40%
50%
60%
70%
80%
90%
100%
110%
120%
Total Real Assets25.6%
Total Fixed Income37.5%
Total Equities37.9%
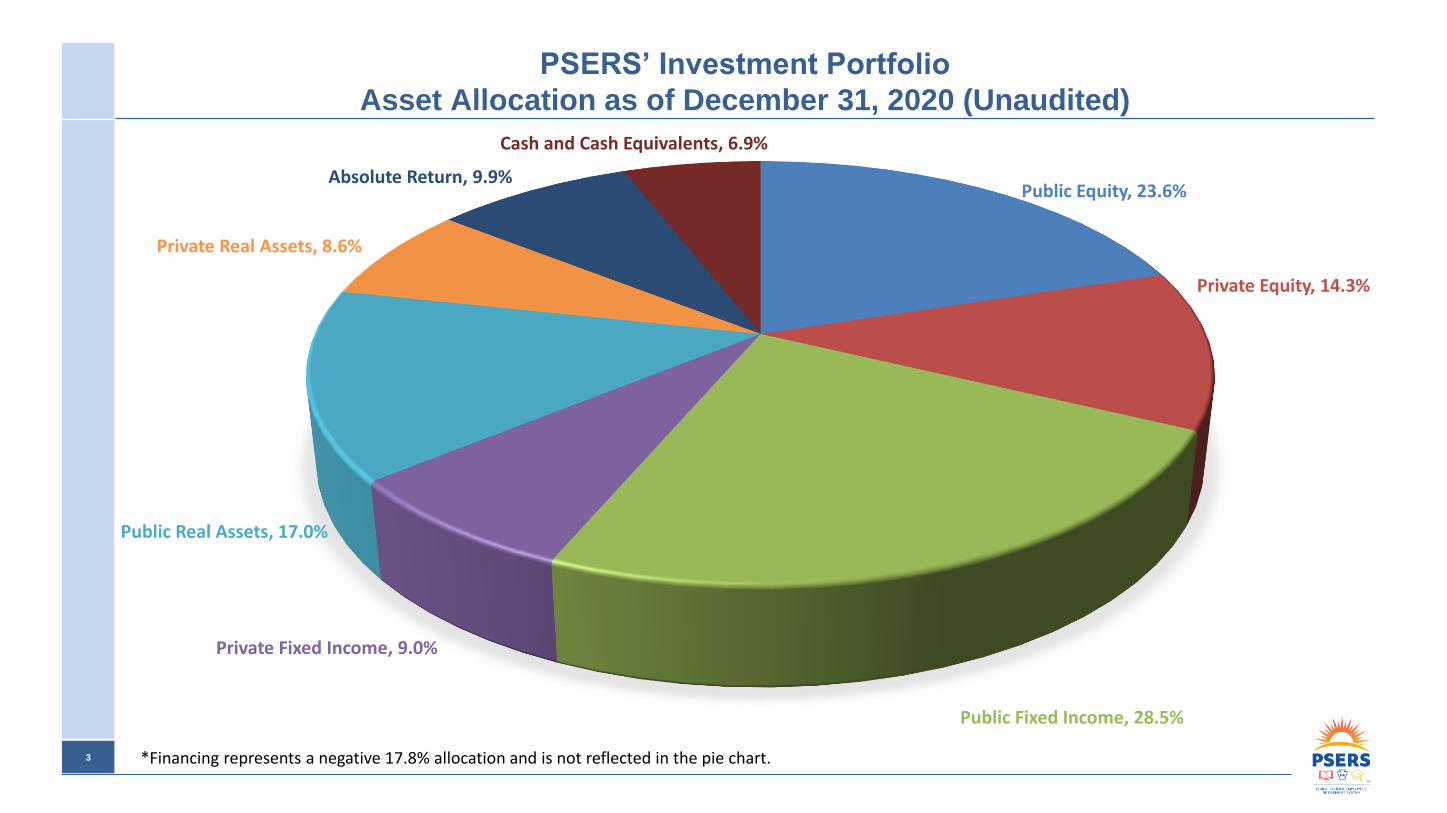
3
PSERS’ Investment Portfolio
Asset Allocation as of December 31, 2020 (Unaudited)
*Financing represents a negative 17.8% allocation and is not reflected in the pie chart.
Public Equity, 23.6%
Private Equity, 14.3%
Public Fixed Income, 28.5%
Private Fixed Income, 9.0%
Public Real Assets, 17.0%
Private Real Assets, 8.6%
Absolute Return, 9.9%
Cash and Cash Equivalents, 6.9%
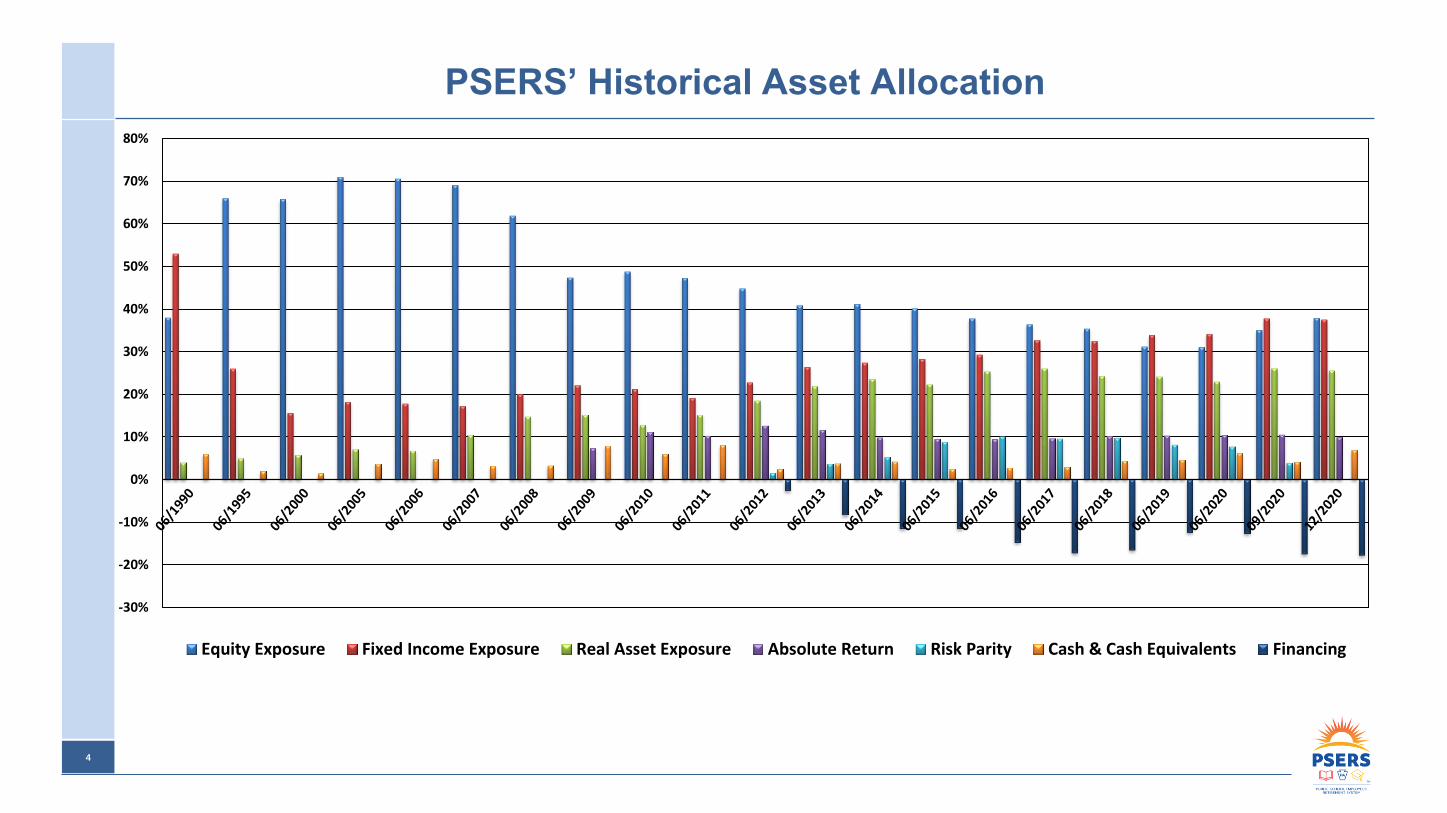
4
PSERS’ Historical Asset Allocation
-30%
-20%
-10%
0%
10%
20%
30%
40%
50%
60%
70%
80%
Equity Exposure Fixed Income Exposure Real Asset Exposure Absolute Return Risk Parity Cash & Cash Equivalents Financing
5
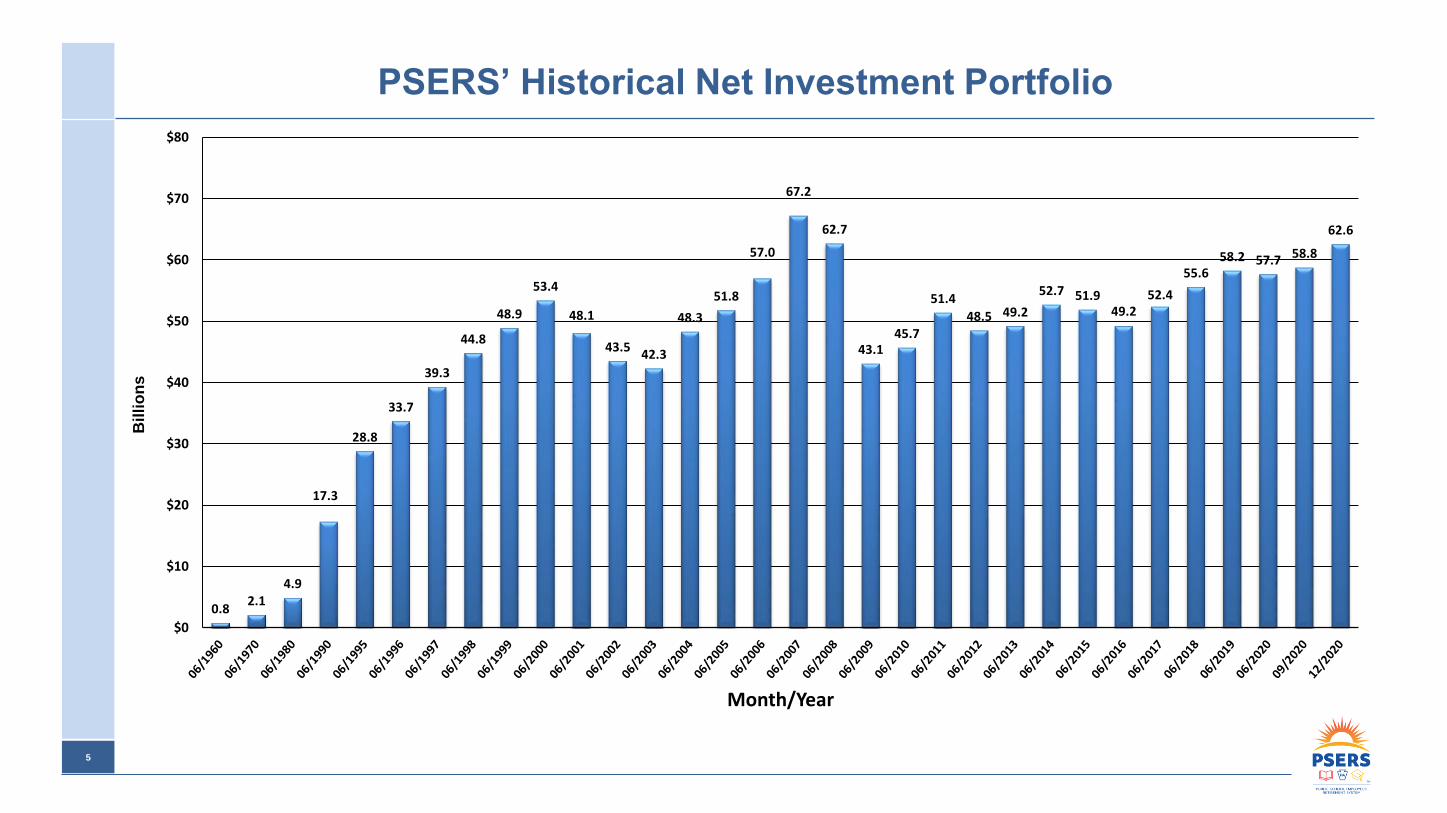
PSERS’ Historical Net Investment Portfolio
0.82.1
4.9
17.3
28.8
33.7
39.3
44.8
48.9
53.4
48.1
43.542.3
48.3
51.8
57.0
67.2
62.7
43.145.7
51.4
48.5 49.2
52.7 51.949.2
52.4
55.658.2 57.7 58.8
62.6
$0
$10
$20
$30
$40
$50
$60
$70
$80
Month/Year
Billi
on
s
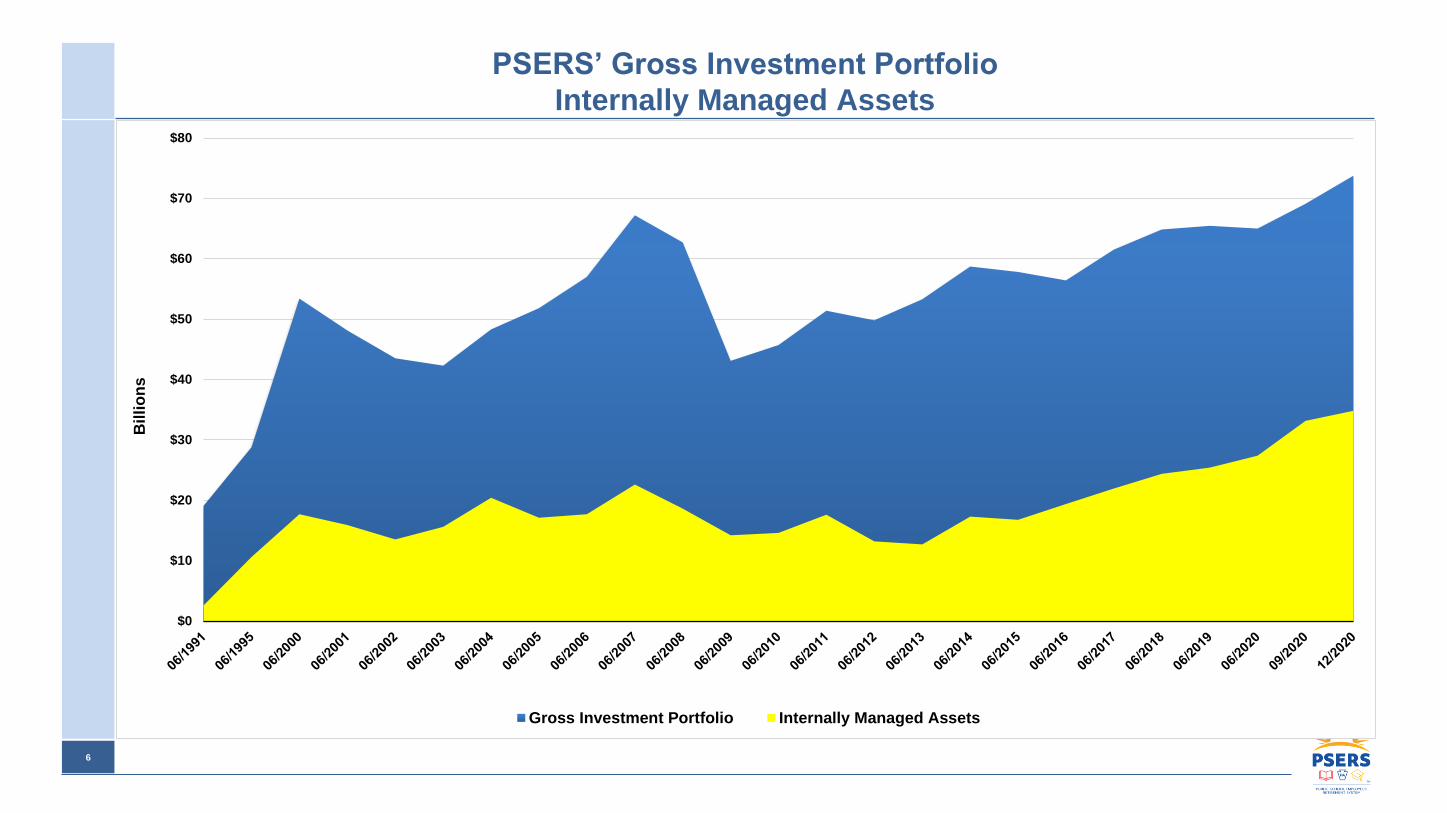
6
PSERS’ Gross Investment Portfolio
Internally Managed Assets
$0
$10
$20
$30
$40
$50
$60
$70
$80
Gross Investment Portfolio Internally Managed Assets
Billi
on
s
7
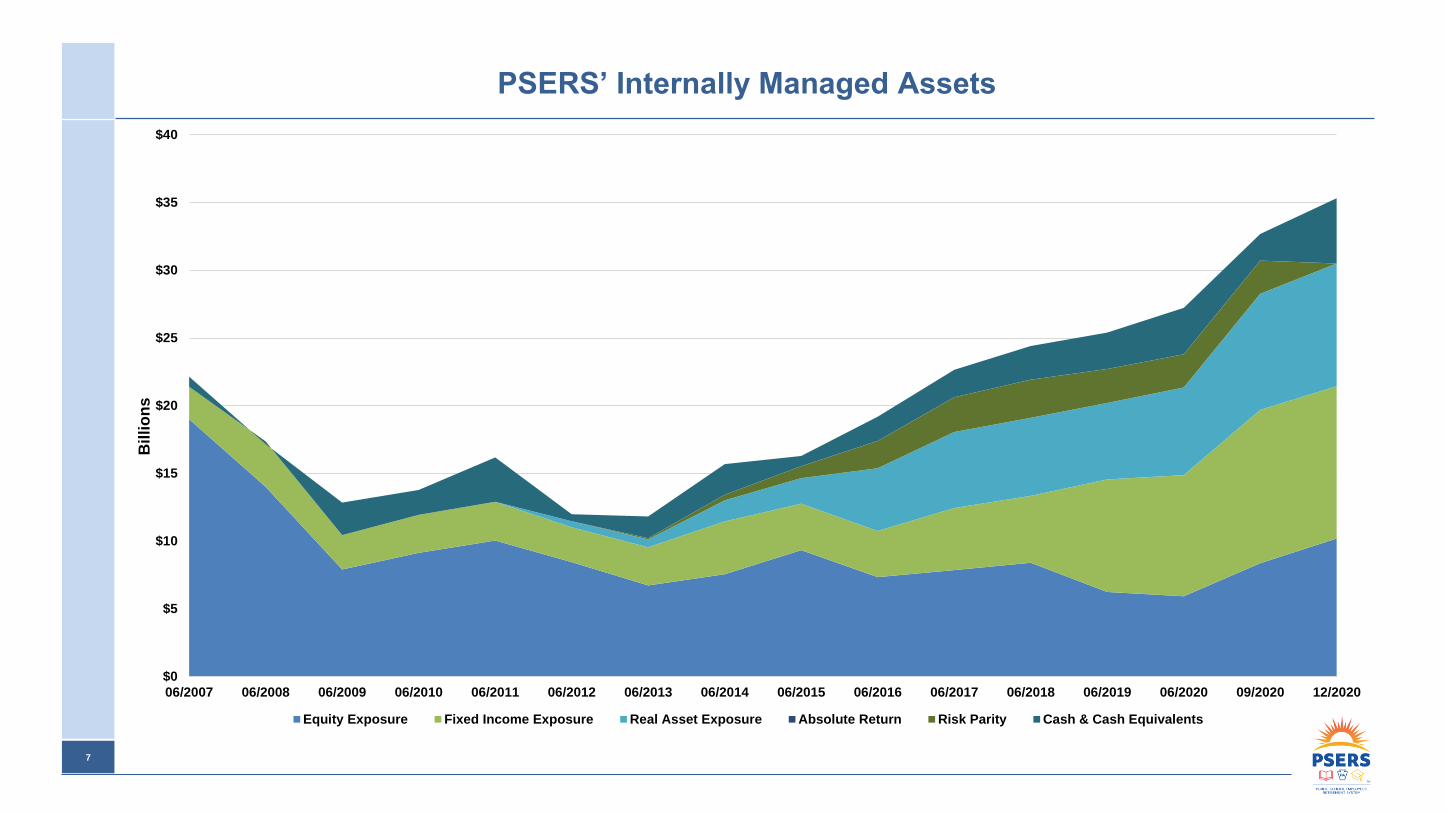
PSERS’ Internally Managed Assets
$0
$5
$10
$15
$20
$25
$30
$35
$40
06/2007 06/2008 06/2009 06/2010 06/2011 06/2012 06/2013 06/2014 06/2015 06/2016 06/2017 06/2018 06/2019 06/2020 09/2020 12/2020
Billi
on
s
Equity Exposure Fixed Income Exposure Real Asset Exposure Absolute Return Risk Parity Cash & Cash Equivalents
8
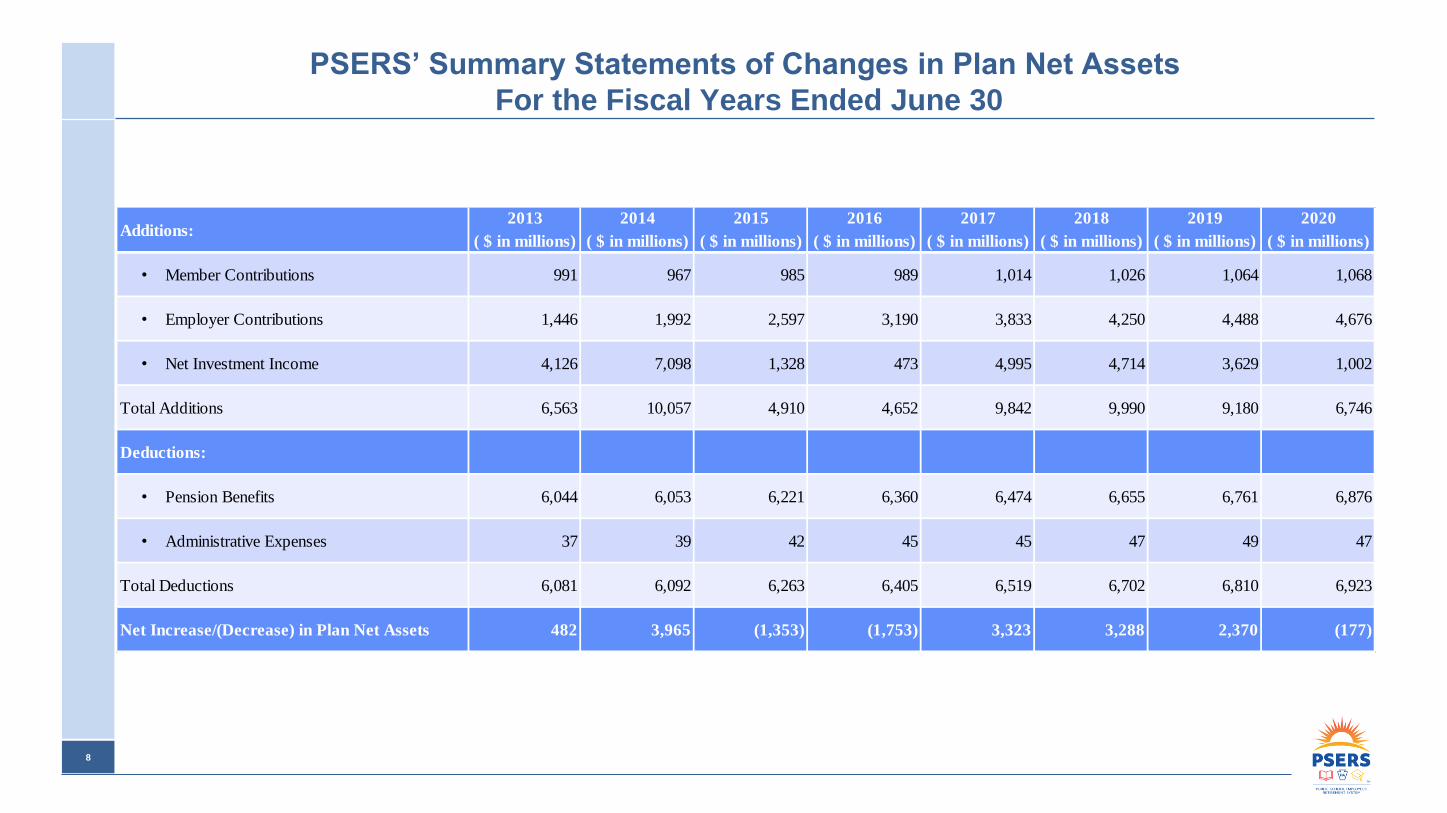
PSERS’ Summary Statements of Changes in Plan Net Assets
For the Fiscal Years Ended June 30
Additions:2013
( $ in millions)
2014
( $ in millions)
2015
( $ in millions)
2016
( $ in millions)
2017
( $ in millions)
2018
( $ in millions)
2019
( $ in millions)
2020
( $ in millions)
• Member Contributions 991 967 985 989 1,014 1,026 1,064 1,068
• Employer Contributions 1,446 1,992 2,597 3,190 3,833 4,250 4,488 4,676
• Net Investment Income 4,126 7,098 1,328 473 4,995 4,714 3,629 1,002
Total Additions 6,563 10,057 4,910 4,652 9,842 9,990 9,180 6,746
Deductions:
• Pension Benefits 6,044 6,053 6,221 6,360 6,474 6,655 6,761 6,876
• Administrative Expenses 37 39 42 45 45 47 49 47
Total Deductions 6,081 6,092 6,263 6,405 6,519 6,702 6,810 6,923
Net Increase/(Decrease) in Plan Net Assets 482 3,965 (1,353) (1,753) 3,323 3,288 2,370 (177)

9
PSERS Annual Cash Flows History – Since 2001
(14%)
(12%)
(10%)
(8%)
(6%)
(4%)
(2%)
0%
2%
4%
6%
8%
10%
($10)
($8)
($6)
($4)
($2)
$0
$2
$4
$6
$8
$10
20
01
20
02
20
03
20
04
20
05
20
06
20
07
20
08
20
09
20
10
20
11
20
12
20
13
20
14
20
15
20
16
20
17
20
18
20
19
20
20
Billi
on
s
Member Contributions ($) Employer Contributions ($)
Benefit Payments ($) Net Cash Flow Shortfall ($)
Cash Flow Excess/Shortfall as % of Beginning NAV (%)
10
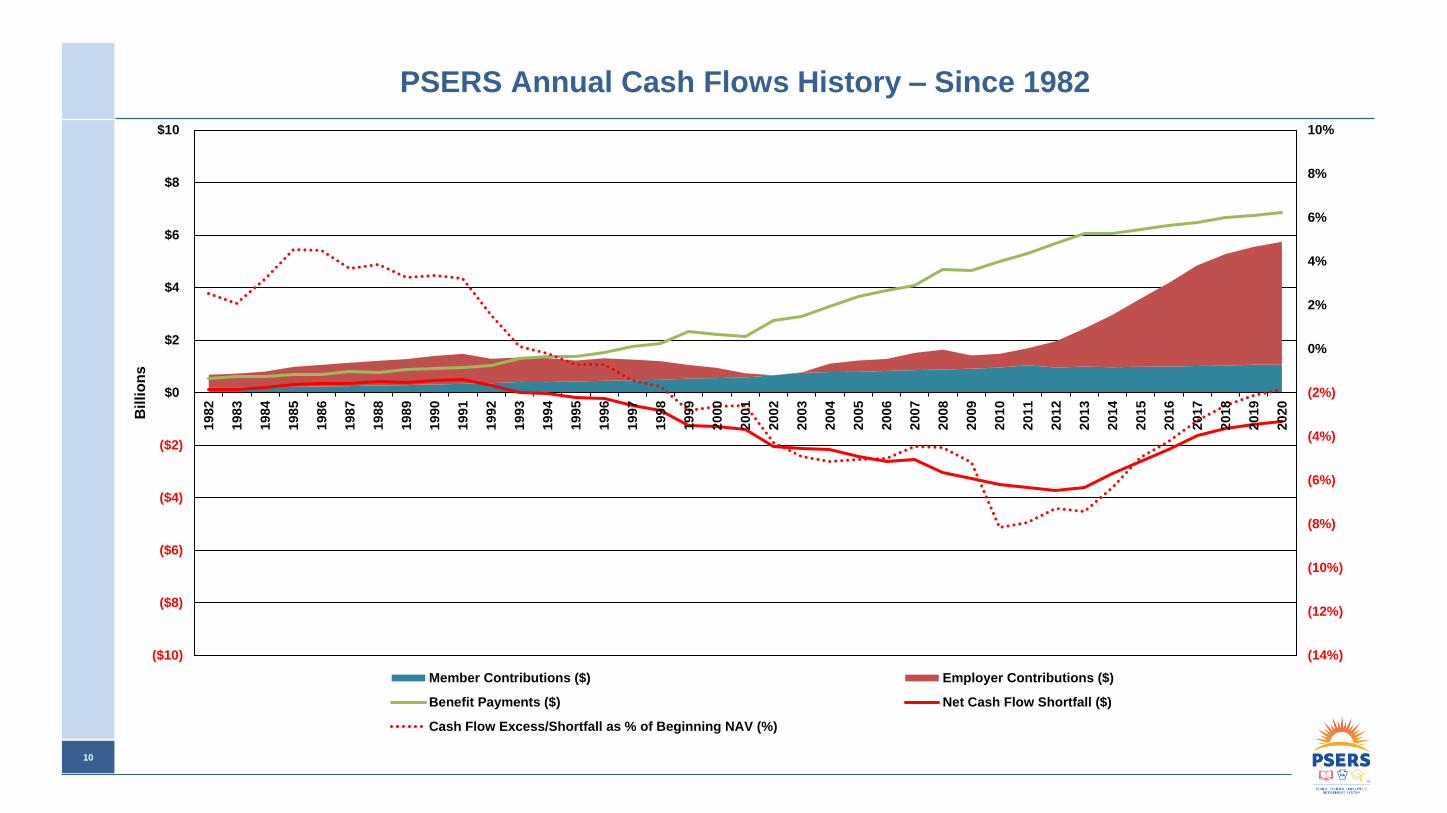
PSERS Annual Cash Flows History – Since 1982
(14%)
(12%)
(10%)
(8%)
(6%)
(4%)
(2%)
0%
2%
4%
6%
8%
10%
($10)
($8)
($6)
($4)
($2)
$0
$2
$4
$6
$8
$10
19
82
19
83
19
84
19
85
19
86
19
87
19
88
19
89
19
90
19
91
19
92
19
93
19
94
19
95
19
96
19
97
19
98
19
99
20
00
20
01
20
02
20
03
20
04
20
05
20
06
20
07
20
08
20
09
20
10
20
11
20
12
20
13
20
14
20
15
20
16
20
17
20
18
20
19
20
20
Bil
lio
ns
Member Contributions ($) Employer Contributions ($)
Benefit Payments ($) Net Cash Flow Shortfall ($)
Cash Flow Excess/Shortfall as % of Beginning NAV (%)