Embed Size (px)
Citation preview

PSC / Water Utility Consultant Meeting
August 12, 2019

Participating Remotely
• Video and PowerPoint Slides• Asking Questions

9:00-9:15 Welcome & Introductions
9:15-9:30 PSC Update Andy Galvin
9:30-10:00 Review of Ratemaking Process Denise Schmidt
10:00-10:30 Rate Case Overview & the Application Process
Kathy Butzlaff
10:30-11:00 Construction Case Overview & the Application Process
Mark Williams
11:00-11:20 Rate Impacts from Construction Cases LouAnn Holzmann
11:20-11:30 Questions & Discussion

PSC Updates
Andy GalvinDirector, Bureau of Water Utility Regulation & Analysis

CommissionerMike Huebsch
CommissionerEllen Nowak
Division of Energy
Regulation& Analysis
Division of Digital Access,
Consumer & Environmental
Affairs
Office of General Counsel
Division of Water Utility
Regulation & Analysis
Division of Business Operations
& Office
ManagementDenise Schmidt
Division Administrator
Chairperson Becky Valcq

Division of Water Utility Regulation & Analysis
Denise SchmidtDivision Administrator
Bureau of Water Utility RegulationAndy Galvin, Director
Auditors
• Kathy Butzlaff
• Bridgot Gysbers
• LouAnn Holzmann
• Amanda Slater
• Troy Gazza
VacantWater Policy Advisor
Rate Analysts
• Alex Hanna
• Andrew Fisher
Engineers
• Steve Kemna
• Mark Williams
• Peggy Wischhoff
Exec. Staff Assistants
• Jen Roades• Kathy Endres

Dockets
•All cases before the Commission have unique docket numbers 5555-CW-100
E-Services Portal http://apps.psc.wi.gov
Case Management System (CMS)
Electronic Records Filing System (ERF)
Event Calendar


http://apps.psc.wi.gov


http://apps.psc.wi.gov


Subscribing to PSC Dockets 5555-CW-100
• In the future, all correspondence will be sent only to utilities and other parties that are subscribed to the docket.
• In particular, for your cases, make sure your key staff and consultants are subscribed
http://apps.psc.wi.gov


Send email to [email protected] “Water Currents” in subject line

Utility Inquiry Line: 608-266-3766
When in doubt,call us!

Review of the Ratemaking Process
Denise Schmidt, AdministratorDivision of Water Utility Regulation & Analysis

• Changing demand patterns • Aging infrastructure, deferred
maintenance and replacement • Increasing capital and operating costs• Emerging regulatory requirements• Decline in grant funding
General Service Water Bills


•Establish rates that are based on cost and avoid subsidizing customers

Revenue Requirement
Cost Allocation
Rate Design
Financial & Operational Data
Information About Infrastructure, How Water is Used
Policy Objectives

Reasonable O&M expenses: maintenance, billing, customer service, etc.+
Depreciation as a way to recover capital investment+
(Reasonable rate of return) x (Rate Base)+
Property, income taxes, PILOT=
Revenue Requirement

•In the regulatory rate model, cash flow is generated by depreciation expense and ROR
•Cash flow is used for:- Principal and interest payments- Minor plant additions- Unexpected expenses- Savings for the future

Revenue Requirement $10,500,000
Less fee and other revenues collected for
capital projects (ex: impact fees, assessments) (500,000)
Less costs related to contributed plant (ROR and
depreciation) (2,000,000)
Less other revenue (ex: private fire protection
fees, grants, etc.) (50,000)
Rate Revenue Needed $7,950,000

• Allocate costs to functional categories - Base or average use costs- Extra-capacity or peak demand costs - Customer costs- Fire protection costs
• Group customers with similar usage characteristics
• Allocate costs to customer classes proportionate to their demands on the system

• Residential – Single Family• Residential – Multifamily• Commercial• Industrial• Public Authority• Irrigation• Raw Water• Individual Customer – typically for a large industrial customer with either
high or low peak demands• Wholesale

Step 2: Allocate Costs to Functional ComponentsBase (Avg. Day) – Extra Capacity (Max Day) – Extra Capacity (Max Hour)
Fire Protection– Customer
Step 1: Identify Costs by Functional CategorySource of Supply – Treatment – Pumping – Storage – Transmission & Distribution
Meters & Service Lines – Fire Protection – Billing - Administrative
Joint Costs
Step 3: Allocate Costs to Customer ClassesResidential – Commercial – Industrial – Public Authority
Wholesale – Multifamily – Fire Protection – Individual Customer
Dir
ect C
osts
Customer Demand Ratios and Units of Service Applied
Based on USOA
System Demand Ratios Applied

•Revenue level to be recovered from each customer class
•Average unit costs for each customer class- Fixed customer charges ($ per billing period)- Variable volumetric charges ($ per volume)- Fixed fire protection charges (PFP)

Rate Design
Resource Sustainability
Equity
Affordability
Easy to
ImplementRevenue Stability
Adequate Revenue
Public Understanding

0 5 10 15 20 25
1
2
3
4
Volume Used
Cost
per
Uni
t
Inclining Block
0 5 10 15 20 25
1
2
3
4
Volume UsedCo
st p
er U
nit
Declining Block
1
2
3
4
Volume Used
Cost
per
Uni
t Uniform
0 5 10 15 20 25
1
2
3
4
Month of Use
Cost
per
Uni
t
Seasonal

By Customer Class
Advantages• Cost-of-Service based• Public acceptance
Disadvantages • Administrative complexity• Customers using same volumes
can be in different classes• Need to keep up with changes
in use
System-wide
Advantages• Administrative simplicity• Public understanding
Disadvantages• Not Cost-of Service based unless
use customer class based rates

Customer Class
Residential
Multifamily
Commercial
Industrial
Public Authority
Ace Ethanol, LLC
Extra Capacity RatiosMax Day Max Hour
2.50 5.45
2.25 5.00
1.75 4.00
1.15 2.50
1.75 4.00
0.425 0.791

Advantages
• Support conservation (inclining), or support economic development (declining)
• May simplify billing (declining)
Disadvantages
• Administrative complexity (inclining)
• Perceived as encouraging wasteful use (declining)
• Public perception with regard to equity


$4.86
$6.01
$8.01
Gallons Used per Quarter
Residential Water Rates(Price per 1,000 Gallons)
2,000 Over 10,00010,000


• PFP Charge recovers costs associated with building and maintaining capacity to provide high pressures and flows to hydrants for the purpose of fire suppression
• Portion of wells, pumps, storage facilities, water mains, and hydrants
• It is not simply a “hydrant rental” fee

Source: http://efc.web.unc.edu/?s=fire+protection

How close is each class to 100%?

Bill Comparison:
• Is the impact on any customer group high compared to others?
• Does the impact make sense, given the group’s burden on the system?
• Are the impacts aligned with rate-making objectives?

Source: http://efc.web.unc.edu/?s=are+utilities+that+need+to+raise+rates+actually+raising+rates%3F

•Evaluation based on annual report data•Metrics
–Fewer than 90 days’ cash on hand, AND –Two consecutive years of operating losses, AND–No rate case within last year
•Commission may open investigation: Are rates reasonable?
•Goal: Within 18 months, Utility takes action to improve financial situation

Source: AWWA, “Avoiding Rate Shock: Making the Case for Water Rates”


https://psc.wi.gov/Pages/ForUtilities/Water/WaterUtilityTraining.aspx

Rate Case Overview & the Application Process
Kathy Butzlaff, Audit ManagerBureau of Water Utility Regulation & Analysis

Inflationary increase
Quick and Simple Process
No hearing required
Any size increase
Longer Process
Public hearing required
Simplified Rate Case Conventional Rate Case
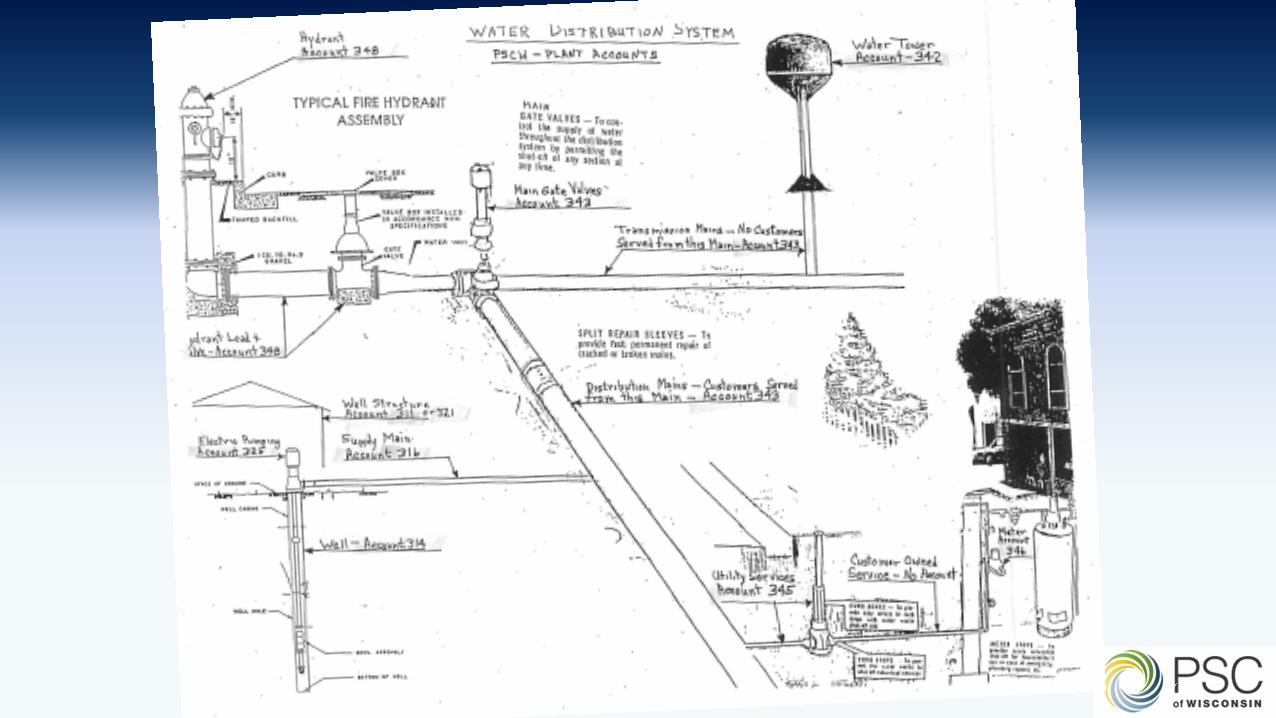
57 62 51 53 47 48 44 32
75 76 99127
10872 88
48
0
20
40
60
80
100
120
140
160
180
200
2012 2013 2014 2015 2016 2017 2018 2019
SRCsCRCs

Application Review &
Assignment
15 Days
Revenue Requirement
95Days
COSS/Rate
Design
30Days
Public Hearing
35 Days
FinalDecision
25Days
109 Days 38 Days49 Days 15 Days38 Days
200days
249days
2018
2019 through June 30126 Days 23 Days44 Days 15 Days42 Days 250
days

• The average case - 250 days• If Utility delays are eliminated – 222 days
Percent of Cases in less than 200 days:• 16% of all cases• 44% of cases – utility delays
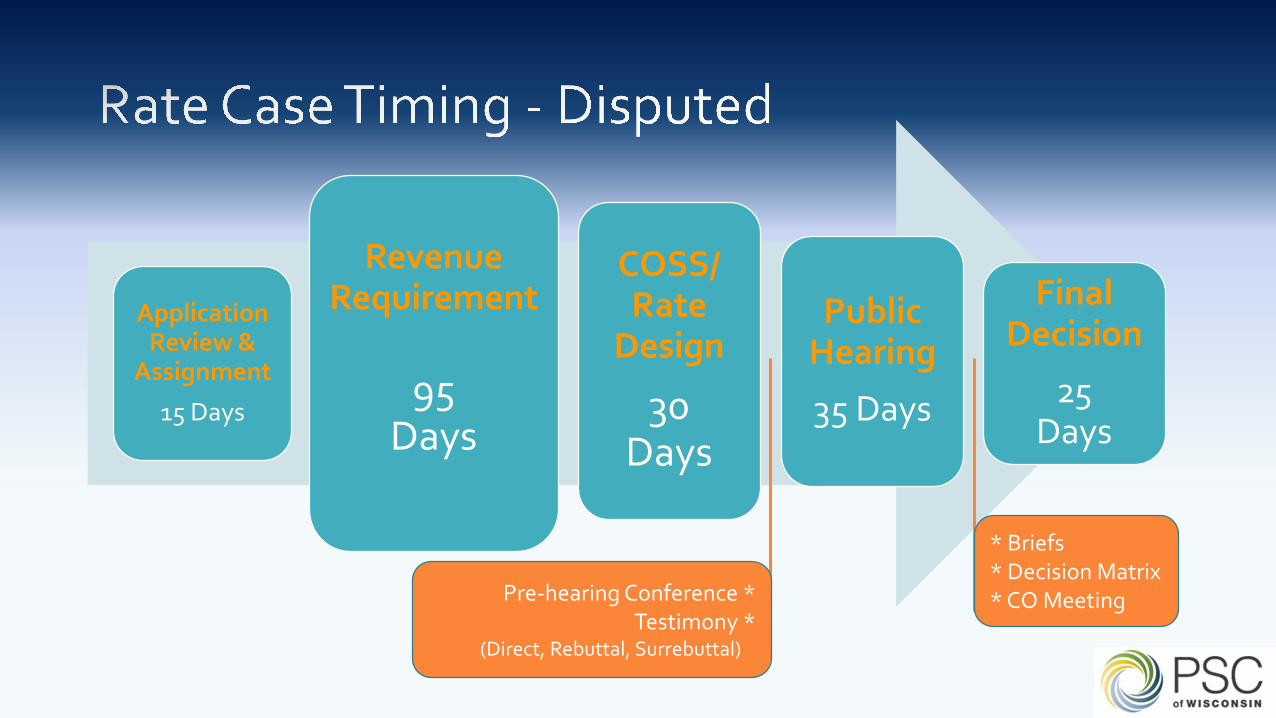
Application Review &
Assignment
15 Days
Revenue Requirement
95Days
COSS/Rate
Design
30Days
Public Hearing
35 Days
FinalDecision
25Days
Pre-hearing Conference *Testimony *
(Direct, Rebuttal, Surrebuttal)
* Briefs* Decision Matrix * CO Meeting
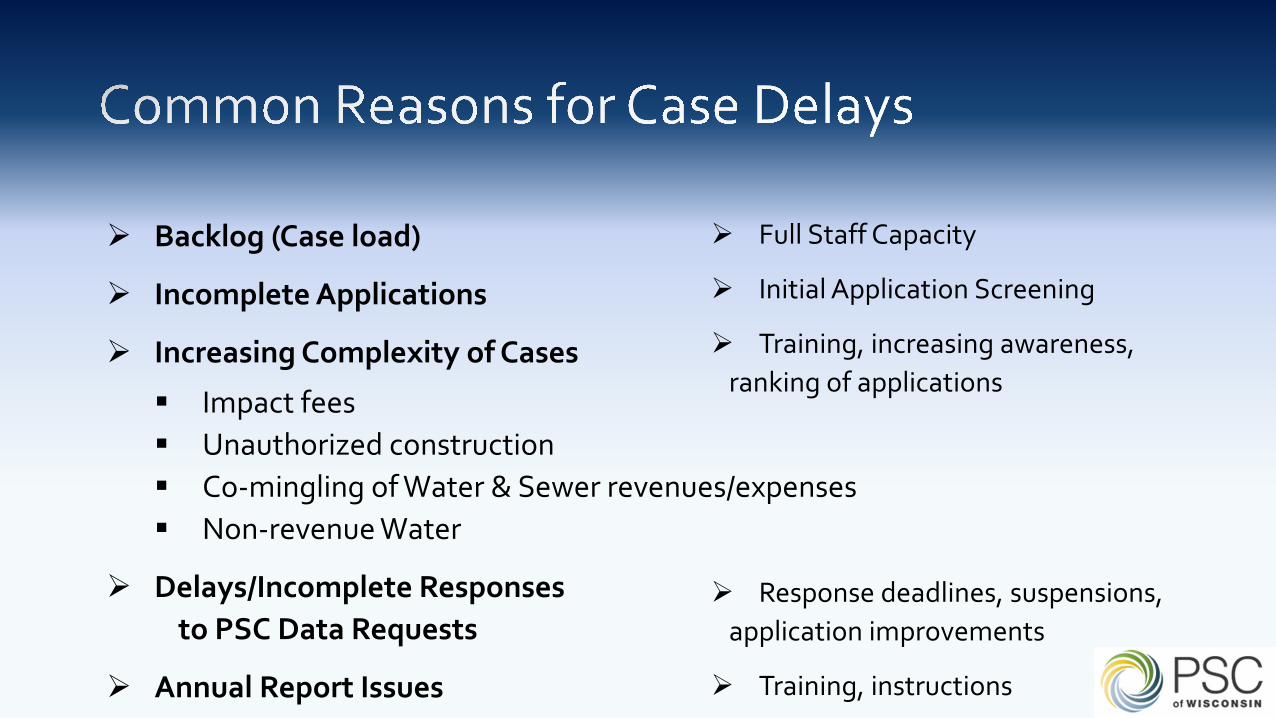
Backlog (Case load)
Incomplete Applications
Increasing Complexity of Cases
Impact fees Unauthorized construction Co-mingling of Water & Sewer revenues/expenses Non-revenue Water
Delays/Incomplete Responses to PSC Data Requests
Annual Report Issues
Full Staff Capacity
Initial Application Screening
Training, increasing awareness, ranking of applications
Response deadlines, suspensions, application improvements
Training, instructions

1. Obtain construction approvals prior to filing2. Request a rate application at least 200 days in advance before you need the
increase revenue3. Be sure your application is complete:
a. Thoroughly complete Attachments 19 and 19a of the rate applicationb. Resolve problems with customer billing datac. Classify construction projects properlyd. Classify Contribution in Aid of Construction (CIAC) plant correctly in both test year and
prior years
4. Answer PSC data requests promptly and completely5. Call if you have questions!

Jan. 25, 2019 letter• Allows recovery of processing fees in O&M expenses• 5820-UR-115, 6680-TE-103, 6680-TG-108
Currently, two options:1. Rate recovery: request in current/future applications
• updated to provide information
2. No rate recovery: to do so immediately, use surplus revenue to cover processing costs
3. Tariff change without rate case is under consideration

Construction Case Overview & the Application Process
Mark Williams, Public Utility Engineer -SeniorBureau of Water Utility Regulation & Analysis

PSC reviews capital improvements to ensure sustainability of water utility while keeping rates just and reasonable
• Reviews financial aspects of project
• 3 primary criteria for evaluating projects
• Requires alternatives analysis
• Requires most cost-effective solution with lowest risk of future stranded assets
• Estimates rate impact

Wis. Stat. § 196.49(3)(b): “The commission may refuse to certify a project if it appears that the completion of the project will do any of the following:
1. Substantially impair the efficiency of the service of the public utility.
2. Provide facilities unreasonably in excess of probable future requirements.
3. When placed in operation, add to the cost of service without proportionately increasing the value or available quantity of service….”

1. New Utilities• (PSC 184.03(1))
2. Expansion Acquisitions, Interconnections• (PSC 184.03(2))
3. Utility Plant Construction• (PSC 184.03(3))
Exempt if:Project costs are less than $364,000**
or 25% of a Utility’s most recent Operating Revenues
Project Type ExemptionsPSC 184.03 (3) & (4)
1. Water mains (unless >= 8” and > 3 miles long)
2. Laterals, hydrants, or valves
3. Routine meter replacement
4. SCADA or other electronic monitoring and control systems
5. Replace/Repair existing pumps, motors, or associated equipment
6. Routine maintenance
7. Etc.

0
20
40
60
80
100
2008 2009 2010 2011 2012 2013 2014 2015 2016 2017 2018 2019
Pre-recession average

0
5
10
15
20
25
30
Water Supply Non-routine MeterReplacement
Water Treatment Utility Building Large Mains Other Utility Organization
201620172018

ApplicationReview
& Analysis
(To DR)
20 Days
NOI
40Days
Final Decision
30 days
Pre-Application
Meeting
AssignApp
15d
Construction Authorization Process
Goal: 105days
DR-NOI: 48 Days
NOI-Order:29 Days
App-Asgn: xx Days
Asgn-DR: 65 Days
135days
2018
2019 Q.1 DR-NOI: 54 Days
NOI-Order:30 Days
App-Asgn: xx Days
Asgn-DR: 53 Days
141days

psc.wi.gov/Pages/ForUtilities/Water/Construction.aspx

1. Request joint PSC/DNR pre-application meeting early in process (ex: well site phase)
2. Make sure application is based on updated information (demand forecasts, major customer agreements, etc.)
3. Make sure application is complete(Use the Checklists!)
4. Respond to PSC data requests promptly
5. If in doubt, call us!

1. Missing or incomplete alternative analysis
2. Missing or incomplete discussion of each the three statutory requirements
3. Incomplete breakdown of project costs by construction items, engineering, contingencies, USOA accounts
4. Old or non-current cost information
4. Old or non-current water use demand study or analysis
5. Missing service agreements
6. Questions, call us!

• Order Point Tracker• No efficient way of tracking order points
• Reminders will be sent to Utility’s UNF contacts 30 days in advance of due date
• Monthly reminders will be sent out following the due date
• Staff will be assigned to work with utilities
The Utility shall submit a report to the Commission no later than 12 months from the date of this order…

• Online Construction Applications
• Transitioning from static checklists to online application
• Ensure that the information staff needs for projects is provided
• Starting with AMR/AMI projects as way to streamline process

Rate Impacts from Construction
LouAnn Holzmann, Public Utility AuditorBureau of Water Utility Regulation & Analysis

•Water utilities are capital intensive enterprises • Up to 90% of costs may be fixed costs• Biggest impact to rates is new plant
•How to Mitigate the Rate Impact?• Delay spending on new plant if possible• Add customers or regionalize• Grants or principal forgiveness• Other contributions from customers• Good financing terms• Municipality could limit PILOT

•Operation and maintenance expenses
•Depreciation expense as a recovery of capital investment
•Taxes and tax equivalent (PILOT)
•Reasonable return on net investment rate base (ROR on NIRB)

Cost Utility Financed Plant
Contributed Plant Impact of Grant Money
O & M expenses 1-2% 1-2% No Change
Depreciation expense
3-4% 0% Lower
Taxes (PILOT) 2% 2% No Change
ROR on rate base 5-7% 0% Lower
TOTAL 13% 3% Lower

• Estimated % increase in rates due to construction project= (UP)(0.13) + (CP)(0.03)
Annual Sales of Water• Where: • UP = Utility financed project costs in dollars (loans or funds)• CP = Contributed financed project costs in dollars (grants and principal
forgiveness) • Annual Sales of Water = the utility’s annual “total sales of water” in dollars from
page W-1 of the utility’s most recent PSC Annual Report

50% Grant Utility Financed$500,000
Grant Financed$500,000
Annual Total @ 50% Grant
O&M $5,000 $5,000 $10,000
Depreciation $15,000 $0 $15,000
Taxes (PILOT) $10,000 $10,000 $20,000
ROR $35,000 $0 $35,000
Total $65,000 $15,000 $80,000

No Grant 50% Grant
Current Revenues $100,000 $100,000
$ Increase $130,000 $80,000
% Increase 130% 80%
Average bill/qtr.(current)
$100 $100
Average bill/qtr.(new)
$230 $180
PFP Charge Also increases Increases less

•Increases the annual revenue requirement
• Operation and maintenance expenses• Depreciation expense• Taxes and tax equivalent (PILOT)• Reasonable return on net investment rate base (ROR on NIRB)
•SRC most likely not a large enough increase•Utility needs to plan ahead for a conventional rate case

•PSC construction approvals•Other construction approvals•Rate increases•Loan closings•Principal forgiveness and grants

•Plan ahead even more!•Consider two (or more) rate increases•One increase now to get utility income up to a good level
• Cover current expenses• Save money towards project• Qualify for better financing terms• Stay off PSC Financial Outreach list
•Second increase to coincide with project construction

Roundtable Discussion and Wrap-Up

March: WRWA Technical Conference and Expo
May: Regulatory Affairs Seminar
??? PSC/Consultants Meeting
September: WIAWWA Annual Conference
October: PSC/Utility Meeting


![I o I 000D00(}][!JCP0 :. [JJooOJDpsc.mo.gov/CMSInternetData/Annual Reports/PSC... · The commission's duties include inspection and investigation of various utility opera tions, response](https://img.pdfslide.us/doc/110x75/5f521683db0b1605760770c7/i-o-i-000d00jcp0-reportspsc-the-commissions-duties-include-inspection.jpg)