Embed Size (px)
Citation preview
Dia
gn
osti
cs
High Resolution Melting: History, Technology, and Utility
Charles Hardwick, Ph.DField Applications Consultant
www.roche-applied-science.com

Dia
gn
osti
cs
2www.roche-applied-science.com
High Resolution Melting What is it?
• Melting Curve Analysis is well established as a method to characterize amplicons with SYBR Green I, HybProbe (FRET) or SimpleProbe probes.
• High resolution melting analysis is an extension of melting curve analysis…
– enables not only detection of SNPS but also their discovery
– requires special fluorophores, a high-performance instrument (block homogeneity, suitable filters, optical sensitivity and resolution) and special analysis algorithms.

Dia
gn
osti
cs
3www.roche-applied-science.com
History - Background
• Evolved from need to monitor sequence variation of entire amplicon
– Single-strand conformation polymorphism
– Heteroduplex migration
– Denaturating gel electrophoresis
– Temperature gradient gel electrophoresis
– Enzymatic or chemical cleavage
– Cycle sequencing and gel electrophoresis
– Denaturing HPLC
– Mass Spectrophotometry
– Array analysis
Dia
gn
osti
cs
4www.roche-applied-science.com
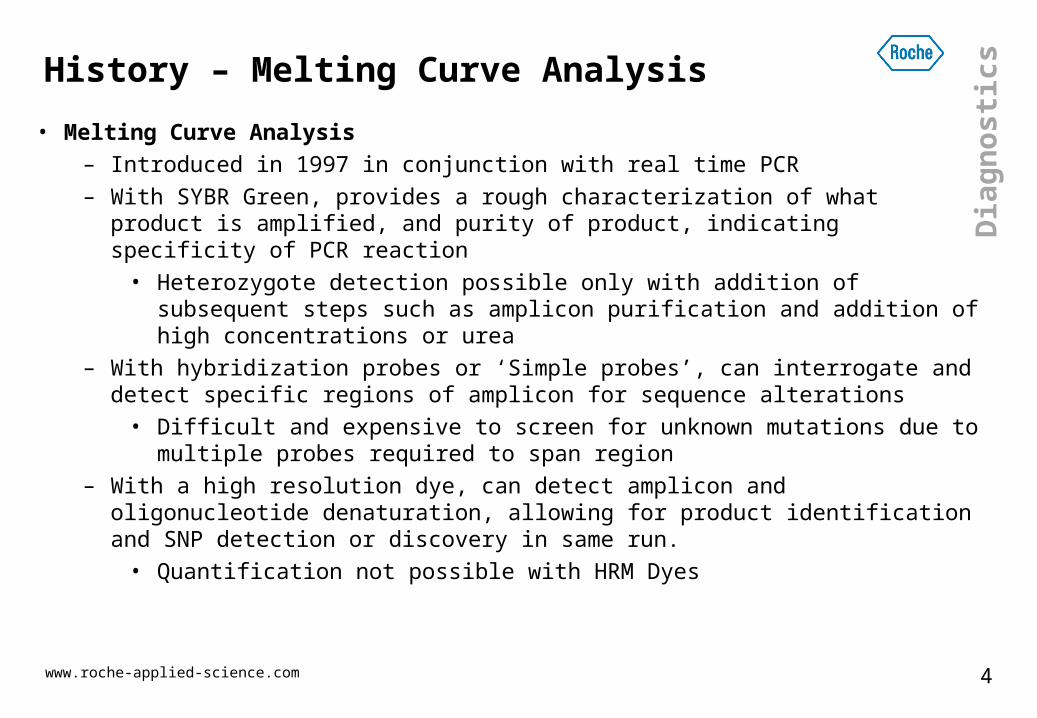
History – Melting Curve Analysis
• Melting Curve Analysis
– Introduced in 1997 in conjunction with real time PCR
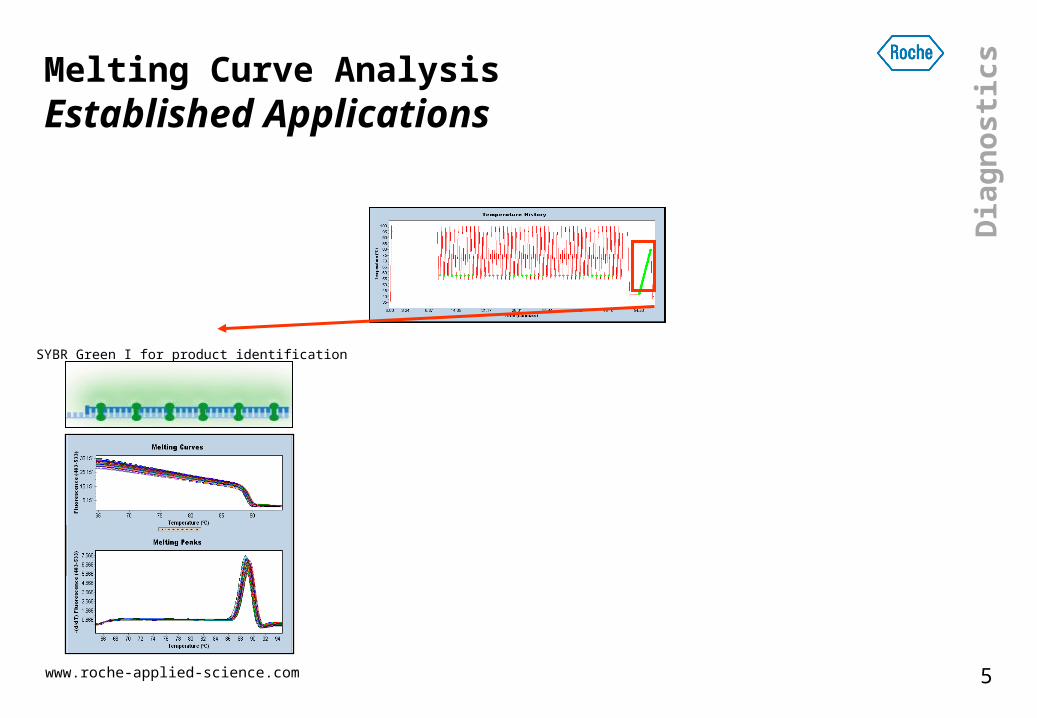
– With SYBR Green, provides a rough characterization of what product is amplified, and purity of product, indicating specificity of PCR reaction
• Heterozygote detection possible only with addition of subsequent steps such as amplicon purification and addition of high concentrations or urea
– With hybridization probes or ‘Simple probes’, can interrogate and detect specific regions of amplicon for sequence alterations
• Difficult and expensive to screen for unknown mutations due to multiple probes required to span region
– With a high resolution dye, can detect amplicon and oligonucleotide denaturation, allowing for product identification and SNP detection or discovery in same run.
• Quantification not possible with HRM Dyes
Dia
gn
osti
cs
5www.roche-applied-science.com
Melting Curve AnalysisEstablished Applications
SYBR Green I for product identification

Dia
gn
osti
cs
6www.roche-applied-science.com
Melting Curve AnalysisEstablished Applications
SYBR Green I for product identification Fluorescence labeled Probes for Genotyping
Melting Curve

Dia
gn
osti
cs
7www.roche-applied-science.com
Melting Curve AnalysisEstablished and New Applications
SYBR Green I for product identification High Resolution Melting Dye for Gene Scanning Fluorescence labeled Probes for Genotyping

Dia
gn
osti
cs
8www.roche-applied-science.com
History – High-Resolution Melting
• Traditional genotyping methods versus high resolution melting
– Ideal for screening 1000s of samples for sequence variations
dHPLC Sequencing
Previous gene scanning techniques
•Low throughput
•Expensive
•Time consuming
Real-Time PCR
•High throughput
•Cost Effective
•Fast

Dia
gn
osti
cs
9www.roche-applied-science.com
SNP Discovery and Genotyping Methods
Melting Curve Analysis
Dia
gn
osti
cs
10www.roche-applied-science.com
History – High-Resolution Melting
Why High Resolution Melting?
Robust, non-destructive closed-tube method with many
applications; highly informative and flexible. More convenient and
cost-effective than current technologies, such as sequencing or
dHPLC.

Dia
gn
osti
cs
11www.roche-applied-science.com
High Resolution Melting - Technology
• Principles
• Prerequisites
• Dyes
• Instrumentation
• Data Analysis

Dia
gn
osti
cs
12www.roche-applied-science.com
DNA withheterozygote
SNP
PCR+
+ . . .
T
C
T
T T
T
T
C
C C C
C
G
A
A
A A
AA
G
G G
G
G
Denaturationreannealing
+Intercalatingfluorescent
dye
Increasingtemperature
High Resolution Melting Amplicon Melting

Dia
gn
osti
cs
13www.roche-applied-science.com
High Resolution Melting
Raw Data

Dia
gn
osti
cs
14www.roche-applied-science.com
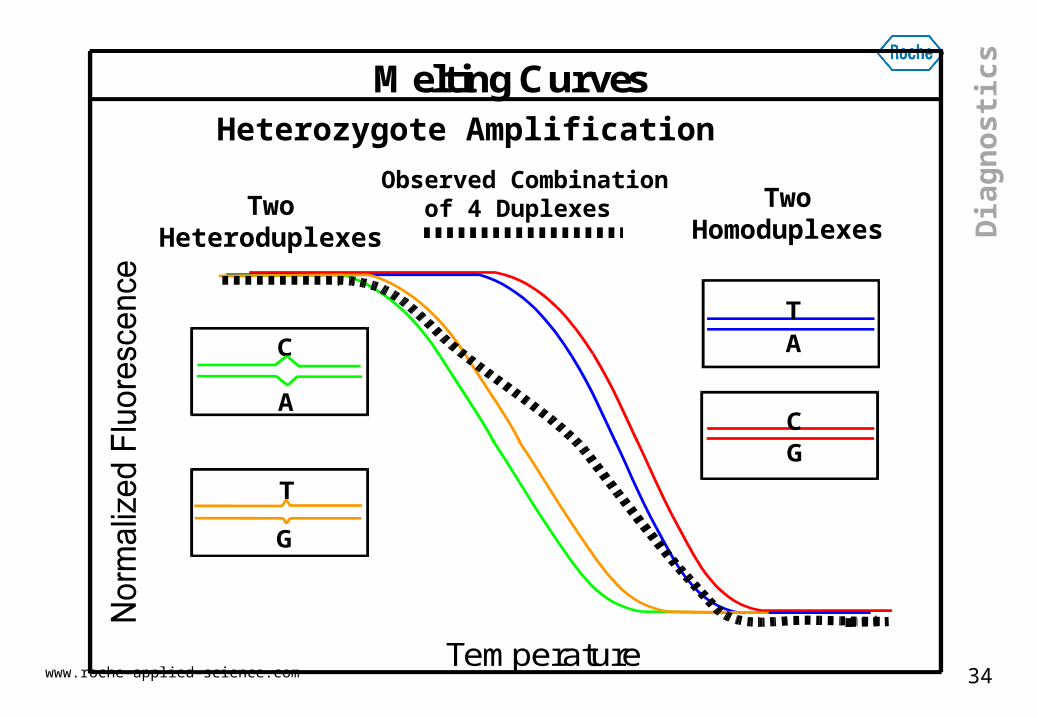
Amplicon MeltingVariation in Melting Temperature (Tm)
• The Tm of an amplicon depends mainly on GC content. Alterations in the amplicon may influence the Tm.
• Amplicon Melting of homozygote samples (containing homoduplexes of wildtype or
mutant DNA) give very similar curve shapes.
• Amplicon Melting of heterozygote samples (containing homo and heteroduplexes) give
curve shapes which are highly distinct.
Highest Stability Lowest Stability G:C > A:T > G:G > G:T = G:A > T:T = A:A > T:C > A:C > C:C

Dia
gn
osti
cs
15www.roche-applied-science.com
Technology - Prerequisites and Innovations What Is Needed to Perform HRM?
• Novel intercalating dye to identify heteroduplex DNA– saturating, non-inhibitory, ds DNA binding without redistribution during
melting
• Precise Instrument to allow genotyping and/or mutation scanning of whole PCR products.
– homogenous temperature profile and temperature control– high sensitivity optical system (light source, filters and detection system)
• Flexible Data Analysis Software– Sensitive and specific algorithms to distinguish detected differences– Easy to use, easy to adjust– Melt-standard compatible

Dia
gn
osti
cs
16www.roche-applied-science.com
High Resolution Melting Non-Saturating vs Saturating Dyes
homoduplexes heteroduplexes
VS
vs
Saturating dye• uniform, sharp signals• only sequence but not dye makes a difference
Fluorescent ds-DNA specific dyes (e.g., SYBR Green I)• individual curves not sharp• overlap is the same for homo- and heteroduplexes

Dia
gn
osti
cs
17www.roche-applied-science.com
High Resolution MeltingHigh Resolution Melting Dye in Action
Non-Saturating Dye- SYBR Green I
Saturating Dye- LightCycler HRM Master
→Heat
→Heat
No decrease in fluorescence
Decrease in fluorescence

Dia
gn
osti
cs
18www.roche-applied-science.com
High Resolution Melting
Dyes
• Gundry et al tried a number of common and uncommon dyes for HRM
– SYBR Green 1
– SYBR Gold
– Ethidium bromide
– Pico Green
– TOTO-1
– YOYO-1
• Requirements:
– Saturating
– non-inhibitory to PCR reaction
– Sufficient fluorescent levels for detection
– Allows heteroduplex detection

Dia
gn
osti
cs
19www.roche-applied-science.com
High Resolution Melting
Dyes
– Very few dyes meet the requirements
• LC Green – Idaho Technologies – somewhat inhibitory
• R27 – Biolight – limited heteroduplex detection
• EvaGreen – Biotium – somewhat inhibitory, though less than SYBR
• ResoLight – Roche
– Signal 7x higher than LC Green
– No PCR inhibition within 8x concentration range
– Improved stability over LC Green or R27
– Well suited to heteroduplex differentiation
Dia
gn
osti
cs
20www.roche-applied-science.com
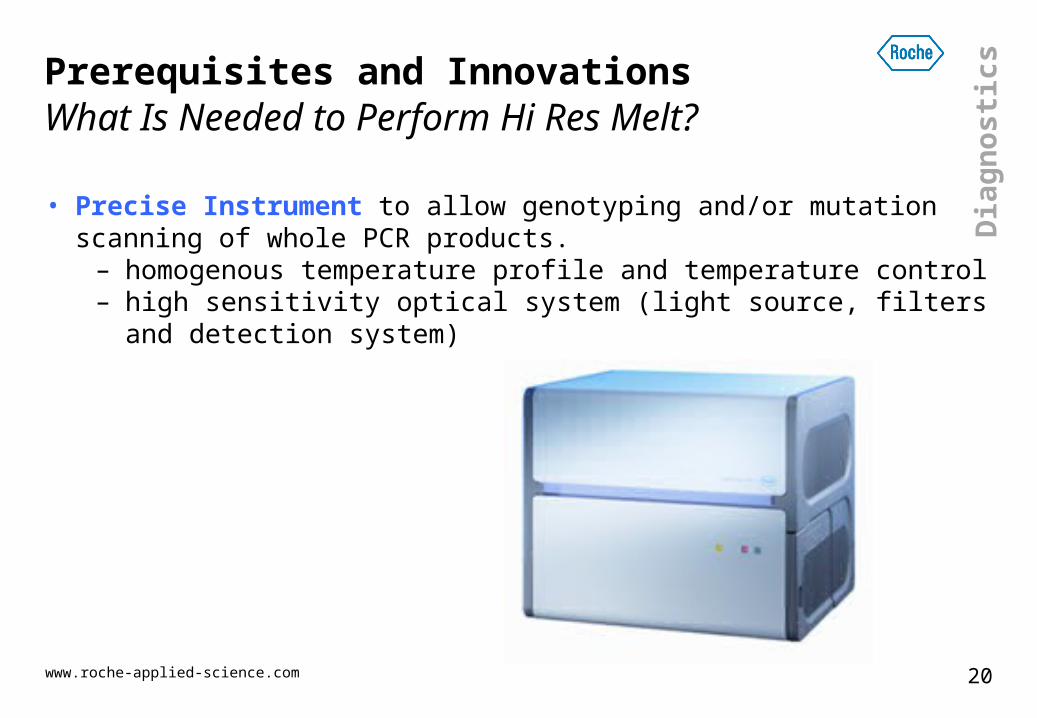
Prerequisites and Innovations What Is Needed to Perform Hi Res Melt?
• Precise Instrument to allow genotyping and/or mutation scanning of whole PCR products.
– homogenous temperature profile and temperature control– high sensitivity optical system (light source, filters and detection system)

Dia
gn
osti
cs
21www.roche-applied-science.com
LightCycler® 480 SystemThermocycler
• Six Peltier elements: semi-conductors where direction of current either cools or heats the thermoblock.
Therma-BaseTM
Cooling body
Heat pumps
MWP Mount
Heated lid • Includes Therma-BaseTM for optimized heat exchange which results in excellent overall temperature homogeneity.
• Allows to finish a PCR run: 96 wells in < 1 hour
384 wells in < 40 min.
• New technology for thermocyclers
• Unique to LC480
Dia
gn
osti
cs
22www.roche-applied-science.com
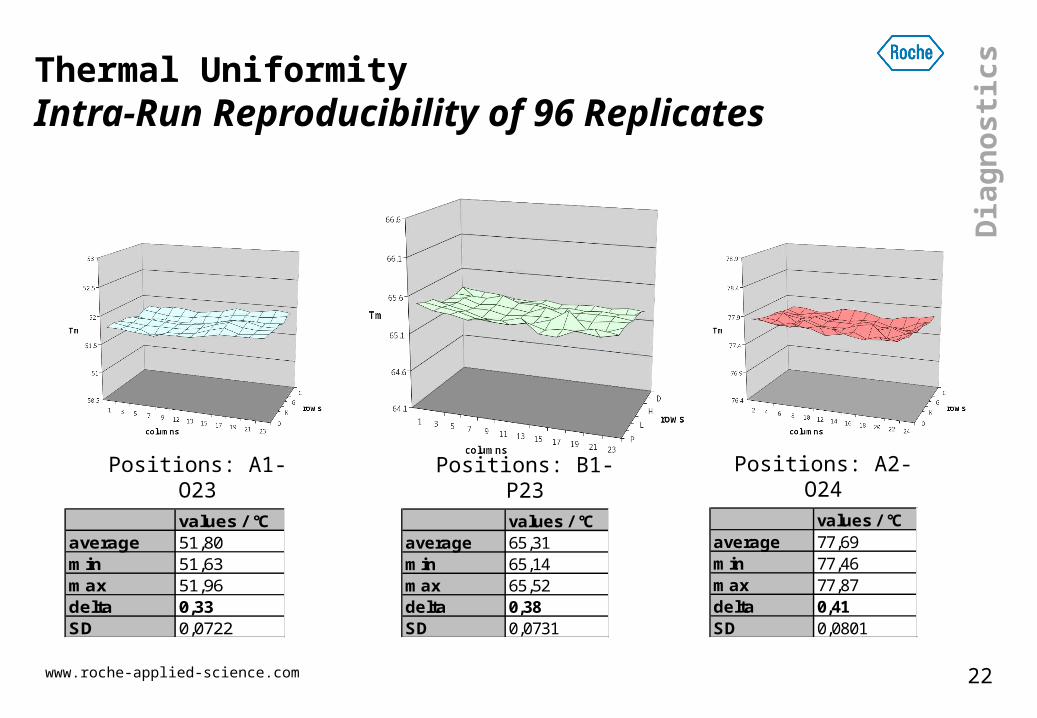
Thermal Uniformity Intra-Run Reproducibility of 96 Replicates
values / °Caverage 77,69min 77,46max 77,87delta 0,41SD 0,0801
values / °Caverage 65,31min 65,14max 65,52delta 0,38SD 0,0731
values / °Caverage 51,80min 51,63max 51,96delta 0,33SD 0,0722
Positions: A1-O23 Positions: B1-P23 Positions: A2-O24

Dia
gn
osti
cs
23www.roche-applied-science.com
LightCycler® 480 Performance Absolute Quantification, SYBR Green I
Total RNA per reaction 100ng 10 ng 1 ng 100 pg 10 pg H2Omean 20,57 24,11 27,91 31,69 35,49 -SD 0,083 0,163 0,14 0,186 0,337 -max 20,71 24,45 28,17 32,07 35,96 -min 20,42 23,83 27,69 31,44 34,9 -delta Cp 0,29 0,62 0,48 0,63 1,06 -
2-step RT-PCRTarget: h-HPRT

Dia
gn
osti
cs
24www.roche-applied-science.com
Thermal Uniformity Instrument Comparison -96 wells
LightCycler® 480 Instrument Standard Instrument

Dia
gn
osti
cs
25www.roche-applied-science.com
LightCycler® 480 Instrument Standard Instrument
Thermal Uniformity Instrument Comparison – 384 wells

Dia
gn
osti
cs
26www.roche-applied-science.com
LightCycler® 480 Instrument Optical System - Lightpath
Folded optical pathto reduce heightCCD Camera
Lamp Unit
Filter
Filter
Optics
Optics
Optics cable
Micro well plate
Heated Cover
Micro well plate
Heated Cover
Reference Channel
Lamp Unit
CCD Camera
Dia
gn
osti
cs
27www.roche-applied-science.com
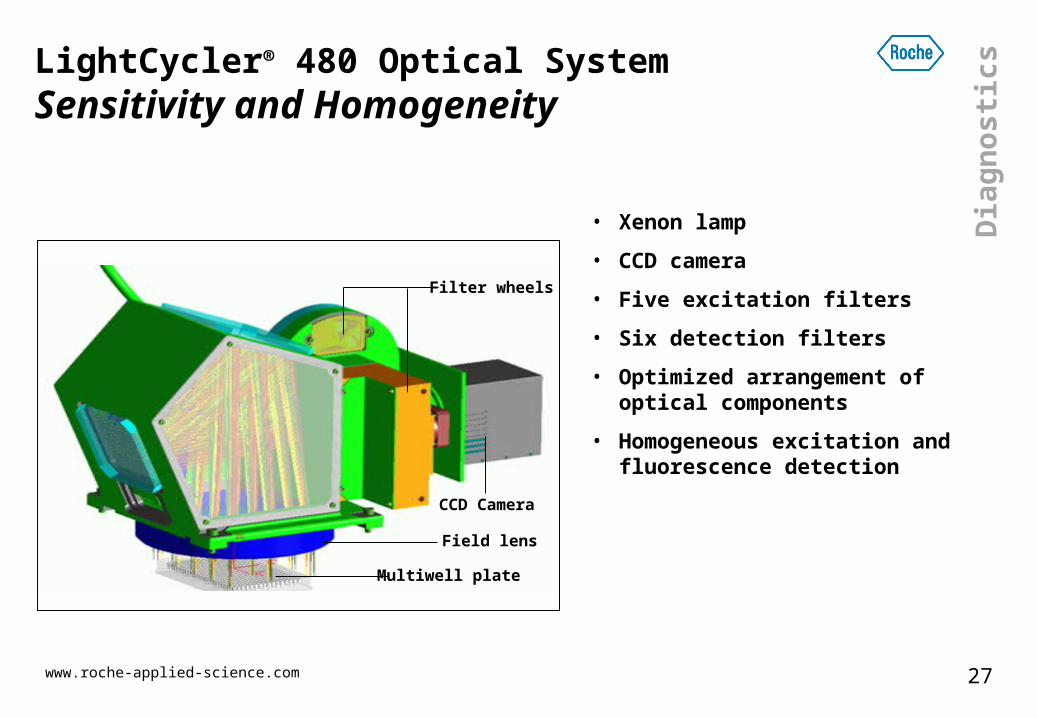
LightCycler® 480 Optical SystemSensitivity and Homogeneity
• Xenon lamp
• CCD camera
• Five excitation filters
• Six detection filters
• Optimized arrangement of optical components
• Homogeneous excitation and fluorescence detection
Filter wheels
CCD Camera
Multiwell plate
Field lens

Dia
gn
osti
cs
28www.roche-applied-science.com
LightCycler® 480 Instrument Optical Properties
• Light source: high intensity xenon lamp
• Highest intensity of light over a broad electromagnetic spectrum
• Degrades (ages) in linearly, without spectral shift.
400 500 600 700
Excitation filters
Emission filters
450, 483, 523, 558, 615 nm
500, 533, 568, 610, 640, 670 nm

Dia
gn
osti
cs
29www.roche-applied-science.com
LightCycler® 480 System Assay Formats and Dyes

Dia
gn
osti
cs
30www.roche-applied-science.com
External evaluationARUP (Salt Lake City) study of hardware features
Heterozygote scanning: LightCycler® 480 equals LightScanner LightCycler® 480 advantages: data density, signal-to-noise ratio, melting rate, speed
Herrmann, M. G. et al. (2007). "Expanded Instrument Comparison of Amplicon DNA Melting Analysis for Mutation Scanning and Genotyping." Clin Chem; June 2007

Dia
gn
osti
cs
31www.roche-applied-science.com
High Resolution Melting
Software and Data Analysis
• Wittwer et al (2003) demonstrated a useful and robust analysis methodology that has the capability to reveal both homo- and hetero-duplex DS DNA configurations
• Utilizes fluoresence normalization, temperature shift adjustment, and derivative melting curve plots
• Can reveal extremely minor differences in DS DNA melting curve shape
• Allows for comparison and adjustment to use melting standards for genotyping

Dia
gn
osti
cs
32www.roche-applied-science.com
High Resolution Melting Data Analysis
Raw Data
Normalization Temperature Shift
Difference Plot
Normalized, Tm-shifted Difference PlotNormalized, Tm-shifted Difference Plot

Dia
gn
osti
cs
33www.roche-applied-science.com
Wt/Homo/Heterozygote Differentiation
homozygous wildtype(homoduplexes)
homozygous mutant(homoduplexes)
heterozygous (homo and heteroduplexes)
Example:
Sequence variations (SNP GT) in the LPLH3 gene
72 samples, 164 bp amplicon
Dia
gn
osti
cs
34www.roche-applied-science.com
Melting Curves
Temperature
CG
TA
Heterozygote Amplification
TwoHomoduplexes
TwoHeteroduplexes
C
A
T
G
Observed Combinationof 4 Duplexes

Dia
gn
osti
cs
35www.roche-applied-science.com
Unlabeled Probe Genotyping and Amplicon Melting Simultaneous genotyping and scanning
Tem
per
atur
e
Time (sec)0 30 60 90 120
Scan the full fragment
Genotype by probe melting
Dia
gn
osti
cs
36www.roche-applied-science.com
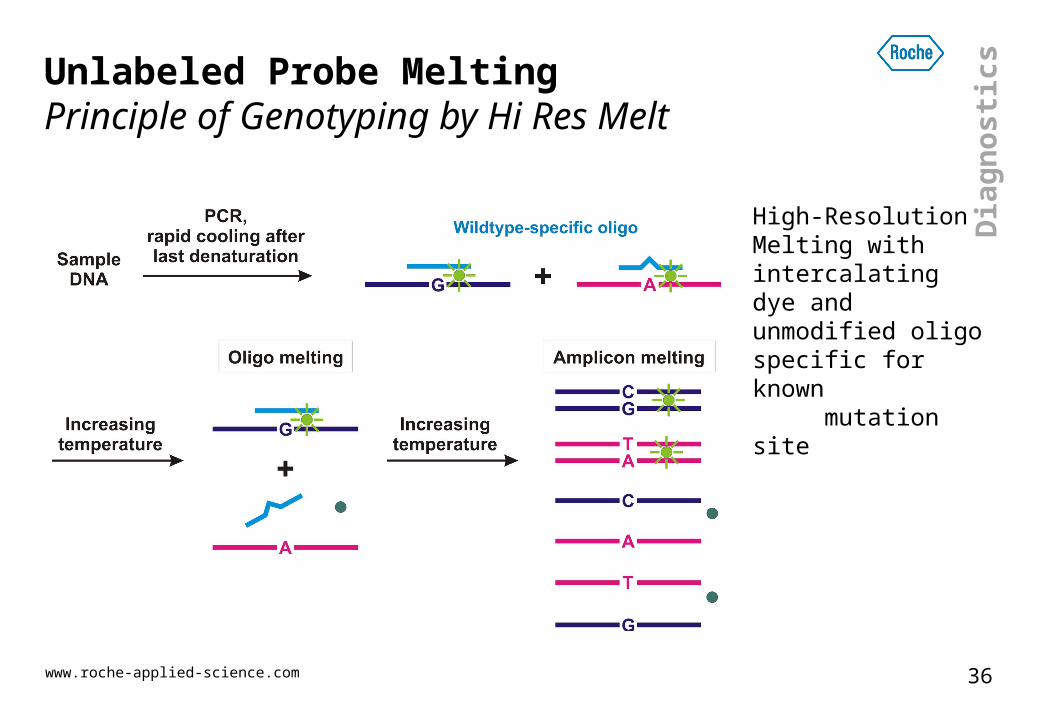
Unlabeled Probe MeltingPrinciple of Genotyping by Hi Res Melt
High-Resolution Melting with intercalating dye and unmodified oligo specific for known mutation site

Dia
gn
osti
cs
37www.roche-applied-science.com
Combined Unlabeled Probe and Amplicon Melting
Example 1: TNF
Probe for SNP CT
Amplicon 136 bp
96 samples
Wildtype
1st Derivative
Mutation
Heterozygotes
Normalization, Difference Plot
Homozygotes (not separated)
Heterozygote
Heterozygotes for another SNP (AG) in this amplicon

Dia
gn
osti
cs
38www.roche-applied-science.com
High Resolution Melting
Utility
• Optimization requirements
• Data and Results
• Possibilities
• References and Papers

Dia
gn
osti
cs
39www.roche-applied-science.com
High Resolution Melting
Utility
• Optimization requirements
• Data and Results
• Possibilities
• References and Papers

Dia
gn
osti
cs
40www.roche-applied-science.com
Optimizing a Gene Scanning ExperimentMgCl2 Concentration
MWMPCR Products (+ NTC 4.0 mM)MWM
50 bp4.04.03.53.02.52.01.51.0
50 bpMgCl2 Concentration
Agarose Gel 2%
167 bp PCR FragmentMgCl2 Titration 1.0 – 4.0 mMPCR Primers: 200 nM eachTouchdown PCR Protocol (64 – 54°C)

Dia
gn
osti
cs
41www.roche-applied-science.com
Optimizing a Gene Scanning ExperimentSample Material
• Use consistent extraction protocols for all samples to be analyzed via High Resolution Melting.
• Quantify DNA samples using spectrophotometry. Adjust them to the same concentration prior to PCR
• Use the same amount of template in each reaction (5 to 30 ng template DNA in a 20 µl reaction). Amplification plots should produce a crossing point value of < 30.
• Crossing points (aka CT) should be within 5 cycles of each other

Dia
gn
osti
cs
42www.roche-applied-science.com
Optimizinging a Gene Scanning ExperimentPCR Primers
• Design PCR primers that have annealing temperatures around 60°C and produce short amplicons, ideally100–250 bp.
• Use a software package to design primers
– Primer3 (http://frodo.wi.mit.edu/cgi-bin/primer3/primer3_www.cgi)
– LightCycler® Probe Design Software 2.0.
• BLAST (http://www.ncbi.nlm.nih.gov/BLAST) the primer sequences to ensure they are specific for the target species and gene.
• Use primers that have been purified by HPLC.
• Use low primer concentrations (e.g., 200 nM each) to avoid primer-dimer formation.

Dia
gn
osti
cs
43www.roche-applied-science.com
Optimizing a Gene Scanning ExperimentPCR Programs: Amplification
Example:
Touchdown PCR

Dia
gn
osti
cs
44www.roche-applied-science.com
Optimizing a Gene Scanning ExperimentPCR Programs: High Resolution Melting
Example:
HRM program
Dia
gn
osti
cs
45www.roche-applied-science.com
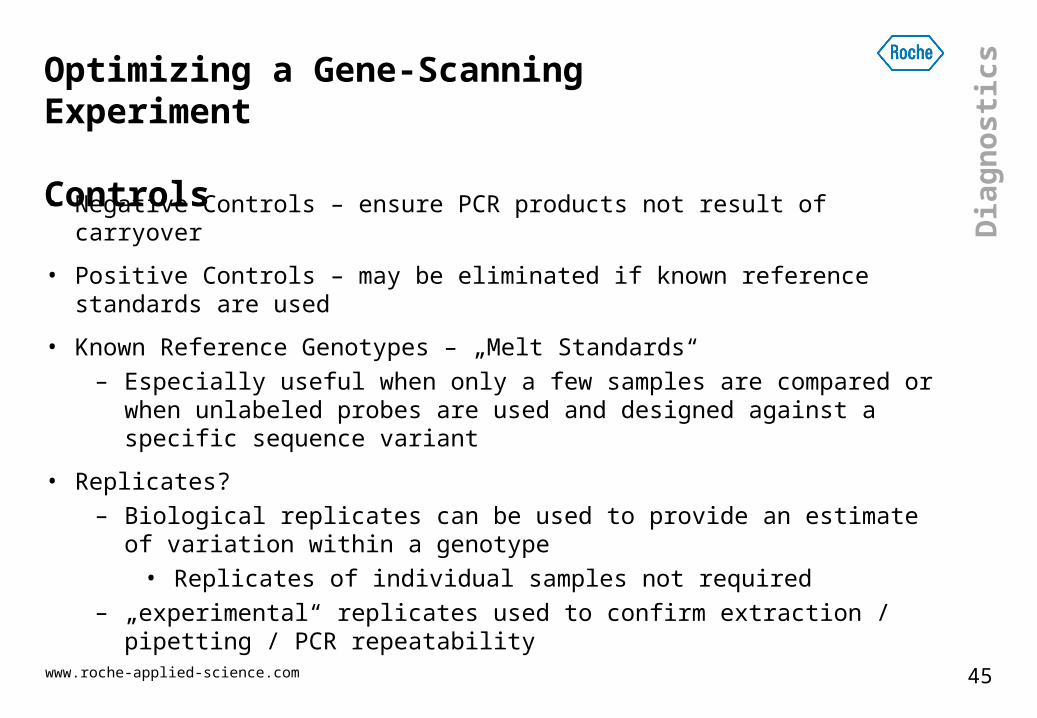
Optimizing a Gene-Scanning Experiment
Controls• Negative Controls – ensure PCR products not result of carryover
• Positive Controls – may be eliminated if known reference standards are used
• Known Reference Genotypes – „Melt Standards“
– Especially useful when only a few samples are compared or when unlabeled probes are used and designed against a specific sequence variant
• Replicates?
– Biological replicates can be used to provide an estimate of variation within a genotype
• Replicates of individual samples not required
– „experimental“ replicates used to confirm extraction / pipetting / PCR repeatability

Dia
gn
osti
cs
46www.roche-applied-science.com
Guidelines for successful HRM Assays
1. Analyze small DNA fragments
There will be a bigger effect of a single base variation on a small amplicon.
2. Analyze a single pure product
Primer-dimers and non-specific products make HRM difficult to interpret.
3. Use sufficient pre-amplification template
Make sure the product has a Cp (CT) no more than 30 cycles. Samples that amplify later than this produce variable HRM results due to amplification artifacts.
4. Check for aberrant amplification plots
Check the qPCR plots carefully for log-linear plots that are not steep, jagged, or reach a low signal plateau. This can indicate poor amplification, incorrect reaction setup, etc.
Dia
gn
osti
cs
47www.roche-applied-science.com
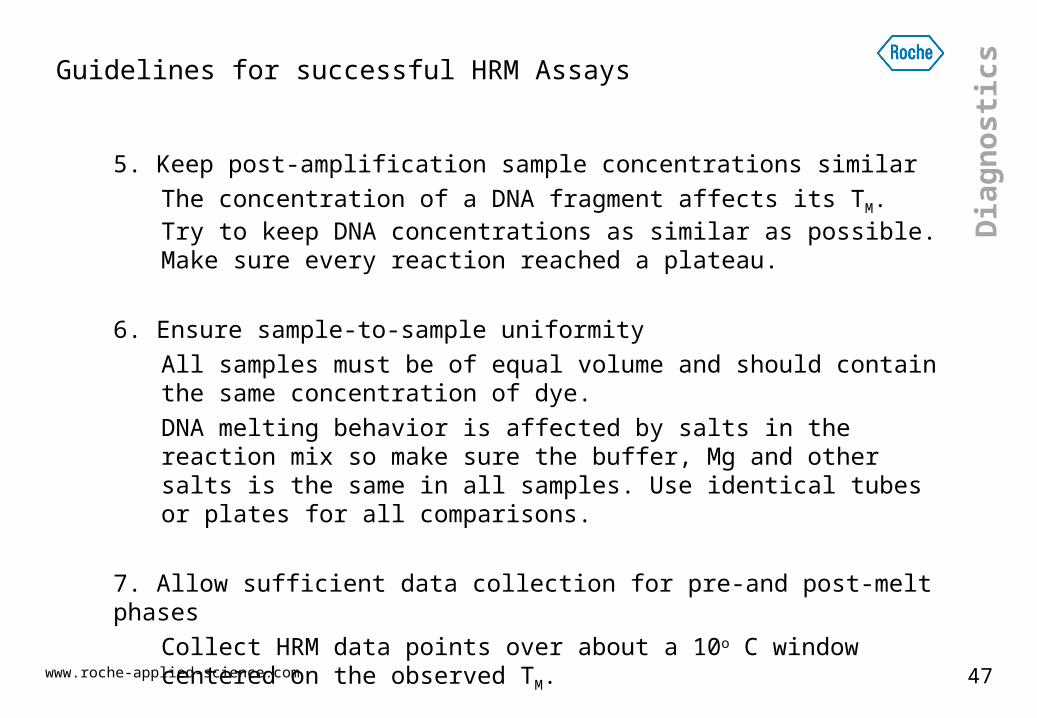
Guidelines for successful HRM Assays
5. Keep post-amplification sample concentrations similar
The concentration of a DNA fragment affects its TM. Try to keep DNA concentrations as similar as possible. Make sure every reaction reached a plateau.
6. Ensure sample-to-sample uniformity
All samples must be of equal volume and should contain the same concentration of dye.
DNA melting behavior is affected by salts in the reaction mix so make sure the buffer, Mg and other salts is the same in all samples. Use identical tubes or plates for all comparisons.
7. Allow sufficient data collection for pre-and post-melt phases
Collect HRM data points over about a 10o C window centered on the observed TM.

Dia
gn
osti
cs
Problem Possible reasons SolutionExtraneous melting transitions or poor curve clustering
Secondary PCR products Optimize PCR conditions to obtain clean product
Low PCR yield
Inconsistent genomic DNA preparation
Optimize PCR to enhance product yield
Ensure that the genomic DNA concentration and buffer is consistent
Amplicon and probe melting transitions not visible or are very small
PCR product Tm too high
Probe Tm too high, preventing PCR extension
Amplicon too long
Low PCR yield
High GC content
Redesign probe with lower Tm, use and exonuclease-positive Taq or add the probe after PCR
Design primers for shorter amplicon length
Optimize PCR to enhance product yield
Add DMSO, betaine or glycerol to the PCR buffer 48
Optimizing a Gene-Scanning ExperimentTroubleshooting – Montgomery et al (2007)
TABLE 1 | Troubleshooting table.
Dia
gn
osti
cs
49www.roche-applied-science.com
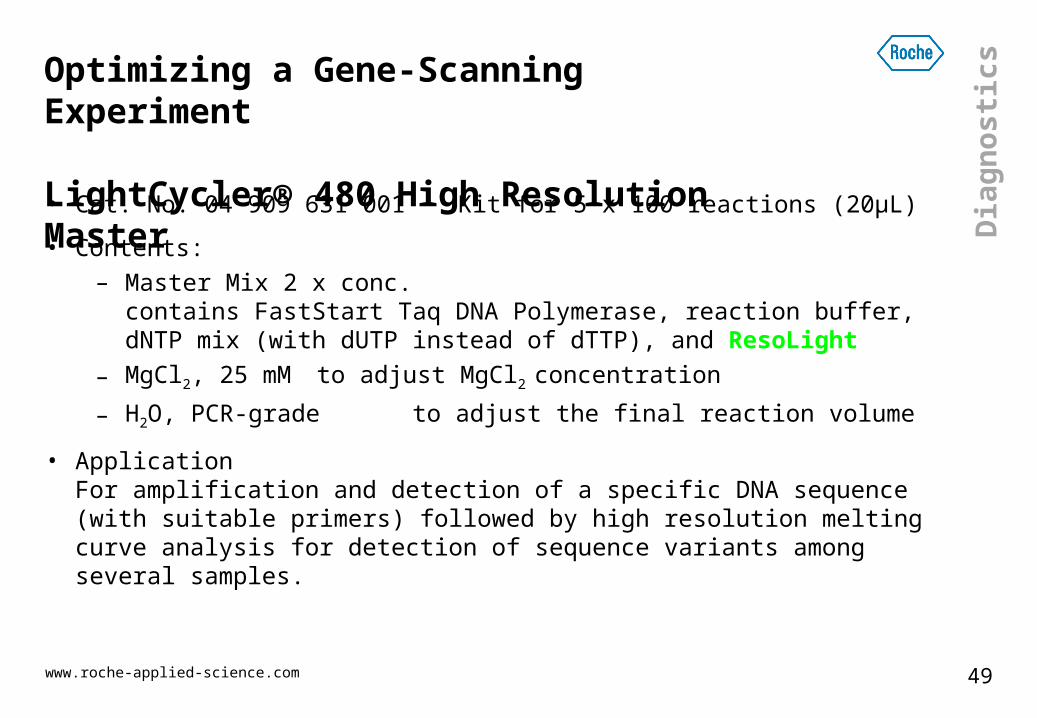
Optimizing a Gene-Scanning Experiment
LightCycler® 480 High Resolution Master• Cat. No. 04 909 631 001 Kit for 5 x 100 reactions (20µL)
• Contents:
– Master Mix 2 x conc.contains FastStart Taq DNA Polymerase, reaction buffer, dNTP mix (with dUTP instead of dTTP), and ResoLight
– MgCl2, 25 mM to adjust MgCl2 concentration
– H2O, PCR-grade to adjust the final reaction volume
• ApplicationFor amplification and detection of a specific DNA sequence (with suitable primers) followed by high resolution melting curve analysis for detection of sequence variants among several samples.
Dia
gn
osti
cs
50www.roche-applied-science.com
Utility
• Optimization requirements
• Data and Results
• Possibilities
• References and Papers
Dia
gn
osti
cs
51www.roche-applied-science.com
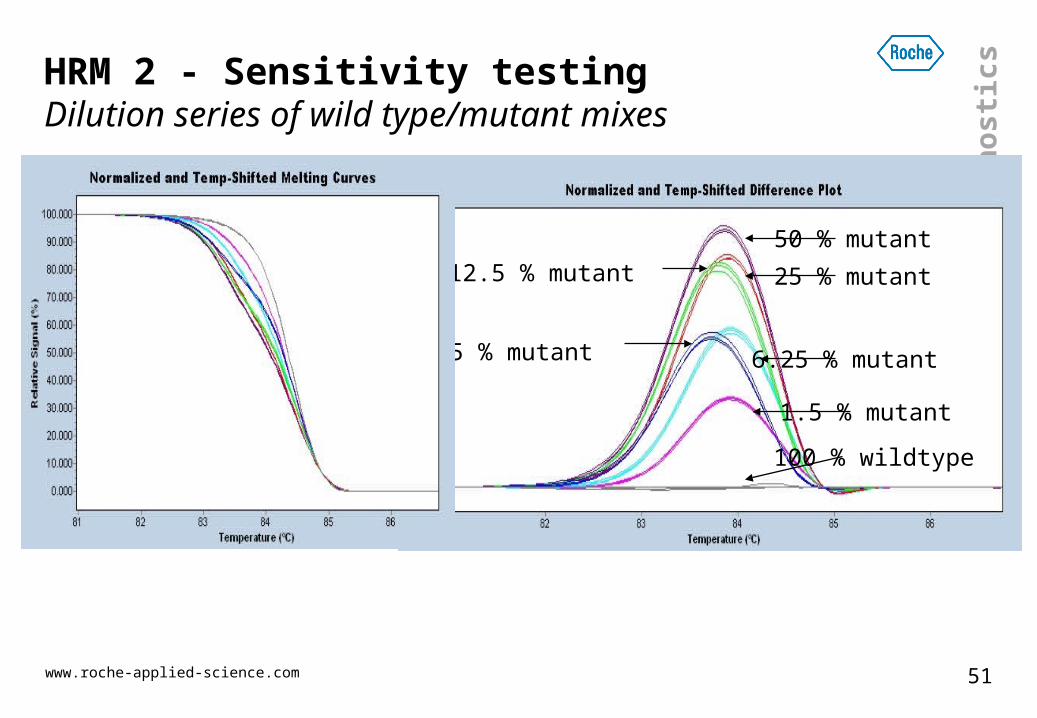
HRM 2 - Sensitivity testingDilution series of wild type/mutant mixes
50 % mutant
100 % wildtype
6.25 % mutant
12.5 % mutant
1.5 % mutant
3.125 % mutant
25 % mutant
Dia
gn
osti
cs
52www.roche-applied-science.com
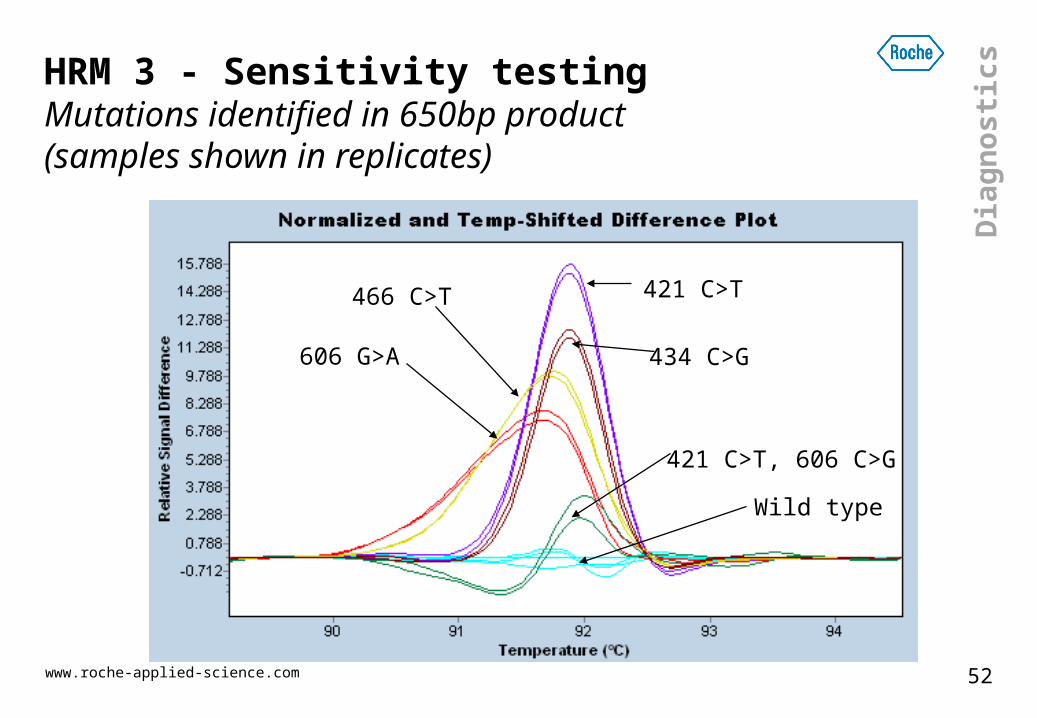
HRM 3 - Sensitivity testing Mutations identified in 650bp product(samples shown in replicates)
606 G>A
421 C>T
421 C>T, 606 C>G
466 C>T
434 C>G
Wild type

Dia
gn
osti
cs
53www.roche-applied-science.com
HRM of grape varieties
From: Plant Methods. 2008; 4: 8.

Dia
gn
osti
cs
54www.roche-applied-science.com
HRM Data – 5DNA Methylation
• A little as 0.5% methylated DNA was detected
UCLA

Dia
gn
osti
cs
55www.roche-applied-science.com
HRM Data – 6Mycoplasma synoviae strain identification – Jeffery et al (2007)

Dia
gn
osti
cs
56www.roche-applied-science.com
Utility
• Optimization requirements
• Data and Results
• Possibilities
• References and Papers
Dia
gn
osti
cs
57www.roche-applied-science.com
High Resolution MeltingKey applications
Scan genes to discover SNPs and/or somatic mutations Genotyping of known SNPs Characterization of haplotype blocks – “hap maps” DNA methylation analysis DNA mapping Species identification/taxonomy HLA compatibility Screening for loss of heterozygosity Association (case/control) studies Allelic prevalence in a population Identification of candidate predisposition genes
Dia
gn
osti
cs
58www.roche-applied-science.com
Utility
• Optimization requirements
• Data and Results
• Possibilities
• References and Papers

Dia
gn
osti
cs
59www.roche-applied-science.com
HRM References
• Gundry CN, Vandersteen JG, Reed GH, Pryor RJ, Chen J, Wittwer CT. Amplicon melting analysis with labeled primers: a closed-tube method for differentiating homozygotes and heterozygotes. Clin Chem. 2003 Mar;49(3):396-406.
• Wittwer CT, Reed GH, Gundry CN, Vandersteen JG, Pryor RJ. High-resolution genotyping by amplicon melting analysis using LCGreen. Clin Chem. 2003 Jun;49(6 Pt 1):853-60.
• Zhou L, Myers AN, Vandersteen JG, Wang L, Wittwer CT. Closed-tube genotyping with unlabeled oligonucleotide probes and a saturating DNA dye. Clin Chem. 2004 Aug;50(8):1328-35.
• Zhou L, Wang L, Palais R, Pryor R, Wittwer CT. High-resolution DNA melting analysis for simultaneous mutation scanning and genotyping in solution. Clin Chem. 2005 Oct;51(10):1770-7.
• Jeffery N, Gasser R, Steer P, Noormohammadi A. Classification of Mycoplasma synoviae strains using single-strand conformation plolymorphism and high-resolution melting-curve analysis of the vlhA gene single-copy region. Microbiology 2007 153, 2679-2688.

Dia
gn
osti
cs
60www.roche-applied-science.com
HRM References
• Fortini D, Ciammaruconi A, De Santis R, Fasanella A, Battisti A, D'Amelio R, Lista F, Cassone A, Carattoli A. Optimization of high-resolution melting analysis for low-cost and rapid screening of allelic variants of Bacillus anthracis by multiple-locus variable-number tandem repeat analysis. Clin Chem. 2007 Jul;53(7):1377-80.
• Vandersteen JG, Bayrak-Toydemir P, Palais RA, Wittwer CT. Identifying common genetic variants by high-resolution melting. Clin Chem. 2007 Jul;53(7):1191-8.
• Dobrowolski SF, Ellingson C, Coyne T, Grey J, Martin R, Naylor EW, Koch R, Levy HL. Mutations in the phenylalanine hydroxylase gene identified in 95 patients with phenylketonuria using novel systems of mutation scanning and specific genotyping based upon thermal melt profiles. Mol Genet Metab. 2007 Jul;91(3):218-27.
• Wojdacz TK, Dobrovic A. Methylation-sensitive high resolution melting (MS-HRM): a new approach for sensitive and high-throughput assessment of methylation. Nucleic Acids Res. 2007;35(6):e41.
• Montgomery J, Wittwer CT, Palais R, Zhou L. Simultaneous mutation scanning and genotyping by high-resolution DNA melting analysis. Nat Protoc. 2007;2(1):59-66.

Dia
gn
osti
cs
61www.roche-applied-science.com
HRM References
• von Ahsen, N. Two for typing: homogeneous combined single-nucleotide polymorphism scanning and genotyping. Clin Chem 2005 51, 1761-1762.
• Herrmann, M.G., Durtschi, J.D., Bromley, L.K., Wittwer, C.T. & Voelkerding, K.V. Amplicon DNA melting analysis for mutation scanning and genotyping: cross-platform comparison of instruments and dyes. Clin Chem 2006 52, 494-503
• Dujols V, Kusukawa N, McKinney JT, Dobrowolsky SF, Wittwer CT. High-resolution melting analysis for scanning and genotyping., in Real Time PCR. Tevfik D, ed., Taylor and Francis, Abingdon, 2006.
• Reed GH, Wittwer CT. Sensitivity and specificity of single-nucleotide polymorphism scanning by high-resolution melting analysis. Clin Chem. 2004;50:1748-54.
• Reischl U. Melting of the ribosomal RNA gene reveals bacterial species identity: a step toward a new rapid test in clinical microbiology. Clin Chem 2006 52(11): 1985-7.

Dia
gn
osti
cs
62www.roche-applied-science.com
History – High-Resolution Melting
Why High Resolution Melting?
Robust, non-destructive closed-tube method with many applications;
highly informative and flexible. More convenient and cost-effective than
current technologies, such as sequencing or dHPLC.
Why HRM on the LightCycler® 480 System?
Only plate-based Real-Time PCR HRM platform offering high-throughput
HRM as a highly versatile, integrated system (hardware, software,
reagents).

Dia
gn
osti
cs
63www.roche-applied-science.com
Utility
• Optimization requirements
• Data and Results
• Possibilities
• References and Papers
• What this means for other real time Applications

Dia
gn
osti
cs
64www.roche-applied-science.com
Real Time PCR, HRM, and Quantification
• The technological and biochemical requirements for accurate and meaningful HRM studies are fulfilled by the LC 480 system.
• HRM Scanning is another software module that expands the capabilities of the LC 480, the premier real time PCR system on the market.
• The technologies that enable HRM also provide unsurpassed accuracy and consistency for the amplification, producing excellent quantitative data and results.

Dia
gn
osti
cs
65www.roche-applied-science.com
The LightCycler® 480 System Data Homogeneity
““A Walk Around the BlockA Walk Around the Block””

Dia
gn
osti
cs
66www.roche-applied-science.com
LightCycler® 480 Instrument Temperature Homogeneity
Prototype Software
96-fold replicates of 3 genotypes
Tm(1) / °C Tm(2) / °C
average 56.47 64.88
minimum 56.14 64.67
maximum 56.85 65.4
delta 0.71 0.73
SD 0.1612 0.1801

Dia
gn
osti
cs
67www.roche-applied-science.com
T(52)L/L H/H
Tm-low
Tm-med
Tm-high
M/M T(66)
SimpleProbe probes, FAM-label
Thermal Homogeneity Demonstration by Melting Curve Analysis
T(78)

Dia
gn
osti
cs
68www.roche-applied-science.com
Total - 384 samples
A1: 96 x Tm-low (52°C) A2: 96 x Tm-high (78°C)
B1: 96 x Tm-med (66°C) B2: 96 x negative control
Thermal Homogeneity - Experimental SetupAnalysis of four 96-well Plate Subsets

Dia
gn
osti
cs
69www.roche-applied-science.com
Thermal Homogeneity – LightCycler 480Intra-Run Reproducibility of 96 Replicates
values / °Caverage 77.69min 77.46max 77.87delta 0.41SD 0.0801
values / °Caverage 65.31min 65.14max 65.52delta 0.38SD 0.0731
values / °Caverage 51.80min 51.63max 51.96delta 0.33SD 0.0722
Positions: A1-O23 Positions: B1-P23 Positions: A2-O24

Dia
gn
osti
cs
70www.roche-applied-science.com
LightCycler® 480 (96): 55 min
Experiment:• Serial 10-fold dilutions • 3 replicates • Target: Cyp2C9.2; 165 bp long fragment• Fast & Standard protocol (Hydrolysis Probe Format)• Samples in neighboring wells
Data Uniformity Dilution Series/Neighboring Wells – 165 bp target

Dia
gn
osti
cs
71www.roche-applied-science.com
LightCycler® 480 (96): 55 min
Data Uniformity Two Copy Numbers/Spread Across Plate – 442 bp target
Experiment:• Samples in checkerboard pattern• 1000 & 100 copies• 48 replicates • Target: CycA; 442 bp long fragment• Fast & Standard protocol (Hydrolysis Probe Format)• Samples in neighboring wells

Dia
gn
osti
cs
72www.roche-applied-science.com
ABI 7900 (96): 90 min
AB 7900 (96) Fast: 44 min
Data Uniformity Two Copy Numbers/Spread Across Plate – 442 bp target
Experiment:• Samples in checkerboard pattern• 1000 & 100 copies• 48 replicates • Target: CycA; 442 bp long fragment• Fast & Standard protocol (Hydrolysis Probe Format)• Samples in neighboring wells

Dia
gn
osti
cs
73www.roche-applied-science.com
LightCycler® 480 System Applications
Gene Detection: Detecting e.g., bacteria in sample material
Gene Expression: Analyzing expression level of gene of interest
Genotyping: Detecting known variants
Gene Scanning: Finding new variants
Dia
gn
osti
cs
74www.roche-applied-science.com
Credits
• Special thanks for contributions for this presentation:
– Natalie Barnes – RAS Australia Systems Account Representative
– Dr. Michael Hoffman – RAS Global Marketing Manager
– Roche Applied Science US Technical Support
• Bill Demyan, Ph.D
• Joe Donnenhofer
• Alex Pierson
• Michelle Moore
• Duane Marks
– Dr. Oliver Geulen – RAS Global Training and Applications
– Steve Hurwitz – RAS US LightCycler Manager
– John Ogden, Ph.D – RAS US Genomics Marketing Manager

Dia
gn
osti
cs
75www.roche-applied-science.com
HRM Genotyping – History, Technology, and Utility
• Questions?
• Please feel free to contact us about any of our products:
– Field Applications Consultant
• 800-845-7355 x 28007 (voicemail)
– Systems Account Manager
• 800-845-7355 x 28018 (voicemail)
Dia
gn
osti
cs
76www.roche-applied-science.com
LIGHTCYCLER, LC, HybProbe and SimpleProbe are trademarks of Roche