Embed Size (px)
Citation preview

Specifications Guide
Agilent Technologies PSA SeriesSpectrum Analyzers
This manual provides documentation for the following instruments: E4443A (3 Hz to 6.7 GHz)
E4445A (3 Hz to 13.2 GHz) E4440A (3 Hz to 26.5 GHz)
E4447A (3 Hz to 42.98 GHz)E4446A (3 Hz to 44GHz)
E4448A (3 Hz to 50 GHz)
Manufacturing Part Number: E4440-90647Supersedes: July 2012
Printed in USA
December 2012
© Copyright 2001-2012 Agilent Technologies, Inc.

NoticeThe information contained in this document is subject to change without notice.
The following safety symbols are used throughout this manual. Familiarize yourself with the symbols and their meaning before operating this analyzer.
This product may contain remanufactured assemblies equivalent to new in performance and warranty.
WarrantyThis Agilent Technologies instrument product is warranted against defects in material and workmanship for a period of one year from date of shipment. During the warranty period, Agilent Technologies will, at its option, either repair or replace products that prove to be defective.
For warranty service or repair, this product must be returned to a service facility designated by Agilent Technologies. Buyer shall prepay shipping charges to Agilent Technologies and Agilent Technologies shall pay shipping charges to return the product to Buyer. However, Buyer shall pay all shipping charges, duties, and taxes for products returned to Agilent Technologies from another country.
Agilent Technologies warrants that its software and firmware designated by Agilent Technologies for use with an instrument will execute its programming instructions when properly installed on that instrument. Agilent Technologies does not warrant that the operation of the instrument, or software, or firmware will be uninterrupted or error-free.
Limitation of WarrantyThe foregoing warranty shall not apply to defects resulting from improper or inadequate maintenance by Buyer, Buyer-supplied software or interfacing, unauthorized modification or misuse, operation outside of the environmental specifications for the product, or improper site preparation or maintenance.
NO OTHER WARRANTY IS EXPRESSED OR IMPLIED. AGILENT TECHNOLOGIES SPECIFICALLY DISCLAIMS THE IMPLIED WARRANTIES OF MERCHANTABILITY AND FITNESS FOR A PARTICULAR PURPOSE.
2

Exclusive RemediesTHE REMEDIES PROVIDED HEREIN ARE BUYER’S SOLE AND EXCLUSIVE REMEDIES. AGILENT TECHNOLOGIES SHALL NOT BE LIABLE FOR ANY DIRECT, INDIRECT, SPECIAL, INCIDENTAL, OR CONSEQUENTIAL DAMAGES, WHETHER BASED ON CONTRACT, TORT, OR ANY OTHER LEGAL THEORY.
WARNING Warning denotes a hazard. It calls attention to a procedure which, if not correctly performed or adhered to, could result in injury or loss of life. Do not proceed beyond a warning note until the indicated conditions are fully understood and met.
CAUTION Caution denotes a hazard. It calls attention to a procedure that, if not correctly performed or adhered to, could result in damage to or destruction of the product. Do not proceed beyond a caution note until the indicated conditions are fully understood and met.
NOTE Note calls out special information for the user’s attention. It provides operational information or additional instructions of which the user should be aware.
Where to Find the Latest InformationDocumentation is updated periodically. For the latest information about this analyzer, including firmware upgrades, application information, and product information, see the following URL:
http://www.agilent.com/find/psa
3

4

Contents
1. PSA Series Core Spectrum AnalyzerDefinitions and Requirements. . . . . . . . . . . . . . . . . . . . . . . . . . . . . . . . . . . . . . . . . . . . . . . . . . . . . . . . . . . . 16
Definitions . . . . . . . . . . . . . . . . . . . . . . . . . . . . . . . . . . . . . . . . . . . . . . . . . . . . . . . . . . . . . . . . . . . . . . . . . 16Conditions Required to Meet Specifications. . . . . . . . . . . . . . . . . . . . . . . . . . . . . . . . . . . . . . . . . . . . . . . 16Certification. . . . . . . . . . . . . . . . . . . . . . . . . . . . . . . . . . . . . . . . . . . . . . . . . . . . . . . . . . . . . . . . . . . . . . . . 16
Frequency . . . . . . . . . . . . . . . . . . . . . . . . . . . . . . . . . . . . . . . . . . . . . . . . . . . . . . . . . . . . . . . . . . . . . . . . . . . 17E4443A . . . . . . . . . . . . . . . . . . . . . . . . . . . . . . . . . . . . . . . . . . . . . . . . . . . . . . . . . . . . . . . . . . . . . . . . . . . 17E4445A . . . . . . . . . . . . . . . . . . . . . . . . . . . . . . . . . . . . . . . . . . . . . . . . . . . . . . . . . . . . . . . . . . . . . . . . . . . 17E4440A . . . . . . . . . . . . . . . . . . . . . . . . . . . . . . . . . . . . . . . . . . . . . . . . . . . . . . . . . . . . . . . . . . . . . . . . . . . 18E4446A . . . . . . . . . . . . . . . . . . . . . . . . . . . . . . . . . . . . . . . . . . . . . . . . . . . . . . . . . . . . . . . . . . . . . . . . . . . 19E4447A . . . . . . . . . . . . . . . . . . . . . . . . . . . . . . . . . . . . . . . . . . . . . . . . . . . . . . . . . . . . . . . . . . . . . . . . . . . 20E4448A . . . . . . . . . . . . . . . . . . . . . . . . . . . . . . . . . . . . . . . . . . . . . . . . . . . . . . . . . . . . . . . . . . . . . . . . . . . 21External Mixing (Option AYZ) . . . . . . . . . . . . . . . . . . . . . . . . . . . . . . . . . . . . . . . . . . . . . . . . . . . . . . . . . 22Frequency Reference. . . . . . . . . . . . . . . . . . . . . . . . . . . . . . . . . . . . . . . . . . . . . . . . . . . . . . . . . . . . . . . . . 23Frequency Readout Accuracy . . . . . . . . . . . . . . . . . . . . . . . . . . . . . . . . . . . . . . . . . . . . . . . . . . . . . . . . . . 24Frequency Counter Count Accuracy . . . . . . . . . . . . . . . . . . . . . . . . . . . . . . . . . . . . . . . . . . . . . . . . . . . . . 24Delta Count Accuracy . . . . . . . . . . . . . . . . . . . . . . . . . . . . . . . . . . . . . . . . . . . . . . . . . . . . . . . . . . . . . . . . 24Resolution . . . . . . . . . . . . . . . . . . . . . . . . . . . . . . . . . . . . . . . . . . . . . . . . . . . . . . . . . . . . . . . . . . . . . . . . . 24Frequency Span . . . . . . . . . . . . . . . . . . . . . . . . . . . . . . . . . . . . . . . . . . . . . . . . . . . . . . . . . . . . . . . . . . . . . 25Sweep Trigger . . . . . . . . . . . . . . . . . . . . . . . . . . . . . . . . . . . . . . . . . . . . . . . . . . . . . . . . . . . . . . . . . . . . . . 26Gated FFT . . . . . . . . . . . . . . . . . . . . . . . . . . . . . . . . . . . . . . . . . . . . . . . . . . . . . . . . . . . . . . . . . . . . . . . . . 26Gated Sweep . . . . . . . . . . . . . . . . . . . . . . . . . . . . . . . . . . . . . . . . . . . . . . . . . . . . . . . . . . . . . . . . . . . . . . . 27Measurement Time vs. Span (nominal) . . . . . . . . . . . . . . . . . . . . . . . . . . . . . . . . . . . . . . . . . . . . . . . . . . 29
Amplitude . . . . . . . . . . . . . . . . . . . . . . . . . . . . . . . . . . . . . . . . . . . . . . . . . . . . . . . . . . . . . . . . . . . . . . . . . . . 40Gain Compression . . . . . . . . . . . . . . . . . . . . . . . . . . . . . . . . . . . . . . . . . . . . . . . . . . . . . . . . . . . . . . . . . . . 41
E4443A, E4445A, E4440A. . . . . . . . . . . . . . . . . . . . . . . . . . . . . . . . . . . . . . . . . . . . . . . . . . . . . . . . . . 41 E4447A, E4446A, E4448A . . . . . . . . . . . . . . . . . . . . . . . . . . . . . . . . . . . . . . . . . . . . . . . . . . . . . . . . . 43
Displayed Average Noise Level (DANL) . . . . . . . . . . . . . . . . . . . . . . . . . . . . . . . . . . . . . . . . . . . . . . . . . 45E4443A, E4445A, E4440A. . . . . . . . . . . . . . . . . . . . . . . . . . . . . . . . . . . . . . . . . . . . . . . . . . . . . . . . . . 45E4447A, E4446A, E4448A. . . . . . . . . . . . . . . . . . . . . . . . . . . . . . . . . . . . . . . . . . . . . . . . . . . . . . . . . . 50
Display Range . . . . . . . . . . . . . . . . . . . . . . . . . . . . . . . . . . . . . . . . . . . . . . . . . . . . . . . . . . . . . . . . . . . . . . 55Marker Readout. . . . . . . . . . . . . . . . . . . . . . . . . . . . . . . . . . . . . . . . . . . . . . . . . . . . . . . . . . . . . . . . . . . . . 55Frequency Response . . . . . . . . . . . . . . . . . . . . . . . . . . . . . . . . . . . . . . . . . . . . . . . . . . . . . . . . . . . . . . . . . 56
E4443A, E4445A, E4440A. . . . . . . . . . . . . . . . . . . . . . . . . . . . . . . . . . . . . . . . . . . . . . . . . . . . . . . . . . 56 E4447A, E4446A, E4448A . . . . . . . . . . . . . . . . . . . . . . . . . . . . . . . . . . . . . . . . . . . . . . . . . . . . . . . . . 58E4443A, E4445A, E4440A. . . . . . . . . . . . . . . . . . . . . . . . . . . . . . . . . . . . . . . . . . . . . . . . . . . . . . . . . . 62E4447A, E4446A, E4448A. . . . . . . . . . . . . . . . . . . . . . . . . . . . . . . . . . . . . . . . . . . . . . . . . . . . . . . . . . 62
RF Input VSWR . . . . . . . . . . . . . . . . . . . . . . . . . . . . . . . . . . . . . . . . . . . . . . . . . . . . . . . . . . . . . . . . . . . . 65E4443A, E4445A, E4440A . . . . . . . . . . . . . . . . . . . . . . . . . . . . . . . . . . . . . . . . . . . . . . . . . . . . . . . . . 65E4447A, E4446A, E4448A. . . . . . . . . . . . . . . . . . . . . . . . . . . . . . . . . . . . . . . . . . . . . . . . . . . . . . . . . . 66
Relative Fidelity . . . . . . . . . . . . . . . . . . . . . . . . . . . . . . . . . . . . . . . . . . . . . . . . . . . . . . . . . . . . . . . . . . . . 70Available Detectors . . . . . . . . . . . . . . . . . . . . . . . . . . . . . . . . . . . . . . . . . . . . . . . . . . . . . . . . . . . . . . . . . . 72Second Harmonic Distortion. . . . . . . . . . . . . . . . . . . . . . . . . . . . . . . . . . . . . . . . . . . . . . . . . . . . . . . . . . . 74Third Order Intermodulation Distortion . . . . . . . . . . . . . . . . . . . . . . . . . . . . . . . . . . . . . . . . . . . . . . . . . . 76
E4443A, E4445A, E4440A. . . . . . . . . . . . . . . . . . . . . . . . . . . . . . . . . . . . . . . . . . . . . . . . . . . . . . . . . . 76E4447A, E4446A, E4448A. . . . . . . . . . . . . . . . . . . . . . . . . . . . . . . . . . . . . . . . . . . . . . . . . . . . . . . . . . 78
Dynamic Range . . . . . . . . . . . . . . . . . . . . . . . . . . . . . . . . . . . . . . . . . . . . . . . . . . . . . . . . . . . . . . . . . . . . . 81E4443A, E4445A, E4440A. . . . . . . . . . . . . . . . . . . . . . . . . . . . . . . . . . . . . . . . . . . . . . . . . . . . . . . . . . 81E4447A, E4446A, E4448A: Bands 04 . . . . . . . . . . . . . . . . . . . . . . . . . . . . . . . . . . . . . . . . . . . . . . . . 82
5

Contents
E4447A, E4446A, E4448A: Bands 56 . . . . . . . . . . . . . . . . . . . . . . . . . . . . . . . . . . . . . . . . . . . . . . . . 83Power Suite Measurements . . . . . . . . . . . . . . . . . . . . . . . . . . . . . . . . . . . . . . . . . . . . . . . . . . . . . . . . . . . . . 84
Fast ACPR Test . . . . . . . . . . . . . . . . . . . . . . . . . . . . . . . . . . . . . . . . . . . . . . . . . . . . . . . . . . . . . . . . . . . . . 91Options . . . . . . . . . . . . . . . . . . . . . . . . . . . . . . . . . . . . . . . . . . . . . . . . . . . . . . . . . . . . . . . . . . . . . . . . . . . . . 96General . . . . . . . . . . . . . . . . . . . . . . . . . . . . . . . . . . . . . . . . . . . . . . . . . . . . . . . . . . . . . . . . . . . . . . . . . . . . . 97Inputs/Outputs (Front Panel) . . . . . . . . . . . . . . . . . . . . . . . . . . . . . . . . . . . . . . . . . . . . . . . . . . . . . . . . . . . 101
RF Input . . . . . . . . . . . . . . . . . . . . . . . . . . . . . . . . . . . . . . . . . . . . . . . . . . . . . . . . . . . . . . . . . . . . . . . . . 101E4443A, E4445A, E4440A . . . . . . . . . . . . . . . . . . . . . . . . . . . . . . . . . . . . . . . . . . . . . . . . . . . . . . . . 101E4447A, E4446A, E4448A . . . . . . . . . . . . . . . . . . . . . . . . . . . . . . . . . . . . . . . . . . . . . . . . . . . . . . . . 101
Option AYZ External Mixing . . . . . . . . . . . . . . . . . . . . . . . . . . . . . . . . . . . . . . . . . . . . . . . . . . . . . . . . . 102Rear Panel . . . . . . . . . . . . . . . . . . . . . . . . . . . . . . . . . . . . . . . . . . . . . . . . . . . . . . . . . . . . . . . . . . . . . . . . . 104
Regulatory Information . . . . . . . . . . . . . . . . . . . . . . . . . . . . . . . . . . . . . . . . . . . . . . . . . . . . . . . . . . . . . 109Declaration of Conformity . . . . . . . . . . . . . . . . . . . . . . . . . . . . . . . . . . . . . . . . . . . . . . . . . . . . . . . . . . . 109Compliance with German Noise Requirements . . . . . . . . . . . . . . . . . . . . . . . . . . . . . . . . . . . . . . . . . . . 110Compliance with EMC Requirements . . . . . . . . . . . . . . . . . . . . . . . . . . . . . . . . . . . . . . . . . . . . . . . . . . 110
2. Phase Noise Measurement PersonalityOption 226, Phase Noise Measurement Personality. . . . . . . . . . . . . . . . . . . . . . . . . . . . . . . . . . . . . . . . . . 114
Carrier Frequency Range . . . . . . . . . . . . . . . . . . . . . . . . . . . . . . . . . . . . . . . . . . . . . . . . . . . . . . . . . . . . 114Measurement Characteristics . . . . . . . . . . . . . . . . . . . . . . . . . . . . . . . . . . . . . . . . . . . . . . . . . . . . . . . . . 114Offset Frequency. . . . . . . . . . . . . . . . . . . . . . . . . . . . . . . . . . . . . . . . . . . . . . . . . . . . . . . . . . . . . . . . . . . 115Measurement Accuracy . . . . . . . . . . . . . . . . . . . . . . . . . . . . . . . . . . . . . . . . . . . . . . . . . . . . . . . . . . . . . 115Amplitude Repeatability . . . . . . . . . . . . . . . . . . . . . . . . . . . . . . . . . . . . . . . . . . . . . . . . . . . . . . . . . . . . . 116Frequency Offset Accuracy . . . . . . . . . . . . . . . . . . . . . . . . . . . . . . . . . . . . . . . . . . . . . . . . . . . . . . . . . . 117
3. Noise Figure Measurement PersonalityOption 219, Noise Figure Measurement Personality . . . . . . . . . . . . . . . . . . . . . . . . . . . . . . . . . . . . . . . . . 120
Noise Figure . . . . . . . . . . . . . . . . . . . . . . . . . . . . . . . . . . . . . . . . . . . . . . . . . . . . . . . . . . . . . . . . . . . . . . 120Gain. . . . . . . . . . . . . . . . . . . . . . . . . . . . . . . . . . . . . . . . . . . . . . . . . . . . . . . . . . . . . . . . . . . . . . . . . . . . . 126Noise Figure Uncertainty Calculator . . . . . . . . . . . . . . . . . . . . . . . . . . . . . . . . . . . . . . . . . . . . . . . . . . . 127
4. Digital Modulation Analysis Measurements SpecificationsSignal Acquisition. . . . . . . . . . . . . . . . . . . . . . . . . . . . . . . . . . . . . . . . . . . . . . . . . . . . . . . . . . . . . . . . . . 134Trigger. . . . . . . . . . . . . . . . . . . . . . . . . . . . . . . . . . . . . . . . . . . . . . . . . . . . . . . . . . . . . . . . . . . . . . . . . . . 137Supported data formats . . . . . . . . . . . . . . . . . . . . . . . . . . . . . . . . . . . . . . . . . . . . . . . . . . . . . . . . . . . . . . 138Filtering. . . . . . . . . . . . . . . . . . . . . . . . . . . . . . . . . . . . . . . . . . . . . . . . . . . . . . . . . . . . . . . . . . . . . . . . . . 139Symbol rate . . . . . . . . . . . . . . . . . . . . . . . . . . . . . . . . . . . . . . . . . . . . . . . . . . . . . . . . . . . . . . . . . . . . . . . 139Accuracy . . . . . . . . . . . . . . . . . . . . . . . . . . . . . . . . . . . . . . . . . . . . . . . . . . . . . . . . . . . . . . . . . . . . . . . . . 140
5. Digital Communications Basic Measurement Personality Additional Definitions and Requirements . . . . . . . . . . . . . . . . . . . . . . . . . . . . . . . . . . . . . . . . . . . . . . . . . 146
Option B7J, Basic Measurement Personality . . . . . . . . . . . . . . . . . . . . . . . . . . . . . . . . . . . . . . . . . . . . . 146Frequency Range . . . . . . . . . . . . . . . . . . . . . . . . . . . . . . . . . . . . . . . . . . . . . . . . . . . . . . . . . . . . . . . . . . 146Electronic Input Attenuator . . . . . . . . . . . . . . . . . . . . . . . . . . . . . . . . . . . . . . . . . . . . . . . . . . . . . . . . . . 147Absolute Amplitude Accuracy . . . . . . . . . . . . . . . . . . . . . . . . . . . . . . . . . . . . . . . . . . . . . . . . . . . . . . . . 148LO emissions < 3 GHz . . . . . . . . . . . . . . . . . . . . . . . . . . . . . . . . . . . . . . . . . . . . . . . . . . . . . . . . . . . . . . 149Third-orderIntermodulation Distortion . . . . . . . . . . . . . . . . . . . . . . . . . . . . . . . . . . . . . . . . . . . . . . . . . . . . . . . . . . . 149
6

Contents
Displayed Average Noise Level . . . . . . . . . . . . . . . . . . . . . . . . . . . . . . . . . . . . . . . . . . . . . . . . . . . . . . . 149Measurement Range . . . . . . . . . . . . . . . . . . . . . . . . . . . . . . . . . . . . . . . . . . . . . . . . . . . . . . . . . . . . . . . . 149
Measurements . . . . . . . . . . . . . . . . . . . . . . . . . . . . . . . . . . . . . . . . . . . . . . . . . . . . . . . . . . . . . . . . . . . . . . . 150Spectrum . . . . . . . . . . . . . . . . . . . . . . . . . . . . . . . . . . . . . . . . . . . . . . . . . . . . . . . . . . . . . . . . . . . . . . . . . 150Waveform . . . . . . . . . . . . . . . . . . . . . . . . . . . . . . . . . . . . . . . . . . . . . . . . . . . . . . . . . . . . . . . . . . . . . . . . 151
Inputs and Outputs . . . . . . . . . . . . . . . . . . . . . . . . . . . . . . . . . . . . . . . . . . . . . . . . . . . . . . . . . . . . . . . . . . . 153Front Panel . . . . . . . . . . . . . . . . . . . . . . . . . . . . . . . . . . . . . . . . . . . . . . . . . . . . . . . . . . . . . . . . . . . . . . . 153RF Input. . . . . . . . . . . . . . . . . . . . . . . . . . . . . . . . . . . . . . . . . . . . . . . . . . . . . . . . . . . . . . . . . . . . . . . . . . 153
6. GSM/EDGE Measurement PersonalityAdditional Definitions and Requirements . . . . . . . . . . . . . . . . . . . . . . . . . . . . . . . . . . . . . . . . . . . . . . . . . 156Option 202, GSM/EDGE . . . . . . . . . . . . . . . . . . . . . . . . . . . . . . . . . . . . . . . . . . . . . . . . . . . . . . . . . . . . . . 157
EDGE Error Vector Magnitude(EVM) . . . . . . . . . . . . . . . . . . . . . . . . . . . . . . . . . . . . . . . . . . . . . . . . . . . . . . . . . . . . . . . . . . . . . . . . . . . 157Power vs. Time . . . . . . . . . . . . . . . . . . . . . . . . . . . . . . . . . . . . . . . . . . . . . . . . . . . . . . . . . . . . . . . . . . . . 157EDGE Power vs. Time . . . . . . . . . . . . . . . . . . . . . . . . . . . . . . . . . . . . . . . . . . . . . . . . . . . . . . . . . . . . . . 157Power Ramp Relative Accuracy . . . . . . . . . . . . . . . . . . . . . . . . . . . . . . . . . . . . . . . . . . . . . . . . . . . . . . . 158Phase and Frequency Error . . . . . . . . . . . . . . . . . . . . . . . . . . . . . . . . . . . . . . . . . . . . . . . . . . . . . . . . . . . 160Output RF Spectrum . . . . . . . . . . . . . . . . . . . . . . . . . . . . . . . . . . . . . . . . . . . . . . . . . . . . . . . . . . . . . . . . 161Dynamic Range . . . . . . . . . . . . . . . . . . . . . . . . . . . . . . . . . . . . . . . . . . . . . . . . . . . . . . . . . . . . . . . . . . . . 162In-Band Frequency Ranges . . . . . . . . . . . . . . . . . . . . . . . . . . . . . . . . . . . . . . . . . . . . . . . . . . . . . . . . . . . 164Alternative Frequency Ranges . . . . . . . . . . . . . . . . . . . . . . . . . . . . . . . . . . . . . . . . . . . . . . . . . . . . . . . . 164Trigger . . . . . . . . . . . . . . . . . . . . . . . . . . . . . . . . . . . . . . . . . . . . . . . . . . . . . . . . . . . . . . . . . . . . . . . . . . . 165Burst Sync . . . . . . . . . . . . . . . . . . . . . . . . . . . . . . . . . . . . . . . . . . . . . . . . . . . . . . . . . . . . . . . . . . . . . . . . 165Range Control . . . . . . . . . . . . . . . . . . . . . . . . . . . . . . . . . . . . . . . . . . . . . . . . . . . . . . . . . . . . . . . . . . . . . 165
7. W-CDMA Measurement PersonalityAdditional Definitions and Requirements . . . . . . . . . . . . . . . . . . . . . . . . . . . . . . . . . . . . . . . . . . . . . . . . . 168Conformance With 3GPP TS 25.141 Base Station Requirements for a Manufacturing Environment. . . . 169
Channel Power . . . . . . . . . . . . . . . . . . . . . . . . . . . . . . . . . . . . . . . . . . . . . . . . . . . . . . . . . . . . . . . . . . . . 172Adjacent Channel PowerRatio (ACPR; ACLR) . . . . . . . . . . . . . . . . . . . . . . . . . . . . . . . . . . . . . . . . . . . . . . . . . . . . . . . . . . . . . . . 173Dynamic Range . . . . . . . . . . . . . . . . . . . . . . . . . . . . . . . . . . . . . . . . . . . . . . . . . . . . . . . . . . . . . . . . . . . . 175Multi-Carrier Power . . . . . . . . . . . . . . . . . . . . . . . . . . . . . . . . . . . . . . . . . . . . . . . . . . . . . . . . . . . . . . . . 175Power Statistics CCDF . . . . . . . . . . . . . . . . . . . . . . . . . . . . . . . . . . . . . . . . . . . . . . . . . . . . . . . . . . . . . . 175Intermodulation . . . . . . . . . . . . . . . . . . . . . . . . . . . . . . . . . . . . . . . . . . . . . . . . . . . . . . . . . . . . . . . . . . . . 176Occupied Bandwidth . . . . . . . . . . . . . . . . . . . . . . . . . . . . . . . . . . . . . . . . . . . . . . . . . . . . . . . . . . . . . . . . 177Code Domain. . . . . . . . . . . . . . . . . . . . . . . . . . . . . . . . . . . . . . . . . . . . . . . . . . . . . . . . . . . . . . . . . . . . . . 178QPSK EVM. . . . . . . . . . . . . . . . . . . . . . . . . . . . . . . . . . . . . . . . . . . . . . . . . . . . . . . . . . . . . . . . . . . . . . . 182Modulation Accuracy . . . . . . . . . . . . . . . . . . . . . . . . . . . . . . . . . . . . . . . . . . . . . . . . . . . . . . . . . . . . . . . 184Power Control and Power vs. Time. . . . . . . . . . . . . . . . . . . . . . . . . . . . . . . . . . . . . . . . . . . . . . . . . . . . . 187
Frequency . . . . . . . . . . . . . . . . . . . . . . . . . . . . . . . . . . . . . . . . . . . . . . . . . . . . . . . . . . . . . . . . . . . . . . . . . . 188In-Band Frequency Range. . . . . . . . . . . . . . . . . . . . . . . . . . . . . . . . . . . . . . . . . . . . . . . . . . . . . . . . . . . . 188
General . . . . . . . . . . . . . . . . . . . . . . . . . . . . . . . . . . . . . . . . . . . . . . . . . . . . . . . . . . . . . . . . . . . . . . . . . . . . 189Trigger . . . . . . . . . . . . . . . . . . . . . . . . . . . . . . . . . . . . . . . . . . . . . . . . . . . . . . . . . . . . . . . . . . . . . . . . . . . 189Range Control . . . . . . . . . . . . . . . . . . . . . . . . . . . . . . . . . . . . . . . . . . . . . . . . . . . . . . . . . . . . . . . . . . . . . 189
7

Contents
8.HSDPA/HSUPA Measurement PersonalityAdditional Definitions and Requirements . . . . . . . . . . . . . . . . . . . . . . . . . . . . . . . . . . . . . . . . . . . . . . . . . 192Option 210, HSDPA/HSUPA Measurement Personality . . . . . . . . . . . . . . . . . . . . . . . . . . . . . . . . . . . . . . 193
Code Domain . . . . . . . . . . . . . . . . . . . . . . . . . . . . . . . . . . . . . . . . . . . . . . . . . . . . . . . . . . . . . . . . . . . . . 193Modulation Accuracy (Composite EVM). . . . . . . . . . . . . . . . . . . . . . . . . . . . . . . . . . . . . . . . . . . . . . . . . . . . . . . . . . . . . . . . . . 196
Frequency . . . . . . . . . . . . . . . . . . . . . . . . . . . . . . . . . . . . . . . . . . . . . . . . . . . . . . . . . . . . . . . . . . . . . . . . . . 198In-Band Frequency Range . . . . . . . . . . . . . . . . . . . . . . . . . . . . . . . . . . . . . . . . . . . . . . . . . . . . . . . . . . . 198
General . . . . . . . . . . . . . . . . . . . . . . . . . . . . . . . . . . . . . . . . . . . . . . . . . . . . . . . . . . . . . . . . . . . . . . . . . . . . 199Trigger. . . . . . . . . . . . . . . . . . . . . . . . . . . . . . . . . . . . . . . . . . . . . . . . . . . . . . . . . . . . . . . . . . . . . . . . . . . 199Range Control . . . . . . . . . . . . . . . . . . . . . . . . . . . . . . . . . . . . . . . . . . . . . . . . . . . . . . . . . . . . . . . . . . . . . 199
9. cdmaOne Measurement PersonalityAdditional Definitions and Requirements . . . . . . . . . . . . . . . . . . . . . . . . . . . . . . . . . . . . . . . . . . . . . . . . . 202Option BAC, cdmaOne Measurements Personality . . . . . . . . . . . . . . . . . . . . . . . . . . . . . . . . . . . . . . . . . . 203
Channel Power Measurement . . . . . . . . . . . . . . . . . . . . . . . . . . . . . . . . . . . . . . . . . . . . . . . . . . . . . . . . . 203Code Domain (Base Station) . . . . . . . . . . . . . . . . . . . . . . . . . . . . . . . . . . . . . . . . . . . . . . . . . . . . . . . . . 204Modulation Accuracy . . . . . . . . . . . . . . . . . . . . . . . . . . . . . . . . . . . . . . . . . . . . . . . . . . . . . . . . . . . . . . . 205Adjacent Channel Power Ratio. . . . . . . . . . . . . . . . . . . . . . . . . . . . . . . . . . . . . . . . . . . . . . . . . . . . . . . . 206Spur Close. . . . . . . . . . . . . . . . . . . . . . . . . . . . . . . . . . . . . . . . . . . . . . . . . . . . . . . . . . . . . . . . . . . . . . . . 208In-Band Frequency Ranges. . . . . . . . . . . . . . . . . . . . . . . . . . . . . . . . . . . . . . . . . . . . . . . . . . . . . . . . . . . 208
10. cdma2000 Measurement PersonalityAdditional Definitions and Requirements . . . . . . . . . . . . . . . . . . . . . . . . . . . . . . . . . . . . . . . . . . . . . . . . . 210Option B78, cdma2000 Measurement Personality. . . . . . . . . . . . . . . . . . . . . . . . . . . . . . . . . . . . . . . . . . . 211
Channel Power . . . . . . . . . . . . . . . . . . . . . . . . . . . . . . . . . . . . . . . . . . . . . . . . . . . . . . . . . . . . . . . . . . . . 211Adjacent Channel Power Ratio. . . . . . . . . . . . . . . . . . . . . . . . . . . . . . . . . . . . . . . . . . . . . . . . . . . . . . . . 212Power Statistics CCDF . . . . . . . . . . . . . . . . . . . . . . . . . . . . . . . . . . . . . . . . . . . . . . . . . . . . . . . . . . . . . . 213Intermodulation. . . . . . . . . . . . . . . . . . . . . . . . . . . . . . . . . . . . . . . . . . . . . . . . . . . . . . . . . . . . . . . . . . . . 214Occupied Bandwidth. . . . . . . . . . . . . . . . . . . . . . . . . . . . . . . . . . . . . . . . . . . . . . . . . . . . . . . . . . . . . . . . 214Spectrum Emission Mask . . . . . . . . . . . . . . . . . . . . . . . . . . . . . . . . . . . . . . . . . . . . . . . . . . . . . . . . . . . . 215Code Domain . . . . . . . . . . . . . . . . . . . . . . . . . . . . . . . . . . . . . . . . . . . . . . . . . . . . . . . . . . . . . . . . . . . . . 216QPSK EVM . . . . . . . . . . . . . . . . . . . . . . . . . . . . . . . . . . . . . . . . . . . . . . . . . . . . . . . . . . . . . . . . . . . . . . 217Modulation Accuracy(Composite Rho). . . . . . . . . . . . . . . . . . . . . . . . . . . . . . . . . . . . . . . . . . . . . . . . . . . . . . . . . . . . . . . . . . . 218In-Band Frequency Range Band Class 0 (North American Cellular). . . . . . . . . . . . . . . . . . . . . . . . . . . . . . . . . . . . . . . . . . . . . . . . . . . . . . . . . . 219
General . . . . . . . . . . . . . . . . . . . . . . . . . . . . . . . . . . . . . . . . . . . . . . . . . . . . . . . . . . . . . . . . . . . . . . . . . . . . 221Trigger. . . . . . . . . . . . . . . . . . . . . . . . . . . . . . . . . . . . . . . . . . . . . . . . . . . . . . . . . . . . . . . . . . . . . . . . . . . 221Range Control . . . . . . . . . . . . . . . . . . . . . . . . . . . . . . . . . . . . . . . . . . . . . . . . . . . . . . . . . . . . . . . . . . . . . 221
11. 1xEV-DV Measurement PersonalityAdditional Definitions and Requirements . . . . . . . . . . . . . . . . . . . . . . . . . . . . . . . . . . . . . . . . . . . . . . . . . 224Test model signal for 1xEV-DV . . . . . . . . . . . . . . . . . . . . . . . . . . . . . . . . . . . . . . . . . . . . . . . . . . . . . . . . . 225Option 214, 1xEV-DV Measurement Personality . . . . . . . . . . . . . . . . . . . . . . . . . . . . . . . . . . . . . . . . . . . 226
Code Domain . . . . . . . . . . . . . . . . . . . . . . . . . . . . . . . . . . . . . . . . . . . . . . . . . . . . . . . . . . . . . . . . . . . . . 226Modulation Accuracy(Composite Rho). . . . . . . . . . . . . . . . . . . . . . . . . . . . . . . . . . . . . . . . . . . . . . . . . . . . . . . . . . . . . . . . . . . 228
8

Contents
In-Band Frequency Range. . . . . . . . . . . . . . . . . . . . . . . . . . . . . . . . . . . . . . . . . . . . . . . . . . . . . . . . . . . . 231General . . . . . . . . . . . . . . . . . . . . . . . . . . . . . . . . . . . . . . . . . . . . . . . . . . . . . . . . . . . . . . . . . . . . . . . . . . . . 232
Trigger . . . . . . . . . . . . . . . . . . . . . . . . . . . . . . . . . . . . . . . . . . . . . . . . . . . . . . . . . . . . . . . . . . . . . . . . . . . 232Range Control . . . . . . . . . . . . . . . . . . . . . . . . . . . . . . . . . . . . . . . . . . . . . . . . . . . . . . . . . . . . . . . . . . . . . 232
12. 1xEV-DO Measurement PersonalityAdditional Definitions and Requirements . . . . . . . . . . . . . . . . . . . . . . . . . . . . . . . . . . . . . . . . . . . . . . . . . 234Option 204,1xEV-DO Measurements Personality . . . . . . . . . . . . . . . . . . . . . . . . . . . . . . . . . . . . . . . . . . . 235
Channel Power . . . . . . . . . . . . . . . . . . . . . . . . . . . . . . . . . . . . . . . . . . . . . . . . . . . . . . . . . . . . . . . . . . . . 235Power Statistics CCDF . . . . . . . . . . . . . . . . . . . . . . . . . . . . . . . . . . . . . . . . . . . . . . . . . . . . . . . . . . . . . . 236Intermod . . . . . . . . . . . . . . . . . . . . . . . . . . . . . . . . . . . . . . . . . . . . . . . . . . . . . . . . . . . . . . . . . . . . . . . . . 236Occupied Bandwidth . . . . . . . . . . . . . . . . . . . . . . . . . . . . . . . . . . . . . . . . . . . . . . . . . . . . . . . . . . . . . . . . 236Spurious Emissions and ACP . . . . . . . . . . . . . . . . . . . . . . . . . . . . . . . . . . . . . . . . . . . . . . . . . . . . . . . . . 237Code Domain. . . . . . . . . . . . . . . . . . . . . . . . . . . . . . . . . . . . . . . . . . . . . . . . . . . . . . . . . . . . . . . . . . . . . . 238QPSK EVM. . . . . . . . . . . . . . . . . . . . . . . . . . . . . . . . . . . . . . . . . . . . . . . . . . . . . . . . . . . . . . . . . . . . . . . 238Modulation Accuracy (Composite Rho) . . . . . . . . . . . . . . . . . . . . . . . . . . . . . . . . . . . . . . . . . . . . . . . . . . . . . . . . . . . . . . . . . . . 239Power vs. Time (PvT). . . . . . . . . . . . . . . . . . . . . . . . . . . . . . . . . . . . . . . . . . . . . . . . . . . . . . . . . . . . . . . . . . . . . . . . . . . . . . . . . 240
Frequency . . . . . . . . . . . . . . . . . . . . . . . . . . . . . . . . . . . . . . . . . . . . . . . . . . . . . . . . . . . . . . . . . . . . . . . . . . 241In-Band Frequency Range. . . . . . . . . . . . . . . . . . . . . . . . . . . . . . . . . . . . . . . . . . . . . . . . . . . . . . . . . . . . 241
Alternative Frequency Ranges . . . . . . . . . . . . . . . . . . . . . . . . . . . . . . . . . . . . . . . . . . . . . . . . . . . . . . . . . . 242Alternative Frequency Ranges . . . . . . . . . . . . . . . . . . . . . . . . . . . . . . . . . . . . . . . . . . . . . . . . . . . . . . . . 242
General . . . . . . . . . . . . . . . . . . . . . . . . . . . . . . . . . . . . . . . . . . . . . . . . . . . . . . . . . . . . . . . . . . . . . . . . . . . . 243Trigger . . . . . . . . . . . . . . . . . . . . . . . . . . . . . . . . . . . . . . . . . . . . . . . . . . . . . . . . . . . . . . . . . . . . . . . . . . . 243Range Control . . . . . . . . . . . . . . . . . . . . . . . . . . . . . . . . . . . . . . . . . . . . . . . . . . . . . . . . . . . . . . . . . . . . . 243
13. NADC Measurement PersonalityAdditional Definitions and Requirements . . . . . . . . . . . . . . . . . . . . . . . . . . . . . . . . . . . . . . . . . . . . . . . . . 246Option BAE, NADC Measurement Personality . . . . . . . . . . . . . . . . . . . . . . . . . . . . . . . . . . . . . . . . . . . . . 247
Adjacent Channel Power Ratio . . . . . . . . . . . . . . . . . . . . . . . . . . . . . . . . . . . . . . . . . . . . . . . . . . . . . . . . 247Error Vector Magnitude (EVM) . . . . . . . . . . . . . . . . . . . . . . . . . . . . . . . . . . . . . . . . . . . . . . . . . . . . . . . 248In-Band Frequency Range. . . . . . . . . . . . . . . . . . . . . . . . . . . . . . . . . . . . . . . . . . . . . . . . . . . . . . . . . . . . 248
General . . . . . . . . . . . . . . . . . . . . . . . . . . . . . . . . . . . . . . . . . . . . . . . . . . . . . . . . . . . . . . . . . . . . . . . . . . . . 249Trigger . . . . . . . . . . . . . . . . . . . . . . . . . . . . . . . . . . . . . . . . . . . . . . . . . . . . . . . . . . . . . . . . . . . . . . . . . . . 249Range Control . . . . . . . . . . . . . . . . . . . . . . . . . . . . . . . . . . . . . . . . . . . . . . . . . . . . . . . . . . . . . . . . . . . . . 249
14. PDC Measurement PersonalityAdditional Definitions and Requirements . . . . . . . . . . . . . . . . . . . . . . . . . . . . . . . . . . . . . . . . . . . . . . . . . 252Option BAE, PDC Measurement Personality . . . . . . . . . . . . . . . . . . . . . . . . . . . . . . . . . . . . . . . . . . . . . . . 253
Adjacent Channel Power Ratio . . . . . . . . . . . . . . . . . . . . . . . . . . . . . . . . . . . . . . . . . . . . . . . . . . . . . . . . 253Occupied Bandwidth . . . . . . . . . . . . . . . . . . . . . . . . . . . . . . . . . . . . . . . . . . . . . . . . . . . . . . . . . . . . . . . . 254In-Band Frequency Range. . . . . . . . . . . . . . . . . . . . . . . . . . . . . . . . . . . . . . . . . . . . . . . . . . . . . . . . . . . . 254
General . . . . . . . . . . . . . . . . . . . . . . . . . . . . . . . . . . . . . . . . . . . . . . . . . . . . . . . . . . . . . . . . . . . . . . . . . . . . 255Trigger . . . . . . . . . . . . . . . . . . . . . . . . . . . . . . . . . . . . . . . . . . . . . . . . . . . . . . . . . . . . . . . . . . . . . . . . . . . 255Range Control . . . . . . . . . . . . . . . . . . . . . . . . . . . . . . . . . . . . . . . . . . . . . . . . . . . . . . . . . . . . . . . . . . . . . 255
9

Contents
15.TD-SCDMA Measurement PersonalityOption 211, TD SCDMA Measurement Personality . . . . . . . . . . . . . . . . . . . . . . . . . . . . . . . . . . . . . . . . . 258
Power vs. Time . . . . . . . . . . . . . . . . . . . . . . . . . . . . . . . . . . . . . . . . . . . . . . . . . . . . . . . . . . . . . . . . . . . . 258Transmit Power . . . . . . . . . . . . . . . . . . . . . . . . . . . . . . . . . . . . . . . . . . . . . . . . . . . . . . . . . . . . . . . . . . . . 258Adjacent Channel Power. . . . . . . . . . . . . . . . . . . . . . . . . . . . . . . . . . . . . . . . . . . . . . . . . . . . . . . . . . . . . 259Multi-Carrier Power . . . . . . . . . . . . . . . . . . . . . . . . . . . . . . . . . . . . . . . . . . . . . . . . . . . . . . . . . . . . . . . . 259Spurious Emissions. . . . . . . . . . . . . . . . . . . . . . . . . . . . . . . . . . . . . . . . . . . . . . . . . . . . . . . . . . . . . . . . . 260
16. TD-SCDMA/HSDPA/8PSK Measurement PersonalitiesAdditional Definitions and Requirements . . . . . . . . . . . . . . . . . . . . . . . . . . . . . . . . . . . . . . . . . . . . . . . . . 262Measurement Specifications. . . . . . . . . . . . . . . . . . . . . . . . . . . . . . . . . . . . . . . . . . . . . . . . . . . . . . . . . . . . 263
Code Domain . . . . . . . . . . . . . . . . . . . . . . . . . . . . . . . . . . . . . . . . . . . . . . . . . . . . . . . . . . . . . . . . . . . . . 263Modulation Accuracy . . . . . . . . . . . . . . . . . . . . . . . . . . . . . . . . . . . . . . . . . . . . . . . . . . . . . . . . . . . . . . . 264Frequency . . . . . . . . . . . . . . . . . . . . . . . . . . . . . . . . . . . . . . . . . . . . . . . . . . . . . . . . . . . . . . . . . . . . . . . . 266In-Band Frequency Range . . . . . . . . . . . . . . . . . . . . . . . . . . . . . . . . . . . . . . . . . . . . . . . . . . . . . . . . . . . 266General . . . . . . . . . . . . . . . . . . . . . . . . . . . . . . . . . . . . . . . . . . . . . . . . . . . . . . . . . . . . . . . . . . . . . . . . . . 266Trigger. . . . . . . . . . . . . . . . . . . . . . . . . . . . . . . . . . . . . . . . . . . . . . . . . . . . . . . . . . . . . . . . . . . . . . . . . . . 266Range Control . . . . . . . . . . . . . . . . . . . . . . . . . . . . . . . . . . . . . . . . . . . . . . . . . . . . . . . . . . . . . . . . . . . . . 266
17. 40 MHz Bandwidth Digitizer - Option 140Frequency . . . . . . . . . . . . . . . . . . . . . . . . . . . . . . . . . . . . . . . . . . . . . . . . . . . . . . . . . . . . . . . . . . . . . . . . . . 268Amplitude and Phase . . . . . . . . . . . . . . . . . . . . . . . . . . . . . . . . . . . . . . . . . . . . . . . . . . . . . . . . . . . . . . . . . 269
IF Frequency Response. . . . . . . . . . . . . . . . . . . . . . . . . . . . . . . . . . . . . . . . . . . . . . . . . . . . . . . . . . . . . . 273IF Phase Linearity . . . . . . . . . . . . . . . . . . . . . . . . . . . . . . . . . . . . . . . . . . . . . . . . . . . . . . . . . . . . . . . . . . 275EVM . . . . . . . . . . . . . . . . . . . . . . . . . . . . . . . . . . . . . . . . . . . . . . . . . . . . . . . . . . . . . . . . . . . . . . . . . . . . 278
Dynamic Range . . . . . . . . . . . . . . . . . . . . . . . . . . . . . . . . . . . . . . . . . . . . . . . . . . . . . . . . . . . . . . . . . . . . . 279Data Acquisition. . . . . . . . . . . . . . . . . . . . . . . . . . . . . . . . . . . . . . . . . . . . . . . . . . . . . . . . . . . . . . . . . . . . . 285Wideband IF Triggering . . . . . . . . . . . . . . . . . . . . . . . . . . . . . . . . . . . . . . . . . . . . . . . . . . . . . . . . . . . . . . . 286
18. 80 MHz Bandwidth Digitizer - Option 122Frequency . . . . . . . . . . . . . . . . . . . . . . . . . . . . . . . . . . . . . . . . . . . . . . . . . . . . . . . . . . . . . . . . . . . . . . . . . . 290Nominal IF Bandwidth. . . . . . . . . . . . . . . . . . . . . . . . . . . . . . . . . . . . . . . . . . . . . . . . . . . . . . . . . . . . . . . . 291Amplitude and Phase . . . . . . . . . . . . . . . . . . . . . . . . . . . . . . . . . . . . . . . . . . . . . . . . . . . . . . . . . . . . . . . . . 292
IF Frequency Response. . . . . . . . . . . . . . . . . . . . . . . . . . . . . . . . . . . . . . . . . . . . . . . . . . . . . . . . . . . . . . 296IF Phase Linearity . . . . . . . . . . . . . . . . . . . . . . . . . . . . . . . . . . . . . . . . . . . . . . . . . . . . . . . . . . . . . . . . . . 298
Amplitude and Phase, Continued . . . . . . . . . . . . . . . . . . . . . . . . . . . . . . . . . . . . . . . . . . . . . . . . . . . . . . . . 301Dynamic Range . . . . . . . . . . . . . . . . . . . . . . . . . . . . . . . . . . . . . . . . . . . . . . . . . . . . . . . . . . . . . . . . . . . . . 302Data Acquisition. . . . . . . . . . . . . . . . . . . . . . . . . . . . . . . . . . . . . . . . . . . . . . . . . . . . . . . . . . . . . . . . . . . . . 308Wideband IF Triggering . . . . . . . . . . . . . . . . . . . . . . . . . . . . . . . . . . . . . . . . . . . . . . . . . . . . . . . . . . . . . . . 309
19. External Calibration Using Wide Bandwidth Digitizer CharacteristicsIF Frequency Response. . . . . . . . . . . . . . . . . . . . . . . . . . . . . . . . . . . . . . . . . . . . . . . . . . . . . . . . . . . . . . 312IF Phase Linearity . . . . . . . . . . . . . . . . . . . . . . . . . . . . . . . . . . . . . . . . . . . . . . . . . . . . . . . . . . . . . . . . . . 312EVM . . . . . . . . . . . . . . . . . . . . . . . . . . . . . . . . . . . . . . . . . . . . . . . . . . . . . . . . . . . . . . . . . . . . . . . . . . . . 313Nominal IF Frequency Response . . . . . . . . . . . . . . . . . . . . . . . . . . . . . . . . . . . . . . . . . . . . . . . . . . . . . . 314
10

Contents
20.Switchable MW Preselector Bypass SpecificationsApplicability of Specifications for this option . . . . . . . . . . . . . . . . . . . . . . . . . . . . . . . . . . . . . . . . . . . . . . 316
Specifications in other chapters. . . . . . . . . . . . . . . . . . . . . . . . . . . . . . . . . . . . . . . . . . . . . . . . . . . . . . . . 316Option 123, Switchable MW Preselector Bypass. . . . . . . . . . . . . . . . . . . . . . . . . . . . . . . . . . . . . . . . . . . . 317
Frequency . . . . . . . . . . . . . . . . . . . . . . . . . . . . . . . . . . . . . . . . . . . . . . . . . . . . . . . . . . . . . . . . . . . . . . . . 317Image Responses . . . . . . . . . . . . . . . . . . . . . . . . . . . . . . . . . . . . . . . . . . . . . . . . . . . . . . . . . . . . . . . . . . . 317
Amplitude . . . . . . . . . . . . . . . . . . . . . . . . . . . . . . . . . . . . . . . . . . . . . . . . . . . . . . . . . . . . . . . . . . . . . . . . . . 318E4443A, E4445A, E4440A. . . . . . . . . . . . . . . . . . . . . . . . . . . . . . . . . . . . . . . . . . . . . . . . . . . . . . . . . . . 318E4447A, E4446A, E4448A. . . . . . . . . . . . . . . . . . . . . . . . . . . . . . . . . . . . . . . . . . . . . . . . . . . . . . . . . . . 320
Dynamic Range. . . . . . . . . . . . . . . . . . . . . . . . . . . . . . . . . . . . . . . . . . . . . . . . . . . . . . . . . . . . . . . . . . . . . . 323First LO Emission Level . . . . . . . . . . . . . . . . . . . . . . . . . . . . . . . . . . . . . . . . . . . . . . . . . . . . . . . . . . . . . 323
E4443A, E4445A, E4440A. . . . . . . . . . . . . . . . . . . . . . . . . . . . . . . . . . . . . . . . . . . . . . . . . . . . . . . . . 323E4447A, E4446A, E4448A. . . . . . . . . . . . . . . . . . . . . . . . . . . . . . . . . . . . . . . . . . . . . . . . . . . . . . . . . 323
21. Y-axis Video Output - Option 124Applicability of Specification for this Option . . . . . . . . . . . . . . . . . . . . . . . . . . . . . . . . . . . . . . . . . . . . . . 326
Operating Conditions . . . . . . . . . . . . . . . . . . . . . . . . . . . . . . . . . . . . . . . . . . . . . . . . . . . . . . . . . . . . . . . 326Output Signal . . . . . . . . . . . . . . . . . . . . . . . . . . . . . . . . . . . . . . . . . . . . . . . . . . . . . . . . . . . . . . . . . . . . . . . 327Amplitude . . . . . . . . . . . . . . . . . . . . . . . . . . . . . . . . . . . . . . . . . . . . . . . . . . . . . . . . . . . . . . . . . . . . . . . . . . 328Delay. . . . . . . . . . . . . . . . . . . . . . . . . . . . . . . . . . . . . . . . . . . . . . . . . . . . . . . . . . . . . . . . . . . . . . . . . . . . . . 329Continuity and Compatibility . . . . . . . . . . . . . . . . . . . . . . . . . . . . . . . . . . . . . . . . . . . . . . . . . . . . . . . . . . . 330
22. W-LAN Measurement PersonalityOFDM Analysis (802.11a, 802.11g OFDM) . . . . . . . . . . . . . . . . . . . . . . . . . . . . . . . . . . . . . . . . . . . . . . . 332
Frequency . . . . . . . . . . . . . . . . . . . . . . . . . . . . . . . . . . . . . . . . . . . . . . . . . . . . . . . . . . . . . . . . . . . . . . . . 332Amplitude . . . . . . . . . . . . . . . . . . . . . . . . . . . . . . . . . . . . . . . . . . . . . . . . . . . . . . . . . . . . . . . . . . . . . . . . 332
Signal Acquisition. . . . . . . . . . . . . . . . . . . . . . . . . . . . . . . . . . . . . . . . . . . . . . . . . . . . . . . . . . . . . . . . . . . . 333Display Formats . . . . . . . . . . . . . . . . . . . . . . . . . . . . . . . . . . . . . . . . . . . . . . . . . . . . . . . . . . . . . . . . . . . . . 334Adjustable Parameters . . . . . . . . . . . . . . . . . . . . . . . . . . . . . . . . . . . . . . . . . . . . . . . . . . . . . . . . . . . . . . . . 335Accuracy . . . . . . . . . . . . . . . . . . . . . . . . . . . . . . . . . . . . . . . . . . . . . . . . . . . . . . . . . . . . . . . . . . . . . . . . . . . 336DSSS/CCK/PBSS Analysis (802.11b, 802.11g) . . . . . . . . . . . . . . . . . . . . . . . . . . . . . . . . . . . . . . . . . . . . 338
Frequency . . . . . . . . . . . . . . . . . . . . . . . . . . . . . . . . . . . . . . . . . . . . . . . . . . . . . . . . . . . . . . . . . . . . . . . . 338Amplitude . . . . . . . . . . . . . . . . . . . . . . . . . . . . . . . . . . . . . . . . . . . . . . . . . . . . . . . . . . . . . . . . . . . . . . . . 338Signal Acquisition . . . . . . . . . . . . . . . . . . . . . . . . . . . . . . . . . . . . . . . . . . . . . . . . . . . . . . . . . . . . . . . . . . 339Display Formats . . . . . . . . . . . . . . . . . . . . . . . . . . . . . . . . . . . . . . . . . . . . . . . . . . . . . . . . . . . . . . . . . . . 340Adjustable Parameters. . . . . . . . . . . . . . . . . . . . . . . . . . . . . . . . . . . . . . . . . . . . . . . . . . . . . . . . . . . . . . . 341Accuracy . . . . . . . . . . . . . . . . . . . . . . . . . . . . . . . . . . . . . . . . . . . . . . . . . . . . . . . . . . . . . . . . . . . . . . . . . 342
Conformance for 802.11a and 802.11g ERP-OFDM/DSSS-OFDM Standard . . . . . . . . . . . . . . . . . . . . . 344Conformance for 802.11b and 802.11g ERP-DSSS/CCK/PBCC Standard . . . . . . . . . . . . . . . . . . . . . . . 346
23. External Source Control - Option 215Frequency . . . . . . . . . . . . . . . . . . . . . . . . . . . . . . . . . . . . . . . . . . . . . . . . . . . . . . . . . . . . . . . . . . . . . . . . 348Dynamic Range . . . . . . . . . . . . . . . . . . . . . . . . . . . . . . . . . . . . . . . . . . . . . . . . . . . . . . . . . . . . . . . . . . . . 349Power sweep range . . . . . . . . . . . . . . . . . . . . . . . . . . . . . . . . . . . . . . . . . . . . . . . . . . . . . . . . . . . . . . . . . 349Measurement Time . . . . . . . . . . . . . . . . . . . . . . . . . . . . . . . . . . . . . . . . . . . . . . . . . . . . . . . . . . . . . . . . . 350Supported External Sources . . . . . . . . . . . . . . . . . . . . . . . . . . . . . . . . . . . . . . . . . . . . . . . . . . . . . . . . . . 351
11

Contents
24. EMI Receiver Specifications: PSA and N9039A RF PreselectorApplicability of Specifications for this Option . . . . . . . . . . . . . . . . . . . . . . . . . . . . . . . . . . . . . . . . . . . . . 354Requirements for PSA based EMI Receiver . . . . . . . . . . . . . . . . . . . . . . . . . . . . . . . . . . . . . . . . . . . . . . . 355
Conditions Required to Meet Specifications . . . . . . . . . . . . . . . . . . . . . . . . . . . . . . . . . . . . . . . . . . . . . 355Frequency . . . . . . . . . . . . . . . . . . . . . . . . . . . . . . . . . . . . . . . . . . . . . . . . . . . . . . . . . . . . . . . . . . . . . . . . . . 356
CISPR Band . . . . . . . . . . . . . . . . . . . . . . . . . . . . . . . . . . . . . . . . . . . . . . . . . . . . . . . . . . . . . . . . . . . . . . 357Sweep Time vs. Span . . . . . . . . . . . . . . . . . . . . . . . . . . . . . . . . . . . . . . . . . . . . . . . . . . . . . . . . . . . . . . . 358
Amplitude . . . . . . . . . . . . . . . . . . . . . . . . . . . . . . . . . . . . . . . . . . . . . . . . . . . . . . . . . . . . . . . . . . . . . . . . . . 359Maximum Safe Input Level . . . . . . . . . . . . . . . . . . . . . . . . . . . . . . . . . . . . . . . . . . . . . . . . . . . . . . . . . . 360Measurement Range . . . . . . . . . . . . . . . . . . . . . . . . . . . . . . . . . . . . . . . . . . . . . . . . . . . . . . . . . . . . . . . . 361Gain Compression. . . . . . . . . . . . . . . . . . . . . . . . . . . . . . . . . . . . . . . . . . . . . . . . . . . . . . . . . . . . . . . . . . 362Displayed Average Noise Level (DANL) . . . . . . . . . . . . . . . . . . . . . . . . . . . . . . . . . . . . . . . . . . . . . . . . 363Absolute Amplitude Accuracy . . . . . . . . . . . . . . . . . . . . . . . . . . . . . . . . . . . . . . . . . . . . . . . . . . . . . . . . 364RF Preselector Gain & Noise Figure . . . . . . . . . . . . . . . . . . . . . . . . . . . . . . . . . . . . . . . . . . . . . . . . . . . 366General Spurious Responses. . . . . . . . . . . . . . . . . . . . . . . . . . . . . . . . . . . . . . . . . . . . . . . . . . . . . . . . . . 367Second Harmonic Distortion . . . . . . . . . . . . . . . . . . . . . . . . . . . . . . . . . . . . . . . . . . . . . . . . . . . . . . . . . 368RF Preselector Third Order Intercept . . . . . . . . . . . . . . . . . . . . . . . . . . . . . . . . . . . . . . . . . . . . . . . . . . 369Residual Responses. . . . . . . . . . . . . . . . . . . . . . . . . . . . . . . . . . . . . . . . . . . . . . . . . . . . . . . . . . . . . . . . . 370
N9039A RF Preselector Specifications . . . . . . . . . . . . . . . . . . . . . . . . . . . . . . . . . . . . . . . . . . . . . . . . . . . 371Calibration Cycle . . . . . . . . . . . . . . . . . . . . . . . . . . . . . . . . . . . . . . . . . . . . . . . . . . . . . . . . . . . . . . . . . . 371Model and Option listings. . . . . . . . . . . . . . . . . . . . . . . . . . . . . . . . . . . . . . . . . . . . . . . . . . . . . . . . . . . . 371Pre-selection Filters . . . . . . . . . . . . . . . . . . . . . . . . . . . . . . . . . . . . . . . . . . . . . . . . . . . . . . . . . . . . . . . . 372Inputs and Outputs . . . . . . . . . . . . . . . . . . . . . . . . . . . . . . . . . . . . . . . . . . . . . . . . . . . . . . . . . . . . . . . . . 373Temperature Range . . . . . . . . . . . . . . . . . . . . . . . . . . . . . . . . . . . . . . . . . . . . . . . . . . . . . . . . . . . . . . . . . 374Environmental and Military Specifications . . . . . . . . . . . . . . . . . . . . . . . . . . . . . . . . . . . . . . . . . . . . . . 374EMC . . . . . . . . . . . . . . . . . . . . . . . . . . . . . . . . . . . . . . . . . . . . . . . . . . . . . . . . . . . . . . . . . . . . . . . . . . . . 374Safety . . . . . . . . . . . . . . . . . . . . . . . . . . . . . . . . . . . . . . . . . . . . . . . . . . . . . . . . . . . . . . . . . . . . . . . . . . . 375Power Requirements . . . . . . . . . . . . . . . . . . . . . . . . . . . . . . . . . . . . . . . . . . . . . . . . . . . . . . . . . . . . . . . . 375Dimensions . . . . . . . . . . . . . . . . . . . . . . . . . . . . . . . . . . . . . . . . . . . . . . . . . . . . . . . . . . . . . . . . . . . . . . . 376Weight . . . . . . . . . . . . . . . . . . . . . . . . . . . . . . . . . . . . . . . . . . . . . . . . . . . . . . . . . . . . . . . . . . . . . . . . . . . 376Displays . . . . . . . . . . . . . . . . . . . . . . . . . . . . . . . . . . . . . . . . . . . . . . . . . . . . . . . . . . . . . . . . . . . . . . . . . 376
25. Measuring Receiver PersonalityAdditional Definitions and Requirements . . . . . . . . . . . . . . . . . . . . . . . . . . . . . . . . . . . . . . . . . . . . . . . . . 378
PSA Conditions Required to Meet Specifications . . . . . . . . . . . . . . . . . . . . . . . . . . . . . . . . . . . . . . . . . 378Frequency Modulation . . . . . . . . . . . . . . . . . . . . . . . . . . . . . . . . . . . . . . . . . . . . . . . . . . . . . . . . . . . . . . . . 379
Input Power Range . . . . . . . . . . . . . . . . . . . . . . . . . . . . . . . . . . . . . . . . . . . . . . . . . . . . . . . . . . . . . . . . . 379AM Rejection (50 Hz to 3 kHz BW) . . . . . . . . . . . . . . . . . . . . . . . . . . . . . . . . . . . . . . . . . . . . . . . . . . . 380Residual FM (50 Hz to 3 kHz BW) . . . . . . . . . . . . . . . . . . . . . . . . . . . . . . . . . . . . . . . . . . . . . . . . . . . . 381
Amplitude Modulation . . . . . . . . . . . . . . . . . . . . . . . . . . . . . . . . . . . . . . . . . . . . . . . . . . . . . . . . . . . . . . . . 382Input Power Range . . . . . . . . . . . . . . . . . . . . . . . . . . . . . . . . . . . . . . . . . . . . . . . . . . . . . . . . . . . . . . . . . 382AM Depth Accuracy . . . . . . . . . . . . . . . . . . . . . . . . . . . . . . . . . . . . . . . . . . . . . . . . . . . . . . . . . . . . . . . . 382Flatness . . . . . . . . . . . . . . . . . . . . . . . . . . . . . . . . . . . . . . . . . . . . . . . . . . . . . . . . . . . . . . . . . . . . . . . . . . 383FM Rejection (50 Hz to 3 kHz BW). . . . . . . . . . . . . . . . . . . . . . . . . . . . . . . . . . . . . . . . . . . . . . . . . . . . 384
Phase Modulation . . . . . . . . . . . . . . . . . . . . . . . . . . . . . . . . . . . . . . . . . . . . . . . . . . . . . . . . . . . . . . . . . . . . 385Input Power Range . . . . . . . . . . . . . . . . . . . . . . . . . . . . . . . . . . . . . . . . . . . . . . . . . . . . . . . . . . . . . . . . . 385Maximum Peak Phase Deviation . . . . . . . . . . . . . . . . . . . . . . . . . . . . . . . . . . . . . . . . . . . . . . . . . . . . . . 385AM Rejection (50 Hz to 3 kHz BW) . . . . . . . . . . . . . . . . . . . . . . . . . . . . . . . . . . . . . . . . . . . . . . . . . . . 387Residual PM (50 Hz to 3 kHz BW) . . . . . . . . . . . . . . . . . . . . . . . . . . . . . . . . . . . . . . . . . . . . . . . . . . . . 387
12

Contents
Modulation Rate . . . . . . . . . . . . . . . . . . . . . . . . . . . . . . . . . . . . . . . . . . . . . . . . . . . . . . . . . . . . . . . . . . . . . 388Frequency Range. . . . . . . . . . . . . . . . . . . . . . . . . . . . . . . . . . . . . . . . . . . . . . . . . . . . . . . . . . . . . . . . . . . 388Modulation Rate Accuracy . . . . . . . . . . . . . . . . . . . . . . . . . . . . . . . . . . . . . . . . . . . . . . . . . . . . . . . . . . . 388
Modulation Distortion. . . . . . . . . . . . . . . . . . . . . . . . . . . . . . . . . . . . . . . . . . . . . . . . . . . . . . . . . . . . . . . . . 389Modulation Rate . . . . . . . . . . . . . . . . . . . . . . . . . . . . . . . . . . . . . . . . . . . . . . . . . . . . . . . . . . . . . . . . . . . 389Accuracy . . . . . . . . . . . . . . . . . . . . . . . . . . . . . . . . . . . . . . . . . . . . . . . . . . . . . . . . . . . . . . . . . . . . . . . . . 389Residual Noise and Distortion. . . . . . . . . . . . . . . . . . . . . . . . . . . . . . . . . . . . . . . . . . . . . . . . . . . . . . . . . 389PM . . . . . . . . . . . . . . . . . . . . . . . . . . . . . . . . . . . . . . . . . . . . . . . . . . . . . . . . . . . . . . . . . . . . . . . . . . . . . . 390FM . . . . . . . . . . . . . . . . . . . . . . . . . . . . . . . . . . . . . . . . . . . . . . . . . . . . . . . . . . . . . . . . . . . . . . . . . . . . . . 391
Modulation SINAD. . . . . . . . . . . . . . . . . . . . . . . . . . . . . . . . . . . . . . . . . . . . . . . . . . . . . . . . . . . . . . . . . . . 392Residual Noise and Distortion. . . . . . . . . . . . . . . . . . . . . . . . . . . . . . . . . . . . . . . . . . . . . . . . . . . . . . . . . 393
Modulation Filters. . . . . . . . . . . . . . . . . . . . . . . . . . . . . . . . . . . . . . . . . . . . . . . . . . . . . . . . . . . . . . . . . . . . 395RF Frequency Counter . . . . . . . . . . . . . . . . . . . . . . . . . . . . . . . . . . . . . . . . . . . . . . . . . . . . . . . . . . . . . . . . 396Audio Input . . . . . . . . . . . . . . . . . . . . . . . . . . . . . . . . . . . . . . . . . . . . . . . . . . . . . . . . . . . . . . . . . . . . . . . . . 397
Audio Frequency Counter 1 . . . . . . . . . . . . . . . . . . . . . . . . . . . . . . . . . . . . . . . . . . . . . . . . . . . . . . . . . . 397Audio AC (RMS) Level 1 . . . . . . . . . . . . . . . . . . . . . . . . . . . . . . . . . . . . . . . . . . . . . . . . . . . . . . . . . . . . 398Audio Distortion . . . . . . . . . . . . . . . . . . . . . . . . . . . . . . . . . . . . . . . . . . . . . . . . . . . . . . . . . . . . . . . . . . . 398Audio SINAD 1 . . . . . . . . . . . . . . . . . . . . . . . . . . . . . . . . . . . . . . . . . . . . . . . . . . . . . . . . . . . . . . . . . . . . 398Audio Filters . . . . . . . . . . . . . . . . . . . . . . . . . . . . . . . . . . . . . . . . . . . . . . . . . . . . . . . . . . . . . . . . . . . . . . 399
RF Power . . . . . . . . . . . . . . . . . . . . . . . . . . . . . . . . . . . . . . . . . . . . . . . . . . . . . . . . . . . . . . . . . . . . . . . . . . 400Input SWR. . . . . . . . . . . . . . . . . . . . . . . . . . . . . . . . . . . . . . . . . . . . . . . . . . . . . . . . . . . . . . . . . . . . . . . . 402Power Reference (P-Series, EPM and EPM-P Series Specifications) . . . . . . . . . . . . . . . . . . . . . . . . . . 404
Tuned RF Level Specification Nomenclature. . . . . . . . . . . . . . . . . . . . . . . . . . . . . . . . . . . . . . . . . . . . . . . 405Tuned RF Level. . . . . . . . . . . . . . . . . . . . . . . . . . . . . . . . . . . . . . . . . . . . . . . . . . . . . . . . . . . . . . . . . . . . . . 406
Minimum Power (dBm) Frequency Range . . . . . . . . . . . . . . . . . . . . . . . . . . . . . . . . . . . . . . . . . . . . . . . . . . . . . . . . . . . . . . . . . . 408Absolute Measurement Accuracy . . . . . . . . . . . . . . . . . . . . . . . . . . . . . . . . . . . . . . . . . . . . . . . . . . . . . 410Power Meter Range Uncertainty . . . . . . . . . . . . . . . . . . . . . . . . . . . . . . . . . . . . . . . . . . . . . . . . . . . . . . . 412Power Meter Range Uncertainty . . . . . . . . . . . . . . . . . . . . . . . . . . . . . . . . . . . . . . . . . . . . . . . . . . . . . . . 413Information about Residuals . . . . . . . . . . . . . . . . . . . . . . . . . . . . . . . . . . . . . . . . . . . . . . . . . . . . . . . . . . 414Graphical Relative Measurement Accuracy Specifications (Nominal). . . . . . . . . . . . . . . . . . . . . . . . . . . 41
13

Contents
14

1 PSA Series Core Spectrum Analyzer
This chapter contains the specifications for the core spectrum analyzer. The specifications and characteristics for the measurement personalities and options are covered in the chapters that follow.
15

PSA Series Core Spectrum Analyzer
Definitions and Requirements
Definitions and Requirements
This book contains specifications and supplemental information for the PSA Series spectrum analyzers. The distinction among specifications, typical performance, and nominal values are described as follows.
Definitions
• Specifications describe the performance of parameters covered by the product warranty (temperature = 0 to 55 °C, unless otherwise noted).
• Typical describes additional product performance information that is not covered by the product warranty. It is performance beyond specification that 80 % of the units exhibit with a 95 % confidence level over the temperature range 20 to 30 °C. Typical performance does not include measurement uncertainty.
• Nominal values indicate expected performance, or describe product performance that is useful in the application of the product, but is not covered by the product warranty.
The following conditions must be met for the analyzer to meet its specifications.
Conditions Required to Meet Specifications
• The analyzer is within its calibration cycle. See the General chapter.
• Front-panel 1st LO OUT connector terminated in 50 Ohms. (If Option AYZ is installed.)
• Under auto couple control, except that Auto Sweep Time = Accy.
• For center frequencies < 20 MHz, DC coupling applied.
• At least 2 hours of storage or operation at the operating temperature.
• Analyzer has been turned on at least 30 minutes with Auto Align On selected, or
If Auto Align Off is selected, Align All Now must be run:
— Within the last 24 hours, and
— Any time the ambient temperature changes more than 3 °C, and
— After the analyzer has been at operating temperature at least 2 hours.
Certification
Agilent Technologies certifies that this product met its published specifications at the time of shipment from the factory. Agilent Technologies further certifies that its calibration measurements are traceable to the United States National Institute of Standards and Technology, to the extent allowed by the Institute’s calibration facility, and to the calibration facilities of other International Standards Organization members.
16 Chapter 1

PSA Series Core Spectrum Analyzer
Frequency
Frequency
E4443A
E4445A
Description Specifications Supplemental Information
Frequency Range
DC Coupled 3 Hz to 6.7 GHz
AC Coupled 20 MHz to 6.7 GHz
Internal Mixing Bands Harmonic Mixing Mode (N)a
a. N is the harmonic mixing mode. All mixing modes are negative (as indicated by the “”), where the desired first LO harmonic is higher than the tuned frequency by the first IF (3.9214 GHz for the 3 Hz to 3.0 GHz band, 321.4 MHz for all other bands).
0 3 Hz to 3.0 GHz (DC Coupled) 1
0 20 MHz to 3.0 GHz (AC Coupled) 1
1 2.85 to 6.6 GHz 1
2 6.2 to 6.7 GHz 2
Description Specifications Supplemental Information
Frequency Range
DC Coupled 3 Hz to 13.2 GHz
AC Coupled 20 MHz to 13.2 GHz
Internal Mixing Bands Harmonic Mixing Mode (N)a
a. N is the harmonic mixing mode. All mixing modes are negative (as indicated by the “”), where the desired first LO harmonic is higher than the tuned frequency by the first IF (3.9214 GHz for the 3 Hz to 3.0 GHz band, 321.4 MHz for all other bands).
0 3 Hz to 3.0 GHz (DC Coupled) 1
0 20 MHz to 3.0 GHz (AC Coupled) 1
1 2.85 to 6.6 GHz 1
2 6.2 to 13.2 GHz 2
Chapter 1 17

PSA Series Core Spectrum Analyzer
Frequency
E4440A
Description Specifications Supplemental Information
Frequency Range
DC Coupled 3 Hz to 26.5 GHz
AC Coupled 20 MHz to 26.5 GHz
Internal Mixing Bands Harmonic Mixing Mode (N)a
a. N is the harmonic mixing mode. All mixing modes are negative (as indicated by the “”), where the desired first LO harmonic is higher than the tuned frequency by the first IF (3.9214 GHz for the 3 Hz to 3.0 GHz band, 321.4 MHz for all other bands).
0 3 Hz to 3.0 GHz (DC Coupled) 1
0 20 MHz to 3.0 GHz (AC Coupled) 1
1 2.85 to 6.6 GHz 1
2 6.2 to 13.2 GHz 2
3 12.8 to 19.2 GHz 4
4 18.7 to 26.5 GHz 4
18 Chapter 1

PSA Series Core Spectrum Analyzer
Frequency
E4446A
Description Specifications Supplemental Information
Frequency Range
DC Coupled 3 Hz to 44.0 GHz
Internal Mixing Bands Harmonic Mixing Mode (N)a
a. N is the harmonic mixing mode. Most mixing modes are negative (as indicated by the “”), where the desired first LO harmonic is higher than the tuned frequency by the first IF (3.9214 GHz for Bands 0, 5 and 6, 321.4 MHz for all other bands). A positive mixing mode (indicated by “+”) is one in which the tuned frequency is higher than the desired first LO harmonic by the first IF (3.9214 GHz for band 5).
0 3 Hz to 3.0 GHz 1
1 2.85 to 6.6 GHz 1
2 6.2 to 13.2 GHz 2
3 12.8 to 19.2 GHz 4
4 18.7 to 26.8 GHz 4
5 26.4 to 31.15 GHz 4+
6 31.0 to 44.0 GHz 8
Chapter 1 19

PSA Series Core Spectrum Analyzer
Frequency
E4447A
Description Specifications Supplemental Information
Frequency Range
DC Coupled 3 Hz to 42.98 GHz
Internal Mixing Bands Harmonic Mixing Mode (N)a
a. N is the harmonic mixing mode. Most mixing modes are negative (as indicated by the “”), where the desired first LO harmonic is higher than the tuned frequency by the first IF (3.9214 GHz for Bands 0, 5 and 6, 321.4 MHz for all other bands). A positive mixing mode (indicated by “+”) is one in which the tuned frequency is higher than the desired first LO harmonic by the first IF (3.9214 GHz for band 5).
0 3 Hz to 3.0 GHz 1
1 2.85 to 6.6 GHz 1
2 6.2 to 13.2 GHz 2
3 12.8 to 19.2 GHz 4
4 18.7 to 26.8 GHz 4
5 26.4 to 31.15 GHz 4+
6 31.0 to 42.98 GHz 8
20 Chapter 1

PSA Series Core Spectrum Analyzer
Frequency
E4448A
Description Specifications Supplemental Information
Frequency Range
DC Coupled 3 Hz to 50.0 GHz
Internal Mixing Bands Harmonic Mixing Mode (N)a
a. The low frequency range of the Option 1DS preamp extends to 100 kHz when the RF coupling is set to DC, and to 10 MHz when RF coupling is set to AC. The Option 110 preamp goes down to 10 MHz.
0 3 Hz to 3.0 GHz 1
1 2.85 to 6.6 GHz 1
2 6.2 to 13.2 GHz 2
3 12.8 to 19.2 GHz 4
4 18.7 to 26.8 GHz 4
5 26.4 to 31.15 GHz 4+
6 31.0 to 50.0 GHz 8
Chapter 1 21

PSA Series Core Spectrum Analyzer
Frequency
External Mixing (Option AYZ)
Description Specifications Supplemental Information
Frequency RangeExternal Mixing Option AYZ
18 GHz to 325 GHz
Harmonic Mixing Mode (Na)
a. N is the harmonic mixing mode. For negative mixing modes (as indicated by the “”), the desired 1st LO harmonic is higher than the tuned frequency by the 1st IF (321.4 MHz for all external mixing bands) For positive mixing modes, the desired 1st LO harmonic is lower than the tuned frequency by 321.4 MHz.
Band Preselected Unpreselected
K (18.0 GHz to 26.5 GHz) n/a 6
A (26.5 GHz to 40.0 GHz) 8+ 8
Q (33.0 GHz to 50.0 GHz) 10+ 10
U (40.0 GHz to 60.0 GHz) 10+ 10
V (50.0 GHz to 75.0 GHz) 14+ 14
E (60.0 GHz to 90.0 GHz) n/a 16
W (75.0 GHz to 110.0 GHz) n/a 18
F (90.0 GHz to 140.0 GHz) n/a 22
D (110.0 GHz to 170.0 GHz) n/a 26
G (140.0 GHz to 220.0 GHz) n/a 32
Y (170.0 GHz to 260.0 GHz) n/a 38
J (220.0 GHz to 325.0 GHz) n/a 48
22 Chapter 1

PSA Series Core Spectrum Analyzer
Frequency
Description Specifications Supplemental Information
Frequency Reference
Accuracy [(time since last adjustment aging rate) + temperature stability +
calibration accuracya]
a. Calibration accuracy depends on how accurately the frequency standard was adjusted to 10 MHz. If the calibration procedure is followed, the calibration accuracy is given by the specification “Achievable Initial Calibration Accuracy.”
Temperature Stability
20 to 30 C 1 108
0 to 55 C 5 108
Aging Rate 5 1010/day (nominal)
Total Aging
1 Year 1 107
2 Years 1.5 107
Settability 2 109
Warmup and Retraceb
b. Only applies when the power is disconnected from instrument. Does not apply when instrument is in standby mode.
300 s after turn on 1 107 of final frequency (nominal)
900 s after turn on 5 108 of final frequency (nominal)
Achievable Initial Calibration
Accuracyc
c. The achievable calibration accuracy at the beginning of the calibration cycle includes these effects:1) The temperature difference between the calibration environment and the use environment2) The orientation relative to the gravitation field changing between the calibration environment and the use environment3) Retrace effects in both the calibration environment and the use environment due to unplugging the instrument4) Settability
7 108
Chapter 1 23

PSA Series Core Spectrum Analyzer
Frequency
Description SpecificationsSupplemental Information
Frequency Readout Accuracy
(marker freq. freq. ref. accy + 0.25 % span + 5
% RBWa + 2 Hz + 0.5 horizontal resolutionb)
a. The warranted performance is only the sum of all errors under autocoupled conditions. Under non-auto-coupled conditions, the frequency readout accuracy will nominally meet the specification equation, except for conditions in which the RBW term dominates, as explained in examples below. The nominal RBW contribution to frequency readout accuracy is 2 % of RBW for RBWs from 1 Hz to 1 MHz, 3 % of RBW from 1.1 MHz through 3 MHz (the widest autocoupled RBW), and 30 % of RBW for the (manually selected) 4, 5, 6 and 8 MHz RBWs.First example: a 120 MHz span, with autocoupled RBW. The autocoupled ratio of span to RBW is 106:1, so the RBW selected is 1.1 MHz. The 5 % RBW term contributes only 55 kHz to the total fre-quency readout accuracy, compared to 300 kHz for the 0.25 % span term, for a total of 355 kHz. In this example, if an instrument had an unusually high RBW centering error of 7 % of RBW (77 kHz) and a span error of 0.20 % of span (240 kHz), the total actual error (317 kHz) would still meet the com-puted specification (355 kHz).Second example: a 20 MHz span, with a 4 MHz RBW. The specification equation does not apply because the Span: RBW ratio is not autocoupled. If the equation did apply, it would allow 50 kHz of error (0.25 %) due to the span and 200 kHz error (5 %) due to the RBW. For this non-autocoupled RBW, the RBW error is nominally 30 %, or 1200 kHz.
b. Horizontal resolution is due to the marker reading out one of the trace points. The points are spaced by span/(Npts 1), where Npts is the number of sweep points. For example, with the factory preset value of 601 sweep points, the horizontal resolution is span/600. However, there is an exception: When both the detector mode is “normal” and the span > 0.25 (Npts 1) RBW, peaks can occur only in even-numbered points, so the effective horizontal resolution becomes doubled, or span/300 for the fac-tory preset case. When the RBW is autocoupled and there are 601 sweep points, that exception occurs only for spans > 450 MHz.
See notec
c. Swept (not FFT) spans < 2 MHz show a non-linearity in the frequency location at the right or left edge of the span of up to 1.4 % of span per megahertz of span (unless using the “fast tuning” option for phase noise optimization). This non-linearity is corrected in the marker readout. Traces output to a remote computer will show the nonlinear relationship between frequency and trace point number. This non-lin-earity does not occur if the phase noise optimization is set to Fast Tuning.
Frequency Counterd Count Accuracy
d. Instrument conditions: RBW = 1 kHz, gate time = auto (100 ms), S/N 50 dB, frequency = 1 GHz
(marker freq. freq. Ref. Accy. + 0.100 Hz) See notee
e. If the signal being measured is locked to the same frequency reference as the analyzer, the specified count accuracy is 0.100 Hz under the test conditions of footnote d. This error is a noisiness of the result. It will increase with noisy sources, wider RBWs, lower S/N ratios, and source frequencies >1 GHz.
Delta Count Accuracy (delta freq. freq. Ref. Accy. + 0.141 Hz)
Resolution 0.001 Hz
24 Chapter 1

PSA Series Core Spectrum Analyzer
Frequency
Description Specifications Supplemental Information
Frequency Span
Range Swept and FFT
E4443A 0 Hz, 10 Hz to 6.7 GHz
E4445A 0 Hz, 10 Hz to 13.2 GHz
E4440A 0 Hz, 10 Hz to 26.5 GHz
E4447A 0 Hz, 10 Hz to 42.98 GHz
E4446A 0 Hz, 10 Hz to 44 GHz
E4448A 0 Hz, 10 Hz to 50 GHz
Resolution 2 Hz
Span Accuracy
Swept (0.2 % span + horizontal resolutiona)
a. Horizontal resolution is due to the marker reading out one of the trace points. The points are spaced by span/(Npts 1), where Npts is the number of sweep points. For example, with the factory preset value of 601 sweep points, the horizontal resolution is span/600. However, there is an exception: When both the detector mode is “normal” and the span > 0.25 (Npts 1) RBW, peaks can occur only in even-numbered points, so the effective horizontal resolution becomes doubled, or span/300 for the fac-tory preset case. When the RBW is auto coupled and there are 601 sweep points, that exception occurs only for spans > 450 MHz.
See noteb
b. Swept (not FFT) spans < 2 MHz show a non-linearity in the frequency location at the right or left edge of the span of up to 1.4 % of span per megahertz of span (unless using the “fast tuning” option for phase noise optimization). This non-linearity is corrected in the marker readout. Traces output to a remote computer will show the nonlinear relationship between frequency and trace point number. This non-lin-earity does not occur if the phase noise optimization is set to Fast Tuning.
FFT (0.2 % span + horizontal resolutiona)
Chapter 1 25

PSA Series Core Spectrum Analyzer
Frequency
Description Specifications Supplemental Information
Sweep Time
Range Span = 0 Hz Span 10 Hz
1 s to 6000 sa1 ms to 2000 s
a. For sweep times greater than 286 seconds, the number of sweep points must be greater than (sweep time in seconds / 143.166 + 1). The maximum trace bucket length is 143.166 seconds. The number of trace buckets is the number of sweep points - 1.
Accuracy Span 10 Hz, swept Span 10 Hz, FFT Span = 0 Hz
0.01% (nominal)40% (nominal)0.01% (nominal)
Sweep Trigger Free Run, Line, Video, External Front, External Rear, RF Burst
Delayed Trigger b Range Span 10 Hz, swept Span = 0 Hz or FFT Resolution
b. Delayed trigger is available with line, video, external, and RF Burst triggers.
1 s to 500 ms150 ms to +500 ms0.1 s
Description Specifications Supplemental Information
Gated FFTa
a. Gated measurements (measuring a signal only during a specific time interval) are possible with trig-gered FFT measurements. The FFT allows analysis during a time interval set by the RBW (within nom-inally 2 % of 1.83/RBW). This time interval is shorter than that of swept gating circuits, allowing higher resolution of the spectrum.
Delay Range 150 to +500 ms
Delay Resolution 100 ns or 4 digits, whichever is greater
Gate Duration 1.83/RBW 2 % (nominal)
26 Chapter 1

PSA Series Core Spectrum Analyzer
Frequency
Description Specifications Supplemental Information
Gated Sweep
Span Range Any span
Gate Delay Range 0 to 500.0 ms
Gate Delay Settability 4 digits, 100 ns
Gate Delay Jitter 33.3 ns p-p (nominal)
Gate Length Range 10.0 sa to 500.0 ms
a. Gate lengths of 15 ms or less give increased amplitude errors in bands 1 through 4.
Gated Freq Readout Errorsb
b. Additional errors in frequency readout occur due to LO Gating. These errors are in addition to those described in the Frequency Readout Uncertainty specification.
At seamsc
c. Errors occur at the seams in Gated LO measurements. These seams occur at the point where the LO stops (at the end of the gate length) and restarts. An exception to the listed nominal performance occurs when the LO mode is single-loop narrow and the span is 2 to 3 MHz inclusive. In single-loop narrow mode, the error is nominally 6 kHz, which is 0.3 % of span or less. Single-loop narrow mode occurs whenever the Span is 2 MHz and the Phase Noise Optimization is set to either “Optimize Phase Noise for f < 50 kHz” or “Optimize Phase Noise for f > 50 kHz.” All errors are multiplied by N, the harmonic mixing number.
0.2 % of span N (nominal)
Short Gate Lengthd
d. Short gate lengths cause frequency location inaccuracies that accumulate randomly with increasing numbers of seams. The standard deviation of the frequency error can nominally be described as 200 ns N (Span / SweepTime) sqrt(SpanPosition SweepTime / GateLength). In this expression, Span-Position is the location of the signal across the screen, with 0 being the left edge and 1 being the right edge of the span. For a sweep time of 5 ms (such as a 10 MHz to 3 GHz span) and a gate length of 10 ms, this expression evaluates to a standard deviation of 0.09 % of span. N is the harmonic mixing num-ber.
0.2 % of span N (nominal)
Gated Amplitude Errors Normale Accye
Low bandf 0.5 dB 0.05 dB
High bandg 5 dB 2 dB
Gate Sources Pos or neg edge triggered
Ext Front or Rear Thresholds independently settable over 5 V range (nominal)
RF Burst (Wideband) Threshold 22 dB relative to peak (nominal); 20 MHz bandwidth (nominal)
Chapter 1 27
PSA Series Core Spectrum Analyzer
Frequency
e. The “Normal” and “Accy” columns refer to the sweep times selected when the sweep time is set to Auto and the “Auto Sweep Time” key is set to normal or accuracy. The specifications in these columns are nominal.
f. Additional amplitude errors occur due to LO Gating. In band 0 (frequencies under 3 GHz), these errors occur at the seams in Gated LO measurements. These seams occur at the point where the LO stops (at the end of the gate length) and restarts. The size of these errors depends on the sweep rate. For exam-ple, with RBW = VBW, the error nominally is within 0.63 dB Span / (Sweeptime RBW2).
g. Additional errors due to LO Gating in high band (above 3 GHz) occur due to high sweep rates of the YIG-tuned preselector (YTF). The autocoupled sweep rate is reduced in high band when gating is turned on in order to keep errors from exceeding those shown. With gating off, YTF sweep rates may go as high as 400 to 600 MHz/ms. With gating on, these rates are reduced to 100 MHz/ms (Normal) and 50 MHz/ms (Accy) below 19.2 GHz and half that for 19.2 to 26.5 GHz. Furthermore, additional errors of 10 dB and more can occur for Gate Lengths under 15 ms.
28 Chapter 1

PSA Series Core Spectrum Analyzer
Frequency
Measurement Time vs. Span (nominal)
Description Specifications Supplemental Information
Number of Frequency Display Trace Points (buckets)
Factory preset 601
Range
Span 10 Hz 101 to 8192
Span = 0 Hz 2 to 8192
Chapter 1 29

PSA Series Core Spectrum Analyzer
Frequency
Description Specifications Supplemental Information
Resolution Bandwidth (RBW)
Range (3.01 dB bandwidth) 1 Hz to 8 MHz.Bandwidths > 3 MHz = 4, 5, 6, and 8 MHz. Bandwidths 1 Hz to 3 MHz are spaced at 10 % spacing, 24 per decade: 1.0, 1.1, 1.2, 1.3, 1.5, 1.6, 1.8, 2.0, 2.2, 2.4, 2.7, 3.0, 3.3, 3.6, 3.9, 4.3, 4.7, 5.1, 5.6, 6.2, 6.8, 7.5, 8.2, 9.1, and repeat, times ten to an integer.
Power bandwidth accuracya b
a. The noise marker, band power marker, channel power and ACP all compute their results using the power bandwidth of the RBW used for the measurement. Power bandwidth accuracy is the power uncertainty in the results of these measurements due only to bandwidth-related errors. (The analyzer knows this power bandwidth for each RBW with greater accuracy than the RBW width itself, and can therefore achieve lower errors.)
b. Instruments with serial numbers of MY44300000 or higher, or US44300000 or higher, or SG44300000 or higher meet these specifications. Earlier instruments meet 0.5 % from 82 to 330 kHz and 1.0 % from 360 kHz to 1.1 MHz.
RBW Range CF Range
1 Hz 51 kHz All 0.5 % Equivalent to 0.022 dB
56 100 kHz All 1.0 % Equivalent to 0.044 dB
110 240 kHz All 0.5 % Equivalent to 0.022 dB
270 kHz 1.1 MHz <3 GHz 1.5 % Equivalent to 0.066 dB
1.2 2.0 MHz <3 GHz 0.07 dB (nominal)
2.2 6 MHz <3 GHz 0.2 dB (nominal)
30 Chapter 1

PSA Series Core Spectrum Analyzer
Frequency
Description Specifications Supplemental Information
Accuracy (3.01 dB bandwidth)a
a. Resolution Bandwidth Accuracy can be observed at slower sweep times than autocoupled conditions. Normal sweep rates cause the shape of the RBW filter displayed on the analyzer screen to widen by nominally 6 %. This widening declines to 0.6 % nominal when the Auto Swp Time key is set to Accy instead of Norm. The true bandwidth, which determines the response to impulsive signals and noise-like signals, is not affected by the sweep rate.
1 Hz to 1.5 MHz RBW 2 % (nominal)
1.6 MHz to 3 MHz RBW
(CF 3 GHz)
(CF > 3 GHz)
7 % (nominal)
8 % (nominal)
4 MHz to 8 MHz RBW
(CF 3 GHz)
(CF > 3 GHz)
15 % (nominal)
20 % (nominal)
Selectivity (60 dB/3 dB) 4.1:1 (nominal)
Chapter 1 31

PSA Series Core Spectrum Analyzer
Frequency
Description Specifications Supplemental information
EMI Resolution Bandwidths
CISPR Family
Available when the detector is Quasi-Peak, EMI Average or EMI Peak
200 Hz, 9 kHz, 120 kHz Meets CISPR standarda
a. CISPR 16-1-1(2006)
CISPR standard for these bandwidths is 6 dB widths, subject to masks
1 MHz Meets CISPR standarda CISPR standard is impulse bandwidth
Non-CISPR bandwidths 1, 3, 10 sequence of 6 dB bandwidths
MIL STD family
Available when the detector is MIL Peak
10, 100 Hz, 1, 10, 100 kHz, 1 MHz 6 dB bandwidths meet MIL-STD-461D/E(20 Aug 1999)
Non-MIL STD bandwidths 30, 300 Hz, 3 kHz, etc. sequence of 6 dB bandwidths
32 Chapter 1

PSA Series Core Spectrum Analyzer
Frequency
Description Specification Supplemental information
Analysis Bandwidtha
a. Analysis bandwidth is the instantaneous bandwidth available about a center frequency over which the input signal can be digitized for further analysis or processing in the time, frequency, or modulation domain. The analysis band-width specifications shown here are with the options installed within the PSA. Additionally, the 321.4 MHz IF out, a standard feature for E4440A/43A/45A/46A/48A, provides down converted IF signal for an external digitizer to gain various analysis bandwidths. Refer to “321.4 MHz IF Output” on page 107 for the nominal bandwidths of the output signal from the 321.4 MHz IF out under different conditions.
With Option 140 40 MHz
With Option 122 80 MHz
Option B7J 10 MHz
Chapter 1 33

PSA Series Core Spectrum Analyzer
Frequency
Nominal Dynamic Range vs. Offset Frequency vs. RBW
Description Specifications Supplemental Information
Video Bandwidth (VBW)
Range Same as Resolution Bandwidth range plus wide-open VBW (labeled 50 MHz)
Accuracy 6 % (nominal) in swept mode and zero spana
a. For FFT processing, the selected VBW is used to determine a number of averages for FFT results. That number is chosen to give roughly equivalent display smoothing to VBW filtering in a swept measure-ment. For example, if VBW=0.1 RBW, four FFTs are averaged to generate one result.
34 Chapter 1

PSA Series Core Spectrum Analyzer
Frequency
Description Specifications Supplemental Information
Stability
Noise SidebandsCenter Frequency = 1 GHzaBest-case Optimizationb
a. Nominal changes of phase noise sidebands with other center frequencies are shown by some examples in the graphs that follow. To predict the phase noise for other center frequencies, note that phase noise at offsets above approximately 1 kHz increases nominally as 20 log N, where N is the harmonic mixer mode. For offsets below 1 kHz, and center frequencies above 1 GHz, the phase noise increases nominally as 20 log CF, where CF is the center frequency in GHz.
b. Noise sidebands for offsets of 30 kHz and below are shown for phase noise optimization set to optimize (f) for f < 50 kHz; for offsets of 100 kHz and above, the optimization is set for f > 50 kHz.
20 to 30 C 0 to 55 C Typical Nominal
Newest Instrumentsc Offset
100 Hz 91 dBc/Hz 90 dBc/Hz 96 dBc/Hz
1 kHz 103 dBc/Hz 100 dBc/Hz 108 dBc/Hz
10 kHz 116 dBc/Hz 115 dBc/Hz 118 dBc/Hz
30 kHz 116 dBc/Hz 115 dBc/Hz 118 dBc/Hz
100 kHz 122 dBc/Hz 121 dBc/Hz 124 dBc/Hz
1 MHz 145 dBc/Hzd 144 dBc/Hzd 147 dBc/Hze 148 dBc/Hze
6 MHz 153 dBc/Hzd 153 dBc/Hzd 156 dBc/Hze 156.5 dBc/Hze
10 MHz 155 dBc/Hzd 155 dBc/Hzd 157.5 dBc/Hze 158 dBc/Hze
Oldest Instruments
Offset
100 Hz 91 dBc/Hz 90 dBc/Hz 97 dBc/Hz
1 kHz 103 dBc/Hz 100 dBc/Hz 107 dBc/Hz
10 kHz 114 dBc/Hz 113 dBc/Hz 117 dBc/Hz
30 kHz 114 dBc/Hz 113 dBc/Hz 117 dBc/Hz
100 kHz 120 dBc/Hz 119 dBc/Hz 123 dBc/Hz
1 MHz 144 dBc/Hzd 142 dBc/Hzd 146 dBc/Hze 148 dBc/Hze
6 MHz 151 dBc/Hzd 150 dBc/Hzd 152 dBc/Hze 156 dBc/Hze
10 MHz 151 dBc/Hzd 150 dBc/Hzd 152 dBc/Hze 157.5 dBc/Hze
Residual FM <(1 Hz Nf) pp in 1 s
Chapter 1 35

PSA Series Core Spectrum Analyzer
Frequency
c. Instruments with serial numbers of MY44020000 or higher, or US44020000 or higher, or SG44020000 or higher are the newest instruments. Instruments with lower serial numbers are the older instruments. The transition between these occurred around January 2004. Press System, Show System to read out the serial number.
d. Analyzer-contributed phase noise at the low levels of this offset requires advanced verification tech-niques because broadband noise would otherwise cause excessive measurement error. Agilent uses a high level low phase noise CW test signal and sets the input attenuator so that the mixer level will be well above the normal top-of-screen level (-10 dBm) but still well below the 1 dB compression level. This improves dynamic range (carrier to broadband noise ratio) at the expense of amplitude uncertainty due to compression of the phase noise sidebands of the analyzer. (If the mixer level were increased to the "1 dB Gain Compression Point," the compression of a single sideband is specified to be 1 dB or lower. At lower levels, the compression falls off rapidly. The compression of phase noise sidebands is substantially less than the compression of a single-sideband test signal, further reducing the uncertainty of this technique.) Agilent also measures the broadband noise of the analyzer without the CW signal and subtracts its power from the measured phase noise power. The same techniques of overdrive and noise subtraction can be used in measuring a DUT, of course.
e. “Typical” results include the effect of the signal generator used in verifying performance; nominal results show performance observed during development with specialized signal sources.
f. N is the harmonic mixing mode.
36 Chapter 1

PSA Series Core Spectrum Analyzer
Frequency
Nominal Phase Noise of Different LO Optimizations
Sweep Type
SpanOptimize L (f) for f
< 50 kHzOptimize L (f) for
f > 50 kHzOptimize LOfor fast tuning
FFT All A(Dual Loop Wideband)
B(Dual Loop Narrowband)
D(Single Loop Wideband)Swept < 2 MHz
2 to 50 MHz C (Single Loop Narrowband)
> 50 MHz
Nominal Phase Noise of Different LO Optimizationswith RBW Selectivity Curves, CF = 1 GHz
-160
-150
-140
-130
-120
-110
-100
-90
-80
-70
-60
0.1 1 10 100 1000 10000
Offset Frequency (kHz)
SS
B P
ha
se
No
ise
(d
Bc
/Hz)
RBW=100 kHzRBW=10 kHzRBW=1 kHzRBW=100 Hz
D
C
A
B
Chapter 1 37

PSA Series Core Spectrum Analyzer
Frequency
*Unlike the other curves, which are measured results from the measurement of excellent sources, the CF = 50 GHz curve is the predicted, not observed, phase noise, computed from the 25.2 GHz observation. See the footnotes in the Frequency Stability section for the details of phase noise performance versus center frequency.
Nominal Phase Noise at Different Center Frequencies
38 Chapter 1

PSA Series Core Spectrum Analyzer
Frequency
Nominal Phase Noise at Common Cellular Communication Frequencies
Nominal Phase Noise at Common Cellular Communication Frequencies,
(f) Optimized Versus f
-160
-150
-140
-130
-120
-110
-100
-90
-80
-70
-60
0.1 1 10 100 1000 10000
Offset Frequency (kHz)
SS
B P
ha
se
No
ise
(d
Bc
/Hz)
2.4 GHz
1.8 GHz1 GHz
Chapter 1 39

PSA Series Core Spectrum Analyzer
Amplitude
Amplitude
Description SpecificationsSupplemental Information
Measurement Range
Preamp installed or off: Displayed Average Noise Level to +30 dBm
Preamp On:
Option 1DS
Option 110
Displayed Average Noise Level to +30 dBm
Displayed Average Noise Level to +23 dBm
Input Attenuation Range 0 to 70 dB, in 2 dB steps
Description Specifications Supplemental Information
Maximum Safe Input Level
Average Total Power +30 dBm (1 W) Preamp installed and off, or without preamp.
Applies with preamp (Option1DS) +30 dBm (1 W)
Applies with preamp (Option 110) +23 dBm
Peak Pulse Power <10 s pulse width, <1% duty cycle, and input attenuation 30 dB
+50 dBm (100 W)
DC volts DC Coupled AC Coupled (E4443A, E4445A, E4440A)
0.2 Vdc100 Vdc
40 Chapter 1

PSA Series Core Spectrum Analyzer
Amplitude
Gain Compression
E4443A, E4445A, E4440A
Description Specifications Supplemental Information
1 dB Gain Compression Point(Two-tone)a b c
a. Large signals, even at frequencies not shown on the screen, can cause the analyzer to mismeasure onscreen signals because of twotone gain compression. This specification tells how large an interfer-ing signal must be in order to cause a 1 dB change in an onscreen signal.
b. Tone spacing > 15 times RBW, with a minimum of 30 kHz of separationc. Reference level and offscreen performance: The reference level (RL) behavior differs from previous
analyzers in a way that makes PSA more flexible. In previous analyzers, the RL controlled how the mea-surement was performed as well as how it was displayed. Because the logarithmic amplifier in previous analyzers had both range and resolution limitations, this behavior was necessary for optimum measure-ment accuracy. The logarithmic amplifier in PSA, however, is implemented digitally such that the range and resolution greatly exceed other instrument limitations. Because of this, a PSA can make measurements largely independent of the setting of the RL without compromising accuracy. Because the RL becomes a display function, not a measurement function, a marker can read out results that are offscreen, either above or below, without any change in accuracy. The only exception to the indepen-dence of RL and the way in which the measurement is performed is in the input attenuation setting: When the input attenuation is set to auto, the rules for the determination of the input attenuation include dependence on the reference level. Because the input attenuation setting controls the trade off between large signal behaviors (thirdorder intermodulation, compression, and display scale fidelity) and small signal effects (noise), the measurement results can change with RL changes when the input attenuation is set to auto.
Maximum power at mixerd
d. Mixer power level (dBm) = input power (dBm) input attenuation (dB).
Nominale
e. The compression of a small on-screen signal by a large interfering signal can be represented as a curve of compression versus the level of the interfering signal. The specified performance is a level/compres-sion pair. The specification could be verified by finding the level for which the compression is 1 dB, or by finding the compression for the specified level. The latter technique is used. Therefore, the amount of compression is known in production, and the typical compression is known statistically, thus allowing a “typical” listing. The level required to reach 1 dB compression is not monitored in production, thus “nominal” performance is shown for this view of the performance.
20 to 200 MHz 0 dBm +3 dBm
200 MHz to 3.0 GHz +3 dBm +7 dBm
3.0 to 6.6 GHz +3 dBm +4 dBm
6.6 to 26.5 GHz 2 dBm 0 dBm
Chapter 1 41

PSA Series Core Spectrum Analyzer
Amplitude
Description Specifications Supplemental Information
Typical Gain Compression(Two-tone)
Mixer Level
TypicalaCompression
a. The compression of a small on-screen signal by a large interfering signal can be represented as a curve of compression versus the level of the interfering signal. The specified performance is a level/compres-sion pair. The specification could be verified by finding the level for which the compression is 1 dB, or by finding the compression for the specified level. The latter technique is used. Therefore, the amount of compression is known in production, and the typical compression is known statistically, thus allow-ing a “typical” listing. The level required to reach 1 dB compression is not monitored in production, thus “nominal” performance is shown for this view of the performance.
20 to 200 MHz 0 dBm <0.5 dB
200 MHz to 6.6 GHz +3 dBm <0.5 dB
6.6 to 26.5 GHz 2 dBm <0.4 dB
Preamp On (Option 1DS) Maximum power at the preampb for 1 dB gain compression
b. Total power at the preamp (dBm) = total power at the input (dBm) input attenuation (dB).
10 to 200 MHz 30 dBm (nominal)
200 MHz to 3 GHz 25 dBm (nominal)
Preamp On (Option 110)
Maximum power at the preampb for 1 dB gain compression
10 to 200 MHz 24 dBm (nominal)
200 MHz to 3.0 GHz 20 dBm (nominal)
3.0 to 6.6 GHz 23 dBm (nominal)
6.6 to 26.5 GHz 27 dBm (nominal)
42 Chapter 1

PSA Series Core Spectrum Analyzer
Amplitude
E4447A, E4446A, E4448A
Description Specifications Supplemental Information
1 dB Gain Compression Point(Two-tone)a b c
a. Large signals, even at frequencies not shown on the screen, can cause the analyzer to mismeasure onscreen signals because of twotone gain compression. This specification tells how large an interfer-ing signal must be in order to cause a 1 dB change in an onscreen signal.
b. Tone spacing > 15 times RBW, with a minimum of 30 kHz of separation.c. Reference level and offscreen performance: The reference level (RL) behavior differs from previous
analyzers in a way that makes PSA more flexible. In previous analyzers, the RL controlled how the measurement was performed as well as how it was displayed. Because the logarithmic amplifier in pre-vious analyzers had both range and resolution limitations, this behavior was necessary for optimum measurement accuracy. The logarithmic amplifier in PSA, however, is implemented digitally such that the range and resolution greatly exceed other instrument limitations. Because of this, a PSA can make measurements largely independent of the setting of the RL without compromising accuracy. Because the RL becomes a display function, not a measurement function, a marker can read out results that are offscreen, either above or below, without any change in accuracy. The only exception to the indepen-dence of RL and the way in which the measurement is performed is in the input attenuation setting: When the input attenuation is set to auto, the rules for the determination of the input attenuation include dependence on the reference level. Because the input attenuation setting controls the trade off between large signal behaviors (thirdorder intermodulation, compression, and display scale fidelity) and small signal effects (noise), the measurement results can change with RL changes when the input attenuation is set to auto.
Maximum power at mixerd
d. Mixer power level (dBm) = input power (dBm) input attenuation (dB).
Nominale
e. The compression of a small on-screen signal by a large interfering signal can be represented as a curve of compression versus the level of the interfering signal. The specified performance is a level/compres-sion pair. The specification could be verified by finding the level for which the compression is 1 dB, or by finding the compression for the specified level. The latter technique is used. Therefore, the amount of compression is known in production, and the typical compression is known statistically, thus allow-ing a “typical” listing. The level required to reach 1 dB compression is not monitored in production, thus “nominal” performance is shown for this view of the performance.
20 to 200 MHz +2 dBm +3 dBm
200 MHz to 3.0 GHz +3 dBm +7 dBm
3.0 to 6.6 GHz +3 dBm +4 dBm
6.6 to 26.8 GHz 2 dBm 0 dBm
26.8 to 50.0 GHz 0 dBm
Chapter 1 43

PSA Series Core Spectrum Analyzer
Amplitude
Description Specifications Supplemental Information
Typical Gain Compression(Two-tone)
Mixer Level
TypicalCompression
20 to 200 MHz 0 dBm <0.5 dB
200 MHz to 6.6 GHz +3 dBm <0.5 dB
6.6 to 26.8 GHz 2 dBm <0.4 dB
Preamp On (Option 1DS)Maximum power at thepreampa for 1 dB gain compression
a. Total power at the preamp (dBm) = total power at the input (dBm) input attenuation (dB).
10 to 200 MHz 30 dBm (nominal)
200 MHz to 3 GHz
Preamp On (Option 110)
Maximum power at thepreampa for 1 dB gain compression
25 dBm (nominal)
10 to 200 MHz 24 dBm (nominal)
200 MHz to 3.0 GHz 20 dBm (nominal)
3.0 to 6.6 GHz 23 dBm (nominal)
6.6 to 30 GHz 27 dBm (nominal)
30 GHz to 50 GHz 24 dBm (nominal)
44 Chapter 1

PSA Series Core Spectrum Analyzer
Amplitude
Displayed Average Noise Level (DANL)
E4443A, E4445A, E4440A
Description SpecificationsSupplemental Information
Displayed Average Noise Level (DANL)a
a. DANL for zero span and swept is normalized in two ways and for two reasons. DANL is measured in a 1 kHz RBW and normalized to the narrowest available RBW, because the narrowest RBWs (1.0 to 1.8 Hz) are not usable for signals below 110 dBm but DANL can be a useful figure of merit for the other RBWs. (RBWs this small are usually best used in FFT mode, because sweep rates are very slow in these bandwidths. RBW autocoupling never selects these RBWs in swept mode because of potential errors at low signal levels.) The second normalization is that DANL is measured with 10 dB input attenuation and normalized to the 0 dB input attenuation case, because that makes DANL and third order intermodulation test conditions congruent, allowing accurate dynamic range estimation for the analyzer. Because of these normalizations, this measure of DANL is useful for estimating instrument performance such as TOI to noise range and compression to noise range, but not ultimate sensitivity.
Input terminated, Sample or Average detectorAveraging type = LogNormalized to 0 dB input attenuation
Nominal
3 Hz to 1 kHz 110 dBm
1 to 10 kHz 130 dBm
Zero span & sweptNormalizeda to 1 Hz
FFT OnlyActualb 1 Hz
b. DANL for FFT measurements are useful for estimating the ultimate sensitivity of the analyzer for low-level signals. This specification is verified with 0 dB input attenuation and 1 Hz RBW. A limitation of this DANL specification is that some instruments have a center-screen-only spurious signal of nom-inally 150 dBm, which can be avoided by tuning the analyzer a few hertz away from the frequency of interest.
Zero span &
swept a
20 to 30 C 0 to 55 C 20 to 30 C (typical)
10 to 100 kHzc 137 dBm 137 dBm 137 dBm 141 dBm
100 kHz to 1 MHz 145 dBm 145 dBm 145 dBm 149 dBm
1 to 10 MHz 150 dBm 150 dBm 150 dBm 153 dBm
10 MHz to 1.2 GHz 154 dBm 153 dBm 154 dBm 155 dBm
1.2 to 2.1 GHz 153 dBm 152 dBm 153 dBm 154 dBm
2.1 to 3 GHz 152 dBm 151 dBm 152 dBm 153 dBm
3 to 6.6 GHz 152 dBm 151 dBm 151 dBm 153 dBm
6.6 to 13.2 GHz 150 dBm 149 dBm 149 dBm 152 dBm
13.2 to 20 GHz 147 dBm 146 dBm 146 dBm 149 dBm
20 to 26.5 GHz 143 dBm 142 dBm 143 dBm 145 dBm
Chapter 1 45

PSA Series Core Spectrum Analyzer
Amplitude
c. Specifications are shown for instruments with serial numbers of MY44020000 or higher, or US44020000 or higher, or SG44020000 or higher. For instruments with lower serial numbers, the spec-ifications are 135 dBm and the typical is 142 dBm. The transition between these occurred around January 2004. Press System, Show System to read out the serial number.
Description SpecificationsSupplemental Information
Displayed Average Noise Level (cont.)
Zero span & sweptNormalizeda to 1 Hz
a. DANL for zero span and swept is normalized in two ways and for two reasons. DANL is measured in a 1 kHz RBW and normalized to the narrowest available RBW, because the narrowest RBWs (1.0 to 1.8 Hz) are not usable for signals below 110 dBm but DANL can be a useful figure of merit for the other RBWs. (RBWs this small are usually best used in FFT mode, because sweep rates are very slow in these bandwidths. RBW autocoupling never selects these RBWs in swept mode because of potential errors at low signal levels.) The second normalization is that DANL is measured with 10 dB input attenuation and normalized to the 0 dB input attenuation case, because that makes DANL and third order intermodulation test conditions congruent, allowing accurate dynamic range estimation for the analyzer. Because of these normalizations, this measure of DANL is useful for estimating instrument performance such as TOI to noise range and compression to noise range, but not ultimate sensitivity.
FFT OnlyActualb 1 Hz
b. DANL for FFT measurements are useful for estimating the ultimate sensitivity of the analyzer for low-level signals. This specification is verified with 0 dB input attenuation and 1 Hz RBW. A limitation of this DANL specification is that some instruments have a center-screen-only spurious signal of nom-inally 150 dBm, which can be avoided by tuning the analyzer a few hertz away from the frequency of interest.
Zero span &
swept a
20 to 30 C 0 to 55 C 20 to 30 C (typical)
Preamp Off (Option 110 installed)
10 to 100 kHzc 137 dBm 137 dBm 137 dBm 141 dBm
100 kHz to 1 MHz 145 dBm 145 dBm 145 dBm 149 dBm
1 to 10 MHz 150 dBm 150 dBm 150 dBm 153 dBm
10 MHz to 1.2 GHz 153 dBm 152 dBm 153 dBm 155 dBm
1.2 to 2.1 GHz 152 dBm 151 dBm 152 dBm 154 dBm
2.1 to 3 GHz 151 dBm 150 dBm 151 dBm 153 dBm
3 to 6.6 GHz 151 dBm 150 dBm 151 dBm 153 dBm
6.6 to 13.2 GHz 147 dBm 146 dBm 147 dBm 150 dBm
13.2 to 16 GHz 144 dBm 143 dBm 144 dBm 147 dBm
16 to 19 GHz 144 dBm 143 dBm 144 dBm 148 dBm
19 to 26.5 GHz 140 dBm 139 dBm 140 dBm 144 dBm
46 Chapter 1

PSA Series Core Spectrum Analyzer
Amplitude
c. Specifications are shown for instruments with serial numbers of MY44020000 or higher, or US44020000 or higher, or SG44020000 or higher. For instruments with lower serial numbers, the spec-ifications are 135 dBm and the typical is 142 dBm. The transition between these occurred around January 2004. Press System, Show System to read out the serial number.
Chapter 1 47

PSA Series Core Spectrum Analyzer
Amplitude
Description SpecificationsSupplemental Information
Displayed Average Noise Level (cont.)
Zero span & sweptNormalizeda to 1 Hz
a. DANL for zero span and swept is normalized in two ways and for two reasons. DANL is measured in a 1 kHz RBW and normalized to the narrowest available RBW, because the narrowest RBWs (1.0 to 1.8 Hz) are not usable for signals below 110 dBm but DANL can be a useful figure of merit for the other RBWs. (RBWs this small are usually best used in FFT mode, because sweep rates are very slow in these bandwidths. RBW autocoupling never selects these RBWs in swept mode because of potential errors at low signal levels.) The second normalization is that DANL is measured with 10 dB input attenuation and normalized to the 0 dB input attenuation case, because that makes DANL and third order intermodulation test conditions congruent, allowing accurate dynamic range estimation for the analyzer. Because of these normalizations, this measure of DANL is useful for estimating instrument performance such as TOI to noise range and compression to noise range, but not ultimate sensitivity.
FFT OnlyActualb 1 Hz
Zero span &
swept a
20 to 30 C 0 to 55 C 20 to 30 C (typical)
Preamp On (Option 1DS installed)
100 to 200 kHz 159 dBm 157 dBm 158 dBm 162 dBm
200 kHz to 500 kHz 159 dBm 157 dBm 158 dBm 162 dBm
500 kHz to 1 MHz 163 dBm 160 dBm 162 dBm 165 dBm
1 MHz to 10 MHz 166 dBm 163 dBm 165 dBm 168 dBm
10 to 500 MHz 169 dBm 168 dBm 168 dBm 170 dBm
500 MHz to 1.0 GHz 168 dBm 167 dBm 167 dBm 169 dBm
1.1 to 2.1 GHz 167 dBm 166 dBm 166 dBm 168 dBm
2.1 to 3.0 GHz 165 dBm 165 dBm 165 dBm 166 dBm
Preamp On(Option 110 installed)
10 to 50 MHz 148 dBm 147 dBm 148 dBm 154 dBm
50 kHz to 500 MHz 153 dBm 152 dBm 153 dBm 164 dBm
500 MHz to 2.1 GHz 166 dBm 165 dBm 166 dBm 168 dBm
2.1 GHz to 3 GHz 166 dBm 165 dBm 166 dBm 168 dBm
3 to 6.6 GHz 165 dBm 164 dBm 165 dBm 166 dBm
6.6 to 13.2 GHz 163 dBm 162 dBm 163 dBm 165 dBm
13.2 to 16 GHz 162 dBm 161 dBm 162 dBm 165 dBm
16 to 19 GHz 162 dBm 159 dBm 162 dBm 164 dBm
19 to 26.5 GHz 159 dBm 156 dBm 159 dBm 161 dBm
48 Chapter 1

PSA Series Core Spectrum Analyzer
Amplitude
b. DANL for FFT measurements are useful for estimating the ultimate sensitivity of the analyzer for low-level signals. This specification is verified with 0 dB input attenuation and 1 Hz RBW. A limitation of this DANL specification is that some instruments have a center-screen-only spurious signal of nom-inally 150 dBm, which can be avoided by tuning the analyzer a few hertz away from the frequency of interest.
Chapter 1 49

PSA Series Core Spectrum Analyzer
Amplitude
E4447A, E4446A, E4448A
Description SpecificationsSupplemental Information
Displayed Average Noise Level (DANLa)
Input terminated, Sample or Average detectorAveraging type = LogNormalized to 0 dB input attenuation
Nominal
3 Hz to 1 kHz 110 dBm
1 to 10 kHz 130 dBm
Zero span & sweptNormalized a to 1 Hz
FFT OnlyActualb 1 Hz
Zero span & swept
20 to 30 °C 0 to 55 °C 20 to 30 °C 0 to 55 °C (typical)
10 to 100 kHzc 137 dBm 137 dBm 137 dBm 137 dBm 141 dBm
100 kHz to 1 MHz 145 dBm 145 dBm 145 dBm 145 dBm 150 dBm
1 to 10 MHz 150 dBm 150 dBm 150 dBm 150 dBm 155 dBm
10 MHz to 1.2 GHz 153 dBm 152 dBm 152 dBm 151 dBm 154 dBm
1.2 to 2.1 GHz 152 dBm 151 dBm 151 dBm 150 dBm 153 dBm
2.1 to 3 GHz 151 dBm 149 dBm 150 dBm 148 dBm 152 dBm
3 to 6.6 GHz 151 dBm 149 dBm 150 dBm 149 dBm 152 dBm
6.6 to 13.2 GHz 146 dBm 145 dBm 146 dBm 145 dBm 149 dBm
13.2 to 20 GHz 144 dBm 142 dBm 143 dBm 141 dBm 146 dBm
20 to 22.5 GHz 143 dBm 141 dBm 143 dBm 141 dBm 146 dBm
22.5 to 26.8 GHz 140 dBm 138 dBm 140 dBm 138 dBm 144 dBm
26.8 to 31.15 GHz 142 dBm 140 dBm 141 dBm 139 dBm 145 dBm
31.15 to 35 GHz 134 dBm 132 dBm 133 dBm 131 dBm 136 dBm
35 to 38 GHz 129 dBm 127 dBm 129 dBm 127 dBm 132 dBm
38 to 44 GHz 131 dBm 129 dBm 131 dBm 128 dBm 134 dBm
44 to 49 GHz 128 dBm 127 dBm 127 dBm 126 dBm 131 dBm
49 to 50 GHz 127 dBm 126 dBm 126 dBm 125 dBm 130 dBm
50 Chapter 1

PSA Series Core Spectrum Analyzer
Amplitude
a. DANL for zero span and swept is normalized in two ways and for two reasons. DANL is measured in a 1 kHz RBW and normalized to the narrowest available RBW, because the narrowest RBWs (1.0 to 1.8) are not usable for signals below 110 dBm but DANL can be a useful figure of merit for the other RBWs. (RBWs this small are usually best used in FFT mode, because sweep rates are very slow in these bandwidths. RBW autocoupling never selects these RBWs in swept mode because of potential errors at low signal levels.) The second normalization is that DANL is measured with 10 dB input attenuation and normalized to the 0 dB input attenuation case, because that makes DANL and third order intermod-ulation test conditions congruent, allowing accurate dynamic range estimation for the analyzer. Because of these normalizations, this measure of DANL is useful for estimating instrument performance such as TOI to noise range and compression to noise range, but not ultimate sensitivity.
b. DANL for FFT measurements are useful for estimating the ultimate sensitivity of the analyzer for low-level signals. This specification is verified with 0 dB input attenuation and 1 Hz RBW. A limitation of this DANL specification is that some instruments have a center-screen-only spurious signal of nomi-nally 150 dBm, which can be avoided by tuning the analyzer a few hertz away from the frequency of interest.
c. Specifications are shown for instruments with serial numbers of MY44020000 or higher, or US44020000 or higher, or SG44020000 or higher. For instruments with lower serial numbers, the spec-ifications are 140 dBm and the typical is 143 dBm. The transition between these occurred around January 2004. Press System, Show System to read out the serial number.
Chapter 1 51

PSA Series Core Spectrum Analyzer
Amplitude
Description SpecificationsSupplemental Information
Displayed AverageNoise Level (cont.)
Zero span & sweptNormalized a to 1 Hz
FFT OnlyActuala 1 Hz
a. DANL for FFT measurements are useful for estimating the ultimate sensitivity of the analyzer for low-level signals. This specification is verified with 0 dB input attenuation and 1 Hz RBW. A limitation of this DANL specification is that some instruments have a center-screen-only spurious signal of nomi-nally 150 dBm, which can be avoided by tuning the analyzer a few hertz away from the frequency of interest.
Zero span & swept
Preselected Pathb
b. For unpreselected path performance, refer to chapter 20.
20 to 30 °C 0 to 55 °C 20 to 30 °C 0 to 55 °C (typical)
Preamp Off (Option 110 or 123 installed)
10 to 100 kHz 137 dBm 137 dBm 137 dBm 137 dBm 141 dBm
100 kHz to 1 MHz 145 dBm 145 dBm 145 dBm 145 dBm 150 dBm
1 to 10 MHz 150 dBm 150 dBm 150 dBm 150 dBm 155 dBm
10 MHz to 1.2 GHz 152 dBm 151 dBm 152 dBm 151 dBm 154 dBm
1.2 to 2.1 GHz 150 dBm 149 dBm 150 dBm 149 dBm 153 dBm
2.1 to 3 GHz 149 dBm 147 dBm 149 dBm 147 dBm 152 dBm
3 to 6.6 GHz 150 dBm 149 dBm 150 dBm 149 dBm 152 dBm
6.6 to 13.2 GHz 144 dBm 143 dBm 144 dBm 143 dBm 145 dBm
13.2 to 19 GHz 141 dBm 139 dBm 141 dBm 139 dBm 144 dBm
19 to 22.5 GHz 141 dBm 139 dBm 141 dBm 139 dBm 144 dBm
22.5 to 26.8 GHz 136 dBm 135 dBm 136 dBm 135 dBm 140 dBm
26.8 to 31.15 GHz 139 dBm 137 dBm 139 dBm 137 dBm 142 dBm
31.15 to 35 GHz 131 dBm 129 dBm 131 dBm 129 dBm 132 dBm
35 to 38 GHz 125 dBm 123 dBm 125 dBm 123 dBm 127 dBm
38 to 41 GHz 127 dBm 125 dBm 127 dBm 125 dBm 128 dBm
41 to 44 GHz 127 dBm 125 dBm 127 dBm 125 dBm 128 dBm
44 to 45 GHz 124 dBm 122 dBm 124 dBm 122 dBm 128 dBm
45 to 49 GHz 124 dBm 122 dBm 124 dBm 122 dBm 125 dBm
49 to 50 GHz 124 dBm 122 dBm 124 dBm 122 dBm 125 dBm
52 Chapter 1

PSA Series Core Spectrum Analyzer
Amplitude
Description SpecificationsSupplemental Information
Displayed AverageNoise Level (cont.)
Zero span & sweptNormalized a to 1 Hz
FFT OnlyActuala 1 Hz
a. DANL for FFT measurements are useful for estimating the ultimate sensitivity of the analyzer for low-level signals. This specification is verified with 0 dB input attenuation and 1 Hz RBW. A limitation of this DANL specification is that some instruments have a center-screen-only spurious signal of nomi-nally 150 dBm, which can be avoided by tuning the analyzer a few hertz away from the frequency of interest.
Zero span & swept
20 to 30 °C 0 to 55 °C 20 to 30 °C 0 to 55 °C (typical)
Preamp On(Option 1DS)
100 to 200 kHz 158 dBm 157 dBm 157 dBm 155 dBm 162 dBm
200 to 500 kHz 158 dBm 157 dBm 157 dBm 155 dBm 162 dBm
500 kHz to 1 MHz 161 dBm 160 dBm 160 dBm 158 dBm 165 dBm
1 to 10 MHz 167 dBm 166 dBm 166 dBm 166 dBm 169 dBm
10 to 500 MHz 167 dBm 166 dBm 167 dBm 167 dBm 169 dBm
0.5 to 1.2 GHz 166 dBm 165 dBm 166 dBm 166 dBm 168 dBm
1.2 to 2.1 GHz 165 dBm 164 dBm 165 dBm 165 dBm 167 dBm
2.1 to 3.0 GHz 163 dBm 162 dBm 163 dBm 162 dBm 165 dBm
Chapter 1 53

PSA Series Core Spectrum Analyzer
Amplitude
Description SpecificationsSupplemental Information
Displayed AverageNoise Level (cont.)
Zero span & sweptNormalized a to 1 Hz
FFT OnlyActuala 1 Hz
a. DANL for FFT measurements are useful for estimating the ultimate sensitivity of the analyzer for low-level signals. This specification is verified with 0 dB input attenuation and 1 Hz RBW. A limitation of this DANL specification is that some instruments have a center-screen-only spurious signal of nomi-nally 150 dBm, which can be avoided by tuning the analyzer a few hertz away from the frequency of interest.
Zero span & swept
20 to 30 °C 0 to 55 °C 20 to 30 °C 0 to 55 °C (typical)
Preamp On(Option 110)
10 to 50 MHz 148 dBm 147 dBm 148 dBm 147 dBm 158 dBm
50 to 500 MHz 153 dBm 152 dBm 153 dBm 152 dBm 164 dBm
500 MHz to 1.2 GHz 165 dBm 164 dBm 165 dBm 164 dBm 168 dBm
1.2 to 2.1 GHz 165 dBm 164 dBm 165 dBm 164 dBm 168 dBm
2.1 to 3 GHz 165 dBm 164 dBm 165 dBm 164 dBm 167 dBm
3 to 6.6 GHz 165 dBm 164 dBm 165 dBm 164 dBm 167 dBm
6.6 to 13.2 GHz 162 dBm 161 dBm 162 dBm 161 dBm 165 dBm
13.2 to 19 GHz 161 dBm 160 dBm 161 dBm 160 dBm 163 dBm
19 to 22.5 GHz 161 dBm 160 dBm 161 dBm 160 dBm 162 dBm
22.5 to 26.8 GHz 155 dBm 154 dBm 155 dBm 154 dBm 160 dBm
26.8 to 31.15 GHz 157 dBm 155 dBm 157 dBm 155 dBm 161 dBm
31.15 to 35 GHz 152 dBm 149 dBm 152 dBm 149 dBm 156 dBm
35 to 38 GHz 146 dBm 143 dBm 146 dBm 143 dBm 150 dBm
38 to 41 GHz 146 dBm 143 dBm 146 dBm 143 dBm 150 dBm
41 to 44 GHz 146 dBm 143 dBm 146 dBm 143 dBm 150 dBm
44 to 45 GHz 143 dBm 139 dBm 143 dBm 139 dBm 150 dBm
45 to 49 GHz 143 dBm 139 dBm 143 dBm 139 dBm 146 dBm
49 to 50 GHz 140 dBm 136 dBm 140 dBm 136 dBm 145 dBm
54 Chapter 1

PSA Series Core Spectrum Analyzer
Amplitude
Description Specifications Supplemental Information
Display Range
Log Scale Ten divisions displayed; 0.1 to 1.0 dB/division in 0.1 dB steps, and1 to 20 dB/division in 1 dB steps
Linear Scale Ten divisions
Marker Readouta
a. Reference level and off-screen performance: The reference level (RL) behavior differs from previous analyzers in a way that makes PSA more flexible. In previous analyzers, the RL controlled how the measurement was performed as well as how it was displayed. Because the logarithmic amplifier in pre-vious analyzers had both range and resolution limitations, this behavior was necessary for optimum measurement accuracy. The logarithmic amplifier in PSA, however, is implemented digitally such that the range and resolution greatly exceed other instrument limitations. Because of this, a PSA can make measurements largely independent of the setting of the RL without compromising accuracy. Because the RL becomes a display function, not a measurement function, a marker can read out results that are off-screen, either above or below, without any change in accuracy. The only exception to the indepen-dence of RL and the way in which the measurement is performed is in the input attenuation setting: When the input attenuation is set to auto, the rules for the determination of the input attenuation include dependence on the reference level. Because the input attenuation setting controls the trade off between large signal behaviors (third-order intermodulation, compression, and display scale fidelity) and small signal effects (noise), the measurement results can change with RL changes when the input attenuation is set to auto.
Log units resolution
Average Off, on-screen 0.01 dB
Average On or remote 0.001 dB
Linear units resolution 1 % of signal level
Chapter 1 55

PSA Series Core Spectrum Analyzer
Amplitude
Frequency Response
E4443A, E4445A, E4440A
Description Specifications Supplemental Information
Frequency Response Refer to footnote for modes
above 18 GHza
a. Signal frequencies above 18 GHz are prone to response errors due to modes in the Type-N connector used. With the use of Type-N to APC 3.5 mm adapter part number 1250-1744, there are nominally six such modes. These modes cause nominally up to a –0.35 dB amplitude change. The effect of these modes with this connector is included with these specifications.
10 dB input attenuation
Maximum error relative to reference condition (50 MHz)b
b. Specifications for frequencies > 3 GHz apply for sweep rates < 100 MHz/ms.
20 to 30 C 0 to 55 C Typical 20 to 30 C(at worst observed frequency)
3 Hz to 3.0 GHz 0.38 dB 0.58 dB 0.11 dB
3.0 to 6.6 GHzc
c. Preselector centering applied.
1.50 dB 2.00 dB 0.6 dB
6.6 to 13.2 GHzc 2.00 dB 2.50 dB 1.0 dB
13.2 to 22.0 GHzc 2.00 dB 2.50 dB 0.9 dB
22.0 to 26.5 GHzc 2.50 dB 3.50 dB 1.3 dB
Additional frequency response error, FFT moded e
d. FFT frequency response errors are specified relative to swept measurements.e. This error need not be included in Absolute Amplitude Accuracy error budgets when the difference
between the analyzer center frequency and the signal frequency is within 1.5 % of the span.
[0.15 dB + (0.1 dB/MHz FFT
widthf)] to a max. of 0.40 dB
f. An FFT width is given by the span divided by the FFTs/Span parameter.
Preamp On (Option 1DS),
100 kHz to 3.0 GHz
0.70 dB 0.80 dB 0.20 dB (nominal)
Preamp On (Option 110)
10 MHz to 3.0 GHz 0.20 dB (nominal)
56 Chapter 1

PSA Series Core Spectrum Analyzer
Amplitude
Description Specifications Supplemental Information
Frequency Response at Attenuation 10 dB
Atten = 20, 30 or 40 dB 20 to 30 C 0 to 55 C
10 MHz to 2.2 GHz 0.53 dB 0.68 dB
2.2 to 3 GHz 0.69 dB 0.84 dB
Atten = 0 dB
Preamp On (Option 1DS) 0.70 dB 0.80 dB
Preamp On (Option 110)
10 MHz to 3.05 GHz 1.0 dB 1.9 dB 0.35 dB
3.0 to 6.6 GHz 1.75 dB 2.5 dB 0.8 dB
6.6 to 13.2 GHz 3.0 dB 3.5 dB 1.0 dB
13.2 to 19 GHz 3.0 dB 3.5 dB 1.2 dB
19 to 26.5 GHz 4.0 dB 4.5 dB 2.0 dB
Other attenuator settings Nominally, same performance as the 20, 30 and 40 dB settings
Chapter 1 57

PSA Series Core Spectrum Analyzer
Amplitude
E4447A, E4446A, E4448A
Description Specifications Supplemental Information
Frequency Response Refer to footnote for modes
above 18 GHza
a. Signal frequencies above 18 GHz are prone to response errors due to modes in the Type-N connector used. With the use of Type-N to APC 3.5 mm adapter part number 1250-1744, there are nominally six such modes. These modes cause nominally up to a –0.35 dB amplitude change. The effect of these modes with this connector are included with these specifications.
10 dB input attenuation
Maximum error relative to reference condition (50 MHz)b
b. Specifications for frequencies > 3 GHz apply for sweep rates <100 MHz/ms.
20 to 30 C 0 to 55 C Typical(at worst observed frequency)
3 Hz to 3.0 GHz 0.38 dB 0.70 dB 0.15 dB
3.0 to 6.6 GHzc
c. Preselector centering applied.
1.50 dB 2.00 dB 0.6 dB
6.6 to 13.2 GHzc 2.00 dB 3.00 dB 1.0 dB
13.2 to 22.0 GHzc 2.00 dB 2.50 dB 1.2 dB
22.0 to 26.8 GHzc 2.50 dB 3.50 dB 1.3 dB
26.8 to 31.15 GHzc 1.75 dB 2.75 dB 0.6 dB
31.15 to 50.0 GHzc 2.50 dB 3.50 dB 1.0 dB
Additional frequency response error, FFT moded e
d. FFT frequency response errors are specified relative to swept measurements.e. This error need not be included in Absolute Amplitude Accuracy error budgets when the difference
between the analyzer center frequency and the signal frequency is within 1.5 % of the span.
[0.15 dB + (0.1 dB/MHz FFT
widthf)] to a max. of 0.40 dB
f. An FFT width is given by the span divided by the FFTs/Span parameter.
Preamp On (Option 1DS),
100 kHz to 3.0 GHz
0.70 dB
0.80 dB
0.20 dB (nominal)
Preamp On (Option 110)
10 MHz to 3 GHz 0.30 dB (nominal)
58 Chapter 1

PSA Series Core Spectrum Analyzer
Amplitude
Description Specifications Supplemental Information
Frequency Response at Attenuation 10 dB
Atten = 20, 30 or 40 dB 20 to 30 C 0 to 55 C
10 MHz to 2.2 GHz 0.53 dB 0.68 dB
2.2 to 3 GHz 0.69 dB 0.84 dB
Atten = 0 dB
Preamp On (Option 1DS) 0.70 dB 0.80 dB
Preamp On (Option 110)
10 MHz to 3.05 GHz 1.3 dB 2.0 dB 0.5 dB
3.0 to 6.6 GHz 2.5 dB 3.0 dB 1.0 dB
6.6 to 13.2 GHz 2.5 dB 3.5 dB 1.2 dB
13.2 to 19 GHz 3.0 dB 4.0 dB 1.5 dB
19 to 26.5 GHz 4.0 dB 4.5 dB 2.0 dB
26.5 to 31.15 GHz 3.0 dB 3.5 dB 1.2 dB
31.15 to 50 GHz 3.5 dB 4.5 dB 1.6 dB
Other attenuator settings Nominally, same performance as the 20, 30 and 40 dB settings
Chapter 1 59

PSA Series Core Spectrum Analyzer
Amplitude
Nominal Frequency Response
60 Chapter 1

PSA Series Core Spectrum Analyzer
Amplitude
Description Specifications Supplemental Information
Input Attenuation Switching Uncertainty
Relative to 10 dB (reference setting)
Frequency Range
50 MHz (reference frequency)
Atten = 12 to 40 dB 0.14 dB 0.037 dB (typical)
Other settings 2 dB 0.18 dB 0.053 dB (typical)
Atten = 0 dB 0.20 dB 0.083 dB (typical)
3 Hz to 3.0 GHz 0.3 dB (nominal)
3.0 to 13.2 GHz 0.5 dB (nominal)
13.2 to 26.8 GHz 0.7 dB (nominal)
26.8 to 50 GHz 1.0 dB (nominal)
Description Specifications Supplemental Information
Preamp (Option 1DS)a
a. The preamp follows the input attenuator, AC/DC coupling control, and 3 GHz low-pass filtering. It pre-cedes the input mixer.
Gain +28 dB (nominal)
Noise figure
10 MHz to 1.5 GHz 6 dB (nominal)
1.5 to 3.0 GHz 7 dB (nominal)
Chapter 1 61

PSA Series Core Spectrum Analyzer
Amplitude
E4443A, E4445A, E4440A
E4447A, E4446A, E4448A
Description Specifications Supplemental Information
Preamp (Option 110)a
a. The preamp follows the input attenuator and AC/DC coupling control. It procedes the input mixer.
Gain
10 MHz to 26.5 GHz 27 dB (nominal)
Noise figure
10 MHz to 30 MHz 12.5 dB (nominal)
30 MHz to 3 GHz 7.8 dB (nominal)
3 to 26.5 GHz 10.3 dB (nominal)
Description Specifications Supplemental Information
Preamp (Option 110)a
a. The preamp follows the input attenuator and AC/DC coupling control. It procedes the input mixer.
Gain
10 MHz to 3.0 GHz 28 dB (nominal)
3.0 to 30.0 GHz 27 dB (nominal)
30.0 to 50.0 GHz 24 dB (nominal)
Noise figure
10 MHz to 30 MHz 12.5 dB (nominal)
30 MHz to 3 GHz 7.8 dB (nominal)
3 to 30 GHz 10.3 dB (nominal)
30 to 50 GHz 21.8 dB (nominal)
62 Chapter 1

PSA Series Core Spectrum Analyzer
Amplitude
Description Specifications Supplemental Information
Absolute Amplitude Accuracy
At 50 MHza 20 to 30 C 0 to 55 C
a. Absolute amplitude accuracy is the total of all amplitude measurement errors, and applies over the fol-lowing subset of settings and conditions: 10 Hz RBW 1 MHz; Input signal 10 to 50 dBm; Input attenuation 10 dB; span <5 MHz (nominal additional error for span 5 MHz is 0.02 dB); all settings autocoupled except Auto Swp Time = Accy; combinations of low signal level and wide RBW use VBW 30 kHz to reduce noise.This absolute amplitude accuracy specification includes the sum of the following individual specifica-tions under the conditions listed above: Scale Fidelity, Reference Level Accuracy, Display Scale Switching Uncertainty, Resolution Bandwidth Switching Uncertainty, 50 MHz Amplitude Reference Accuracy, and the accuracy with which the instrument aligns its internal gains to the 50 MHz Ampli-tude Reference.
0.24 dB0.28 dB
0.06 dB (typical)
At all frequenciesa 20 to 30 C
0 to 55 C
(0.24 dB + frequency response)
(0.28 dB + frequency response)
(0.06 dB + frequency response) (typical)
95 % Confidence AbsoluteAmplitude Accuracyb
b. Absolute Amplitude Accuracy for a wide range of signal and measurement settings, with 95 % confi-dence, for the attenuation settings and frequency ranges shown. The wide range of settings of RBW, signal level, VBW, reference level and display scale are discussed in footnote a. The value given is computed from the observations of a statistically significant number of instruments. The computation includes the root-sum-squaring of these terms: the absolute amplitude accuracy observed at 50 MHz at 44 quasi-random combinations of settings and signal levels, the frequency response relative to 50 MHz at 102 quasi=random test frequencies, the attenuation switching uncertainty relative to 10 dB at 50 MHz, and the measurement uncertainties of these observations. To that root-sum-squaring result is added the environmental effects of 20 to 30 °C variation. The 95th percentiles are determined with 95 % confidence.
Wide range of signal levels, RBWs, RLs, etc.
0 to 3 GHz, Atten = 10 dB 0.19 dB
0 to 2.2 GHz, Atten = 10, 20, 30 or 40 dB
0.20 dB
Amplitude Reference Accuracy 0.05 dB (nominal)
Preamp Onc (Option 1DS) (0.36 dB + frequency response)
(0.09 dB + frequency response) (typical)
Preamp Ond (Option 110) (0.40 dB + frequency response)
(0.15 dB + frequency response) (typical)
Chapter 1 63

PSA Series Core Spectrum Analyzer
Amplitude
c. Same settings as footnote b, except that the signal level at the preamp input is 40 to 80 dBm. Total power at preamp (dBm) = total power at input (dBm) minus input attenuation (dB). For frequencies from 100 kHz to 3 GHz.
d. Same settings as footnote b, except that the signal level at the preamp input is 40 to 80 dBm. Total power at preamp (dBm) = total power at input (dBm) minus input attenuation (dB). For frequencies from 10 MHz to the maximum frequency of the PSA instrument.
64 Chapter 1

PSA Series Core Spectrum Analyzer
Amplitude
RF Input VSWR
E4443A, E4445A, E4440A
Description Specifications Supplemental Information
RF Input VSWR
at tuned frequency Nominal
10 dB attenuation, 50 MHz 1.07:1
8 dB input attenuation
50 MHz to 3 GHz < 1.2:1
3 to 18 GHz < 1.6:1
18 to 26.5 GHz < 1.9:1
2 to 6 dB input attenuation
50 MHz to 3 GHz < 1.6:1
3 to 26.5 GHz < 1.9:1
0 dB input attenuation
50 MHz to 26.5 GHz < 1.9:1
Preamp On (Option 1DS)
50 MHz to 3 GHz
10 dB input attenuation < 1.2:1
< 10 dB input attenuation < 1.5:1
Preamp On (Option 110)
0 dB input attenuation
200 MHz to 6.6 GHz < 1.5:1
6.6 to 26.5 GHz < 1.9:1
10 dB input attenuation
200 MHz to 6.6 GHz < 1.4:1
6.6 to 13.2 GHz < 1.7:1
13.2 to 19.2 GHz < 1.5:1
19.2 to 26.5 GHz < 1.8:1
Alignments running Open input
Chapter 1 65

PSA Series Core Spectrum Analyzer
Amplitude
E4447A, E4446A, E4448A
Description Specifications Supplemental Information
RF Input VSWR Nominal
at tuned frequency
10 dB attenuation, 50 MHz < 1.03:1
8 dB input attenuation
50 MHz to 3 GHz < 1.13:1
3 to 18 GHz < 1.27:1
18 to 26.5 GHz < 1.37:1
26.5 to 50.0 GHz < 1.57:1
2 to 6 dB input attenuation
50 MHz to 3 GHz < 1.29:1
3 to 18 GHz < 1.75:1
18 to 26.5 GHz < 1.68:1
26.5 to 50.0 GHz < 1.94:1
0 dB input attenuation
50 MHz to 3 GHz < 1.48:1
3 to 18 GHz < 2.55:1
18 to 26.5 GHz < 2.90:1
26.5 to 50.0 GHz < 2.12:1
Preamp On (Option 1DS)
50 MHz to 3 GHz
10 dB input attenuation < 1.13:1
< 10 dB input attenuation < 1.30:1
Preamp On (Option 110)
0 dB input attenuation
200 MHz to 6.6 GHz < 1.4:1
6.6 to 13.2 GHz < 1.7:1
13.2 to 31 GHz < 1.6:1
31 to 41 GHz < 2.0:1
41 to 50 GHz < 1.9:1
66 Chapter 1

PSA Series Core Spectrum Analyzer
Amplitude
Description Specifications Supplemental Information
10 dB input attenuation
200 MHz to 6.6 GHz < 1.3:1
6.6 to 13.2 GHz < 1.5:1
13.2 to 31 GHz < 1.4:1
31 to 41 GHz < 1.8:1
41 to 50 GHz < 1.7:1
> 10 dB input attenuation
200 MHz to 6.6 GHz < 1.2:1
6.6 to 13.2 GHz < 1.4:1
13.2 to 19.2 GHz < 1.3:1
19.2 to 31 GHz < 1.5:1
31 to 50 GHz < 1.7:1
Internal 50 MHz calibrator is On Open input
Alignments running Open input
Description Specifications Supplemental Information
Resolution Bandwidth Switching Uncertaintya relative to reference BW of 30 kHz
a. RBW switching is specified and tested in the reference condition: 25 dBm signal input and 10 dB input attenuation. At higher input levels, changing RBW may cause a larger change in result than that specified, because the display scale fidelity can be slightly different for different RBWs. These RBW differences in scale fidelity are nominally within 0.01 dB in all RBWs even for signals as large as 10 dBm at the input mixer.
1.0 Hz to 1.0 MHz RBW 0.03 dB
1.1 MHz to 3 MHz RBW 0.05 dB
Manually selected wide RBWs: 4, 5, 6, 8 MHz
1.0 dB
Chapter 1 67

PSA Series Core Spectrum Analyzer
Amplitude
Description Specifications Supplemental Information
Reference Levela
a. Reference level and off-screen performance: The reference level (RL) behavior differs from previous analyzers in a way that makes PSA more flexible. In previous analyzers, the RL controlled how the mea-surement was performed as well as how it was displayed. Because the logarithmic amplifier in previous analyzers had both range and resolution limitations, this behavior was necessary for optimum measure-ment accuracy. The logarithmic amplifier in PSA, however, is implemented digitally such that the range and resolution greatly exceed other instrument limitations. Because of this, a PSA can make measure-ments largely independent of the setting of the RL without compromising accuracy. Because the RL becomes a display function, not a measurement function, a marker can read out results that are off-screen, either above or below, without any change in accuracy. The only exception to the indepen-dence of RL and the way in which the measurement is performed is in the input attenuation setting: When the input attenuation is set to auto, the rules for the determination of the input attenuation include dependence on the reference level. Because the input attenuation setting controls the trade off between large signal behaviors (third-order intermodulation, compression, and display scale fidelity) and small signal effects (noise), the measurement results can change with RL changes when the input attenuation is set to auto.
Range
Log Units 170 to +30 dBm, in 0.01 dB steps
Linear Units 707 pV to 7.07 V, in 0.1 % steps
Accuracy 0 dBb
b. Because reference level affects only the display, not the measurement, it causes no additional error in measurement results from trace data or markers.
68 Chapter 1

PSA Series Core Spectrum Analyzer
Amplitude
Description Specifications Supplemental Information
Display Scale Switching Uncertainty
Switching between Linear and Log 0 dBa
a. Because Log/Lin and Log Scale Switching affect only the display, not the measurement, they cause no additional error in measurement results from trace data or markers.
Log Scale Switching 0 dBa
Display Scale Fidelityb c d e
b. Supplemental information: The amplitude detection linearity specification applies at all levels below 10 dBm at the input mixer; however, noise will reduce the accuracy of low level measurements. The amplitude error due to noise is determined by the signal-to-noise ratio, S/N. If the S/N is large (20 dB or better), the amplitude error due to noise can be estimated from the equation below, given for the 3-sigma (three standard deviations) level.
The errors due to S/N ratio can be further reduced by averaging results. For large S/N (20 dB or better), the 3 sigma level can be reduced proportional to the square root of the number of averages taken.
c. Display scale fidelity and resolution bandwidth switching uncertainty interact slightly. See the footnote for RBW switching. RBW switching applies at only one level on the scale fidelity curve, but scale fidelity applies for all RBWs.
d. Scale fidelity is warranted with ADC dither turned on. Turning on ADC dither nominally increases DANL. The nominal increase is highest with the preamp off in the lowest-DANL frequency range, under 1.2 GHz, where the nominal increase is 2.5 dB. Other ranges and the preamp-on case will show lower increases in DANL. Turning off ADC dither nominally degrades low-level (signal levels below 60 dBm at the input mixer level) scale fidelity by 0.2 dB.
e. Reference level and off-screen performance: The reference level (RL) behavior differs from previous analyzers in a way that makes PSA more flexible. In previous analyzers, the RL controlled how the measurement was performed as well as how it was displayed. Because the logarithmic amplifier in pre-vious analyzers had both range and resolution limitations, this behavior was necessary for optimum measurement accuracy. The logarithmic amplifier in PSA, however, is implemented digitally such that the range and resolution greatly exceed other instrument limitations. Because of this, a PSA can make measurements largely independent of the setting of the RL without compromising accuracy. Because the RL becomes a display function, not a measurement function, a marker can read out results that are off-screen, either above or below, without any change in accuracy. The only exception to the indepen-dence of RL and the way in which the measurement is performed is in the input attenuator setting: When the input attenuator is set to auto, the rules for the determination of the input attenuation include dependence on the reference level. Because the input attenuation setting controls the trade off between large signal behaviors (third-order intermodulation, compression, and display scale fidelity) and small signal effects (noise), the measurement results can change with RL changes when the input attenuation is set to auto.
Log-Linear Fidelity (relative to the reference condition of 25 dBm input through the 10 dB attenuation, or 35 dBm at the input mixer)
3 3 20dB 1 10 S N 3dB+ 20dB –+ log=
Chapter 1 69

PSA Series Core Spectrum Analyzer
Amplitude
Description Specifications Supplemental Information
Input mixer levela
a. Mixer level = Input Level Input Attenuator
Linearity
20 dBm 10 dBm
0.07 dB0.13 dB
Relative Fidelityb
Equation for error A (((B1 + B2) P) to a maximum of (C1 + C2))
b. The relative fidelity is the error in the measured difference between two signal levels. It is so small in many cases that it cannot be verified without being dominated by measurement uncertainty of the veri-fication. Because of this verification difficulty, this specification gives nominal performance, based on numbers that are as conservatively determined as those used in warranted specifications. We will con-sider one example of the use of the error equation to compute the nominal performance.Example: the accuracy of the relative level of a sideband around 60 dBm, with a carrier at 5 dBm, using attenuator = 10 dB and RBW = 3 kHz.Because the larger signal is 5 dBm with 10 dB attenuation, the mixer level, ML, defined to be input power minus input attenuation, is 15 dBm. The line for this mixer level shows A = 0.011 dB, B1 = 0.007 and C1 = 0.08 dB. Because the RBW is neither 10 kHz and over, nor 2 kHz and under, parame-ters B2 and C2 are determined by formulas. B2 is 7/3000, or 0.00233. C2 is 76 dB/3000, or 0.025 dB. With these values for the parameters, the equation becomes: 0.011 dB (0.0093 P to a maximum of 0.105 dB). P is (5 (60)) or 55 dB. Therefore, the maximum error in the power ratio is 0.116 dB.
Level of larger signal A B1 C1
20 dBm < ML < 12 dBm 0.011 dB 0.007 0.08 dB
29 dBm < ML 20 dBm 0.011 dB 0.0015 0.04 dB
Noise < ML 29 dBm 0.001 dB 0.001 0.04 dB
RBW B2 C2
10 kHz 0.000 0.000 dB
2 kHz 0.0035 0.038 dB
others (RBW in Hz) 7/RBW 76 dB/RBW
70 Chapter 1

PSA Series Core Spectrum Analyzer
Amplitude
Description Specifications Supplemental Information
Special Circumstances Relative
Fidelitya
a. Under very specific conditions, the PSA is warranted to have exceptional relative scale fidelity. The analysis frequency must be in Band 0. Sweep Type must be FFT with “FFTs/Span” set to 1, dither must be on, and the input attenuator must be set so that the ML (mixer level, given by Input Level Attenu-ation) does not exceed 28 dBm. The span must be 40 kHz; wider spans will cause lower throughput, and narrower spans may have poorer fidelity. RBW of 75 Hz or lower is recommended. Average Type = Log improves the isolation of the measurement from the effects of noise. Further recommendations for achieving this fidelity are: 1) Detector = Sample 2) Signal to be CW 3) Analyzer and signal source to have their reference frequencies locked together 4) Analyzer center frequency = signal frequency + 2500 Hz 5) Sweep points = 401 6) Trace averaging on, 100 averages.
(0.009 dB + 0.003 dB per
10 dB stepb)
b. “Step” in this specification refers to the difference between two relative measurements, such as might be experienced by stepping a stepped attenuator. Therefore, the relative fidelity accuracy is computed by adding the uncertainty for each full or partial 10 dB step to the other uncertainty term. For example, if the two levels whose relative level is to be determined differ by 15 dB; consider that to be a differ-ence of two 10 dB steps. The relative accuracy specification would be (0.009 + 2(0.003)) or 0.015 dB.
FFT, Span = 40 kHz, dither On, ML 28 dBm
Chapter 1 71

PSA Series Core Spectrum Analyzer
Amplitude
Display Scale Fidelity
Description Specifications Supplemental Information
Available Detectors Normal, Peak, Sample, Negative Peak, Log Power Average, RMS Average, Voltage Average
EMI Detectors
CISPR Peak, Quasi-Peak, Average
MIL-STD Peak
72 Chapter 1

PSA Series Core Spectrum Analyzer
Amplitude
Description Specifications Supplemental Information
EMI Average Detector Used for CISPR-compliant average measurements and, with 1 MHz RBW, for frequencies above 1 GHz
Default Average Type Voltage All filtering is done on the linear (voltage) scale even when the display scale is log.
Default VBW 1 Hz
Description Specifications Supplemental Information
Quasi-Peak Detector Used with CISPR-compliant RBWs, for frequencies 1 GHz
Absolute Amplitude Accuracy for reference spectral intensities
Meets CISPR standardsa
a. CISPR 16-1 (2002-10)
Relative amplitude accuracy versus pulse repetition rate
Meets CISPR standardsa
Quasi-Peak to average response ratio Meets CISPR standardsa
Dynamic range
Pulse repetition rates 20 Hz Nominally meets CISPR
standardsa
Pulse repetition rates 10 Hz Does not meet CISPR standards in some cases with DC pulse excitation; see following table.
Chapter 1 73

PSA Series Core Spectrum Analyzer
Amplitude
Description Specifications Supplemental Information
Second Harmonic Distortion SHIa
a. SHI = second harmonic intercept. The SHI is given by the mixer power in dBm minus the second har-monic distortion level relative to the mixer tone in dBc. The measurement is made with a –11 dBm tone at the input mixer.
Mixer
Levelb(typical)
b. Mixer level = Input Level – Input Attenuation
Distortion(typical)
SHI
Source Frequency
10 to 460 MHz +42 dBm –40 dBm –82 dBc
460 MHz to 1.18 GHz +52 dBm –40 dBm –92 dBc
1.18 to 1.5 GHz +42 dBm 40 dBm –82 dBc
1.5 to 2.0 GHz +80 dBm 10 dBm –90 dBc
2.0 to 3.25 GHz
E4443A, E4445A, E4440A +90 dBm –10 dBm –100 dBc
E4447A, E4446A, E4448A +84 dBm –10 dBm –94 dBc
3.25 to 13.25 GHz
E4443A, E4445A, E4440A +90 dBm –10 dBm –100 dBc
E4447A, E4446A, E4448 +86 dBm –10 dBm –96 dBc
13.25 to 25.0 GHz
E4443A, E4445A, E4440A N/A
E4447A, E4446A, E4448A –10 dBm –100 dBc (nominal)
+90dBm(nominal)
Preamp On (Option 1DS) Preamp
Levelc
c. Preamp level = Input Level – Input Attenuation.
10 MHz to 1.5 GHz –45 dBm –60 dBc(nominal)
+15 dBm(nominal)
Preamp On (Option 110) Preamp
Levelc
10 to 460 MHz
460 MHz to 25 GHz
–45 dBm
–45 dBm
–55 dBc(nominal)
–60 dBc(nominal)
+10 dBm(nominal)
+15 dBm(nominal)
74 Chapter 1

PSA Series Core Spectrum Analyzer
Amplitude
Description Specifications Supplemental Information
General Spurious Responses
Mixer Levela = 40 dBm
a. Mixer level = Input Level Input Attenuation
100 Hz f < 10 MHz from carrier (73 + 20 log N) dBcb
b. N = LO mixing harmonic
f 10 MHz from carrier (80 + 20 log N) dBcb (90 + 20 log N) dBcb (typical)
Chapter 1 75

PSA Series Core Spectrum Analyzer
Amplitude
Third Order Intermodulation Distortion
E4443A, E4445A, E4440A
Description Specifications Supplemental Information
Third OrderIntermodulation Distortion Tone separation >15 kHz Sweep type not set to FFT
Verification conditionsa
a. TOI is verified with two tones, each at 18 dBm at the mixer, spaced by 100 kHz.
Distortionb
b. Distortion for two tones that are each at 30 dBm is computed from TOI.
TOIc
c. TOI = third order intercept. The TOI is given by the mixer tone level (in dBm) minus (distortion/2) where distortion is the relative level of the distortion tones in dBc.
TOI (typical)
20 to 30 C Two 30 dBm tones
10 to 100 MHz 88 dBc +14 dBm +17 dBm
100 to 400 MHz 90 dBc +15 dBm +18 dBm
400 MHz to 1.7 GHz 92 dBc +16 dBm +19 dBm
1.7 to 2.7 GHz 94 dBc +17 dBm +19 dBm
2.7 to 3 GHz 94 dBc +17 dBm +20 dBm
3 to 6 GHz 90 dBc +15 dBm +18 dBm
6 to 16 GHz 76 dBc +8 dBm +11 dBm
16 to 26.5 GHz 84 dBc +12 dBm +14 dBm
0 to 55 C
10 to 100 MHz 86 dBc +13 dBm +17 dBm
100 to 400 MHz 86 dBc +13 dBm +17 dBm
400 MHz to 2.7 GHz 90 dBc +15 dBm +18 dBm
2.7 to 3 GHz 90 dBc +15 dBm +18 dBm
3 to 6 GHz 90 dBc +15 dBm +18 dBm
6 to 16 GHz 74 dBc +7 dBm +10 dBm
16 to 26.5 GHz 82 dBc +11 dBm +13 dBm
76 Chapter 1

PSA Series Core Spectrum Analyzer
Amplitude
Description Specifications Supplemental Information
Preamp On (Option 1DS) Verification conditionsa
a. TOI is verified with two tones each at 45 dBm at the preamp, spaced by 100 kHz.
TOI (nominal)
10 to 500 MHz 15 dBm
500 MHz to 3 GHz 13 dBm
Preamp On (Option 110) Verification conditions a
TOI (nominal)
10 MHz to 3 GHz 15 dBm
3 to 6.6 GHz 21 dBm
6.6 to 13.2 GHz 23 dBm
13.2 to 19 GHz 23 dBm
19 to 26.5 GHz 25 dBm
Chapter 1 77

PSA Series Core Spectrum Analyzer
Amplitude
E4447A, E4446A, E4448A
Description Specifications Supplemental Information
Third OrderIntermodulation Distortion Tone separation >15 kHz Sweep type not set to FFT
Verification conditionsa
a. TOI is verified with two tones, each at 18 dBm at the mixer, spaced by 100 kHz.
Distortionb
b. Distortion for two tones that are each at 30 dBm is computed from TOI.
TOIc
c. TOI = third order intercept. The TOI is given by the mixer tone level (in dBm) minus (distortion/2) where distortion is the relative level of the distortion tones in dBc.
TOI (typical)
20 to 30 C Two 30 dBm tones
10 to 100 MHz 90 dBc +15 dBm +20 dBm
100 to 400 MHz 92 dBc +16 dBm +21 dBm
400 MHz to 1.7 GHz 94 dBc +17 dBm +20 dBm
1.7 to 2.7 GHz 96 dBc +18 dBm +21 dBm
2.7 to 3 GHz 96 dBc +18 dBm +21 dBm
3 to 6 GHz 92 dBc +16 dBm +21 dBm
6 to 16 GHz 84 dBc +12 dBm +15 dBm
16 to 26.5 GHz 84 dBc +12 dBm +16 dBm
26.5 to 50.0 GHz +12.5 dBm (nominal)
0 to 55 C
10 to 100 MHz 88 dBc +14 dBm +19 dBm
100 to 400 MHz 91 dBc +15.5 dBm +20 dBm
400 MHz to 1.7 GHz 92 dBc +16 dBm +19.5 dBm
1.7 to 2.7 GHz 94 dBc +17 dBm +20 dBm
2.7 to 3 GHz 93 dBc +16.5 dBm +20.5 dBm
3 to 6 GHz 92 dBc +16 dBm +21 dBm
6 to 16 GHz 84 dBc +12 dBm +14 dBm
16 to 26.5 GHz 84 dBc +12 dBm +15 dBm
26.5 to 50.0 GHz +12.5 dBm (nominal)
78 Chapter 1

PSA Series Core Spectrum Analyzer
Amplitude
Description Specifications Supplemental Information
Preamp On (Option 1DS) Verification conditionsa
a. TOI is verified with two tones each at 45 dBm at the preamp, spaced by 100 kHz.
TOI (nominal)
10 to 500 MHz 15 dBm
500 MHz to 3 GHz 13 dBm
Preamp On (Option 110) Verification conditions a
TOI (nominal)
10 MHz to 3 GHz 15 dBm
3 to 6.6 GHz 21 dBm
6.6 to 13.2 GHz 23 dBm
13.2 to 19 GHz 23 dBm
19 to 26.5 GHz 25 dBm
Chapter 1 79
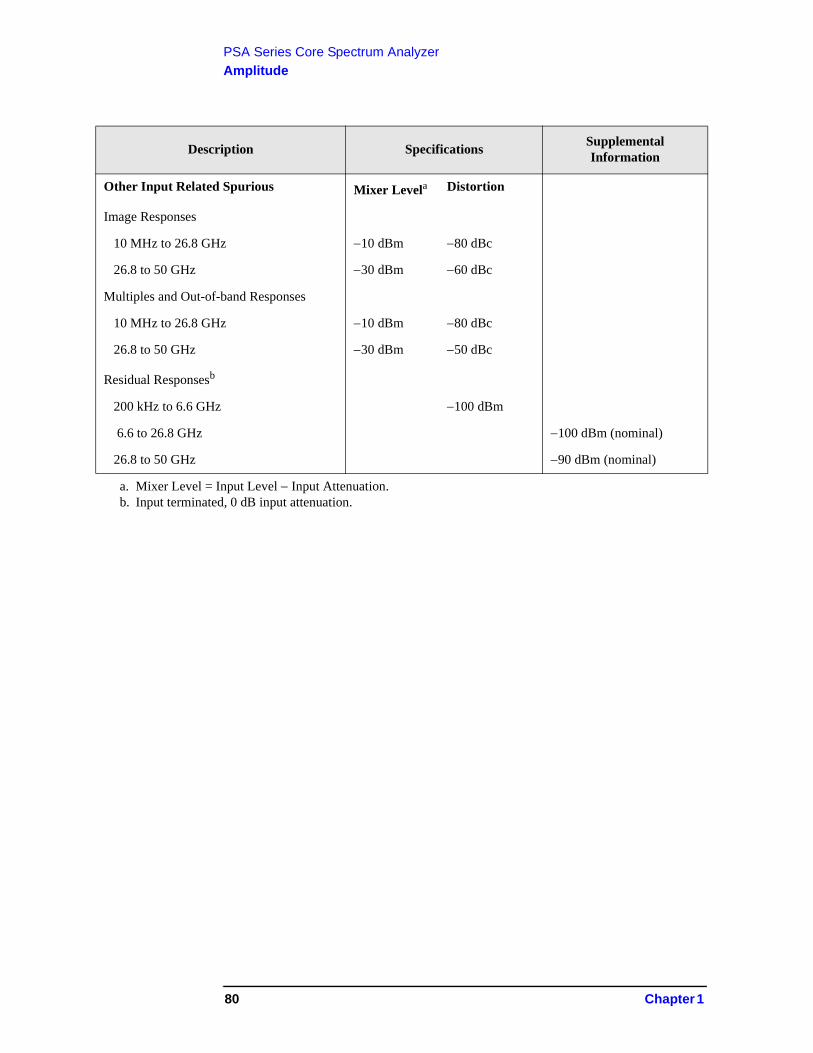
PSA Series Core Spectrum Analyzer
Amplitude
Description SpecificationsSupplemental Information
Other Input Related Spurious Mixer Levela
a. Mixer Level = Input Level Input Attenuation.
Distortion
Image Responses
10 MHz to 26.8 GHz 10 dBm 80 dBc
26.8 to 50 GHz 30 dBm 60 dBc
Multiples and Out-of-band Responses
10 MHz to 26.8 GHz 10 dBm 80 dBc
26.8 to 50 GHz 30 dBm 50 dBc
Residual Responsesb
b. Input terminated, 0 dB input attenuation.
200 kHz to 6.6 GHz 100 dBm
6.6 to 26.8 GHz 100 dBm (nominal)
26.8 to 50 GHz 90 dBm (nominal)
80 Chapter 1

PSA Series Core Spectrum Analyzer
Amplitude
Dynamic Range
E4443A, E4445A, E4440A
Nominal Dynamic Range
Chapter 1 81

PSA Series Core Spectrum Analyzer
Amplitude
E4447A, E4446A, E4448A: Bands 04
Dynamic Range
82 Chapter 1

PSA Series Core Spectrum Analyzer
Amplitude
E4447A, E4446A, E4448A: Bands 56
Dynamic Range
Chapter 1 83

PSA Series Core Spectrum Analyzer
Power Suite Measurements
Power Suite Measurements
Description Specifications Supplemental Information
Channel Power
Amplitude Accuracy Absolute Amplitude Accuracya +Power Bandwidth Accuracyb c
a. See Amplitude section.b. See Frequency section.c. Expressed in dB.
Radio Std = 3GPP W-CDMA, or IS-95
Absolute Power Accuracy 20 to 30 C Mixer leveld < 20 dBm
d. Mixer level is the input power minus the input attenuation.
0.68 dB 0.18 dB (typical)
Description Specifications Supplemental Information
Occupied Bandwidth
Frequency Accuracy (Span/600) (nominal)
84 Chapter 1

PSA Series Core Spectrum Analyzer
Power Suite Measurements
Description Specifications Supplemental Information
Adjacent Channel Power (ACP)
Radio Std = None
Accuracy of ACP Ratio (dBc) Display Scale Fidelitya
a. The effect of scale fidelity on the ratio of two powers is called the relative scale fidelity. The scale fidel-ity specified in the Amplitude section is an absolute scale fidelity with 35 dBm at the input mixer as the reference point. The relative scale fidelity is nominally only 0.01 dB larger than the absolute scale fidelity.
Accuracy of ACP Absolute Power (dBm or dBm/Hz)
Absolute Amplitude Accuracyb +Power Bandwidth Accuracyc d
b. See Amplitude section.c. See Frequency section.d. Expressed in decibels.
Accuracy of Carrier Power (dBm), or Carrier Power PSD (dBm/Hz)
Absolute Amplitude Accuracya + Power Bandwidth Accuracyc
Passband widthe
e. An ACP measurement measures the power in adjacent channels. The shape of the response versus fre-quency of those adjacent channels is occasionally critical. One parameter of the shape is its 3 dB band-width. When the bandwidth (called the Ref BW) of the adjacent channel is set, it is the 3 dB bandwidth that is set. The passband response is given by the convolution of two functions: a rectangle of width equal to Ref BW and the power response versus frequency of the RBW filter used. Measurements and specifications of analog radio ACPs are often based on defined bandwidths of measuring receivers, and these are defined by their 6 dB widths, not their 3 dB widths. To achieve a passband whose 6 dB width is x, set the Ref BW to be x 0.572 RBW.
3 dB
Chapter 1 85

PSA Series Core Spectrum Analyzer
Power Suite Measurements
Description Specifications Supplemental Information
Adjacent Channel Power (ACP)
Radio Std = 3GPP W-CDMA (ACPR; ACLR)a
a. Most versions of adjacent channel power measurements use negative numbers, in units of dBc, to refer to the power in an adjacent channel relative to the power in a main channel, in accordance with ITU standards. The standards for W-CDMA analysis include ACLR, a positive number represented in dB units. In order to be consistent with other kinds of ACP measurements, this measurement and its speci-fications will use negative dBc results, and refer to them as ACPR, instead of positive dB results referred to as ACLR. The ACLR can be determined from the ACPR reported by merely reversing the sign.
Minimum power at RF Input 36 dBm (nominal)
86 Chapter 1

PSA Series Core Spectrum Analyzer
Power Suite Measurements
Description Specifications Supplemental Information
Adjacent Channel Power (ACP)
ACPR Accuracya
a. The accuracy of the Adjacent Channel Power Ratio will depend on the mixer drive level and whether the distortion products from the analyzer are coherent with those in the UUT. These specifications apply even in the worst case condition of coherent analyzer and UUT distortion products. For ACPR levels other than those in this specifications table, the optimum mixer drive level for accuracy is approximately 37 dBm (ACPR/3), where the ACPR is given in (negative) decibels.
RRC weighted, 3.84 MHz noisebandwidth, method = IBW or Fastb
b. The Fast method has a slight decrease in accuracy in only one case: for BTS measurements at 5 MHz offset, the accuracy degrades by 0.01 dB relative to the accuracy shown in this table.
Radio Offset Freq
MS (UE) 5 MHz 0.12 dB At ACPR range of 30 to 36 dBc with optimum mixer levelc
c. To meet this specified accuracy when measuring mobile station (MS) or user equipment (UE) within 3 dB of the required 33 dBc ACPR, the mixer level (ML) must be optimized for accuracy. This opti-mum mixer level is 26 dBm, so the input attenuation must be set as close as possible to the average input power (26 dBm). For example, if the average input power is 6 dBm, set the attenuation to 20 dB. This specification applies for the normal 3.5 dB peak-to-average ratio of a single code. Note that if the mixer level is set to optimize dynamic range instead of accuracy, accuracy errors are nominally doubled.
MS (UE) 10 MHz 0.17 dB At ACPR range of 40 to 46 dBc with optimum mixer leveld
d. ACPR accuracy at 10 MHz offset is warranted when the input attenuator is set to give an average mixer level of 14 dBm.
BTS 5 MHz 0.22 dBb At ACPR range of 42 to 48 dBc with optimum mixer levele
e. In order to meet this specified accuracy, the mixer level must be optimized for accuracy when measur-ing node B Base Transmission Station (BTS) within 3 dB of the required 45 dBc ACPR. This opti-mum mixer level is 22 dBm, so the input attenuation must be set as close as possible to the average input power (22 dBm). For example, if the average input power is 6 dBm, set the attenuation to 16 dB. This specification applies for the normal 10 dB peak-to-average ratio (at 0.01 % probability) for Test Model 1. Note that, if the mixer level is set to optimize dynamic range instead of accuracy, accu-racy errors are nominally doubled.
BTS 10 MHz 0.22 dB At ACPR range of 47 to 53 dBc with optimum mixer leveld
BTS 5 MHz 0.17 dB At 48 dBc non-coherent ACPRf
f. Accuracy can be excellent even at low ACPR levels assuming that the user sets the mixer level to opti-mize the dynamic range, and assuming that the analyzer and UUT distortions are incoherent. When the errors from the UUT and the analyzer are incoherent, optimizing dynamic range is equivalent to mini-mizing the contribution of analyzer noise and distortion to accuracy, though the higher mixer level increases the display scale fidelity errors. This incoherent addition case is commonly used in the indus-try and can be useful for comparison of analysis equipment, but this incoherent addition model is rarely justified.
Chapter 1 87

PSA Series Core Spectrum Analyzer
Power Suite Measurements
Description Specification Supplemental Information
Adjacent Channel Power (ACP)
Dynamic Range RRC weighted, 3.84 MHz noise bandwidth
Noise Correction
Offset Freq Method
Off 5 MHz IBW 74.5 dB (typical)a b
Off 5 MHz Fast 73 dB (typical)a b
Off 10 MHz either 82 dB (typical)a b
On 5 MHz either 81 dB (typical)a c
On 10 MHz either 88 dB (typical)a b
RRC Weighting Accuracyd
White noise in Adjacent Channel 0.00 dB nominal
TOI-induced spectrum 0.004 dB nominal
rms CW error 0.023 dB nominal
a. Agilent measures 100 % of PSAs for dynamic range in the factory production process. This measure-ment requires a near-ideal signal, which is impractical for field and customer use. Because field verifi-cation is impractical, Agilent only gives a typical result. More than 80 % of prototype PSAs met this “typical” specification; the factory test line limit is set commensurate with an on-going 80 % yield to this typical. The ACPR dynamic range is verified only at 2 GHz, where Agilent has the near-perfect signal avail-able. The dynamic range is specified for the optimum mixer drive level, which is different in different instruments and different conditions. The test signal is a 1 DPCH signal.The ACPR dynamic range is the observed range. This typical specification includes no measurement uncertainty.
b. The optimum mixer drive level will be approximately 12 dBm.c. The optimum mixer drive level will be approximately 15 dBm.
88 Chapter 1

PSA Series Core Spectrum Analyzer
Power Suite Measurements
d. 3GPP requires the use of a root-raised-cosine filter in evaluating the ACLR of a device. The accuracy of the passband shape of the filter is not specified in standards, nor is any method of evaluating that accuracy. This footnote discusses the performance of the filter in this instrument. The effect of the RRC filter and the effect of the RBW used in the measurement interact. The analyzer compensates the shape of the RRC filter to accommodate the RBW filter. The effectiveness of this compensation is summa-rized in three ways: White noise in Adj Ch: The compensated RRC filter nominally has no errors if the adjacent channel has a spectrum that is flat across its width. TOI-induced spectrum: If the spectrum is due to third-order intermodulation, it has a distinctive shape. The computed errors of the compensated filter are 0.004 dB for the 470 kHz RBW used for UE testing with the IBW method and also used for all testing with the Fast method, and 0.000 dB for the 30 kHz RBW filter used for BTS testing with the IBW method. The worst error for RBWs between these extremes is 0.05 dB for a 330 kHz RBW filter. rms CW error: This error is a measure of the error in measuring a CW-like spurious component. It is evaluated by computing the root of the mean of the square of the power error across all frequencies within the adjacent channel. The computed rms error of the compensated filter is 0.023 dB for the 470 kHz RBW used for UE testing with the IBW method and also used for all testing with the Fast method, and 0.000 dB for the 30 kHz RBW filter used for BTS testing. The worst error for RBWs between these extremes is 0.057 dB for a 430 kHz RBW filter.
Chapter 1 89

PSA Series Core Spectrum Analyzer
Power Suite Measurements
Description Specifications Supplemental Information
Adjacent Channel Power (ACP)
Radio Std = IS-95 or J-STD-008
Method RBW methoda
a. The RBW method measures the power in the adjacent channels within the defined resolution band-width. The noise bandwidth of the RBW filter is nominally 1.055 times the 3.01 dB bandwidth. There-fore, the RBW method will nominally read 0.23 dB higher adjacent channel power than would a measurement using the integration bandwidth method, because the noise bandwidth of the integration bandwidth measurement is equal to that integration bandwidth. For cmdaOne ACPR measurements using the RBW method, the main channel is measured in a 3 MHz RBW, which does not respond to all the power in the carrier. Therefore, the carrier power is compen-sated by the expected under-response of the filter to a full width signal, of 0.15 dB. But the adjacent channel power is not compensated for the noise bandwidth effect. The reason the adjacent channel is not compensated is subtle. The RBW method of measuring ACPR is very similar to the preferred method of making measurements for compliance with FCC requirements, the source of the specifications for the cdmaOne Spur Close specifications. ACPR is a spot measure-ment of Spur Close, and thus is best done with the RBW method, even though the results will disagree by 0.23 dB from the measurement made with a rectangular passband.
ACPR Relative Accuracy
Offsets < 1300 kHzb
b. The specified ACPR accuracy applies if the measured ACPR substantially exceeds the analyzer dynamic range at the specified offset. When this condition is not met, there are additional errors due to the addition of analyzer spectral components to UUT spectral components. In the worst case at these offsets, the analyzer spectral components are all coherent with the UUT components; in a more typical case, one third of the analyzer spectral power will be coherent with the distortion components in the UUT. Coherent means that the phases of the UUT distortion components and the analyzer distortion components are in a fixed relationship, and could be perfectly in-phase. This coherence is not intuitive to many users, because the signals themselves are usually pseudo-random; nonetheless, they can be coherent.When the analyzer components are 100 % coherent with the UUT components, the errors add in a volt-age sense. That error is a function of the signal (UUT ACPR) to noise (analyzer ACPR dynamic range limitation) ratio, SN, in decibels. The function is error = 20 log(1 + 10SN/20)For example, if the UUT ACPR is 62 dB and the measurement floor is 82 dB, the SN is 20 dB and the error due to adding the analyzer distortion to that of the UUT is 0.83 dB.
0.10 dB
Offsets > 1.85 MHzc 0.10 dB
90 Chapter 1

PSA Series Core Spectrum Analyzer
Power Suite Measurements
c. As in the previous footnote, the specified ACPR accuracy applies if the ACPR measured substantially exceeds the analyzer dynamic range at the specified offset. When this condition is not met, there are additional errors due to the addition of analyzer spectral components to UUT spectral components. Unlike the situation in footnote b, though, the spectral components from the analyzer will be noncoher-ent with the components from the UUT. Therefore, the errors add in a power sense. The error is a func-tion of the signal (UUT ACPR) to noise (analyzer ACPR dynamic range limitation) ratio, SN, in decibels. The function is error = 10 log(1 + 10SN/10). For example, if the UUT ACPR is 75 dB and the measurement floor is 85 dB, the SN ratio is 10 dB and the error due to adding the analyzer's noise to that of the UUT is 0.41 dB.
Fast ACPR Testa
a. Observation conditions for ACP speed:Display Off, signal is Test Model 1 with 64 DPCH, Method set to Fast. Measured with: an IBM com-patible PC with a 3 GHz Pentium 4, running Windows XP Professional Version 2002. The communica-tions medium was PCI GPIB IEEE 488.2. The Test Application Language was .NET - C#. The Application Communication Layer was Agilent T&M Programmer’s Toolkit for Visual Studio (Version 1.1), Agilent I/O Libraries (Version M).
Measurement + Data Transfer Time vs. Std Deviation
0.00
0.05
0.10
0.15
0.20
0.25
0.30
0.35
0.40
0.45
10 100Nominal Measurement and Transfer Time (ms)
Sta
nd
ard
Dev
iati
on
(d
B)
No measurementpersonalities installed
Three measurementpersonalities installed
Sweep Time = 6.2 ms
Chapter 1 91

PSA Series Core Spectrum Analyzer
Power Suite Measurements
Description Specifications Supplemental Information
Multi-Carrier Power
Radio Std - 3GPP W-CDMA RRC weighted, 3.84 MHz noise bandwidth
ACPR Dynamic Range 5 MHz offset Two carriers
70 dB (nominal)
ACPR Accuracy
Two carriers 5 MHz offset, 48 dBc ACPR
0.38 dB (nominal)
ACPR Accuracy
4 carriers
Radio Offset Cohera
a. Coher = no means that the specified accuracy only applies when the distortions of the device under test are not coherent with the third-order distortions of the analyzer. Incoherence is often the case with advanced multicarrier amplifiers built with compensations and predistortions that mostly eliminate coherent third-order effects in the amplifier.
NC UUT ACPR Range MLOptb
b. Optimum mixer level (MLOpt). The mixer level is given by the average power of the sum of the four carriers minus the input attenuation.
BTS 5 MHz no Off 0.24 dB 42 to 48 dB 17 dBm
BTS 5 MHz no On 0.11 dB 42 to 48 dB 20 dBm
ACPR Dynamic Range
4 carriers
5 MHz offset
Noise Correction (NC) off
Noise Correction (NC) on
Nominal DR
66 dB
76 dB
Nominal MLoptb
14 dBm
17 dBm
92 Chapter 1

PSA Series Core Spectrum Analyzer
Power Suite Measurements
Description Specifications Supplemental Information
Power Statistics CCDF
Histogram Resolutiona
a. The Complementary Cumulative Distribution Function (CCDF) is a reformatting of a histogram of the power envelope. The width of the amplitude bins used by the histogram is the histogram resolution. The resolution of the CCDF will be the same as the width of those bins.
0.1 dB
Description Specifications Supplemental Information
Intermod (TOI) Measures the third-order intercept from a signal with two dominant tones
Description Specifications Supplemental Information
Harmonic Distortion
Maximum harmonic number 10th
Results Fundamental power (dBm)Relative harmonics power (dBc)
Description Specifications Supplemental Information
Burst Power
Methods Power above thresholdPower within burst width
Results Output power, averageOutput power, single burstMaximum powerMinimum power within burstBurst width
Chapter 1 93

PSA Series Core Spectrum Analyzer
Power Suite Measurements
Description Specifications Supplemental Information
Spurious Emissions W-CDMA signals
Table-driven spurious signals; search across regions
Dynamic Range, relative 1980 MHz regiona
a. The dynamic range specification is the ratio of the channel power to the power in the region specified. The dynamic range depends on the many measurement settings. These specifications are based on the detector being set to average, the default RBW (1200 kHz), and depend on the mixer level. Mixer level is defined to be the input power minus the input attenuation. This dynamic range specification applies for a mixer level of 8 dBm. Higher mixer levels can give up to 5 dB better dynamic range, but at the expense of compression in the input mixer, which reduces accuracy. The compression behavior of the input mixer is specified in the amplitude section of these specifications.
80.6 dB
82.4 dB (typical)
Sensitivity, absolute 1980 MHz regionb
b. The sensitivity for this region is specified in the default 1200 kHz bandwidth, at a center frequency of 1 GHz.
89.7 dBm
91.7 dBm (typical)
94 Chapter 1
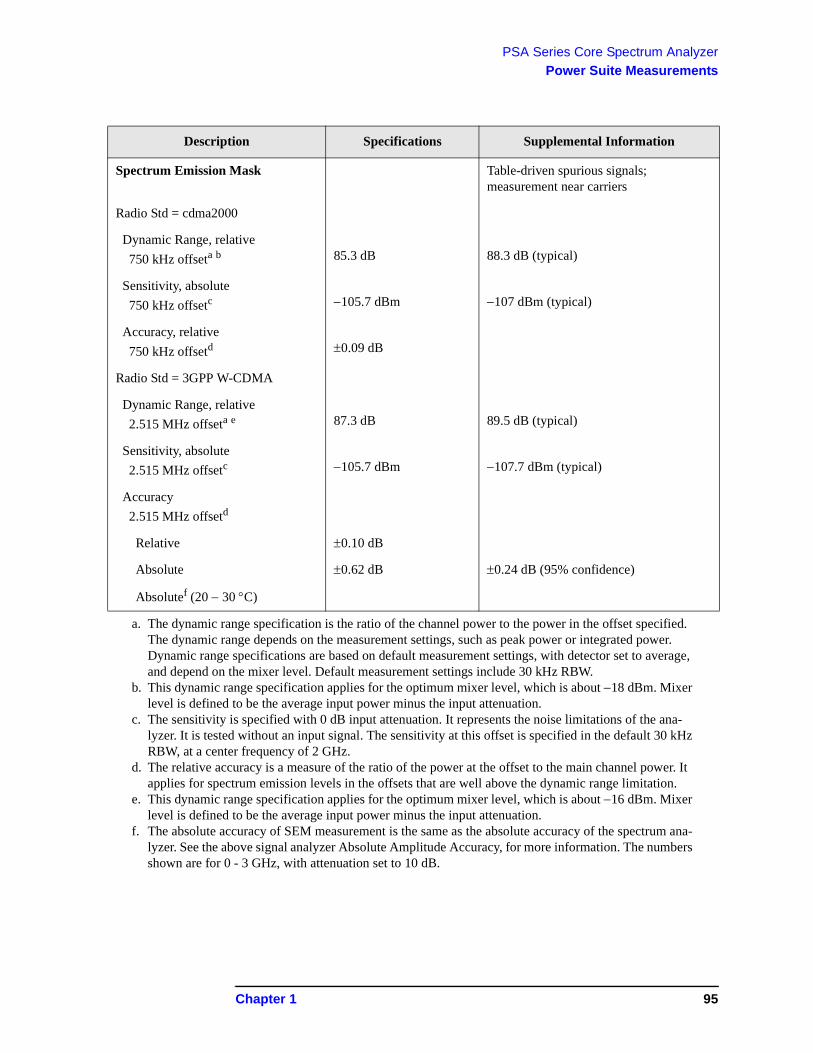
PSA Series Core Spectrum Analyzer
Power Suite Measurements
Description Specifications Supplemental Information
Spectrum Emission Mask Table-driven spurious signals; measurement near carriers
Radio Std = cdma2000
Dynamic Range, relative 750 kHz offseta b
a. The dynamic range specification is the ratio of the channel power to the power in the offset specified. The dynamic range depends on the measurement settings, such as peak power or integrated power. Dynamic range specifications are based on default measurement settings, with detector set to average, and depend on the mixer level. Default measurement settings include 30 kHz RBW.
b. This dynamic range specification applies for the optimum mixer level, which is about 18 dBm. Mixer level is defined to be the average input power minus the input attenuation.
85.3 dB
88.3 dB (typical)
Sensitivity, absolute 750 kHz offsetc
c. The sensitivity is specified with 0 dB input attenuation. It represents the noise limitations of the ana-lyzer. It is tested without an input signal. The sensitivity at this offset is specified in the default 30 kHz RBW, at a center frequency of 2 GHz.
105.7 dBm
107 dBm (typical)
Accuracy, relative 750 kHz offsetd
d. The relative accuracy is a measure of the ratio of the power at the offset to the main channel power. It applies for spectrum emission levels in the offsets that are well above the dynamic range limitation.
0.09 dB
Radio Std = 3GPP W-CDMA
Dynamic Range, relative 2.515 MHz offseta e
e. This dynamic range specification applies for the optimum mixer level, which is about 16 dBm. Mixer level is defined to be the average input power minus the input attenuation.
87.3 dB
89.5 dB (typical)
Sensitivity, absolute 2.515 MHz offsetc
105.7 dBm
107.7 dBm (typical)
Accuracy 2.515 MHz offsetd
Relative 0.10 dB
Absolute
Absolutef (20 30 C)
f. The absolute accuracy of SEM measurement is the same as the absolute accuracy of the spectrum ana-lyzer. See the above signal analyzer Absolute Amplitude Accuracy, for more information. The numbers shown are for 0 - 3 GHz, with attenuation set to 10 dB.
0.62 dB 0.24 dB (95% confidence)
Chapter 1 95

PSA Series Core Spectrum Analyzer
Options
Options
The following options affect instrument specifications.
Option 110: RF/µWave Internal Preamplifier
Option 122: 80 MHz Bandwidth Digitizer
Option 123: Switchable MW Preselector Bypass
Option 124: Y-axis Video Output
Option 140: 40 MHz Bandwidth Digitizer
Option 1DS: RF Internal Preamplifier
Option 202: GSM with EDGE Measurement Personality
Option 204: 1xEV-DO Measurement Personality
Option 210: HSDPA/HSUPA Measurement Personality
Option 212: TD-SCDMA Modulation Analysis Measurement Personality
Option 213: HSDPA/8PSK for TD-SCDMA Modulation Analysis
Option 214: 1xEV-DV Measurement Personality
Option 217 WLAN Measurement Personality
Option 219: Noise Figure Measurement Personality
Option 226: Phase Noise Measurement Personality
Option 233: Measuring Receiver Personality
Option 235: Wide Bandwidth Digitizer External Calibration Wizard
Option 239: EMI Receiver Personality
Option 241: Flexible Digital Modulation Analysis Measurement Personality
Option AYZ: External Mixing
Option B78: cdma2000 Measurement Personality
Option B7J: Digital Demodulation Hardware
Option BAC: cdmaOne Measurement Personality
Option BAE: NADC, PDC Measurement Personalities
Option BAF: W-CDMA Measurement Personality
96 Chapter 1

PSA Series Core Spectrum Analyzer
General
General
Description Specifications Supplemental Information
Calibration Cycle 2 years Recommended
Description Specifications Supplemental Information
Environmental Samples of this product have been tested in accordance with the Agilent Environmental Test Manual and verified to be robust against the environmental stresses of Storage, Transportation and End-use; those stresses include but are not limited to temperature, humidity, shock, vibration, altitude and power line conditions.
Test Methods are aligned with IEC 60068-2 and levels are similar to MIL-PRF-28800F Class 3.
Line power (single phase)
Maximum
100/120V, 50/60/400 Hz220/240V, 50/60 Hz
450 W
Temperature rangeOperatingStorage
Humidity Maximum Operating Minimum Operating Maximum Non-operating
0 C to +55 C40 C to +70 C
95% at 40 C (non-condensing)15% at 40 C (non-condensing)90% at 65 C (non-condensing)
Altitude 0 to 4500 m (14,760 ft.)
Magnetic Susceptibility Degradation of some product specifications can occur in the presence of ambient power frequency magnetic fields of 30 A/m or greater. The product self-recovers and operates as specified when removed or shielded from the ambient magnetic field.
Chapter 1 97

PSA Series Core Spectrum Analyzer
General
Vibration Degradation of some product specifications can occur if this instrument is operated while subjected to continuous vibrations > 0.21 grms in the 5 to 500 Hz frequency range.
Description SpecificationsSupplemental Information
Measurement Speed nominal
Local measurement and display update ratea
a. Factory preset, fixed center frequency, RBW = 1 MHz, and span >10 MHz and 600 MHz, and stop frequency 3 GHz, Auto Align Off.
Sweep points = 101 Sweep points = 401 Sweep points = 601
50/s 50/s 50/s
Remote measurement and GPIB transfer ratea b
b. LO = Fast Tuning, Display Off, 32 bit integer format, markers Off, single sweep, measured with IBM compatible PC with 1.1 GHz Pentium Pro running Windows NT4.0, one meter GPIB cable, National Instruments PCI-GPIC Card and NI-488.2 DLL.
Sweep points = 101 Sweep points = 401 Sweep points = 601
45/s 30/s 25/s
W-CDMA ACLR measurement time
Measurement Time vs. Span
See page 91
See page 29
Description Specifications Supplemental Information
98 Chapter 1

PSA Series Core Spectrum Analyzer
General
Description Specifications Supplemental Information
Displaya
a. The LCD display is manufactured using high precision technology. However, there may be up to six bright points (white, blue, red or green in color) that constantly appear on the LCD screen. These points are normal in the manufacturing process and do not affect the measurement integrity of the product in any way.
Resolution 640 480
Size 213 mm (8.4 in) diagonal (nominal)
Scale
Log Scale 0.1, 0.2, 0.3...1.0, 2.0, 3.0...20 dB per division
Linear Scale 10 % of reference level per division
Units dBm, dBmV, dBmA, Watts, Volts, Amps, dBmV, dBmA, dBmV/m, dBmA/m, dBpT, dBG
Description Specifications Supplemental Information
Volume Control and Headphone Jack
Reserved for future applications
Description Specifications Supplemental Information
Data Storage
Internal 64 MB (nominal)
With Option 115 512 MB (nominal)
With Option 117 512 MB (nominal)
Floppy Drive (10 to 40 C) 3.5” 1.44 MB, MS-DOS‚compatible
Chapter 1 99

PSA Series Core Spectrum Analyzer
General
Description Specifications Supplemental Information
Weight (without options)
Net E4440A, E4443A, E4445A 23 kg (50 lb) (nominal)
Net E4447A, E4446A, E4448A 24 kg (53 lb) (nominal)
Shipping 33 kg (73 lb) (nominal)
Cabinet Dimensions Cabinet dimensions exclude front and rear protrusions.
Height 177 mm (7.0 in)
Width 426 mm (16.8 in)
Length 483 mm (19 in)
100 Chapter 1

PSA Series Core Spectrum Analyzer
Inputs/Outputs (Front Panel)
Inputs/Outputs (Front Panel)
RF Input
E4443A, E4445A, E4440A
E4447A, E4446A, E4448A
Description Specifications Supplemental Information
RF Input Nominal
Connector
E4440A
Standard Type-N female
Option BAB APC 3.5 male
E4443A, E4445A Type-N female
Impedance 50 (see RF Input VSWR)
First LO Emission Levela
a. With 10 dB attenuation and RF preselector ON. Refer to Chapter 20 (Option 123, Switchable MW pre-selector bypass specifications) for the nominal performance of the “First LO emission level” when the preselector is OFF (or bypassed) .See page 323.
Band 0 Bands 1
< 120 dBm < 100 dBm
Description Specifications Supplemental Information
RF Input Nominal
Connector 2.4 mm male
Impedance 50 (see RF Input VSWR)
First LO Emission Levela
a. With 10 dB attenuation and RF preselector ON. Refer to Chapter 20 (Option 123, Switchable MW pre-selector bypass specifications) for the nominal performance of the “First LO emission level” when the preselector is OFF (or bypassed). See page 323.
Band 0 Bands 1
< 120 dBm < 100 dBm
Chapter 1 101

PSA Series Core Spectrum Analyzer
Inputs/Outputs (Front Panel)
Option AYZ External Mixing
Description Specifications Supplemental Information
IF Input
Connector SMA, female
Impedance 50 (nominal)
Center Frequency 321.4 MHz
3 dB bandwidth 60 MHz (nominal)
Maximum Safe Input Level
+10 dBm
Absolute Amplitude Accuracy
2030 °C1.2 dB
055 °C2.5 dB
VSWR <1.5:1 (nominal)
1 dB Gain Compression 0 dBm (nominal)
Mixer Bias Current
Range 10 mA
Resolution 0.01 mA
Accuracy 0.02 mA (nominal)
Output Impedance 477 (nominal)
Mixer Bias Voltage
Range 3.7 V (measured in an open circuit)
102 Chapter 1

PSA Series Core Spectrum Analyzer
Inputs/Outputs (Front Panel)
Description Specifications Supplemental Information
LO Output
Connector SMA, female
Impedance 50 (nominal)
Frequency Range 3.05 to 6.89 GHz
VSWR <2.0:1 (nominal)
Power Out 20 to 30 °C 0 to 55 °C
E4440A
3.05 to 6.0 GHz +14.5 to +18.5 dBm +14.5 to +19.0 dBm
6.0 to 6.89 GHz +13.5 to +18.5 dBm +13.5 to +19.0 dBm
E4447A, E4446A, E4448A
3.05 to 3.2 GHz +14.5 to +20.0 dBm +14.0 to +20.5 dBm
3.2 to 6.0 GHz +14.5 to +18.8 dBm +14.0 to +19.3 dBm
6.0 to 6.89 GHz +14.5 to +18.5 dBm (nominal)
Chapter 1 103

PSA Series Core Spectrum Analyzer
Rear Panel
Rear Panel
Description Specifications Supplemental Information
10 MHz Out (Switched) Switchable On/Off
Connector BNC female
Impedance 50 (nominal)
Output Amplitude 0 dBm (nominal)
Frequency 10 MHz (10 MHz frequency reference accuracy)
Description Specifications Supplemental Information
Ext Ref In
Connector BNC female Note: Analyzer noise sidebands and spurious response performance may be affected by the quality of the external reference used.
Impedance 50 (nominal)
Input Amplitude Range 5 to +10 dBm (nominal)
Input Frequency 1 to 30 MHz (nominal)(selectable to 1 Hz resolution)
Lock range 5 106 of selected external reference input frequency
104 Chapter 1

PSA Series Core Spectrum Analyzer
Rear Panel
Description Specifications Supplemental Information
Trigger In Trigger source may be selected from front or rear.
Connector BNC female
External Trigger Input
Impedance 10 k (nominal)
Trigger Level Range 5 to +5 V 1.5 V (TTL) factory preset
Description Specifications Supplemental Information
Keyboard
Connector 6-pin mini-DIN (PS2) Factory use and for firmware upgrades only.
Description Specifications Supplemental Information
Trigger 1 and Trigger 2 Outputs
Connector BNC female
Trigger 1 Output Impedance Level
HSWP (High = sweeping)50 (nominal)5 V TTL
Trigger 2 Output Reserved for future applications50 (nominal)5V CMOS logic levels
Description Specifications Supplemental Information
Monitor Output
Connector VGA compatible,
Format 15-pin mini D-SUB VGA (31.5 kHz horizontal,60 Hz vertical sync rates, non-interlaced) Analog RGB
Resolution 640 480 pixels
Chapter 1 105

PSA Series Core Spectrum Analyzer
Rear Panel
Description Specifications Supplemental Information
Pre-Sel Tune Out Used by Option AYZ
ConnectorLoad Impedance (dc Coupled)Range
BNC female 110 W (nominal)0 to 10 V (nominal)
Sensitivity External Mixer
1.5V/GHz of tuned LO frequency (nominal)
Description Specifications Supplemental Information
Preselector Tune Voltage
1.5 V/GHz of tuned LO frequency (nominal)
Description Specifications Supplemental Information
Noise Source Drive Output Used by Option 219
Connector BNC female
Output Voltage
On 28.0 0.1 V 60 mA maximum
Off < 1 V
106 Chapter 1

PSA Series Core Spectrum Analyzer
Rear Panel
321.4 MHz IF Output
Description Specifications Supplemental Information
GPIB Interface
Connector IEEE-488 bus connector
GPIB Codes SH1, AH1, T6, SR1, RL1, PP0, DC1, C1, C2, C3 and C28, DT1, L4, C0
Serial Interface
Connector 9-pin D-SUB male Factory use only
Parallel Interface
Connector 25-pin D-SUB female Printer port only
LAN TCP/IP Interface RJ45 Ethertwist
USB 2.0 Interface (Option 111)
USB Type B connector Slave mode only, device-side, USB 2.0 compliant
Description Specifications Supplemental Information
321.4 MHz IF Output
Connector SMA female
Impedance 50 (nominal)
Frequency 321.4 MHz (nominal)
Conversion Gain
Low band (3 Hz to 3.05 GHz) +2 to +4 dB (nominal)
High / mm band (2.85 GHz to analyzer upper frequency limit)
–6 to –8 dB (nominal)
High / mm band (2.85 GHz to analyzer upper frequency limit) Preselector off (Option 123)
–9 to –17 dB (nominal)
Bandwidth (–3 dB)
Low band (3 Hz to 3.05 GHz) 40 MHz or 60 MHza (nominal)
High band (2.85 to 26.5 GHz) 35 to 70 MHzb (nominal)
mm band (26.5 to 50 GHz) 40 MHz or 60 MHza (nominal)
Chapter 1 107

PSA Series Core Spectrum Analyzer
Rear Panel
High / mm band (2.85 GHz to analyzer upper frequency limit) Preselector off (Option 123)
240 MHz (nominal)
External Mixing Dependent on mixer used. See Mixer specs.
a. 40 MHz standard, 60 MHz with option 122 or 140 installed in the instrument. When option 122 or 140 is installed, the IF Output port signal is now centered at 300 MHz, and the BW of the output is centered at 300 MHz is approximately 95 MHz.
b. The bandwidth in the microwave preselected bands increases approximately monotonically between the lowest and highest tuned frequencies. See “nominal Bandwidth” on page 295 of the PSA Specifica-tions Guide.
Description Specifications Supplemental Information
108 Chapter 1

PSA Series Core Spectrum Analyzer
Rear Panel
Regulatory Information
This product is designed for use in Installation Category II and Pollution Degree 2 per IEC 61010 2nd ed, and 664 respectively.
This product has been designed and tested in accordance with IEC Publication 61010 2nd ed, Safety Requirements for Electronic Measuring Apparatus, and has been supplied in a safe condition. The instruction documentation contains information and warnings which must be followed by the user to ensure safe operation and to maintain the product in a safe condition.
Declaration of Conformity
A copy of the Manufacturer’s European Declaration of Conformity for this instrument can be obtained by contacting your local Agilent Technologies sales representative.
The CE mark is a registered trademark of the European Community (if accompanied by a year, it is the year when the design was proven). This product complies with all relevant directives.
ICES/NMB-001 “This ISM device complies with Canadian ICES-001.”
“Cet appareil ISM est conforme a la norme NMB du Canada.”
ISM 1-A (GRP.1 CLASS A)
This is a symbol of an Industrial Scientific and Medical Group 1 Class A product. (CISPR 11, Clause 4)
The CSA mark is the Canadian Standards Association. This product complies with the relevant safety requirements.
The C-Tick mark is a registered trademark of the Australian/New Zealand Spectrum Management Agency. This product complies with the relevant EMC regulations.
This equipment is Class A suitable for professional use and is for use in electromagnetic environments outside of the home.
This product complies with the WEEE Directive (2002/96/EC) marking requirements. The affixed label indicates that you must not discard this electrical/ electronic product in domestic household waste.
Product Category: With reference to the equipment types in the WEEE Directive Annex I, this product is classed as a “Monitoring and Control instrumentation” product.
Do not dispose in domestic household waste.
To return unwanted products, contact your local Agilent office, or see www.agilent.com/environment/product/ for more information.
Chapter 1 109
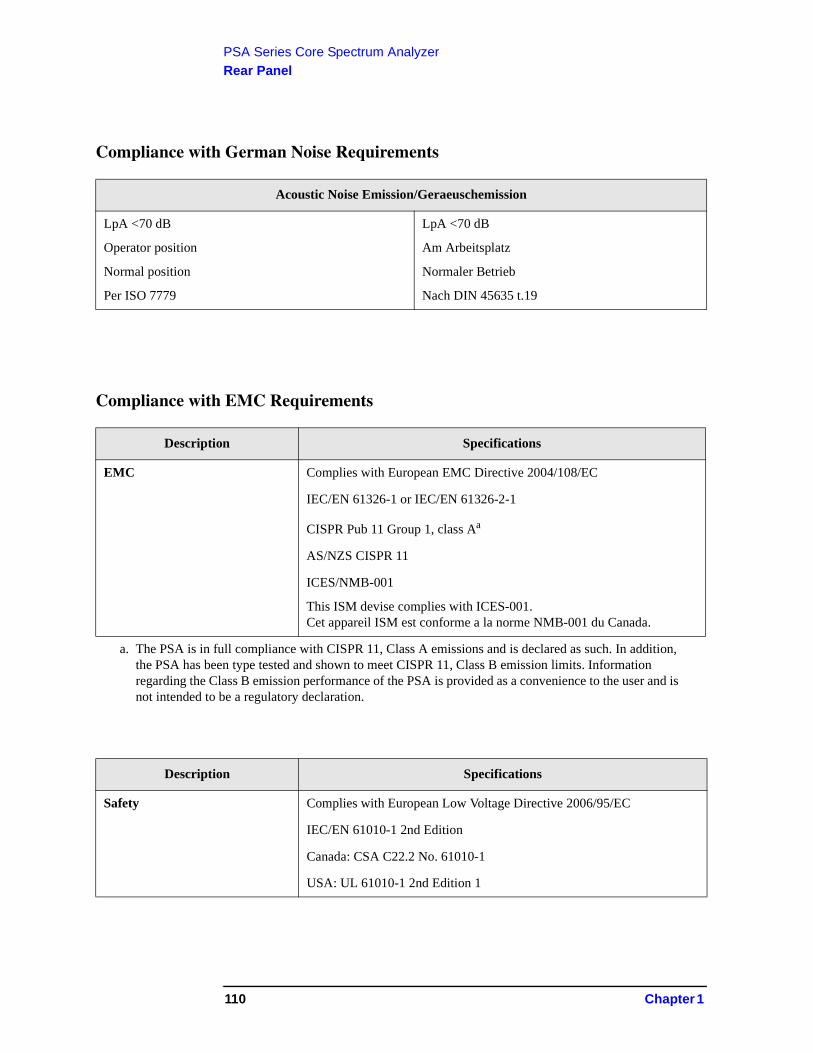
PSA Series Core Spectrum Analyzer
Rear Panel
Compliance with German Noise Requirements
Compliance with EMC Requirements
Acoustic Noise Emission/Geraeuschemission
LpA <70 dB
Operator position
Normal position
Per ISO 7779
LpA <70 dB
Am Arbeitsplatz
Normaler Betrieb
Nach DIN 45635 t.19
Description Specifications
EMC Complies with European EMC Directive 2004/108/EC
IEC/EN 61326-1 or IEC/EN 61326-2-1
CISPR Pub 11 Group 1, class Aa
a. The PSA is in full compliance with CISPR 11, Class A emissions and is declared as such. In addition, the PSA has been type tested and shown to meet CISPR 11, Class B emission limits. Information regarding the Class B emission performance of the PSA is provided as a convenience to the user and is not intended to be a regulatory declaration.
AS/NZS CISPR 11
ICES/NMB-001
This ISM devise complies with ICES-001.Cet appareil ISM est conforme a la norme NMB-001 du Canada.
Description Specifications
Safety Complies with European Low Voltage Directive 2006/95/EC
IEC/EN 61010-1 2nd Edition
Canada: CSA C22.2 No. 61010-1
USA: UL 61010-1 2nd Edition 1
110 Chapter 1

PSA Series Core Spectrum Analyzer
Rear Panel
Description Specifications Supplemental Information
Immunity Testing
Radiated Immunity
This product complies with the radiated electromagnetic field immunity requirement in IEC/EN 61326 using performance criteria B. Degradation of some product specifications can occur in the presence of ambient electromagnetic fields. The product self-recovers and operates as specified when the ambient field is removed.
Testing was done at 3 V/m according to IEC 61000-4-3/2002. When the analyzer tuned frequency is identical to the immunity test signal frequency, there may be signals of up to 60 dBm displayed on the screen.
When radiated at the immunity test frequency of 321.4 MHZ selected RBW the displayed average noise level may rise by approximately 10 dB.
Electrostatic Discharge
Air discharges up to 8 kV were applied according to IEC 61000-4-2/2001. Discharges to center pins of any of the connectors may cause damage to the associated circuitry.
Chapter 1 111

PSA Series Core Spectrum Analyzer
Rear Panel
112 Chapter 1

2 Phase Noise Measurement Personality
This chapter contains specifications for the PSA series, Option 226, Phase Noise measurement personality.
113
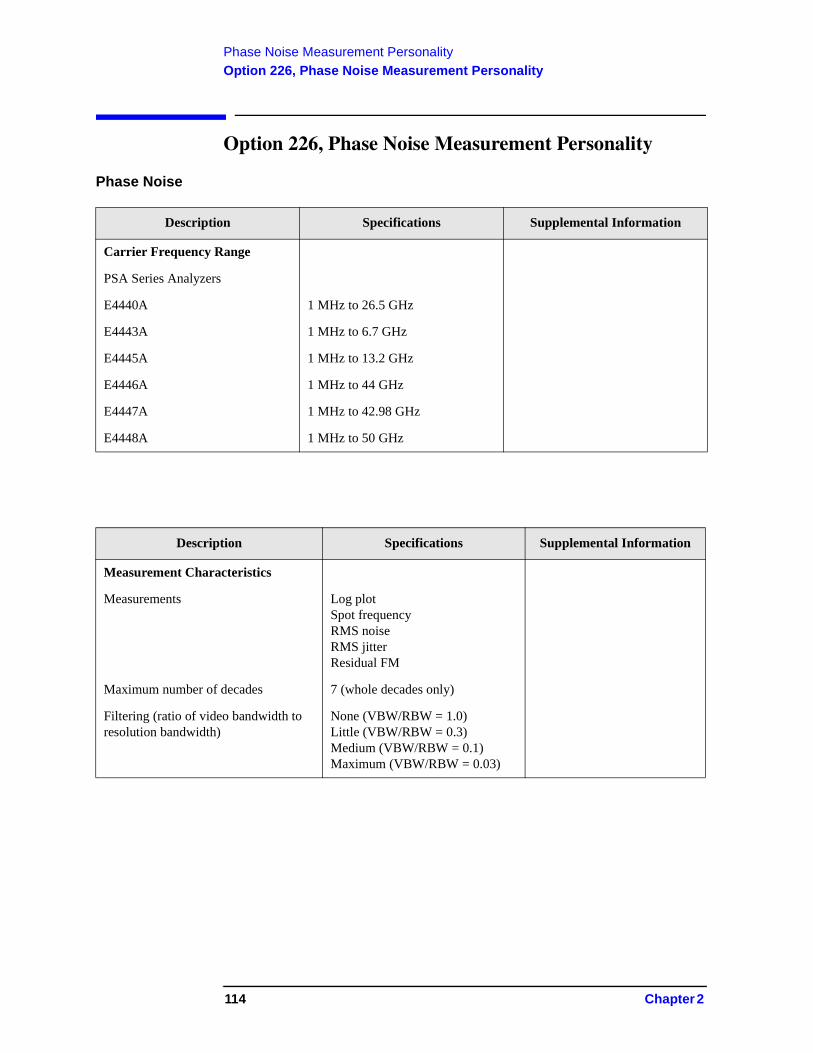
Phase Noise Measurement Personality
Option 226, Phase Noise Measurement Personality
Option 226, Phase Noise Measurement Personality
Phase Noise
Description Specifications Supplemental Information
Carrier Frequency Range
PSA Series Analyzers
E4440A 1 MHz to 26.5 GHz
E4443A 1 MHz to 6.7 GHz
E4445A 1 MHz to 13.2 GHz
E4446A 1 MHz to 44 GHz
E4447A 1 MHz to 42.98 GHz
E4448A 1 MHz to 50 GHz
Description Specifications Supplemental Information
Measurement Characteristics
Measurements Log plot Spot frequencyRMS noiseRMS jitterResidual FM
Maximum number of decades 7 (whole decades only)
Filtering (ratio of video bandwidth to resolution bandwidth)
None (VBW/RBW = 1.0)Little (VBW/RBW = 0.3)Medium (VBW/RBW = 0.1)Maximum (VBW/RBW = 0.03)
114 Chapter 2

Phase Noise Measurement Personality
Option 226, Phase Noise Measurement Personality
Description Specifications Supplemental Information
Offset Frequency
Range 10 Hz to 100 MHz The minimum offset is limited to 10 times the narrowest RBW of the analyzer.
Description Specifications Supplemental Information
Measurement Accuracy
Amplitude Accuracya (carrier frequency 1 MHz to 3.0 GHz)
a. Amplitude accuracy is derived from analyzer specification and characteristics. It is based on a 1 GHz signal at 0 dBm while running the log plot measurement with all other measurement and analyzer set-tings at their factory defaults.
0.29 dB b
b. This does not include the effect of system noise floor. This error is a function of the signal (phase noise of the DUT) to noise (analyzer noise floor due to phase noise and thermal noise) ratio, SN, in decibels.
The function is: error = 10 log(1 + 10SN/10).
For example, if the phase noise being measured is 10 dB above the measurement floor, the error due to adding the analyzer’s noise to the UUT is 0.41 dB.
Chapter 2 115
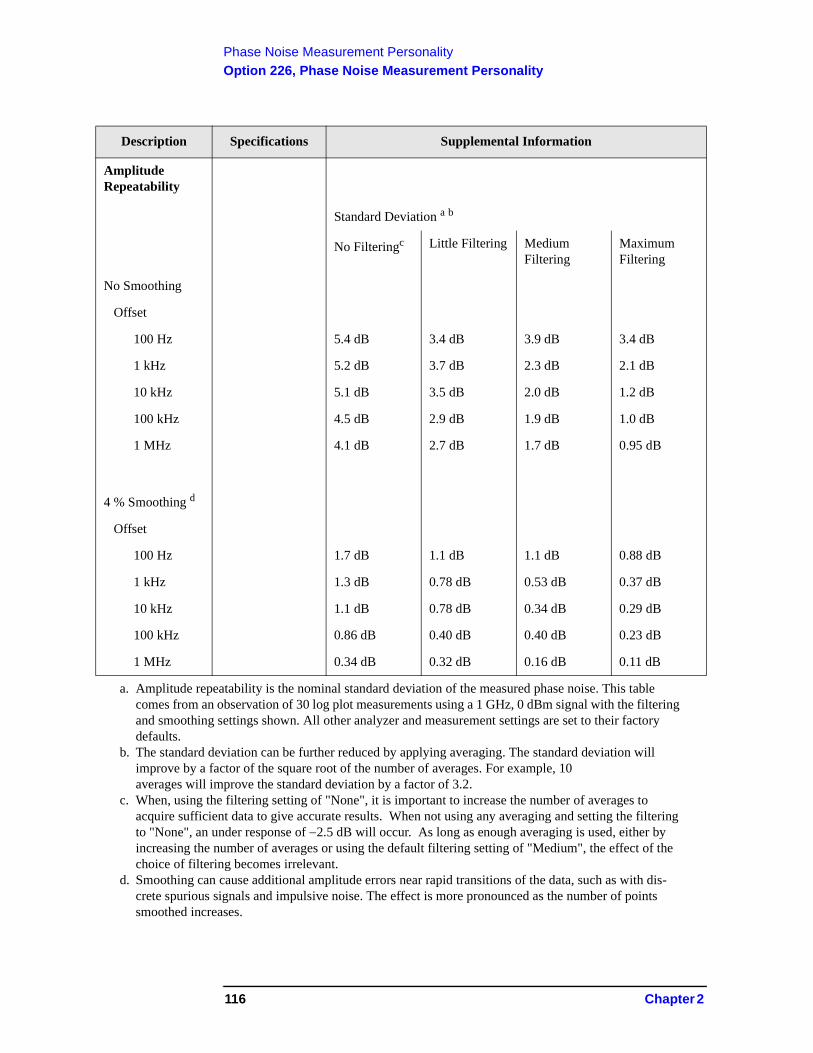
Phase Noise Measurement Personality
Option 226, Phase Noise Measurement Personality
Description Specifications Supplemental Information
Amplitude Repeatability
Standard Deviation a b
a. Amplitude repeatability is the nominal standard deviation of the measured phase noise. This table comes from an observation of 30 log plot measurements using a 1 GHz, 0 dBm signal with the filtering and smoothing settings shown. All other analyzer and measurement settings are set to their factory defaults.
b. The standard deviation can be further reduced by applying averaging. The standard deviation will improve by a factor of the square root of the number of averages. For example, 10 averages will improve the standard deviation by a factor of 3.2.
No Filteringc
c. When, using the filtering setting of "None", it is important to increase the number of averages to acquire sufficient data to give accurate results. When not using any averaging and setting the filtering to "None", an under response of 2.5 dB will occur. As long as enough averaging is used, either by increasing the number of averages or using the default filtering setting of "Medium", the effect of the choice of filtering becomes irrelevant.
Little Filtering Medium Filtering
Maximum Filtering
No Smoothing
Offset
100 Hz 5.4 dB 3.4 dB 3.9 dB 3.4 dB
1 kHz 5.2 dB 3.7 dB 2.3 dB 2.1 dB
10 kHz 5.1 dB 3.5 dB 2.0 dB 1.2 dB
100 kHz 4.5 dB 2.9 dB 1.9 dB 1.0 dB
1 MHz 4.1 dB 2.7 dB 1.7 dB 0.95 dB
4 % Smoothing d
d. Smoothing can cause additional amplitude errors near rapid transitions of the data, such as with dis-crete spurious signals and impulsive noise. The effect is more pronounced as the number of points smoothed increases.
Offset
100 Hz 1.7 dB 1.1 dB 1.1 dB 0.88 dB
1 kHz 1.3 dB 0.78 dB 0.53 dB 0.37 dB
10 kHz 1.1 dB 0.78 dB 0.34 dB 0.29 dB
100 kHz 0.86 dB 0.40 dB 0.40 dB 0.23 dB
1 MHz 0.34 dB 0.32 dB 0.16 dB 0.11 dB
116 Chapter 2

Phase Noise Measurement Personality
Option 226, Phase Noise Measurement Personality
Description Specifications Supplemental Information
Frequency Offset Accuracya
a. The frequency offset error in octaves causes an additional amplitude accuracy error proportional to the product of the frequency error and slope of the phase noise. For example, a 0.01 octave frequency error combined with an 18 dB/octave slope gives 0.18 dB additional amplitude error.
1.4 % 0.02 octave
Nominal Phase Noise Normalized to 1 Hz Versus Offset Frequency a
a. Unlike the other curves, which are measured results from the measurement of excellent sources, the CF = 50 GHz curve is the predicted, not observed, phase noise, computed from the 25.2 GHz observation. See the footnotes in the Frequency Stability section in the Frequency chapter for the details of phase noise performance versus center frequency.
Nominal Phase Noise at Different Center Frequencies
with RBW Selectivity Curves, (f) Optimized Versus f
-160
-150
-140
-130
-120
-110
-100
-90
-80
-70
-60
0.1 1 10 100 1000 10000
Offset Frequency (kHz)
SS
B P
has
e N
ois
e (d
Bc/
Hz)
CF=600 MHz
CF=50 GHz*
CF=10.2 GHz
CF=25.2 GHz
RBW=100 Hz RBW=1 KHz RBW=10 kHz RBW=100 kHz
Chapter 2 117

Phase Noise Measurement Personality
Option 226, Phase Noise Measurement Personality
118 Chapter 2

3 Noise Figure Measurement Personality
This chapter contains specifications for the PSA series, Option 219, Noise Figure Measurement Personality.
119

Noise Figure Measurement Personality
Option 219, Noise Figure Measurement Personality
Option 219, Noise Figure Measurement Personality
Description Specifications Supplemental Information
Noise Figure Uncertainty Calculatora
a. The figures given in the table are for the uncertainty added by the PSA instrument only. To compute the total uncertainty for your noise figure measurement, you need to take into account other factors includ-ing: DUT NF, Gain, Gain Uncertainty and Match; Noise source ENR uncertainty and Match. The com-putations can be performed with the uncertainty calculator included with the Noise Figure Measurement Personality. Go to Mode Setup then select Uncertainty Calculator. Similar calculators are also available on the Agilent web site; go to http://www.agilent.com/find/nfu.
200 kHz to 10 MHzb
b. See the FAQ for current information on the availability of noise sources for this frequency range. To find the FAQ, choose any PSA Series model number from www.agilent.com/find/psa, and look for the FAQ link under “In the Library”.
Using internal preamp (Option 1DS)
Noise Source ENR Measurement Range (nominal)
Instrument
Uncertainty a (nominal)
4 7 dB 0 20 dB 0.05 dB
12 17 dB 0 30 dB 0.05 dB
20 22 dB 0 35 dB 0.10 dB
10 to 30 MHz Using internal preamp (Option 110)
Noise Source ENR Measurement Range (nominal)
Instrument
Uncertainty a (nominal)
4 7 dB 0 20 dB 0.05 dB
12 17 dB 0 30 dB 0.05 dB
20 22 dB 0 35 dB 0.10 dB
10 MHz to 3 GHz Using internal preamp (Option 1DS), and RBW=1 MHz
120 Chapter 3

Noise Figure Measurement Personality
Option 219, Noise Figure Measurement Personality
Description Specifications Supplemental Information
Noise Source ENR Measurement Range
Instrument
Uncertaintya
a. “Instrument Uncertainty” is defined for noise figure analysis as uncertainty due to relative amplitude uncertainties encountered in the analyzer when making the measurements required for a noise figure or gain computation. The relative amplitude uncertainty is given by the relative display scale fidelity, also known as incremental log fidelity. The uncertainty of the analyzer is multiplied within the computation by an amount that depends on the Y factor to give the total uncertainty of the noise figure or gain mea-surement.See Agilent App Note 57-2, literature number 5952-3706E for details on the use of this specification. Jitter (amplitude variations) will also affect the accuracy of results. The standard deviation of the mea-sured result decreases by a factor of the square root of the Resolution Bandwidth used and by the square root of the number of averages. PSA uses the 1 MHz resolution Bandwidth as default since this is the widest bandwidth with uncompromised accuracy.
4 7 dB 0 20 dB 0.05 dB
12 17 dB 0 30 dB 0.05 dB
20 22 dB 0 35 dB 0.10 dB
30 MHz to 3 GHz Using internal preamp (Option 110) and RBW=1 MHz
Noise Source ENR Measurement Range
Instrument
Uncertainty a
4 7 dB 0 20 dB 0.05 dB
12 17 dB 0 30 dB 0.05 dB
20 22 dB 0 35 dB 0.10 dB
Chapter 3 121
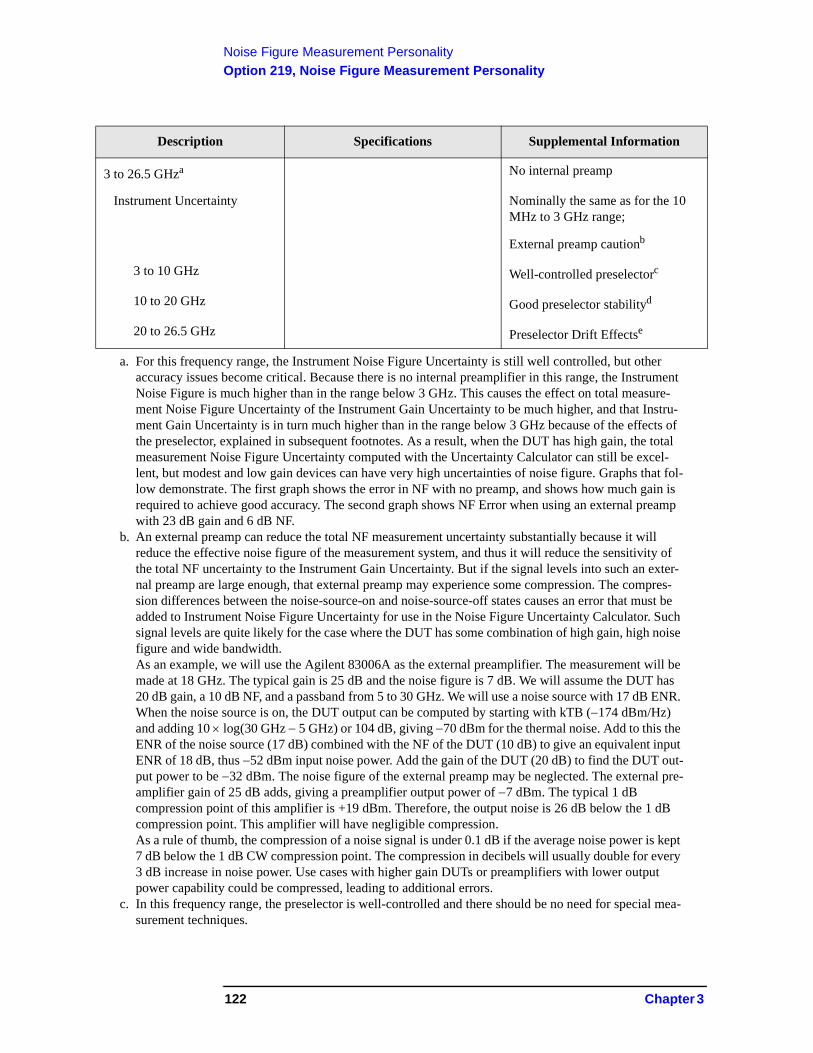
Noise Figure Measurement Personality
Option 219, Noise Figure Measurement Personality
Description Specifications Supplemental Information
3 to 26.5 GHza
a. For this frequency range, the Instrument Noise Figure Uncertainty is still well controlled, but other accuracy issues become critical. Because there is no internal preamplifier in this range, the Instrument Noise Figure is much higher than in the range below 3 GHz. This causes the effect on total measure-ment Noise Figure Uncertainty of the Instrument Gain Uncertainty to be much higher, and that Instru-ment Gain Uncertainty is in turn much higher than in the range below 3 GHz because of the effects of the preselector, explained in subsequent footnotes. As a result, when the DUT has high gain, the total measurement Noise Figure Uncertainty computed with the Uncertainty Calculator can still be excel-lent, but modest and low gain devices can have very high uncertainties of noise figure. Graphs that fol-low demonstrate. The first graph shows the error in NF with no preamp, and shows how much gain is required to achieve good accuracy. The second graph shows NF Error when using an external preamp with 23 dB gain and 6 dB NF.
No internal preamp
Instrument Uncertainty Nominally the same as for the 10 MHz to 3 GHz range;
External preamp cautionb
b. An external preamp can reduce the total NF measurement uncertainty substantially because it will reduce the effective noise figure of the measurement system, and thus it will reduce the sensitivity of the total NF uncertainty to the Instrument Gain Uncertainty. But if the signal levels into such an exter-nal preamp are large enough, that external preamp may experience some compression. The compres-sion differences between the noise-source-on and noise-source-off states causes an error that must be added to Instrument Noise Figure Uncertainty for use in the Noise Figure Uncertainty Calculator. Such signal levels are quite likely for the case where the DUT has some combination of high gain, high noise figure and wide bandwidth.As an example, we will use the Agilent 83006A as the external preamplifier. The measurement will be made at 18 GHz. The typical gain is 25 dB and the noise figure is 7 dB. We will assume the DUT has 20 dB gain, a 10 dB NF, and a passband from 5 to 30 GHz. We will use a noise source with 17 dB ENR. When the noise source is on, the DUT output can be computed by starting with kTB (174 dBm/Hz) and adding 10 log(30 GHz 5 GHz) or 104 dB, giving 70 dBm for the thermal noise. Add to this the ENR of the noise source (17 dB) combined with the NF of the DUT (10 dB) to give an equivalent input ENR of 18 dB, thus 52 dBm input noise power. Add the gain of the DUT (20 dB) to find the DUT out-put power to be 32 dBm. The noise figure of the external preamp may be neglected. The external pre-amplifier gain of 25 dB adds, giving a preamplifier output power of 7 dBm. The typical 1 dB compression point of this amplifier is +19 dBm. Therefore, the output noise is 26 dB below the 1 dB compression point. This amplifier will have negligible compression.As a rule of thumb, the compression of a noise signal is under 0.1 dB if the average noise power is kept 7 dB below the 1 dB CW compression point. The compression in decibels will usually double for every 3 dB increase in noise power. Use cases with higher gain DUTs or preamplifiers with lower output power capability could be compressed, leading to additional errors.
3 to 10 GHz Well-controlled preselectorc
c. In this frequency range, the preselector is well-controlled and there should be no need for special mea-surement techniques.
10 to 20 GHz Good preselector stabilityd
20 to 26.5 GHz Preselector Drift Effectse
122 Chapter 3

Noise Figure Measurement Personality
Option 219, Noise Figure Measurement Personality
d. In this frequency range, the preselector usually requires no special measurement techniques in a lab environment. But if the temperature changes by a few degrees, or the analyzer frequency is swept or changed across many gigahertz, there is a small risk that the preselector will not be centered well enough for good measurements.
e. In this frequency range, the preselector behavior is not warranted. There is a modest risk that the prese-lector will not be centered well enough for good measurements. This risk may be reduced but not elim-inated by using the analyzer at room temperature, limiting the span swept to a few gigahertz, and not changing the operating frequency range for many minutes.
Chapter 3 123

Noise Figure Measurement Personality
Option 219, Noise Figure Measurement Personality
Description Specifications Supplemental Information
3 to 26.5 GHz Using internal preamp (Option 110)
Instrument Uncertainty Nominally the same as for the 30 MHz to 3 GHz range
3 to 10 GHz Well-controlled preselector a
a. In this frequency range, the preselector is well-controlled and there should be no need for special mea-surement techniques.
10 to 20 GHz Good preselector stability b
b. In this frequency range, the preselector usually requires no special measurement techniques in a lab environment. But if the temperature changes by a few degrees, or the analyzer frequency is swept or changed across many gigahertz, there is a small risk that the preselector will not be centered well enough for good measurements.
20 to 26.5 GHz Preselector Drift Effects c
c. In this frequency range, the preselector behavior is not warranted. There is a modest risk that the prese-lector will not be centered well enough for good measurements. This risk may be reduced but not elim-inated by using the analyzer at room temperature, limiting the span swept to a few gigahertz, and not changing the operating frequency range for many minutes.
26.5 to 50 GHz Instrument Uncertainty d
d. The Instrument Uncertainty performance, itself, becomes less significant in these frequency regions when other factors such as Instrument Noise Figure (see graphs for E4448A w/Option 110) tend to dominate the accuracy of the measurement. However, effective noise figure and gain measurements are still achievable, especially when the DUT has reasonably high gain. In order to mitigate the effect of increased instrument noise figure, techniques such as averaging (see the footnote on “Instrument Uncertainty” on page 121) and utilization of higher ENR sources, can be used. However, care must be taken to avoid signal levels that lead to compression.
124 Chapter 3

Noise Figure Measurement Personality
Option 219, Noise Figure Measurement Personality
Computed Measurement NF Uncertainty vs. DUT Gain, >3 GHz Non-warranted Frequency Range, No Internal Preamplifier
Assumptions: Measurement Frequency 12 GHz, Instrument NF =26.5 dB, Instrument VSWR = 1.4, Instrument Gain Uncertainty = 2.2 dB, Instrument NF Uncertainty = 0.05 dB, Agilent 346B Noise Source with Uncertainty = 0.2 dB, Source VSWR = 1.25, DUT input/output VSWR = 1.5.
Computed Measurement NF Uncertainty vs. DUT Gain, >3 GHz Non-warranted Frequency Range, No Internal Preamplifier
Assumptions: Same as above, with the addition of an external preamp. With an external preamp, the preamp/analyzer combination NF is 7.93 dB; the external preamp alone has a gain of 23 dB and a NF of 6 dB. Instrument VSWR is now that of the external preamp; VSWR = 2.6.
0
1
2
3
4
-10 -5 0 5 10 15 20 25 30 35
DUT Gain (dB)
Mea
s N
F U
nce
rt (
dB
)
NF = 5 dB
NF = 10 dB
NF = 15 dB
Chapter 3 125

Noise Figure Measurement Personality
Option 219, Noise Figure Measurement Personality
Description Specifications Supplemental Information
Gain
200 kHz to 10 MHza
a. See the FAQ for current information on the availability of noise sources for this frequency range. To find the FAQ, choose any PSA Series model number from www.agilent.com/find/psa, and look for the FAQ link under “In the Library.”
Using internal preamp (Option 1DS)
Noise Source ENR Measurement Range (nominal)
Instrument
Uncertaintyb (nominal)
b. See the “Instrument Uncertainty” footnote a on page 122
4 7 dB 20 to 40 dB 0.17 dB
12 17 dB 20 to 40 dB 0.17 dB
20 22 dB 20 to 40 dB 0.17 dB
10 MHz to 3 GHz Using internal preamp (Option 1DS)
Noise Source ENR Measurement Range
Instrument
Uncertaintyb
4.5 6.5 dB 20 to 40 dB 0.17 dB
12 17 dB 20 to 40 dB 0.17 dB
20 22 dB 20 to 40 dB 0.17 dB
30 MHz to 3 GHz Using internal preamp (Option 110)
Noise Source ENR Measurement Range
Instrument
Uncertaintyb
4.5 6.5 dB 20 to 40 dB 0.17 dB
12 17 dB 20 to 40 dB 0.17 dB
20 22 dB 20 to 40 dB 0.17 dB
3 to 26.5 GHzc
Instrument Uncertainty 2.2 dB (nominal)d for Measurement Range 20 to 40 dB
26.5 to 50 GHz See the uncertainty footnote on page 122.
126 Chapter 3

Noise Figure Measurement Personality
Option 219, Noise Figure Measurement Personality
c. See footnotes b, c, d and e for this frequency range in the Noise Figure section on page 122d. The performance shown would apply when there is a long time between the calibration step and the
DUT-measurement step in a NF or Gain measurement. Under special circumstances of small changes in frequency (such as spot frequency measurements) and short time periods between the calibration time and the measurement time, this error source becomes much smaller, approaching the Instrument Uncertainty shown for the 10 MHz to 3 GHz frequency range. These special circumstances would be frequency span ranges of under 1 GHz, with that frequency range unchanged for 30 minutes, and the time between the calibration step and the DUT measurement step held to less than 10 minutes.
Description Specifications Supplemental Information
Noise Figure Uncertainty Calculatora
a. Noise figure uncertainty calculations require the parameters shown in order to calculate the uncertainty.
Noise Figure Instrument Uncertainty See Noise Figure
Gain Instrument Uncertainty See Gain
Instrument Noise Figure See graphs, Nominal Noise FigureDANL +176.15, nominalb
b. Nominally, the noise figure of the spectrum analyzer is given by the DANL (displayed average noise level) minus kTB (173.88 dB in a 1 Hz bandwidth at 25 °C) plus 2.51 dB (the effect of log averaging used in DANL verifications) minus 0.24 dB (the ratio of the noise bandwidth of the 1 Hz RBW filter with which DANL is specified to a 1 Hz noise bandwidth for which kTB is given). The actual NF will vary from the nominal due to frequency response errors.
Instrument Input Match See graphs, Nominal VSWR
Nominal Instrument Noise Figure
Nominal Instrument Noise Figure 200 kHz to 10 MHzOption 1DS Preamp On
4
5
6
7
0 1 2 3 4 5 6 7 8 9 10
Freq (MHz)
NF
(dB
)
Chapter 3 127

Noise Figure Measurement Personality
Option 219, Noise Figure Measurement Personality
Nominal Instrument Noise Figure 10 MHz to 3 GHzOption 1DS Preamp On
Nominal Instrument Noise Figure
Nominal Instrument Noise Figure 10 MHz to 3 GHzOption 110 Preamp On
Nominal Instrument Noise Figure
4
5
67
8
9
10
0 1 2 3
Freq (GHz)
NF
(dB
)
4
6
8
10
12
14
16
0 1 2 3
Freq (GHz)
NF
(d
B)
1 MHz
128 Chapter 3

Noise Figure Measurement Personality
Option 219, Noise Figure Measurement Personality
Nominal Instrument Noise Figure 3 to 26.5 GHzNo Preamp
Nominal Instrument Noise Figure
Nominal Instrument Noise Figure 3 to 50 GHzOption 110 Preamp On
Nominal Instrument Noise Figure
24
26
2830
32
34
3 8 13 18 23
Freq (GHz)
NF
(dB
)
0
5
10
15
20
25
30
35
3 13 23 33 43Freq (GHz)
NF
(dB
)
Chapter 3 129

Noise Figure Measurement Personality
Option 219, Noise Figure Measurement Personality
Nominal Instrument Input VSWR 200 kHz to 10 MHz; Preamp 1DS On, Attenuation = 0 dBVSWR of two instruments shown. One was an E4440A and one was an E4448A (bold trace). All PSA models have similar VSWR behavior in this frequency range.
Nominal Instrument Noise Figure
Nominal Instrument Input VSWR 10 MHz to 3 GHz; Preamp 1DS On, Attenuation = 0 dBVSWR of six instruments shown. Three graphs are representative of E4440/3/5 models, and three of E4446/8 models (bold traces).
Nominal Instrument Noise Figure
1.001.051.101.15
1.201.251.301.351.40
0.0 1.0 2.0 3.0 4.0 5.0 6.0 7.0 8.0 9.0 10.0
Freq (MHz)
VS
WR
1.00
1.20
1.40
1.601.80
2.00
2.20
2.40
2.60
0 0.5 1 1.5 2 2.5 3
Freq (GHz)
VS
WR
E4448A
E4440A
130 Chapter 3
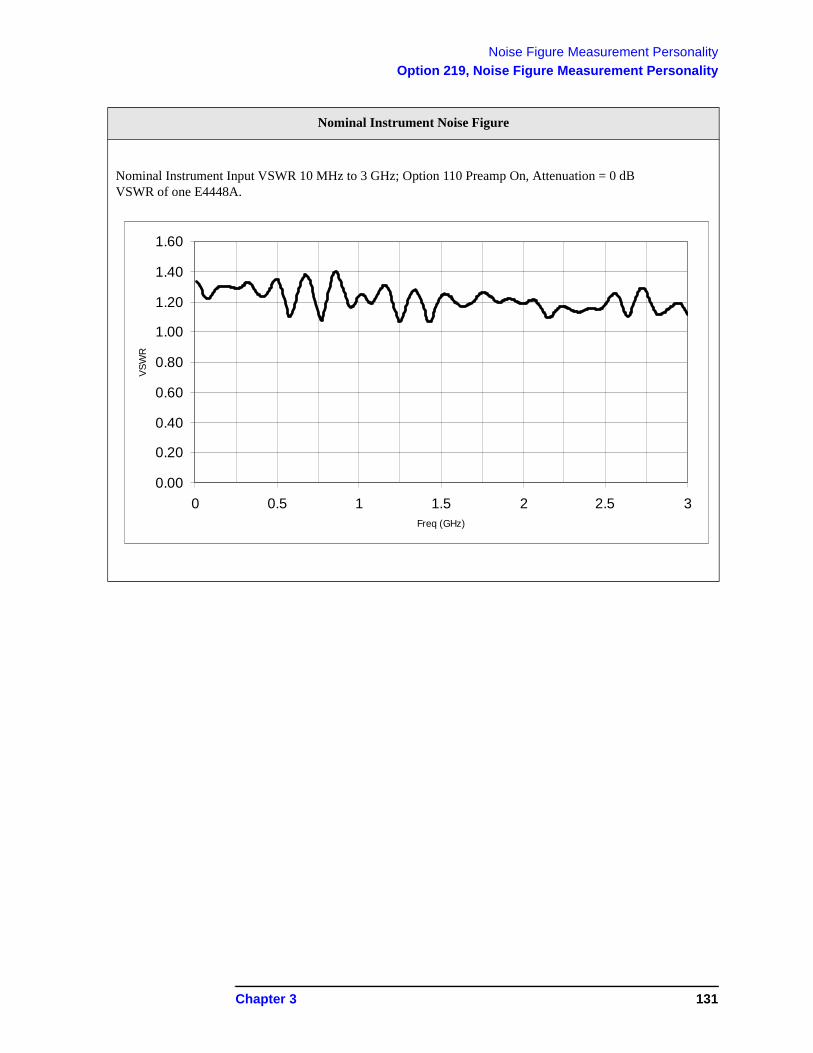
Noise Figure Measurement Personality
Option 219, Noise Figure Measurement Personality
Nominal Instrument Input VSWR 10 MHz to 3 GHz; Option 110 Preamp On, Attenuation = 0 dBVSWR of one E4448A.
Nominal Instrument Noise Figure
0.00
0.20
0.40
0.60
0.80
1.00
1.20
1.40
1.60
0 0.5 1 1.5 2 2.5 3Freq (GHz)
VS
WR
Chapter 3 131

Noise Figure Measurement Personality
Option 219, Noise Figure Measurement Personality
Nominal Instrument Input VSWR
Nominal Instrument Input VSWR 3 to 26.5 GHz; No Preamp, Attenuation = 0 dBVSWR of six instruments shown. Three graphs are representative of E4440/3/5 models, and three of E4446/8 models (bold traces).
Nominal Instrument Input VSWR 3 to 50 GHz; Option 110 Preamp On, Attenuation = 0 dBVSWR of E4448A
0.00
0.50
1.00
1.50
2.00
0 10 20 30 40 50
Freq (GHz)
VS
WR
132 Chapter 3

4 Digital Modulation Analysis Measurements Specifications
This chapter contains specifications for the PSA Series, Option 241, Flexible Digital Modulation Analysis Measurement Personality.
133

Digital Modulation Analysis Measurements Specifications
Additional Definitions and Requirements
Because digital communications signals are noise-like, all measurements will have variations. The specifications apply only with adequate averaging to remove those variations.
The specifications apply in the frequency ranges documented in In-Band Frequency Range.
The specifications for this chapter apply to the E4440A, E4443A, and E4445A spectrum analyzers. For the E4446A, E4447A, and E4448A, the performance is nominal only and not subject to any warranted specifications.
The measurement performance is only slightly different in the E4446A, E4447A, and E4448A when compared to the performance of the E4440A, E4443A, and E4445A analyzers. Because the hardware performance of the analyzers is very similar, but not identical, you can estimate the nominal performance of the measurements from the specifications in this chapter.
Description Specifications Supplemental Information
Signal Acquisition
Frequency Range a
a. Specified range is the frequency range over which all specifications apply. Operational range is the fre-quency range over which the personality may be operated, subject to the maximum frequency for each PSA model.
Operational range 3 Hz to 6.7 GHz
3 Hz to 13.2 GHz
3 Hz to 26.5 GHz
3 Hz to 42.98 GHz
3 Hz to 44 GHz
3 Hz to 50 GHz
E4443A
E4445A
E4440A
E4447A
E4446A
E4448A
134 Chapter 4

Digital Modulation Analysis Measurements Specifications
Description Specifications Supplemental Information
Analysis bandwidth
Without options 122 or 140/123 a
a. For wideband modulation analysis up to 80 MHz, option 123 is necessary to get maximum perfor-mance out of option 122 at frequencies above 3.05 GHz.
Range (IFBW) 1 kHz to 10 MHz Flat Top
IF Frequency response, FBW = 10 MHz
0.12 dB (nominal)
IF Frequency response, FBW = 6.4 MHz
1 peak-to-peak (nominal)
With options122/123 a
Range (IFBW) 1 kHz to 80 MHz Flat Top
IF Frequency Response Refer to page 273.
Phase Linearity Refer to page 275.
With options 140/123 b
b. For wideband modulation analysis up to 40 MHz, option 123 is necessary to get maximum perfor-mance out of option 140 at frequencies above 3.05 GHz.
Range (IFBW) 1 kHz to 40 MHz Flat Top
IF Frequency Response Refer to page 296.
Phase Linearity Refer to page 298.
Data block length 10 to 20000 symbols Variable based on samples per symbol
Samples per symbol 1, 2, 4, 5 or 10 c
c. 2, 4 or 10 when Modulation Format is set to OQPSK
Symbol clock Internally generated
Chapter 4 135

Digital Modulation Analysis Measurements Specifications
Description Specifications Supplemental Information
Carrier lock
Lock range (wide)a
a. Clean signal with random data sequence, Carrier Lock is set to Wide. When the EVM of the signal is not good, the automatic carrier lock may find a false spectrum for the carrier frequency. In that case, the automatic carrier lock works better with Carrier Lock set to Normal with narrower locking range. The entire spectrum including the frequency offset must fit inside of instrument analysis bandwidth (Center frequency (RBW/2)). The automatic carrier lock does not adjust the center frequency.
Internally generated (smaller of Symbol rate or 1.5MHz) (nominal) for BPSK, QPSK, OQPSK, DQPSK, 16QAM, 64QAM, 256QAM
(smaller of Symbol rate/2 or 750 kHz) (nominal) for 8PSK, D8PSK
Lock range (narrow)b
b. Clean signal with random data sequence, Carrier Lock is set to Normal. The entire spectrum including the frequency offset must fit inside of instrument analysis bandwidth (Center frequency (RBW/2)).
(Symbol rate/7) (nominal) for BPSK
(Symbol rate/12.5) (nominal) for QPSK, DQPSK, /4 DQPSK
(Symbol rate/200) (nominal) for OQPSK
(Symbol rate/25) (nominal) for 8PSK
(Symbol rate/46) (nominal) for D8PSK
(Symbol rate/40) (nominal) for 16QAM, 32QAM
(Symbol rate/56) (nominal) for 64QAM
(Symbol rate/125) (nominal) for 128QAM
(Symbol rate/360) (nominal) for 256QAM
136 Chapter 4
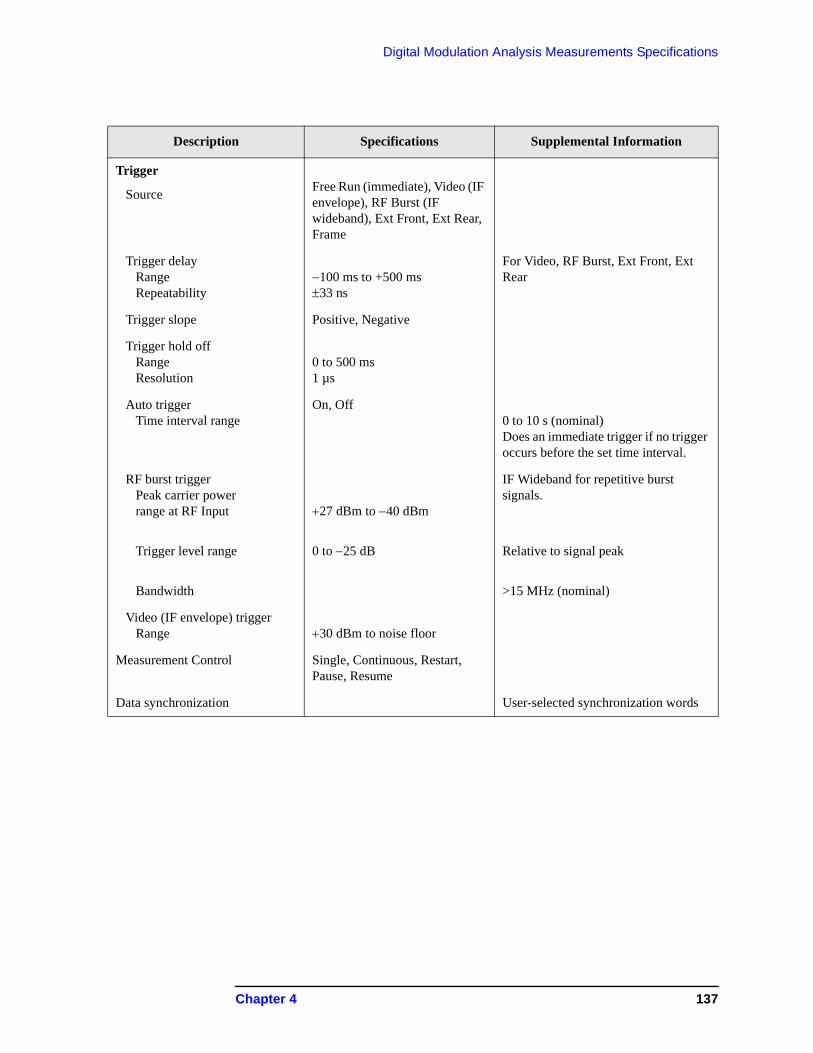
Digital Modulation Analysis Measurements Specifications
Description Specifications Supplemental Information
Trigger
Source
Free Run (immediate), Video (IF envelope), RF Burst (IF wideband), Ext Front, Ext Rear, Frame
Trigger delay Range Repeatability
100 ms to +500 ms33 ns
For Video, RF Burst, Ext Front, Ext Rear
Trigger slope Positive, Negative
Trigger hold off Range Resolution
0 to 500 ms1 µs
Auto trigger Time interval range
On, Off 0 to 10 s (nominal)Does an immediate trigger if no trigger occurs before the set time interval.
RF burst trigger Peak carrier power range at RF Input
Trigger level range
Bandwidth
27 dBm to 40 dBm
0 to 25 dB
IF Wideband for repetitive burst signals.
Relative to signal peak
>15 MHz (nominal)
Video (IF envelope) trigger Range
30 dBm to noise floor
Measurement Control Single, Continuous, Restart, Pause, Resume
Data synchronization User-selected synchronization words
Chapter 4 137

Digital Modulation Analysis Measurements Specifications
Description Specifications Supplemental Information
Supported data formats
Carrier types Continuous, Pulsed (burst, such as TDMA)
Modulation formats 2 FSK4 FSK8 FSKMSK type 1MSK type 2BPSKQPSK8PSKOQPSKDQPSKD8PSK/4 DQPSK3/8 8PSK (EDGE)16QAM32QAM64QAM128QAM256QAM16DVBQAM32DVBQAM64DVBQAM128DVBQAM256DVBQAM
Single button pre-sets
Mode for BTS and MS
W-CDMA (3GPP)cdmaOnecdma2000NADCEDGEGSMPDCPHSTETRABluetoothZigBee 2450MHzVDL Mode3APCO25 Phase1
Single-carrier, single code channel only
138 Chapter 4

Digital Modulation Analysis Measurements Specifications
Description Specifications Supplemental Information
Filtering
Measurement filter types Nyquist (Raised cosine), Root Nyquist (Square-root raised cosine), IS-95 compatible, Gaussian, EMF (EDGE), Rectangle, None
Reference filter types Nyquist (Raised cosine), Root Nyquist (Square-root raised cosine), IS-95 compatible, Gaussian, EDGE, Rectangle, Half sine
User-selectable Alpha/BT
Range Resolution
0.01 to 1.00.01
Description Specifications Supplemental Information
Symbol rate
Range
IFBW = Narrow 1 kHz to 10 MHza (nominal)
a. Meaningful operational range is limited by the Maximum symbol rate. For the optimum EVM accu-racy, the analysis bandwidth (IFBW) should encompass all the significant power spectral density of the signal.
IFBW = Wide, with options 122/123 10 kHz to 80 MHz a
(nominal)
IFBW = Wide, with options 140/123 10 kHz to 40 MHz (nominal)
Maximum symbol rate IFBW / (1+ )b
b. Determined by the IFBW and the excess bandwidth factor () of the input signal. The entire signal must fit within the selected IFBW.
Chapter 4 139

Digital Modulation Analysis Measurements Specifications
Description Specifications Supplemental Information
Accuracya
a. These specifications apply for signals without an Input Overload message, with (RF input power Input Atten) 25dBm, random data sequence, and temperature 20 to 30 °C, Equalization filter Off
BPSK, QPSK, 8PSK, DQPSK,D8PSK,
/4 DQPSK b Symbol rate >= 1kHz
b. Meas Filter = Root Nyquist, Ref Filter = Nyquist, Results length = 150 symbols
Frequency range < 3GHz
Residual errors 0.3 0.2 < 0.3 0.3(typical)
0.2 < 0.3 (typical)
Error vector magnitude (EVM) Symbol rate < 10 kHz Symbol rate < 100 kHz Symbol rate < 1 MHz Symbol rate < 6 MHz
0.8 % rms0.7 % rms0.9 % rms2.1 % rms
0.9 % rms0.7 % rms0.9 % rms2.1 % rms
0.7 % rms0.6 % rms0.6 % rms1.2 % rms
0.7 % rms0.6 % rms0.7 % rms1.2 % rms
Magnitude error Symbol rate < 10 kHz Symbol rate < 100 kHz Symbol rate < 1 MHz Symbol rate < 6 MHz
0.4 % rms0.4 % rms0.5 % rms1.5 % rms
0.5 % rms0.5 % rms0.6 % rms1.5 % rms
0.4 % rms0.4 % rms0.4 % rms0.8 % rms
0.5 % rms0.5 % rms0.5 % rms0.8 % rms
Phase error c Symbol rate < 10 kHz Symbol rate < 100 kHz Symbol rate < 1 MHz Symbol rate < 6 MHz
c. For modulation formats with equal symbol amplitudes.
0.5 % rms0.4 % rms0.5 % rms1.2 % rms
0.5 % rms0.4 °%rms0.5 % rms1.2 % rms
0.4 % rms0.3 % rms0.3 % rms0.7 % rms
0.4 % rms0.3 % rms0.3 % rms0.7 % rms
Frequency error Symbol rate/500,000 + tfad (nominal)
d. tfa = transmitter frequency frequency reference accuracy
I-Q origin offset
Analyzer Noise Floor 60 dB (nominal)
140 Chapter 4

Digital Modulation Analysis Measurements Specifications
Description Specifications Supplemental Information
16QAM, 32QAM, 64QAM, 128QAM, 256QAMa Symbol rate >= 10 kHz
a. Meas Filter = Root Nyquist, Ref Filter = Nyquist, Results length = 800 symbols, EVM Ref Calc = RMS
Frequency range < 3GHz
Residual errors 0.2 0.3 0.1 < 0.2 0.2 0.3 (typical)
0.1 < 0.2 (typical)
Error vector magnitude (EVM) Symbol rate < 100 kHz Symbol rate < 1 MHz Symbol rate < 6 MHz
0.7 % rms0.8 % rms2.1 % rms
0.9 % rms1.0 % rms2.7 % rms
0.6 % rms0.6 % rms1.2 % rms
0.8 % rms0.9 % rms1.3 % rms
Magnitude error Symbol rate < 100 kHz Symbol rate < 1 MHz Symbol rate < 6 MHz
0.3 % rms0.5 % rms1.5 % rms
0.5 % rms0.7 % rms2.0 % rms
0.2 % rms0.4 % rms0.9 % rms
0.5 % rms0.6 % rms0.9 % rms
Phase error Symbol rate < 100 kHz Symbol rate < 1 MHz Symbol rate < 6 MHz
0.4 % rms0.6 % rms1.5 % rms
0.6 % rms0.7 % rms1.8 % rms
0.3 % rms0.4 % rms0.9 % rms
0.6 % rms0.6 % rms0.9 % rms
Frequency error Symbol rate/500,000 + tfab
(nominal)
b. tfa = transmitter frequency frequency reference accuracy
I-Q origin offset
Analyzer Noise Floor 60 dB (nominal)
MSKc Symbol rate = 200 to 300 kHz BT = 0.3
c. Meas Filter = none, Ref Filter = Gaussian, Results length = 148 symbols.
Frequency range < 3GHz
Residual errors
Phase error 0.3 % rms
Frequency error 5 Hz + tfab
I-Q origin offset 60 dB (nominal)
Chapter 4 141

Digital Modulation Analysis Measurements Specifications
Description Specifications Supplemental Information
16, 32, 64, 128, 256DVBQAMaSymbol rate = 6.9 MHzAlpha = 0.15
a. Meas Filter = Root Nyquist, Ref Filter = Nyquist, Results length = 800 symbols, EVM Ref Calc = RMS
Residual errors
Error vector magnitude (EVM) Frequency = 1.0 GHz
0.7 % rms (nominal)
QPSKbSymbol rate = 5 MHz
b. Meas Filter = Root Nyquist, Ref Filter = Nyquist, Result length = 150 symbols
Operated with options 122 or 140 (IF Path = Wide) and 123 (Preselector = OFF)
Residual errors = 0.22 (nominal)
Error vector magnitude (EVM) Frequency = 5.0 GHz Frequency = 10.0 GHz Frequency = 15.0 GHz Frequency = 20.0 GHz
0.4 % rms0.4 % rms0.6 % rms0.8 % rms
QPSK bSymbol rate = 15 MHz
Operated with options 122 or 140 (IF Path = Wide) and 123 (Preselector = OFF)
Residual errors = 0.22 (nominal)
Error vector magnitude (EVM) Frequency = 5.0 GHz Frequency = 10.0 GHz Frequency = 15.0 GHz Frequency = 20.0 GHz
0.6 % rms0.7 % rms0.8 % rms1.2 % rms
QPSK bSymbol rate = 30 MHz
Operated with options 122 or 140 (IF Path = Wide) and 123 (Preselector = OFF)
Residual errors = 0.22 (nominal)
Error vector magnitude (EVM) Frequency = 5.0 GHz Frequency = 10.0 GHz Frequency = 15.0 GHz Frequency = 20.0 GHz
1.4 % rms1.3 % rms1.6 % rms1.9 % rms
142 Chapter 4

Digital Modulation Analysis Measurements Specifications
Description Specifications Supplemental Information
QPSKSymbol rate = 50 MHz
Operated with options 122 (IF PAth = Wide) and 123 (Preselector = OFF). E4446A or E4448A only. Non-equalized, Root Raised Cosine
filter (Alpha = 0.35). Opts 110/B7Ja
17.5 GHz 2.4% (nominal)
24 GHz 2.2% (nominal)
29 GHz 4.2% (nominal)
36 GHz 2.8% (nominal)
43 GHz 3.1% (nominal)
64QAMbSymbol rate = 5 MHz
Operated with options 122 or 140 (IF Path = Wide) and 123 (Preselector = OFF)
Residual errors = 0.2 (nominal)
Error vector magnitude (EVM)
Frequency = 5.0 GHz Frequency = 10.0 GHz Frequency = 15.0 GHz Frequency = 20.0 GHz
0.3 % rms0.3 % rms0.4 % rms0.6 % rms
64QAMaSymbol rate = 15 MHz
Operated with options 122 or 140 (IF Path = Wide) and 123 (Preselector = OFF)
Residual errors = 0.2 (nominal)
Error vector magnitude (EVM) Frequency = 5.0 GHz Frequency = 10.0 GHz Frequency = 15.0 GHz Frequency = 20.0 GHz
0.4 % rms0.5 % rms0.6 % rms0.9 % rms
64QAMaSymbol rate = 30 MHz
Operated with options 122 or 140 (IF Path = Wide) and 123 (Preselector = OFF)
Residual Errors = 0.2 (nominal)
Error vector magnitude (EVM) Frequency = 5.0 GHz Frequency = 10.0 GHz Frequency = 15.0 GHz Frequency = 20.0 GHz
1.2 % rms1.2 % rms1.3 % rms1.4 % rms
a. The PSA is installed with Options 110 and B7J, but Option 110 is Off.b. Meas Filter = Root Nyquist, Ref Filter = Nyquist, Result length = 800 symbols, EVM Ref Calc = Max.
Chapter 4 143

Digital Modulation Analysis Measurements Specifications
144 Chapter 4

5 Digital Communications Basic Measurement Personality
This chapter contains specifications for the PSA Series, Option B7J, Basic Mode measurement personality for vector signal analysis. These specifications also apply to the other digital communications measurement personalities (W-CDMA, HSDPA/HSUPA, GSM with EDGE, cdma2000, 1xEV-DV, 1xEV-DO, cdmaOne, NADC, TD-SCDMA Modulation Analysis, PDC).
145

Digital Communications Basic Measurement Personality
Additional Definitions and Requirements
Additional Definitions and Requirements
Because digital communications signals are noise-like, all measurements will have variations. The specifications apply only with adequate averaging to remove those variations.
The specifications for this chapter apply to the E4440A, E4443A and E4445A spectrum analyzers. For the E4446A, E4447A, and E4448A, the performance is nominal only and not subject to any warranted specifications.
The measurement performance is only slightly different in the E4446A, E4447A, and E4448A when compared to the performance of the E4440A, E4443A and E4445A analyzers. Because the hardware performance of the analyzers is very similar but not identical, you can estimate the nominal performance of the measurements from the specifications in this chapter.
Option B7J, Basic Measurement Personality
Frequency Description Specifications Supplemental Information
Frequency Range 20 MHz to 3 GHz
146 Chapter 5
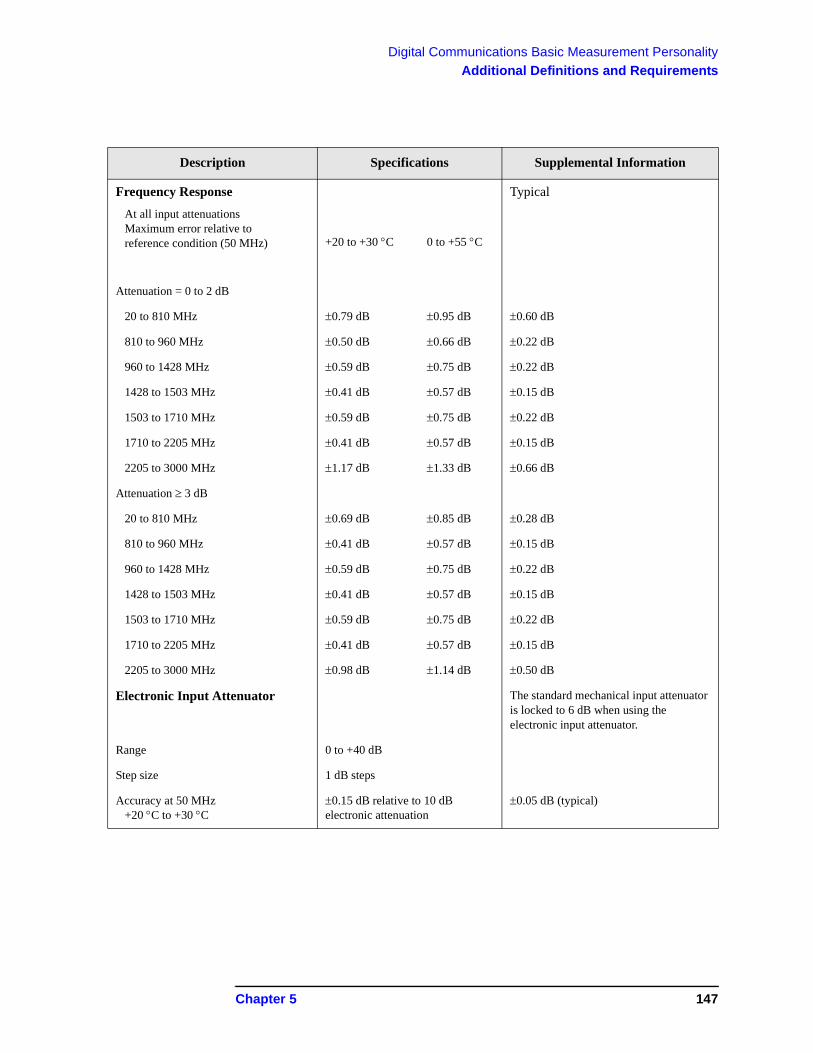
Digital Communications Basic Measurement Personality
Additional Definitions and Requirements
Description Specifications Supplemental Information
Frequency Response
At all input attenuations Maximum error relative to reference condition (50 MHz)
+20 to +30C
0 to +55C
Typical
Attenuation = 0 to 2 dB
20 to 810 MHz 0.79 dB 0.95 dB 0.60 dB
810 to 960 MHz 0.50 dB 0.66 dB 0.22 dB
960 to 1428 MHz 0.59 dB 0.75 dB 0.22 dB
1428 to 1503 MHz 0.41 dB 0.57 dB 0.15 dB
1503 to 1710 MHz 0.59 dB 0.75 dB 0.22 dB
1710 to 2205 MHz 0.41 dB 0.57 dB 0.15 dB
2205 to 3000 MHz 1.17 dB 1.33 dB 0.66 dB
Attenuation 3 dB
20 to 810 MHz 0.69 dB 0.85 dB 0.28 dB
810 to 960 MHz 0.41 dB 0.57 dB 0.15 dB
960 to 1428 MHz 0.59 dB 0.75 dB 0.22 dB
1428 to 1503 MHz 0.41 dB 0.57 dB 0.15 dB
1503 to 1710 MHz 0.59 dB 0.75 dB 0.22 dB
1710 to 2205 MHz 0.41 dB 0.57 dB 0.15 dB
2205 to 3000 MHz 0.98 dB 1.14 dB 0.50 dB
Electronic Input Attenuator The standard mechanical input attenuator is locked to 6 dB when using the electronic input attenuator.
Range 0 to +40 dB
Step size 1 dB steps
Accuracy at 50 MHz +20 C to +30 C
0.15 dB relative to 10 dB electronic attenuation
0.05 dB (typical)
Chapter 5 147

Digital Communications Basic Measurement Personality
Additional Definitions and Requirements
Description Specifications Supplemental Information
Absolute Amplitude Accuracy
Excluding: mismatch, scalloping, and IF flatnessa Including: linearity, RBW switching, attenuator,b Freq. tuned to the input CW freq.
a. Absolute amplitude error does not include input mismatch errors. It is tested only when the analyzer center frequency is tuned to the input CW frequency. In this test condition, the effects of FFT scallop-ing error and IF Flatness do not apply. FFT scalloping error, the possible variation in peak level as the signal frequency is varied between FFT bins, is a mathematical parameter of the FFT window; it is under 0.01 dB for the flattop window. IF flatness, the variation in measured amplitude with signal fre-quency variations across the span of an FFT result, is not specified separately for the digital communi-cations personalities, but the errors caused by IF flatness are included in all individual personality specifications.
b. Absolute amplitude error is tested at a combination of signal levels, spans, bandwidths and input atten-uator settings. As a result, it is a measure of the sum of many errors normally specified separately for a spectrum analyzer: detection linearity (also known as scale or log fidelity), RBW switching uncer-tainty, attenuator switching uncertainty, IF gain accuracy, Amplitude Calibrator accuracy, and the accu-racy with which the analyzer aligns itself to its internal calibrator.
At 50 MHz, +20 C to +30 C 0.25 dB 0.06 dB (typical)
At 50 MHz, all temperatures 0.33 dB
At all frequencies (Absolute amplitude accuracy at 50MHz + Frequency Response)
+20 C to +30 C (0.25 dB + frequency response)
(0.06 dB + frequency response) (typical)
0 C to +55 C (0.33 dB + frequency response)
50 MHz Amplitude Ref. Accuracy 0.05 dB (nominal)
148 Chapter 5

Digital Communications Basic Measurement Personality
Additional Definitions and Requirements
Description Specifications Supplemental Information
LO emissions < 3 GHz < 125 dBm (nominal)
Third-orderIntermodulation Distortion
When using the electronic input attenuator, the standard mechanical input attenuator is locked to 6 dB.
TOI performance will nominally be better than shown in the Amplitude chapter by7 dB + (CF 1 dB/GHz).
Displayed Average Noise Level When using the electronic input attenuator, the standard mechanical input attenuator is locked to 6 dB.
DANL performance will nominally be worse than shown in the Amplitude chapter by7 dB + (CF 1 dB/GHz).
Description Specifications Supplemental Information
Measurement Range Displayed Average Noise Level to +30 dBm
Chapter 5 149

Digital Communications Basic Measurement Personality
Measurements
Measurements
Spectrum
These specifications apply to the measurements available in Basic Mode.
Description Specifications Supplemental Information
Spectrum
Span range 10 Hz to 10 MHz 1, 1.5, 2, 3, 5, 7.5, 10 sequence or arbitrary user-definable
Capture time 66 ns to 40 s2 points to 200 kpoints Coupled to span and RBW
Resolution BW range Overall Span = 10 MHz Span = 100 kHz Span = 1 kHz Span = 100 Hz
100 MHz to 1 MHz3 kHz to 5 kHz30 Hz to 500 kHz400 MHz to 7.5 kHz100 MHz to 2 kHz
1, 1.5, 2, 3, 5, 7.5, 10 sequence or arbitrary user-definable
Pre-FFT filter Type BW
Gaussian, FlatAuto, Manual 1 Hz to 10 MHz
FFT window Flat Top (high amplitude accuracy); Uniform; Hanning; Hamming; Gaussian; Blackman; Blackman-Harris; Kaiser-Bessel 70; K-B 90; K-B 110
Displays Spectrum, I/Q waveform, Simultaneous Spectrum & I/Q waveform
150 Chapter 5

Digital Communications Basic Measurement Personality
Measurements
Waveform
Description Specifications Supplemental Information
Waveform
Sweep time rangea RBW 7.5 MHz RBW 1 MHz RBW 100 kHz RBW 10 kHz
a. The maximum available sweep time range is proportional to the setting of the decimation (Meas Setup > Advanced > Decimation). The limits shown are for decimation = 4, the maximum allowed. The default for decimation is 1.
10 s to 200 ms10 s to 400 ms10 s to 2 s10 s to 20 s
Time record length 2 to >900 kpoints (nominal)
Resolution bandwidth filter 1, 1.5, 2, 3, 5, 7.5, 10 sequence orarbitrary user-definable
Gaussian Flat Top Frequency response for 10 MHz setting
10 Hz to 8 MHz10 Hz to 10 MHz
0.25 dB over 8 MHz (nominal)3 dB roll off bandwidth is 10 MHz (nominal)
Displays RF envelope, I/Q waveform
X-axis display
Range
Controls
10 divisions scale/div
Scale/Div, Ref Value, andRef Position
Allows expanded views of portions of the trace data.
Chapter 5 151

Digital Communications Basic Measurement Personality
Measurements
Description Specifications Supplemental Information
Both Spectrum and Waveform
Trigger
Source Free Run (immediate), Video (IF envelope), RF Burst (wideband), Ext Front, Ext Rear, Frame, Line
Trigger delay Range Repeatability Resolution
100 ms to 500 ms33 ns33 ns
For Video, RF Burst, Ext Front, Ext Rear
Trigger slope Positive, Negative
Trigger hold off Range Resolution
0 to 500 ms1 s
Auto trigger Time interval range
On, Off 0 to 10 s (nominal)Does an immediate trigger if no trigger occurs before the set time interval.
RF burst trigger Peak carrier power range at RF Input
Trigger level range
Bandwidth
27 dBm to 40 dBm
0 to 25 dB
Wideband IF for repetitive burst signals.
Relative to signal peak
>15 MHz (nominal)
Video (IF envelope) trigger Range
30 dBm to noise floor
Measurement Control Single, Continuous, Restart, Pause, Resume
Averaging
Avg number
Avg mode
Avg type
1 to 10,000
Exponential, Repeat
Power Avg (RMS), Log-Power Avg (Video), Voltage Avg, Maximum, Minimum
Y-axis display controls Scale/Div, Ref Value, and Ref Position Allows expanded views of portions of the trace data
Markers Normal, Delta, Band Power, Noise
152 Chapter 5

Digital Communications Basic Measurement Personality
Inputs and Outputs
Inputs and Outputs
Front Panel
Description Specifications Supplemental Information
RF Input
VSWR with electronic attenuator 7 MHz to 3 GHz
0 or 1 dB input attenuation 2 dB input attenuation
< 1.3:1 (nominal)< 1.2:1 (nominal)
Chapter 5 153

Digital Communications Basic Measurement Personality
Inputs and Outputs
154 Chapter 5

6 GSM/EDGE Measurement Personality
This chapter contains specifications for the PSA series, Option 202, GSM with EDGE measurement personality.
155

GSM/EDGE Measurement Personality
Additional Definitions and Requirements
Additional Definitions and Requirements
Because digital communications signals are noise-like, all measurements will have variations. The specifications apply only with adequate averaging to remove those variations.
The specifications apply in the frequency ranges documented in In-Band Frequency Range.
The specifications for this chapter apply to the E4440A, E4443A and E4445A spectrum analyzers. For the E4446A, E4447A, and E4448A, the performance is nominal only and not subject to any warranted specifications.
The measurement performance is only slightly different in the E4446A, E4447A, and E4448A when compared to the performance of the E4440A, E4443A and E4445A analyzers. Because the hardware performance of the analyzers is very similar but not identical, you can estimate the nominal performance of the measurements from the specifications in this chapter.
156 Chapter 6

GSM/EDGE Measurement Personality
Option 202, GSM/EDGE
Option 202, GSM/EDGE
Description Specifications Supplemental Information
EDGE Error Vector Magnitude(EVM)
Specifications based on 200 bursts
Carrier Power Range at RF Input +24 to 45 dBm (nominal)
EVM
Operating rangea
a. The operating range applies when the Burst Sync is set to Training Sequence.
0 to 25 % (nominal)
Floor (RMS) 0.5 % 0.3 % (typical)
Accuracy b (RMS) EVM range 1 % to 10 %
b. The accuracy specification applies when the Burst Sync is set to Training Sequence. The definition of accuracy for the purposes of this specification is how closely the result meets the expected result. That expected result is 0.975 times the actual RMS EVM of the signal, per 3GPP TS 5.05, annex G.
0.5 %
+24 to 12 dBm power range at RF input
Frequency Error
Accuracy 1 Hz + tfac
c. tfa = transmitter frequency frequency reference accuracy
IQ Origin Offset
DUT Maximum Offset 20 dBc
Maximum Analyzer Noise Floor 43 dBc
Trigger to T0 Time Offset
Relative Offset Accuracy 5.0 ns (nominal)
Description Specifications Supplemental Information
Power vs. Time
and
EDGE Power vs. Time
GMSK modulation (GSM)3/8 shifted 8PSK modulation (EDGE)
Measures mean transmitted RF carrier power during the useful part of the burst (GSM method) and the power vs. time ramping.510 kHz RBW
Chapter 6 157

GSM/EDGE Measurement Personality
Option 202, GSM/EDGE
Minimum carrier power at RF Input for GSM and EDGE
40 dBm (nominal)
Absolute power accuracy for in-band
signal (excluding mismatch error)a
20 to 30 C; attenuation > 2 dBb 0.11 0.66 dB 0.11 0.18 dB (typical)
20 to 30 C; attenuation 2 dBb 0.11 0.75 dB 0.11 0.24 dB (typical)
0 to 55 C; attenuation > 2 dBb 0.11 0.90 dB
a. The power versus time measurement uses a resolution bandwidth of about 510 kHz. This is not wide enough to pass all the transmitter power unattenuated, leading the consistent error shown in addition to the uncertainty. A wider RBW would allow smaller errors in the carrier measurement, but would allow more noise to reduce the dynamic range of the low-level measurements. The measurement floor will change by 10 log(RBW/510 kHz). The average amplitude error will be about 0.11 dB ((510 kHz/RBW)2). Therefore, the consistent part of the amplitude error can be eliminated by using a wider RBW.
b. The absolute power accuracy depends on the setting of the electronic input attenuator as well as the sig-nal-to-noise ratio. For high input levels, the Auto setting of RF Input Range will result in high sig-nal-to-noise ratios and Input Atten > 2 dB, for which the Absolute power accuracy is best. At moderate levels, manually setting the Input Atten can give better accuracy than the automatic setting. At very low levels, automatic or manual setting of the Input Atten to 0 dB optimizes the accuracy by maximiz-ing the signal-to-noise ratio.For GSM and EDGE respectively, “high levels” would nominally be levels above 2.3 dBm and 5.5 dBm respectively, and “very low levels” would nominally be below 68 dBm. The error due to very low signals levels is a function of the signal (mean transmit power) to noise (mea-
surement floor) ratio, SN, in decibels.The function is error = 10 log(1 + 10 SN/10).For example, if the mixer level (input power minus attenuation) is 26.4 dB above the measurement floor, the error due to adding the analyzer's noise to the UUT is only 0.01 dB.
Description Specifications Supplemental Information
Power Ramp Relative Accuracy Referenced to mean transmitted power
RF Input Range = Auto a +6 dB to noise a b
0.13 dB
Mixer Level 12 dBm a 0 to +6 dB 0 to noise a b
0.13 dB0.08 dB
Mixer Level 18 dBm a +6 dB to noise
0.08 dB
Measurement floor 88 dBm + Input Attenuation (nominal)
Time resolution 200 ns
Description Specifications Supplemental Information
158 Chapter 6

GSM/EDGE Measurement Personality
Option 202, GSM/EDGE
Burst to mask uncertainty 0.2 bit(approx 0.7 s)
a. Using auto setting of RF Input range optimizes the dynamic range of analysis, but the scale fidelity is poorer at the relatively high mixer levels chosen. Because of this, manually setting the input attenuator so that the mixer level (RF Input power minus Input Attenuation) is lower can improve the relative accuracy of power ramp measurements as shown.
b. The relative error specification does not change as the levels approach the noise floor, except for the effect of the noise power itself. If the mixer level is not high enough to make the contribution of the measurement floor negligible, the noise of the analyzer will add power to the signal being measured, resulting in an error. That error is a function of the signal (carrier power) to noise (measurement floor) ratio (SN), in decibels. The function is error = 10 log(1 + 10 SN/10). For example, if the mixer level is 26.4 dB above the measurement floor, the error due to adding the noise of the analyzer to the UUT is only 0.01 dB.
Description Specifications Supplemental Information
Chapter 6 159

GSM/EDGE Measurement Personality
Option 202, GSM/EDGE
Description Specifications Supplemental Information
Phase and Frequency Error GMSK modulation (GSM)
Specifications based on 3GPP essential conformance requirements, and 200 bursts
Carrier power range at RF Input 27 to 45 dBm (nominal)
Phase error Floor (RMS) Accuracy (RMS) Phase error range 1 ° to 15 °
0.5 0.5
Peak phase error Accuracy Phase error range 3 ° to 25 °
2.0
Frequency error
Initial frequency error range 75 kHz (nominal)
Accuracy 5 Hz + tfa a
a. tfa = transmitter frequency frequency reference accuracy
I/Q Origin Offset DUT Maximum Offset Analyzer Noise Floor
15 dBc (nominal)50 dBc (nominal)
Burst sync time uncertainty 0.1 bit (approx 0.4 s)
Trigger to T0 time offset Relative offset accuracy
5.0 ns (nominal)
160 Chapter 6

GSM/EDGE Measurement Personality
Option 202, GSM/EDGE
Description Specifications Supplemental Information
Output RF Spectrum
and EDGE Output RF Spectrum
GMSK modulation (GSM)3/8 shifted 8PSK modulation (EDGE)
Minimum carrier power at RF Input 20 dBm (nominal)
ORFS Relative RF Power Uncertainty a Due to modulation
a. The uncertainty in the RF power ratio reported by ORFS has many components. This specification does not include the effects of added power in the measurements due to dynamic range limitations, but does include the following errors: detection linearity, RF and IF flatness, uncertainty in the bandwidth of the RBW filter, and compression due to high drive levels in the front end.
Offsets 1.2 MHz 0.15 dB
Offsets 1.8 MHz 0.25 dB
Due to switching 0.15 dB (nominal)b
b. The worst-case modeled and computed errors in ORFS due to switching are shown, but there are two further considerations in evaluating the accuracy of the measurement: First, Agilent has been unable to create a signal of known ORFS due to switching, so we have been unable to verify the accuracy of our models. This performance value is therefore shown as nominal instead of guaranteed. Second, the stan-dards for ORFS allow the use of any RBW of at least 300 kHz for the reference measurement against which the ORFS due to switching is ratioed. Changing the RBW can make the measured ratio change by up to about 0.24 dB, making the standards ambiguous to this level. The user may choose the RBW for the reference; the default 300 kHz RBW has good dynamic range and speed, and agrees with past prac-tices. Using wider RBWs would allow for results that depend less on the RBW, and give larger ratios of the reference to the ORFS due to switching by up to about 0.24 dB.
ORFS Absolute RF Power Accuracyc 20 to 30 C, attenuation > 2 dBd 20 to 30 C, attenuation 2 dBd
c. The absolute power accuracy depends on the setting of the electronic input attenuator as well as the sig-nal-to-noise ratio. For high input levels, the Auto setting of RF Input Range will result in high sig-nal-to-noise ratios and Input Atten > 2 dB, for which the Absolute power accuracy is best. At moderate levels, manually setting the Input Atten can give better accuracy than the automatic setting. For GSM and EDGE respectively, “high levels” would nominally be levels above 2.3 dBm and 3.7 dBm respectively.
d. Using the RF Input Range auto setting nominally results in better accuracy for power levels above 2.3 dBm for GSM and 3.69 dBm for EDGE. This is because these power levels set the input attenuator to 3 dB or more where RF frequency response errors are smaller.
0.72 dB0.81 dB
0.18 dB (typical)0.24 dB (typical)
Chapter 6 161

GSM/EDGE Measurement Personality
Option 202, GSM/EDGE
Description Specifications Supplemental Information
Dynamic Range
Spectrum due to modulationa20 to 30 C
a. Maximum dynamic range requires RF input power above 2 dBm for offsets of 1.2 MHz and below. For offsets of 1.8 MHz and above, the required RF input power for maximum dynamic range is +6 dBm for GSM signals and +5 dBm for EDGE signals
5-pole sync-tuned filters bMethods: Direct Timec and FFTd
b. ORFS standards call for the use of a 5-pole, sync-tuned filter; this and the following footnotes review the instrument's conformance to that standard. Offset frequencies can be measured by using either the FFT method or the direct time method. By default, the FFT method is used for offsets of 400 kHz and below, and the direct time method is used for offsets above 400 kHz. The FFT method is slower and has lower dynamic range than the direct time method.
c. The direct time method uses digital Gaussian RBW filters whose noise bandwidth (the measure of importance to “spectrum due to modulation”) is within 0.5 % of the noise bandwidth of an ideal 5-pole sync-tuned filter. However, the Gaussian filters do not match the 5-pole standard behavior at off-sets of 400 kHz and less, because they have lower leakage of the carrier into the filter. The lower leak-age of the Gaussian filters provides a superior measurement because the leakage of the carrier masks the ORFS due to the UUT, so that less masking lets the test be more sensitive to variations in the UUT spectral splatter. But this superior measurement gives a result that does not conform with ORFS stan-dards. Therefore, the default method for offsets of 400 kHz and below is the FFT method.
d. The FFT method uses an exact 5-pole sync-tuned RBW filter, implemented in software.
Offset Frequency GSM EDGE GSM(typical)
EDGE (typical)
100 kHze
e. The dynamic range for offsets at and below 400 kHz is not directly observable because the signal spec-trum obscures the result. These dynamic range specifications are computed from phase noise observa-tions.
67.3 dB 67.3 dB
200 kHz 74.5 dB 74.5 dB
250 kHz 76.9 dB 76.9 dB
400 kHz 81.5 dB 81.3 dB
600 kHz 85.6 dB 85.1 dB 87.7 dB 87.0 dB
1.2 MHz 91.0 dB 89.4 dB 92.8 dB 91.0 dB
GSM(nominal)
EDGE (nominal)
1.8 MHz f
f. Offsets of 1.8 MHz and higher use 100 kHz analysis bandwidths.
90.3 dB 90.2 dB 93.1 dB 92.0 dB
6.0 MHz 94.0 dB 93.7 dB 96.8 dB 94.5 dB
162 Chapter 6

GSM/EDGE Measurement Personality
Option 202, GSM/EDGE
Description Specifications Supplemental Information
Dynamic Range,Spectrum due to switching aOffset Frequency
a. The impulse bandwidth (the measure of importance to “spectrum due to switching transients”) of the filter used in the direct time method is 0.8 % less than the impulse bandwidth of an ideal 5-pole sync-tuned filter, with a tolerance of 0.5 %. Unlike the case with spectrum due to modulation, the shape of the filter response (Gaussian vs. sync-tuned) does not affect the results due to carrier leakage, so the only parameter of the filter that matters to the results is the impulse bandwidth. There is a mean error of 0.07 dB due to the impulse bandwidth of the filter, which is compensated in the measurement of ORFS due to switching. By comparison, an analog RBW filter with a 10 % width tolerance would cause a maximum amplitude uncertainty of 0.9 dB.
5-pole sync-tuned filters a
400 kHz 72.1 dB
600 kHz 75.9 dB
1.2 MHz 80.2 dB
1.8 MHz 84.6 dB
Spectrum (Frequency Domain) See “Spectrum” on page 150.
Waveform (Time Domain) See “Waveform” on page 151.
Chapter 6 163

GSM/EDGE Measurement Personality
Option 202, GSM/EDGE
DescriptionGSM
SpecificationsEDGE
SpecificationsSupplemental Information
In-Band Frequency Rangesa
a. Frequency ranges over which all specifications apply.
GSM 900, P-GSM 890 to 915 MHz935 to 960 MHz
890 to 915 MHz935 to 960 MHz
GSM 900, E-GSM 880 to 915 MHz925 to 960 MHz
880 to 915 MHz925 to 960 MHz
DCS1800 1710 to 1785 MHz1805 to 1880 MHz
1710 to 1785 MHz1805 to 1880 MHz
PCS1900 1850 to 1910 MHz1930 to 1990 MHz
GSM850 824 to 849 MHz869 to 894 MHz
DescriptionGSM
SpecificationsEDGE
SpecificationsSupplemental Information
Alternative Frequency Rangesa
a. Frequency ranges with tuning plans but degraded specifications for absolute power accuracy. The deg-radation should be nominally 0.30 dB.
Down Band GSM 400 to 500 MHz 400 to 500 MHz
GSM450 450.4 to 457.6 MHz460.4 to 467.6 MHz
GSM480 478.8 to 486 MHz488.8 to 496 MHz
GSM700 447.2 to 761.8 MHz
164 Chapter 6

GSM/EDGE Measurement Personality
Option 202, GSM/EDGE
Description Specifications Supplemental Information
Trigger
Trigger source RF burst (wideband), Video (IF envelope), Ext Front, Ext Rear, Frame Timer. Actual available choices dependent on measurement.
Trigger delay, level, and slope Each trigger source has a separate set of these parameters.
Trigger delay Range Repeatability Resolution
100 to 500 ms33 ns33 ns
External trigger inputs Level Range Impedance
5 to +5 V
10 k (nominal)
Burst Sync
Source Training sequence, RF amplitude, None.Actual available choices dependent on measurement.
Training sequence code GSM defined 0 to 7Auto (search) or Manual
Burst type Normal (TCH & CCH)Sync (SCH)Access (RACH)
Range Control RF Input Autorange aManually set Max Total Pwr Manually set Input Atten
a. Auto range is not continuous with each measurement acquisition; it will run only once immediately fol-lowing a measurement restart, initiated either by pressing the Restart key, or by sending the GPIB command INIT:IMM. This behavior was chosen to maintain best measurement speed, but it requires caution when input power levels change. If the input signal power changes, the analyzer will not read-just the input attenuators for optimal dynamic range unless a measurement restart is initiated. For example, if a sequence of power measurements is made, beginning with a maximum power level that is large enough to require non-zero input attenuation, it is advisable to do a measurement restart to auto-matically set a lower input attenuator value to maintain optimal dynamic range for approximately every 3 dB the input signal power level is reduced, or smaller, depending upon how precisely dynamic range needs to be optimized. Conversely, if the input signal power increases to a high enough level, input overloading will occur if the input attenuators are not readjusted by doing a measurement restart.
Chapter 6 165

GSM/EDGE Measurement Personality
Option 202, GSM/EDGE
166 Chapter 6
7 W-CDMA Measurement Personality
This chapter contains specifications for the PSA Series, Option BAF, W-CDMA measurement personality.
167

W-CDMA Measurement Personality
Additional Definitions and Requirements
Additional Definitions and Requirements
Because digital communications signals are noise-like, all measurements will have variations. The specifications apply only with adequate averaging to remove those variations.
The specifications apply in the frequency ranges documented in In-Band Frequency Range.
The specifications for this chapter apply to the E4440A, E4443A and E4445A spectrum analyzers. For the E4446A, E4447A, and E4448A, the performance is nominal only and not subject to any warranted specifications.
The measurement performance is only slightly different in the E4446A, E4447A, and E4448A when compared to the performance of the E4440A, E4443A and E4445A analyzers. Because the hardware performance of the analyzers is very similar but not identical, you can estimate the nominal performance of the measurements from the specifications in this chapter.
168 Chapter 7

W-CDMA Measurement Personality
Conformance With 3GPP TS 25.141 Base Station Requirements for a Manufacturing Environment
Conformance With 3GPP TS 25.141 Base Station Requirements for a Manufacturing Environment
Sub-clause
Name
3GPP Required Test Instrument
Tolerance(as of 2002-06)
InstrumentTolerance
Interval a b c
a. Those tolerances marked as 95 % are derived from 95th percentile observations with 95 % confidence.b. Those tolerances marked as 100 % are derived from 100 % limit tested observations. Only the 100 %
limit tested observations are covered by the product warranty.c. The computation of the instrument tolerance intervals shown includes the uncertainty of the tracing of
calibration references to national standards. It is added, in a root-sum-square fashion, to the observed performance of the instrument.
Supplemental Information
Conditions 25 to 35 C d Derived tolerancese 95th percentiled 100 % limit testedb Calibration uncertainties includedd
d. This table is intended for users in the manufacturing environment, and as such, the tolerance limits have been computed for temperatures of the ambient air near the analyzer of 25 to 35 C.
e. Most of the tolerance limits in this table are derived from measurements made of standard instrument specifications, rather than direct observations.
6.2.1 Maximum Output Power 0.7 dB (95 %) 0.28 dB (95 %) 0.71 dB (100 %)
6.2.2 CPICH Power Accuracy 0.8 dB (95 %) 0.29 dB (95 %) 10 dB CDPf
f. Tolerance limits are computed for a CPICH code domain power of 10 dB relative to total signal power.
6.3.4 Frequency Error 12 Hz (95 %) 10 Hz (100 %) Freq Ref lockedg
6.4.2 Power Control Stepsh
1 dB step 0.1 dB (95 %) 0.03 dB (95 %) Test Model 2
0.5 dB step 0.1 dB (95 %) 0.03 dB (95 %) Test Model 2
Ten 1 dB steps 0.1 dB (95 %) 0.03 dB (95 %) Test Model 2
Ten 0.5 dB steps 0.1 dB (95 %) 0.03 dB (95 %) Test Model 2
6.4.3 Power Dynamic Range 1.1 dB (95 %) 0.50 dB (95 %)
6.4.4 Total Power Dynamic
Rangeh0.3 dB (95 %) 0.015 dB (95 %) Ref 35 dBm at
mixeri
6.5.1 Occupied Bandwidth 100 kHz (95 %) 38 kHz (95 %) 10 averages j
Chapter 7 169

W-CDMA Measurement Personality
Conformance With 3GPP TS 25.141 Base Station Requirements for a Manufacturing Environment
g. The frequency references of the DUT and the test equipment must be locked together to meet this toler-ance interval.
h. These measurements are obtained by utilizing the code domain power function or general instrument capability. The tolerance limits given represent instrument capabilities.
i. The tolerance interval is based on the largest signal power being 35 dBm at the mixer.j. The OBW measurement errors are dominated by the noise-like nature of the signal. The errors decline
in proportion to the square root of the number of averages. The tolerance interval shown is for ten aver-ages.
170 Chapter 7

W-CDMA Measurement Personality
Conformance With 3GPP TS 25.141 Base Station Requirements for a Manufacturing Environment
Sub-clause
Name
3GPP Required Test Instrument
Tolerance(as of 2002-06)
InstrumentTolerance
Interval a b c
a. Those tolerances marked as 95 % are derived from 95th percentile observations with 95 % confidence.b. Those tolerances marked as 100 % are derived from 100 % limit tested observations. Only the 100 %
limit tested observations are covered by the product warranty.c. The computation of the instrument tolerance intervals shown includes the uncertainty of the tracing of
calibration references to national standards. It is added, in a root-sum-square fashion, to the observed performance of the instrument.
Supplemental Information
6.5.2.1 Spectrum Emission Mask 1.5 dB (95 %) 0.59 dB (95 %) Absolute peak d
d. The tolerance interval shown is for the peak absolute power of a CW-like spurious signal. The standards for SEM measurements are ambiguous as of this writing; the tolerance interval shown is based on Agi-lent’s interpretation of the current standards and is subject to change.
6.5.2.2 ACLR
5 MHz offset 0.8 dB (95 %) 0.22 dB (100 %)
10 MHz offset 0.8 dB (95 %) 0.22 dB (100 %)
6.5.3 Spurious Emissions
f < 3 GHz 1.5 to 2.0 dB (95 %)
0.65 dB (100 %)
3 GHz < f < 4 GHz 2.0 dB (95 %) 1.77 dB (100 %)
4 GHz < f < 12.6 GHz 4.0 dB (95 %) 2.27 dB (100 %)
6.7.1 EVM 2.5 % (95 %) 1.0 % (95 %) Range 15 to 20 % e
e. EVM tolerances apply with signals having EVMs within 2.5 % of the required 17.5 % EVM limit.
6.7.2 Peak Code Domain Error 1.0 dB (95 %) 1.0 dB (nominal)
Chapter 7 171

W-CDMA Measurement Personality
Conformance With 3GPP TS 25.141 Base Station Requirements for a Manufacturing Environment
Description Specifications Supplemental Information
Channel Power
Minimum power at RF Input 70 dBm (nominal)
Absolute power accuracy a 20 to 30 C, Attenuation > 2 dB b 20 to 30 C, Attenuation 2 dB b
a. Absolute power accuracy includes all error sources for in-band signals except mismatch errors and repeatability due to incomplete averaging. It applies when the mixer level is high enough that measure-ment floor contribution is negligible.
b. The absolute power accuracy depends on the setting of the electronic input attenuator as well as the sig-nal-to-noise ratio. For high input levels, the Auto setting of RF Input Range will result in high sig-nal-to-noise ratios and Input Atten > 2 dB, for which the Absolute power accuracy is best. At moderate levels, manually setting the Input Atten can give better accuracy than the automatic setting. At very low levels, automatic or manual setting of the Input Atten to 0 dB optimizes the accuracy by maximiz-ing the signal-to-noise ratio. For W-CDMA, “high levels” would nominally be levels above 14.4 dBm, and “very low levels” would nominally be below 58 dBm. The error due to very low signals levels is a function of the signal (channel power) to noise (measure-
ment floor) ratio, SN, in decibels. The function is error = 10 log(1 + 10 SN/10). For example, if the mixer level (input power minus attenuation) is 26.4 dB above the measurement floor, the error due to adding the analyzer's noise to the UUT is only 0.01 dB.
0.71 dB
0.80 dB
0.19 dB (typical)
0.25 dB (typical)
Measurement floor c
c. Measurement floor is the channel power measured due only to the noise of the analyzer. The measure-ment floor nominally changes by +1 dB/GHz for signal frequencies different from the 2 GHz frequency for which this nominal floor was determined.
78 dBm (nominal)
172 Chapter 7

W-CDMA Measurement Personality
Conformance With 3GPP TS 25.141 Base Station Requirements for a Manufacturing Environment
Description Specifications Supplemental Information
Adjacent Channel PowerRatio (ACPR; ACLR)a
a. Most versions of ACP measurements use negative numbers, in units of dBc, to refer to the power in an adjacent channel relative to the power in a main channel, in accordance with ITU standards. The stan-dards for W-CDMA analysis include ACLR, a positive number represented in dB units. In order to be consistent with other kinds of ACP measurements, this measurement and its specifications will use neg-ative dBc results, and refer to them as ACPR, instead of positive dB results referred to as ACLR. The ACLR can be determined from the ACPR reported by merely reversing the sign.
Specifications apply for Sweep Method = FFT or Swp
Minimum power at RF Input 27 dBm (nominal)
ACPR Accuracyb Radio
b. The ACPR level accuracy depends on the mixer drive level and whether the distortion products from the analyzer are coherent with those in the UUT. Except for the “non-coherent case” described in foot-note f, the specifications apply even in the worst case condition of coherent analyzer and UUT distor-tion products. For ACPR levels other than those in this specifications table, the optimum mixer drive level for accuracy is approximately 29 dBm (ACPR/3), where the ACPR is given in (negative) deci-bels.
Offset Freq.
RRC weighted, 3.84 MHz noise bandwidth
MS (UE) 5 MHz 0.12 dB At ACPR range of 30 to 36 dBc with
optimum mixer level c
c. In order to meet this specified accuracy when measuring mobile station (MS) or user equipment (UE) within 3 dB of the required 33 dBc ACPR, the mixer level (ML) must be optimized for accuracy. This optimum mixer level is 18 dBm, so the input attenuation must be set as close as possible to the average input power (18 dBm). For example, if the average input power is 6 dBm, set the attenuation to 12 dB. This specification applies for the normal 3.5 dB peak-to-average ratio of a single code. Note that, if the mixer level is set to optimize dynamic range instead of accuracy, accuracy errors are nominally dou-bled.
MS (UE) 10 MHz 0.17 dB At ACPR range of 40 to 46 dBc with
auto-ranged d
d. ACPR accuracy at 10 MHz offset is warranted when RF Input Range is set to Auto.
BTS 5 MHz 0.22 dB At ACPR range of 42 to 48 dBc with
optimum mixer level e
e. In order to meet this specified accuracy, the mixer level must be optimized for accuracy when measur-ing Node-B of the Base Transmission Station (BTS) within 3 dB of the required 45 dBc ACPR. This optimum mixer level is 14 dBm, so the input attenuation must be set as close as possible to the average input power (14 dBm). For example, if the average input power is 6 dBm, set the attenuation to 8 dB. This specification applies for the normal 10 dB peak-to-average ratio (at 0.01 % probability) for Test Model 1. Note that, if the mixer level is set to optimize dynamic range instead of accuracy, accu-racy errors are nominally doubled.
BTS 10 MHz 0.22 dB At ACPR range of 47 to 53 dBc with
auto-ranged d
BTS 5 MHz 0.17 dB At 48 dBc non-coherent ACPR f
Chapter 7 173

W-CDMA Measurement Personality
Conformance With 3GPP TS 25.141 Base Station Requirements for a Manufacturing Environment
f. Accuracy can be excellent even at low ACPR levels assuming that the user sets the mixer level to opti-mize the dynamic range, and assuming that the analyzer and UUT distortions are incoherent. When the errors from the UUT and the analyzer are incoherent, optimizing dynamic range is equivalent to mini-mizing the contribution of analyzer noise and distortion to accuracy, though the higher mixer level increases the display scale fidelity errors. This incoherent addition case is commonly used in the indus-try and can be useful for comparison of analysis equipment, but this incoherent addition model is rarely justified.
174 Chapter 7

W-CDMA Measurement Personality
Conformance With 3GPP TS 25.141 Base Station Requirements for a Manufacturing Environment
Description Specifications Supplemental Information
Dynamic Range
Offset Frequency
RRC weighted, 3.84 MHz noise bandwidth
5 MHz 74.5 dB (nominal) a
a. The averaged input power level should be at least 1 dBm and RF Input Range is set to Auto
10 MHz 82 dB (nominal) a
Description Specifications Supplemental Information
Multi-Carrier Power
Minimum Carrier Power at RF Input 12 dBm (nominal)
ACPR Dynamic Range, two carriers RRC weighted, 3.84 MHz noise bandwidth
5 MHz offset
10 MHz offset
70 dB (nominal)
75 dB (nominal)
ACPR Accuracy, two carriers 5 MHz offset, 48 dBc ACPR
0.38 dB (nominal)
Description Specifications Supplemental Information
Power Statistics CCDF
Minimum Power at RF Input 40 dBm, average (nominal)
Histogram Resolution 0.01 dB a
a. The Complementary Cumulative Distribution Function (CCDF) is a reformatting of the histogram of the power envelope. The width of the amplitude bins used by the histogram is the histogram resolution. The resolution of the CCDF will be the same as the width of those bins.
Chapter 7 175

W-CDMA Measurement Personality
Conformance With 3GPP TS 25.141 Base Station Requirements for a Manufacturing Environment
Description Specifications Supplemental Information
Intermodulation
Minimum Carrier Power at RF Input 30 dBm (nominal)
Third-order Intercept
CF = 1 GHz TOI + 7.2 dBa
a. The third-order intercept (TOI) of the analyzer as configured for the W-CDMA personality is higher than the third-order intercept specified for the analyzer without the personality, due to the configuration of loss elements in front of the input mixer. The personality configures the mechanical attenuator to be in a fixed 6 dB attenuation position, and has additional loss in the electronic attenuator. The TOI increases by the nominal amount shown due to these losses when the electronic attenuator is set to 0 dB, and further increases proportional to the setting of the electronic attenuator.
CF = 2 GHz TOI + 7.5 dBa
176 Chapter 7

W-CDMA Measurement Personality
Conformance With 3GPP TS 25.141 Base Station Requirements for a Manufacturing Environment
Description Specifications Supplemental Information
Occupied Bandwidth
Minimum carrier power at RF Input 40 dBm (nominal)
Frequency Resolution 100 Hz
Frequency Accuracy
(nominal) a
a. The errors in Occupied Bandwidth measurement are due mostly to the noisiness of any measurement of a noise-like signal, such as the W-CDMA signal. The observed standard deviation of the OBW mea-surement is 60 kHz, so with 1000 averages, the standard deviation should be about 2 kHz, or 0.05 %. The frequency errors due to the FFT processing are computed to be 0.028 % with the RBW (30 kHz) used.
Spectrum Emission Mask
Minimum power at RF Input 20 dBm (nominal)
Dynamic Range, relative b 2.515 MHz offset c 1980 MHz region d
b. The dynamic range specification is the ratio of the channel power to the power in the offset and region specified. The dynamic range depends on the measurement settings, such as peak power or integrated power. This specification is derived from other analyzer performance limitations such as third-order intermodulation, DANL and phase noise. Dynamic range specifications are based on default measure-ment settings, with detector set to average, and depend on the mixer level. Mixer level is defined to be the input power minus the input attenuation.
c. Default measurement settings include 30 kHz RBW. This dynamic range specification applies for the optimum mixer level, which is about 9 dBm.
d. Default measurement settings include 1200 kHz RBW. This dynamic range specification applies for a mixer level of 0 dBm. Higher mixer levels can give up to 5 dB better dynamic range, but at the expense of compression in the input mixer, which reduces accuracy. The compression behavior of the input mixer is specified in the PSA Specifications Guide; the levels into the mixer are nominally 8 dB lower in this application when the center frequency is 2 GHz.
86.7 dB
80.7 dB
88.9 dB (typical)
83.0 dB (typical)
Sensitivity, absolute e 2.515 MHz offset f 1980 MHz region g
e. The sensitivity is specified with 0 dB input attenuation. It represents the noise limitations of the ana-lyzer. It is tested without an input signal.
f. The sensitivity at this offset is specified in the default 30 kHz RBW.g. The sensitivity for this region is specified in the default 1200 kHz bandwidth.
97.9 dBm81.9 dBm
99.9 dBm (typical)83.9 dBm (typical)
Accuracy, relative Display = Abs Peak Pwr Display = Rel Peak Pwr
0.14 dB0.56 dB
1.4%
Navg
---------------
Chapter 7 177

W-CDMA Measurement Personality
Conformance With 3GPP TS 25.141 Base Station Requirements for a Manufacturing Environment
Description Specifications Supplemental Information
Code Domain
BTS Measurements
25 dBm MLa15 dBm 25 to 35 °C b, Preamp (Option 1DS) Off, except as noted
a. ML (mixer level) is RF input power minus attenuation.b. This table is intended for users in the manufacturing environment, and as such, the tolerance limits
have been computed for temperatures of the ambient air near the analyzer of 25 to 35 °C.
Following specifications are 95 % c, unless stated as (nominal).
c. All specifications given are derived from 95th percentile observations with 95 % confidence.
Code domain power
Minimum power at RF input
Preamp (Option 1DS) Off Preamp (Option 1DS) On Maximum power at RF input Preamp (Option 1DS) On
75 dBm (nominal)d e102 dBm (nominal)f45 dBm (nominal)g
d. Nominal operating range. Accuracy specifications apply when mixer level (RF input power minus attenuation) is between 25 and 15 dBm.
e. Predefined test models under the Symbol Boundary menu are recommended for RF input power levels below 60 dBm. At low signal-to-noise ratios the auto channel ID algorithm may not correctly detect an active code channel as turned on. The predefined test model bypasses the auto channel ID algorithm.
f. CPICH synchronization requires a minimum RF input power of 102 dBm. CPICH synchronization can be achieved for RF input power down to 112 dBm, but lock will not be consistent.
g. CPICH synchronization can be obtained above 45 dBm, but TOI products will begin to raise the code domain noise floor. The power range that is free from TOI-induced noise floor problems can be extended up to 20 dB by increasing the input attenuation above the factory preset setting of 0 dB when using the preamplifier. There is no auto mode for setting input attenuation when the preamplifier is On.
178 Chapter 7

W-CDMA Measurement Personality
Conformance With 3GPP TS 25.141 Base Station Requirements for a Manufacturing Environment
Description Specifications Supplemental Information
Relative accuracy a
a. A code channel power measurement made on a specific spreading code includes all power that projects onto that code. This power is primarily made up from the intended signal power that was spread using that code, but also includes that part of the SCH power (when present) that also projects onto the code being measured. The reason for this addition is that the SCH power is spread using a gold code, which is not orthogonal to the code being measured. The increase in decibels due to this SCH leakage effect is given by the following formula:SCH leakage effect = 10 log (10PS/10P/(10F) + 10PC/10P) CWhere:S = Relative SCH power in dB (during the first 10 % of each timeslot)F = Spreading factor of the code channel being measuredC = Ideal relative code channel power in dB (excluding SCH energy)For example, consider a composite signal comprising the SCH set to 10 dB during the first 10 % of each slot, and a DPCH at spreading factor 128 set to 28 dB. Performing a code channel power mea-surement on the DPCH will return a nominal code channel power measurement of 27.79 dB. The SCH leakage effect of 0.21 dB should not be considered as a measurement error but rather the expected consequence of the non-orthogonal SCH projecting energy onto the code used by the DPCH.In order to calculate the ideal code channel power C from a code channel power measurement M that includes SCH energy, the following formula can be used:C = 10 log (10PM/10 P 10PS/10P/(10F))Therefore a code channel power measurement M = 27.79 dB at spreading factor 128 of a signal including a relative SCH power of 10 dB indicates an ideal code channel power of 28 dB.
Test signal
Test Model 2 Code domain power range
0 to 10 dBc 10 to 30 dBc 30 to 40 dBc
0.015 dB0.06 dB0.07 dB
Test Model 1 with 32 DPCH Code domain power range
0 to 10 dBc 10 to 30 dBc 30 to 40 dBc
0.015 dB0.08 dB0.15 dB
Symbol power vs. time b
b. The SCH leakage effect due to its being spread by a gold code not orthogonal to the symbol power being measured will add additional power to the measured result during the portion of the slot where SCH power is present. When SCH power is present, the accuracy specification applies but the signal being measured will include the noise-like contribution of the SCH power.
Minimum power at RF Input 50 dBm (nominal) c d
c. CPICH synchronization requires a minimum RF input power of 102 dBm. CPICH synchronization can be achieved for RF input power down to 112 dBm, but lock will not be consistent.
Chapter 7 179

W-CDMA Measurement Personality
Conformance With 3GPP TS 25.141 Base Station Requirements for a Manufacturing Environment
d. CPICH synchronization can be obtained above 45 dBm, but TOI products will begin to raise the code domain noise floor. The power range that is free from TOI-induced noise floor problems can be extended up to 20 dB by increasing the input attenuation above the factory preset setting of 0 dB when using the preamplifier. There is no auto mode for setting input attenuation when the preamplifier is On.
180 Chapter 7

W-CDMA Measurement Personality
Conformance With 3GPP TS 25.141 Base Station Requirements for a Manufacturing Environment
Description Specifications Supplemental Information
Relative accuracy Test signal Test Model 1 with 32 DPCH signal Code domain power range
0 to 25 dBc 25 to 40 dBc
0.10 dB0.50 dB
Symbol error vector magnitude
Minimum power at RF Input 50 dBm (nominal) a b
a. CPICH synchronization requires a minimum RF input power of 102 dBm. CPICH synchronization can be achieved for RF input power down to 112 dBm, but lock will not be consistent.
b. CPICH synchronization can be obtained above 45 dBm, but TOI products will begin to raise the code domain noise floor. The power range that is free from TOI-induced noise floor problems can be extended up to 20 dB by increasing the input attenuation above the factory preset setting of 0 dB when using the preamplifier. There is no auto mode for setting input attenuation when the preamplifier is On.
Accuracy Test signal Test Model 1 with 32 DPCH signal Code domain power range 0 to 25 dBc
1.0 %
Chapter 7 181

W-CDMA Measurement Personality
Conformance With 3GPP TS 25.141 Base Station Requirements for a Manufacturing Environment
Description Specifications Supplemental Information
QPSK EVM
Preamp (Option 1DS) Off, except as noted.
Minimum power at RF Input 20 dBm (nominal)
QPSK Downlink
EVM Operating range
0 to 25 % (nominal)
Floor
Preamp (Option 1DS) Off Preamp (Option 1DS) On
1.5 %
1.5 % (nominal)RF input power = 50 dBm,Attenuator = 0 dB
Accuracya 1.0 % (nominal) at EVM of 10 %
I/Q origin offset DUT Maximum Offset Analyzer Noise Floor
10 dBc (nominal)50 dBc (nominal)
Frequency error Range
300 kHz (nominal)
Accuracy 10 Hz (nominal) + tfa b
12.2 k RMC Uplink
EVM Operating range Floor Accuracy a
0 to 20 % (nominal)1.5 % (nominal)1.0 % (nominal) at EVM of 10 %
I/Q origin offset DUT Maximum Offset Analyzer Noise Floor
10 dBc (nominal)50 dBc (nominal)
Frequency error Range Accuracy
20 kHz (nominal)10 Hz (nominal) + tfa b
182 Chapter 7

W-CDMA Measurement Personality
Conformance With 3GPP TS 25.141 Base Station Requirements for a Manufacturing Environment
a. The accuracy specification applies when the EVM to be measured is well above the measurement floor. When the EVM does not greatly exceed the floor, the errors due to the floor add to the accuracy errors. The errors due to the floor are noise-like and add incoherently with the UUT EVM. The errors depend
on the EVM of the UUT and the floor as follows: error = sqrt(EVMUUT2 + EVMsa2) EVMUUT, where EVMUUT is the EVM of the UUT in percent, and EVMsa is the EVM floor of the analyzer in percent. For example, if the EVM of the UUT is 7 %, and the floor is 2.5 %, the error due to the floor is 0.43 %. The total error can cause a reading as high as EVMUUT + floorerror + accyerror, or as low as EVMUUT accyerror, where floorerror is the result of the error computation due to the floor, and accyerror is the specified accuracy.
b. tfa = transmitter frequency frequency reference accuracy
Chapter 7 183

W-CDMA Measurement Personality
Conformance With 3GPP TS 25.141 Base Station Requirements for a Manufacturing Environment
Description Specifications Supplemental Information
Modulation Accuracy
(Composite EVM) BTS Measurements 25 dBm MLa 15 dBm Preamp (Option 1DS) Off, except as noted
a. ML (mixer level) is RF input power minus attenuation.
Following specifications are
95 % b, unless stated as (nominal).
b. All specifications given are derived from 95th percentile observations with 95 % confidence.
Composite EVM Minimum power at RF input Preamp (Option 1DS) Off Preamp (Option 1DS) On
75 dBm (nominal) c d102 dBm (nominal) e
c. Predefined test models under the Symbol Boundary menu are recommended for RF input power levels below 60 dBm. At low signal-to-noise ratios the auto channel ID algorithm may not correctly detect an active code channel as turned on. The predefined test model bypasses the auto channel ID algorithm.
d. Nominal operating range. Accuracy specification applies when mixer level (RF input power minus attenuation) is between 25 and 15 dBm.
e. CPICH synchronization requires a minimum RF input power of 102 dBm. CPICH synchronization can be achieved for RF input power down to 112 dBm, but lock will not be consistent.
Maximum power at RF input Preamp (Option 1DS) On
45 dBm (nominal) f
f. CPICH synchronization can be obtained above 45 dBm, but TOI products will begin to raise the EVM floor. The power range that is free from TOI-induced noise floor problems can be extended up to 20 dB by increasing the input attenuation above the factory preset setting of 0 dB when using the preamplifier. There is no auto mode for setting input attenuation when the preamplifier is On.
Test Model 4 Range Floor Accuracy g
g. The accuracy specification applies when the EVM to be measured is well above the measurement floor. When the EVM does not greatly exceed the floor, the errors due to the floor add to the accuracy errors. The errors due to the floor are noise-like and add incoherently with the UUT EVM. The errors depend
on the EVM of the UUT and the floor as follows: error = sqrt(EVMUUT2 + EVMsa2) EVMUUT, where EVMUUT is the EVM of the UUT in percent, and EVMsa is the EVM floor of the analyzer in percent. For example, if the EVM of the UUT is 7 %, and the floor is 2.5 %, the error due to the floor is 0.43 %. The total error can cause a reading as high as EVMUUT + floorerror + accyerror, or as low as EVMUUT accyerror, where floorerror is the result of the error computation due to the floor, and accy-error is the specified accuracy.
0 to 25 %1.5 %
1.0 %
Test Model 1 with 32 DPCH Range Floor Accuracy h
0 to 25 %1.5 %
1.0 %
184 Chapter 7

W-CDMA Measurement Personality
Conformance With 3GPP TS 25.141 Base Station Requirements for a Manufacturing Environment
h. The accuracy specification applies when the EVM to be measured is well above the measurement floor. When the EVM does not greatly exceed the floor, the errors due to the floor add to the accuracy errors. The errors due to the floor are noise-like and add incoherently with the UUT EVM. The errors depend
on the EVM of the UUT and the floor as follows: error = sqrt(EVMUUT2 + EVMsa2) EVMUUT, where EVMUUT is the EVM of the UUT in percent, and EVMsa is the EVM floor of the analyzer in percent. For example, if the EVM of the UUT is 7 %, and the floor is 2.5 %, the error due to the floor is 0.43 %. The total error can cause a reading as high as EVMUUT + floorerror + accyerror, or as low as EVMUUT accyerror, where floorerror is the result of the error computation due to the floor, and accy-error is the specified accuracy.
Chapter 7 185

W-CDMA Measurement Personality
Conformance With 3GPP TS 25.141 Base Station Requirements for a Manufacturing Environment
Description Specifications Supplemental Information
Peak Code Domain Error Using Test Model 3 with 16 DPCH signal spreading code 256 Accuracy
1.0 dB (nominal)
I/Q Origin Offset DUT Maximum Offset Analyzer Noise Floor
10 dBc (nominal)50 dBc (nominal)
Frequency Error Specified for CPICH power 15 dBc Range Accuracy
500 Hz 2 Hz + tfa a
a. tfa = transmitter frequency frequency reference accuracy
Time offset Absolute frame offset accuracy Relative frame offset accuracy Relative offset accuracy (for STTD diff mode) b
b. The accuracy specification applies when the measured signal is the combination of CPICH (antenna 1) and CPICH (Antenna 2), and where the power level of each CPICH is 3 dB relative to the total power of the combined signal. Further, the range of the measurement for the accuracy specification to apply is0.1 chips.
150 ns1.25 ns
5.0 ns (nominal)
Spectrum (Frequency Domain) See “Spectrum” on page 150.
Waveform (Time Domain) See “Waveform” on page 151.
186 Chapter 7

W-CDMA Measurement Personality
Conformance With 3GPP TS 25.141 Base Station Requirements for a Manufacturing Environment
Description Specifications Supplemental Information
Power Control and Power vs. Time
Absolute power measurement Using 5 MHz resolution bandwidth
Accuracy
0 to 20 dBm 0.7 dB (nominal)
20 to 60 dBm 1.0 dB (nominal)
Relative power measurement
Accuracy
Step range 1.5 dB 0.1 dB (nominal)
Step range 3.0 dB 0.15 dB (nominal)
Step range 4.5 dB 0.2 dB (nominal)
Step range 26.0 dB 0.3 dB (nominal)
Chapter 7 187

W-CDMA Measurement Personality
Frequency
Frequency
Description Specifications Supplemental Information
In-Band Frequency Range 2110 to 2170 MHz1920 to 1980 MHz
188 Chapter 7

W-CDMA Measurement Personality
General
General
Description Specifications Supplemental Information
Trigger
Trigger source RF burst (wideband), Video (IF envelope), Ext Front, Ext Rear. Actual choices are dependent on measurement.
Trigger delay, level, & slope Each trigger source has separate set of these parameters.
Trigger delay Range Repeatability Resolution
100 to +500 ms33 ns33 ns
External trigger inputs Level Impedance
5 V to +5 V (nominal)10 k (nominal)
Range Control RF Input Autorange aManually set Max Total PwrManually set Input Atten
a. Autorange is not continuous with each measurement acquisition; it will run only once immediately fol-lowing a measurement restart, initiated either by pressing Restart or by sending the GPIB command INIT:IMM. This behavior was chosen to maintain best measurement speed, but it requires caution when input power levels change. If the input signal power changes, the analyzer will not readjust the input attenuators for optimal dynamic range unless a measurement restart is initiated. For example, if a sequence of power measurements is made, beginning with a maximum power level that is large enough to require non-zero input attenuation, it is advisable to do a measurement restart to automatically set a lower input attenuator value to maintain optimal dynamic range for approximately every 3 dB the input signal power level is reduced, or smaller, depending upon how precisely dynamic range needs to be optimized. Conversely, if the input signal power increases to a high enough level, input overloading will occur if the input attenuators are not readjusted by doing a measurement restart.
Chapter 7 189

W-CDMA Measurement Personality
General
190 Chapter 7

8 HSDPA/HSUPA Measurement Personality
This chapter contains specifications for the PSA series, Option 210, HSDPA/HSUPA measurement personality.
191

HSDPA/HSUPA Measurement Personality
Additional Definitions and Requirements
Additional Definitions and Requirements
Because digital communications signals are noise-like, all measurements will have variations. The specifications apply only with adequate averaging to remove those variations.
The specifications apply in the frequency ranges documented in In-Band Frequency Range.
The specifications for this chapter apply to the E4440A, E4443A and E4445A spectrum analyzers. For the E4446A, E4447A, and E4448A, the performance is nominal only and not subject to any warranted specifications.
The measurement performance is only slightly different in the E4446A, E4447A, and E4448A when compared to the performance of the E4440A, E4443A and E4445A analyzers. Because the hardware performance of the analyzers is very similar but not identical, you can estimate the nominal performance of the measurements from the specifications in this chapter.
192 Chapter 8

HSDPA/HSUPA Measurement Personality
Option 210, HSDPA/HSUPA Measurement Personality
Option 210, HSDPA/HSUPA Measurement Personality
Description Specifications Supplemental Information
Code Domain
BTS Measurements 25 dBm MLa 15 dBm 25 to 35 °C b Preamp (Option 1DS) Off, except as noted
a. ML (mixer level) is RF input power minus attenuation.b. This table is intended for users in the manufacturing environment, and as such, the tolerance limits have
been computed for temperatures of the ambient air near the analyzer of 25 to 35 °C.
Following specifications are
95 % c, unless stated as (nominal).
c. Nominal operating range. Accuracy specifications apply when mixer level (RF input power minus attenuation) is between 25 and 15 dBm.
Code domain power
Minimum power at RF input
Preamp (Option 1DS) Off Preamp (Option 1DS) On Maximum power at RF input Preamp (Option 1DS) On
75 dBm (nominal)c d102 dBm (nominal)e45 dBm (nominal)f
d. Predefined test models under the Symbol Boundary menu are recommended for RF input power levels below 60 dBm. At low signal-to-noise ratios the auto channel ID algorithm may not correctly detect an active code channel as turned on. The predefined test model bypasses the auto channel ID algorithm.
e. CPICH synchronization requires a minimum RF input power of 102 dBm. CPICH synchronization can be achieved for RF input power down to 112 dBm, but lock will not be consistent.
f. CPICH synchronization can be obtained above 45 dBm, but TOI products will begin to raise the code domain noise floor. The power range that is free from TOI-induced noise floor problems can be extended up to 20 dB by increasing the input attenuation above the factory preset setting of 0 dB when using the preamplifier. There is no auto mode for setting input attenuation when the preamplifier is On.
Chapter 8 193

HSDPA/HSUPA Measurement Personality
Option 210, HSDPA/HSUPA Measurement Personality
Description Specifications Supplemental Information
Relative accuracy a
a. A code channel power measurement made on a specific spreading code includes all power that projects onto that code. This power is primarily made up from the intended signal power that was spread using that code, but also includes that part of the SCH power (when present) that also projects onto the code being measured. The reason for this addition is that the SCH power is spread using a gold code, which is not orthogonal to the code being measured. The increase in decibels due to this SCH leakage effect is given by the following formula:
Where: S = Relative SCH power in dB (during the first 10 % of each timeslot) F = Spreading factor of the code channel being measured C = Ideal relative code channel power in dB (excluding SCH energy) For example, consider a composite signal comprising the SCH set to 10 dB during the first 10 % of each slot, and a DPCH at spreading factor 128 set to 28 dB. Performing a code channel power mea-surement on the DPCH will return a nominal code channel power measurement of 27.79 dB. The SCH leakage effect of 0.21 dB should not be considered as a measurement error but rather the expected con-sequence of the non-orthogonal SCH projecting energy onto the code used by the DPCH. In order to calculate the ideal code channel power C from a code channel power measurement M that includes SCH energy, the following formula can be used:
Therefore a code channel power measurement M = 27.79 dB at spreading factor 128 of a signal including a relative SCH power of 10 dB indicates an ideal code channel power of 28 dB.
Test signal
Test Model 2 Code domain power range
0 to 10 dBc 10 to 30 dBc 30 to 40 dBc
0.015 dB0.06 dB0.07 dB
Test Model 1 with 32 DPCH Code domain power range
0 to 10 dBc 10 to 30 dBc 30 to 40 dBc
0.015 dB0.08 dB0.15 dB
Test Model 5 with 8 HS-PDSCH Code domain power range
0 to 10 dBc 10 to 30 dBc 30 to 40 dBc
0.015 dB (nominal)0.08 dB (nominal)0.15 dB (nominal)
SCHleakage dB 10 10
S10------
10F 10
C10------
+
C–log=
C dB 10 10
M10------
10
S10------
10F –
log=
194 Chapter 8

HSDPA/HSUPA Measurement Personality
Option 210, HSDPA/HSUPA Measurement Personality
Description Specifications Supplemental Information
Symbol power vs. time a
a. Relative accuracy applies when examining data outside of where SCH is active.
Minimum power at RF Input 50 dBm (nominal) b c
b. Nominal operating range. Accuracy specifications apply when mixer level (RF input power minus attenuation) is between 25 and 15 dBm.
c. CPICH synchronization requires a minimum RF input power of 102 dBm. CPICH synchroniza-tion can be achieved for RF input power down to 112 dBm, but lock will not be consistent.
Relative accuracy Test signal Test Model 1 with 32 DPCH signal Code domain power range
0 to 25 dBc 25 to 40 dBc
0.10 dB0.50 dB
Test Model 5 with 8 HS-PDSCH signal Code domain power range
0 to 25 dBc 25 to 40 dBc
0.10 dB (nominal)0.50 dB (nominal)
Symbol error vector magnitude
Minimum power at RF Input 50 dBm (nominal)
Accuracy Test signal Test Model 1 with 32 DPCH signal Code domain power range 0 to 25 dBc
1.0 %
Chapter 8 195

HSDPA/HSUPA Measurement Personality
Option 210, HSDPA/HSUPA Measurement Personality
Description Specifications Supplemental Information
Modulation Accuracy (Composite EVM)
BTS Measurements 25 dBm MLa 15 dBm Preamp (Option 1DS) Off, except as noted
a. ML (mixer level) is RF input power minus attenuation.
Following specifications are 95 %, unless stated as (nominal).
Composite EVM Minimum power at RF input Preamp (Option 1DS) Off Preamp (Option 1DS) On
75 dBm (nominal)b c102 dBm (nominal)d
b. Predefined test models under the Symbol Boundary menu are recommended for RF input power levels below 60 dBm. At low signaltonoise ratios the auto channel ID algorithm may not correctly detect an active code channel as turned on. The predefined test model bypasses the auto channel ID algorithm.
c. Nominal operating range. Accuracy specification applies when mixer level (RF input power minus attenuation) is between 25 and 15 dBm.
d. CPICH synchronization requires a minimum RF input power of 102 dBm. CPICH synchronization can be achieved for RF input power down to 112 dBm, but lock will not be consistent.
Maximum power at RF input Preamp (Option 1DS) On
45 dBm (nominal)e
e. CPICH synchronization can be achieved for RF input power down to 112 dBm, but lock will not be consistent. CPICH synchronization can be obtained above 45 dBm, but TOI products will begin to raise the EVM floor. The power range that is free from TOIinduced noise floor problems can be extended up to 20 dB by increasing the input attenuation above the factory preset setting of 0 dB when using the preamplifier. There is no auto mode for setting input attenuation when the preamplifier is On.
Test Model 4 Range Floor Accuracyf
0 to 25 %1.5 %
1.0 % (nominal)
Test Model 1 with 32 DPCH Range Floor Accuracy f
0 to 25 %1.5 %
1.0 % (nominal)
Test Model 5 with 8 HSPDSCH Range Floor Accuracy f
0 to 25 % (nominal)1.5 % (nominal)1.0 % (nominal)
196 Chapter 8

HSDPA/HSUPA Measurement Personality
Option 210, HSDPA/HSUPA Measurement Personality
f. The accuracy specification applies when the EVM to be measured is well above the measurement floor. When the EVM does not greatly exceed the floor, the errors due to the floor add to the accuracy errors. The errors due to the floor are noiselike and add incoherently with the UUT EVM. The errors depend
on the EVM of the UUT and the floor as follows: error = sqrt(EVMUUT2 + EVMsa2) EVMUUT, where EVMUUT is the EVM of the UUT in percent, and EVMsa is the EVM floor of the analyzer in percent. For example, if the EVM of the UUT is 7 %, and the floor is 2.5 %, the error due to the floor is 0.43 %. The total error can cause a reading as high as EVMUUT + floorerror + accyerror, or as low as EVMUUT accyerror, where floorerror is the result of the error computation due to the floor, and accyerror is the specified accuracy.
Description Specifications Supplemental Information
Peak Code Domain Error Accuracy Using Test Model 3 with 16 DPCH signal; spreading code 256
1.0 % (nominal)
Using Test Model 5 with 8 HS-PDSCH signal; spreading code 256
1.0 % (nominal)
I/Q Origin Offset DUT Maximum Offset Analyzer Noise Floor
10 dBc (nominal)50 dBc (nominal)
Frequency Error Specified for CPICH power 15 dBc Range Accuracy
500 Hz 2 Hz + tfa a
a. tfa = transmitter frequency frequency reference accuracy
Time offset Absolute frame offset accuracy Relative frame offset accuracy Relative offset accuracy b (for STTD diff mode)
b. The accuracy specification applies when the measured signal is the combination of CPICH (antenna 1) and CPICH (Antenna 2), and where the power level of each CPICH is 3 dB relative to the total power of the combined signal. Further, the range of the measurement for the accuracy specification to apply is0.5 chips.
150 ns1.25 ns
5.0 ns (nominal)
Spectrum (Frequency Domain) See “Spectrum” on page 150.
Waveform (Time Domain) See “Waveform” on page 151.
Chapter 8 197
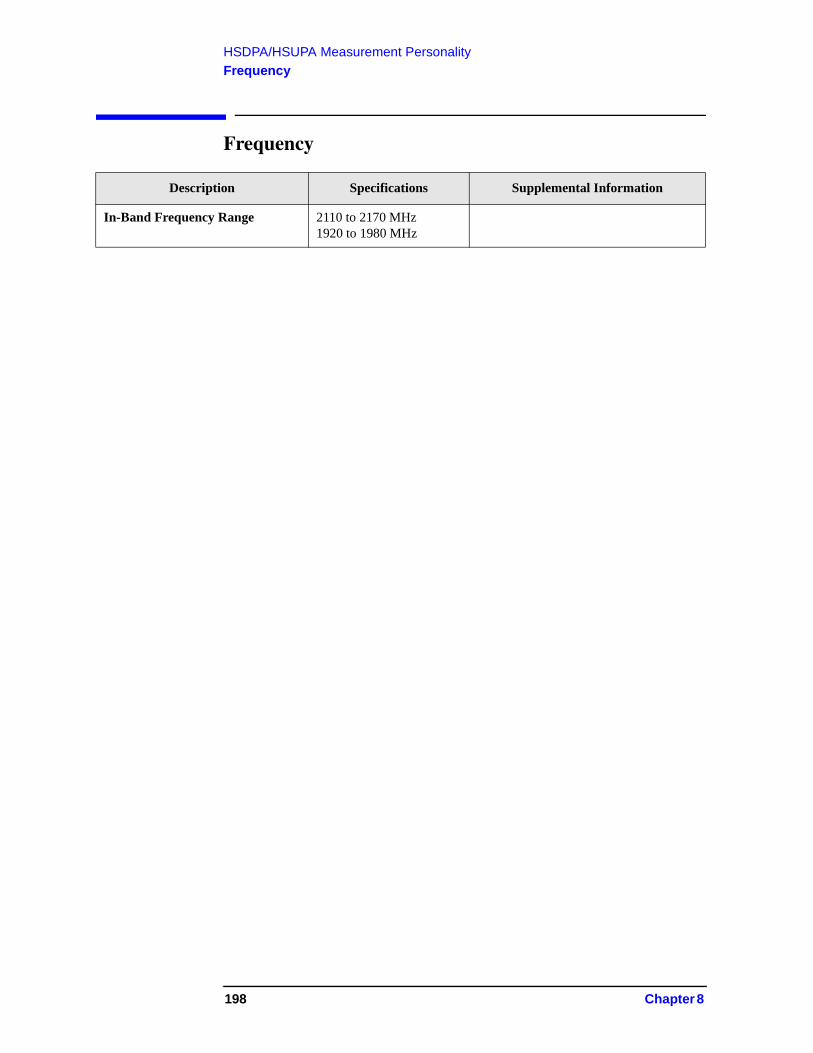
HSDPA/HSUPA Measurement Personality
Frequency
Frequency
Description Specifications Supplemental Information
In-Band Frequency Range 2110 to 2170 MHz1920 to 1980 MHz
198 Chapter 8

HSDPA/HSUPA Measurement Personality
General
General
Description Specifications Supplemental Information
Trigger
Trigger source RF burst (wideband), Video (IF envelope), Ext Front, Ext Rear. Actual choices are dependent on measurement.
Trigger delay, level, & slope Each trigger source has separate set of these parameters.
Trigger delay Range Repeatability Resolution
100 to +500 ms33 ns33 ns
External trigger inputs Level Impedance
5 V to +5 V (characteristic)10 kW (nominal)
Range Control RF Input Autorange aManually set Max Total Pwr Manually set Input Atten
a. Auto range is not continuous with each measurement acquisition; it will run only once immediately fol-lowing a measurement restart, initiated either by pressing the Restart key, or by sending the GPIB com-mand INIT:IMM. This behavior was chosen to maintain best measurement speed, but it requires caution when input power levels change. If the input signal power changes, the analyzer will not read-just the input attenuators for optimal dynamic range unless a measurement restart is initiated. For exam-ple, if a sequence of power measurements is made, beginning with a maximum power level that is large enough to require non-zero input attenuation, it is advisable to do a measurement restart to automati-cally set a lower input attenuator value to maintain optimal dynamic range for approximately every 3 dB the input signal power level is reduced, or smaller, depending upon how precisely dynamic range needs to be optimized. Conversely, if the input signal power increases to a high enough level, input overloading will occur if the input attenuators are not readjusted by doing a measurement restart.
Chapter 8 199

HSDPA/HSUPA Measurement Personality
General
200 Chapter 8

9 cdmaOne Measurement Personality
This chapter contains specifications for the PSA series, Option BAC, cdmaOne measurement personality.
201

cdmaOne Measurement Personality
Additional Definitions and Requirements
Additional Definitions and Requirements
Because digital communications signals are noise-like, all measurements will have variations. The specifications apply only with adequate averaging to remove those variations.
The specifications apply in the frequency ranges documented in In-Band Frequency Range.
The specifications for this chapter apply to the E4440A, E4443A and E4445A spectrum analyzers. For the E4446A, E4447A, and E4448A, the performance is nominal only and not subject to any warranted specifications.
The measurement performance is only slightly different in the E4446A, E4447A, and E4448A when compared to the performance of the E4440A, E4443A and E4445A analyzers. Because the hardware performance of the analyzers is very similar but not identical, you can estimate the nominal performance of the measurements from the specifications in this chapter.
202 Chapter 9

cdmaOne Measurement Personality
Option BAC, cdmaOne Measurements Personality
Option BAC, cdmaOne Measurements Personality
Description Specifications Supplemental Information
Channel Power Measurement
1.23 MHz Integration BW
Minimum power at RF Input
75 dBm (nominal)
Absolute power accuracy a 20 C to 30 C attenuation > 2 dBb attenuation 2 dB
a. Absolute power accuracy includes all error sources for in-band signals except mismatch errors. There are two cases listed.
b. The absolute power accuracy depends on the setting of the electronic input attenuator as well as the sig-nal-to-noise ratio. For high input levels, the Auto setting of RF Input Range will result in high sig-nal-to-noise ratios and Input Atten > 2 dB, for which the absolute power accuracy is best. At moderate levels, manually setting the Input Atten can give better accuracy than the automatic setting. At very low levels, automatic or manual setting of the Input Atten to 0 dB optimizes the accuracy by maximizing the signal-to-noise ratio.For cdmaOne, “high levels” would nominally be levels above 14.7 dBm, and “very low levels” would nominally be below 66 dBm.The error due to very low signals levels is a function of the signal (channel power) to noise (measure-ment floor) ratio, SN, in decibels. The function is: For example, if the mixer level (input power minus attenuation) is 26.4 dB above the measurement floor, the error due to adding the analyzer's noise to the UUT is only 0.01 dB.
0.67 dB 0.76 dB
0.18 dB (typical)0.24 dB (typical)
Measurement floor c
c. Measurement floor is the channel power measured due only to the noise of the analyzer. The measure-ment floor nominally changes by +1 dB/GHz for signal frequencies different from the 1 GHz frequency for which this nominal floor was determined.
86 dBm + Input Attenuation (nominal)
Relative power accuracy Fixed channel Fixed input attenuator
0.08 dB 0.03 dB (typical)
Mixer level 52 to 12 dBm d
d. The relative accuracy is the ratio of the accuracy of amplitude measurements of two different transmit-ter power levels. Mixer level is defined to be the input power minus the attenuation. This specification is equivalent to the difference between two points on the scale fidelity curve shown in the PSA Specifi-cations Guide. The error sources of scale fidelity are almost all monotonic with input level, so the rela-tive error between two levels is nearly (within 0.01 dB) identical to the “error relative to 35 dBm” specified in the Guide.
Chapter 9 203

cdmaOne Measurement Personality
Option BAC, cdmaOne Measurements Personality
Description Specifications Supplemental Information
Code Domain (Base Station)
Minimum power at RF Input
40 dBm (nominal)
Measurement interval range 0.5 to 30 ms
Code domain power Dynamic Range
Measurement interval 2.0 ms50 dB (nominal)
Relative Power Accuracy 0.3 dB Walsh channel power within 20 dB of total power
Other reported power parameters Average active trafficMaximum inactive trafficAverage inactive trafficPilot, paging, sync channels
dB readings for these power measurements are referenced to total power
Frequency error Input frequency error range Accuracy
900 Hz10 Hz + tfa a
a. tfa = transmitter frequency frequency reference accuracy
Measurement interval 2.0 ms
Pilot time offset Range Accuracy Resolution
13.33 ms to +13.33 ms300 ns10 ns
From even second signal tostart of PN sequence
Code domain timing Range Accuracy Resolution
200 ns10 ns0.1 ns
Pilot to code channel time tolerance; measurement interval 2.0 ms
Code domain phase Range Accuracy Resolution
200 mrad10 mrad0.1 mrad
Pilot to code channel phasetolerance; measurement interval 2.0 ms
204 Chapter 9

cdmaOne Measurement Personality
Option BAC, cdmaOne Measurements Personality
Description Specifications Supplemental Information
Modulation Accuracy
Minimum power at RF Input 40 dBm (nominal)
Measurement interval range 0.5 to 30 ms
Rho (waveform quality) Range Accuracy 0.9 < Rho < 1.0 Resolution
0.9 to 1.00.0010.0001
Measurement interval 2.0 msOperating range 0.5 to 1.0
Frequency error Input frequency error range Accuracy
900 Hz10 Hz + tfa a
a. tfa = transmitter frequency frequency reference accuracy
Measurement interval 2.0 ms
Base station pilot time offset Range Accuracy Resolution
13.33 ms to +13.33 ms300 ns10 ns
From even second signal to start of PN sequence
EVM (RMS) Floor Accuracy b Range 0 to 14 %
b. The accuracy specification applies when the EVM to be measured is well above the measurement floor. When the EVM does not greatly exceed the floor, the errors due to the floor add to the accuracy errors. The errors due to the floor are noise-like and add incoherently with the UUT EVM. The errors depend
on the EVM of the UUT and the floor as follows: error = sqrt(EVMUUT2 + EVMsa2) EVMUUT, where EVMUUT is the EVM of the UUT in percent, and EVMsa is the EVM floor of the analyzer in percent. For example, if the EVM of the UUT is 7 %, and the floor is 2.5 %, the error due to the floor is 0.43 %. The total error can cause a reading as high as EVMUUT + floorerror + accyerror, or as low as EVMUUT – accyerror, where floorerror is the result of the error computation due to the floor, and accyerror is the specified accuracy.
2.0 %0.5 %
Measurement interval 2.0 ms1.5 % (typical)
Carrier feed through Floor Accuracy
55 dBc2.0 dB
Chapter 9 205

cdmaOne Measurement Personality
Option BAC, cdmaOne Measurements Personality
Description Specifications Supplemental Information
Adjacent Channel Power Ratio
Minimum power at RF Input 39 dBm (nominal)
Dynamic Range a
a. The optimum mixer level (mixer level is defined to be the average input power minus the input attenu-ation) is different for optimum ACPR dynamic range than the Auto setting of RF Input Level. For opti-mum dynamic range, the ideal mixer level is about 12 dBm for the 750 kHz offset, which is close to the input overload threshold. The setting for mixer level when RF Input Level is set to Auto is about 17 dBm. The advantage of the Auto setting is that it gives a greater range of allowable input peak-to-average ratios without registering an input overload.
Referenced to average power in 1.23 MHz BW
Offset Freq. (kHz)
Integ. BW (kHz)
750 30 86.7 dB Mixer level = 12 dBm
885 30 86.3 dB Mixer level = 12 dBm
1256.25 12.5 90.8 dB Mixer level = 12 dBm
1265 30 87.0 dB Mixer level = 12 dBm
1980 30 87.8 dB
2750 1000 72.7 dB
ACPR Relative Accuracy
Offsets < 1.30 MHz b Offsets > 1.85 MHz c
b. The specified ACPR accuracy applies if the measured ACPR substantially exceeds the analyzer dynamic range at the specified offset. When this condition is not met, there are additional errors due to the addition of analyzer spectral components to UUT spectral components. In the worst case at these offsets, the analyzer spectral components are all coherent with the UUT components; in a more typical case, one third of the analyzer spectral power will be coherent with the distortion components in the UUT. Coherent means that the phases of the UUT distortion components and the analyzer distortion components are in a fixed relationship, and could be perfectly in-phase. This coherence is not intuitive to many users, because the signals themselves are usually pseudo-random; nonetheless, they can be coherent. When the analyzer components are 100 % coherent with the UUT components, the errors add in a voltage sense. That error is a function of the signal (UUT ACPR) to noise (analyzer ACPR
dynamic range limitation) ratio, SN, in decibels. The function is error = 20 log(1 + 10(SN/20)). For example, if the UUT ACPR is 67 dB and the measurement floor is 87 dB, the SN is 20 dB and the error due to adding the analyzer's distortion to that of the UUT is 0.83 dB.
0.09 dB0.09 dB
206 Chapter 9

cdmaOne Measurement Personality
Option BAC, cdmaOne Measurements Personality
c. As in footnote b, the specified ACPR accuracy applies if the ACPR measured substantially exceeds the analyzer dynamic range at the specified offset. When this condition is not met, there are additional errors due to the addition of analyzer spectral components to UUT spectral components. Unlike the sit-uation in footnote b, however, the spectral components from the analyzer will be non-coherent with the components from the UUT. Because of this, the errors add in a power sense. The error is a function of the signal (UUT ACPR) to noise (analyzer ACPR dynamic range limitation) ratio, SN, in decibels.The function is:
For example, if the UUT ACPR is 78 dB and the measurement floor is 88 dB, the SN ratio is 10 dB and the error due to adding the analyzer’s noise to that of the UUT is 0.41 dB.
error 10 log 1 10SN– 10
+ =
Chapter 9 207

cdmaOne Measurement Personality
Option BAC, cdmaOne Measurements Personality
Description Specifications Supplemental Information
Spur Close
Minimum power at RF Input 35 dBm (nominal)
Minimum spurious emissionpower sensitivity at RF Input a
a. The sensitivity is the smallest CW signal that can be reliable detected, using the 30 kHz RBW, not including the effects of phase noise.
95 dBm + Input Attenuation
Representative Amplitude Accuracies b
b. The range of possible channel powers, and levels, frequencies and spacing of spurious signals makes complete specification of amplitude uncertainty as complex as it is for any spectrum analysis measure-ment. The error sources for arbitrary signals are given in the “Digital Communications Basic Measure-ment Personality” chapter. Therefore, just two examples will be specified.
Example Absolute Accuracy c Example Relative Accuracy d
c. The absolute power accuracy example is a base station test measuring a spurious signal at a typical specification limit of 13 dBm in a 30 kHz bandwidth 2 MHz offset from the center of the channel. The base station power is +40 dBm feed through an ideal 20 dB external attenuator. The specified accuracy excludes mismatch errors.
d. The relative power accuracy example is a base station test measuring a spurious signal 750 kHz offset from the center of the channel, at the typical specification limit of 45 dBc in a 30 kHz bandwidth, rel-ative to the power in the channel. The base station power is +20 dBm at the RF input.
0.89 dB0.09 dB
Spectrum (Frequency Domain) See “Spectrum” on page 150.
Waveform (Time Domain) See “Waveform” on page 151.
Description Specifications Supplemental Information
In-Band Frequency Ranges 824 to 849 MHz869 to 894 MHz
1850 to 1910 MHz1930 to 1990 MHz
IS-95IS-95
J-STD-008J-STD-008
208 Chapter 9

10 cdma2000 Measurement Personality
This chapter contains specifications for the PSA series, Option B78, cdma2000 measurement personality.
209

cdma2000 Measurement Personality
Additional Definitions and Requirements
Additional Definitions and Requirements
Because digital communications signals are noise-like, all measurements will have variations. The specifications apply only with adequate averaging to remove those variations.
The specifications apply in the frequency ranges documented in In-Band Frequency Range.
The specifications for this chapter apply to the E4440A, E4443A and E4445A spectrum analyzers. For the E4446A, E4447A, and E4448A, the performance is nominal only and not subject to any warranted specifications.
The measurement performance is only slightly different in the E4446A, E447A, and E4448A when compared to the performance of the E4440A, E4443A and E4445A analyzers. Because the hardware performance of the analyzers is very similar but not identical, you can estimate the nominal performance of the measurements from the specifications in this chapter.
210 Chapter 10

cdma2000 Measurement Personality
Option B78, cdma2000 Measurement Personality
Option B78, cdma2000 Measurement Personality
Description Specifications Supplemental Information
Channel Power
1.23 MHz Integration BW
Minimum power at RF input 74 dBm (nominal)
Absolute power accuracy a 20 to 30 C attenuation > 2 dBb attenuation 2 dB
a. Absolute power accuracy includes all error sources for in-band signals except mismatch errors. There are two cases listed.
b. The absolute power accuracy depends on the setting of the electronic input attenuator as well as the sig-nal-to-noise ratio. For high input levels, the Auto setting of RF Input Range will result in high sig-nal-to-noise ratios and Input Atten> 2 dB, for which the absolute power accuracy is best. At moderate levels, manually setting the Input Atten can give better accuracy than the automatic setting. At very low levels, automatic or manual setting of the Input Atten to 0 dB optimizes the accuracy by maximizing the signal-to-noise ratio. For cdmaOne, “high levels” would nominally be levels above 14.7 dBm, and “very low levels” would nominally be below 66 dBm.The error due to very low signals levels is a function of the signal (channel power) to noise (measure-ment floor) ratio, SN, in decibels.
The function is: For example, if the mixer level (input power minus attenuation) is 26.4 dB above the measurement floor, the error due to adding the analyzer's noise to the UUT is only 0.01 dB.
0.67 dB0.76 dB
0.18 dB (typical)0.24 dB (typical)
Measurement floor c
c. Measurement floor is the channel power measured due only to the noise of the analyzer. It nominally changes by +1 dB/GHz for signal frequencies different from the 2 GHz frequency for which this nomi-nal floor was determined.
85 dBm (nominal)
Relative power accuracy Fixed channel Fixed input attenuator Mixer level 52 to 12 dBm d
d. The relative accuracy is the ratio of the accuracy of amplitude measurements of two different transmit-ter power levels. Mixer level is defined to be the input power minus the attenuation. This specification is equivalent to the difference between two points on the scale fidelity curve shown in the PSA Specifi-cations Guide. Because the error sources of scale fidelity are almost all monotonic with input level, the relative error between two levels is nearly (within 0.01 dB) identical to the “error relative to 35 dBm” specified in the Guide.
0.08 dB 0.03 dB (typical)
error 10 log 1 10SN– 10
+ =
Chapter 10 211

cdma2000 Measurement Personality
Option B78, cdma2000 Measurement Personality
Description Specifications Supplemental Information
Adjacent Channel Power Ratio
Minimum power at RF input 38 dBm (nominal)
Dynamic range a
a. The optimum mixer level (mixer level is defined to be the average input power minus the input attenu-ation) is different for optimum ACPR dynamic range than the Auto setting of RF Input Level. For opti-mum dynamic range, the ideal mixer level is about 12 dBm for the 750 kHz offset, which is close to the input overload threshold. The setting for mixer level when RF Input Level is set to Auto is about 17 dBm. The advantage of the Auto setting is that it gives a greater range of allowable input peak-to-average ratios without registering an input overload
Referenced to average power of carrier in 1.23 MHz bandwidth
Offset Freq. Integ. BW
750 kHz 30 kHz 84.9 dBc Optimum mixer levelb = 12 dBm
b. These specifications apply with an apparent mixer level of 17 dBm. Mixer level is defined to be input power minus input attenuation. The apparent mixer level is different from the actual mixer level because the actual attenuation is decreased by 5 dB, compared to the attenuation shown, when measur-ing the adjacent channels, in order to improve dynamic range. Therefore, these specifications only apply when the input attenuation is 5 dB or more and the apparent mixer level is 17 dBm.
885 kHz 30 kHz 85.2 dBc Optimum mixer level = 12 dBm
1256.25 kHz 12.5 kHz 89.6 dBc Optimum mixer level = 12 dBm
1980 kHz 30 kHz 86.8 dBc
2750 kHz 1000 kHz 71.7 dBc
ACPR Relative Accuracy
Offsets < 1300 kHz c Offsets > 1.85 MHz d
c. The specified ACPR accuracy applies if the measured ACPR substantially exceeds the analyzer dynamic range at the specified offset. When this condition is not met, there are additional errors due to the addition of analyzer spectral components to UUT spectral components. In the worst case at these offsets, the analyzer spectral components are all coherent with the UUT components; in a more typical case, one third of the analyzer spectral power will be coherent with the distortion components in the UUT. Coherent means that the phases of the UUT distortion components and the analyzer distortion components are in a fixed relationship, and could be perfectly in-phase. This coherence is not intuitive to many users, because the signals themselves are usually pseudo-random; nonetheless, they can be coherent. When the analyzer components are 100 % coherent with the UUT components, the errors add in a voltage sense. That error is a function of the signal (UUT ACPR) to noise (analyzer ACPR
dynamic range limitation) ratio, SN, in decibels. The function is error = 20 log(1 + 10 SN/20). For example, if the UUT ACPR is 62 dB and the measurement floor is 82 dB, the SN is 20 dB and the error due to adding the analyzer's distortion to that of the UUT is 0.83 dB.
0.09 dB0.09 dB
212 Chapter 10

cdma2000 Measurement Personality
Option B78, cdma2000 Measurement Personality
d. As in footnote b, the specified ACPR accuracy applies if the ACPR measured substantially exceeds the analyzer dynamic range at the specified offset. When this condition is not met, there are additional errors due to the addition of analyzer spectral components to UUT spectral components. Unlike the sit-uation in footnote a, though, the spectral components from the analyzer will be non-coherent with the components from the UUT. Therefore, the errors add in a power sense. The error is a function of the signal (UUT ACPR) to noise (analyzer ACPR dynamic range limitation) ratio, SN, in decibels. The
function is error = 10 log (1 + 10 SN/10). For example, if the UUT ACPR is 75 dB and the measure-ment floor is 85 dB, the SN ratio is 10 dB and the error due to adding the analyzer's noise to that of the UUT is 0.41 dB.
Description Specification Supplemental Information
Power Statistics CCDF
Minimum power at RF Input
Histogram Resolution 0.01 dB a
a. The Complementary Cumulative Distribution Function (CCDF) is a reformatting of a histogram of the power envelope. The width of the amplitude bins used by the histogram is the histogram resolution. The resolution of the CCDF will be the same as the width of those bins.
40 dBm (nominal)
Chapter 10 213

cdma2000 Measurement Personality
Option B78, cdma2000 Measurement Personality
Description Specification Supplemental Information
Intermodulation
Minimum carrier power at RF Input 30 dBm (nominal)
Third-order intercept CF = 1 GHz CF = 2 GHz
TOI + 7.2 dB aTOI + 7.5 dB a
a. The third-order intercept (TOI) of the analyzer as configured for the cdma2000 personality is higher than the third-order intercept specified for the analyzer without the personality, due to the configuration of loss elements in front of the input mixer. The personality configures the mechanical attenuator to be in a fixed 6 dB attenuation position, and has additional loss in the electronic attenuator. The TOI increases by the nominal amount shown due to these losses when the electronic attenuator is set to 0 dB, and further increases proportional to the setting of the electronic attenuator.
Description Specification Supplemental Information
Occupied Bandwidth
Minimum carrier power at RF Input 40 dBm (nominal)
Frequency resolution 100 Hz
Frequency accuracy
(nominal)a
a. The errors in Occupied Bandwidth measurement are mostly due to the noisiness of any measurement of a noise-like signal, such as the cdma2000 signal. The observed standard deviation of the OBW mea-surement is 14 kHz (1.2 %), so with 100 averages, the standard deviation should be about 1.4 kHz, or 0.1 %.
1.2%
Navg
---------------
214 Chapter 10

cdma2000 Measurement Personality
Option B78, cdma2000 Measurement Personality
Description Specifications Supplemental Information
Spectrum Emission Mask
Minimum carrier power at RF Input 20 dBm (nominal)
Dynamic Range, relative a
a. The dynamic range specification is the ratio of the channel power to the power in the offset and region specified. The dynamic range depends on the measurement settings, such as peak power or integrated power. This specification is derived from other analyzer performance limitations such as third-order intermodulation, DANL and phase noise. Dynamic range specifications are based on default measure-ment settings, with detector set to average, and depend on the mixer level. Mixer level is defined to be the input power minus the input attenuation.
750 kHz offset b 1980 MHz region c
b. Default measurement settings include 30 kHz RBW. This dynamic range specification applies for the optimum mixer level, which is about 11 dBm.
c. Default measurement settings include 1200 kHz RBW. This dynamic range specification applies for a mixer level of 0 dBm. Higher mixer levels can give up to 5 dB better dynamic range, but at the expense of compression in the input mixer, which reduces accuracy. The compression behavior of the input mixer is specified in the PSA Specifications Guide; the levels into the mixer are nominally 8 dB lower in this application when the center frequency is 2 GHz.
84.7 dB80.7 dB
86.4 dB (typical)83.0 dB (typical)
Sensitivity, absolute d
d. The sensitivity is specified with 0 dB input attenuation. It represents the noise limitations of the ana-lyzer. It is tested without an input signal.
750 kHz offset e 1980 MHz region f
e. The sensitivity at this offset is specified for the default 30 kHz RBW, at a center frequency of 2 GHz.f. The sensitivity for this region is specified for the default 1200 kHz bandwidth, at a center frequency of
2 GHz.
97.9 dBm81.9 dBm
99.9 dBm (typical)83.9 dBm (typical)
Accuracy, relative 750 kHz offset g 1980 MHz region h
g. The relative accuracy is a measure of the ratio of the power at the offset to the main channel power. It applies for spectrum emission levels in the offsets that are well above the dynamic range limitation.
h. The relative accuracy is a measure of the ratio of the power in the region to the main channel power. It applies for spurious emission levels in the regions that are well above the dynamic range limitation.
0.14 dB0.56 dB
Chapter 10 215

cdma2000 Measurement Personality
Option B78, cdma2000 Measurement Personality
Description Specifications Supplemental Information
Code Domain Specifications apply to BTS for 9 active channels as defined in 3GPP2, and where the mixer level (RF input power minus attenuation) is between 25 and 15 dBm.
Code domain power
Power range at RF input Preamplifier On
80 to 40 dBm (nominal)a
a. Pilot synchronization requires a minimum RF input power of 80 dBm. Pilot synchronization can be obtained above 40 dBm, but TOI products will begin to raise the code domain noise floor. The power range that is free from TOI-induced noise floor problems can be extended up to 20 dB by increasing the input attenuation above the factory preset setting of 0 dB when using the preamplifier. There is no auto mode for setting input attenuation when the preamplifier is On.
The following specifications are applicable with the Preamplifier (Option 1DS) Off.
Code domain power
Minimum power at RF input 60 dBm (nominal)b c
b. At low signal-to-noise ratios where the RF input power is below 65 dBm, the auto channel ID algo-rithm may not accurately detect an active code channel as turned on.
c. Nominal operating range. Accuracy specification applies when mixer level (RF input power minus attenuation) is between 25 and 15 dBm.
Relative power accuracy
Code domain power range 0 to 10 dBc 10 to 30 dBc 30 to 40 dBc
0.015 dB0.18 dB0.51 dB
Symbol power vs. time
Minimum power at RF Input 40 dBm (nominal)b c
Accuracy 0.1 dB Specified for code channel power 20 dBc
Symbol error vector magnitude
Minimum power at RF Input Accuracy
0.1 %
20 dBm (nominal) b c
216 Chapter 10

cdma2000 Measurement Personality
Option B78, cdma2000 Measurement Personality
Description Specifications Supplemental Information
QPSK EVM
Minimum power at RF input Preamplifier (Option 1DS) Off, except as noted
20 dBm (nominal)
EVM Operating range
0 to 18 % (nominal)
Floor
Preamplifier (Option 1DS) Off 1.5 % (nominal)
Preamplifier (Option 1DS) On 1.5 % RF input power = 50 dBm,Attenuator = 0 dB
Accuracy a
a. The accuracy specification applies when the EVM to be measured is well above the measurement floor. When the EVM does not greatly exceed the floor, the errors due to the floor add to the accuracy errors. The errors due to the floor are noise-like and add incoherently with the UUT EVM. The errors depend
on the EVM of the UUT and the floor as follows: error = sqrt(EVMUUT2 + EVMsa2) EVMUUT, where EVMUUT is the EVM of the UUT in percent, and EVMsa is the EVM floor of the analyzer in percent. For example, if the EVM of the UUT is 7 %, and the floor is 2.5 %, the error due to the floor is 0.43 %. The total error can cause a reading as high as EVMUUT + floorerror + accyerror, or as low as EVMUUT accyerror, where floorerror is the result of the error computation due to the floor, and accyerror is the specified accuracy.
1.0 % (nominal)
I/Q origin offset DUT Maximum Offset Analyzer Noise Floor
10 dBc (nominal)45 dBc (nominal)
Frequency Error Range
5.0 kHz (nominal)
Accuracy 10 Hz + tfa b
b. tfa = transmitter frequency frequency reference accuracy
Chapter 10 217

cdma2000 Measurement Personality
Option B78, cdma2000 Measurement Personality
Description Specifications Supplemental Information
Modulation Accuracy(Composite Rho)
Specifications apply to BTS for 9 active channels as defined in 3GPP2, and where the mixer level (RF input power minus attenuation) is between 25 and 15 dBm.
Power range at RF Input Preamplifier (Option 1DS) On
80 to 40 dBm (nominal)a
a. Pilot synchronization requires a minimum RF input power of 80 dBm. Pilot synchronization can be obtained above 40 dBm, but TOI products will begin to raise the EVM floor. The power range that is free from TOIinduced noise floor problems can be extended up to 20 dB by increasing the input atten-uation above the factory preset setting of 0 dB when using the preamplifier. There is no auto mode for setting input attenuation when the preamplifier is On.
Minimum power at RF Input Preamplifier (Option 1DS) Off
60 dBm (nominal)b c
b. At low signaltonoise ratios where the RF input power is below 65 dBm, the auto channel ID algo-rithm may not accurately detect an active code channel as turned on.
c. Nominal operating range. Accuracy specification applies when mixer level (RF input power minus attenuation) is between 25 and 15 dBm.
All remaining Modulation Accuracy specifications are applicable with the Preamplifier (Option 1DS) Off.
Global EVM Range
0 to 25 %
Floor 1.5 %
Accuracy d
d. The accuracy specification applies when the EVM to be measured is well above the measurement floor. When the EVM does not greatly exceed the floor, the errors due to the floor add to the accuracy errors. The errors due to the floor are noise-like and add incoherently with the UUT EVM. The errors depend
on the EVM of the UUT and the floor as follows: floorerror = sqrt(EVMUUT2 + EVMsa2) EVMUUT, where EVMUUT is the EVM of the UUT in percent, and EVMsa is the EVM floor of the analyzer in percent. For example, if the EVM of the UUT is 7 %, and the floor is 2.5 %, the error due to the floor is 0.43 %. The total error can cause a reading as high as EVMUUT + floorerror + accyerror, or as low as EVMUUT accyerror, where floorerror is the result of the error computation due to the floor, and accyerror is the specified accuracy.
0.75 %
Rho Range
0.9 to 1.0
Floor 0.99978
Accuracy 0.0010
0.0035
at Rho 0.99751 (EVM 5 %)
at Rho 0.94118 (EVM 25 %)
218 Chapter 10

cdma2000 Measurement Personality
Option B78, cdma2000 Measurement Personality
Description Specifications Supplemental Information
Pilot time offset Range
13.33 to +13.33 ms
From even second signal to start of PN sequence
Accuracy 300 ns
Resolution 10 ns
Code domain timing Range
200 ns
Pilot to code channel time tolerance
Accuracy 1.25 ns
Resolution 0.1 ns
Code domain phase Range
200 mrad
Pilot to code channel phase tolerance
Accuracy 10 mrad
Resolution 0.1 mrad
Peak code domain error Accuracy
1.0 dB (nominal)
I/Q origin offset DUT Maximum Offset Analyzer Noise Floor
10 dBc (nominal)50 dBc (nominal)
Frequency error Range
900 Hz
Accuracy 10 Hz + tfa a
a. tfa = transmitter frequency frequency reference accuracy
Spectrum (Frequency Domain) See “Spectrum” on page 150.
Waveform (Time Domain) See “Waveform” on page 151.
Description Specifications Supplemental Information
In-Band Frequency Range Band Class 0 (North American Cellular)
869 to 894 MHz824 to 849 MHz
Band Class 1 (North American PCS)
1930 to 1990 MHz1850 to 1910 MHz
Band Class 2 (TACS)
917 to 960 MHz872 to 915 MHz
Chapter 10 219

cdma2000 Measurement Personality
Option B78, cdma2000 Measurement Personality
Band Class 3 (JTACS)
832 to 870 MHz887 to 925 MHz
Band Class 4 (Korean PCS)
1840 to 1870 MHz1750 to 1780 MHz
Band Class 6 (IMT-2000)
2110 to 2170 MHz1920 to 1980 MHz
Description Specifications Supplemental Information
220 Chapter 10

cdma2000 Measurement Personality
General
General
Description Specifications Supplemental Information
Trigger
Trigger source RF burst (wideband), Video (IF envelope), Ext Front, Ext Rear. Actual available choices are dependent on measurement.
Trigger delay, level, and slope Each trigger source has a separate set of these parameters.
Trigger delay Range Repeatability Resolution
100 to +500 ms33 ns33 ns
External trigger inputs Level Impedance
5 V to +5 V (nominal)10 kW (nominal)
Range Control RF Input Autorange aManually set Max Total Pwr Manually set Input Atten
a. Auto range is not continuous with each measurement acquisition; it will run only once immediately following a measurement restart, initiated either by pressing the Restart key, or by sending the GPIB command INIT:IMM. This behavior was chosen to maintain best measurement speed, but it requires caution when input power levels change. If the input signal power changes, the analyzer will not read-just the input attenuators for optimal dynamic range unless a measurement restart is initiated. For example, if a sequence of power measurements is made, beginning with a maximum power level that is large enough to require non-zero input attenuation, it is advisable to do a measurement restart to auto-matically set a lower input attenuator value to maintain optimal dynamic range for approximately every 3 dB the input signal power level is reduced, or smaller, depending upon how precisely dynamic range needs to be optimized. Conversely, if the input signal power increases to a high enough level, input overloading will occur if the input attenuators are not readjusted by doing a measurement restart.
Chapter 10 221

cdma2000 Measurement Personality
General
222 Chapter 10

11 1xEV-DV Measurement Personality
This chapter contains specifications for the PSA series, Option 214, 1xEV-DV measurement personality.
223

1xEV-DV Measurement Personality
Additional Definitions and Requirements
Additional Definitions and Requirements
Because digital communications signals are noise-like, all measurements will have variations. The specifications apply only with adequate averaging to remove those variations.
The specifications apply in the frequency ranges documented in In-Band Frequency Range.
The specifications for this chapter apply to the E4440A, E4443A and E4445A spectrum analyzers. For the E4446A, E4447A, and E4448A, the performance is nominal only and not subject to any warranted specifications.
The measurement performance is only slightly different in the E4446A, E4447A, and E4448A when compared to the performance of the E4440A, E4443A and E4445A analyzers. Because the hardware performance of the analyzers is very similar but not identical, you can estimate the nominal performance of the measurements from the specifications in this chapter.
224 Chapter 11
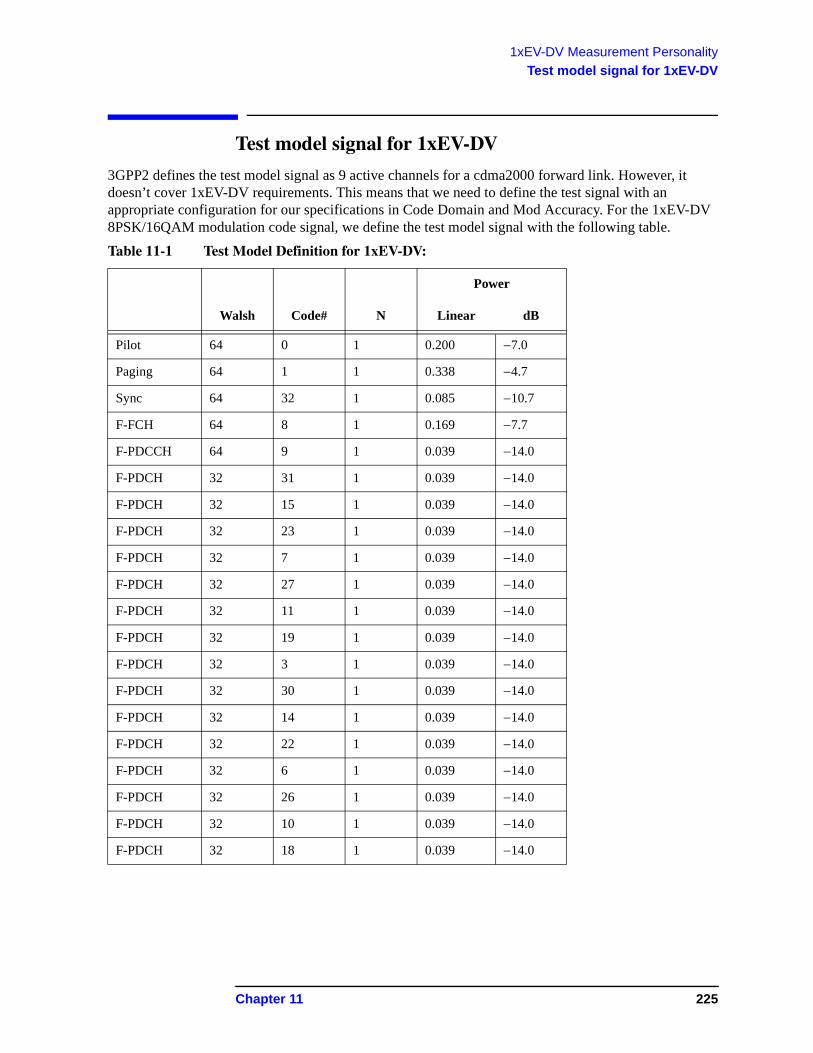
1xEV-DV Measurement Personality
Test model signal for 1xEV-DV
Test model signal for 1xEV-DV
3GPP2 defines the test model signal as 9 active channels for a cdma2000 forward link. However, it doesn’t cover 1xEV-DV requirements. This means that we need to define the test signal with an appropriate configuration for our specifications in Code Domain and Mod Accuracy. For the 1xEV-DV 8PSK/16QAM modulation code signal, we define the test model signal with the following table.
Table 11-1 Test Model Definition for 1xEV-DV:
Power
Walsh Code# N Linear dB
Pilot 64 0 1 0.200 7.0
Paging 64 1 1 0.338 4.7
Sync 64 32 1 0.085 10.7
F-FCH 64 8 1 0.169 7.7
F-PDCCH 64 9 1 0.039 14.0
F-PDCH 32 31 1 0.039 14.0
F-PDCH 32 15 1 0.039 14.0
F-PDCH 32 23 1 0.039 14.0
F-PDCH 32 7 1 0.039 14.0
F-PDCH 32 27 1 0.039 14.0
F-PDCH 32 11 1 0.039 14.0
F-PDCH 32 19 1 0.039 14.0
F-PDCH 32 3 1 0.039 14.0
F-PDCH 32 30 1 0.039 14.0
F-PDCH 32 14 1 0.039 14.0
F-PDCH 32 22 1 0.039 14.0
F-PDCH 32 6 1 0.039 14.0
F-PDCH 32 26 1 0.039 14.0
F-PDCH 32 10 1 0.039 14.0
F-PDCH 32 18 1 0.039 14.0
Chapter 11 225

1xEV-DV Measurement Personality
Option 214, 1xEV-DV Measurement Personality
Option 214, 1xEV-DV Measurement Personality
Description Specifications Supplemental Information
Code Domain Specifications apply to BTS for 9 active channels as defined in 3GPP2 unless otherwise stated, and where the mixer level (RF input power minus attenuation) is between 25 and 15 dBm.
Code domain power
Power range at RF input
Preamplifier On
80 to 40 dBm (nominal)a
a. Pilot synchronization requires a minimum RF input power of 80 dBm. Pilot synchronization can be obtained above 40 dBm, but TOI products will begin to raise the code domain noise floor. The power range that is free from TOI-induced noise floor problems can be extended up to 20 dB by increasing the input attenuation above the factory preset setting of 0 dB when using the preamplifier. There is no auto mode for setting input attenuation when the preamplifier is On.
The following specifications are applicable with the Preamplifier (Option 1DS) Off.
Code domain power
Minimum power at RF input 60 dBm (nominal)b c
b. At low signal-to-noise ratios where the RF input power is below 65 dBm, the auto channel ID algo-rithm may not accurately detect an active code channel as turned on.
c. Nominal operating range. Accuracy specification applies when mixer level (RF input power minus attenuation) is between 25 and 15 dBm.
Relative power accuracy
QPSK modulation code signal
Code domain power range 0 to 10 dBc 10 to 30 dBc 30 to 40 dBc
0.015 dB0.18 dB0.51 dB
8PSK/16QAM modulation code signal
Code domain power range 0 to 10 dBc 10 to 30 dBc 30 to 40 dBc
See the table inTest model signal for 1xEV-DV on page 225
0.015 dB (nominal)0.18 dB (nominal)0.51 dB (nominal)
226 Chapter 11

1xEV-DV Measurement Personality
Option 214, 1xEV-DV Measurement Personality
Description Specifications Supplemental Information
Symbol power vs. time
Minimum power at RF Input 40 dBm (nominal)a b
a. Pilot synchronization requires a minimum RF input power of 80 dBm. Pilot synchronization can be obtained above 40 dBm, but TOI products will begin to raise the code domain noise floor. The power range that is free from TOI-induced noise floor problems can be extended up to 20 dB by increasing the input attenuation above the factory preset setting of 0 dB when using the preamplifier. There is no auto mode for setting input attenuation when the preamplifier is On.
b. At low signal-to-noise ratios where the RF input power is below 65 dBm, the auto channel ID algo-rithm may not accurately detect an active code channel as turned on.
QPSK modulation code signal
Accuracy
0.1 dB For code channel power 20 dBc
8PSK/16QAM modulation code signal
Accuracy
See Test model signal for 1xEV-DV on page 225
0.1 dB (nominal)
Symbol error vector magnitude
Minimum power at RF Input
Accuracy 0.10 %
20 dBm (nominal)
Chapter 11 227

1xEV-DV Measurement Personality
Option 214, 1xEV-DV Measurement Personality
Description Specifications Supplemental Information
Modulation Accuracy(Composite Rho)
Specifications apply to BTS for 9 active channels as defined in 3GPP2 unless otherwise stated, and where the mixer level (RF input power minus attenuation) is between 25 and 15 dBm.
Power range at RF Input Preamplifier (Option 1DS) On
80 to 40 dBm (nominal)a
a. Pilot synchronization requires a minimum RF input power of 80 dBm. Pilot synchronization can be obtained above 40 dBm, but TOI products will begin to raise the EVM floor. The power range that is free from TOI-induced noise floor problems can be extended up to 20 dB by increasing the input atten-uation above the factory preset setting of 0 dB when using the preamplifier. There is no auto mode for setting input attenuation when the preamplifier is On.
Minimum power at RF Input Preamplifier (Option 1DS) Off
60 dBm (nominal)b c
b. At low signal-to-noise ratios where the RF input power is below 65 dBm, the auto channel ID algo-rithm may not accurately detect an active code channel as turned on.
c. Nominal operating range. Accuracy specification applies when mixer level (RF input power minus attenuation) is between 25 and 15 dBm.
All remaining Modulation Accuracy specifications are applicable with thePreamplifier (Option 1DS) Off.
Global EVM Range
0 to 25 %
Floor 1.5 %
Accuracyd 0.75 %
Rho Range
0.9 to 1.0
Floor 0.99978
Accuracy 0.0010 At Rho 0.99751 (EVM 5 %)
0.0035 At Rho 0.94118 (EVM 25 %)
228 Chapter 11

1xEV-DV Measurement Personality
Option 214, 1xEV-DV Measurement Personality
d. The accuracy specification applies when the EVM to be measured is well above the measurement floor. When the EVM does not greatly exceed the floor, the errors due to the floor add to the accuracy errors. The errors due to the floor are noise-like and add incoherently with the UUT EVM. The errors depend
on the EVM of the UUT and the floor as follows: floorerror = sqrt(EVMUUT2 + EVMsa2) EVMUUT, where EVMUUT is the EVM of the UUT in percent, and EVMsa is the EVM floor of the analyzer in percent. For example, if the EVM of the UUT is 7 %, and the floor is 2.5 %, the error due to the floor is 0.43 %. The total error can cause a reading as high as EVMUUT + floorerror + accyerror, or as low as EVMUUT accyerror, where floorerror is the result of the error computation due to the floor, and accyerror is the specified accuracy.
Description Specifications Supplemental Information
The following specifications for Global EVM and Rho apply for the test model signal for 1xEV-DV defined above.
Global EVM
Range
See the table in Test model signal for 1xEV-DV on page 225
0 to 25 % (nominal)
Floor 1.5 % (nominal)
Accuracya 0.75 % (nominal)
Rho
Range 0.9 to 1.0 (nominal)
Floor 0.99978 (nominal)
Accuracy 0.0010 (nominal) at Rho 0.99751 (EVM 5 %)
0.0035 (nominal) at Rho 0.94118 (EVM 25 %)
Pilot time offset
Range 13.33 to +13.3 ms
From even second signal to start of PN sequence
Accuracy 300 ns
Resolution 10 ns
Code domain timing
Range 200 ns
Pilot to code channel time tolerance
Accuracy 1.25 ns
Resolution 0.1 ns
Chapter 11 229

1xEV-DV Measurement Personality
Option 214, 1xEV-DV Measurement Personality
Code domain phase
Range 200 mrad
Pilot to code channel phase tolerance
Accuracy 10 mrad
Resolution 0.1mrad
a. The accuracy specification applies when the EVM to be measured is well above the measurement floor. When the EVM does not greatly exceed the floor, the errors due to the floor add to the accuracy errors. The errors due to the floor are noise-like and add incoherently with the UUT EVM. The errors depend
on the EVM of the UUT and the floor as follows: floorerror = sqrt(EVMUUT2 + EVMsa2) EVMUUT, where EVMUUT is the EVM of the UUT in percent, and EVMsa is the EVM floor of the analyzer in percent. For example, if the EVM of the UUT is 7 %, and the floor is 2.5 %, the error due to the floor is 0.43 %. The total error can cause a reading as high as EVMUUT + floorerror + accyerror, or as low as EVMUUT accyerror, where floorerror is the result of the error computation due to the floor, and accyerror is the specified accuracy.
Description Specifications Supplemental Information
Peak code domain error Accuracy
9 active channels
1.0 dB (nominal)
Test model signal for 1xEV-DVSee Test model signal for 1xEV-DV on page 225
1.0 dB (nominal)
Description Specifications Supplemental Information
230 Chapter 11

1xEV-DV Measurement Personality
Option 214, 1xEV-DV Measurement Personality
Description Specifications Supplemental Information
I/Q origin offset
DUT Maximum Offset Analyzer Noise Floor
10 dBc (nominal)50 dBc (nominal)
Frequency error
Range 900 Hz
Accuracy 10 Hz + tfaa
a. tfa = transmitter frequency frequency reference accuracy
Spectrum (Frequency Domain) See “Spectrum” on page 150.
Waveform (Time Domain) See “Waveform” on page 151.
Description Specifications Supplemental Information
In-Band Frequency Range
Band Class 0 (North American Cellular)
869 to 894 MHz824 to 849 MHz
Band Class 1 (North American PCS)
1930 to 1990 MHz1850 to 1910 MHz
Band Class 2 (TACS)
917 to 960 MHz872 to 915 MHz
Band Class 3 (JTACS)
832 to 870 MHz887 to 925 MHz
Band Class 4 (Korean PCS)
1840 to 1870 MHz1750 to 1780 MHz
Band Class 6 (IMT-2000)
2110 to 2170 MHz1920 to 1980 MHz
Chapter 11 231

1xEV-DV Measurement Personality
General
General
Description Specifications Supplemental Information
Trigger
Trigger source RF burst (wideband), Video (IF envelope), Ext Front, Ext Rear. Actual available choices are dependent on measurement.
Trigger delay, level, and slope Each trigger source has a separate set of these parameters.
Trigger delay Range Repeatability Resolution
100 to +500 ms33 ns33 ns
External trigger inputs Level Impedance
5 V to +5 V (nominal)10 kW (nominal)
Range Control RF Input Autorange aManually set Max Total PwrManually set Input Atten
a. Auto range is not continuous with each measurement acquisition; it will run only once immediately fol-lowing a measurement restart, initiated either by pressing the Restart key, or by sending the GPIB com-mand INIT:IMM. This behavior was chosen to maintain best measurement speed, but it requires caution when input power levels change. If the input signal power changes, the analyzer will not read-just the input attenuators for optimal dynamic range unless a measurement restart is initiated. For exam-ple, if a sequence of power measurements is made, beginning with a maximum power level that is large enough to require non-zero input attenuation, it is advisable to do a measurement restart to automati-cally set a lower input attenuator value to maintain optimal dynamic range for approximately every 3 dB the input signal power level is reduced, or smaller, depending upon how precisely dynamic range needs to be optimized. Conversely, if the input signal power increases to a high enough level, input overloading will occur if the input attenuators are not readjusted by doing a measurement restart.
232 Chapter 11

12 1xEV-DO Measurement Personality
This chapter contains specifications for the PSA series, Option 204, 1xEV-DO measurement personality.
233

1xEV-DO Measurement Personality
Additional Definitions and Requirements
Additional Definitions and Requirements
Because digital communications signals are noise-like, all measurements will have variations. The specifications apply only with adequate averaging to remove those variations.
The specifications apply in the frequency ranges documented in In-Band Frequency Range.
The specifications for this chapter apply to the E4440A, E4443A and E4445A spectrum analyzers. For the E4446A, E4447A, and E4448A, the performance is nominal only and not subject to any warranted specifications.
The measurement performance is only slightly different in the E4446A, E4447A, and E4448A when compared to the performance of the E4440A, E4443A and E4445A analyzers. Because the hardware performance of the analyzers is very similar but not identical, you can estimate the nominal performance of the measurements from the specifications in this chapter.
234 Chapter 12

1xEV-DO Measurement Personality
Option 204,1xEV-DO Measurements Personality
Option 204,1xEV-DO Measurements Personality
Description Specifications Supplemental Information
Channel Power
1.23 MHz Integration BW
Input signal must not be bursted
Minimum power at RF input 74 dBm (nominal)
Absolute power accuracy a 20 to 30 C attenuation > 2 dBb attenuation 2 dB
a. Absolute power accuracy includes all error sources for in-band signals except mismatch errors. There are two cases listed.
b. The absolute power accuracy depends on the setting of the electronic input attenuator as well as the sig-nal-to-noise ratio. For high input levels, the Auto setting of RF Input Range will result in high sig-nal-to-noise ratios and Input Atten > 2 dB, for which the absolute power accuracy is best. At moderate levels, manually setting the Input Atten can give better accuracy than the automatic setting. At very low levels, automatic or manual setting of the Input Atten to 0 dB optimizes the accuracy by maximizing the signal-to-noise ratio. For cdmaOne, “high levels” would nominally be levels above 14.7 dBm, and “very low levels” would nominally be below 66 dBm.The error due to very low signals levels is a function of the signal (channel power) to noise (measure-ment floor) ratio, SN, in decibels. The function is: error = 10 log (1 + 10 SN/10)For example, if the mixer level (input power minus attenuation) is 26.4 dB above the measurement floor, the error due to adding the analyzer's noise to the UUT is only 0.01 dB.
0.67 dB 0.76 dB
0.18 dB (typical)0.24 dB (typical)
Measurement floor c
c. Measurement floor is the channel power measured due only to the noise of the analyzer. The measure-ment floor nominally changes by +1 dB/GHz for signal frequencies different from the 2 GHz frequency for which this nominal floor was determined.
85 dBm (nominal)
Relative power accuracy Fixed channel Fixed input attenuator Mixer level 52 to 12 dBm d
d. .The relative accuracy is the ratio of the accuracy of amplitude measurements of two different transmit-ter power levels. Mixer level is defined to be the input power minus the attenuation. This specification is equivalent to the difference between two points on the scale fidelity curve shown in the PSA Specifi-cations Guide. Because the error sources of scale fidelity are almost all monotonic with input level, the relative error between two levels is nearly (within 0.01 dB) identical to the “error relative to 35 dBm” specified in the Guide.
0.08 dB 0.03 dB (typical)
Chapter 12 235

1xEV-DO Measurement Personality
Option 204,1xEV-DO Measurements Personality
Description Specifications Supplemental Information
Power Statistics CCDF
Minimum power at RF Input
Histogram Resolution
0.01 dB a
a. The Complementary Cumulative Distribution Function (CCDF) is a reformatting of a histogram of the power envelope. The width of the amplitude bins used by the histogram is the histogram resolution. The resolution of the CCDF will be the same as the width of those bins.
40 dBm (nominal)
Description Specifications Supplemental Information
Intermod Input signal must not be bursted
Minimum carrier power at RF Input 30 dBm (nominal)
Third-order intercept CF = 1 GHz CF = 2 GHz
TOI + 7.2 dB aTOI + 7.5 dB a
a. The third-order intercept (TOI) of the analyzer as configured for the cdma2000 personality is higher than the third-order intercept specified for the analyzer without the personality, due to the configuration of loss elements in front of the input mixer. The personality configures the mechanical attenuator to be in a fixed 6 dB attenuation position, and has additional loss in the electronic attenuator. The TOI increases by the nominal amount shown due to these losses when the electronic attenuator is set to 0 dB, and further increases proportional to the setting of the electronic attenuator.
Description Specifications Supplemental Information
Occupied Bandwidth Input signal must not be bursted
Minimum carrier power a RF Input 40 dBm (nominal)
Frequency resolution 100 Hz
Frequency accuracy
(nominal)a
a. The errors in Occupied Bandwidth measurement are mostly due to the noisiness of any measurement of a noise-like signal, such as the 1xEV signal. The observed standard deviation of the OBW measure-ment is 14 kHz (1.2 %), so with 100 averages, the standard deviation should be about 1.4 kHz, or 0.1 %.
1.2%
Navg
---------------
236 Chapter 12

1xEV-DO Measurement Personality
Option 204,1xEV-DO Measurements Personality
Description Specifications Supplemental Information
Spurious Emissions and ACP
Minimum carrier power a RF Input 20 dBm (nominal)
Dynamic Range, relative a
a. The dynamic range specification is the ratio of the channel power to the power in the offset and region specified. The dynamic range depends on the measurement settings, such as peak power or integrated power. This specification is derived from other analyzer performance limitations such as third-order intermodulation, DANL and phase noise. Dynamic range specifications are based on default measure-ment settings, with detector set to average, and depend on the mixer level. Mixer level is defined to be the input power minus the input attenuation.
750 kHz offset b 1.980 MHz region c
b. Default measurement settings include 30 kHz RBW. This dynamic range specification applies for the optimum mixer level, which is about 11 dBm.
c. Default measurement settings include 1200 kHz RBW. This dynamic range specification applies for a mixer level of 0 dBm. Higher mixer levels can give up to 5 dB better dynamic range, but at the expense of compression in the input mixer, which reduces accuracy. The compression behavior of the input mixer is specified in the PSA Specifications Guide; the levels into the mixer are nominally 8 dB lower in this application when the center frequency is 2 GHz.
84.7 dB80.7 dB
86.4 dB (typical)83.0 dB (typical)
Sensitivity, absolute d
d. The sensitivity is specified with 0 dB input attenuation. It represents the noise limitations of the ana-lyzer. It is tested without an input signal.
750 kHz offset e 1.980 MHz region f
e. The sensitivity at this offset is specified for the default 30 kHz RBW, at a center frequency of 2 GHz.f. The sensitivity for this region is specified for the default 1200 kHz bandwidth, at a center frequency of
2 GHz.
97.9 dBm81.9 dBm
99.9 dBm (typical)83.9 dBm (typical)
Accuracy, relative 750 kHz offset g 1.980 MHz region h
g. The relative accuracy is a measure of the ratio of the power at the offset to the main channel power. It applies for spectrum emission levels in the offsets that are well above the dynamic range limitation.
h. The relative accuracy is a measure of the ratio of the power in the region to the main channel power. It applies for spurious emission levels in the regions that are well above the dynamic range limitation.
0.14 dB0.56 dB
Chapter 12 237

1xEV-DO Measurement Personality
Option 204,1xEV-DO Measurements Personality
Description Specifications Supplemental Information
Code Domain
Specification applies at 0 dBm input power.
For Pilot, 2 MAC channels, and 16 channels of QPSK data
Relative power accuracy 0.15 dB
Description Specifications Supplemental Information
QPSK EVM
Minimum power at RF input 20 dBm (nominal)
EVM Operating range
0 to 15 % (nominal)
Floor 1.5 % (nominal)
Accuracy a
a. The accuracy specification applies when the EVM to be measured is well above the measurement floor. When the EVM does not greatly exceed the floor, the errors due to the floor add to the accuracy errors. The errors due to the floor are noise-like and add incoherently with the UUT EVM. The errors depend
on the EVM of the UUT and the floor as follows: error = sqrt(EVMUUT2 + EVMsa2) EVMUUT, where EVMUUT is the EVM of the UUT in percent, and EVMsa is the EVM floor of the analyzer in percent. For example, if the EVM of the UUT is 7 %, and the floor is 2.5 %, the error due to the floor is 0.43 %. The total error can cause a reading as high as EVMUUT + floorerror + accyerror, or as low as EVMUUT accyerror, where floorerror is the result of the error computation due to the floor, and accyerror is the specified accuracy.
1.0 % (nominal)
I/Q origin offset DUT Maximum Offset Analyzer Noise Floor
10 dBc (nominal)50 dBc (nominal)
Frequency Error Range
5.0 kHz (nominal)
Accuracy 10 Hz (nominal) + tfa b
b. tfa = transmitter frequency frequency reference accuracy
238 Chapter 12

1xEV-DO Measurement Personality
Option 204,1xEV-DO Measurements Personality
Description Specifications Supplemental Information
Modulation Accuracy (Composite Rho)
Specifications apply at 0 dBm input power, unless otherwise indicated
For Pilot, 2 MAC channels, and 16 channels of QPSK data
Minimum carrier power at RF Input 50 dBm (nominal)
Composite EVM Operating range
0 to 25 % (nominal)
Floor 2.5 % 2.5 %, nominal, at 45 dBm input power, and ADC gain set to +18 dB
Accuracy a
a. The accuracy specification applies when the EVM to be measured is well above the measurement floor. When the EVM does not greatly exceed the floor, the errors due to the floor add to the accuracy errors. The errors due to the floor are noise-like and add incoherently with the UUT EVM. The errors depend
on the EVM of the UUT and the floor as follows: error = sqrt(EVMUUT2 + EVMsa2) EVMUUT, where EVMUUT is the EVM of the UUT in percent, and EVMsa is the EVM floor of the analyzer in percent. For example, if the EVM of the UUT is 7 %, and the floor is 2.5 %, the error due to the floor is 0.43 %. The total error can cause a reading as high as EVMUUT + floorerror + accyerror, or as low as EVMUUT accyerror, where floorerror is the result of the error computation due to the floor, and accyerror is the specified accuracy.
1.0 % At the range of 5 % to 25 %
Rho Range
0.9 to 1.0
Floor 0.99938 0.9994, nominal, at 45 dBm input power, and ADC gain set to +18 dB
Accuracy 0.00100.0044
at Rho 0.99751 (EVM 5 %)at Rho 0.94118 (EVM 25 %)
I/Q origin offset DUT Maximum Offset Analyzer Noise Floor
10 dBc (nominal)50 dBc (nominal)
Frequency error Range
(Pilot, MAC, QPSK Data, 8PSK Data)400 Hz (nominal)
Accuracy 10 Hz + tfa b (nominal)
b. tfa = transmitter frequency frequency reference accuracy
Chapter 12 239

1xEV-DO Measurement Personality
Option 204,1xEV-DO Measurements Personality
Description Specifications Supplemental Information
Power vs. Time (PvT)
Minimum power at RF input 73 dBm (nominal)
Absolute power accuracy a 20 to 30 C attenuation > 2 dBb attenuation 2 dB
a. Absolute power accuracy includes all error sources for in-band signals except mismatch errors. There are two cases listed.
b. The absolute power accuracy depends on the setting of the electronic input attenuator as well as the sig-nal-to-noise ratio. For high input levels, the Auto setting of RF Input Range will result in high sig-nal-to-noise ratios and Input Atten> 2 dB, for which the absolute power accuracy is best. At moderate levels, manually setting the Input Atten can give better accuracy than the automatic setting. At very low levels, automatic or manual setting of the Input Atten to 0dB optimizes the accuracy by maximizing the signal-to-noise ratio. For cdmaOne, “high levels” would nominally be levels above 14.7 dBm, and “very low levels” would nominally be below 66 dBm.The error due to very low signals levels is a function of the signal (channel power) to noise (measure-ment floor) ratio, SN, in decibels. The function is:
For example, if the mixer level (input power minus attenuation) is 26.4 dB above the measurement floor, the error due to adding the analyzer's noise to the UUT is only 0.01 dB.
0.24 dB (nominal)0.30 dB (nominal)
Measurement floor c
c. Measurement floor is the channel power measured due only to the noise of the analyzer. The measure-ment floor nominally changes by +1 dB/GHz for signal frequencies different from the 2 GHz frequency for which this nominal floor was determined.
84 dBm (nominal)
Relative power accuracy Fixed channel Fixed input attenuator Mixer level 52 to 12 dBm d
d. The relative accuracy is the ratio of the accuracy of amplitude measurements of two different transmit-ter power levels. Mixer level is defined to be the input power minus the attenuation. This specification is equivalent to the difference between two points on the scale fidelity curve shown in the PSA Specifi-cations Guide. Because the error sources of scale fidelity are almost all monotonic with input level, the relative error between two levels is nearly (within 0.01 dB) identical to the “error relative to 35 dBm” specified in the Guide.
0.03 dB (nominal)
Spectrum (Frequency Domain) See “Spectrum” on page 150.
Waveform (Time Domain) See “Waveform” on page 151.
error 10 log 1 10SN– 10
+ =
240 Chapter 12

1xEV-DO Measurement Personality
Frequency
Frequency
Description Specifications Supplemental Information
In-Band Frequency Range
(Access Network Only)
Band Class 0 869 to 894 MHz North American and Korean Cellular Bands
Band Class 1 1930 to 1990 MHz North American PCS Band
Band Class 2 917 to 960 MHz TACS Band
Band Class 3 832 to 869 MHz JTACS Band
Band Class 4 1840 to 1870 MHz Korean PCS Band
Band Class 6 2110 to 2170 MHz IMT-2000 Band
Band Class 8 1805 to 1880 MHz 1800-MHz Band
Band Class 9 925 to 960 MHz 900-MHz Band
Chapter 12 241

1xEV-DO Measurement Personality
Alternative Frequency Ranges
Alternative Frequency Ranges
Description Specifications Supplemental Information
Alternative Frequency Rangesa (Access Network Only)
a. Frequency ranges with tuning plans but degraded specifications for absolute power accuracy. The deg-radation should be nominally 0.30 dB
Band Class 5 421 to 430 MHz460 to 470 MHz489 to 194 MHz
NMT-450 Band
Band Class 7 746 to 764 MHz North American 700-MHz Cellular Band
242 Chapter 12

1xEV-DO Measurement Personality
General
General
Description Specifications Supplemental Information
Trigger
Trigger source RF burst (wideband), Video (IF envelope), Ext Front, Ext Rear. Actual available choices are dependent on measurement selection.
Trigger delay, level, and slope Each trigger source has a separate set of these parameters.
Trigger delay Range Repeatability Resolution
100 to +500 ms33 ns33 ns
External trigger inputs Level Impedance
5 V to +5 V, characteristic10 kW (nominal)
Range Control RF Input Autorange a Manually set Max Total PwrManually set Input Atten
a. Auto range is not continuous with each measurement acquisition; it will run only once immediately fol-lowing a measurement restart, initiated either by pressing the Restart key, or by sending the GPIB command INIT:IMM. This behavior was chosen to maintain best measurement speed, but it requires caution when input power levels change. If the input signal power changes, the analyzer will not read-just the input attenuators for optimal dynamic range unless a measurement restart is initiated. For example, if a sequence of power measurements is made, beginning with a maximum power level that is large enough to require non-zero input attenuation, it is advisable to do a measurement restart to auto-matically set a lower input attenuator value to maintain optimal dynamic range for approximately every 3 dB the input signal power level is reduced, or smaller, depending upon how precisely dynamic range needs to be optimized. Conversely, if the input signal power increases to a high enough level, input overloading will occur if the input attenuators are not readjusted by doing a measurement restart.
Chapter 12 243

1xEV-DO Measurement Personality
General
244 Chapter 12

13 NADC Measurement Personality
This chapter contains specifications for the PSA series, Option BAE, NADC measurement personality.
245

NADC Measurement Personality
Additional Definitions and Requirements
Additional Definitions and Requirements
Because digital communications signals are noise-like, all measurements will have variations. The specifications apply only with adequate averaging to remove those variations.
The specifications apply in the frequency ranges documented in In-Band Frequency Range.
The specifications for this chapter apply to the E4440A, E4443A and E4445A spectrum analyzers. For the E4446A, E4447A, and E4448A, the performance is nominal only and not subject to any warranted specifications.
The measurement performance is only slightly different in the E4446A, E4447A, and E4448A when compared to the performance of the E4440A, E4443A and E4445A analyzers. Because the hardware performance of the analyzers is very similar but not identical, you can estimate the nominal performance of the measurements from the specifications in this chapter.
246 Chapter 13

NADC Measurement Personality
Option BAE, NADC Measurement Personality
Option BAE, NADC Measurement Personality
Description Specifications Supplemental Information
Adjacent Channel Power Ratio
Minimum Power at RF Input 50 dBm (nominal)
ACPR Dynamic Range At 30 kHz offseta At 60 kHz offset At 90 kHz offset
a. An ideal NADC signal, filtered by a perfect root-raised-cosine filter, shows about 35.4 dB ACPR at the 30 kHz offset. The added noise power due to intermodulation distortions and phase noise in the ana-lyzer is well below this level. Therefore, measurement accuracy at 30 kHz offset is not significantly impacted by the dynamic range of the analyzer.
74 dB (nominal)77 dB (nominal)
ACPR Relative Accuracy 0.08 dB b
b. The specified ACPR accuracy applies if the measured ACPR substantially exceeds the analyzer dynamic range at the specified offset. At the nominal test limits for the offsets (26, 45 and 45 dBc for 30, 60 and 90 kHz offsets), for RF power above 25 dBm, this condition is met. When this condi-tion is not met, there are additional errors due to the addition of analyzer spectral components to UUT spectral components. The spectral components from the analyzer will be non-coherent with the compo-nents from the UUT at the 60 and 90 kHz offsets. Because of this, the errors add in a power sense. The error is a function of the signal (UUT ACPR) to noise (analyzer ACPR dynamic range limitation) ratio, SN, in decibels.The function is:error = 10 log(1 + 10 SN/10)For example, if the UUT ACPR is 64 dB and the measurement floor is 74 dB, the SN ratio is 10 dB and the error due to adding the analyzer's noise to that of the UUT is 0.41 dB.
Chapter 13 247

NADC Measurement Personality
Option BAE, NADC Measurement Personality
Description Specifications Supplemental Information
Error Vector Magnitude (EVM)
Minimum Power at RF Input 45 dBm (nominal)
EVM
Operating range 0 to 18 % (nominal)
Floor 0.5 %
Accuracy a
a. The accuracy specification applies when the EVM to be measured is well above the measurement floor. When the EVM does not greatly exceed the floor, the errors due to the floor add to the accuracy errors. The errors due to the floor are noise-like and add incoherently with the UUT EVM. The errors depend
on the EVM of the UUT and the floor as follows: error = sqrt(EVMUUT2 + EVMsa2) EVMUUT, where EVMUUT is the EVM of the UUT in percent, and EVMsa is the EVM floor of the analyzer in percent. For example, if the EVM of the UUT is 7 %, and the floor is 2.5 %, the error due to the floor is 0.43 %. The total error can cause a reading as high as EVMUUT + floorerror + accyerror, or as low as EVMUUT accyerror, where floorerror is the result of the error computation due to the floor, and accyerror is the specified accuracy.
0.6 % (nominal)
Frequency Error
Accuracy 2.0 Hz (nominal) + tfa b
b. tfa = transmitter frequency frequency reference accuracy
I/Q Origin offset
DUT Maximum Offset Analyzer Noise Floor
10 dBc (nominal)50 dBc (nominal)
Spectrum (Frequency Domain) See “Spectrum” on page 150.
Waveform (Time Domain) See “Waveform” on page 151.
Description Specifications Supplemental Information
In-Band Frequency Range
Cellular Band 824 to 849 MHz869 to 894 MHz
PCS Band 1850 to 1910 MHz1930 to 1990 MHz
248 Chapter 13

NADC Measurement Personality
General
General
Description Specifications Supplemental Information
Trigger
Trigger source RF burst (wideband), Video (IF envelope), Ext Front, Ext Rear. Actual available choices dependent on measurement.
Trigger delay, level, and slope Each trigger source has a separate set of these parameters.
Trigger delay Range Repeatability Resolution
100 to +500 ms33 ns33 ns
External trigger inputs Level Impedance
5 V to +5 V (nominal)10 kW (nominal)
Range Control RF Input Autorange a Manually set Max Total PwrManually set Input Atten
a. Auto range is not continuous with each measurement acquisition; it will run only once immediately fol-lowing a measurement restart, initiated either by pressing the Restart key, or by sending the GPIB command INIT:IMM. This behavior was chosen to maintain best measurement speed, but it requires caution when input power levels change. If the input signal power changes, the analyzer will not read-just the input attenuators for optimal dynamic range unless a measurement restart is initiated. For example, if a sequence of power measurements is made, beginning with a maximum power level that is large enough to require non-zero input attenuation, it is advisable to do a measurement restart to auto-matically set a lower input attenuator value to maintain optimal dynamic range for approximately every 3 dB the input signal power level is reduced, or smaller, depending upon how precisely dynamic range needs to be optimized. Conversely, if the input signal power increases to a high enough level, input overloading will occur if the input attenuators are not readjusted by doing a measurement restart.
Chapter 13 249

NADC Measurement Personality
General
250 Chapter 13

14 PDC Measurement Personality
This chapter contains specifications for the PSA series, Option BAE, PDC measurement personality.
251

PDC Measurement Personality
Additional Definitions and Requirements
Additional Definitions and Requirements
Because digital communications signals are noise-like, all measurements will have variations. The specifications apply only with adequate averaging to remove those variations.
The specifications apply in the frequency ranges documented in In-Band Frequency Range.
The specifications for this chapter apply to the E4440A, E4443A and E4445A spectrum analyzers. For the E4446A, E4447A, and E4448A, the performance is nominal only and not subject to any warranted specifications.
The measurement performance is only slightly different in the E4446A, E4447A, and E4448A when compared to the performance of the E4440A, E4443A and E4445A analyzers. Because the hardware performance of the analyzers is very similar but not identical, you can estimate the nominal performance of the measurements from the specifications in this chapter.
252 Chapter 14

PDC Measurement Personality
Option BAE, PDC Measurement Personality
Option BAE, PDC Measurement Personality
Description Specifications Supplemental Information
Adjacent Channel Power Ratio
Minimum Power at RF Input 36 dBm (nominal)
ACPR Dynamic Range At 50 kHz offset At 100 kHz offset
74 dB (nominal)78 dB (nominal)
ACPR Relative Accuracy 0.08 dBa
a. The specified ACPR accuracy applies if the measured ACPR substantially exceeds the analyzer dynamic range at the specified offset. When this condition is not met, there are additional errors due to the addition of analyzer spectral components to UUT spectral components. The spectral components from the analyzer will be non-coherent with the components from the UUT. Because of this, the errors add in a power sense. The error is a function of the signal (UUT ACPR) to noise (analyzer ACPR dynamic range limitation) ratio, SN, in decibels.The function is: error = 10 × log(1 + 10 SN/10)For example, if the UUT ACPR is 64 dB and the measurement floor is 74 dB, the SN ratio is 10 dB and the error due to adding the analyzer's noise to that of the UUT is 0.41 dB.With the nominal dynamic ranges shown, and with ACP at the nominal test limits of 45 and 60 dB, and with an input RF power well above 18 dBm, the errors due to dynamic range limitations are nom-inally 0.005 dB at 50 kHz offset and 0.07 dB at 100 kHz offset.
Error Vector Magnitude (EVM)
Minimum Power at RF Input 50 dBm (nominal)
EVM Operating range Floor Accuracyb
0.5 %
0 to 18 % (nominal)0.6 % (nominal)
I/Q Origin offset DUT Maximum Offset Analyzer Noise Floor
12 dBc (nominal)50 dBc (nominal)
Frequency Error Accuracy
2.0 Hz + tfa c
Spectrum (Frequency Domain) See “Spectrum” on page 150.
Waveform (Time Domain) See “Waveform” on page 151.
Chapter 14 253

PDC Measurement Personality
Option BAE, PDC Measurement Personality
b. The accuracy specification applies when the EVM to be measured is well above the measurement floor. When the EVM does not greatly exceed the floor, the errors due to the floor add to the accuracy errors. The errors due to the floor are noise-like and add incoherently with the UUT EVM. The errors depend
on the EVM of the UUT and the floor as follows: error = sqrt(EVMUUT2 + EVMsa2) EVMUUT, where EVMUUT is the EVM of the UUT in percent, and EVMsa is the EVM floor of the analyzer in percent. For example, if the EVM of the UUT is 7 %, and the floor is 2.5 %, the error due to the floor is 0.43 %. The total error can cause a reading as high as EVMUUT + floorerror + accyerror, or as low as EVMUUT accyerror, where floorerror is the result of the error computation due to the floor, and accyerror is the specified accuracy.
c. tfa = transmitter frequency frequency reference accuracy
Description Specifications Supplemental Information
Occupied Bandwidth
Minimum power at RF InputFrequency ResolutionFrequency Accuracy
100 Hz
60 dBm (nominal)50 to 150 Hz (nominal)a
a. The errors in the Occupied Bandwidth measurement are mostly due to the noisiness of any measure-ment of a noise-like signal, such as the PDC signal. The observed standard deviation of the OBW mea-surement is 270 Hz, so with 100 averages, the standard deviation should be well under the display resolution. The frequency errors due to the FFT processing are computed to be only 2.9 Hz with the narrow RBW (140 Hz) used. For large numbers of averages, the error is within the quantization error shown.
Description Specifications Supplemental Information
In-Band Frequency Range
800 MHz Band #1 810 to 828 MHz940 to 958 MHz
800 MHz Band #2 870 to 885 MHz925 to 940 MHz
800 MHz Band #3 838 to 840 MHz893 to 895 MHz
1500 MHz Band 1477 to 1501 MHz1429 to 1453 MHz
254 Chapter 14

PDC Measurement Personality
General
General
Description Specifications Supplemental Information
Trigger
Trigger source RF burst (wideband), Video (IF envelope), Ext Front, Ext Rear, Frame Timer. Actual available choices dependent on measurement.
Trigger delay, level, and slope Each trigger source has a separate set of these parameters.
Trigger delay Range Repeatability Resolution
100 to 500 ms33 ns33 ns
External trigger inputs Level Impedance
5 V to +5 V (nominal)10 kW (nominal)
Range Control RF Input Autorange a Manually set Max Total PwrManually set Input Atten
a. Auto range is not continuous with each measurement acquisition; it will run only once immediately fol-lowing a measurement restart, initiated either by pressing the Restart key, or by sending the GPIB com-mand INIT:IMM. This behavior was chosen to maintain best measurement speed, but it requires caution when input power levels change. If the input signal power changes, the analyzer will not read-just the input attenuators for optimal dynamic range unless a measurement restart is initiated. For exam-ple, if a sequence of power measurements is made, beginning with a maximum power level that is large enough to require non-zero input attenuation, it is advisable to do a measurement restart to automati-cally set a lower input attenuator value to maintain optimal dynamic range for approximately every 3 dB the input signal power level is reduced, or smaller, depending upon how precisely dynamic range needs to be optimized. Conversely, if the input signal power increases to a high enough level, input overloading will occur if the input attenuators are not readjusted by doing a measurement restart.
Chapter 14 255

PDC Measurement Personality
General
256 Chapter 14

15 TD-SCDMA Measurement Personality
This chapter contains characteristics for the PSA series, Option 211, TD-SCDMA measurement personality.
257

TD-SCDMA Measurement Personality
Option 211, TD SCDMA Measurement Personality
Option 211, TD SCDMA Measurement Personality
Description Specification Supplemental Information
Power vs. Time Note: RRC filter not supported
Burst Type Traffic, UpPTS and DwPTS
Full radio frame maska
a. Mask supports consecutive timeslots (standards compliant). Masks are user definable over the bus.
10 ms mask delay
Transmit power Min, Max, Mean
Dynamic range 112 dB (nominal)
Trigger External front, rear
Averaging type
Measurement time
Off, RMS, Log
Up to 9 slots
Description Specification Supplemental Information
Transmit Power Note: RRC filter not supported
Burst Types Traffic, UpPTS, DwPTS
Measurement method Above threshold, Burst width
Measurement results type Min, Max, Mean
Trigger External Front, External Rear, RF Burst, Free Run
Average type Off, RMS, Log
Average mode Exponential, Repeat
Measurement time Up to 18 slots
258 Chapter 15

TD-SCDMA Measurement Personality
Option 211, TD SCDMA Measurement Personality
Description Specification Supplemental Information
Adjacent Channel Power
Limitsa
a. Default settings for the limits are standards compliant.
Customizable up to 6 offsets
Filter None, RRC (variable alpha)
Measurement Type Total Power Ref, PSD (power spectral density) Ref
Noise correction On, Off
Description Specification Supplemental Information
Multi-Carrier Power RRC filter supported
Carriers supported Up to 12 carriers
Averaging type RMS
Limitsa
a. Default settings for the limits are standards compliant.
Customizable up to 3 offsets (relative and absolute)
Noise correction On, Off
Chapter 15 259

TD-SCDMA Measurement Personality
Option 211, TD SCDMA Measurement Personality
Description Specification Supplemental Information
Spurious Emissionsa
a. This applications takes into account the differences between mobile station and base station default values based on the standards set forth in CWTS TSM 05.05V3.1.
User definable range table b
b. User definable center frequency, span, resolutions bandwidth, video bandwidth, sweep time and abso-lute parameters for each range.
Define up to 20 ranges
Reported spurs Up to 200 spurs can be reported
Average Type RMS (Trace averaging also supported)
Average mode Exponential, Repeat
Peak threshold rangec
c. Spurs that are both above the peak threshold and meet the peak excursion criteria will be measured.
+7 dBm to 93 dBm
Peak excursion rangec 0 to 100 dB
Spectrum Emission Mask
Offsets from channel 5 offsets (compliant or user defined)
Fail mask Absolute; Relative; Absolute AND relative; Absolute OR relative
General Information Automatic input and reference level setting
Device Type Mobile station, Base transceiver station
Standards Compliant 1.28 Mcps TSM 3.1.0/NTDD
260 Chapter 15

16 TD-SCDMA/HSDPA/8PSK Measurement Personalities
This chapter contains specifications for the PSA Series, Option 212, TD-SCDMA modulation analysis measurement personality, and for the PSA Series, Option 213, HSDPA/8PSK for TD-SCDMA modulation analysis measurement personality.
261

TD-SCDMA/HSDPA/8PSK Measurement Personalities
Additional Definitions and Requirements
Additional Definitions and Requirements
Because digital communications signals are noise-like, all measurements will have variations. The specifications apply only with adequate averaging to remove those variations.
The specifications apply in the frequency ranges documented in In-Band Frequency Range.
The specifications for this chapter apply to the E4440A, E4443A and E4445A spectrum analyzers. For the E4446A, E4447A, and E4448A, the performance is nominal only and not subject to any warranted specifications.
The measurement performance is only slightly different in the E4446A, E4447A, and E4448A when compared to the performance of the E4440A, E4443A and E4445A analyzers. Because the hardware performance of the analyzers is very similar but not identical, the user can estimate the nominal performance of the measurements from the specifications in this chapter.
262 Chapter 16

TD-SCDMA/HSDPA/8PSK Measurement Personalities
Measurement Specifications
Measurement Specifications
Description Specifications Supplemental Information
Code Domain
BTS Measurements 25 dBm MLa 15 dBm 25 to 35 °Cb, Preamp (Option 1DS) Off, except as noted
a. ML (mixer level) is RF input power attenuation.b. This table is intended for users in the manufacturing environment, and as such, the tolerance limits
have been computed for temperatures of the ambient air near the analyzer of 25 to 35 °C.
Following specifications are 95
%c, unless stated as (nominal).
c. All specifications given are derived from 95th percentile observations with 95 % confidence.
Code domain power
Minimum power at RF input
Preamp (Option 1DS) Off Preamp (Option 1DS) On
60 dBm (nominal)d75 dBm (nominal)
d. Nominal operating range. Accuracy specifications apply when mixer level (RF input power minus attenuation) is between 25 and 15 dBm.
Maximum power at RF input
Preamp (Option 1DS) On 45 dBm (nominal)
Relative accuracy < 0.1 dB (nominal)
Symbol power vs. time
Minimum power at RF input 50 dBm (nominal)d
Symbol error vector magnitude
Minimum power at RF input 50 dBm (nominal)d
Accuracy < 0.9 % (nominal)
Chapter 16 263

TD-SCDMA/HSDPA/8PSK Measurement Personalities
Measurement Specifications
Description Specifications Supplemental Information
Modulation Accuracy
(Composite EVM)
BTS Measurements 25 dBm MLa 15 dBm Preamp (Option 1DS) Off, except as noted
a. ML (mixer level) is RF input power attenuation.
Following specifications are
95 %b, unless stated as (nominal).
b. All specifications given are derived from 95th percentile observations with 95 % confidence.
Composite EVM
Minimum power at RF input Preamp (Option 1DS) Off Preamp (Option 1DS) On
60 dBm (nominal)c d75 dBm (nominal)
c. Predefined test models under the Symbol Boundary menu are recommended for RF input power levels below 60 dBm. At low signal-to-noise ratios the auto channel ID algorithm may not correctly detect an active code channel as turned on. The predefined test model bypasses the auto channel ID algorithm.
Maximum power at RF input Preamp (Option 1DS) On
45 dBm (nominal)
Test signal with TS0 active with one DPCH per timeslot Accuracye
Test signal with TS2 active with 4 HS-PDSCH per timeslot Accuracyf
1.0 % (nominal)
1.0 % (nominal)
Peak Code Domain ErrorTest signal with TS0 active with one DPCH per timeslot Accuracy
Test signal with TS2 active with 4 HS-PDSCH per timeslot Accuracy
1.0 dB (nominal)
1.0 dB (nominal)
I/Q Origin Offset DUT Maximum Offset Analyzer Noise Floor
10 dBc (nominal)50 dBc (nominal)
Frequency Error Range Accuracy
264 Chapter 16

TD-SCDMA/HSDPA/8PSK Measurement Personalities
Measurement Specifications
d. Nominal operating range. Accuracy specification applies when mixer level (RF input power minus attenuation) is between 25 and 15 dBm.
e. The accuracy specification applies when the EVM to be measured is well above the measurement floor. When the EVM does not greatly exceed the floor, the errors due to the floor add to the accuracy errors. The errors due to the floor are noise-like and add incoherently with the UUT EVM. The errors
depend on the EVM of the UUT and the floor as follows: error = sqrt(EVMUUT2 + EVMsa2) EVMUUT, where EVMUUT is the EVM of the UUT in percent, and EVMsa is the EVM floor of the analyzer in percent. For example, if the EVM of the UUT is 7 %, and the floor is 2.5 %, the error due to the floor is 0.43 %. The total error can cause a reading as high as EVMUUT + floorerror + accyerror, or as low as EVMUUT accyerror, where floorerror is the result of the error computation due to the floor, and accyerror is the specified accuracy.
f. The accuracy specification applies when the EVM to be measured is well above the measurement floor. When the EVM does not greatly exceed the floor, the errors due to the floor add to the accuracy errors. The errors due to the floor are noise-like and add incoherently with the UUT EVM. The errors depend
on the EVM of the UUT and the floor as follows: error = sqrt(EVMUUT2 + EVMsa2) EVMUUT, where EVMUUT is the EVM of the UUT in percent, and EVMsa is the EVM floor of the analyzer in percent. For example, if the EVM of the UUT is 7 %, and the floor is 2.5 %, the error due to the floor is 0.43 %. The total error can cause a reading as high as EVMUUT + floorerror + accyerror, or as low as EVMUUT accyerror, where floorerror is the result of the error computation due to the floor, and accyerror is the specified accuracy.
Chapter 16 265

TD-SCDMA/HSDPA/8PSK Measurement Personalities
Measurement Specifications
Frequency
General
Description Specifications Supplemental Information
In-Band Frequency Range a) 1900 to 1920 MHz 2010 to 2025 MHz
b) 1850 to 1910 MHz 1930 to 1990 MHz
c) 1910 to 1930 MHz
Description Specifications Supplemental Information
Trigger
Trigger source RF burst (wideband), Video (IF envelope), Ext Front, Ext Rear. Actual choices are dependent on measurement.
Trigger delay, level, and slope Each trigger source has separate set of these parameters.
Trigger delayRangeRepeatabilityResolution
100 to +500 ms33 ns33 ns
External trigger inputsLevelImpedance
5 V to +5 V (nominal)10 kW (nominal)
Range Control RF Input AutorangeaManually set Max Total PwrManually set Input Atten
a. Autorange is not continuous with each measurement acquisition; it will run only once immediately fol-lowing a measurement restart, initiated either by pressing the Restart key, or by sending the GPIB com-mand INIT:IMM. This behavior was chosen to maintain best measurement speed, but it requires caution when input power levels change. If the input signal power changes, the analyzer will not read-just the input attenuators for optimal dynamic range unless a measurement restart is initiated. For example, if a sequence of power measurements is made, beginning with a maximum power level that is large enough to require non-zero input attenuation, it is advisable to do a measurement restart to auto-matically set a lower input attenuator value to maintain optimal dynamic range for approximately every 3 dB the input signal power level is reduced, or smaller, depending upon how precisely dynamic range needs to be optimized. Conversely, if the input signal power increases to a high enough level, input overloading will occur if the input attenuators are not readjusted by doing a measurement restart.
266 Chapter 16

17 40 MHz Bandwidth Digitizer - Option 140
This chapter contains specifications for the PSA Series, Option 140, 40 MHz Bandwidth Digitizer. They apply in the Basic measurement personality, and only while using the wideband path. If you are using the narrowband path, see the chapter on Digital Communications Basic Measurement Personality (Narrowband) Specifications.
267

40 MHz Bandwidth Digitizer - Option 140
Frequency
Frequency
Description Specifications Supplemental Information
Frequency Range
E4443A
E4445A
E4440A
E4446A
E4448A
10 MHz to 6.7 GHz
10 MHz to 13.2 GHz
10 MHz to 26.5 GHz
10 MHz to 44 GHz
10 MHz to 50 GHz
Frequency Span
Minimum Span
Maximum Usable Span
Center Frequency 3.0 GHz
Center Frequency > 3.0 GHz
Preselector On
Preselector Offa
a. Option 123 is installed and enabled
10 Hz
40 MHz
40 MHz
40 MHz (nominal)
Resolution Bandwidth
(Spectrum Measurement)
Range
Overall
Span = 40 MHz
Span = 1 MHz
Span = 10 kHz
Span = 100 Hz
Window Shapes
500 mHz to 3 MHz
3 kHz to 3 MHz
50 Hz to 1 MHz
1 Hz to 10 kHz
500 mHz to 100 Hz
Flat Top, Uniform, Hanning, Hamming, Gaussian, Blackman, Blackman-Harris, Kaiser-Bessel (K-B 70 dB, K-B 90 dB & K-B 110 dB)
Analysis Bandwidth (Span) (Waveform Measurement)
Gaussian Shape
10 Hz to 40 MHz
268 Chapter 17

40 MHz Bandwidth Digitizer - Option 140
Amplitude and Phase
Amplitude and Phase
Description Specifications Supplemental Information
Full Scale Levela Dither Offb, 0 dB input
attenuationc, 0 dB IF gain c
a. The full scale level is the reference for specifications with dBfs (decibels relative to full scale) units. It is a level that is sure to be free of overload.
b. The full scale level decreases by nominally 2 dB when dither is on.c. The full scale level increases proportionally to input attenuation and decreases proportionally to IF
gain. Full scale level = 16 dBm + RF attenuation IF gain, where RF attenuation = 0, 2, 4, …. 70 dB and IF gain = 12 to +12 dB.
16 dBm
IF Gain Control 12 dB to +12 dB 2 dB steps
Overload Leveld
For E4440A/43A/45A
Band 0 +4 dBfs (nominal)
Preselector On Preselector Offe
Band 1 +5 dBfs (nominal) +5 dBfs (nominal)
Band 2 +6 dBfs (nominal) +8 dBfs (nominal)
Band 3 +5 dBfs (nominal) +9 dBfs (nominal)
Band 4 +5 dBfs (nominal) +19 dBfs (nominal)
For E4446A/48A
Band 0 +2 dBfs (nominal)
Preselector Offe
Band 1 +5 dBfs (nominal)
Band 2 +5 dBfs (nominal)
Band 3 +5 dBfs (nominal)
Band 4 +10 dBfs (nominal)
Band 5 +8 dBfs (nominal)
Band 6 +12 dBfs (nominal)
Band 7 +20 dBfs (nominal)
Chapter 17 269

40 MHz Bandwidth Digitizer - Option 140
Amplitude and Phase
d. For maximum dynamic range, signal levels may be controlled so that they approach the clipping level of the ADC in the wideband IF. That clipping level varies from nominally 2 dB above the Full Scale Level in the 10 MHz 3.0 GHz band, to much higher levels in higher bands. The ratio of the clipping level to the Full Scale Level varies with band number and whether the preselector is off or on. At its highest, the ratio is about 20 dB at 26.5 GHz with the preselector off.
e. Option 123 is installed and enabled.
270 Chapter 17

40 MHz Bandwidth Digitizer - Option 140
Amplitude and Phase
Description Specifications Supplemental Information
Absolute amplitude accuracya b
For E4440A/43A/45A
At 50 MHzc 20 to 30 °C 0 to 55 °C
0.30 dB0.42 dB
For E4446A/48A
At 50 MHzc 20 to 30 °C 0 to 55 °C
0.32 dB0.42 dB
Attenuator Switchingd See Chapter 1 Mechanical attenuator only
Input Couplinge AC coupling only for E4440A/43A/45A.
High pass filter corner frequency at 3 dB is 4 MHz (nominal)
DC coupling only for E4446A/48A
RF Frequency Response Relative to 50 MHz, measured at center of span, 10 dB input atten
Typicalf performance vs. Span
Span 36 MHz
Span 36 MHz
Span 36 MHz
Span 36 MHz
For E4440A/43A/45A
50 MHz to 3 GHz, 20 to 30 °C 0.52 dB 0.51 dB 0.22 dB 0.11 dB
50 MHz to 3 GHz, 0 to 55 °C 0.71 dB 0.64 dB
Preselector is Ong
3.05 to 6.6 GHz 0.40 dB
> 6.6 to 13.2 GHz 1.20 dB
> 13.2 to 19.2 GHz 0.70 dB
> 19.2 to 26.5 GHz 2.00 dB
Preselector is Offg
3.0 to 6.6 GHz 0.15 dB 0.70 dB
> 6.6 to 13.2 GHz 0.25 dB 0.90 dB
> 13.2 to 19.2 GHz 0.50 dB 0.90 dB
Chapter 17 271

40 MHz Bandwidth Digitizer - Option 140
Amplitude and Phase
> 19.2 to 26.5 GHz 0.80 dB 1.00 dB
For E4446A/48A
50 MHz to 3 GHz, 20 to 30 °C 0.75 dB 0.85 dB 0.35 dB 0.35 dB
50 MHz to 3 GHz, 0 to 55 °C 0.90 dB 1.00 dB
Preselector is Offg
3.0 to 6.6 GHz 0.85 dB 2.30 dB
> 6.6 to 13.2 GHz 1.15 dB 2.50 dB
> 13.2 to 19.2 GHz 1.00 dB 3.35 dB
> 19.2 to 26.5 GHz 1.70 dB 2.35 dB
> 26.5 to 31.15 GHz 0.95 dB (nominal)
1.50 dB (nominal)
> 31.15 to 41 GHz 1.00 dB (nominal)
1.50 dB (nominal)
> 41 to 50 GHz 2.30 dB (nominal)
2.50 dB (nominal)
a. Absolute Amplitude at CF = Absolute Amplitude at 50 MHz + Attenuation Switching + RF Frequency Response + IF Frequency Response.
b. Changes in the impedance seen by the 321.4 MHz Aux Output port on the rear panel can impact the amplitude accuracy of the PSA> IF the impedance on this port is changed, the user should perform an Align Now All to ensure the amplitude accuracy of the PSA.
c. Center of span, 10 dB input attenuation, flat top window.d. The wideband IF path uses the electromechanical attenuator. e. The effects of input Coupling are included within IF and RF Frequency Response.f. This “typical” is the performance observed at the worst center frequency and worst offset frequency
within the ranges shown in 80 % of the instruments observed with 95 % confidence. Agilent measures 100 % of PSA analyzers for this performance in the factory production process. These performance results are not warranted.
g. When Preselector is On, Band 1 starts at 3.05 GHz. When Preselector is Off (Option 123 is installed and enabled), Band 1 starts at 3.0 GHz.
Description Specifications Supplemental Information
272 Chapter 17

40 MHz Bandwidth Digitizer - Option 140
Amplitude and Phase
Description Specifications Supplemental Information
IF Frequency Responsea Relative to center frequency
Freq (GHz)
Span Preselector Typical RMS
(nominal)b
For E4440A/43A/45A
3.0 30 MHz n/a 0.47 dB 0.13 dB 0.08 dB
>3.0 to 3.05 30 MHz Onc 0.57 dB 0.28 dB 0.13 dB
> 3.0 to 3.05 30 MHz Offd 0.40 dB 0.16 dB 0.06 dB
3.0 40 MHz n/a 0.65 dB 0.30 dB 0.14 dB
> 3.0 to 3.05 40 MHz Onc 0.73 dB 0.30 dB 0.21 dB
> 3.0 to 3.05 40 MHz Offd 0.43 dB 0.17 dB 0.09 dB
> 3.05 to 6.6 30 MHz On 1.10 dB 0.41 dB
> 3.05 to 6.6 30 MHz Offd 0.40 dB 0.16 dB 0.06 dB
> 6.6 to 26.5 30 MHz On 1.30 dB 0.57 dB
> 6.6 to <10 30 MHz Offd 0.58 dB 0.28 dB 0.11 dB
10 to 26.5 30 MHz Offd 0.56 dB 0.16 dB 0.06 dB
> 3.05 to 6.6 40 MHz Offd 0.43 dB 0.17 dB 0.09 dB
> 6.6 to 26.5 40 MHz Offd 0.96 dB 0.30 dB 0.13 dB
For E4446A/48A
3.0 30 MHz Offd 0.95 dB 0.45 dB 0.15 dB
3.0 40 MHz Offd 1.15 dB 0.60 dB 0.15 dB
> 3.0 to 6.6 30 MHz Offd 0.40 dB 0.15 dB 0.05 dB
> 6.6 to 13.2 30 MHz Offd 0.70 dB 0.30 dB 0.05 dB
> 13.2 to 19.2 30 MHz Offd 0.45 dB 0.20 dB 0.05 dB
Chapter 17 273

40 MHz Bandwidth Digitizer - Option 140
Amplitude and Phase
> 19.2 to 26.5 30 MHz Offd 0.70 dB 0.30 dB 0.10 dB
> 26.5 to 31.15 30 MHz Offd 0.65 dB 0.25 dB 0.05 dB
> 31.15 to 41 30 MHz Offd 0.70 dB 0.25 dB 0.05 dB
> 41 to 50 30 MHz Offd 1.20 dB 0.40 dB 0.10 dB
> 3.0 to 6.6 40 MHz Offd 0.80 dB 0.30 dB 0.10 dB
> 6.6 to 13.2 40 MHz Offd 1.35 dB 0.65 dB 0.15 dB
> 13.2 to 19.2 40 MHz Offd 0.75 dB 0.35 dB 0.10 dB
> 19.2 to 26.5 40 MHz Offd 1.25 dB 0.50 dB 0.10 dB
> 26.5 to 31.15 40 MHz Offd 1.00 dB 0.40 dB 0.10 dB
> 31.15 to 41 40 MHz Offd 1.15 dB 0.40 dB 0.10 dB
> 41 to 50 40 MHz Offd 1.60 dB 0.55 dB 0.10 dB
a. The effects of RF Coupling at low frequencies and the effects of low-pass filter roll-off above 3.05 GHz are both included within the IF Frequency Response.
b. The listed performance is the rms of the amplitude deviation from the center frequency amplitude, where the rms is computed over the range of offset frequencies and center frequencies shown.
c. With Preselector On, the IF frequency response performance is degraded at this frequency range. For better performance it is recommended to turn off the Preselector (Option 123 installed and enabled).
d. Option 123 is installed and enabled
Description Specifications Supplemental Information
274 Chapter 17

40 MHz Bandwidth Digitizer - Option 140
Amplitude and Phase
Description Specification Supplemental Information
IF Phase Linearity
Relative to mean phase linearity
Freq (GHz)
Span
(MHz)
Preselector Typicala RMS (nominal)b
For E4440A/43A/45A
3.0 30 n/a 1.2° 0.3°
< 0.3 40 n/a 3.2° 1.1°
0.3 to 3.0 40 n/a 2.5° 0.6°
> 3.0 to 6.6 30 On 7.0° (nominal) 2.0°
> 6.6 to 20 30 On 10.0° (nominal) 2.1°
> 3.0 to 20 30 Off c 0.8° 0.2°
> 20 to 26.5 30 Off c 0.8° (nominal) 0.2°
> 3.0 to 20 40 Off c 1.2° 0.3°
> 20 to 26.5 40 Off c 1.2° (nominal) 0.3°
For E4446A/48A
3.0 30 Off c 2.8° 0.6°
< 0.3 40 Off c 6.3° 1.4°
0.3 to 3.0 40 Off c 5.7° 1.0°
> 3.0 to 20 30 Off c 2.5° 0.2°
> 20 to 26.5 30 Off c 2.0° (nominal) 0.2°
> 26.5 to 31.15 30 Off c 1.4° (nominal) 0.2°
> 31.15 to 41 30 Off c 2.1° (nominal) 0.2°
> 41 to 44 30 Off c 2.1° (nominal) 0.2°
Chapter 17 275

40 MHz Bandwidth Digitizer - Option 140
Amplitude and Phase
> 3.0 to 20 40 Off c 4.4° 0.4°
> 20 to 26.5 40 Off c 3.2° (nominal) 0.6°
> 26.5 to 31.15 40 Off c 3.7° (nominal) 0.4°
> 31.15 to 41 40 Off c 3.1° (nominal) 0.3°
> 41 to 44 40 Off c 2.8° (nominal) 0.4°
a. This “typical” is the performance observed at the worst center frequency and worst offset frequency within the ranges shown in 80 % of the instruments observed with 95 % confidence. Agilent measures 100 % of PSA analyzers for this performance in the factory production process. These performance results are not warranted.
b. The listed performance is the rms of the phase deviation relative to the mean phase deviation from a linear phase condition, where the rms is computed over the range of offset frequencies and center fre-quencies shown.
c. Option 123 is installed and enabled.
Description Specification Supplemental Information
276 Chapter 17

40 MHz Bandwidth Digitizer - Option 140
Amplitude and Phase
PSA Phase ResponseOpt. 140 alone
-5-4-3-2-1012345
-30 -20 -10 0 10 20 30
IF Offset (MHz)
Ph
Re
spo
nse
(d
eg
)
1001
1751
Center Freq (MHz)
PSA Phase Response Opt. 140 + 1DS + B7J
-5-4-3-2-1012345
-30 -20 -10 0 10 20 30
IF Offset (MHz)
Ph
Res
pons
e (d
eg)
1001
1751
Center Freq (MHz)
PSA Opt 140/123 Phase Response
-5
-4
-3
-2
-1
0
1
2
3
4
5
-30 -20 -10 0 10 20 30
Offset Freq (MHz)
Ph
Res
pons
e (d
eg)
5001
18001
Center Freq (MHz)
Chapter 17 277

40 MHz Bandwidth Digitizer - Option 140
Amplitude and Phase
Description Specification Supplemental Information
EVM
EVM measurement floor for an 802.11g OFDM signal, using 89601A software equalization, channel estimation and data EQ
2.4 GHz 0.35 % (nominal)
6.0 GHz 0.56 % (nominal)
278 Chapter 17

40 MHz Bandwidth Digitizer - Option 140
Dynamic Range
Dynamic Range
Description Specifications Supplemental Information
Third Order Intermodulation Distortion Two tones of equal magnitude, 0 dB IF Gain
Verified with 1 MHz separation
Freq Spana Tone Levelb
(GHz) (MHz) (dBfs) (dBm)
For E4440A/43A/45A
3.05 30 9 25 75 dBc 80 dBc (typical)
3.05 40 9 25 74 dBc 78 dBc (typical)
3.05 30 6 22 72 dBc 77 dBc (typical; equivalent to +16.5 dBm TOI)
3.05 40 6 22 70 dBc 74 dBc (typical)
Preselector On
> 3.05 30 6 22 68 dBc (nominal)
Preselector Offb
> 3.0 30 6 22 70 dBc (nominal)
For E4446A/48A
3.05 30 9 25 75 dBc 80 dBc (typical)
3.05 40 9 25 74 dBc 78 dBc (typical)
3.05 30 6 22 72 dBc 77 dBc (typical; equivalent to +16.5 dBm TOI)
3.05 40 6 22 68 dBc 74 dBc (typical)
Preselector On
> 3.05c 30 4 20 65 dBc (nominal)
Preselector Offb
> 3.0c 30 4 20 66 dBc (nominal)
Chapter 17 279

40 MHz Bandwidth Digitizer - Option 140
Dynamic Range
Spurious (Input Related) Responses Includes: aliased harmonic distortion, second-order IF inter modulation products, images about the center frequency. Preselector On.
Excludes second harmonic of RF input; see “Second Harmonic Distortion” on page 74.
Freq Span Level
(GHz) (MHz) (dBfs)
For E4440A/43A/45A
3.05 30 0 73 dBc 82 dBc (typical)
3.05 40 0 65 dBc 76 dBc (typical)
> 3.05 30 0 68 dBc (nominal)
For E4446A/48A
3.05 30 0 64 dBc 74 dBc (typical)
3.05 40 0 54 dBc 65 dBc (typical)
> 3.05 30 0 62 dBc (nominal)
a. Specifications apply for the “best practices” case of using the central portion of the 36 and 40 MHz bandwidths. Noise and distortion performance degrade by about 4 dB at the edges of these bandwidths.
b. Option 123 is installed and enabled.c. Up to 33 GHz. Above 33 GHz, the noise floor dominates the dynamic range specifications.
Description Specifications Supplemental Information
280 Chapter 17

40 MHz Bandwidth Digitizer - Option 140
Dynamic Range
Description Specifications Supplemental Information
Input Noise Density Excluding residuals;
Freq (GHz)
Span(MHz)
IF Gain(dB)
Preselector On, unless otherwise stated.
For E4440A/43A/45A Non-option 123
3.05 30 12 136 dBfs/Hz 140 dBfs/Hza (nominal)
3.05 40 12 133 dBfs/Hz
3.05 30 0 130 dBfs/Hz 134 dBfs/Hz (typical)
3.05 30 0 130 dBfs/Hz 137 dBfs/Hz @ 1 GHz (typical)
3.05 40 0 130 dBfs/Hz
3.0 to 6.6b 30 0 130 dBfs/Hz 133 dBfs/Hz (typical)
For E4440A/43A/45A (Opt 110 preamp installed but Off)
Non-option 123
3.05 30 12 135 dBfs/Hz 133 dBfs/Hza(nominal)
3.05 40 12 132 dBfs/Hz
3.05 30 0 129 dBfs/Hz 134 dBfs/Hz (typical)
3.05 30 0 129 dBfs/Hz 136 dBfs/Hz @ 1 GHz (typical)
3.05 40 0 129 dBfs/Hz
3.0 to 6.6b 30 0 128 dBfs/Hz 131 dBfs/Hz (typical)
The following are nominal:
Preselector On Preselector Offb
30 MHz Span 40 MHz Span
3.05 to 6.6 -135 dBfs/Hz -135 dBfs/Hz
> 6.6 to 13.2 -132 dBfs/Hz -128 dBfs/Hz
> 13.2 to 19.2 -132 dBfs/Hz -123 dBfs/Hz
> 19.2 to 26.5 -128 dBfs/Hz -116 dBfs/Hz
For E4446A/48A
3.05 30 12 133 dBfs/Hz 138 dBfs/Hz (nominal)
3.05 40 12 130 dBfs/Hz -138 dBfs/Hz (nominal)
3.05 30 0 127 dBfs/Hz 132 dBfs/Hz (typical)
Chapter 17 281

40 MHz Bandwidth Digitizer - Option 140
Dynamic Range
3.05 40 0 127 dBfs/Hz -137 dBfs/Hz (nominal)
3.0 to 6.6b 30 0 125 dBfs/Hz 128 dBfs/Hz (typical)
The following are nominal:
Preselector Offb
Freq (GHz) 40 MHz Span
3.0 to 6.6 127 dBfs/Hz
> 6.6 to 13.2 127 dBfs/Hz
> 13.2 to 19.2 123 dBfs/Hz
> 19.2 to 26.5 116 dBfs/Hz
> 26.5 to 31.15 116 dBfs/Hz
> 31.15 to 41 109 dBfs/Hz
> 41 to 50 101 dBfs/Hz
a. Specifications apply for the “best practices” case of using the central portion of the 36 and 40 MHz bandwidths. Noise and distortion performance degrade by about 4 dB at the edges of these bandwidths.
b. Preselector is Off (Option 123 installed and enabled).
Description Specifications Supplemental Information
282 Chapter 17

40 MHz Bandwidth Digitizer - Option 140
Dynamic Range
Description Specifications Supplemental Information
Input Sensitivity (Noise Level) Excluding residuals;
Input terminated, log averaging, 0 dB input attenuation, freq 3.05GHz, maximum IF gain
Non-option 123
For E4440A/43A/45A (Opt 1DS preamp installed but Off)
152 dBma b
a. This sensitivity is specified in a 1 Hz RBW, averaged on a log scale, much as is the Displayed Average Noise Level in chapter 1. The sensitivity in terms of noise density is 2.25 dB worse.
b. Specifications apply for the “best practices” case of using the central portion of the 36 and 40 MHz bandwidths. Noise and distortion performance degrade by about 4 dB at the edges of these bandwidths.
For E4440A/43A/45A (Opt 110 preamp installed but Off)
151 dBma b
For E4446A/48A (Opt 1DS or 110 preamp installed but Off)
149 dBma b
Description Specification Supplemental Information
Residual Responses Input terminated, 0 dB RF attenuation
Verified with IF Gain = 6 dB
For E4440A/43A/45A
Relative to Full-Scalea
Center Freq. (CF) Span
3.0 GHz 40 MHz 90 dBfs
> 3.05 GHz and < 6.6 GHz
30 MHz 85 dBfs Preselector On
> 3.0 GHz and < 6.6 GHz
40 MHz 75 dBfs (nominal, Preselector
Offb)
For E4446A/48A
Relative to Full-Scale Levela
Center Freq. (CF) Span
3.0 GHz 40 MHz 90 dBfs
> 3.05 GHz and < 6.6 GHz
30 MHz 85 dBfs Preselector On
Chapter 17 283

40 MHz Bandwidth Digitizer - Option 140
Dynamic Range
> 3.0 GHz and < 6.6 GHz
30 MHz 80 dBfs (nominal, Preselector
Offb)
> 3.0 GHz and < 6.6 GHz
40 MHz 72 dBfs (nominal, Preselector
Offb)
Frequency Stability Noise Sidebands
Center Frequency = 1 GHz, IF Gain = 12 dB
For E4440A/43A/45A
Offset Frequency
100 Hz 91 dBc/Hz (nominal)
1 kHz 100 dBc/Hz (nominal)
10 kHz 106 dBc/Hz
100 kHz 119 dBc/Hz
1 MHzc 137 dBc/Hz
For E4446A/48A
Offset Frequency
100 Hz 91 dBc/Hz (nominal)
1 kHz 100 dBc/Hz (nominal)
10 kHz 103 dBc/Hz
100 kHz 116 dBc/Hz
1 MHzc 135 dBc/Hz
a. The Full-Scale level increases proportionally to input attenuation and decreases proportionally to IF gain. Full-Scale level (dBm) = -16 dBm + RF attenuation - IF gain, where RF attenuation = 0, 2, 4, ..., 70 dB and IF gain = -12 dB to +12 dB.
b. Option 123 is installed and enabled.c. The noise specified at this offset includes both contributors: the phase noise of the LO and the relative
level of broadband input noise, with minimum IF gain and a signal at full scale, approximately 4 dBm at the input mixer.
Description Specification Supplemental Information
284 Chapter 17

40 MHz Bandwidth Digitizer - Option 140
Data Acquisition
Data Acquisition
Description Specifications Supplemental Information
Time Record Length
Spectrum Measurement
Waveform Measurement
32 to 180,000 samples
32 to 106 samples (nominal)
Deep Time Capture Analysis BW > 20 MHz
1.2 108 samples
Analysis BW 20 MHz 6 107 samples
ADC Resolution 14 bits
Chapter 17 285

40 MHz Bandwidth Digitizer - Option 140
Wideband IF Triggering
Wideband IF Triggering
Description Specification Supplemental Information
Trigger Types Free Run (immediate), Video (IF envelope), External Front, External Rear, Frame (periodic)
Frame (periodic) Trigger Period
Range
Resolution
Offset Delay
Range
Resolution
Repeatability (when synchronized to an external source)
0 to > 500 ms
1 ns
0 to 10 s
10 ns
10 ps jitter (nominal )
External Trigger Trigger Delay
Range
Resolution
Repeatability
Spectrum Mode (any span)
Waveform
Analysis BW 6.25 MHz
Analysis BW < 6.25 MHz
Slope control, Input Impedance, Level Accuracy
100 ms to +500 ms
10 ns
See Chapter 1
1.5 ns (nominal )
1.5 ns (nominal )
25 ns (nominal )
Video (IF Envelope) Trigger Trigger Delay
Range
Resolution
Amplitude Range
0 to 500 ms
1 s
0 to 80 dBfs
Usable range limited by noise
286 Chapter 17

40 MHz Bandwidth Digitizer - Option 140
Wideband IF Triggering
Description Specification Supplemental Information
Trigger Hold off Range
Resolution
0 to 500 ms
10 ns
Auto Trigger Time Interval Range
1 ms to 10 s
Time Averaging Maximum block size for frame- triggered averaging
Maximum number of averages
16384 samples
> 500,000
Analysis BW 20 MHz
Chapter 17 287

40 MHz Bandwidth Digitizer - Option 140
Wideband IF Triggering
288 Chapter 17

18 80 MHz Bandwidth Digitizer - Option 122
This chapter contains specifications for the PSA Series, Option 122, 80 MHz Bandwidth Digitizer. They apply in the Basic measurement personality, and only while using the wideband path. If you are using the narrowband path, see the chapter on Digital Communications Basic Measurement Personality (Narrowband) Specifications.
289

80 MHz Bandwidth Digitizer - Option 122
Frequency
Frequency
Description Specifications Supplemental Information
Frequency Range E4443A
E4445A
E4440A
E4446A
E4448A
10 MHz to 6.7 GHz
10 MHz to 13.2 GHz
10 MHz to 26.5 GHz
10 MHz to 44 GHz
10 MHz to 50 GHz
Frequency Span Minimum Span
Maximum Usable Span
Center Frequency 3.0 GHz
Center Frequency > 3.0 GHz
Preselector On
10 Hz
80 MHz
40 to 80 MHz (nominal); see “Nominal IF Bandwidth” on page 291.
Preselector Offa
a. Option 123 is installed and enabled.
80 MHz
Resolution Bandwidth
(Spectrum Measurement)
Range
Overall
Span = 80 MHz
Span = 1 MHz
Span = 10 kHz
Span = 100 Hz
Window Shapes
500 mHz to 3 MHz
3 kHz to 3 MHz
50 Hz to 1 MHz
1 Hz to 10 kHz
500 mHz to 100 Hz
Flat Top, Uniform, Hanning, Hamming, Gaussian, Blackman, Blackman-Harris, Kaiser-Bessel (K-B 70 dB, K-B 90 dB & K-B 110 dB)
Analysis Bandwidth (Span) (Waveform Measurement) Gaussian Shape
10 Hz to 80 MHz
290 Chapter 18

80 MHz Bandwidth Digitizer - Option 122
Nominal IF Bandwidth
Nominal IF Bandwidth
Nominal IF Bandwidth (4 dB) vs. Center Frequency, CF > 3.05 GHza
a. Preselector is On.
40
50
60
70
80
3 6 9 12 15 18 21 24
Center Frequency (GHz)
Ban
dwid
th (
MH
z)
Chapter 18 291

80 MHz Bandwidth Digitizer - Option 122
Amplitude and Phase
Amplitude and Phase
Description Specifications Supplemental Information
Full Scale LevelaDither Offb, 0 dB inputattenuationc, 0 dB IF gainc
a. The full scale level is the reference for specifications with dBfs (decibels relative to full scale) units. It is a level that is sure to be free of overload
b. The full scale level decreases by nominally 2 dB when dither is on.c. The full scale level increases proportionally to input attenuation and decreases proportionally to IF
gain. Full scale level (dBm) = 16 dBm +RF attenuation IF gain where RF attenuation = 0, 2, 4, …. 70 dB and IF gain = 12 to +12 dB.
16 dBm
IF Gain Control 12 dB to +12 dB 2 dB steps
Overload Leveld
For E4440A/43A/45A
Band 0 +4 dBfs (nominal)
Preselector On Preselector Offe
Band 1 +5 dBfs (nominal) +5 dBfs (nominal)
Band 2 +6 dBfs (nominal) +8 dBfs (nominal)
Band 3 +5 dBfs (nominal) +9 dBfs (nominal)
Band 4 +5 dBfs (nominal) +19 dBfs (nominal)
For E4446A/48A
Band 0 +2 dBfs (nominal)
Preselector Offe
Band 1 +5 dBfs (nominal)
Band 2 +5 dBfs (nominal)
Band 3 +5 dBfs (nominal)
Band 4 +10 dBfs (nominal)
Band 5 +8 dBfs (nominal)
Band 6 +12 dBfs (nominal)
Band 7 +20 dBfs (nominal)
292 Chapter 18

80 MHz Bandwidth Digitizer - Option 122
Amplitude and Phase
d. For maximum dynamic range, signal levels may be controlled so that they approach the clipping level of the ADC in the wideband IF. That clipping level varies from nominally 2 dB above the Full Scale Level in the 10 MHz 3 GHz band, to much higher levels in higher bands. The ratio of the clipping level to the Full Scale Level varies with band number and whether the preselector is off or on. At its highest, the ratio is about 20 dB at 26.5 GHz with the preselector off.
e. Option 123 is installed and enabled.
Chapter 18 293

80 MHz Bandwidth Digitizer - Option 122
Amplitude and Phase
Description Specifications Supplemental Information
Absolute amplitude accuracya b
For E4440A/43A/45A
At 50 MHzc 20 to 30 °C 0 to 55 °C
0.30 dB0.42 dB
For E4446A/48A
At 50 MHzc 20 to 30 °C 0 to 55 °C
0.32 dB0.42 dB
Attenuator Switchingd See Chapter 1 Mechanical attenuator only
Input Couplinge AC coupling only for E4440A/43A/45A
High pass filter corner frequency at 3 dB is 4 MHz (nominal)
DC coupling only for E4446A/48A
RF Frequency Response Relative to 50 MHz, measured at center of span, 10 dB input atten
Typicalf performance vs. Span
Span 36 MHz
Span > 36 MHz
Span 36 MHz
Span > 36 MHz
For E4440A/43A/45A
50 MHz to 3 GHz, 20 to 30 °C 0.52 dB 0.51 dB 0.22 dB 0.11 dB
50 MHz to 3 GHz, 0 to 55 °C 0.71 dB 0.64 dB
Preselector Ong
3.05 to 6.6 GHz 0.40 dB
> 6.6 to 13.2 GHz 1.20 dB
> 13.2 to 19.2 GHz 0.70 dB
> 19.2 to 26.5 GHz 2.00 dB
Preselector is Offg
3.0 to 6.6 GHz 0.15 dB 0.70 dB
> 6.6 to 13.2 GHz 0.25 dB 0.90 dB
> 13.2 to 19.2 GHz 0.50 dB 0.90 dB
294 Chapter 18

80 MHz Bandwidth Digitizer - Option 122
Amplitude and Phase
> 19.2 to 26.5 GHz 0.80 dB 1.00 dB
For E4446A/48A
50 MHz to 3 GHz, 20 to 30 °C 0.75 dB 0.85 dB 0.35 dB 0.35 dB
50 MHz to 3 GHz, 0 to 55 °C 0.90 dB 1.00 dB
Preselector is Offg
3.0 to 6.6 GHz 0.85 dB 2.30 dB
> 6.6 to 13.2 GHz 1.15 dB 2.50 dB
> 13.2 to 19.2 GHz 1.00 dB 3.35 dB
> 19.2 to 26.5 GHz 1.70 dB 2.35 dB
> 26.5 to 31.15 GHz 0.95 dB (nominal)
1.50 dB (nominal)
> 31.15 to 41 GHz 1.00 dB (nominal)
1.50 dB (nominal)
> 41 to 50 GHz 2.30 dB (nominal)
a. Absolute Amplitude at CF = Absolute Amplitude at 50 MHz + Attenuation Switching + RF Frequency Response + IF Frequency Response.
b. Changes in the impedance seen by the 321.4 MHz Aux Output port on the rear panel can impact the amplitude accuracy of the PSA if the impedance on this port is changed, the user should perform an Align Now All to ensure the amplitude accuracy of the PSA.
c. Center of span, 10 dB input attenuation, flat top window.d. The wideband IF path uses the electromechanical attenuator. e. The effects of input Coupling are included within IF and RF Frequency Response.f. This “typical” is the performance observed at the worst center frequency and worst offset frequency
within the ranges shown in 80% of the instruments observed with 95% confidence. Agilent measures 100% of PSA analyzers for this performance in the factory production process. These performance results are not warranted.
g. When Preselector is On, Band 1 starts at 3.05 GHz. When Preselector is Off (Option 123 is installed and enabled), Band 1 starts at 3.0 GHz.
Description Specifications Supplemental Information
Chapter 18 295

80 MHz Bandwidth Digitizer - Option 122
Amplitude and Phase
Description Specifications Supplemental Information
IF Frequency Responsea Relative to center frequency
Freq (GHz)
Span Preselector Typical RMS
(nominal)b
For E4440A/43A/45A
3.0 30 MHz n/a 0.47 dB 0.13 dB 0.08 dB
3.0 to 3.05 30 MHz Onc 0.57 dB 0.28 dB 0.13 dB
> 3.0 to 3.05 30 MHz Off c 0.40 dB 0.16 dB 0.06 dB
3.0 60 MHz n/a 0.65 dB 0.30 dB 0.14 dB
3.0 to 3.05 60 MHz Onc 0.73 dB 0.30 dB 0.21 dB
> 3.0 to 3.05 60 MHz Off d 0.43 dB 0.17 dB 0.09 dB
< 0.10 80 MHz n/a 1.09 dB 0.50 dB 0.24 dB
0.10 to 3.00 80 MHz n/a 0.73 dB 0.30 dB 0.18 dB
> 3.0 to 3.05 80 MHz Onc 0.93 dB 0.40 dB 0.25 dB
> 3.0 to 3.05 80 MHz Off d 0.63 dB 0.19 dB 0.11 dB
> 3.05 to 6.6 30 MHz Onc 1.10 dB 0.41 dB
> 3.05 to 6.6 30 MHz Off d 0.40 dB 0.16 dB 0.06 dB
> 6.6 to 26.5 30 MHz Onc 1.30 dB 0.57 dB
> 6.6 to < 10 30 MHz Off d 0.58 dB 0.28 dB 0.11 dB
10 to 26.5 30 MHz Off d 0.56 dB 0.16 dB 0.06 dB
> 3.05 to 6.6 60 MHz Off d 0.43 dB 0.17 dB 0.09 dB
> 6.6 to 26.5 60 MHz Off d 0.96 dB 0.30 dB 0.13 dB
> 3.05 to 6.6 80 MHz Off d 0.63 dB 0.19 dB 0.11 dB
> 6.6 to 26.5 80 MHz Off d 1.13 dB 0.40 dB 0.15 dB
For E4446A/48A
3.0 30 MHz Offd 0.95 dB 0.45 dB 0.15 dB
3.0 60 MHz Offd 1.15 dB 0.60 dB 0.15 dB
296 Chapter 18

80 MHz Bandwidth Digitizer - Option 122
Amplitude and Phase
< 0.10 80 MHz Offd 1.05 dB 0.70 dB 0.15 dB
0.10 to 3.0 80 MHz Offd 1.60 dB 0.85 dB 0.20 dB
> 3.0 to 6.6 30 MHz Offd 0.40 dB 0.15 dB 0.05 dB
> 6.6 to 13.2 30 MHz Offd 0.70 dB 0.30 dB 0.05 dB
> 13.2 to 19.2 30 MHz Offd 0.45 dB 0.20 dB 0.05 dB
> 19.2 to 26.5 30 MHz Offd 0.70 dB 0.30 dB 0.10 dB
> 26.5 to 31.15 30 MHz Offd 0.65 dB 0.25 dB 0.05 dB
> 31.15 to 41 30 MHz Offd 0.70 dB 0.25 dB 0.05 dB
> 41 to 50 30 MHz Offd 1.20 dB 0.40 dB 0.10 dB
> 3.0 to 6.6 60 MHz Offd 0.80 dB 0.30 dB 0.10 dB
> 6.6 to 13.2 60 MHz Offd 1.35 dB 0.65 dB 0.15 dB
> 13.2 to 19.2 60 MHz Offd dB 0.35 dB 0.10 dB
> 19.2 to 26.5 60 MHz Offd 1.25 dB 0.50 dB 0.10 dB
> 26.5 to 31.15 60 MHz Offd 1.00 dB 0.40 dB 0.10 dB
> 31.15 to 41 60 MHz Offd 1.15 dB 0.40 dB 0.10 dB
> 41 to 50 60 MHz Offd 1.60 dB 0.55 dB 0.10 dB
> 3.0 to 6.6 80 MHz Offd dB 0.50 dB 0.15 dB
> 6.6 to 13.2 80 MHz Offd 1.85 dB 0.85 dB 0.20 dB
> 13.2 to 19.2 80 MHz Offd 0.80 dB 0.35 dB 0.10 dB
> 19.2 to 26.5 80 MHz Offd 1.65 dB 0.70 dB 0.15 dB
> 26.5 to 31.15 80 MHz Offd 1.20 dB 0.50 dB 0.10 dB
> 31.15 to 41 80 MHz Offd 1.35 dB 0.50 dB 0.10 dB
> 41 to 50 80 MHz Offd 2.30 dB 0.75 dB 0.15 dB
a. The effects of RF Coupling at low frequencies and the effects of low-pass filter roll-off above 3.05 GHz are both included within the IF Frequency Response.
b. The listed performance is the rms of the amplitude deviation from the center frequency amplitude, where the rms is computed over the range of offset frequencies and center frequencies shown.
c. With Preselector On, the IF frequency response performance is degraded at this frequency range. For better performance it is recommended to turn off the Preselector (Option 123 installed and enabled).
d. Option 123 is installed and enabled.
Description Specifications Supplemental Information
Chapter 18 297

80 MHz Bandwidth Digitizer - Option 122
Amplitude and Phase
Description Specification Supplemental Information
IF Phase Linearity
Relative to mean phase linearity
For E4440A/43A/45A
Freq(GHz)
Span (MHz)
Preselector Typicala RMS (nominal)b
3.0 30 n/a 1.2° 0.3°
< 0.3 60 n/a 3.2° 1.1°
0.3 to 3.0 60 n/a 2.5° 0.6 °
< 0.3 80 n/a 10.0° 2.3°
0.3 to 3.0 80 n/a 4.0° 0.9°
> 3.0 to 6.6 30 On 7.0° (nominal) 2.0°
> 6.6 to 20 30 On 10.0° (nominal) 2.1°
> 3.0 to 20 30 Offc 0.8° 0.2°
> 20 to 26.5 30 Offc ±0.8° (nominal) 0.2°
> 3.0 to 20 60 Off c 1.2° 0.3°
> 20 to 26.5 60 Off c 1.2° (nominal) 0.3°
> 3.0 to 20 80 Off c 2.5° 0.4°
> 20 to 26.5 80 Off c 2.5° (nominal) 0.4°
For E4446A/48A
3.0 30 Offc 2.8° 0.6°
< 0.3 60 Offc 6.3° 1.4°
0.3 to 3.0 60 Offc 5.7° 1.0°
< 0.3 80 Offc 12.0° 2.4°
0.3 to 3.0 80 Offc 10.7° 1.7°
> 3.0 to 20 30 Offc 2.5 ° 0.2°
> 20 to 26.5 30 Offc 2.0 °(nominal) 0.2°
> 26.5 to 31.15 30 Offc 1.4° (nominal) 0.2°
298 Chapter 18

80 MHz Bandwidth Digitizer - Option 122
Amplitude and Phase
> 31.15 to 41 30 Offc 2.1° (nominal) 0.2°
> 41 to 44 30 Offc 2.1° (nominal) 0.2°
> 3.0 to 20 60 Offc 4.4° 0.4°
> 20 to 26.5 60 Offc 3.2° (nominal) 0.6°
> 26.5 to 31.15 60 Offc 3.7° (nominal) 0.4°
> 31.15 to 41 60 Offc 3.1° (nominal) 0.3°
> 41 to 44 60 Offc 2.8° (nominal) 0.4 °
> 3.0 to 20 80 Offc 5.8° 0.5 °
> 20 to 26.5 80 Offc 5.8° (nominal) 0.7°
> 26.5 to 31.15 80 Offc 7.0° (nominal) 0.6°
> 31.15 to 41 80 Offc 6.3° (nominal) 0.5°
> 41 to 44 80 Offc 6.2° (nominal) 0.6°
a. This “typical” is the performance observed at the worst center frequency and worst offset frequency within the ranges shown in 80% of the instruments observed with 95% confidence. Agilent measures 100% of PSA analyzers for this performance in the factory production process. These performance results are not warranted.
b. The listed performance is the rms of the phase deviation relative to the mean phase deviation from a linear phase condition, where the rms is computed over the range of offset frequencies and center fre-quencies shown.
c. Option 123 is installed and enabled.
Description Specification Supplemental Information
Chapter 18 299

80 MHz Bandwidth Digitizer - Option 122
Amplitude and Phase
E4440A Nominal Phase Response
Opt. 122 alone
-5 -4 -3 -2 -1 0 1 2 3 4 5
-50 -40 -30 -20 -10 0 10 20 30 40 50
Ph Response (deg)
1001 1751
Center Freq (MHz)
Offset Freq (MHz)
E4440A Nominal Phase Response
-5 -4 -3 -2 -1 0 1 2 3 4 5
-50 -40 -30 -20 -10 0 10 20 30 40 50
Ph
Res
pons
e (d
eg)
1001 1751
Center Freq (MHz)
Offset Freq (MHz)
Option 122 Alone
-5 -4 -3 -2 -1 0 1 2 3 4 5
-50 -40 -30 -20 -10 0 10 20 30 40 50
Offset Freq (MHz)
Ph
Res
pons
e (d
eg)
1001 1751
Center Freq (MHz)
E4440A Nominal Phase Response Options 1DS and B7J Installed
E 4440A No m ina l P hase R esponse
(O ption 123)
-5 -4 -3 -2 -1 0 1 2 3 4 5
-50 -40 -30 -20 -10 0 10 20 30 40 50
O ffset F req (M Hz)
Ph
Re
spo
nse
(deg
)
5001 18001
C enter Freq (M H z)
300 Chapter 18
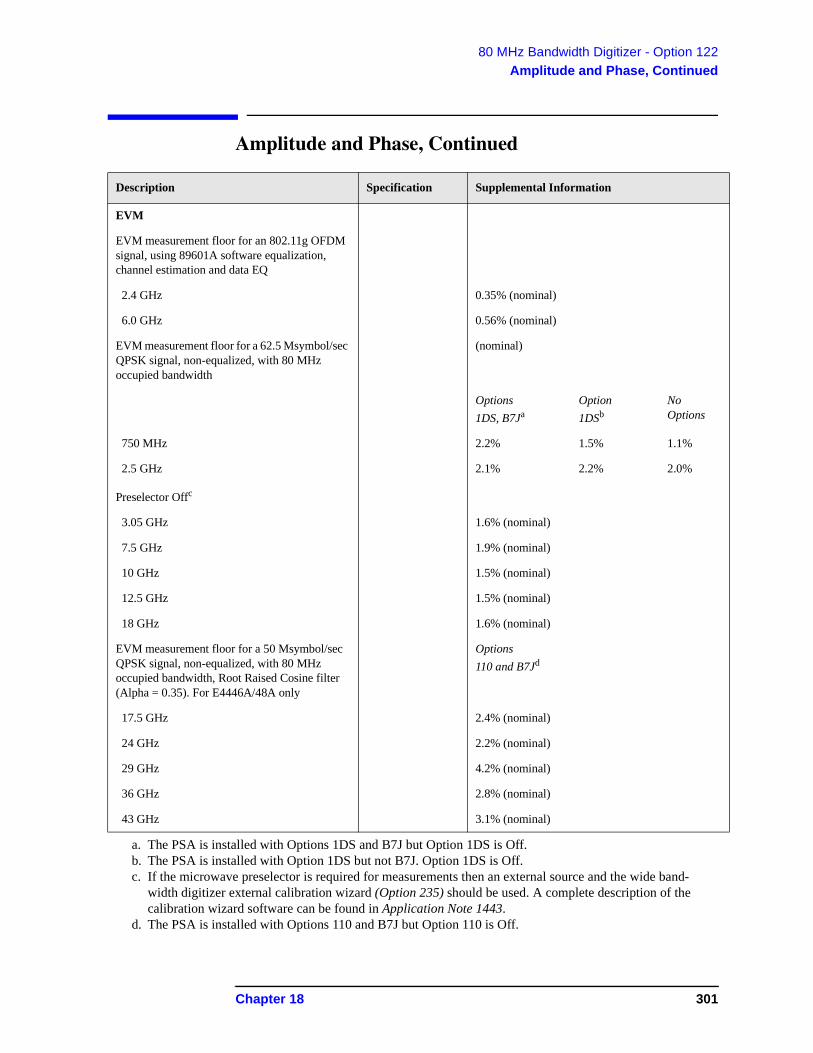
80 MHz Bandwidth Digitizer - Option 122
Amplitude and Phase, Continued
Amplitude and Phase, Continued
Description Specification Supplemental Information
EVM
EVM measurement floor for an 802.11g OFDM signal, using 89601A software equalization, channel estimation and data EQ
2.4 GHz 0.35% (nominal)
6.0 GHz 0.56% (nominal)
EVM measurement floor for a 62.5 Msymbol/sec QPSK signal, non-equalized, with 80 MHz occupied bandwidth
(nominal)
Options 1DS, B7Ja
a. The PSA is installed with Options 1DS and B7J but Option 1DS is Off.
Option1DSb
b. The PSA is installed with Option 1DS but not B7J. Option 1DS is Off.
No Options
750 MHz 2.2% 1.5% 1.1%
2.5 GHz 2.1% 2.2% 2.0%
Preselector Offc
c. If the microwave preselector is required for measurements then an external source and the wide band-width digitizer external calibration wizard (Option 235) should be used. A complete description of the calibration wizard software can be found in Application Note 1443.
3.05 GHz 1.6% (nominal)
7.5 GHz 1.9% (nominal)
10 GHz 1.5% (nominal)
12.5 GHz 1.5% (nominal)
18 GHz 1.6% (nominal)
EVM measurement floor for a 50 Msymbol/sec QPSK signal, non-equalized, with 80 MHz occupied bandwidth, Root Raised Cosine filter (Alpha = 0.35). For E4446A/48A only
Options 110 and B7Jd
d. The PSA is installed with Options 110 and B7J but Option 110 is Off.
17.5 GHz 2.4% (nominal)
24 GHz 2.2% (nominal)
29 GHz 4.2% (nominal)
36 GHz 2.8% (nominal)
43 GHz 3.1% (nominal)
Chapter 18 301

80 MHz Bandwidth Digitizer - Option 122
Dynamic Range
Dynamic Range
Description Specifications Supplemental Information
Third Order Intermodulation Distortion Two tones of equal magnitude, 0 dB IF Gain
Verified with 1 MHz separation
For E4440A/43A/45A
Freq Spana Tone Levelb
(GHz) (MHz) (dBfs) (dBm)
3.05 30 9 25 75 dBc 80 dBc (typical)
3.05 60 9 25 74 dBc 78 dBc (typical)
3.05 80 9 25 78 dBc (nominal)
3.05 30 6 22 72 dBc 77 dBc (typical; equivalent to +16.5 dBm TOI)
3.05 60 6 22 70 dBc 74 dBc (typical)
3.05 80 6 22 74 dBc (nominal)
Preselector On
> 3.05 30 6 22 68 dBc (nominal)
Preselector Offc
> 3.0 30 6 22 70 dBc (nominal)
For E4446A/ 48A
Freq Spana Tone Levelb
(GHz) (MHz) (dBfs) (dBm)
3.05 30 9 25 75 dBc 80 dBc (typical)
3.05 60 9 25 74 dBc 78 dBc (typical)
3.05 80 9 25 73dBc (nominal)
3.05 30 6 22 72 dBc 77dBc (typical; equivalent to + 16.5 dBm TOI)
3.05 60 6 22 68 dBc 74 dBc (typical)
3.05 80 6 22 76 dBc (nominal)
Preselector On
302 Chapter 18

80 MHz Bandwidth Digitizer - Option 122
Dynamic Range
> 3.05d 30 4 20 65 dBc (nominal)
Preselector Offc
> 3.0d 30 4 20 66 dBc (nominal)
Spurious (Input Related) Responses Includes: aliased harmonic distortion, second-order IF intermodulation products, images about the center frequency. Preselector On.
Excludes second harmonic of RF input; see “Second Harmonic Distortion” on page 74
For E4440A/43A/45A
Freq Span Level
(GHz) (MHz) (dBfs)
3.05 30 0 73 dBc 82 dBc (typical)
3.05 60 0 65 dBc 76 dBc (typical)
> 3.05 30 0 68 dBc (nominal)
For E4446A/48A
Freq Span Level
(GHz) (MHz) (dBfs)
3.05 30 0 64 dBc 74 dBc (typical)
3.05 60 0 54 dBc 65 dBc (typical)
> 3.05 30 0 62 dBc (nominal)
a. Specifications apply for the “best practices” case of using the central portion of the 36 and 80 MHz bandwidths. Noise and distortion performance degrade by about 4 dB at the edges of these bandwidths.
b. Tone level; at mixer = RF Input level minus attenuation.c. Option 123 is installed and enabled.d. Up to 33 GHz. Above 33 GHz, the noise floor dominates the dynamic range specs.
Description Specifications Supplemental Information
Chapter 18 303

80 MHz Bandwidth Digitizer - Option 122
Dynamic Range
Description Specifications Supplemental Information
Input Noise Density Excluding residuals;
Freq(GHz)
Span(MHz)
IF Gain(dB)
Preselector On, unless otherwise stated.
For E4440A/43A/45A Non-option 123
3.05 30 12 136 dBfs/Hz 140 dBfs/Hza (nominal)
3.05 60 12 133 dBfs/Hz
3.05 30 0 130 dBfs/Hz 134 dBfs/Hz (typical)
3.05 30 0 130 dBfs/Hz 137 dBfs/Hz @ 1 GHz (typical)
3.05 60 0 130 dBfs/Hz
3.0 to 6.6b 30 0 130 dBfs/Hz 133 dBfs/Hz (typical)
For E4440A/43A/45A (Opt 110 preamp installed but Off)
Non-option 123.
3.05 30 12 135 dBfs/Hz 139 dBfs/Hza (nominal)
3.05 60 12 132 dBfs/Hz
3.05 30 0 129 dBfs/Hz 133 dBfs/Hz (typical)
3.05 30 0 129 dBfs/Hz 136 dBfs/Hz @ 1 GHz (typical)
3.05 60 0 129 dBfs/Hz
3.0 to 6.6b 30 0 128 dBfs/Hz 131 dBfs/Hz (typical)
The following are nominal:
Preselector On Preselector Offb
Freq (GHz) 30 MHz Span 60 MHz Span
3.05 to 6.6 135 dBfs/Hz 135 dBfs/Hz
> 6.6 to 13.2 132 dBfs/Hz 128 dBfs/Hz
> 13.2 to 19.2 132 dBfs/Hz 123 dBfs/Hz
> 19.2 to 26.5 128 dBfs/Hz 116 dBfs/Hz
For E4446A/48A
3.05 30 12 133 dBfs/Hz 138 dBfs/Hza (nominal)
3.05 60 12 130 dBfs/Hz 138 dBfs/Hz (nominal)
3.05 30 0 127 dBfs/Hz 132 dBfs/Hz (typical)
304 Chapter 18

80 MHz Bandwidth Digitizer - Option 122
Dynamic Range
3.05 60 0 127 dBfs/Hz 137 dBfs/Hz (nominal)
3.0 to 6.6b 30 0 125 dBfs/Hz 128 dBfs/Hz (typical)
The following are nominal:
Preselector Offb
Freq(GHz)
60 MHz Span
3.0 to 6.6 127 dBfs/Hz
> 6.6 to 13.2 127 dBfs/Hz
> 13.2 to 19.2 123 dBfs/Hz
> 19.2 to 26.5 116 dBfs/Hz
> 26.5 to 31.15 116 dBfs/Hz
> 31.15 to 41 109 dBfs/Hz
> 41 to 50 101 dBfs/Hz
a. Specifications apply for the “best practices” case of using the central portion of the 36 and 80 MHz bandwidths. Noise and distortion performance degrade by about 4 dB at the edges of these bandwidths.
b. Preselector is Off (Option 123 is installed and enabled).
Description Specifications Supplemental Information
Chapter 18 305

80 MHz Bandwidth Digitizer - Option 122
Dynamic Range
Description Specifications Supplemental Information
Input Sensitivity (Noise level)
Input terminated, log averaging,0 dB input attenuation, freq 3.05GHz, maximum IF gain. Preselector On.
Excluding residuals.
For E4440A/43A/45A (Opt 1DS preamp installed but Off)
152 dBma b
a. This sensitivity is specified in a 1 Hz RBW, averaged on a log scale, much as is the Displayed Average Noise Level in chapter 1. The sensitivity in terms of noise density is 2.25 dB worse.
b. Specifications apply for the “best practices” case of using the central portion of the 36 and 80 MHz bandwidths. Noise and distortion performance degrade by about 4 dB at the edges of these bandwidths.
For E4440A/43A/45A (Opt 110 preamp installed but Off)
151 dBma b
For E4446A/48A (Opt 1DS or 110 preamp installed but Off)
-149 dBma b
Description Specification Supplemental Information
Residual Responses Input terminated, 0 dB RF attenuation
Verified with IF Gain = 6 dB
For E4440A/43A/45A
Relative to Full-Scalea
Center Freq. Span
3.0 GHz, 80 MHz 90 dBfs
>3.05 GHz and <6.6 GHz
30 MHz 85 dBfs Preselector On
>3.0 GHz and <6.6 GHz
80 MHz 75 dBfs (nominal, preselector
offb)
For E4446A/48A
Relative to Full-Scalea
Center Freq. Span
3.0 GHz, 80 MHz 90 dBfs
> 3.05 GHz and < 6.6 GHz
30 MHz –85 dBfs Preselector On
306 Chapter 18

80 MHz Bandwidth Digitizer - Option 122
Dynamic Range
> 3.0 GHz and < 6.6 GHz
30 MHz 80 dBfs (nominal, preselector
offb)
> 3.0 GHz and < 6.6 GHz
80 MHz 72 dBfs (nominal, preselector
offb)
Frequency Stability Noise Sidebands
Center Frequency = 1 GHz, IF Gain = 12 dB
For E4440A/43A/45A
Offset Frequency
100 Hz 91 dBc/Hz (nominal)
1 kHz 100 dBc/Hz (nominal)
10 kHz 106 dBc/Hz
100 kHz 119 dBc/Hz
1 MHzc dBc/Hz
For E4446A/48A
Offset Frequency
100 Hz 91 dBc/Hz (nominal)
1 kHz 100 dBc/Hz (nominal)
10 kHz 103 dBc/Hz
100 kHz 116 dBc/Hz
1 MHz c –135 dBc/Hz
a. The full scale level increases proportionally to input attenuation and decreases proportionally to IF gain. Full scale level (dBm) = 16 dBm +RF attenuation IF gain where RF attenuation = 0, 2, 4, …. 70 dB and IF gain = 12 to +12 dB.
b. Option 123 is installed and enabled.c. The noise specified at this offset includes both contributors: the phase noise of the LO and the relative
level of broadband input noise, with minimum IF gain and a signal at full scale, approximately - 4 dBm at the input mixer.
Description Specification Supplemental Information
Chapter 18 307

80 MHz Bandwidth Digitizer - Option 122
Data Acquisition
Data Acquisition
Description Specifications Supplemental Information
Time Record Length Spectrum Measurement
Waveform Measurement
32 to 180,000 samples
32 to 106 samples (nominal)
Deep Time Capture Analysis BW > 20 MHz
1.2 108 samples
Analysis BW 20 MHz 6 107 samples
ADC Resolution 14 Bits
308 Chapter 18

80 MHz Bandwidth Digitizer - Option 122
Wideband IF Triggering
Wideband IF Triggering
Description Specification Supplemental Information
Trigger Types Free Run (immediate), Video (IF envelope), External Front, External Rear, Frame (periodic)
Frame (periodic) Trigger Period
Range
Resolution
Offset Delay
Range
Resolution
Repeatability (when synchronized to an external source)
0 to > 500 ms
1 ns
0 to 10 s
10 ns
10 ps jitter (nominal )
External Trigger Trigger Delay
Range
Resolution
Repeatability
Spectrum Mode (any span)
Waveform
Analysis BW 6.25 MHz
Analysis BW < 6.25 MHz
Slope control, Input Impedance, Level Accuracy
100 ms to +500 ms
10 ns
See Chapter 1
1.5 ns (nominal )
1.5 ns (nominal )
25 ns (nominal )
Video (IF Envelope) Trigger Trigger Delay
Range
Resolution
Amplitude Range
0 to 500 ms
1 s
0 to 80 dBfs
Usable range limited by noise
Chapter 18 309

80 MHz Bandwidth Digitizer - Option 122
Wideband IF Triggering
Description Specification Supplemental Information
Trigger Hold off Range
Resolution
0 to 500 ms
10 ns
Auto Trigger Time Interval Range
1 ms to 10 s
Time Averaging Maximum block size for frame- triggered averaging
Maximum number of averages
16384 samples
> 500,000
Analysis BW 20 MHz
310 Chapter 18

19 External Calibration Using Wide Bandwidth Digitizer Characteristics
This chapter contains characteristics for the PSA series, Option 235, Wide Bandwidth Digitizer External Calibration (Wide Bandwidth Digitizer External Calibration Wizard). Option 235 requires that Option 122 (80 MHz bandwidth digitizer) or Option 140 (40 MHz bandwidth digitizer) be installed.
311
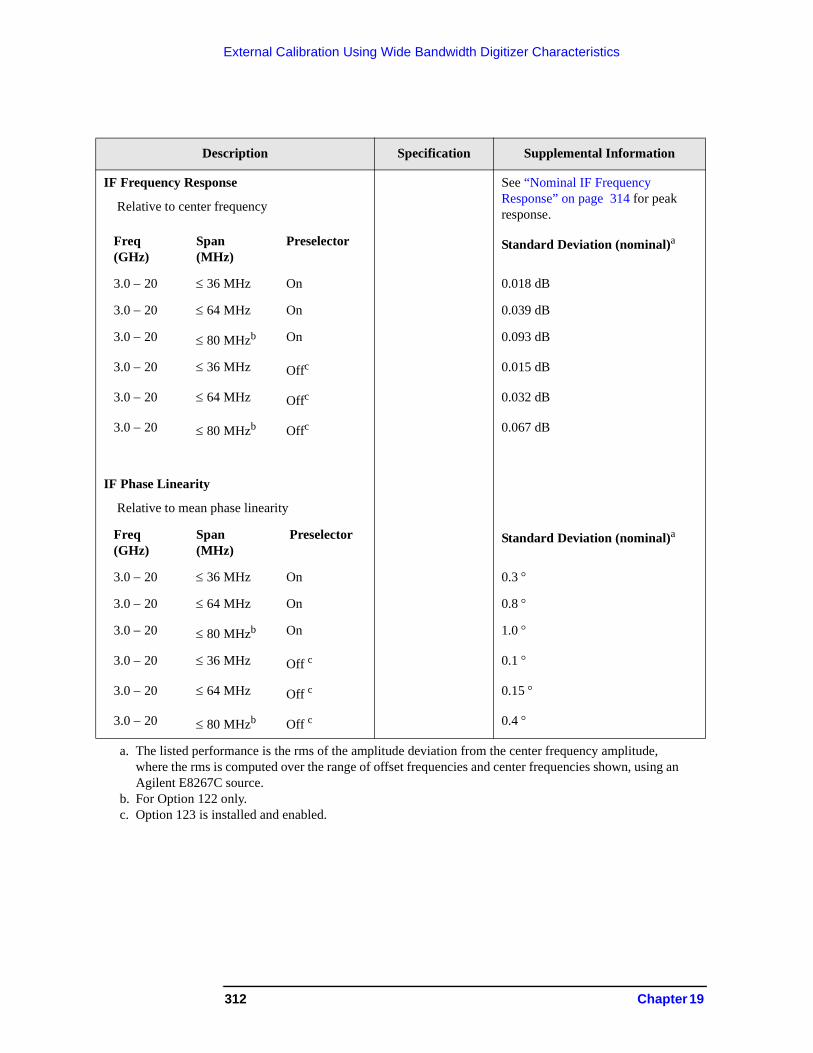
External Calibration Using Wide Bandwidth Digitizer Characteristics
Description Specification Supplemental Information
IF Frequency Response
Relative to center frequency
See “Nominal IF Frequency Response” on page 314 for peak response.
Freq (GHz)
Span(MHz)
Preselector Standard Deviation (nominal)a
a. The listed performance is the rms of the amplitude deviation from the center frequency amplitude, where the rms is computed over the range of offset frequencies and center frequencies shown, using an Agilent E8267C source.
3.0 20 36 MHz On 0.018 dB
3.0 20 64 MHz On 0.039 dB
3.0 20 80 MHzb
b. For Option 122 only.
On 0.093 dB
3.0 20 36 MHz Offc 0.015 dB
3.0 20 64 MHz Offc 0.032 dB
3.0 20 80 MHzb Offc 0.067 dB
IF Phase Linearity
Relative to mean phase linearity
Freq (GHz)
Span(MHz)
Preselector Standard Deviation (nominal)a
3.0 20 36 MHz On 0.3
3.0 20 64 MHz On 0.8
3.0 20 80 MHzb On 1.0
3.0 20 36 MHz Off c
c. Option 123 is installed and enabled.
0.1
3.0 20 64 MHz Off c 0.15
3.0 20 80 MHzb Off c 0.4
312 Chapter 19

External Calibration Using Wide Bandwidth Digitizer Characteristics
Description Specification Supplemental Information
EVM
EVM measurement floor for an 802.11g OFDM signal, using 89600A software equalization, channel estimation and data EQ
2.4 GHz 0.35 % (nominal)
6.0 GHz 0.56 % (nominal)
EVM measurement floor for an 62.5 Msymbol/sec QPSK signal at 18.5 GHz. Adaptive Equalizer off.
1.50 %
Chapter 19 313

External Calibration Using Wide Bandwidth Digitizer Characteristics
Nominal IF Frequency Response
Maximum positive and negative deviation (dB) from center across the indicated span versus center frequency (GHz) of a representative PSA using an Agilent E8267C source
Span = 80 MHz
Preselector Off a
a. Option 123 is required.
Span = 64 MHz
Preselector Off a
Span = 80 MHz
Preselector On
Span = 64 MHz
Preselector On
-0.4
-0.2
0.0
0.2
0.4
3 5 7 9 11 13 15 17 19
-0.4
-0.2
0.0
0.2
0.4
3 5 7 9 11 13 15 17 19
-0.4
-0.2
0.0
0.2
0.4
3 5 7 9 11 13 15 17 19
-0.4
-0.2
0.0
0.2
0.4
3 8 13 18
314 Chapter 19

20 Switchable MW Preselector Bypass Specifications
This chapter contains specifications for the PSA series, Option 123, Switchable Microwave (MW) Preselector Bypass. When the preselector is bypassed, many performance characteristics of the analyzer are improved: >3.05 GHz amplitude accuracy, and wideband IF amplitude and phase flatness. The primary performance degradation is that images are no longer filtered.
315

Switchable MW Preselector Bypass Specifications
Applicability of Specifications for this option
Applicability of Specifications for this option
When the Preselector Bypass option is installed and enabled, some aspects of the analyzer performance changes. This chapter shows some of those changes. The remaining changes are documented in other chapters.
Specifications in other chapters
In Chapter 18 , “80 MHz Bandwidth Digitizer - Option 122,” the following specifications are affected when Option 123 is on (preselector bypassed):
• Frequency Span for Center Frequency > 3.05 GHz
• RF Frequency Response from 3.05 to 50 GHz
• IF Frequency Response
• IF Phase Linearity
• Third Order Intermodulation Distortion, Freq > 3.05 GHz
316 Chapter 20

Switchable MW Preselector Bypass Specifications
Option 123, Switchable MW Preselector Bypass
Option 123, Switchable MW Preselector Bypass
Frequency
Image Responses
Description Specifications Supplemental Information
Frequency Range
E4440AE4443AE4445AE4446AE4447AE4448A
3.05 to 26.5 GHz3.05 to 6.7 GHz3.05 to 13.2 GHz3.05 to 44 GHz3.05 to 42.98 GHz3.05 to 50 GHz
Description Specifications Supplemental Information
Image Responses
Spacing Wide IF Path (Option 122) Span 36 MHz Span > 36 MHz Narrow IF PathRelative Level
600.0 MHz644.0 MHz642.8 MHz
0 dBc (nominal)
Chapter 20 317

Switchable MW Preselector Bypass Specifications
Amplitude
Amplitude
E4443A, E4445A, E4440A
Description SpecificationsSupplemental Information
Displayed Average Noise Level (DANL)
Input terminated Sample or Average detector Averaging type = Log Normalized to 0 dB input attenuation, 1 Hz RBW
20 to 30 °C 0 to 55 °C Typical
Preamp (Option 110) Off or Not Installed
>3.05 to 6.6 GHz 150 dBm 153 dBm
6.6 to 13.2 GHz 142 dBm 146 dBm
13.2 to 19.2 GHz 137 dBm 140 dBm
19.2 to 26.5 GHz 131 dBm 134 dBm
Preamp Off (Option 110 installed) Typical
>3.05 to 6.6 GHz 148 dBm 147 dBm 151 dBm
6.6 to 13.2 GHz 140 dBm 139 dBm 143 dBm
13.2 to 16 GHz 136 dBm 135 dBm 140 dBm
16 to 19.2 GHz 136 dBm 135 dBm 139 dBm
19.2 to 26.5 GHz 129 dBm 128 dBm 130 dBm
Preamp On (Option 110) Typical
>3.05 to 6.6 GHz 161 dBm 159 dBm 162 dBm
6.6 to 13.2 GHz 152 dBm 150 dBm 155 dBm
13.2 to 16 GHz 149 dBm 146 dBm 150 dBm
16 to 19.2 GHz 146 dBm 142dBm 147 dBm
19.2 to 26.5 GHz 138 dBm 135 dBm 140 dBm
318 Chapter 20

Switchable MW Preselector Bypass Specifications
Amplitude
Description Specifications Supplemental Information
Frequency Response 10 dB input attenuation
Maximum error relative toreference condition (50 MHz)
20 to 30 C
0 to 55 C
Typical (at worst observed frequency)
>3.05 to 6.6 GHz 0.9 dB 1.5 dB 0.25 dB
6.6 to 13.2 GHz 1.0 dB 2.0 dB 0.4 dB
13.2 to 19.2 GHz 1.3 dB 2.0 dB 0.5 dB
19.2 to 26.5 GHz 2.3 dB 3.0 dB 0.9 dB
Additional frequency response error, FFT mode
See chapter 1, Amplitude Section, Frequency Response
Preamp On (Option 110)
0 dB input attenuation
Nominal
>3.05 to 6.6 GHz 1.0 dB
6.6 to 13.2 GHz 1.0 dB
13.2 to 19.2 GHz 1.0 dB
19.2 to 26.5 GHz 1.5 dB
Chapter 20 319

Switchable MW Preselector Bypass Specifications
Amplitude
E4447A, E4446A, E4448A
Description SpecificationsSupplemental Information
Displayed Average Noise Level (DANL)
Input terminated Sample or Average detector Averaging type = Log Normalized to 0 dB input attenuation, 1 Hz RBW
Typical
20 to 30 °C 0 to 55 °C
Preamp (Option 110) Off or Not Installed
>3.05 to 6.6 GHz 145 dBm 144 dBm 147 dBm
6.6 to 13.2 GHz 145 dBm 144 dBm 149 dBm
13.2 to 19 GHz 145 dBm 144 dBm 148 dBm
19 to 22.5 GHz 136 dBm 135 dBm 142 dBm
22.5 to 26.8 GHz 133 dBm 132 dBm 137 dBm
26.8 to 31.15 GHz 136 dBm 134 dBm 139 dBm
31.15 to 35 GHz 126 dBm 125 dBm 131 dBm
35 to 38 GHz 126 dBm 125 dBm 131 dBm
38 to 41 GHz 126 dBm 125 dBm 131 dBm
41 to 44 GHz 119 dBm 117 dBm 123 dBm
44 to 45 GHz 119 dBm 117 dBm 123 dBm
45 to 49 GHz 113 dBm 110 dBm 117 dBm
49 to 50 GHz 113 dBm 110 dBm 117 dBm
Preamp On (Option 110) 20 to 30 °C 0 to 55 °C
>3.05 to 6.6 GHz 159 dBm 157 dBm 162 dBm
6.6 to 13.2 GHz 157 dBm 155 dBm 160 dBm
13.2 to 19 GHz 155 dBm 153 dBm 158 dBm
19 to 22.5 GHz 146 dBm 144 dBm 150 dBm
22.5 to 26.8 GHz 142 dBm 140 dBm 145 dBm
26.8 to 31.15 GHz 141 dBm 140 dBm 142 dBm
31.15 to 35 GHz 132 dBm 130 dBm 133 dBm
320 Chapter 20

Switchable MW Preselector Bypass Specifications
Amplitude
35 to 38 GHz 132 dBm 130 dBm 133 dBm
38 to 41 GHz 132 dBm 130 dBm 133 dBm
41 to 44 GHz 123 dBm 120 dBm 127 dBm
44 to 45 GHz 123 dBm 120 dBm 127 dBm
45 to 49 GHz 112 dBm 110 dBm 118 dBm
49 to 50 GHz 112 dBm 110 dBm 118 dBm
Description Specifications Supplemental Information
Frequency Response 10 dB input attenuation
Maximum error relative toreference condition (50 MHz)
20 to 30 C
0 to 55 C
Typical (at worst observed frequency)
>3.05 to 6.6 GHz 1.0 dB 2.0 dB 0.5 dB
6.6 to 13.2 GHz 1.0 dB 3.0 dB 0.5 dB
13.2 to 19.2 GHz 1.3 dB 3.0 dB 0.5 dB
19.2 to 26.8 GHz 1.5 dB 3.0 dB 0.6 dB
26.8 to 31.15 GHz 1.5 dB 3.5 dB 0.6 dB
31.15 to 41 GHz 1.5 dB 3.0 dB 0.7 dB
41 to 50 GHz 2.5 dB 4.5 dB 1.0 dB
Additional frequency response error, FFT mode
See “Frequency Response” on page 56
Description SpecificationsSupplemental Information
Chapter 20 321

Switchable MW Preselector Bypass Specifications
Amplitude
Preamp On (Option 110)
0 dB input attenuation
Nominal
>3.05 to 6.6 GHz 2.0 dB
6.6 to 13.2 GHz 1.5 dB
13.2 to 19.2 GHz 1.5 dB
19.2 to 26.8 GHz 2.0 dB
26.8 to 31.15 GHz 2.0 dB
31.15 to 41 GHz 2.0 dB
41 to 50 GHz 2.0 dB
Description Specifications Supplemental Information
322 Chapter 20

Switchable MW Preselector Bypass Specifications
Dynamic Range
Dynamic Range
First LO Emission Level
E4443A, E4445A, E4440A
E4447A, E4446A, E4448A
Description Specifications Supplemental Information
Second Harmonic Distortion Intercept
Source Freq = 1.5 to 13.25 GHz +30 dBm (nominal)
Third OrderIntermodulation Distortion
Intercept
3.05 to 6.6 GHz +23 dBm (nominal)
6.6 to 7.7 GHz +16 dBm (nominal)
7.7 to 21.5 GHz +20 dBm (nominal)
21.5 to 26.5 GHz +23 dBm (nominal)
1 dB Gain Compression Point(Two-tone)
Power at mixera
a. Mixer level = Input Level Input Attenuation
3.05 to 26.5 GHz +8 dBm (nominal)
Description Specifications Supplemental Information
First LO Emission Level w/Preselector bypassed
(–27 dBm – input attenuation) (nominal) FEmission = Center frequency + 321.4 MHz
Description Specifications Supplemental Information
First LO Emission Level w/Preselector bypassed
(–3 dBm – input attenuation) (nominal)FEmission = Center frequency + 321.4 MHz
Chapter 20 323

Switchable MW Preselector Bypass Specifications
Dynamic Range
324 Chapter 20
21 Y-axis Video Output - Option 124
This chapter contains specifications for the PSA Series, Option 124, Y-Axis Video Output.
325

Y-axis Video Output - Option 124
Applicability of Specification for this Option
Applicability of Specification for this Option
When the Y-axis Video Output option is installed and enabled, it does not affect any other specifications.
Operating Conditions
Description Specifications Supplemental Information
Operating Conditions
Display Scale Types All (Log and Lin) "Lin" is linear in voltage
Log Scales All (0.1 to 20 dB/div)
Modes Spectrum Analyzer only
FFT & Sweep FFTs may not be on. Select swept mode zero span
Gating Gating must be off
Option 122 80 MHz Bandwidth Digitizer
Option 122 must be absent or disabled by setting the IF Path to Narrow
326 Chapter 21

Y-axis Video Output - Option 124
Output Signal
Output Signal
Description Specifications Supplemental Information
Output Signal
Replication of the RF Input Signal envelope, as scaled by the display settings
Differences between display effects and video output
Detectors other than Average The output signal represents the input envelope excluding display detection
Average Detector The effect of average detection in smoothing the displayed trace is approximated by the application of a low-pass filter
Nominal bandwidth:
Trace Averaging Trace averaging affects the displayed signal but does not affect the video output
SweepTime
NpointsLPFBW
1
Chapter 21 327

Y-axis Video Output - Option 124
Amplitude
Amplitude
Description Specifications Supplemental Information
Amplitude Range
Minimum
Maximum
Overrange
Bottom of screen
Top of Screen + Overrange
Range of represented signals
Smaller of 2 dB or 1 division, (nominal)
Output Scalinga
a. The errors in the output can be described as offset and gain errors. An offset error is a constant error, expressed as a fraction of the full-scale output voltage. The gain error is proportional to the output volt-age. Here’s an example. The reference level is 10 dBm, the scale is log, and the scale is 5 dB/division. Therefore, the top of the display is 10 dBm, and the bottom is 60 dBm. Ideally, a 60 dBm signal gives 0 V at the output, and 10 dBm at the input gives 1 V at the output. The maximum error with a 60 dBm input signal is the offset error, 1 % of full scale, or 10 mV; the gain accuracy does not apply because the output is nominally at 0 V. If the input signal is 20 dBm, the nominal output is 0.8 V. In this case, there is an offset error (10 mV) plus a gain error (1 % of 0.8 V, or 8 mV), for a total error of 18 mV.
0 to 1.0 V open circuit, representing bottom to top of screen
Offset 1 % of full scale (nominal)
Gain accuracy 1 % of output voltage (nominal)
Output Impedance 140 (nominal)
328 Chapter 21

Y-axis Video Output - Option 124
Delay
Delay
Description Specifications Supplemental Information
Delay from signal at RF Input to Video Output
1.67 s + 2.56/RBW + 0.159/VBW(nominal)
Chapter 21 329

Y-axis Video Output - Option 124
Continuity and Compatibility
Continuity and Compatibility
Description Specifications Supplemental Information
Output Tracks Video Level
During sweep yes Except band breaks in swept spans
Between sweeps See supplemental information
Before sweep interruption a Alignments bQuick cals c d
a. There is an interruption in the tracking of the video output before each sweep. During this interruption, the video output holds instead of tracks for a time period given by approximately 1.8/RBW.
b. There is an interruption in the tracking of the video output during alignments. During this interruption, the video output holds instead of tracking the envelope of the RF input signal. Alignments may be set to Off or Alert to prevent their interrupting video output tracking.
c. Frequent “quick cals” can also set the video output to hold between sweeps. These alignments are brief but are not disabled by turning Alignments to Off or Alert.
d. If video output interruptions for “quick cals” are unacceptable, setting the analyzer to External Trigger without a trigger present can prevent these from occurring, but will prevent there being any on-screen updating. Video output is always active even if the analyzer is not sweeping.
External trigger, no trigger d Yes
HP 8566/7/8 Compatibility Recorder output labeled “Video”
Continuous output Alignment differencese
e. The HP 8566 family did not have alignments and interruptions that interrupted video outputs, as dis-cussed above.
Output impedance Two variantsf
f. Early HP 8566-family spectrum analyzers had a 140 output impedance; later ones had 190 .
Gain calibration LL and UR not supportedg
g. The HP 8566 family had LL (lower left) and UR (upper right) controls that could be used to calibrate the levels from the video output circuit. These controls are not available in Option 124.
RF Signal to Video Output Delay See footnoteh
h. The delay between the RF input and video output shown above is much higher than the delay in the HP 8566 family spectrum analyzers. The latter has a delay of approximately 0.554/RBW + 0.159/VBW.
330 Chapter 21

22 W-LAN Measurement Personality
This chapter contains specifications for the PSA series, Option 217, WLAN measurement personality.
331

W-LAN Measurement Personality
OFDM Analysis (802.11a, 802.11g OFDM)
OFDM Analysis (802.11a, 802.11g OFDM)
Frequency
Amplitude
Description Specification Supplemental Information
Frequency Range
E4443A
E4445A
E4440A
36 MHz to 6.7 GHz
36 MHz to 13.2 GHz
36 MHz to 26.5 GHz
E4446A
E4448A
36 MHz to 44 GHz
36 MHz to 50 GHz
Frequency Span (analysis bandwidth)
with Option 122 10 Hz to 80 MHz
with Option 140 10 Hz to 40 MHz
Frequency Setting Methods
Center frequency
Channel number
Description Specification Supplemental Information
Amplitude Range
E4443A, E4445A, E4440A E4446A, E4448A
50 dBm to +11 dBm (nominal)
(depends on input attenuation and IF gain settings)
332 Chapter 22

W-LAN Measurement Personality
Signal Acquisition
Signal Acquisition
Description Specification Supplemental Information
Supported Standards 802.11a, 802.11g OFDM
Modulation Formats BPSK, QPSK, 16QAM, 64QAM (auto detect or manual override)
Capture length (20 MHz span) 5.12 seconds
Result length auto detect or adjustable
Triggering free-run/video/external frame Single or continuous
Measurement region Length and offset adjustable within result length
Chapter 22 333

W-LAN Measurement Personality
Display Formats
Display Formats
Description Specification Supplemental Information
Demodulation results
I/Q constellation
Error vector Time, spectrum
RMS Error vector Time, spectrum
Numeric Results
Transmit power Average, peak
EVM Average, max
IQ offset
Gain imbalance
Quadrature error
Center frequency error
Symbol clock error
Demod bits
Spectrum
Spectrum emission mask
Spectrum flatness
Spectrum FFT
CCDF
Graph
Average power
Peak power
334 Chapter 22

W-LAN Measurement Personality
Adjustable Parameters
Adjustable Parameters
Description SpecificationSupplemental Information
Data Format 802.11a, 802.11g OFDM
Single Button Presets 802.11a,
802.11g ERP-OFDM,
802.11g DSSS-OFDM
Sub-carrier spacing 312.5 kHz User settable
Pilot tracking Phase, amplitude, timing
Equalizer training channel estimation sequence, channel estimation sequence and data
Chapter 22 335

W-LAN Measurement Personality
Accuracy
Accuracy
Description Specification Supplemental Information
Absolute Amplitude Accuracy 20 to 30 °C Typical unless otherwise stated.
WLAN measurement personality mode
Center frequency = 2.442 GHz (For E4443A/45A/40A)
1.48 dB 0.74 dB (span = 40 MHz)
Center frequency = 2.442 GHz (For E4446A/48A)
2.52 dB 1.27 dB (span = 40 MHz)
Center frequency = 5.240 GHz (For E4443A/45A/40A)
1.78 dB 0.71 dB (span = 40 MHz,
preselector off)a
a. Option 123 is installed and enabled.
Center frequency = 5.240 GHz (For E4446A/48A)
1.41 dB (span = 40 MHz,
preselector off)a
Spectrum analysis mode
Center frequency = 2.442 GHz (For E4443A/45A/40A)
0.86 dB 0.17 dB
Center frequency = 2.442 GHz (For E4446A/48A)
0.98 dB 0.21 dB
Center frequency = 5.240 GHz (For E4443A/45A/40A)
1.19 dB 0.26 dB (preselector off)a
Center frequency = 5.240 GHz (For E4446A/48A)
2.28 dB 0.56 dB ( preselector off)a
Relative power accuracy (For E4443A/45A/40A) 0.30 dB
Relative power accuracy (For E4446A/48A) 0.30 dB (nominal)
Description Specification Supplemental Information
Modulation Accuracy
Residual EVM (20 averages)
802.11g signal, 54 Mbps data rate, payload data = PN9 sequence
Equalizer training = channel estimation sequence and data
<48 dB (0.40 %) (nominal)
336 Chapter 22

W-LAN Measurement Personality
Accuracy
Equalizer training = channel estimation sequence
<45 dB (0.56 %) (nominal)
Spectral flatness uncertainty 0.75 dB (nominal)
Center frequency leakage <48 dB (nominal)
Frequency lock range 625kHz (2 sub-carrier spacing, nominal)
Frequency Accuracy Transmit center frequency accuracy
5 Hz (nominal)
Symbol clock frequency readout error < 0.9 ppm (nominal)
Description Specification Supplemental Information
Chapter 22 337

W-LAN Measurement Personality
DSSS/CCK/PBSS Analysis (802.11b, 802.11g)
DSSS/CCK/PBSS Analysis (802.11b, 802.11g)
Frequency
Amplitude
Description Specification Supplemental Information
Frequency Range
E4443A
E4445A
E4440A
36 MHz to 6.7 GHz
36 MHz to 13.2 GHz
36 MHz to 26.5 GHz
E4446A
E4448A
36 MHz to 44 GHz36 MHz to 50 GHz
Frequency Span (analysis bandwidth)
with Option 122 10 Hz to 80 MHz
with Option 140 10 Hz to 40 MHz
Frequency Setting Methods
Center frequency
Channel number
Description Specification Supplemental Information
Amplitude Range
E4443A, E4445A, E4440A, E4446A, E4448A
50 dBm to +11 dBm (nominal)
(depends on input attenuation and IF gain settings)
338 Chapter 22

W-LAN Measurement Personality
DSSS/CCK/PBSS Analysis (802.11b, 802.11g)
Signal Acquisition
Description SpecificationSupplemental Information
Supported Standards 802.11b, 802.11g DSSS/CCK/PBCC
Modulation Formats Barker1, Barker2, CCK5.5, CCK11, PBCC5.5, PBCC11, PBCC22, PBCC33
(auto detect or manual override)
Preamble Auto detect (short, long)
Capture Length (22 MHz span) 4.65 seconds
Result length auto detect or adjustable
Triggering free-run/video/external frame
Measurement region Length and offset adjustable within result length
Chapter 22 339

W-LAN Measurement Personality
DSSS/CCK/PBSS Analysis (802.11b, 802.11g)
Display Formats
Description Specification Supplemental Information
Demodulation Results
I/Q constellation
Error vector Time
Numeric Results
Transmit power Average, peak
EVM, 100-chip peak EVM Average, max
Magnitude error Average, max
Phase error Average, max
IQ offset
Gain imbalance
Quadrature error
Center frequency error
Chip clock error
Demod bits
Spectrum
Spectrum emission mask
Spectrum flatness
Power-on ramp time
Power-down ramp time
CCDF
340 Chapter 22

W-LAN Measurement Personality
DSSS/CCK/PBSS Analysis (802.11b, 802.11g)
Adjustable Parameters
Description SpecificationSupplemental Information
Data Format 802.11b including optional short preamble and optional PBCC modes, 802.11g including PBCC22 and PBCC33 modes
Single Button Presets 802.11b DSSS/CCK/PBCC,
802.11g ERP-DSSS/CCK,
802.11g ERP-PBCC
Tracking Phase
Equalizer On/Off
Equalizer Filter Length 3-99 chips
Descrambler Mode On/Off, preamble only, preamble, header only
Chapter 22 341

W-LAN Measurement Personality
DSSS/CCK/PBSS Analysis (802.11b, 802.11g)
Accuracy
Description Specification Supplemental Information
Absolute Amplitude Accuracy 20 to 30 °C Typical unless otherwise stated.
WLAN measurement personality mode Center frequency = 2.442 GHz (For E4443A/45A/40A)
1.48 dB
0.74 dB (span = 40 MHz)
Center frequency = 2.442 GHz (For E4446A/48A)
2.52 dB 1.27 dB (span = 40 MHz)
Spectrum analysis mode Center frequency = 2.442 GHz (For E4443A/45A/40A)
0.86 dB
0.17 dB
Center frequency = 2.442 GHz (For E4446A/48A)
0.98 dB 0.21 dB
Relative Power Accuracy (For E4443A/45A/40A) 0.30 dB
Relative Power Accuracy (For E4446A/48A) 0.30 dB (nominal)
Modulation Accuracy
Residual EVM (10 averages, ref filter = transmit filter)
Data rate = 11 Mbps, payload data = PN9 sequence
Equalizer on < 0.4 % (48 dB) (nominal)
Equalizer off < 1.0 % (40 dB) (nominal)
342 Chapter 22

W-LAN Measurement Personality
DSSS/CCK/PBSS Analysis (802.11b, 802.11g)
Description Specification Supplemental Information
Frequency Lock Range 2.5 MHz (nominal)
Frequency Accuracy Transmit Center Frequency Accuracy
5 Hz (nominal)
Chip clock frequency readout error < 6 % (nominal)
Transmit RF carrier suppression (center frequency leakage)
< 41 dB (nominal)
Transmit power up ramp time resolution error
< 1.6 µs (nominal)
Transmit power down ramp time resolution error
< 1.6 µs (nominal)
Chapter 22 343

W-LAN Measurement Personality
Conformance for 802.11a and 802.11g ERP-OFDM/DSSS-OFDM Standard
Conformance for 802.11a and 802.11g ERP-OFDM/DSSS-OFDM Standard
Section17.3.
Test NamePICS Item
Test LimitLink to Option
217 Specification
Specifi- cations
9.1 Transmit power
OF4.1 (OF4.1.1- OF4.1.3)
Center freq
5.155.25GHz5.255.35GHz5.7255.825 GHz
Maximum Tx power
40mW (2.5mW/MHz)200mW (12.5mW/MHz)800 mW (50 mW/MHz)
Amp accuracy Hard
9.2 Transmit spectrum mask
OF4.2 0 dBr < 18 MHz BW (9 M offset)
20 dBr at 11 M offset28 dBr at 20 M offset40 dBr at 30 M offsetNote: dBr (relative to max PSD of signal)
Dynamic range
Relative accuracy
Hard (or N/A)
9.3 Transmit spurious
OF4.3 Conformance to national regulations Not in option 217. Use Power Suite spurious function
N/A
9.4 Transmit center frequency tolerance
OF4.4 20 ppm for 802.11a
25 ppm for 802.11g
CF = 5.180GHz, 103.6 kHz (11a)
CF = 2.412GHz, 60.3 kHz (11g)
Freq error Nominal
9.5 Symbol clock frequency tolerance
OF4.5 20 ppm for 802.11a ( 5 kHz)
25 ppm for 802.11g ( 6.25 kHz)
Symbol rate = 250Msym/s
Symbol clock error Nominal
9.6.1 Transmit center frequency leakage
OF4.6.1 < 15 dB relative to overall Tx power IQ offset Nominal
344 Chapter 22

W-LAN Measurement Personality
Conformance for 802.11a and 802.11g ERP-OFDM/DSSS-OFDM Standard
9.6.2 Transmit spectral flatness
OF4.6.2 2 dB for 16 sub-carriers and within +2/4 dB for all sub-carriers.
Relative accuracy Nominal
9.6.3 Transmit constellation error (EVM)
OF4.6.3 - OF4.6.10
Data Rate (Mbps)69121824364854
RMS EVM (dB)58101316192225
Residual EVM
EVM accuracy
Nominal
Section17.3.
Test NamePICS Item
Test LimitLink to Option
217 Specification
Specifi- cations
Chapter 22 345

W-LAN Measurement Personality
Conformance for 802.11b and 802.11g ERP-DSSS/CCK/PBCC Standard
Conformance for 802.11b and 802.11g ERP-DSSS/CCK/PBCC Standard
Section18.4.
Test NamePICS Item
Test LimitLink to Option
217 Spec.Specifica-
tions
7.1 Transmit power
HRDS14 HRDS21
< 1000 mW Amp accuracy Hard
7.2 Transmit power control
HRDS14 HRDS21
Power control provided for Tx power > 100 mW
N/A N/A
7.3 Transmit spectrum mask
HRDS22 0 dBr < 22MHz BW ( 11M offset)
30 dBr from 11M to 22M offset
50 dBr at 22M offset
Note: dBr (relative to max PSD of signal)
Dynamic range
Relative accuracy
Hard (or N/A)
7.4 Transmit center frequency tolerance
HRDS23 25 ppm
CF = 2.412GHz, 60.3 kHz
Freq error Nominal
7.5 Chip clock frequency tolerance
HRDS24 25 ppm ( 275 Hz)
Chip rate = 11Mcps
Chip clock error Nominal
7.6 Transmit power-on and power-off ramp
HRDS25 HRDS26
Power-on ramp:
2 s for 10% to 90% of max power
Power-down ramp:
2 s for 90% to 10% of max power
Time resolution
Time accuracy
Nominal
7.6 RF carrier suppression
HRDS27 < 15 dB relative to peak PSD IQ offset Nominal
7.7 Transmit modulation accuracy
HRDS28 802.11b 1000-chip Peak EVM < 0.35
EVM (RMS) < 0.16
Residual EVM
EVM accuracy
Nominal
346 Chapter 22

23 External Source Control - Option 215
This chapter contains specifications for the PSA series, Option 215, External Source Control.
347
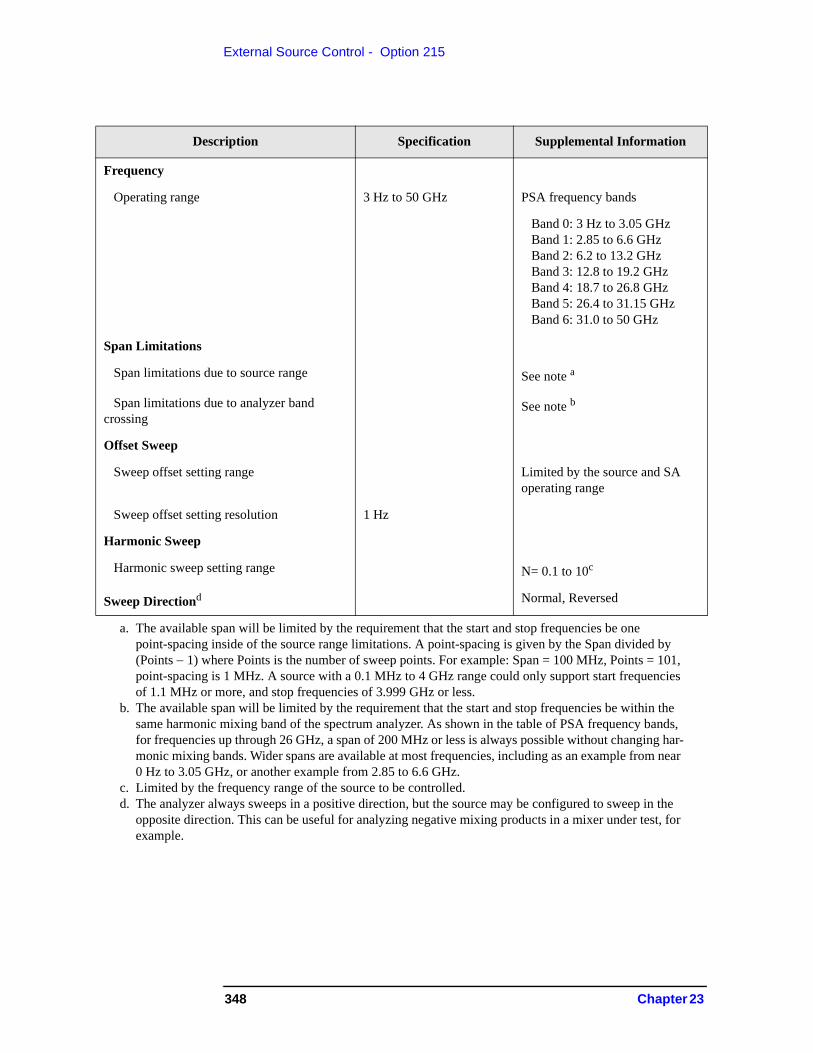
External Source Control - Option 215
Description Specification Supplemental Information
Frequency
Operating range 3 Hz to 50 GHz PSA frequency bands
Band 0: 3 Hz to 3.05 GHz Band 1: 2.85 to 6.6 GHz Band 2: 6.2 to 13.2 GHz Band 3: 12.8 to 19.2 GHz Band 4: 18.7 to 26.8 GHz Band 5: 26.4 to 31.15 GHz Band 6: 31.0 to 50 GHz
Span Limitations
Span limitations due to source range See note a
a. The available span will be limited by the requirement that the start and stop frequencies be one point-spacing inside of the source range limitations. A point-spacing is given by the Span divided by (Points 1) where Points is the number of sweep points. For example: Span = 100 MHz, Points = 101, point-spacing is 1 MHz. A source with a 0.1 MHz to 4 GHz range could only support start frequencies of 1.1 MHz or more, and stop frequencies of 3.999 GHz or less.
Span limitations due to analyzer band crossing
See note b
b. The available span will be limited by the requirement that the start and stop frequencies be within the same harmonic mixing band of the spectrum analyzer. As shown in the table of PSA frequency bands, for frequencies up through 26 GHz, a span of 200 MHz or less is always possible without changing har-monic mixing bands. Wider spans are available at most frequencies, including as an example from near 0 Hz to 3.05 GHz, or another example from 2.85 to 6.6 GHz.
Offset Sweep
Sweep offset setting range Limited by the source and SA operating range
Sweep offset setting resolution 1 Hz
Harmonic Sweep
Harmonic sweep setting range N= 0.1 to 10c
c. Limited by the frequency range of the source to be controlled.
Sweep Directiond
d. The analyzer always sweeps in a positive direction, but the source may be configured to sweep in the opposite direction. This can be useful for analyzing negative mixing products in a mixer under test, for example.
Normal, Reversed
348 Chapter 23

External Source Control - Option 215
Description Specification Supplemental Information
Dynamic Range
10 MHz to 3 GHz, Input terminated, sample detector, average type = log, 20 °C to 30 °C
Dynamic Range = 10 dBm
DANL 10log(RBW)a
a. The dynamic range is given by this computation: 10 dBm DANL 10log(RBW) where DANL is the displayed average noise level specification, normalized to 1 Hz RBW, and the RBW used in the measurement is in hertz units. The dynamic range can be increased by reducing the RBW at the expense of increased sweep time. The sweep time increase will be approximately 3.2 times Span divided by RBW2. The sweep time may not exceed 2000 s, which means the RBW cannot be less than the square root of span divided by 625 s.
PSA span PSA RBW
1 MHz 2 kHz 108.9 dB
10 MHz 6.8 kHz 103.6 dB
100 MHz 20 kHz 98.9 dB
1000 MHz 68 kHz 93.6 dB
Amplitude Accuracy Multiple contributors: bLinearity cSource and Analyzer Flatness dYTF Instability eVSWR effects f
b. The following footnotes discuss the biggest contributors to amplitude accuracy.c. One amplitude accuracy contributor is the linearity with which amplitude levels are detected by the
PSA. This is called "scale fidelity" by most spectrum analyzer users, and "dynamic amplitude accu-racy" by most network analyzer users. This small term is documented in the Amplitude section of the Specifications Guide. It is negligibly small in most cases.
d. The amplitude accuracy versus frequency in the source and the analyzer can contribute to amplitude errors. This error source is eliminated when using normalization in low band (0 to 3.05 GHz). In high band, unless the preselector bypass option is installed and used, the gain instability of the YIG-tuned prefilter in the PSA keeps normalization errors nominally in the 0.25 to 0.5 dB range.
e. In the worst case, the center frequency of the YIG-tuned prefilter can vary enough to cause very sub-stantial errors, much higher than the nominal 0.25 to 0.5 dB nominal errors discussed in the previous footnote. In this case, or as a matter of good practice, the prefilter should be centered. See the user's manual for instructions on centering the preselector.
f. VSWR interaction effects, caused by RF reflections due to mismatches in impedance, are usually the dominant error source. These reflections can be minimized by using 10 dB or more attenuation in the PSA, and using well-matched attenuators in the measurement configuration.
Description Specification Supplemental Information
Power sweep range 0 to 30 dB (Nominal)a
Chapter 23 349

External Source Control - Option 215
a. Relative to the original power level and limited by the source to be controlled.
Description Specification Supplemental Information
Measurement Time Nominal a
a. These measurement times were observed with a span of 100 MHz and the automatically selected set-ting of RBW, which is 20 kHz. The measurement times will not change significantly with span when the RBW is automatically selected. If the RBW is decreased, the measurement time will go up by
approximately 3.2 times Span divided by RBW2.
RBW setting of the PSA determined by the default for Option 215
ESG or PSG b
b. Based on ESG firmware version C.03.72 or PSG firmware version C.04.04.
101 Sweep points 2.9 s
601 Sweep points 9.5 s
MXGc
c. Based on MXG firmware version A.01.41.
101 Sweep points 1.1 s
601 Sweep points 1.9 s
350 Chapter 23

External Source Control - Option 215
Description Specification Supplemental Information
Supported External Sources
Agilent PSG Models: E8257D, E8267D (firmware C.04.04 or later)
E8247C, E8257C, E8267C (firmware C.03.78 or later)
Agilent ESG E4438C (firmware C.03.73 or later)
E4428C (firmware C.04.60 or later)
Agilent MXG N5181A, N5182A, N5183A (firmware A.01.41 or later)
Chapter 23 351

External Source Control - Option 215
352 Chapter 23

24 EMI Receiver Specifications: PSA and N9039A RF Preselector
This chapter contains specifications for the PSA based EMI receiver, using model N9039A, RF Preselector. The PSA, when using the RF Preselector, complies with CISPR 16-1-1 and MIL-STD-461D/E allowing you to make EMI measurements for full compliance.
353

EMI Receiver Specifications: PSA and N9039A RF Preselector
Applicability of Specifications for this Option
Applicability of Specifications for this Option
This chapter of the specifications guide describes the unique performance of the CISPR 16-1-1 compliant EMI Receiver, the combination of PSA and RF Preselector (N9039A). When the RF Preselector is installed and enabled, aspects of the base PSA spectrum analyzer performance are affected as described by this chapter.
Figure 24-1 EMI Receiver Block Diagram
The EMI Receiver has two paths: preselected (up to 1 GHz) and bypass (available through 26.5 GHz).
• Input attenuator in PSA is fixed at 10 dB when making preselected measurements using the N9039A. The RF preselector has 57.5 dB of available attenuation in front of the PSA.
• The RF Preselector Gain is set to OFF by default.
• RF Preselector Gain is used solely for preselected sweeps to increase sensitivity.
• Any signal sent through the RF preselector has a minimum of 10 dB gain. When the RF Preselector Gain is set to ON, an additional 15 dB gain is available. This gain is available in the preselected path alone.
• Standard PSA features are available in bypass path.
• Optional PSA amplifiers (1DS or 110) are disabled in preselected sweeps using the N9039A.
The RF Preselector has two inputs:
RF Input for EMI measurementsCal Source Input for user alignments with a designated external source
354 Chapter 24

EMI Receiver Specifications: PSA and N9039A RF Preselector
Requirements for PSA based EMI Receiver
Requirements for PSA based EMI Receiver
• The PSA needs to be upgraded to revision A.10.00 or later.
• The PSA must have Option 239, EMI Receiver personality, installed.
Conditions Required to Meet Specifications
• The PSA, RF Preselector and Source are within their calibration cycle.
• After all the components have been at operating temperature at least 2 hours.
• The PSA has met the conditions required to meet its specifications (refer to PSA core specifications)
• A minimum of 30 minutes of warm-up time for all three components are required before an RF Preselector user alignment is initiated.
• The user alignment for RF Preselector must be run:
— Within the last 120 hours— Any time the ambient temperature changes more than 3 °C
Chapter 24 355

EMI Receiver Specifications: PSA and N9039A RF Preselector
Frequency
Frequency
Specification Name Information
Frequency Specifications
Frequency Range 9 kHz to 1 GHz
Frequency Reference See “Frequency Reference” on page 23 in the core specifications.
Frequency Readout Accuracy See “Frequency Readout Accuracy” on page 24 in the core specifications.
Frequency Counter Count Accuracy See “Frequency Counter Count Accuracy” on page 24 in the core specifications.
Delta Count Accuracy See “Delta Count Accuracy” on page 24 in the core specifications.
Resolution See “Resolution” on page 24 in the core specifications.
Frequency Span See “Frequency Span” on page 25 in the core specifications.
Bypass path for the EMI Receiver has both swept and FFT based measurements available. Preselected path has swept based measurements.
Sweep Time See “Sweep Time vs. Span” on page 358 in this section.
Sweep Triggera
a. In bypass path the EMI receiver has all trigger types available. In preselected path the EMI receiver has all trigger types available while in zero span. In non-zero span external triggers are used to synchronize the preselector and PSA.
See “Sweep Trigger” on page 26 in the core specifications.
Gated FFTb
b. The Gated FFT is not available in the preselected sweeps.
See “Gated FFT” on page 26 in the core specifications.
Gated Sweepc
c. The Gated Sweep is not available in the preselected sweeps.
See “Gated Sweep” on page 27 in the core specifications.
356 Chapter 24

EMI Receiver Specifications: PSA and N9039A RF Preselector
Frequency
Specification Name Information
Number of Frequency Display Trace Points (buckets)
See “Number of Frequency Display Trace Points (buckets)” section of the core specifications.
Resolution Bandwidth (RBW) See “Resolution Bandwidth (RBW)” section of the core specifications.
EMI Resolution Bandwidthsa
a. Meets all CISPR 16-1-1 (2006) and MIL-STD-461D/E resolution bandwidth standards.
See “EMI Resolution Bandwidths” section of the core specifications.
Analysis Bandwidthb
b. Not available in the preselected sweeps. In preselected path the EMI receiver uses standard IF band-widths.
See “Analysis Bandwidth” section of the core specifications.
Input Mixer Level See “Input Mixer Level” section of the core specifications.
Table 24-1 Data Points as a Function of CISPR Band
CISPR Band Frequency Range CISPR RBW Default Data Pointsa
a. Every data point captures an IF bucket.
Band A 9 – 150 kHz 200 Hz 706
Band B 150 kHz – 30 MHz 9 kHz 3318
Band C 30 – 300 MHz 120 kHz 2251
Band D 300 MHz – 1 GHz 120 kHz 5835
Band C/D 30 MHz – 1 GHz 120 kHz 8085
Band Eb
b. Maximum number of data points allowed by PSA
1 – 18 GHz 1 MHz 8192
Chapter 24 357

EMI Receiver Specifications: PSA and N9039A RF Preselector
Frequency
Description Specifications Supplemental Information
Sweep Time vs. Span Auto-coupled sweep conditions,Nominal values
Bypassa
a. Nominally follows the PSA sweep time rules
Preselectedb
b. Default number of sweep points based on "Data points as a function of CISPR Band" table.
Band A: 9-150 kHz 5.775 s 5.775 s
Band B: 150 kHz-30 MHz 715.4 ms 1.055 s
Band C/D: 30-1000 MHz 158.8 ms 630.6 ms
358 Chapter 24

EMI Receiver Specifications: PSA and N9039A RF Preselector
Amplitude
Amplitude
Specification Name Information
Amplitude Specifications
Display Range See the “Display Range” section of the core specifications
Log Scale
Linear Scale
Marker Readout See the “Marker Readout” section of the core specifications
Available Detectors See the “Available Detectors” section of the core specifications
EMI Detectors See the “EMI Detectors” section of the core specifications
Chapter 24 359

EMI Receiver Specifications: PSA and N9039A RF Preselector
Amplitude
Description Specifications Supplemental Information
Maximum Safe Input Level Applies with or without preamp
Preselected Patha
a. The RF preselected path is protected by a limiter (30 dBm)
Average Total Power RF Preselector attenuation 10 dB
+30 dBm (1 W) With RF Preselector Gain On or Off
Peak Pulse Power RF Preselector attenuation 10 dB
+50 dBm (100 W) With RF Preselector Gain On or Off
Max. Pulse Energy = 100W × 0.01ms = 1 mWs
DC voltsb
b. When using the EMI Presets and conducted bands to 30 MHz, the PSA input is DC coupled. For radi-ated bands, above 30 MHz the PSA input is AC coupled only if for models E4440A, E4443A and E4445A. AC coupling is not available on the E4446A, E4447A and E4448A.
±7.0 Vdc
Bypass Path
Average Total Power
Applies with preamp (Option 1DS)
Applies with preamp (Option 110)
+30 dBm (1 W)
+30 dBm (1 W)
+25 dBm
Peak Pulse Power <10 ms pulse width, <1 % duty cycle, and PSA attenuation 30 dB
+50 dBm (100 W)
DC volts DC Coupled AC Coupled (E4443A, E4445A, E4440A)
±0.2 Vdc±7.0 Vdc
360 Chapter 24

EMI Receiver Specifications: PSA and N9039A RF Preselector
Amplitude
Description Specification Supplemental Information
Overload Detection
Preselected Path Meets the CISPR
specificationsa
a. CISPR 16-1-1 (2006-03)
Bypass Path
20 MHz to 26.5 GHz See “Gain Compression” in core specifications
Description Specifications Supplemental Information
Measurement Rangea
a. Power at EMI Receiver input
Preselected Path Displayed Average Noise Level to +30 dBm (137 dBV)
With RF Preselector Gain ON or OFF
RF Preselector Attenuation Range 0 and 10 to 57.5 dB, in 2.5 dB steps
Bypass Path See “Measurement Range” in core specifications
Chapter 24 361
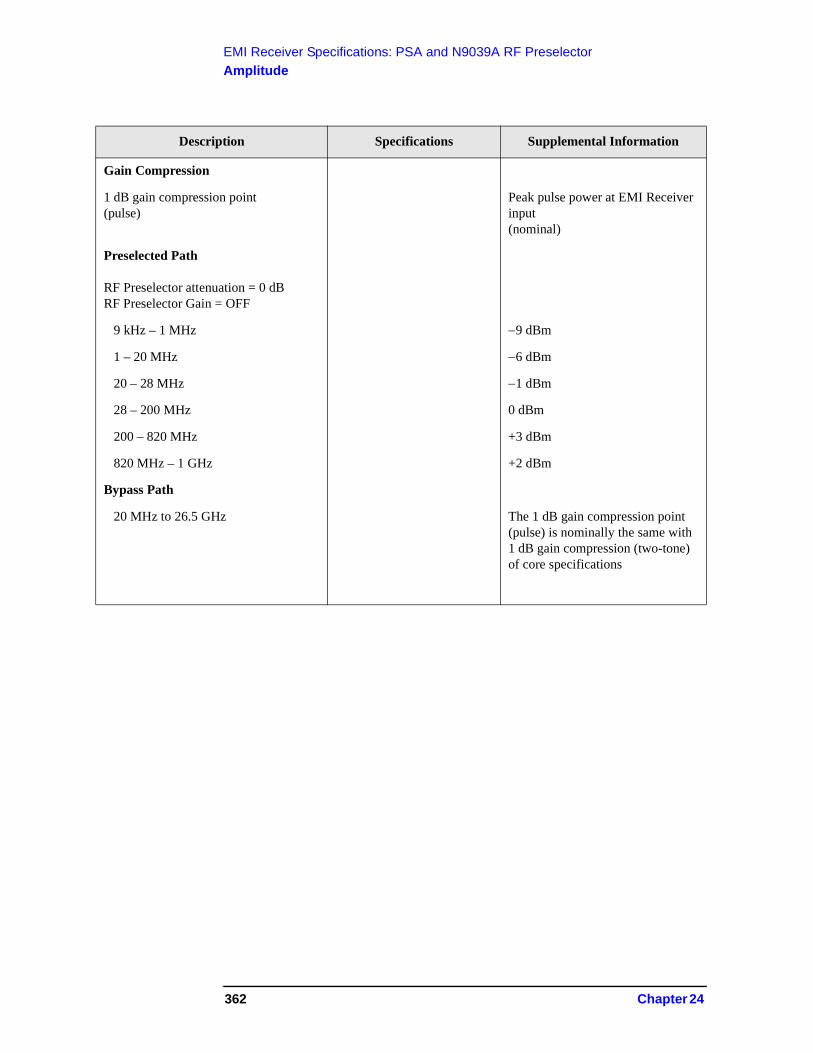
EMI Receiver Specifications: PSA and N9039A RF Preselector
Amplitude
Description Specifications Supplemental Information
Gain Compression
1 dB gain compression point(pulse)
Peak pulse power at EMI Receiver input(nominal)
Preselected PathRF Preselector attenuation = 0 dBRF Preselector Gain = OFF
9 kHz – 1 MHz 9 dBm
1 – 20 MHz 6 dBm
20 – 28 MHz 1 dBm
28 – 200 MHz 0 dBm
200 – 820 MHz +3 dBm
820 MHz – 1 GHz +2 dBm
Bypass Path
20 MHz to 26.5 GHz The 1 dB gain compression point (pulse) is nominally the same with 1 dB gain compression (two-tone) of core specifications
362 Chapter 24
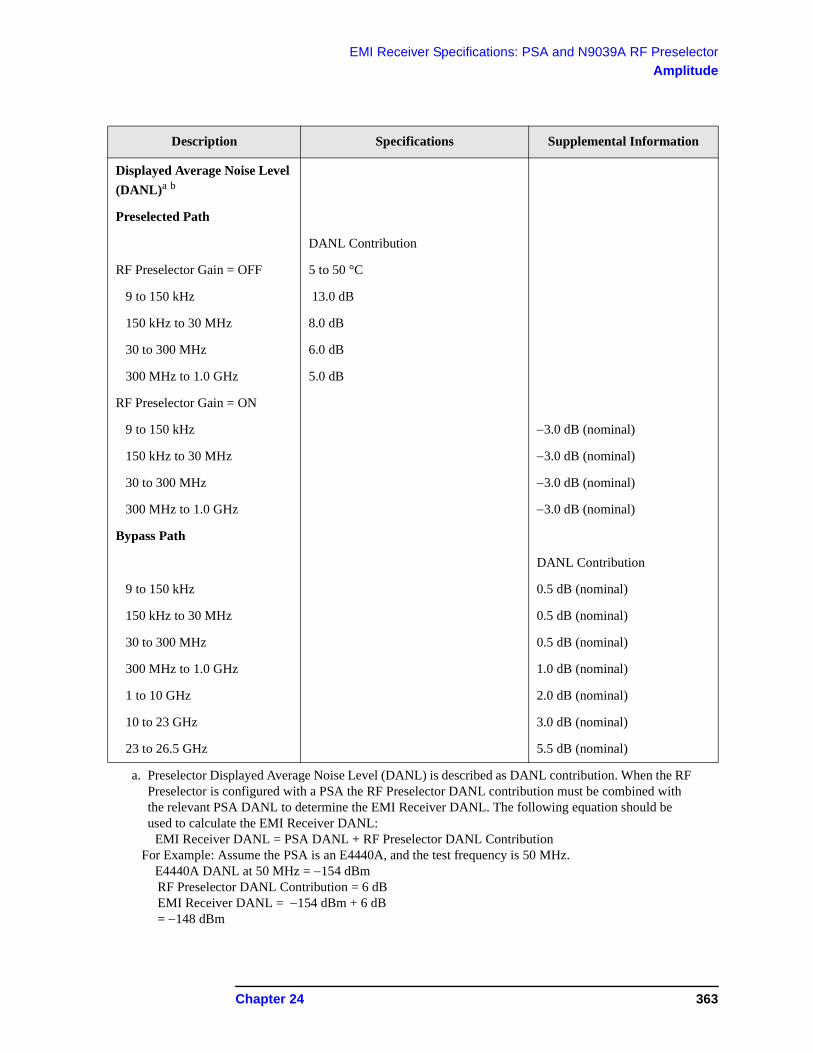
EMI Receiver Specifications: PSA and N9039A RF Preselector
Amplitude
Description Specifications Supplemental Information
Displayed Average Noise Level
(DANL)a b
a. Preselector Displayed Average Noise Level (DANL) is described as DANL contribution. When the RF Preselector is configured with a PSA the RF Preselector DANL contribution must be combined with the relevant PSA DANL to determine the EMI Receiver DANL. The following equation should be used to calculate the EMI Receiver DANL:
EMI Receiver DANL = PSA DANL + RF Preselector DANL Contribution For Example: Assume the PSA is an E4440A, and the test frequency is 50 MHz. E4440A DANL at 50 MHz = 154 dBm
RF Preselector DANL Contribution = 6 dB EMI Receiver DANL = 154 dBm + 6 dB = 148 dBm
Preselected Path
DANL Contribution
RF Preselector Gain = OFF 5 to 50 °C
9 to 150 kHz 13.0 dB
150 kHz to 30 MHz 8.0 dB
30 to 300 MHz 6.0 dB
300 MHz to 1.0 GHz 5.0 dB
RF Preselector Gain = ON
9 to 150 kHz 3.0 dB (nominal)
150 kHz to 30 MHz 3.0 dB (nominal)
30 to 300 MHz 3.0 dB (nominal)
300 MHz to 1.0 GHz 3.0 dB (nominal)
Bypass Path
DANL Contribution
9 to 150 kHz 0.5 dB (nominal)
150 kHz to 30 MHz 0.5 dB (nominal)
30 to 300 MHz 0.5 dB (nominal)
300 MHz to 1.0 GHz 1.0 dB (nominal)
1 to 10 GHz 2.0 dB (nominal)
10 to 23 GHz 3.0 dB (nominal)
23 to 26.5 GHz 5.5 dB (nominal)
Chapter 24 363

EMI Receiver Specifications: PSA and N9039A RF Preselector
Amplitude
b. Verification conditions to measure DANL Contribution: RF Preselector Attenuation = 10 dB RBW = 1 kHz VBW = 30 Hz Span = 0 Hz Detector = Average Detector
Description Specifications Supplemental Information
Absolute Amplitude Accuracy
for RF Inputa b
20 to 30 °C 5 to 50 °C
Preselected Path
RF Preselector Gain = OFF
RF Preselector Attenuation
0 dB
9 kHz to 1 GHz ±0.85 dB (nominal)
10 dB
9 to 150 kHz ±1.20 dB ±1.55 dB ±0.50 dB (typical)
150 kHz to 30 MHz ±1.20 dB ±1.70 dB ±0.55 dB (typical)
30 to 300 MHz ±1.25 dB ±1.70 dB ±0.65 dB (typical)
300 MHz to 1 GHz ±1.40 dB ±2.00 dB ±0.75 dB (typical)
12.5 to 40 dB
9 to 150 kHz ±1.25 dB ±1.95 dB ±0.65 dB (typical)
150 kHz to 30 MHz ±1.25 dB ±2.00 dB ±0.65 dB (typical)
30 to 300 MHz ±1.25 dB ±1.65 dB ±0.65 dB (typical)
300 MHz to 1 GHz ±1.45 dB ±2.00 dB ±0.75 dB (typical)
42.5 to 57.5 dB
9 to 150 kHz ±1.55 dB ±0.80 dB (typical)
150 kHz to 30 MHz ±1.40 dB ±0.70 dB (typical)
30 to 300 MHz ±1.60 dB ±0.80 dB (typical)
300 MHz to 1 GHz ±1.70 dB ±0.90 dB (typical)
RF Preselector Gain = ON
RF Preselector Attenuation
0 dB
364 Chapter 24

EMI Receiver Specifications: PSA and N9039A RF Preselector
Amplitude
9 kHz to 1 GHz ±0.90 dB (nominal)
10 dB
9 to 150 kHz ±1.20 dB ±1.55 dB ±0.55 dB (typical)
150 kHz to 30 MHz ±1.25 dB ±1.70 dB ±0.60 dB (typical)
30 to 300 MHz ±1.45 dB ±1.90 dB ±0.75 dB (typical)
300 MHz to 1 GHz ±1.45 dB ±2.00 dB ±0.75 dB (typical)
12.5 to 57.5 dB
9 kHz to 1 GHz ±0.90 dB (nominal)
Bypass Path
PSA Attenuation
10 dB
9 kHz to 1 GHz ±1.00 dB ±1.45 dB ±0.30 dB (typical)
1 to 3 GHz ±0.60 dB (nominal)
3 to 6.6 GHz ±1.70 dB (nominal)
6.6 to 26.5 GHz ±2.90 dB (nominal)
Preamp On (1DS)
100 kHz to 1.0 GHz ±0.45 dB (nominal)
1 to 3 GHz ±0.80 dB (nominal)
Preamp On (110)c
10 MHz to 3.0 GHz ±0.75 dB (nominal)
3 to 6.6 GHz ±1.00 dB (nominal)
6.6 to 19 GHz ±1.80 dB (nominal)
19 to 26.5 GHz ±2.40 dB (nominal)
a. Conditions required for absolute amplitude accuracy 1. 5 day user alignment cycle 2. plus or minus 3 degrees of last user alignment temperature 3. S/N Ratio > 20 dB
b. Source input absolute amplitude accuracy nominally equals RF input absolute amplitude accuracyc. For frequencies greater than 3 GHz PSA attenuation = 0 dB
Description Specifications Supplemental Information
Chapter 24 365

EMI Receiver Specifications: PSA and N9039A RF Preselector
Amplitude
Description Specifications Supplemental Information
RF Preselector Gain & Noise Figurea
a. The difference from RF Preselector Gain = OFF to RF Preselector Gain = ON is 15 dB
Gain (nominal) Noise Figure (nominal)
RF Preselector Gain = OFF 10 dB 13 dB
RF Preselector Gain = ON 25 dB 10 dB
Description Specifications Supplemental Information
RF Input VSWR
9 kHz to 1 GHz
Preselected Path
RF Preselector Gain = OFF
RF Preselector atten. = 0 dB 2.0:1 1.79:1 (typical)
RF Preselector atten. 10 dB 1.2:1 1.16:1 (typical)
RF Preselector Gain = ON
RF Preselector atten. = 0 dB 1.70:1 (nominal)
RF Preselector atten. 10 dB 1.17:1 (nominal)
Bypass Path Nominally follows the PSA specification
366 Chapter 24

EMI Receiver Specifications: PSA and N9039A RF Preselector
Amplitude
Description Specifications Supplemental Information
General Spurious Responsesa
a. Preselected Path, RF Preselector Attenuation = 10 dB
Preselected Path
Mixer Levelb = 10 dBm
b. Mixer level = RF Preselector Input Level – RF Preselector Attenuation + RF Preselector Gain 10 dB
9 kHz to 1 GHz Meets CISPR
Specificationc
c. CISPR 16-1-1 (2006-03)
77 dBc (nominal)
Bypass Path Nominally matches PSA spurious specification + 3 dB
IF and LO Related Spurious
Preselected Path
Image Responses
10 MHz to 1 GHz Meets CISPR
Specificationc77 dBc (nominal)
Multiples and Out-of-band Responses
10 MHz to 1 GHz Meets CISPR
Specificationc77 dBc (nominal)
Bypass Path Nominally matches PSA spurious specification + 3 dB
Chapter 24 367

EMI Receiver Specifications: PSA and N9039A RF Preselector
Amplitude
Description Specifications Supplemental Information
Second Harmonic Distortion
Preselected Path
RF Preselector Gain ON or OFF
Source Frequency
7 to 500 MHz +60 dBm (nominal)
Bypass Path Nominally meets PSA specifications
368 Chapter 24

EMI Receiver Specifications: PSA and N9039A RF Preselector
Amplitude
Description Specifications Supplemental Information
RF Preselector Third Order Intercept a b c
a. RF Preselector TOI is verified with two tones, each at –15 dBm for RF Preseelctor Gain = OFF (25 dBm for RF Preselector Gain = ON) at the RF Preselector input, with 0 dB RF Preselector attenuation, spaced by 100 kHz.
b. The TOI is given by the input power to the preselector (in dBm) (distortion/2) where distortion is the relative level of the distortion tones in dBc.
c. The EMI Receiver TOI in the preselected path, referenced to the EMI Receiver input is given by the equation below:
Tone separation >15 kHz
Preselected Path
(5 to 50 °C)
RF Preselector Gain = OFF
10 to 30 MHz +4.0 dBm +9.0 dBm (typical)
30 to 300 MHz +5.0 dBm +7.0 dBm (typical)
300 MHz to 1.0 GHz +9.0 dBm +11.0 dBm (typical)
RF Preselector Gain = ON
10 to 30 MHz 2.0 dBm (nominal)
30 to 300 MHz 0.0 dBm (nominal)
300 MHz to 1.0 GHz 2.0 dBm (nominal)
Bypass Pathd
d. Bypass path TOI is referenced to the EMI receiver input. PSA input attenuation is set to 0 dB.
Nominally meets PSA specifications
TOIEMIReceiver dBm 10 10
TOIPSA–
10------------------------
10
TOIRFPresel–
10---------------------------------------
+log
–=
Chapter 24 369

EMI Receiver Specifications: PSA and N9039A RF Preselector
Amplitude
Description Specifications Supplemental Information
Residual Responsesa
a. EMI Receiver input terminated, RF Preselector Attenuation = 0 dB
Preselected Path
RF Preselector Gain = OFF
200 kHz to 1 GHz 93 dBm (nominal)
RF Preselector Gain = ON
200 kHz to 1 GHz 84 dBm (nominal)
Bypass Path
200 kHz to 26.5 GHz 97 dBm (nominal)
370 Chapter 24

EMI Receiver Specifications: PSA and N9039A RF Preselector
N9039A RF Preselector Specifications
N9039A RF Preselector Specifications
Description Specifications Supplemental Information
Calibration Cycle 1 year
Description Specifications Supplemental Information
Model and Option listings
RF IN / OUT Type N Connector
Option BAB APC 3.5 Connector
Chapter 24 371

EMI Receiver Specifications: PSA and N9039A RF Preselector
N9039A RF Preselector Specifications
Description Range Specifications
Pre-selection Filters 6 dB bandwidth (nominal)
9 to 150 kHz 284 kHz, fixed lowpass
150 kHz to 1 MHz 1.5 MHz, fixed bandpass
1 to 2 MHz 2.5 MHz, fixed bandpass
2 to 5 MHz 6.9 MHz, fixed bandpass
5 to 8 MHz 9.0 MHz, fixed bandpass
8 to 11 MHz 9.2 MHz, fixed bandpass
11 to 14 MHz 8.9 MHz, fixed bandpass
14 to 17 MHz 9.2 MHz, fixed bandpass
17 to 20 MHz 8.7 MHz, fixed bandpass
20 to 24 MHz 9.0 MHz, fixed bandpass
24 to 28 MHz 8.8 MHz, fixed bandpass
28 to 32 MHz 8.8 MHz, fixed bandpass
28 to 55 MHz 5.1 MHz, tracking bandpass
55 to 100 MHz 6.5 MHz, tracking bandpass
100 to 155 MHz 10 MHz, tracking bandpass
155 to 235 MHz 16.8 MHz, tracking bandpass
235 to 350 MHz 22.5 MHz, tracking bandpass
350 to 470 MHz 41 MHz, tracking bandpass
470 to 620 MHz 64 MHz, tracking bandpass
620 to 820 MHz 49 MHz, tracking bandpass
820 to 1 GHz 69 MHz, tracking bandpass
372 Chapter 24

EMI Receiver Specifications: PSA and N9039A RF Preselector
N9039A RF Preselector Specifications
Description Specifications Supplemental Information
Inputs and Outputs
Front Panel
RF IN Type N female (Standard)
APC 3.5 male (Option BAB)
RF OUT Type N female (Standard)
APC 3.5 male (Option BAB)
CAL SOURCE IN Type N female
USB 2.0 Ports female
Master (2 ports) Connector USB Type “A”
Output Current 0.5 A (nominal)
Rear Panel
EXTERNAL TRIGGER OUT BNC female
PULSE TRIGGER 2 OUT BNC female
Monitor Out
Connector VGA compatible,15-pin mini D-SUB
Format XGA (60 Hz vertical sync rates, non-interlaced) Analog RGB
Resolution 1024 x 768
USB 2.0 Ports
Master (4 ports)
Connector USB Type “A” female
Output Current 0.5 A (nominal)
Slave (1 port)
Connector USB Type “B” female
Output Current 0.5 A (nominal)
GPIB Interface
Connector IEEE-488 bus connector
GPIB Codes SH1, AH1, T6, SR1, RL1, PP0, DC1, C1,C2, C3 and C28, DT1, L4, C0
LAN TCP/IP Interface RJ45 Ethertwist 100BaseT
Chapter 24 373

EMI Receiver Specifications: PSA and N9039A RF Preselector
N9039A RF Preselector Specifications
Description Specifications Supplemental Information
Temperature Range
Operating 5 to 50 °C
Storage 40 to 70 °C
Altitude 4600 meters (approx. 15,000 feet)
Description Specifications Supplemental Information
Environmental and Military Specifications
Samples of this product have been type tested in accordance with the Agilent Environmental Test Manual and verified to be robust against the environmental stresses of Storage, Transportation and End-use; those stresses include but are not limited to temperature, humidity, shock, vibration, altitude and power line conditions. Test Methods are aligned with IEC 60068-2 and levels are similar to MIL-PRF-28800F Class 3
Description Specification
EMC Complies with European EMC Directive 2004/108/EC
IEC/EN 61326-1 or IEC/EN 61326-2-1
CISPR Pub 11 Group 1, class A
AS/NZS CISPR 11
ICES/NMB-001
This ISM devise complies with ICES-001.Cet appareil ISM est conforme a la norme NMB-001 du Canada.
The N9039A based EMI measurement receiver has been tested as fully compliant to CISPR 16-1-1 2003 and 2006 by World Cal. Inc., a well recognized independent calibration facility
374 Chapter 24

EMI Receiver Specifications: PSA and N9039A RF Preselector
N9039A RF Preselector Specifications
Acoustic Noise Emission/Geraeuschemissiona
a. The Agilent N9039A meets the Agilent Quiet office/lab/test space sound pressure and sound power specification when ventilation input temperature is below +28 degrees C. It complies with German Acoustic regulations: Acoustic noise emission Geraeuschemission
LpA <65 dB
Operator position
Normal position
Per ISO 7779
LpA <60 dB
Am Arbeitsplatz
Normaler Betrieb
Nach DIN 45635 t.19
Description Specification
Safety Complies with European Low Voltage Directive 2006/95/EC
— IEC/EN 61010-1 2nd Edition— Canada: CSA C22.2 No. 61010-1— USA: UL 61010-1 2nd Edition 1
Description Specification Supplemental Information
Power Requirements
Voltage (low range)
Frequency
100/120 V
50/60 Hz
Voltage (high range)
Frequency
220/240 V
50/60 Hz
Maximum Power Consumption 250 W
Chapter 24 375

EMI Receiver Specifications: PSA and N9039A RF Preselector
N9039A RF Preselector Specifications
Description Specifications Supplemental Information
Dimensions
Height 177 mm (7.0 in) Without feet (add 15 mm with feet)
Width 425 mm (16.7 in) Without side handles (add 12 mm with handles)
Length 551 mm (21.7 in)
Description Specifications Supplemental Information
Weight
Net 18 kg (40 lbs)
Shipping 21 kg (46 lbs)
Description Specifications Supplemental Information
Displays
Resolution 1024 x 768 XGA
Size 213 mm (8.4 in) diagonal (nominal)
376 Chapter 24

25 Measuring Receiver Personality
This chapter contains specifications for the N5531S measuring receiver system using the PSA Series, Option 233, Built-in measuring receiver personality.
377

Measuring Receiver Personality
Additional Definitions and Requirements
Additional Definitions and Requirements
This chapter contains specifications and supplemental information for the N5531S measuring receiver
system (comprised of a PSA spectrum analyzer with Option 233, a P-Series, or an EPM/EPM-P Series1 power meter, and an N5532A/B sensor module).
Available for all PSA models: E4443A/45A/40A/47A/46A/48A.
The following conditions must be met for the analyzer to meet the specifications included in this chapter.
PSA Conditions Required to Meet Specifications
• The system components are within their calibration cycle.
• RF Tuned Level using the “High Accuracy Mode”
• Fast Mode set to "Off" when performing modulation measurements.
• For center frequencies < 20 MHz, DC coupling applied.
• At least 2 hours of storage or operation at the operating temperature of 20 to 30 °C.
• The PSA has been turned on at least 30 minutes with Auto Align On selected or if Auto Align Off is selected, Align All Now must be run:
— Within the last 24 hours, and
— Any time the ambient temperature changes more than 3 °C, and
— After the analyzer has been at operating temperature at least 2 hours.
• For analog modulation measurements, a direct connection between the PSA and the device under test (DUT) is required to achieve the best performance and meet the specifications for all test frequencies.
• The following options are required as stated in the specifications.
— Option 123 microwave pre-selector bypass must be installed to meet TRFL specifications above 3 GHz.
— Option 107 (Audio input 100 k) is required with option 233 (Built-in measuring receiver personality) for the audio analysis.
— Option 1DS (pre-amplifier below 3GHz) or option 110 (pre-amplifier up to 50GHz) is needed to achieve better sensitivity as indicated in the specifications guide.
1. For the E4416A, E4417A, E4418B, and E4419B power meters to work with the N5531S measuring receiver, a LAN/GPIB gateway is required.
378 Chapter 25

Measuring Receiver Personality
Frequency Modulation
Frequency Modulation
Description Specification Supplemental Information
Input Power Range 18 to +30 dBm
Operating Rate Rangea
a. The modulation rates and the peak deviations that the system is capable of measuring are governed by the instrument’s IFBW (Information Bandwidth) setting. Their relationship is described by the equa-tion: Peak deviation (in Hz) = IFBW/2 modulation rate.
100 kHz fc < 10 MHz 20 Hz to 10 kHz
10 MHz fc < 50 GHz 50 Hz to 200 kHz
Peak Frequency Deviations a Peak Deviation = IFBW/2 Modulation Rate.
IFBWmax = 5 MHz in “Auto” mode; IFBWmax = 10 MHz in “Manual” mode
100 kHz < fc < 10 MHz 40 kHz maximum
10 MHz < fc < 50 GHz 400 kHz maximum
FM Deviation Accuracyb
b. When the carrier frequency fc is less than 10 MHz, to avoid the image signal that appears in the IF cor-
responding to the negative of the signal frequency, the fc and IFBW must be chosen to satisfy IFBW <
2 (fc 100 kHz).
Frequency Range
Modulation Rate
Peak Deviation
c
c. is the ratio of frequency deviation to modulation rate (deviation/rate)
250 kHz to
10 MHz
20 Hz to
10 kHz
200 Hz to 40 kHz
> 0.2 1.5% of reading
> 1.2 1% of reading
10 MHz to
6.6 GHz
50 Hz to
200 kHz
250 Hz to 400 kHz
> 0.2 1.5% of reading
> 0.45 1% of reading
6.6 to
13.2 GHz
50 Hz to
200 kHz
250 Hz to 400 kHz
> 0.2 2.5% of reading
> 8 1% of reading
13.2 to 31.15 GHz
50 Hz to
200 kHz
250 Hz to 400 kHz
> 0.2 3.8% of reading
> 16 1% of reading
31.15 to50 GHz
50 Hz to
200 kHz
250 Hz to 400 kHz
> 0.2 8.5% of reading
> 32 1% of reading
Chapter 25 379

Measuring Receiver Personality
Frequency Modulation
Description Specification Supplemental Information
Modulation Distortion Floor See “Modulation Distortion” on page 389.
AM Rejection (50 Hz to 3 kHz BW)
Frequency Range
Modulation Rates
AM Depths
150 kHz to 3 GHz
400 Hz or 1 kHz
50% < 10 Hz peak deviation
3 to 6.6 GHz
400 Hz or 1 kHz
50% < 10 Hz
6.6 to 13.2 GHz
400 Hz or 1 kHz
50% < 20 Hz
13.2 to26.5 GHz
400 Hz or 1 kHz
50% < 40 Hz
26.5 to50 GHz
400 Hz or 1 kHz
50% < 75 Hz
380 Chapter 25

Measuring Receiver Personality
Frequency Modulation
Description Specification Supplemental Information
Residual FM (50 Hz to 3 kHz BW)a RF Frequency
100 kHz to 6.6 GHz
a. Follow this procedure to verify this specification: Input a clean CW signal (0 dB) from a signal source to the measuring receiver. (The recommended source is Agilent E8257D with option UNR or UNX.) Lock the signal source 10 MHz reference to the PSA 10 MHz reference output. Select "FM Deviation" on the measuring receiver. Manually tune the frequency to the input signal. Set the PSA parameters as follows, (1) IF BW = 6 kHz, (2) Detector Type = RMS, (3) High Pass Fil-ter = 50 Hz, (4) Low Pass Filter = 3 kHz.
< 1.5 Hz (rms)
6.6 to 13.2 GHz < 3 Hz (rms)
13.2 to 31.15 GHz < 6 Hz (rms)
31.15 to 50 GHz < 12 Hz (rms)
Detectors Available: +peak, peak, peak/2, peak hold, rms
Auto Carrier Frequency Triggeringb
b. PSA firmware revision A.11.08, or Option 23A.
Free run, Video, RF Burst, External (Front or Rear)
Chapter 25 381

Measuring Receiver Personality
Amplitude Modulation
Amplitude Modulation
Description Specification Supplemental Information
Input Power Range 18 to +30 dBm
Operating Rate Rangea
a. When the carrier frequency fc is less than 10 MHz, to avoid the image signal that appears in the IF cor-
responding to the negative of the signal frequency, the fc and IFBW must be chosen to satisfy IFBW < 2 (fc 100 kHz).
100 kHz fc < 10 MHz 20 Hz to 10 kHz
10 MHz fc < 50 GHz 50 Hz to 100 kHz
Description Specification Supplemental Information
Depth Range 5 to 99% Capable of measuring AM depth range of 0 to 99%.
AM Depth Accuracya
a. For peak measurement only: AM accuracy may be affected by distortion generated by the measuring receiver. In the worst case this distortion can decrease accuracy by 0.1% of reading for each 0.1% of distortion.
Frequency Range
Modulation Rate
Depths
100 kHz to 10 MHz
50 Hz to 10 kHz
5 to 99% 0.75% of reading
10 MHz to 3 GHz
50 Hz to 100 kHz
20 to 99% 0.5% of reading
5 to 20% 2.5% of reading
3 to 26.5 GHz
50 Hz to 100 kHz
20 to 99% 1.5% of reading
5 to 20% 4.5% of reading
26.5 to 31.15 GHz
50 Hz to 100 kHz
20 to 99% 1.9% of reading
5 to 20% 6.8% of reading
31.15 to50 GHz
50 Hz to 100 kHz
20 to 99% 6% of reading
5 to 20% 26% of reading
382 Chapter 25

Measuring Receiver Personality
Amplitude Modulation
Description Specification Supplemental Information
Flatnessa
a. Flatness is the relative variation in indicated AM depth versus rate for a constant carrier frequency and depth.
Frequency Range
Modulation Rate
Depths
10 MHz to3 GHz
90 Hz to 10 kHz
5 to 99% 0.30% of reading
3 to 26.5 GHz
90 Hz to 10 kHz
5 to 99% 0.40% of reading
26.5 to50 GHz
90 Hz to 10 kHz
5 to 99% 0.60% of reading
Modulation Distortion Floor See “Modulation Distortion” on page 389.
Chapter 25 383

Measuring Receiver Personality
Amplitude Modulation
Description Specification Supplemental Information
FM Rejection (50 Hz to 3 kHz BW)
Frequency Range
Modulation Rate
Peak FM Deviations
250 kHz to 10 MHz
400 Hz or1 kHz
< 5 kHz < 0.14% AM depth
10 MHz to 50.0 GHz
400 Hz or1 kHz
< 50 kHz < 0.36% AM depth
Residual AM (50 Hz to 3 kHz BW) < 0.01% (rms)a b
a. Preamp must be on to meet this specification for frequency range of 26.5 to 50 GHz.b. Follow this procedure to verify this specification:
Input a clean CW signal (0 dBm) from a signal source to the measuring receiver. (The recommended source is Agilent E8257D with option UNR or UNX.) Lock the signal source 10 MHz reference to the PSA 10 MHz reference output. Select “AM Depth” on the measuring receiver. Manually tune the frequency to the input signal. Set the PSA parameters as follows: (1) IF BW = 6 kHz, (2) Detector type = RMS, (3) High Pass Filter = 50 Hz, (4) Low Pass Filter = 3 kHz, (5) Set “RF Input Ranging” to “Man”, and decrease the input attenuation at 2 dB/step until “SigHi” message appears. Then back off 2 dB for the “SigHi” message to disappear.Option 123 (Preselector bypass) must be installed and preselector is set to OFF to meet specifications above 3 GHz.
Detectors Available: +peak, peak, peak/2, peak hold, rms
Auto Carrier Frequency Triggeringc
c. PSA firmware revision A.11.08, or Option 23A
Free run, Video, RF Burst, External (Front or Rear)
384 Chapter 25

Measuring Receiver Personality
Phase Modulation
Phase Modulation
Description Specification Supplemental Information
Input Power Range 18 to +30 dBm
Operating Rate Range
100 kHz fc < 50 GHz 200 Hz to 20 kHz
Maximum Peak Phase Deviation
fc < 10 MHz 450 radiansa
a. When the carrier frequency fc is less than 10 MHz, to avoid the image signal that appears in the IF cor-
responding to the negative of the signal frequency, the fc and IFBW must be chosen to satisfy IFBW < 2
(fc 100 kHz). The specification of 450 radians applies for fc = 200 kHz, IFBW = 200 kHz, and a
modulation rate of 200 Hz. The specification for maximum peak phase deviation will linearly improve as the allowed IFBW increase. As fc increases, the IFBW can increase up to the maximum allowed
IFBW in “Auto” or “Manual” modes.
fc 10 MHz 12,499 radiansb
b. When the carrier frequency (fc) is equal to or greater than 10 MHz, the maximum peak deviation that
the instrument is capable of measuring depends on the IFBW setting and the modulation rate of the sig-nal-under-test. The relationship is described by the equation: Max peak deviation (in radians) = [IFBW/(2modulation rate in Hz)] 1.The maximum IFBW used in “Auto” mode is 5 MHz, therefore, Max peak deviation (in radians) =
(2.5106/modulation rate in Hz) 1. In “Manual” mode, the maximum IFBW can be set to 10 MHz,
hence, Max peak deviation (in radians) = (5106/modulation rate in Hz) 1.
In “Auto” mode
24,999 radians b In “Manual” mode
Chapter 25 385

Measuring Receiver Personality
Phase Modulation
Description Specification Supplemental Information
M Accuracy
Frequency range Deviations
100 kHz to 6.6 GHz > 0.7 rad 1% of reading
> 0.3 rad 3% of reading
6.6 to 13.2 GHz > 2.0 rad 1% of reading
> 0.6 rad 3% of reading
13.2 to 26.5 GHz > 4.0 rad 1% of reading
> 1.2 rad 3% of reading
26.5 to 31.5 GHz > 4.0 rad 1% of reading
> 1.3 rad 3% of reading
31.5 to 50 GHz > 8.0 rad 1% of reading
> 2.4 rad 3% of reading
Modulation Distortion Floor
See “Modulation Distortion” on page 389.
386 Chapter 25

Measuring Receiver Personality
Phase Modulation
Description Specification Supplemental Information
AM Rejection (50 Hz to 3 kHz BW)
For 50% AM at 1 kHz rate < 0.03 rad (peak)
Residual PM (50 Hz to 3 kHz BW)a
a. Follow this procedure to verify this specification: Input a clean CW signal (0 dB) from a signal source to the measuring receiver. (The recommended source is Agilent E8257D with option UNR or UNX.) Lock the signal source 10 MHz reference to the PSA 10 MHz reference output. Select "PM Deviation" on the measuring receiver. Manually tune the frequency to the input signal. Set the PSA parameters as follows, (1) IF BW = 6 kHz, (2) Detector Type = RMS, (3) High Pass Fil-ter = 50 Hz, (4) Low Pass Filter = 3 kHz.
Frequency range
100 kHz to 6.6 GHz < 0.0017 rad (rms)
6.6 to 13.2 GHz < 0.0033 rad (rms)
13.2 to 31.15 GHz < 0.0066 rad (rms)
31.15 to 50 GHz < 0.0130 rad (rms)
Detectors Available: +peak, peak, peak/2, peak hold, rms
Auto Carrier Frequency Triggeringb
b. PSA firmware revision A.11.08, or Option 23A.
Free run, Video, RF Burst, External (Front or Rear)
Chapter 25 387

Measuring Receiver Personality
Modulation Rate
Modulation Rate1
Description Specification Supplemental Information
Frequency Range
(for demodulated signals)
AM
100 kHz fc < 10 MHz 20 Hz to 10 kHz
10 MHz fc < 50 GHz 20 Hz to 100 kHz
FM
100 kHz fc < 10 MHz 20 Hz to 10 kHz
10 MHz fc < 50 GHz 20 Hz to 200 kHz
M
100 kHz fc < 10 MHz 20 Hz to 10 kHz
10 MHz fc < 50 GHz 20 Hz to 200 kHz
Modulation Rate Accuracy
Modulation (peak)
AMa
a. Follow this procedure to verify this specification: Set an input signal at 10 dBm with 50% AM. Set the PSA as follows: (1) Auto Input Range, (2) Auto IF BW, (3) LP to be greater than the modulation rate, (4) HP=300 Hz or less than the modulation rate, (5) Average = 5 Repeat.
Depth 20%, Rate 100 kHz (0.06 Hz + Modulation Rate
Internal Reference Accuracy)b
b. Refer to the Frequency Reference section in the PSA base specifications.
c 0.01, Rate 200 kHz
c. is the ratio of frequency deviation to modulation rate (deviation/rate).
(0.06 Hz + Modulation Rate
Internal Reference Accuracy)b
c 0.01, Rate 20 kHz (0.06 Hz + Modulation Rate
Internal Reference Accuracy)b
Displayed Resolution 1 MHz
Measurement Rate 2 readings/second
1. With 20 Hz high pass filter
388 Chapter 25

Measuring Receiver Personality
Modulation Distortion
Modulation Distortion1
Description Specification Supplemental Information
Modulation Rate 200 Hz to 300 kHz Using 50 Hz HP filter
Display Range 0.01% to 100%(80 to 0 dB)
Displayed Resolution 0.01% (0.01 dB)
Accuracy 1 dB of reading
Sensitivity
Modulation See "Residual Noise and Distortion" below for minimum modulation levels.
1. The PSA-based measuring receiver measures distortion plus noise as per the standard method of distortion analyz-ers (accepted by the Institute of High Fidelity and others, refer to "Standard Methods of Measurement For Audio Amplifiers", The Institute of High Fidelity, Inc., New York (1978), p. 9). The distortion analyzer method is simple and adequate for most situations. When using this method, it is important to understand that the measurement result is not "total harmonic distortion" except under the condition that the distortion is not too excessive but that it does predominate over any other signal impurities.
Description Specification Supplemental Information
Residual Noise and Distortion
AM
Frequency Range
Modulation Rate Depths
0.1 to 10 MHz 20 Hz to 1 kHz > 1 % < 0.8 % HP = 50 Hz, LP = 3 kHz
> 3 % < 0.3 %
10 MHz to 26.5 GHz
20 Hz to 1 kHz > 1 % < 1.0 %
> 3 % < 0.4 %
26.5 to 50 GHz 20 Hz to 1 kHz > 1 % < 6.2 %
> 3 % < 2.0 %
> 5 % < 1.5 %
Chapter 25 389

Measuring Receiver Personality
Modulation Distortion
Description SpecificationSupplemental Information
M PM
FrequencyRange
Modulation Rate Deviation (rad)
1 MHz to 6.6 GHz 20 to 500 Hz > 0.8 < 0.3% HP = 300 Hz, LP = 3 kHz
2.5 < 0.1%
500 Hz to 1 kHz > 0.4 < 0.3%
1.0 rad < 0.1%
6.6 to 13.2 GHz 20 to 500 Hz > 1.8 < 0.3%
5.5 < 0.1%
500 Hz to 1 kHz > 0.8 < 0.3%
2.5 < 0.1%
13.2 to 31.15 GHz 20 to 500 Hz > 3.5 < 0.3%
10.0 < 0.1%
500 Hz to 1 kHz > 1.2 < 0.3%
4 < 0.1%
31.15 to 50 GHz 20 to 500 Hz > 7.5 < 0.3%
19 < 0.1%
500 Hz to 1 kHz > 3.0 < 0.3%
8.0 < 0.1%
390 Chapter 25

Measuring Receiver Personality
Modulation Distortion
Description SpecificationSupplemental Information
FM
Frequency Range Modulation Rate Deviation
1 MHz to 6.6 GHz 20 Hz to 1 kHz 500 Hz to 2.0 kHz < 0.3% HP = 300 Hz,LP = 3 kHz
2.0 kHz < 0.1%
6.6 to 13.2 GHz 20 Hz to 1 kHz > 2.3 kHz < 0.3%
4.5 kHz < 0.1%
13.2 to 31.15 GHz 20 Hz to 1 kHz > 2.7 kHz < 0.3%
6.0 kHz < 0.1%
31.15 to 50 GHz 20 Hz to 1 kHz > 4.0 kHz < 0.3%
12.0 kHz < 0.1%
Chapter 25 391

Measuring Receiver Personality
Modulation SINAD
Modulation SINAD
Description Specification Supplemental Information
Modulation Rate 200 Hz to 300 kHz Using 50 Hz HP filter
Display Range 0.00 to 80 dB
Displayed Resolution 0.01 dB
Accuracya
a. Measured distortion must be greater than 3% for the accuracy specification to apply. For distortions less than 3%, the noise floor of the analyzer will begin to affect the accuracy of the measurement.
1 dB of reading
392 Chapter 25

Measuring Receiver Personality
Modulation SINAD
Description SpecificationSupplemental Information
Residual Noise and Distortion
AM
Frequency Range Modulation Rate Depths
0.1 to 10 MHz 20 Hz to 1 kHz > 1 % 41.03 dB HP = 50 Hz,LP = 3 kHz
> 3 % 50.45 dB
10 MHz to 26.5 GHz 20 Hz to 1 kHz > 1 % 40.00 dB
> 3 % 47.95 dB
26.5 to 50 GHz 20 Hz to 1 kHz > 1 % 24.15 dB
> 3 % 33.97 dB
> 5 % 36.47 dB
M
Frequency Range Modulation Rate Deviation (rad)
1 MHz to 6.6 GHz 20 to 500 Hz > 0.8 50.46 dB HP = 300 Hz,LP = 3 kHz
2.5 60.00 dB
500 Hz to 1 kHz > 0.4 50.46 dB
1.0 60.00 dB
6.6 to 13.2 GHz 20 to 500 Hz > 1.8 50.46 dB
5.5 60.00 dB
500 Hz to 1 kHz > 0.8 50.46 dB
2.5 60.00 dB
13.2 to 31.15 GHz 20 to 500 Hz > 3.5 50.46 dB
10.0 60.00 dB
500 Hz to 1 kHz > 1.2 50.46 dB
4.0 60.00 dB
31.15 to 50 GHz 20 to 500 Hz > 7.5 50.46 dB
19.0 60.00 dB
500 Hz to 1 kHz > 3.0 50.46 dB
8.0 60.00 dB
Chapter 25 393

Measuring Receiver Personality
Modulation SINAD
Description SpecificationSupplemental Information
FM
Frequency Range Modulation Rate Deviation
1 MHz to 6.6 GHz 20 Hz to 1 kHz 500 Hz to 2.0 kHz 50.46 dB HP = 300 Hz,LP = 3 kHz
2.0 kHz 60.00 dB
6.6 to 13.2 GHz 20 Hz to 1 kHz > 2.3 kHz 50.46 dB
4.5 kHz 60.00 dB
13.2 to 31.15 GHz 20 Hz to 1 kHz > 2.7 kHz 50.46 dB
6.0 kHz 60.00 dB
31.15 to 50 GHz 20 Hz to 1 kHz > 4.0 kHz 50.46 dB
12.0 kHz 60.00 dB
394 Chapter 25

Measuring Receiver Personality
Modulation Filters
Modulation Filters
Description Specification Supplemental Information
Filter Flatness
50 Hz High-Pass Filter < 1% at rates > 50 Hz
300 Hz High-Pass Filter < 1% at rates > 300 Hz
400 Hz High-Pass Filtera
a. PSA firmware revision A.11.08, or Option 23B.
< 1% at rates > 400 Hz
3 kHz Low-Pass Filter < 1% at rates < 3,030 Hz
15 kHz Low-Pass Filter < 1% at rates < 15,030 Hz
30 kHz Low-Pass Filter < 1% at rates < 30,000 Hz
80 kHz Low-Pass Filtera < 1% at rates < 80,000 Hz
300 kHz Low-Pass Filter < 1% at rates < 300,000 Hz
De-Emphasis Filters 25 ms, 50ms, 75 ms, and 750 ms De-emphasis filters are single-pole, low-pass filters with nominal 3 dB frequencies of: 6,366 Hz for 25 s, 3,183 Hz for 50 s, 2,122 Hz for 75 s, and 212 Hz for 750 s.
Deviation from Ideal De-Emphasis Filter
< 0.4 dB, or < 3° Applicable to 25 s, 50 s, and 75 s filters. With 3 kHz Low-Pass filter and IFBW Mode set to “minimal”.
Chapter 25 395

Measuring Receiver Personality
RF Frequency Counter
RF Frequency Counter
Description Specification Supplemental Information
Rangea
a. When the N5532A/B Sensor module is used for the measurement, the frequency range may be limited by the sensor module’s maximum frequency.
100 kHz to 50 GHz
Sensitivityb
b. Instrument condition: RBW 1 kHz
In “Auto” mode
100 kHz fc < 3.0 GHz 0.4 mVrms (55 dBm)
3.0 GHz fc < 26.5 GHz 1.3 mVrms (45 dBm)
26.5 GHz fc < 50 GHz 4.0 mVrms (35 dBm)
Maximum Resolution 0.001 Hz
Accuracy + (readout freq. freq. ref. accy +0.100 Hz)
Modes Frequency and Frequency Error (manual tuning)
Sensitivity in Manual Tuning Mode Using manual ranging and changing RBW settings, sensitivity can be increased to approximately 100 dBm.
396 Chapter 25

Measuring Receiver Personality
Audio Input
Audio Input1
Audio Frequency Counter 1
Description Specification Supplemental Information
Frequency Range 20 Hz to 250 kHz
Input Impedance 100 k (nominal)
Maximum Safe Input Level 7 Vrms, or 20 Vdc
1. PSA Option 107 is required.
Description Specification Supplemental Information
Frequency Range 20 Hz to 250 kHz
Accuracya
a. Follow this procedure to verify this specification: Set an input audio signal at 100 mV. Set the PSA as follows: (1) Auto Level, (2) Auto IF BW, (3) LP is greater than the audio frequency, (4) HP=300 Hz or less than the audio frequency, (5) Average = 5 Repeat.
With HPF set to minimum setting of < 20 Hz
f < 1 kHz (0.02 Hz + f Internal Reference
Accuracy)b
b. Refer to the Frequency Reference section in the PSA base specifications.
f 1 kHz 3 counts of the first 6 significant digits f (Internal Reference
Accuracy)b
Resolution 0.01 Hz (8 digits)
Sensitivity 5 mV
Chapter 25 397

Measuring Receiver Personality
Audio Input
Audio AC (RMS) Level 1
Audio Distortion1
Audio SINAD 1
Description Specification Supplemental Information
Frequency Range 20 Hz to 250 kHz
Measurement Level Range 100 mV rms to 3V rms
Accuracy 1% of reading
Detector Mode RMS
Description Specification Supplemental Information
Display Range (20 Hz to 250 kHz BW) 0.01% to 100% (80 to 0 dB)
Accuracy (20 Hz to 250 kHz) 1 dB of reading
Residual Noise and Distortion < 0.3% (50.4 dB)
Total Noise 73.2 dB characteristic performance
Total Distortion 74.8 dB characteristic performance
1. PSA Option 107 is required.
Description Specification Supplemental Information
Display Range (20 Hz to 250 kHz BW) 0.00 to 80 dB
Display Resolution 0.01 dB
Accuracy
20 Hz to 20 kHz 1 dB of reading
20k Hz to 250 kHz 2 dB of reading
Residual Noise and Distortion 50.4 dB (< 0.3%)
Total Noise 73.2 dB characteristic performance
Total Distortion 74.8 dB characteristic performance
398 Chapter 25

Measuring Receiver Personality
Audio Input
Audio Filters1
Description Specification Supplemental Information
Filter Flatness
50 Hz High-Pass Filter < 1 % at rates > 50 Hz
300 Hz High-Pass Filter < 1 % at rates > 300 Hz
400 Hz High-Pass Filtera
a. PSA firmware revision A.11.08, or Option 23B.
< 1 % at rates > 400 Hz
3 kHz Low-Pass Filter < 1 % at rates < 3,030 Hz
15 kHz Low-Pass Filter < 1 % at rates < 15,030 Hz
30 kHz Low-Pass Filtera < 1 % at rates < 30,000 Hz
80 kHz Low-Pass Filtera < 1 % at rates < 80,000 Hz
> 100 kHz Low-Pass Filter < 1 % at rates < 100 k Hz
CCITT Weighting Filtera Deviation from the Ideal CCITT filter Response
CCITT Recommendation P53
0.2 dB at 800 Hz
1.0 dB, 300 Hz to 3 kHz
2.0 dB, 50 to 300 Hz and 3 to 3.5 kHz
3.0 dB, 3.5 to 5 kHz
De-Emphasis Filters 25 s, 50 s, 75 s, and 750 s De-emphasis filters are single-pole, low-pass filters with nominal 3 dB frequencies of: 6,366 Hz for 25 s, 3,183 Hz for 50 s, 2,122 Hz for 75 s, and 212 Hz for 750 s.
Deviation from Ideal De-Emphasis Filter
< 0.4 dB, or < 3° Applicable to 25 s, 50 s, and 75 s filters. With 3 kHz Low-Pass filter and IFBW Mode set to “minimal”.
1. PSA Option 107 is required.
Chapter 25 399

Measuring Receiver Personality
RF Power
RF Power1 2
The Agilent N5531S measuring receiver system with the N5532A/B sensor modules performs RF power measurements from 10 dBm (100 W) to +30 dBm (1 W). The N5531S must be used with Agilent P-Series power meters (N1911A, N1912A), or EPM Series power meters (N1913A, N1914A). Alternatively, Agilent power meters E4416A, E4417A, E4418B, or E4419B can also be used with a LAN/GPIB gateway connecting the power meter to the PSA.
PSA Firmware Version A.11.13 is required when using the N5532B power sensor
PSA Firmware Version A.11.21 is required when using the N1913A/N1914A power meters
1. For latest specification updates refer to N1911A/N1912A, N1913A/N1914A, E4416A/17A and E4418B/19B power meter User’s Guides.
2. The N5531S RF Power Accuracy is derived from the Agilent power meter accuracy. The parameters listed in this section are components used to calculate the RF Power Accuracy. Application Note 1449-3 (P/N 5988-9215EN) does an excellent job of explaining how the components are combined to derive an overall accuracy number. The resulting calculation yields 0.190 to 0.297 dB when measuring a +10 dBm signal and ignoring DUT mismatch. Assuming 1.5:1 DUT SWR, the calculation would return a typical accuracy of 0.213 to 0.387 dB (depending on the frequency range and power under test). Absolute and relative accuracy specifications do not include mismatch uncertainty.
Description Specification Supplemental Information
RF Power Accuracy (dB) Typicals
Power Meter Range 1 Sensor module options Sensor module options
+20 to +30 dBm #504 #518 #526 #550 #504 #518 #526 #550
100 kHz fc 10 MHz 0.356 0.182
10 MHz < fc 30 MHz 0.356 0.361 0.182 0.185
30 MHz < fc 2 GHz 0.356 0.361 0.361 0.361 0.182 0.185 0.185 0.185
2 GHz < fc 4.2 GHz 0.356 0.392 0.422 0.367 0.182 0.201 0.217 0.188
4.2 GHz < fc 18 GHz 0.400 0.422 0.367 0.205 0.217 0.188
18 GHz < fc 26.5 GHz 0.480 0.387 0.247 0.199
26.5 GHz < fc 50 GHz 0.420 0.216
400 Chapter 25
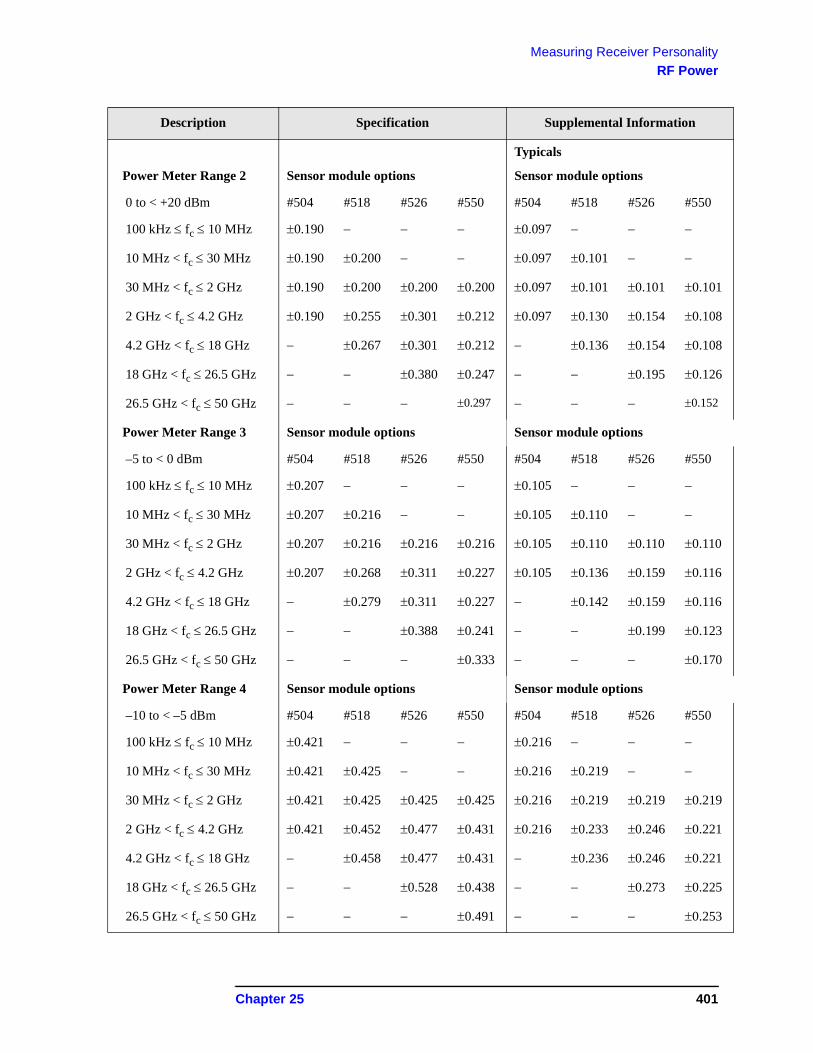
Measuring Receiver Personality
RF Power
Power Meter Range 2 Sensor module options
Typicals
Sensor module options
0 to < +20 dBm #504 #518 #526 #550 #504 #518 #526 #550
100 kHz fc 10 MHz 0.190 0.097
10 MHz < fc 30 MHz 0.190 0.200 0.097 0.101
30 MHz < fc 2 GHz 0.190 0.200 0.200 0.200 0.097 0.101 0.101 0.101
2 GHz < fc 4.2 GHz 0.190 0.255 0.301 0.212 0.097 0.130 0.154 0.108
4.2 GHz < fc 18 GHz 0.267 0.301 0.212 0.136 0.154 0.108
18 GHz < fc 26.5 GHz 0.380 0.247 0.195 0.126
26.5 GHz < fc 50 GHz 0.297 0.152
Power Meter Range 3 Sensor module options Sensor module options
–5 to < 0 dBm #504 #518 #526 #550 #504 #518 #526 #550
100 kHz fc 10 MHz 0.207 0.105
10 MHz < fc 30 MHz 0.207 0.216 0.105 0.110
30 MHz < fc 2 GHz 0.207 0.216 0.216 0.216 0.105 0.110 0.110 0.110
2 GHz < fc 4.2 GHz 0.207 0.268 0.311 0.227 0.105 0.136 0.159 0.116
4.2 GHz < fc 18 GHz 0.279 0.311 0.227 0.142 0.159 0.116
18 GHz < fc 26.5 GHz 0.388 0.241 0.199 0.123
26.5 GHz < fc 50 GHz 0.333 0.170
Power Meter Range 4 Sensor module options Sensor module options
–10 to < –5 dBm #504 #518 #526 #550 #504 #518 #526 #550
100 kHz fc 10 MHz 0.421 0.216
10 MHz < fc 30 MHz 0.421 0.425 0.216 0.219
30 MHz < fc 2 GHz 0.421 0.425 0.425 0.425 0.216 0.219 0.219 0.219
2 GHz < fc 4.2 GHz 0.421 0.452 0.477 0.431 0.216 0.233 0.246 0.221
4.2 GHz < fc 18 GHz 0.458 0.477 0.431 0.236 0.246 0.221
18 GHz < fc 26.5 GHz 0.528 0.438 0.273 0.225
26.5 GHz < fc 50 GHz 0.491 0.253
Description Specification Supplemental Information
Chapter 25 401

Measuring Receiver Personality
RF Power
RF Power Resolution
Display resolution 0.001 dB
Description Specification Supplemental Information
Instrumentation Accuracy
Logarithmic 0.02 dB
Linear 0.5%
Input SWR
N5532A/B Option 504
100 kHz to 2 GHz < 1.10:1 ( = 0.048)
2 GHz to 4.2 GHz < 1.28:1 ( = 0.123)
N5532A/B Option 518
10 MHz to 2 GHz < 1.10:1 ( = 0.048)
2 GHz to 18 GHz < 1.28:1 ( = 0.123)
N5532A/B Option 526
30 MHz to 2 GHz < 1.10:1 ( = 0.048)
2 GHz to 18 GHz < 1.28:1 ( = 0.123)
18 GHz to 26.5 GHz < 1.40:1 ( = 0.167)
N5532A/B Option 550
30 MHz to 2 GHz < 1.10:1 ( = 0.048)
2 GHz to 18 GHz < 1.28:1 ( = 0.123)
18 GHz to 26.5 GHz < 1.40:1 ( = 0.167)
26.5 GHz to 33 GHz < 1.55:1 ( = 0.216)
33 GHz to 40 GHz < 1.70:1 ( = 0.259)
40 GHz to 50 GHz < 1.75:1 ( = 0.272)
Description Specification Supplemental Information
402 Chapter 25

Measuring Receiver Personality
RF Power
Description Specification Supplemental Information
Zero Set and Measurement Noisea
a. Since Zero Set and Measurement Noise cannot be separated, the two components are combined as one error term.
N5532A/B Options 504, 518, 526 and 550 680 nW
Zero Drift of Sensors
N5532A/B Options 504, 518, 526 and 550 <100 nW (1 hour, at constant temperature after 24 hour warm-up)
RF Power Ranges of N5531S with N5532A/B Sensor Modules
20 dBm (10 W) to
+30 dBm (1 W)
One range for power sensors
Response Time (0 to 99% of reading) 150 ms number of averages (nominal)
Displayed Units Watts, dBm, or Volts
Chapter 25 403

Measuring Receiver Personality
RF Power
Power Reference (P-Series, EPM and EPM-P Series Specifications)
Description Specification Supplemental Information
Power Output Power output is traceable to the U.S. National Institute of Standards and Technology (NIST) and National Physical Laboratories (NPL), UK.
N1911A/N1912A 1.00 mW (0.0 dBm).Factory set to ±0.4%
N1913A/N1914A 1.00 mW (0.0 dBm).Factory set to ±0.4%
E4416A/E4417A 1.00 mW (0.0 dBm). Factory set to ±0.4%
E4418B/E4419B 1.00 mW (0.0 dBm). Factory set to ±0.4%
Accuracy
N1911A/N1912A ±0.4% for two years, 25 ± 10 °C
N1913A/N1914A ±0.4% for two years, 25 ± 10 °C
E4416A/E4417A ±0.6% for two years, 25 ± 10 °C
E4418B/E4419B ±0.6% for two years, 25 ± 10 °C
Frequency 50 MHz (nominal)
SWR
N1911A/N1912A < 1.05:1 (typical)
N1913A/N1914A 1.08:1 < 1.05:1 (typical)
E4416A/E4417A < 1.06:1 (nominal)
E4418B/E4419B < 1.05:1 (nominal)
Front Panel Connector Type N (f), 50
404 Chapter 25

Measuring Receiver Personality
Tuned RF Level Specification Nomenclature
Tuned RF Level Specification Nomenclature
The tuned RF level measurement uncertainty is represented primarily by two regions. For high signal-to-noise (S/N) measurements, the uncertainty is dominated by the linearity of the measuring receiver. For low S/N measurements, the measurement uncertainty is dominated by the noise of the measuring receiver being added to the measured signal. The input power level at which the uncertainty switches from linearity dominated to noise dominated is labeled as “Residual Noise Threshold.” The minimum power level is defined as the noise floor of the measuring receiver system.
Additionally, there are 2 range-to-range change uncertainties known as “Range 2 Uncertainty” and “Range 3 Uncertainty”, respectively. Range 2 Uncertainty occurs when the measuring receiver switches from Range 1 to Range 2, and Range 3 Uncertainty from Range 2 to Range 3. They are additive uncertainties applied to all measurements whose input powers across “Range Switch Level”.
Measurement Uncertainty vs. Input Power Relationship
Chapter 25 405

Measuring Receiver Personality
Tuned RF Level
Tuned RF Level
Additional Definitions and Requirements
PSA Option 123 is required to perform “Tuned RF Level” measurements above 3 GHz
These specifications are valid when the measuring receiver input is a CW tone and operating temperature is within the range of 20 to 30 C.
Absolute and relative accuracy specifications do not include mismatch uncertainty.
Specifications in the following tables apply when measuring stable frequency sources, and where the source and measuring receiver share a common frequency reference.
PSA Firmware VersionA.11.13 is required when using the N5532B power sensor
PSA Firmware Version A.11.21 is required when using the N1913A/N1914A power meters
NOTE For sources with frequency instability greater than 100 kHz, use the Tuned RF Level with Tracking measurement. When using the Tuned RF Level with Tracking measurement, the following additional amplitude error must be applied due to FFT frequency response as the signal drifts within the Tracking Range:
+/-(0.15 dB + 0.1 dB/MHz of span) to a max of +/-0.40 dB, where span is equivalent to the Tracking Range setting in the measurement.
The Tuned RF Level with Tracking measurement upper frequency limit = 3.05 GHz.
Minimum power = 10*log[Integrated BW/(75 Hz*1.06)], relative to the specified 75 Hz minimum power level.
406 Chapter 25

Measuring Receiver Personality
Tuned RF Level
Description SpecificationSupplemental Information
Power Range
Maximum power
Preamp off +30 dBm
Preamp on +16 dBm
Minimum power (dBm)a Frequency Range
a. With 30 kHz and 200 kHz IF bandwidths (IFBW), TRFL minimum power level will be degraded by a factor of 10*log (IFBW/75 Hz), relative to the specified 75 Hz minimum power level. This will result in a degradation of 26 dB for the 30 kHz IF bandwidth and 34 dB for the 200 kHz IF bandwidth.
75 Hz IFBW 10 Hz IFBWb c
b. With 10 Hz IFBW setting selected, the measurement automatically switches the IFBW to the 1 Hz set-ting for SNR values <10 dB.
c. For instrument with serial number prefix below US/MY4615, the minimum power level in 10 Hz IFBW setting is 10 dB higher than the values shown here. However, if the PSA contains option 107, the values shown in the table still apply.
E4443A/45A/40A
Preamp uninstalled
Preamp
installedd
d. In the frequency range of 100 kHz to 3.05 GHz, the minimum power specifications with “Preamp installed” are presented in two values: A/B, where value A is for the PSA installed with Option 1DS, and value B is for the PSA installed with Option 110. Furthermore, in the frequency range of 100 kHz and 10 MHz, Option 110 is turned off for these measurements. Option 1DS only covers frequency range of 100 kHz and 3.05 GHz, whereas Option 110 covers up to the maximum frequency of the PSA base instrument. Those two preamplifier options can not coexist in a same PSA instrument.
Preamp uninstalled
Preamp
installed d
100 kHz to 2 MHz 110 124/110 129 140/129 Band 0
2 to 10 MHz 115 131/115 134 140/134 Band 0
10 MHz to 3.05 GHz 117 134/133 136 140/140 Band 0
3.05 to 6.6 GHz 117 117/127 136 136/140 Band 1
6.6 to 13.2 GHz 108 108/116 127 127/135 Band 2
13.2 to 19.2 GHz 100 100/110 119 119/129 Band 3
19.2 to 26.5 GHz 93 93/102 112 112/121 Band 4
Chapter 25 407

Measuring Receiver Personality
Tuned RF Level
Description SpecificationSupplemental Information
Minimum Power (dBm)a Frequency Range
a. With 30 kHz and 200 kHz IF bandwidths (IFBW), TRFL minimum power level will be degraded by a factor of 10*log (IFBW/75 Hz), relative to the specified 75 Hz minimum power level. This will result in a degradation of 26 dB for the 30 kHz IF bandwidth and 34 dB for the 200 kHz IF bandwidth.
75 Hz IFBW 10 Hz IFBW b c
b. With 10 Hz IFBW setting selected, the measurement automatically switches the IFBW to the 1 Hz set-ting for SNR values <10 dB.
c. For instrument with serial number prefix below US/MY4615, the minimum power level in 10 Hz IFBW setting is 10 dB higher than the values shown here. However, if the PSA contains option 107, the values shown in the table still apply.
E4447A/46A/48A
Preamp uninstalled
Preamp
installedd
d. In the frequency range of 100 kHz to 3.05 GHz, the minimum power specifications with “Preamp installed” are presented in two values: A/B, where value A is for the PSA installed with Option 1DS, and value B is for the PSA installed with Option 110. Furthermore, in the frequency range of 100 kHz and 10 MHz, Option 110 is turned off for these measurements. Option 1DS only covers frequency range of 100 kHz and 3.05 GHz, whereas Option 110 covers up to the maximum frequency of the PSA base instrument. Those two preamplifier options can not coexist in a same PSA instrument.
Preamp uninstalled
Preamp
installed d
100 kHz to 2 MHz 110 124/110 129 140/129 Band 0
2 to 10 MHz 115 131/115 134 140/134 Band 0
10 MHz to 3.05 GHz 117 134/133 136 140/140 Band 0
3.05 to 6.6 GHz 114 114/126 133 133/140 Band 1
6.6 to 13.2 GHz 111 111/123 130 130/140 Band 2
13.2 to 19.2 GHz 109 109/118 128 128/137 Band 3
19.2 to 26.5 GHz 97 97/104 116 116/123 Band 4
26.5 to 31.15 GHz 98 98/103 117 117/122 Band 5
31.15 to 41 GHz 87 87/91 106 106/110 Band 6
41 to 45 GHz 81 81/81 100 100/100 Band 7
45 to 50 GHz 69 69/69 88 88/88 Band 7
408 Chapter 25

Measuring Receiver Personality
Tuned RF Level
Description SpecificationSupplemental Information
Linearity (0.009 dB + 0.005 dB/10 dB stepa)
a. “Step” in this specification refers to the difference between relative measurements, such as might be experienced by stepping a stepped attenuator. Therefore, this accuracy is computed by adding the uncertainty for each full or partial 10 dB step to the other uncertainty term. For example, if the two lev-els whose relative level is to be determined differ by 15 dB, consider that to be a difference of two 10 dB steps. The accuracy specification would be (0.009+2(0.005)) or 0.019 dB.
Refer to “Relative Fidelity” on page 70 in the PSA base specifications for special circumstances.
Relative Measurement Accuracy
Residual noise thresholdb to Max power
b. The residual noise threshold power is the power level at which the signal-to-noise ratio (SNR) becomes the dominant contributor to the measurement uncertainty. See the "Tuned RF Level Specification Nomenclature" section.
(0.015 dB + 0.005 dB/10 dB step a) c d (nom.)
c. Immediately following the system alignments, the measurement is made by manually setting frequency to that of the signal-under-test, “Accuracy” mode to “High”, and “Measure Control” to “Single”. For the E4446A/E4447A/E4448A, if the change of measured frequency crosses frequency bands, allow 10 minutes for thermal stability before taking the first measurement within the new band. (Refer to previ-ous page in the column of “Supplemental Information” for definitions of frequency bands for the E4446A/E4447A/E4448A).
d. This includes the linearity accuracy.
Minimum power to residual noise threshold
(cumulative errore + 0.0012 (Input Power
Residual Noise Threshold Power)2)
e. In relative accuracy of TRFL measurements, the “cumulative error” is the error incurred when stepping from a higher power level to the Residual Noise Threshold Power level. The formula to calculate the cumulative error is (0.015 dB + 0.005 dB/10 dB step). For example, assume the higher level starting power is 0 dBm and the calculated Residual Noise Threshold Power is 99 dBm. The cumulative error would be (0.015 + 99/10 0.005 dB), or 0.065 dB, where x is a ceiling function that means the smallest integer not less than x.
Residual Noise Threshold Power (dBm)
Residual Noise Threshold Power = Minimum Power +30 dB
Range 2 Uncertaintyf
f. Add this specification when the Measuring Receiver enters the “Range 2” state. Range 2 is entered when the “Range 1” signal-to-noise ratio (SNR) falls between 50 and 28 dB. The SNR value is tuning band dependent. A prompt of “Range 2” in the PSA display will indicate that the Measuring Receiver is in Range 2.
0.031 dB
Range 3 Uncertaintyg
g. Add this specification in addition to “Range 2 Uncertainty” when the Measuring Receiver software enters the “Range 3” state. Range 3 is entered when the “Range 2” SNR falls between 50 and 28 dB. The SNR value is tuning band dependent. A prompt of “Range 3” in the PSA display will indicate that the Measuring Receiver is in Range 3.
0.031 dB
Chapter 25 409
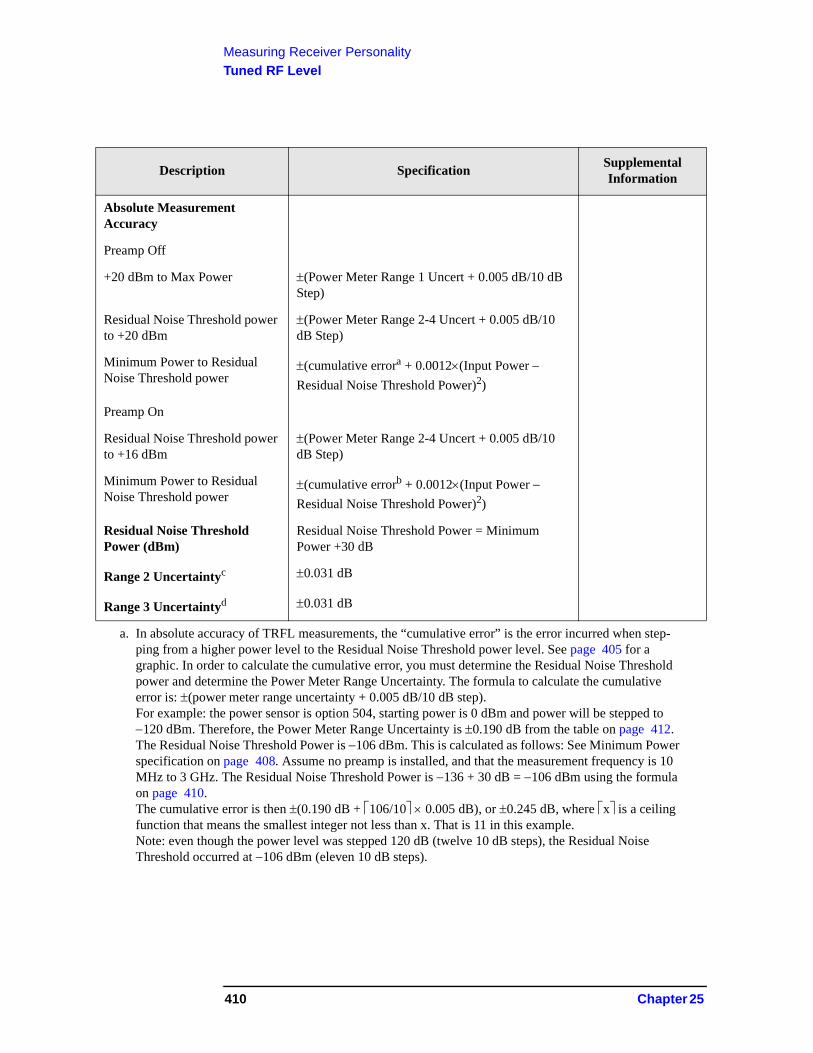
Measuring Receiver Personality
Tuned RF Level
Description SpecificationSupplemental Information
Absolute Measurement Accuracy
Preamp Off
+20 dBm to Max Power (Power Meter Range 1 Uncert + 0.005 dB/10 dB Step)
Residual Noise Threshold power to +20 dBm
(Power Meter Range 2-4 Uncert + 0.005 dB/10 dB Step)
Minimum Power to Residual Noise Threshold power
(cumulative errora + 0.0012(Input Power
Residual Noise Threshold Power)2)
a. In absolute accuracy of TRFL measurements, the “cumulative error” is the error incurred when step-ping from a higher power level to the Residual Noise Threshold power level. See page 405 for a graphic. In order to calculate the cumulative error, you must determine the Residual Noise Threshold power and determine the Power Meter Range Uncertainty. The formula to calculate the cumulative error is: (power meter range uncertainty + 0.005 dB/10 dB step).For example: the power sensor is option 504, starting power is 0 dBm and power will be stepped to 120 dBm. Therefore, the Power Meter Range Uncertainty is 0.190 dB from the table on page 412.The Residual Noise Threshold Power is 106 dBm. This is calculated as follows: See Minimum Power specification on page 408. Assume no preamp is installed, and that the measurement frequency is 10 MHz to 3 GHz. The Residual Noise Threshold Power is 136 + 30 dB = 106 dBm using the formula on page 410.The cumulative error is then (0.190 dB + 106/10 0.005 dB), or 0.245 dB, where x is a ceiling function that means the smallest integer not less than x. That is 11 in this example.Note: even though the power level was stepped 120 dB (twelve 10 dB steps), the Residual Noise Threshold occurred at 106 dBm (eleven 10 dB steps).
Preamp On
Residual Noise Threshold power to +16 dBm
(Power Meter Range 2-4 Uncert + 0.005 dB/10 dB Step)
Minimum Power to Residual Noise Threshold power
(cumulative errorb + 0.0012(Input Power
Residual Noise Threshold Power)2)
Residual Noise Threshold Power (dBm)
Residual Noise Threshold Power = Minimum Power +30 dB
Range 2 Uncertaintyc 0.031 dB
Range 3 Uncertaintyd 0.031 dB
410 Chapter 25

Measuring Receiver Personality
Tuned RF Level
b. In absolute accuracy of TRFL measurements, the “cumulative error” is the error incurred when step-ping from a higher power level to the Residual Noise Threshold power level. See page 405 for a graphic. In order to calculate the cumulative error, you must determine the Residual Noise Threshold power and determine the Power Meter Range Uncertainty. The formula to calculate the cumulative error is: (power meter range uncertainty + 0.005 dB/10 dB step).For example: the power sensor is option 504, starting power is 0 dBm and power will be stepped to 120 dBm. Therefore, the Power Meter Range Uncertainty is 0.190 dB from the table on page 412.The Residual Noise Threshold Power is 110 dBm. This is calculated as follows: See Minimum Power specification on page 408. Assume a preamp is installed and is On, and that the measurement fre-quency is 10 MHz to 3 GHz. The Residual Noise Threshold Power is 140 + 30 dB = 110 dBm using the formula on page 410.The cumulative error is then (0.190 dB + 110/10 0.005 dB), or 0.245 dB, where x is a ceiling function that means the smallest integer not less than x. That is 11 in this example.
c. Add this specification when the Measuring Receiver enters the “Range 2” state. Range 2 is entered when the “Range 1” signal-to-noise ratio (SNR) falls between 50 and 28 dB. The SNR value is tuning band dependent. A prompt of “Range 2” in the PSA display will indicate that the Measuring Receiver is in Range 2.
d. Add this specification in addition to “Range 2 Uncertainty” when the Measuring Receiver software enters the “Range 3” state. Range 3 is entered when the “Range 2” SNR falls between 50 and 28 dB. The SNR value is tuning band dependent. A prompt of “Range 3” in the PSA display will indicate that the Measuring Receiver is in Range 3.
Chapter 25 411

Measuring Receiver Personality
Tuned RF Level
Description Specification Supplemental Information
Power Meter Range Uncertainty
Typicals
Power Meter Range 1 Uncertainty (dB)
Sensor module options Sensor module options
+20 to +30 dBm #504 #518 #526 #550 #504 #518 #526 #550
100 kHz fc 10 MHz 0.356 0.182
10 MHz < fc 30 MHz 0.356 0.361 0.182 0.185
30 MHz < fc 2 GHz 0.356 0.361 0.361 0.361 0.182 0.185 0.185 0.185
2 GHz < fc 4.2 GHz 0.356 0.392 0.422 0.367 0.182 0.201 0.217 0.188
4.2 GHz < fc 18 GHz 0.400 0.422 0.367 0.205 0.217 0.188
18 GHz < fc 26.5 GHz 0.480 0.387 0.247 0.199
26.5 GHz < fc 50 GHz 0.420 0.216
Power Meter Range 2 Uncertainty (dB)
Sensor module options Sensor module options
0 to < +20 dBm #504 #518 #526 #550 #504 #518 #526 #550
100 kHz fc 10 MHz 0.190 0.097
10 MHz < fc 30 MHz 0.190 0.200 0.097 0.101
30 MHz < fc 2 GHz 0.190 0.200 0.200 0.200 0.097 0.101 0.101 0.101
2 GHz < fc 4.2 GHz 0.190 0.255 0.301 0.212 0.097 0.130 0.154 0.108
4.2 GHz < fc 18 GHz 0.267 0.301 0.212 0.136 0.154 0.108
18 GHz < fc 26.5 GHz 0.380 0.247 0.195 0.126
26.5 GHz < fc 50 GHz 0.297 0.152
412 Chapter 25

Measuring Receiver Personality
Tuned RF Level
Description Specification Supplemental Information
Power Meter Range Uncertainty
Typicals
Power Meter Range 3 Uncertainty (dB)
Sensor module options Sensor module options
–5 to < 0 dBm #504 #518 #526 #550 #504 #518 #526 #550
100 kHz fc 10 MHz 0.207 0.105
10 MHz < fc 30 MHz 0.207 0.216 0.105 0.110
30 MHz < fc 2 GHz 0.207 0.216 0.216 0.216 0.105 0.110 0.110 0.110
2 GHz < fc 4.2 GHz 0.207 0.268 0.311 0.227 0.105 0.136 0.159 0.116
4.2 GHz < fc 18 GHz 0.279 0.311 0.227 0.142 0.159 0.116
18 GHz < fc 26.5 GHz 0.388 0.241 0.199 0.123
26.5 GHz < fc 50 GHz 0.333 0.170
Power Meter Range 4 Uncertainty (dB)
Sensor module options Sensor module options
–10 to < –5 dBm #504 #518 #526 #550 #504 #518 #526 #550
100 kHz fc 10 MHz 0.421 0.216
10 MHz < fc 30 MHz 0.421 0.425 0.216 0.219
30 MHz < fc 2 GHz 0.421 0.425 0.425 0.425 0.216 0.219 0.219 0.219
2 GHz < fc 4.2 GHz 0.421 0.452 0.477 0.431 0.216 0.233 0.246 0.221
4.2 GHz < fc 18 GHz 0.458 0.477 0.431 0.236 0.246 0.221
18 GHz < fc 26.5 GHz 0.528 0.438 0.273 0.225
26.5 GHz < fc 50 GHz 0.491 0.253
Chapter 25 413

Measuring Receiver Personality
Tuned RF Level
Information about Residuals
• As the DANL (displayed average noise level) of a spectrum analyzer becomes very low, it can reveal “residuals”. These occur at discrete frequencies and arise from the various clocks and other components of the local oscillators. This is true for ALL modern spectrum analyzers. The residuals specification for the PSA Series is 100 dBm. Please take this information into consideration when you measure the TRFL level below 100 dBm. A user may apply a 50 ohm terminator to the PSA “RF input” connector and switch to the “spectrum analysis” mode to verify the PSA residuals.
• The power meter and sensor module (N5532A/B) combination may generate a residual of around 100 dBm or lower at frequency of 50 MHz and its harmonics. Please take this information into consideration when you use the N5532A/B to measure the TRFL level below 100 dBm at 50 MHz and its second or third harmonic.
Description Specification Supplemental Information
Operating Frequency Range
E4443A/45A/40A/47A/46A/48A 100 kHz to 3 GHz
E4443A/45A/40A/47A/46A/48A 3 to 6.7 GHz Requires Option 123
E4445A/40A/47A/46A/48A 6.7 to 13.2 GHz Requires Option 123
E4440A/47A/46A/48A 13.2 to 26.5 GHz Requires Option 123
E4447A/46A/48A 26.5 to 42.98 GHz Requires Option 123
E4446A/48A 42.98 to 44 GHz Requires Option 123
E4448A 44 to 50 GHz Requires Option 123
Displayed Units
Absolute Watts, dBm, or Volts
Relative Percent or dB
Displayed Resolution 6 digits in watts or 5 digits in volts mode
0.001 dB in dBm or dB (relative) mode
Input SWR See “RF Power” on page 400.
414 Chapter 25

Measuring Receiver Personality
Tuned RF Level
Graphical Relative Measurement Accuracy Specifications (Nominal)
E4440A, E4443A, E4445AIFBW = 10 HzPA On: Option 110 (Internal preamp) installedSensor Module (N5532A/B-504 or N5532A/B-526) Included
E4446A, E4447A, E4448AIFBW = 10 HzPA On: Option 110 (Internal preamp) InstalledSensor Module (N5532A/B-504 or N5532A/B-550) Included
Chapter 25 415

Measuring Receiver Personality
Tuned RF Level
416 Chapter 25