Embed Size (px)
Citation preview
Proximity and the Evolution of CollaborationNetworks: Evidence from Research andDevelopment Projects within the Global
Navigation Satellite System (GNSS) Industry
PIERRE-ALEXANDRE BALLANDLaboratoire d’études et de recherches sur l’économie, les politiques et les systèmes sociaux (LEREPS), University of Toulouse,
Manufacture des tabacs, 21 allée de Brienne, F-31000 Toulouse, France. Email: [email protected]
(Received November 2009: in revised form September 2010)
BALLAND P.-A. Proximity and the evolution of collaboration networks: evidence from research and development projects withinthe global navigation satellite system (GNSS) industry, Regional Studies. This paper analyses the influence of proximity on the evol-ution of collaboration networks. It determines empirically how organizations choose their partners according to their geographical,cognitive, organizational, institutional and social proximity. Relational databases are constructed from research and developmentcollaborative projects, funded under the European Union 6th Framework Programme within the global navigation satellite system(GNSS) industry from 2004 to 2007. The stochastic actor-based model SIENA is used to model the network dynamic as a realiz-ation of a continuous-time Markov chain and to estimate parameters for underlying mechanisms of its evolution. Empirical resultsshow that geographical, organizational and institutional proximity favour collaborations, while cognitive and social proximity donot play a significant role.
Collaboration networks Proximity Economic geography Dynamic network models Global navigation satellite system(GNSS)
BALLAND P.-A.相似性以及协作网络的演进:来自全球导航卫星系统产业研究及发展项目的相关证据,区域研究。本文分析了相似性在协作网络演进过程中的作用。这一研究从经验层面上考察了不同的组织是如何根据地理的、认知
的、组织学的、制度的以及社会的相似性来选择合作伙伴的。2004-2007 年间欧盟全球导航卫星系统产业的第六次
框架计划资助了一系列研究及发展项目,基于上述研究及项目我们构建了相关的数据库。我们利用随机的行为者模型 SIENA 来模型化了网络活力,以实现连续的 Markov 链同时估测了影响其演进机制的相关变量。经验结果表明,地理的、组织的以及制度的相似性会促进协作的产生,而认知与空间的相似性作用并不显著。
协作网络 相似性 经济地理学 活力网络模型 全球导航卫星系统 (GNSS)
BALLAND P.-A. La proximité et l’évolution des réseaux de collaboration: des preuves provenant des projets de R et D au sein del’industrie du système global de navigation par satellite (GNSS), Regional Studies. Ce papier analyse l’influence de la proximité surl’évolution des réseaux de collaboration. Il détermine empiriquement la façon dont les organisations choisissent leurs partenaires enfonction de leur proximité géographique, cognitive, organisationnelle, institutionnelle et sociale. Les bases de données relationnellessont construites à partir des projets collaboratifs de R&D financés par le 6ème ProgrammeCadre deRecherche et de Développementde l’Union Européenne, dans la navigation par satellite (GNSS) de 2004 à 2007. Le modèle stochastique orienté par l’acteur SIENAest utilisé pour modéliser la dynamique du réseau par une chaîne deMarkov en temps continu et pour estimer les paramètres liés auxmécanismes de son évolution. Les résultats empiriques montrent que les dimensions de proximité géographique, organisationnelleet institutionnelle favorisent les collaborations, tandis que les formes de proximité cognitive et sociale ne jouent pas un rôlesignificatif.
Réseaux de collaboration Proximité Économie géographique Modèles de réseaux dynamiques Système global denavigation par satellite (GNSS)
BALLAND P.-A. Nähe und Entstehen von kooperativen Netzwerken: Belege aus Forschungs- und Entwicklungsprojekten inner-halb der Branche des globalen Navigationssatellitensystems (GNSS), Regional Studies. In diesem Beitrag wird der Einfluss der Näheauf das Entstehen von kooperativen Netzwerken untersucht. Auf empirische Weise wird ermittelt, wie sich Firmen ihre Partner jenach ihrer geografischen, kognitiven, organisationellen, institutionellen und sozialen Nähe aussuchen. Auf der Grundlage vonkooperativen Forschungs- und Entwicklungsprojekten innerhalb der Branche des globalen Navigationssatellitensystems (GNSS)
Regional Studies, Vol. 46.6, pp. 741–756, June 2012
0034-3404 print/1360-0591 online/12/060741-16 © 2012 Regional Studies Association http://dx.doi.org/10.1080/00343404.2010.529121http://www.regionalstudies.org
Do
wn
load
ed b
y [
Un
iver
sity
Lib
rary
Utr
ech
t] a
t 2
3:5
6 0
3 J
un
e 2
01
2
im Zeitraum von 2004 bis 2007, die unter dem 6. Rahmenprogramm der Europäischen Union finanziert wurden, werden rela-tionale Datenbanken aufgebaut. Zur Modellierung der Netzwerkdynamik als Realisierung einer zeitlich kontinuierlichenMarkow-Kette und zur Schätzung der Parameter für die zugrundeliegenden Mechanismen ihrer Entstehung kommt das stochas-tische, akteurbasierte SIENA-Modell zum Einsatz. Aus den empirischen Ergebnissen geht hervor, dass eine geografische, organi-sationelle und institutionelle Nähe die Zusammenarbeit fördert, während die kognitive und soziale Nähe keine signifikante Rollespielt.
Kooperative Netzwerke Nähe Wirtschaftsgeografie Dynamische Netzwerkmodelle Globales Navigationssatelliten-system (GNSS)
BALLAND P.-A. Proximidad y la evolución de las redes de colaboración: evidencias de proyectos de investigación y desarrollo en laindustria del sistema global de navegación por satélite (GNSS), Regional Studies. En este artículo se analiza la influencia de la pro-ximidad en la evolución de las redes de colaboración. Se determina empíricamente cómo las organizaciones eligen sus socios enfunción de su proximidad geográfica, cognitiva, organizativa, institucional y social. Se construyen bases de datos relacionados apartir de proyectos colaboradores de investigación y desarrollo financiados bajo el sexto programa marco de la Unión Europeaen la industria del sistema global de navegación por satélite (GNSS) de 2004 a 2007. Se utiliza el enfoque estocástico SIENAbasado en actores para modelar la dinámica de redes como realización de una cadena Markov de tiempo continuo y calcularlos parámetros de los mecanismos subyacentes de su evolución. Los resultados empíricos muestran que la proximidad geográfica,organizativa e institucional favorece las colaboraciones mientras que la proximidad cognitiva y social no desempeña un papelsignificativo.
Redes de colaboración Proximidad Geografía económica Modelos de redes dinámicas Sistema global de navegaciónpor satélite (GNSS)
JEL classifications: O32, R12
INTRODUCTION
Increasing attention has been given recently to under-stand how networks affect organizational performancein innovation studies (AHUJA, 2000; GAY andDOUSSET, 2005; SCHILLING and PHELPS, 2007;BOSCHMA and TER WAL, 2007). This interest has con-tributed to a better understanding of innovative activityand clustering processes (SUIRE and VICENTE, 2009).Surprisingly, the main drivers of the evolution of inno-vation networks have been neglected, and they stillremain unclear. By using network indicators, such ascentrality, reachability, brokerage or structural charac-teristics as independent variables, attention has beenfocused on organizational performance. This hasstrongly contributed to a consideration of the networkas a black box, similar to localized knowledge spilloversin the geography of innovation (BRESCHI and LISSONI,2001). Indeed, the network is seen as an independentvariable with a given structure and given positions ofactors, but little attention is devoted to the underlyingmechanisms of their morphogenesis (COHENDET
et al., 2003).Thus, even if different disciplines have recently con-
tributed to identify patterns of relational change inorganizational networks, these mechanisms still remainunclear. The influences of individual characteristics oforganizations on collaboration choices have been ana-lysed in economics (D’ASPREMONT and JACQUEMIN,1988; CASSIMAN and VEUGELERS, 2002), andespecially the importance of absorptive capacity(COHEN and LEVINTHAL, 1990) has been highlighted
in recent empirical approaches (GIULIANI and BELL,2005; BOSCHMA and TER WAL, 2007). Followingthe seminal contributions on endogenous structuraleffects of network changes in sociology and physics,GLÜCKLER (2007), GIULIANI and BELL (2008) andTER WAL (2009) tried to analyse the path-dependentevolution of network structures. Beyond individualand structural characteristics, the ambiguous effects ofproximity need to be clarified and a start made oninvestigating them theoretically (BOSCHMA, 2005;KNOBEN and OERLEMANS, 2006) and empirically(AUTANT-BERNARD et al., 2007; PONDS et al., 2007;TER WAL, 2009; SCHERNGELL and BARBER, 2010).
BOSCHMA and FRENKEN (2009) identify thisresearch question as being crucial for evolutionary econ-omic geography and they propose a theoretical frame-work in order to link proximity concepts (BELLET
et al., 1993; RALLET and TORRE, 2001; BOSCHMA,2005; CARRINCAZEAUX et al., 2008) and the evolutionof innovation networks (SNIJDERS, 2001; GLÜCKLER,2007). Other contributions relating proximity conceptsand inter-organizational collaborations appearedwith papers analysing how geographical proximityfacilitates face-to-face interactions (BOSCHMA, 2005;WETERINGS, 2005). The influence of proximity is inthis sense close to the homophily effect (MCPHERSON
et al., 2001; POWELL et al., 2005), where actors are sup-posed to interact more with others when they sharesimilar attributes. Proximity researchers have producedmany theoretical propositions in order to definevarious forms of proximity and their articulation. This
742 Pierre-Alexandre Balland
Do
wn
load
ed b
y [
Un
iver
sity
Lib
rary
Utr
ech
t] a
t 2
3:5
6 0
3 J
un
e 2
01
2

paper uses the analytical distinction in five dimensionsproposed by BOSCHMA (2005). Proximity betweenorganizations can thus relate to their spatial area(geographical), their knowledge bases (cognitive), theircorporate group (organizational), their institutionalform (institutional) and, finally, their social network(social). This paper contributes to this ongoing debateby determining empirically how organizations choosetheir partners according to their geographical, organiz-ational, institutional, cognitive and social proximity.
Measuring proximity (NOOTEBOOM, 2000; BOUBA-OLGA and ZIMMERMANN, 2004; POWELL et al., 2005;CANTNER and GRAF, 2006; CARRINCAZEAUX et al.,2008; MASSARD and MEHIER, 2009) and obtainingappropriated data represents an empirical challenge foreach form of proximity. In order to explain the respect-ive influence of the proximity dimensions, a major issueof this paper is dedicated to measuring proximity andanalysing what happens when each form controls theeffect of the four others. Doing this, the paper aims toclarify the influence of each form of proximity on theevolution of the Global Navigation Satellite Systems(GNSS) collaboration network. The relational databaseis constructed from publicly available information aboutresearch and development collaborative projects of the6th European Union Framework Programme withinthe GNSS industry (FP6). Patterns of evolution aredetermined according to a longitudinal study of the rela-tional changes that occurred between four consecutiveyears, from 2004 to 2007. This paper models networkchanges as an evolutionary process, driven by theactors and the overall structure. It uses a statisticalmodel specifically designed to deal with the complexityof network dynamics: the stochastic actor-based modelSIENA (SNIJDERS, 2001) that has already providednew insights in economic geography (GIULIANI andBELL, 2008; TER WAL, 2009). More precisely, theGNSS collaboration network dynamic is modelled as arealization of a continuous-time Markov chain(NORRIS, 1997), and parameters for underlying mech-anisms of its evolution are estimated with the method ofmoments, implemented by computer simulation.1
The paper is structured as follows. The secondsection is dedicated to the definition of proximityretained in this paper. It presents theoretically geo-graphical, organizational, institutional, cognitive andsocial proximity, and elaborates propositions abouttheir respective influence on the evolution of collabor-ation networks. The third section describes the originand nature of the relational data. It details specificitiesof the GNSS industry, but also how data are collectedand how the sample is constructed. The fourth sectionfocuses on the methodology employed for the longi-tudinal data analysis, describing how the networkdynamic is modelled by the stochastic actor-basedmodel SIENA. The fifth section particularly insists onthe operationalization of the forms of proximity andon the specification of the model. The main empirical
results of the model are discussed in the sixth section.Open questions and future research agenda concludein the seventh section.
HOW PROXIMITY INFLUENCES THE
EVOLUTION OF COLLABORATION
NETWORKS
Various definitions and typologies of proximity havebeen discussed in order to provide a better understand-ing of coordination processes of economic activities.Institutions are highlighted in the first typology(BELLET et al., 1993), where three types of proximity:geographical, organizational and institutional, aredefined. Interactions between actors matter more in asecond approach (RALLET and TORRE, 2001), whichexamines geographical and organized proximity inorder to insist on the link between a geographicnotion and a relational one. This paper retains a thirdapproach, based on the analytical distinction proposedby BOSCHMA (2005). It distinguishes five dimensions:geographical, cognitive, organizational, institutionaland social proximity.
Geographical proximity
Geographical proximity refers to the spatial separationbetween actors (GILLY and TORRE, 2000), and it is sup-posed to enhance face-to-face interactions (BOSCHMA,2005). In its simplest form geographical proximity isdefined by the physical distance that separates twoorganizations, and it can be measured by a metricsystem (miles or kilometres) or by using travel times.Recently, authors have distinguished co-location andgeographical proximity in order to specify that organiz-ations can share geographical proximity without beingco-located (meeting, visit or conference) by using tem-porary geographical proximity (TORRE, 2008). Thispaper adopts an approach where geographical proximityrefers to the actors’ perception of their spatial area(BOUBA-OLGA and GROSSETTI, 2008), often expressedaccording to the boundaries of their country or theirregions. Geographical proximity is in this sense closerto a perspective of co-location of the organizations.Beyond material reasons, such as reducing transportcost or providing the utilization of same technologicalplatforms, strong relations exist between geographicalproximity and the diffusion of knowledge(AUDRETSCH and FELDMAN, 1996). The main under-lying mechanism is that tacit knowledge, a key driverof innovation processes, is less likely to be transferredwithin distant collaborations (HOWELLS, 2002). Inaddition, geographical proximity plays a more indirectrole in knowledge transfer by strengthening the otherdimensions of proximity (BOSCHMA, 2005). Followingthis, a first proposition will be tested:
Proximity and the Evolution of Collaboration Networks 743
Do
wn
load
ed b
y [
Un
iver
sity
Lib
rary
Utr
ech
t] a
t 2
3:5
6 0
3 J
un
e 2
01
2
Proposition 1. Organizations are more likely to interact when theybelong to the same spatial area, that is, when they share ageographical proximity.
Cognitive proximity
Cognitive proximity refers to the degree of similitude ofthe knowledge bases of organizations (NOOTEBOOM,2000), and it is necessary to communicate and transferknowledge between partners (KNOBEN andOERLEMANS, 2006). Nevertheless, organizationscollaborate in order to access external knowledge,which requires a certain degree of cognitive distancebetween both partners. It leads to a trade-off betweennovelty (cognitive distance of knowledge bases) andcommunication (cognitive proximity of knowledgebases), illustrated by the existence of an optimalcognitive distance (NOOTEBOOM, 2000) which willensure novelty but also effective communication.Thus, cognitive proximity is certainly the most decisivedimension observed by organizations when they selecttheir future partners (ANTONELLI, 2000; BOSCHMA
and FRENKEN, 2009). This paper retains a definitionof cognitive proximity based on the kind of knowledgedeveloped, through a competencies matrix, in order toanalyse if organizations have a preference for the sameor different knowledge bases. This methodology hasalready been used for the GNSS industry by VICENTE
et al. (2010). Testing the preference for the sameknowledge bases, a second proposition is elaborated:
Proposition 2. Organizations are more likely to interact when theyhave the same knowledge bases, that is, when they share a cogni-tive proximity.
Organizational proximity
Organizational proximity is defined as the degree ofstrategic interdependence between two organizations,and it reduces uncertainty about the behaviour of thefuture partner (BOSCHMA, 2005). The literature pro-vides two major definitions of this concept, whichsometimes can lead to ambiguity. The first refers to arelational space, in opposition to a geographical one,and it is defined by interactions of different nature(RALLET and TORRE, 2001). The present paper pro-poses a definition based on the second approach,where organizational proximity does not refer to collab-oration networks (the dependent variable in this paper)or social networks (social proximity in this paper). It isunderstood as a specific form of proximity amongfirms of the same corporate group, that is, withinparent companies, the subsidiaries and their differentestablishments. Therefore, two organizations can sharean organizational proximity without any innovative,collaborative or social interactions. The degree oforganizational proximity is defined by the degree ofautonomy and control induced by their link(BOSCHMA, 2005). When actors share a high degree
of organizational proximity, it is easier to avoid unin-tended knowledge spillovers and to reduce uncertainty.Thus, it can reduce costs of collaboration by providingthe easier exchange of engineers, working groups ormeetings. Finally, relevant information about theknowledge bases of both partners is also more easilyavailable, as described above with the definition ofcognitive proximity, which is crucial for good cognitivematching and efficient collaboration. These consider-ations lead to the third proposition:
Proposition 3. Organizations are more likely to interact withmembers of their corporate group, that is, when they share anorganizational proximity.
Institutional proximity
Institutional proximity is defined by the similarity ofinformal constraints and formal rules shared by actors(NORTH, 1990), where common representations,routines and incentives allow organizations to realizean efficient transfer of knowledge (KNOBEN and OER-
LEMANS, 2006). The institutional proximity is thuscomposed by formal institutions, like laws and rules,and informal institutions, close to the sociologicalnotion of habitus, which is a way of conduct constructedinvoluntarily through the socialization process. Follow-ing research on science–industry collaborations (LEVY
et al., 2009), this paper considers institutional proximityas belonging to the same institutional form. Thismeasure has already been proposed by PONDS et al.(2007), applying the triple helix model (ETZKOWITZ
and LEYDESDORFF, 2000), in order to distinguishamong industry, academia and government. Thispaper considers also the ‘public’ as a fourth helix(LEYDESDORFF and ETZKOWITZ, 2003) in order tointroduce the influence of non-profit organizations inknowledge creation. Organizations embedded in thesame institutional form share to some extent commonformal and informal institutions, making less easy collab-orations among organizations belonging to differentinstitutional forms. Indeed, both formal and informalinstitutions influence the coordination process of organ-izations (KIRAT and LUNG, 1999), especially in researchand development collaboration networks. Institutionalproximity facilitates communication, especially fororganizations that share and develop complex knowl-edge around collaborative projects. It leads one to testa fourth proposition:
Proposition 4. Organizations are more likely to interact when theyhave the same institutional form, that is, when they share an insti-tutional proximity.
Social proximity
Social proximity refers to the degree of commonrelationships, where friendship and trust are central,and it is supposed to diffuse informal knowledge and
744 Pierre-Alexandre Balland
Do
wn
load
ed b
y [
Un
iver
sity
Lib
rary
Utr
ech
t] a
t 2
3:5
6 0
3 J
un
e 2
01
2

facilitates collaborations (BOSCHMA and FRENKEN,2009). It refers to the intersection between social net-works of individuals of two organizations. Focusing onthe personal level is very relevant for understandingthe mechanisms that provide the diffusion of tacit,sometimes more or less secret, knowledge. Individualsembedded in a social network know each other person-ally (GRANOVETTER, 1985), which determines theiraccessibility to information exchange or technicaladvice (BRESCHI and LISSONI, 2009; GROSSETTI andBÈS, 2001). This paper focuses on social proximitycreated through collaborations between organizationsthemselves (AUTANT-BERNARD et al., 2007). It is sup-posed that their degree of social proximity decreaseswith their geodesic distance, that is, the shortest pathbetween two organizations in the overall network.More precisely, social proximity is considered via theinverse of the geodesic distance separating two organiz-ations (BOSCHMA and FRENKEN, 2009). In thisapproach, social proximity is close to the structuralmechanism of transitivity (DAVIS, 1970; HOLLAND
and LEINHARDT, 1971) which leads to networkclosure according to BOSCHMA and FRENKEN (2009):
the role of social proximity in the formation of networklinks relates to the concept of closure […] closure simplymeans that if two actors have a social distance of two,they have a higher probability of getting connected.
(p. 9)
Social proximity refers mainly to reputation and trusteffects created by the experience of past collaborationsand repeated contacts between partners. Thus, friend-ship, but mostly reputation and trust, contributes toprovide the diffusion of informal knowledge that leadsorganizations with a common partner to be morelikely to collaborate. Considering the social proximityinduced by a weak geodesic distance, a last propositionis elaborated:
Proposition 5. Partners of partners are more likely to interact thanothers, that is, social proximity favours collaboration.
Each of these five propositions will be tested empiricallyin order to clarify the respective influence of thedifferent dimensions of proximity on the evolution ofcollaboration networks. The next section describes thelongitudinal relational database.
DATA
Adequate data are often difficult to obtain for socialnetwork analysis (TER WAL and BOSCHMA, 2009),and it is obviously harder to gather longitudinal rela-tional data (BAUM et al., 2003). Relevant informationabout knowledge collaboration, especially when collab-orations start and finish, can be found in the databaseof the Framework Programmes (FPs) on research andtechnological development. Launched in 1984 by the
European Union, the FPs aim to fund transnationaland collaborative research and development projects inorder to support collaborative research and promote aEuropean research area, reaffirmed through the LisbonEuropean Council in March 2000. The paper focuseson the FP6 within the GNSS industry.
The GNSS industry
GNSS is a standard term used to describe systems thatprovide positioning and navigation solutions. Thesetechnologies were mainly developed in the aerospaceindustry for military reasons. Nowadays,2 in the techno-logical and symbolic paradigm of mobility, GNSS aretechnologies that find complementarities and inte-gration opportunities in many other technological andsocio-economic contexts. Indeed, GNSS industryrequires collaborations between public and privateorganizations, from different sectors, and so is character-ized by a large variety of knowledge background(VICENTE et al., 2010).
Actors of the GNSS industry are thus organizationswith heterogeneous institutional forms, big companies,small and medium-sized enterprises, research centres,agencies3 or non-profit organizations. Important organ-izations4 are the competitors Thales Alenia Space andEADS Astrium, national space agencies CNES5
(France) and DLR6 (Germany), and the EuropeanSpace Agency. Public actors are involved in the knowl-edge creation process around GNSS, because theirapplications are mostly dedicated to health, emergencyor social services. Besides, the Egnos programme andnow Galileo are political key issues to insure a Europeanindependence of navigation satellite systems, especiallyconsidering the American global positioning satellite(GPS).
The geography of the GNSS industry crosses nationalboundaries, and more generally space industry has his-torically developed research collaboration amongorganizations from different European countries.Especially France and Germany for the beginning, andnow Spain, England, the Netherlands and Italy havealso strong competencies and collaborate in the GNSScomposite knowledge dynamic. BALLAND et al. (2010)identified the seven main GNSS clusters in Europein the regions of Midi-Pyrénées, Upper Bavaria, Île-de-France, Inner London, Community of Madrid,Tuscany and Lazio.
Data collection
Aiming to study the evolution of collaboration net-works in the GNSS industry, these databases are parti-cularly relevant for at least two reasons related to thehistory of the space industry. Firstly, since the end ofthe 1950s space organizations are used to working onprojects. Each satellite is a project in itself and also aunique product which makes it difficult to produce it
Proximity and the Evolution of Collaboration Networks 745
Do
wn
load
ed b
y [
Un
iver
sity
Lib
rary
Utr
ech
t] a
t 2
3:5
6 0
3 J
un
e 2
01
2
intensively in a standardized production chain. Sec-ondly, space organizations are used to work underfunded projects or programmes because space explora-tion has always been a very strategic issue for countries.Data can be directly collected from the database ofinformation services of the European Commission, pub-licly available on the Cordis7 for all European Union-supported research and development activities, andmore precisely on the GNSS Supervisory Authoritydatabase8 for FP dedicated to the GNSS industry.Some projects, often the big ones, are more detailedthan others, so it led the author sometimes to collectmore precise information on the project websites, com-munication documents and work package reports, butalso on the websites of the partners, if publicly available.
In spite of the completeness, the dating and the infor-mation about the projects and the organizations given inthese databases, extracting collaborations from fundedprojects, requires the treatment of another kind ofproblem. Institutions that fund these projects, in thiscase the European Commission, select the partnersaccording to scientific, technical, economic and politicalreasons. Sometimes it leads to the inclusion of organiz-ations that would not be selected as partners without theconsideration of these guidelines. One solution is tothink about the activity of the organizations as an indi-cator of their legitimacy to participate in these projects,focusing on relations between organizations which par-ticipate at least in two projects in the overall period, in amanner similar to AUTANT-BERNARD et al. (2007).This approach is certainly not free from criticisms, butit helps to reduce the confusion between partnerschosen for their competencies and partners chosen forpolitical reasons.
The longitudinal network database
Thus, a secondary data set is constructed, and four rela-tional matrixes are distinguished from 2004 to 2007 (onefor each year), corresponding to the observed momentsin the model. Two organizations are linked when theyparticipate in the same project. For the construction ofthe longitudinal relational database, it is assumed thatties are active from the beginning to the end of eachproject. Relations are not directed because by natureties are reciprocal in collaboration networks, and dichot-omized. Table 1 shows descriptive statistics about the
cumulated number of projects and organizations in theoverall period.
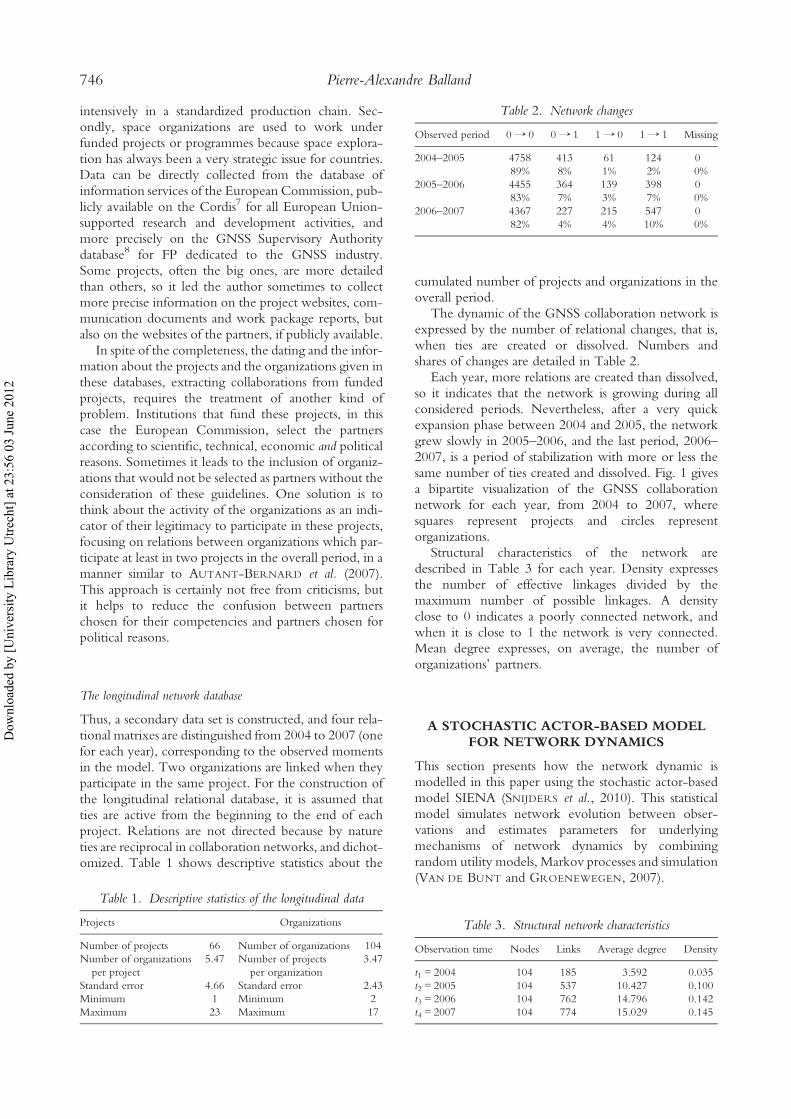
The dynamic of the GNSS collaboration network isexpressed by the number of relational changes, that is,when ties are created or dissolved. Numbers andshares of changes are detailed in Table 2.
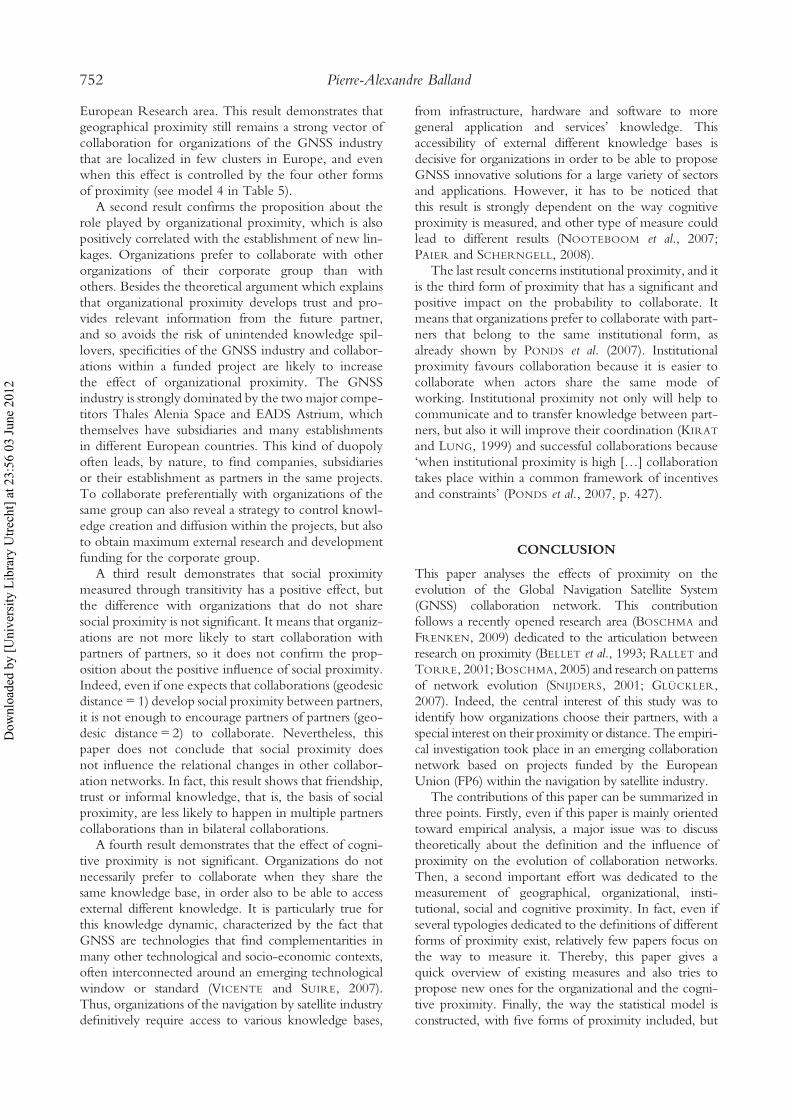
Each year, more relations are created than dissolved,so it indicates that the network is growing during allconsidered periods. Nevertheless, after a very quickexpansion phase between 2004 and 2005, the networkgrew slowly in 2005–2006, and the last period, 2006–2007, is a period of stabilization with more or less thesame number of ties created and dissolved. Fig. 1 givesa bipartite visualization of the GNSS collaborationnetwork for each year, from 2004 to 2007, wheresquares represent projects and circles representorganizations.
Structural characteristics of the network aredescribed in Table 3 for each year. Density expressesthe number of effective linkages divided by themaximum number of possible linkages. A densityclose to 0 indicates a poorly connected network, andwhen it is close to 1 the network is very connected.Mean degree expresses, on average, the number oforganizations’ partners.
A STOCHASTIC ACTOR-BASED MODEL
FOR NETWORK DYNAMICS
This section presents how the network dynamic ismodelled in this paper using the stochastic actor-basedmodel SIENA (SNIJDERS et al., 2010). This statisticalmodel simulates network evolution between obser-vations and estimates parameters for underlyingmechanisms of network dynamics by combiningrandom utility models, Markov processes and simulation(VAN DE BUNT and GROENEWEGEN, 2007).
Table 1. Descriptive statistics of the longitudinal data
Projects Organizations
Number of projects 66 Number of organizations 104Number of organizations
per project5.47 Number of projects
per organization3.47
Standard error 4.66 Standard error 2.43Minimum 1 Minimum 2Maximum 23 Maximum 17
Table 2. Network changes
Observed period 0→ 0 0→ 1 1→ 0 1→ 1 Missing
2004–2005 475889%
4138%
611%
1242%
00%
2005–2006 445583%
3647%
1393%
3987%
00%
2006–2007 436782%
2274%
2154%
54710%
00%
Table 3. Structural network characteristics
Observation time Nodes Links Average degree Density
t1 = 2004 104 185 3.592 0.035t2 = 2005 104 537 10.427 0.100t3 = 2006 104 762 14.796 0.142t4 = 2007 104 774 15.029 0.145
746 Pierre-Alexandre Balland
Do
wn
load
ed b
y [
Un
iver
sity
Lib
rary
Utr
ech
t] a
t 2
3:5
6 0
3 J
un
e 2
01
2

Fig.
1.Evo
lutio
nof
theglob
alna
viga
tion
satellite
syste
m(G
NSS
)colla
boratio
nne
twork
Proximity and the Evolution of Collaboration Networks 747
Downloaded by [University Library Utrecht] at 23:56 03 June 2012

Network changes as an evolutionary process
This model has been specifically designed to deal withthe complexity of network panel data and thus toprovide statistical analysis of the evolution of networks.Thereby, SIENA is complementary to mathematicalmodels for network dynamics, but also to standardeconometric tools, for at least two crucial reasons.Firstly, the model estimates and tests parameters fromempirical data, while mathematical models fornetwork dynamics (BALA and GOYAL, 2000; JIN et al.,2001; JACKSON and ROGERS, 2007) are difficult touse for this purpose (SNIJDERS et al., 2010). Secondly,the model considers network changes as an evolutionaryprocess (BOSCHMA and FRENKEN, 2006), while tra-ditional econometric analysis of collaboration networksare often static (AUTANT-BERNARD et al., 2007; PAIER
and SCHERNGELL, 2008; AHUJA et al., 2009). More-over, the framework of econometric analysis of paneldata (BALTAGI, 2008) has not provided specific modelsfor network dynamics, and is often constructed onthe basis of discrete-time models. Such discrete-timemodels explain the totality of changes (that is, the cre-ation and dissolution of ties) in a single regressionmodel, which seems to be a severe limitation to rep-resent real change processes of networks structures. Itseems to be more realistic to model network structuresas evolving and changing gradually, according to aniterative process, between observed moments (SNIJDERS
et al., 2010), as a realization of a continuous-timeMarkov chain like that proposed traditionally inmodels for social network dynamics since the work ofHOLLAND and LEINHARDT (1977). It appears that pro-viding estimation from empirical data and consideringnetwork changes as an evolutionary process, stochasticactor-based models (SNIJDERS, 2001) are today a verypromising tool to study the dynamic of networks ineconomic geography (TER WAL and BOSCHMA,2009). Besides, the model has already provided newinsights not only in economic geography (GIULIANI
and BELL, 2008; TER WAL, 2009), but also in manage-ment (CHECKLEY and STEGLICH, 2007; VAN DE BUNT
and GROENEWEGEN, 2007), sociology (DE FEDERICO
DE LA RÙA, 2004; LAZEGA et al., 2008), and healthstudies (STEGLICH et al., 2006).
The Markov process
Network structures, organized as time-series x(t), t [t1, ..., tm{ } for a constant set of organizations N = {1,…, n}, are modelled as a continuous-time Markovchain X(t). Each observation is represented by an n ×nmatrix x = (xij), where xij represents the link from theorganization i to the organization j(i, j = 1, …, n).Markov chains are statistical techniques widely used ineconometrics (HANSEN and SCHEINKMAN, 1995;CHIB and GREENBERG, 1996) when time-dependentstochastic processes are analysed. They express the idea
that the current state of the network determines prob-abilistically its further evolution. Thus, t1 to tm areembedded in a continuous set of time pointsT = t1; tm[ ] = {t [ <|t1 ≤ t ≤ tm}. As specified bySTEGLICH et al. (2006), the basic idea
is to take the totality of all possible network configurationson a given set of actors as the state space of a stochasticprocess, and to model observed network dynamics by spe-cifying parametric models for the transition probabilitiesbetween these states.
(p. 3)
In the present case, the size of this state space is {0,1}n(n–1)/2,and it corresponds to all possible binary and undirectednetworks on the given set of organizations.
SIENA deals with the complexity of networkdynamics by modelling the change process throughtwo crucial components: the change opportunityprocess (rate function) and the change determinationprocess (objective function). Formally, opportunitiesfor actor i to change one of the tie variables Xij( j =
1, ..., n; j = i) occur at a rate li, specified below inequation (3). Collaboration choices are determined byfi, specified below in equation (4) as a linear combi-nation of effects, depending on the current state (x0),the potential new state (x), individual attributes (v) andproximity (w). The set of permitted new states, follow-ing on a current state x0, is C(x0) and the product of thetwo model components li and pi determines the tran-sition rate matrix (Q-matrix), of which the elementsare given by (SNIJDERS, 2008):
qx0,x = lim
dt)0
P X(t + dt) = x X(t) = x0}∣
∣
{
dt(1)
where qx0,x = 0 whenever xij = x0
ij for more than oneelement (i, j); and qx0
,x = li(x0, v,w)pi(x0
, x, v,w) fordigraphs x and x0 which differ from each other onlyin the element with index (i, j).
If there is an opportunity for change for actor i, thechoice for this actor is to change one of the tie variablesxij, which will lead to a new state x, x [ C(x0). For thischoice a traditional multinomial logistic regressionmodel is used (SNIJDERS et al., 2010) and the choiceprobabilities are given by:
P X(t) changes to x|i has a change opportunity at time{
t,X(t) = x0}
= pi(x0,x, v,w) =
exp fi(x0,x, v,w)
( )
∑
x′[C(x0)
exp fi(x0,x′
, v,w)( )
(2)
Specification of rate function and objective function
Indeed, the dynamic of the network is modelled accord-ing to the idea that when there is an opportunity for
748 Pierre-Alexandre Balland
Do
wn
load
ed b
y [
Un
iver
sity
Lib
rary
Utr
ech
t] a
t 2
3:5
6 0
3 J
un
e 2
01
2
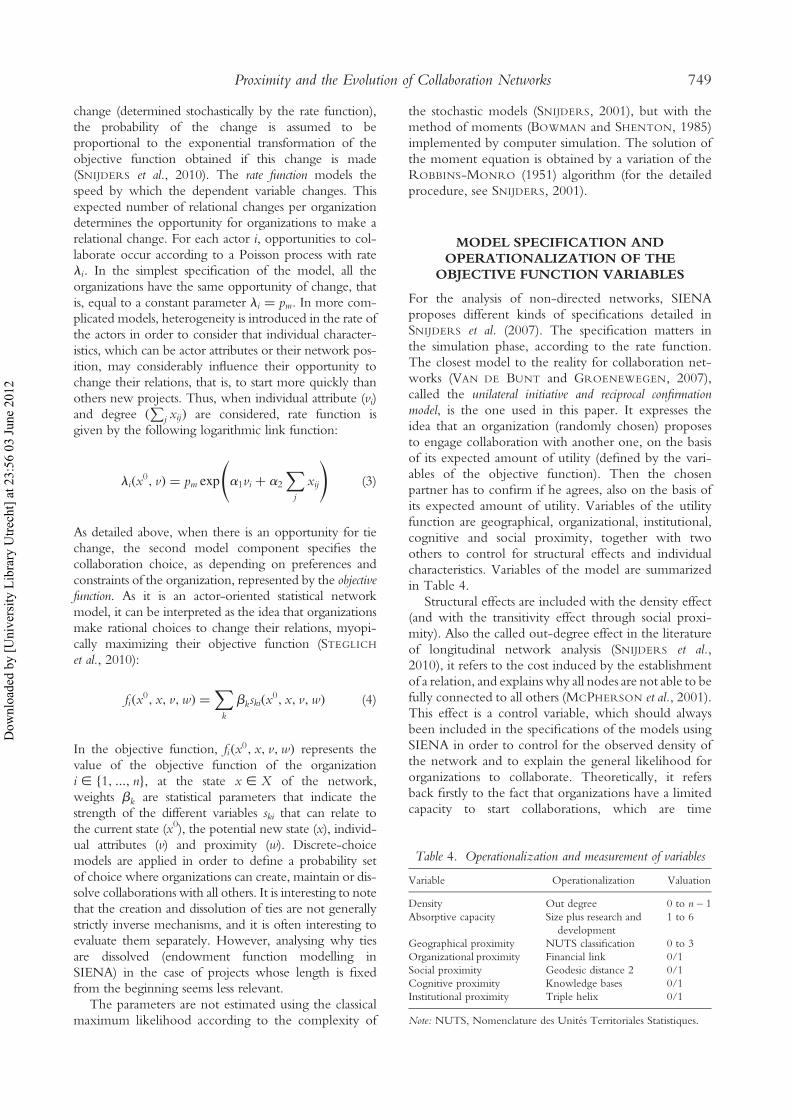
change (determined stochastically by the rate function),the probability of the change is assumed to beproportional to the exponential transformation of theobjective function obtained if this change is made(SNIJDERS et al., 2010). The rate function models thespeed by which the dependent variable changes. Thisexpected number of relational changes per organizationdetermines the opportunity for organizations to make arelational change. For each actor i, opportunities to col-laborate occur according to a Poisson process with rateli. In the simplest specification of the model, all theorganizations have the same opportunity of change, thatis, equal to a constant parameter li = pm. In more com-plicated models, heterogeneity is introduced in the rate ofthe actors in order to consider that individual character-istics, which can be actor attributes or their network pos-ition, may considerably influence their opportunity tochange their relations, that is, to start more quickly thanothers new projects. Thus, when individual attribute (vi)and degree (
∑
j xij) are considered, rate function isgiven by the following logarithmic link function:
li(x0, v) = pm exp a1vi + a2
∑
j
xij
( )
(3)
As detailed above, when there is an opportunity for tiechange, the second model component specifies thecollaboration choice, as depending on preferences andconstraints of the organization, represented by the objectivefunction. As it is an actor-oriented statistical networkmodel, it can be interpreted as the idea that organizationsmake rational choices to change their relations, myopi-cally maximizing their objective function (STEGLICH
et al., 2010):
fi(x0, x, v,w) =
∑
k
bkski(x0, x, v,w) (4)
In the objective function, fi(x0, x, v,w) represents the
value of the objective function of the organizationi [ 1, ..., n}{ , at the state x [ X of the network,weights bk are statistical parameters that indicate thestrength of the different variables ski that can relate tothe current state (x0), the potential new state (x), individ-ual attributes (v) and proximity (w). Discrete-choicemodels are applied in order to define a probability setof choice where organizations can create, maintain or dis-solve collaborations with all others. It is interesting to notethat the creation and dissolution of ties are not generallystrictly inverse mechanisms, and it is often interesting toevaluate them separately. However, analysing why tiesare dissolved (endowment function modelling inSIENA) in the case of projects whose length is fixedfrom the beginning seems less relevant.
The parameters are not estimated using the classicalmaximum likelihood according to the complexity of
the stochastic models (SNIJDERS, 2001), but with themethod of moments (BOWMAN and SHENTON, 1985)implemented by computer simulation. The solution ofthe moment equation is obtained by a variation of theROBBINS-MONRO (1951) algorithm (for the detailedprocedure, see SNIJDERS, 2001).
MODEL SPECIFICATION AND
OPERATIONALIZATION OF THE
OBJECTIVE FUNCTION VARIABLES
For the analysis of non-directed networks, SIENAproposes different kinds of specifications detailed inSNIJDERS et al. (2007). The specification matters inthe simulation phase, according to the rate function.The closest model to the reality for collaboration net-works (VAN DE BUNT and GROENEWEGEN, 2007),called the unilateral initiative and reciprocal confirmationmodel, is the one used in this paper. It expresses theidea that an organization (randomly chosen) proposesto engage collaboration with another one, on the basisof its expected amount of utility (defined by the vari-ables of the objective function). Then the chosenpartner has to confirm if he agrees, also on the basis ofits expected amount of utility. Variables of the utilityfunction are geographical, organizational, institutional,cognitive and social proximity, together with twoothers to control for structural effects and individualcharacteristics. Variables of the model are summarizedin Table 4.
Structural effects are included with the density effect(and with the transitivity effect through social proxi-mity). Also the called out-degree effect in the literatureof longitudinal network analysis (SNIJDERS et al.,2010), it refers to the cost induced by the establishmentof a relation, and explains why all nodes are not able to befully connected to all others (MCPHERSON et al., 2001).This effect is a control variable, which should alwaysbeen included in the specifications of the models usingSIENA in order to control for the observed density ofthe network and to explain the general likelihood fororganizations to collaborate. Theoretically, it refersback firstly to the fact that organizations have a limitedcapacity to start collaborations, which are time
Table 4. Operationalization and measurement of variables
Variable Operationalization Valuation
Density Out degree 0 to n – 1Absorptive capacity Size plus research and
development1 to 6
Geographical proximity NUTS classification 0 to 3Organizational proximity Financial link 0/1Social proximity Geodesic distance 2 0/1Cognitive proximity Knowledge bases 0/1Institutional proximity Triple helix 0/1
Note: NUTS, Nomenclature des Unités Territoriales Statistiques.
Proximity and the Evolution of Collaboration Networks 749
Do
wn
load
ed b
y [
Un
iver
sity
Lib
rary
Utr
ech
t] a
t 2
3:5
6 0
3 J
un
e 2
01
2
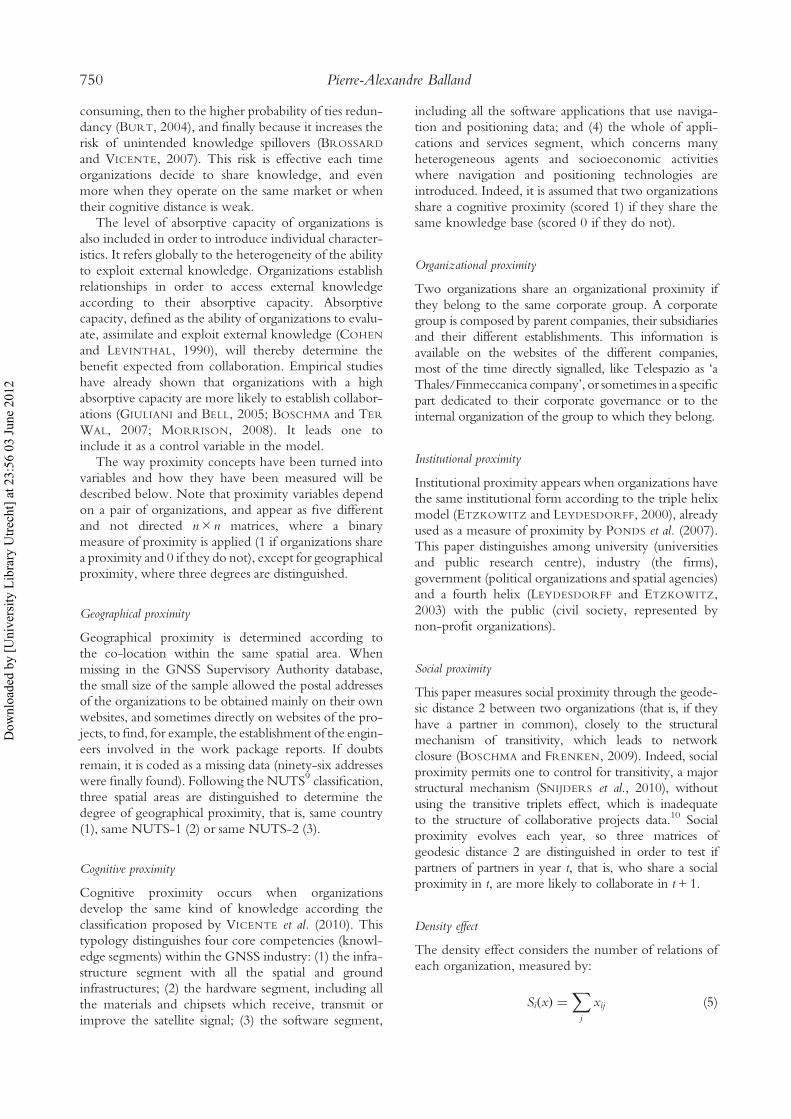
consuming, then to the higher probability of ties redun-dancy (BURT, 2004), and finally because it increases therisk of unintended knowledge spillovers (BROSSARD
and VICENTE, 2007). This risk is effective each timeorganizations decide to share knowledge, and evenmore when they operate on the same market or whentheir cognitive distance is weak.
The level of absorptive capacity of organizations isalso included in order to introduce individual character-istics. It refers globally to the heterogeneity of the abilityto exploit external knowledge. Organizations establishrelationships in order to access external knowledgeaccording to their absorptive capacity. Absorptivecapacity, defined as the ability of organizations to evalu-ate, assimilate and exploit external knowledge (COHEN
and LEVINTHAL, 1990), will thereby determine thebenefit expected from collaboration. Empirical studieshave already shown that organizations with a highabsorptive capacity are more likely to establish collabor-ations (GIULIANI and BELL, 2005; BOSCHMA and TER
WAL, 2007; MORRISON, 2008). It leads one toinclude it as a control variable in the model.
The way proximity concepts have been turned intovariables and how they have been measured will bedescribed below. Note that proximity variables dependon a pair of organizations, and appear as five differentand not directed n × n matrices, where a binarymeasure of proximity is applied (1 if organizations sharea proximity and 0 if they do not), except for geographicalproximity, where three degrees are distinguished.
Geographical proximity
Geographical proximity is determined according tothe co-location within the same spatial area. Whenmissing in the GNSS Supervisory Authority database,the small size of the sample allowed the postal addressesof the organizations to be obtained mainly on their ownwebsites, and sometimes directly on websites of the pro-jects, to find, for example, the establishment of the engin-eers involved in the work package reports. If doubtsremain, it is coded as a missing data (ninety-six addresseswere finally found). Following the NUTS9 classification,three spatial areas are distinguished to determine thedegree of geographical proximity, that is, same country(1), same NUTS-1 (2) or same NUTS-2 (3).
Cognitive proximity
Cognitive proximity occurs when organizationsdevelop the same kind of knowledge according theclassification proposed by VICENTE et al. (2010). Thistypology distinguishes four core competencies (knowl-edge segments) within the GNSS industry: (1) the infra-structure segment with all the spatial and groundinfrastructures; (2) the hardware segment, including allthe materials and chipsets which receive, transmit orimprove the satellite signal; (3) the software segment,
including all the software applications that use naviga-tion and positioning data; and (4) the whole of appli-cations and services segment, which concerns manyheterogeneous agents and socioeconomic activitieswhere navigation and positioning technologies areintroduced. Indeed, it is assumed that two organizationsshare a cognitive proximity (scored 1) if they share thesame knowledge base (scored 0 if they do not).
Organizational proximity
Two organizations share an organizational proximity ifthey belong to the same corporate group. A corporategroup is composed by parent companies, their subsidiariesand their different establishments. This information isavailable on the websites of the different companies,most of the time directly signalled, like Telespazio as ‘aThales/Finmeccanica company’, or sometimes in a specificpart dedicated to their corporate governance or to theinternal organization of the group to which they belong.
Institutional proximity
Institutional proximity appears when organizations havethe same institutional form according to the triple helixmodel (ETZKOWITZ and LEYDESDORFF, 2000), alreadyused as a measure of proximity by PONDS et al. (2007).This paper distinguishes among university (universitiesand public research centre), industry (the firms),government (political organizations and spatial agencies)and a fourth helix (LEYDESDORFF and ETZKOWITZ,2003) with the public (civil society, represented bynon-profit organizations).
Social proximity
This paper measures social proximity through the geode-sic distance 2 between two organizations (that is, if theyhave a partner in common), closely to the structuralmechanism of transitivity, which leads to networkclosure (BOSCHMA and FRENKEN, 2009). Indeed, socialproximity permits one to control for transitivity, a majorstructural mechanism (SNIJDERS et al., 2010), withoutusing the transitive triplets effect, which is inadequateto the structure of collaborative projects data.10 Socialproximity evolves each year, so three matrices ofgeodesic distance 2 are distinguished in order to test ifpartners of partners in year t, that is, who share a socialproximity in t, are more likely to collaborate in t+ 1.
Density effect
The density effect considers the number of relations ofeach organization, measured by:
Si(x) =∑
j
xij (5)
750 Pierre-Alexandre Balland
Do
wn
load
ed b
y [
Un
iver
sity
Lib
rary
Utr
ech
t] a
t 2
3:5
6 0
3 J
un
e 2
01
2
where xij = 1 indicates the presence of a relation from ito j; and xij = 0 indicates that i and j are not linked.
Absorptive capacity
Absorptive capacity is measured according to the sum ofscores of research and development sectoral intensity –
according to theOECD11 classification: high-technology(4), medium–high-technology (3), medium–low-tech-nology (2) and low-technology industries (1) – and thesize – according to the number of employees: 1–10 (1),11–50 (2), 51–250 (3), 251–500 (4) and more than 501(5) – rescaled from 1 to 6.
EMPIRICAL RESULTS
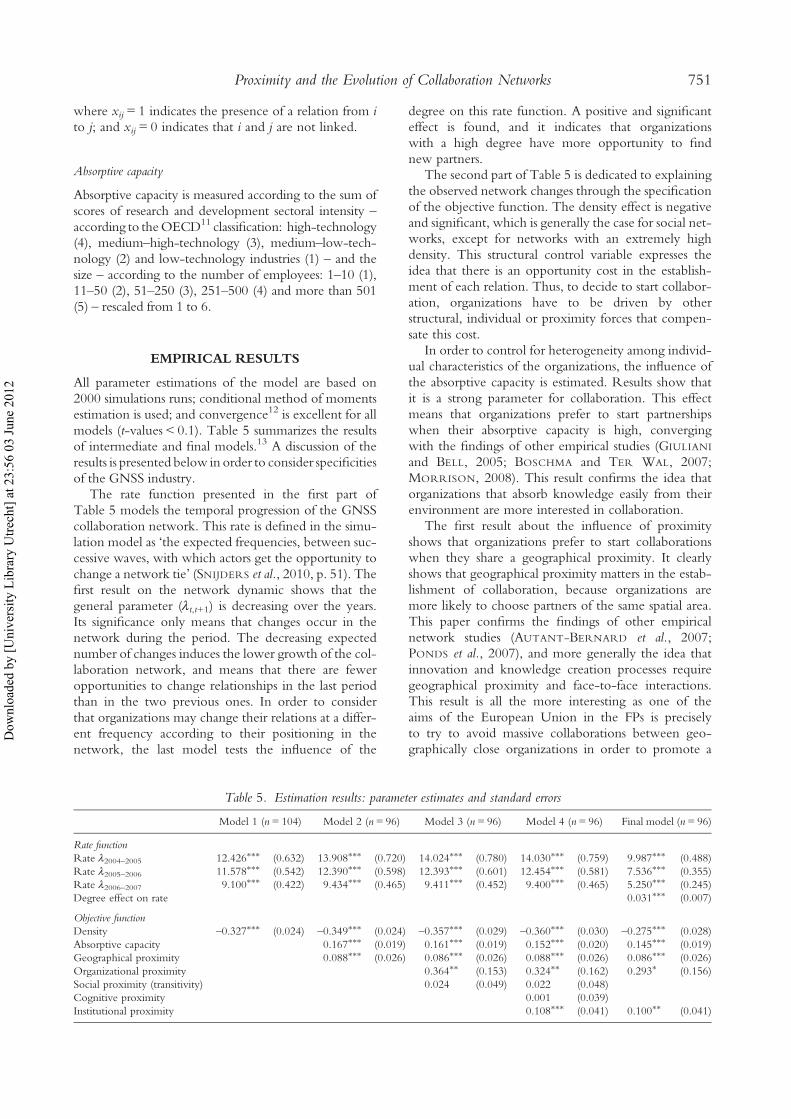
All parameter estimations of the model are based on2000 simulations runs; conditional method of momentsestimation is used; and convergence12 is excellent for allmodels (t-values < 0.1). Table 5 summarizes the resultsof intermediate and final models.13 A discussion of theresults is presented below in order to consider specificitiesof the GNSS industry.
The rate function presented in the first part ofTable 5 models the temporal progression of the GNSScollaboration network. This rate is defined in the simu-lation model as ‘the expected frequencies, between suc-cessive waves, with which actors get the opportunity tochange a network tie’ (SNIJDERS et al., 2010, p. 51). Thefirst result on the network dynamic shows that thegeneral parameter (λt,t+1) is decreasing over the years.Its significance only means that changes occur in thenetwork during the period. The decreasing expectednumber of changes induces the lower growth of the col-laboration network, and means that there are feweropportunities to change relationships in the last periodthan in the two previous ones. In order to considerthat organizations may change their relations at a differ-ent frequency according to their positioning in thenetwork, the last model tests the influence of the
degree on this rate function. A positive and significanteffect is found, and it indicates that organizationswith a high degree have more opportunity to findnew partners.
The second part of Table 5 is dedicated to explainingthe observed network changes through the specificationof the objective function. The density effect is negativeand significant, which is generally the case for social net-works, except for networks with an extremely highdensity. This structural control variable expresses theidea that there is an opportunity cost in the establish-ment of each relation. Thus, to decide to start collabor-ation, organizations have to be driven by otherstructural, individual or proximity forces that compen-sate this cost.
In order to control for heterogeneity among individ-ual characteristics of the organizations, the influence ofthe absorptive capacity is estimated. Results show thatit is a strong parameter for collaboration. This effectmeans that organizations prefer to start partnershipswhen their absorptive capacity is high, convergingwith the findings of other empirical studies (GIULIANI
and BELL, 2005; BOSCHMA and TER WAL, 2007;MORRISON, 2008). This result confirms the idea thatorganizations that absorb knowledge easily from theirenvironment are more interested in collaboration.
The first result about the influence of proximityshows that organizations prefer to start collaborationswhen they share a geographical proximity. It clearlyshows that geographical proximity matters in the estab-lishment of collaboration, because organizations aremore likely to choose partners of the same spatial area.This paper confirms the findings of other empiricalnetwork studies (AUTANT-BERNARD et al., 2007;PONDS et al., 2007), and more generally the idea thatinnovation and knowledge creation processes requiregeographical proximity and face-to-face interactions.This result is all the more interesting as one of theaims of the European Union in the FPs is preciselyto try to avoid massive collaborations between geo-graphically close organizations in order to promote a
Table 5. Estimation results: parameter estimates and standard errors
Model 1 (n = 104) Model 2 (n = 96) Model 3 (n = 96) Model 4 (n = 96) Final model (n = 96)
Rate functionRate λ2004–2005 12.426∗∗∗ (0.632) 13.908∗∗∗ (0.720) 14.024∗∗∗ (0.780) 14.030∗∗∗ (0.759) 9.987∗∗∗ (0.488)Rate λ2005–2006 11.578∗∗∗ (0.542) 12.390∗∗∗ (0.598) 12.393∗∗∗ (0.601) 12.454∗∗∗ (0.581) 7.536∗∗∗ (0.355)Rate λ2006–2007 9.100∗∗∗ (0.422) 9.434∗∗∗ (0.465) 9.411∗∗∗ (0.452) 9.400∗∗∗ (0.465) 5.250∗∗∗ (0.245)Degree effect on rate 0.031∗∗∗ (0.007)
Objective functionDensity –0.327∗∗∗ (0.024) –0.349∗∗∗ (0.024) –0.357∗∗∗ (0.029) –0.360∗∗∗ (0.030) –0.275∗∗∗ (0.028)Absorptive capacity 0.167∗∗∗ (0.019) 0.161∗∗∗ (0.019) 0.152∗∗∗ (0.020) 0.145∗∗∗ (0.019)Geographical proximity 0.088∗∗∗ (0.026) 0.086∗∗∗ (0.026) 0.088∗∗∗ (0.026) 0.086∗∗∗ (0.026)Organizational proximity 0.364∗∗ (0.153) 0.324∗∗ (0.162) 0.293∗ (0.156)Social proximity (transitivity) 0.024 (0.049) 0.022 (0.048)Cognitive proximity 0.001 (0.039)Institutional proximity 0.108∗∗∗ (0.041) 0.100∗∗ (0.041)
Proximity and the Evolution of Collaboration Networks 751
Do
wn
load
ed b
y [
Un
iver
sity
Lib
rary
Utr
ech
t] a
t 2
3:5
6 0
3 J
un
e 2
01
2
European Research area. This result demonstrates thatgeographical proximity still remains a strong vector ofcollaboration for organizations of the GNSS industrythat are localized in few clusters in Europe, and evenwhen this effect is controlled by the four other formsof proximity (see model 4 in Table 5).
A second result confirms the proposition about therole played by organizational proximity, which is alsopositively correlated with the establishment of new lin-kages. Organizations prefer to collaborate with otherorganizations of their corporate group than withothers. Besides the theoretical argument which explainsthat organizational proximity develops trust and pro-vides relevant information from the future partner,and so avoids the risk of unintended knowledge spil-lovers, specificities of the GNSS industry and collabor-ations within a funded project are likely to increasethe effect of organizational proximity. The GNSSindustry is strongly dominated by the two major compe-titors Thales Alenia Space and EADS Astrium, whichthemselves have subsidiaries and many establishmentsin different European countries. This kind of duopolyoften leads, by nature, to find companies, subsidiariesor their establishment as partners in the same projects.To collaborate preferentially with organizations of thesame group can also reveal a strategy to control knowl-edge creation and diffusion within the projects, but alsoto obtain maximum external research and developmentfunding for the corporate group.
A third result demonstrates that social proximitymeasured through transitivity has a positive effect, butthe difference with organizations that do not sharesocial proximity is not significant. It means that organiz-ations are not more likely to start collaboration withpartners of partners, so it does not confirm the prop-osition about the positive influence of social proximity.Indeed, even if one expects that collaborations (geodesicdistance = 1) develop social proximity between partners,it is not enough to encourage partners of partners (geo-desic distance = 2) to collaborate. Nevertheless, thispaper does not conclude that social proximity doesnot influence the relational changes in other collabor-ation networks. In fact, this result shows that friendship,trust or informal knowledge, that is, the basis of socialproximity, are less likely to happen in multiple partnerscollaborations than in bilateral collaborations.
A fourth result demonstrates that the effect of cogni-tive proximity is not significant. Organizations do notnecessarily prefer to collaborate when they share thesame knowledge base, in order also to be able to accessexternal different knowledge. It is particularly true forthis knowledge dynamic, characterized by the fact thatGNSS are technologies that find complementarities inmany other technological and socio-economic contexts,often interconnected around an emerging technologicalwindow or standard (VICENTE and SUIRE, 2007).Thus, organizations of the navigation by satellite industrydefinitively require access to various knowledge bases,
from infrastructure, hardware and software to moregeneral application and services’ knowledge. Thisaccessibility of external different knowledge bases isdecisive for organizations in order to be able to proposeGNSS innovative solutions for a large variety of sectorsand applications. However, it has to be noticed thatthis result is strongly dependent on the way cognitiveproximity is measured, and other type of measure couldlead to different results (NOOTEBOOM et al., 2007;PAIER and SCHERNGELL, 2008).
The last result concerns institutional proximity, and itis the third form of proximity that has a significant andpositive impact on the probability to collaborate. Itmeans that organizations prefer to collaborate with part-ners that belong to the same institutional form, asalready shown by PONDS et al. (2007). Institutionalproximity favours collaboration because it is easier tocollaborate when actors share the same mode ofworking. Institutional proximity not only will help tocommunicate and to transfer knowledge between part-ners, but also it will improve their coordination (KIRAT
and LUNG, 1999) and successful collaborations because‘when institutional proximity is high […] collaborationtakes place within a common framework of incentivesand constraints’ (PONDS et al., 2007, p. 427).
CONCLUSION
This paper analyses the effects of proximity on theevolution of the Global Navigation Satellite System(GNSS) collaboration network. This contributionfollows a recently opened research area (BOSCHMA andFRENKEN, 2009) dedicated to the articulation betweenresearch on proximity (BELLET et al., 1993; RALLET andTORRE, 2001; BOSCHMA, 2005) and research on patternsof network evolution (SNIJDERS, 2001; GLÜCKLER,2007). Indeed, the central interest of this study was toidentify how organizations choose their partners, with aspecial interest on their proximity or distance. The empiri-cal investigation took place in an emerging collaborationnetwork based on projects funded by the EuropeanUnion (FP6) within the navigation by satellite industry.
The contributions of this paper can be summarized inthree points. Firstly, even if this paper is mainly orientedtoward empirical analysis, a major issue was to discusstheoretically about the definition and the influence ofproximity on the evolution of collaboration networks.Then, a second important effort was dedicated to themeasurement of geographical, organizational, insti-tutional, social and cognitive proximity. In fact, even ifseveral typologies dedicated to the definitions of differentforms of proximity exist, relatively few papers focus onthe way to measure it. Thereby, this paper gives aquick overview of existing measures and also tries topropose new ones for the organizational and the cogni-tive proximity. Finally, the way the statistical model isconstructed, with five forms of proximity included, but
752 Pierre-Alexandre Balland
Do
wn
load
ed b
y [
Un
iver
sity
Lib
rary
Utr
ech
t] a
t 2
3:5
6 0
3 J
un
e 2
01
2
also where each form controls for the effect of each otherfurnishes original empirical results.
The empirical results on the evolution of the GNSScollaboration network can be summarized as follows:organizations prefer to start a partnership when theyshare one or more forms of proximity, except for cogni-tive and social proximity, which do not have a signifi-cant effect. Indeed, geographical, organizational andinstitutional proximity favour collaborations. Cognitiveproximity does not have a significant effect on collabor-ation because organizations need not only partners withthe same knowledge base, but also access to differentknowledge in the GNSS industry. Otherwise, socialproximity is less likely to happen in projects with mul-tiple partners than in bilateral collaborations.
This paper studies how organizations choose theirpartners according to their proximity. However, twocrucial questions for the research agenda about proximitydynamics are not developed here. Firstly, the paper doesnot investigate how the different forms of proximityinteract among each other. In fact, even if the paper pro-poses to control the effect of each form of proximity oneach other, it does not show to what extent some formscan be substitutes (one form replaces another one) orcomplementary (one form needs another one). Secondly,these different forms are considered as given data, likeexplanatory variables of the evolution of the collaborationnetwork. Put differently, the paper does not explainwhere this degree of proximity comes from, and how itevolves.14 A future interesting research area could befound in the co-evolution of proximity and networks(MENZEL, 2008; TER WAL and BOSCHMA, 2009; TER
WAL, 2009). Thus, the central question will be to under-stand how proximity contributes to create or dissolvecollaborations, and at the same time how these relationscontribute to increase or decrease the degree of proximitybetween organizations. This issue requires an importanttheoretical contribution that will help to unravel thecomplex linkages of co-evolution. It is then also anempirical challenge to provide and compare resultsfrom other industries with different measures of proxi-mity dimensions.
Acknowledgements – The author is grateful to OlivierBrossard, Ron Boschma, Ainhoa De Federico, KoenFrenken, Tom Snijders, Jérôme Vicente, two anonymousreferees and an anonymous Editor for their helpful sugges-tions. This research received financial support from theEURODITE Project (‘Regional Trajectories to the Knowl-edge Economy: A Dynamic Model’, Sixth FrameworkProgram, Contract Number 006187).
NOTES
1. In the stochastic model proposed, calculations forstatistical inference are too complex to be carried outanalytically (SNIJDERS et al., 2010).
2. Massive civil use of the American GPS really begun on1 May 2000.
3. Spatial agencies, but also agencies for the security of airflight or railroad.
4. For detailed information, see VICENTE et al. (2010).5. Centre National d’Etudes Spatiales.6. Deutsche Zentrum für Luft- und Raumfahrt.7. Community Research and Development Information
Service (CORDIS) (http://cordis.europa.eu/).8. GNSS Supervisory Authority (GSA) (http://www.gsa.
europa.eu/).9. TheNomenclature ofTerritorialUnits for Statistics (NUTS)
was establishedby theEuropeanUnion (Eurostat) inorder toprovide a standard classification of European spatial units.
10. Accounting transitive triplets to measure transitivity areinadequate to affiliations networks constructed frombipartite data (ROBINS and ALEXANDER, 2004) andlead to an artificially high transitivity parameter (by con-struction of the data, each project is a clique, whereorganizations are fully connected).
11. OECD, ANBERD and STAN databases, May 2003.12. The convergence indicates the deviations between
simulated values and observed values.13. For standards errors: ∗p < 0.10; ∗∗p < 0.05; and ∗∗∗p <
0.01.14. Except for institutional proximity, static by nature as
measured in the paper, all dimensions of proximity aredynamics. Organizations are moving (geographical),financial (organizational) and social ties (social) are chan-ging and knowledge (cognitive) is a dynamic process.
REFERENCES
AHUJA G. (2000) Collaboration networks, structural holes, and innovation: a longitudinal study, Administrative Science Quarterly 45,425–455.
AHUJA G., POLIDORO JR F. and MITCHELL W. (2009) Structural homophily or social asymmetry? The formation of alliances bypoorly embedded firms, Strategic Management Journal 30, 941–958.
ANTONELLI C. (2000) Collective knowledge communication and innovation: the evidence of technological districts, RegionalStudies 34, 535–547.
AUDRETSCH D. and FELDMAN M. (1996) Knowledge spillovers and the geography of innovation and production, American EconomicReview 86, 630–640.
AUTANT-BERNARD C., BILLAND P., FRACHISSE D. and MASSARD N. (2007) Social distance versus spatial distance in R&Dcooperation: empirical evidence from European collaboration choices in micro and nanotechnologies, Papers in RegionalScience 86, 495–519.
BALA V. and GOYAL S. (2000) A noncooperative model of network formation, Econometrica 68, 1181–1229.
Proximity and the Evolution of Collaboration Networks 753
Do
wn
load
ed b
y [
Un
iver
sity
Lib
rary
Utr
ech
t] a
t 2
3:5
6 0
3 J
un
e 2
01
2
BALLAND P. A., SUIRE R. and VICENTE J. (2010) How do Clusters/Pipelines and Core/Periphery Structures Work Together in KnowledgeProcesses? Papers in Evolutionary Economic Geography Number 10-08. Section of Economic Geography, Utrecht University,Utrecht.
BALTAGI B. H. (2008) Econometric Analysis of Panel Data. Wiley, Chichester.BAUM J. A., SHIPILOV A. V. and ROWLEY T. J. (2003) Where do small worlds come from?, Industrial and Corporate Change 12,
697–725.BELLET M., COLLETIS G. and LUNG Y. (1993) Économie des proximités, Revue d’Économie Régionale et Urbaine 3, 357–606.BOSCHMA R. A. (2005) Proximity and innovation: a critical assessment, Regional Studies 39, 61–74.BOSCHMA R. A. and FRENKEN K. (2006) Why is economic geography not an evolutionary science? Towards an evolutionary
economic geography, Journal of Economic Geography 6, 273–302.BOSCHMA R. A. and FRENKEN K. (2009) The Spatial Evolution of Innovation Networks: A Proximity Perspective. Papers in Evolutionary
Economic Geography Number 09-05. Section of Economic Geography, Utrecht University, Utrecht.BOSCHMA R. A. and TER WAL A. L. J. (2007) Knowledge networks and innovative performance in an industrial district: the case of
a footwear district in the South of Italy, Industry and Innovation 14, 177–199.BOUBA-OLGA O. and GROSSETTI M. (2008) Socio-économie de proximité, Revue d’Économie Régionale et Urbaine 3, 311–328.BOUBA-OLGA O. and ZIMMERMANN J. B. (2004) Modèles et mesures de la proximité, in PECQUEUR B. and ZIMMERMANN J. B. (Eds)
Economies de proximité, pp. 77–99. Hermès, Paris.BOWMAN K. O. and SHENTON L. R. (1985) Method of moments, in KOTZ S., JOHNSON N. L. and READ C. B. (Eds) Encyclopedia
of Statistical Sciences, Vol. 5, pp. 467–473. Wiley, New York, NY.BRESCHI S. and LISSONI F. (2001) Knowledge spillovers and local innovation systems: a critical survey, Industrial and Corporate
Change 10, 975–1005.BRESCHI S. and LISSONI F. (2009) Mobility of skilled workers and co-invention networks: an anatomy of localized knowledge
flows, Journal of Economic Geography 9, 439–468.BROSSARD O. and VICENTE J. (2007) Cognitive and relational distance in alliances networks: evidence on the knowledge value
chain in the European ICT sector. Paper presented at the Summer Danish Research Unit for Industrial Dynamics(DRUID) Conference, Copenhagen, Denmark, June 2007.
BURT R. S. (2004) Structural holes and good ideas, American Journal of Sociology 110, 349–399.CANTNER U. and GRAF H. (2006) The network of innovators in Jena: an application of social network analysis, Research Policy 35,
463–480.CARRINCAZEAUX C., LUNG Y. and VICENTE J. (2008) The scientific trajectory of the French school of proximity: interaction- and
institution-based approaches to regional innovation systems, European Planning Studies 16, 617–628.CASSIMAN B. and VEUGELERS R. (2002) Spillovers and R&D cooperation: some empirical evidence, American Economic Review 92,
1169–1184.CHECKLEY M. and STEGLICH C. (2007) Partners in power: job mobility and dynamic deal-making, European Management Review 4,
161–171.CHIB S. and GREENBERG E. (1996) Markov chain Monte Carlo simulation methods in econometrics, Econometric Theory 12,
409–431.COHEN W. and LEVINTHAL D. A. (1990) Absorptive capacity: a new perspective on learning and innovation, Administrative Science
Quarterly 35, 128–152.COHENDET P., KIRMAN A. and ZIMMERMANN J. B. (2003) Emergence, formation et dynamique des réseaux. Modèles de la
morphogenèse, Revue d’Économie Industrielle 103, 15–42.D’ASPREMONT C. and JACQUEMIN A. (1988) Cooperative and non-cooperative R&D in duopoly with spillovers, American Economic
Review 78, 1133–1137.DAVIS J. A. (1970) Clustering and hierarchy in interpersonal relations: testing two graph theoretical models on 742 sociomatrices,
American Sociological Review 35, 843–852.DE FEDERICO DE LA RÙA A (2004) L’analyse longitudinal de réseaux sociaux totaux avec SIENA: méthode, discussion et
application, Bulletin de Méthodologie Sociologique 84, 5–39.ETZKOWITZ H. and LEYDESDORFF L. (2000) The dynamics of innovation: from national systems and ‘Mode 2’ to a triple helix of
university–industry–government relations, Research Policy 29, 109–123.GAY B. and DOUSSET B. (2005) Innovation and network structural dynamics: study of the alliance network of a major sector of
the biotechnology industry, Research Policy 34, 1457–1475.GILLY J. P. and TORRE A. (2000) Dynamiques de Proximité. L’Harmattan, Paris.GIULIANI E. and BELL M. (2005) The micro-determinants of meso-level learning and innovation: evidence from a Chilean wine
cluster, Research Policy 34, 47–68.GIULIANI E. and BELL M. (2008) Industrial clusters and the evolution of their knowledge networks: back to Chile again. Paper
presented at the Summer Danish Research Unit for Industrial Dynamics (DRUID) Conference, Copenhagen, Denmark,June 2008.
GLÜCKLER J. (2007) Economic geography and the evolution of networks, Journal of Economic Geography 7, 619–634.GRANOVETTER M. (1985) Economic action and social structure: the problem of embeddedness, American Journal of Sociology 91,
481–510.GROSSETTI M. and BÈS M. P. (2001) Encastrements et découplages dans les relations science–industrie, Revue Française de Sociologie
42, 327–355.
754 Pierre-Alexandre Balland
Do
wn
load
ed b
y [
Un
iver
sity
Lib
rary
Utr
ech
t] a
t 2
3:5
6 0
3 J
un
e 2
01
2

HANSEN L. P. and SCHEINKMAN J. A. (1995) Back to the future: generating moment implications for continuous-time Markovprocesses, Econometrica 63, 767–804.
HOLLAND P. W. and LEINHARDT S. (1971) Transitivity in structural models of small groups, Comparative Group Studies 2, 107–124.HOLLAND P. W. and LEINHARDT S. (1977) A dynamic model for social networks, Journal of Mathematical Sociology 5, 5–20.HOWELLS J. R. L. (2002) Tacit knowledge, innovation and economic geography, Urban Studies 39, 871–884.JACKSON M. O. and ROGERS B. W. (2007) Meeting strangers and friends of friends: how random are social networks?, American
Economic Review 97, 890–915.JIN E. M., GIRVAN M. and NEWMAN M. E. J. (2001) Structure of growing social networks, Physical Review E 64, 046132.KIRAT T. and LUNG Y. (1999) Innovation and proximity – territories as loci of collective learning processes, European Urban and
Regional Studies 6, 27–38.KNOBEN J. and OERLEMANS L. A. G. (2006) Proximity and inter-organizational collaboration: a literature review, International
Journal of Management Reviews 8, 71–89.LAZEGA E., MOUNIER L., SNIJDERS T. and TUBARO P. (2008) Réseaux et controverses: de l’effet des normes sur la dynamique des
structures, Revue Française de Sociologie 49, 467–498.LEVY R., ROUX P. and WOLFF S. (2009) An analysis of science–industry collaborative patterns in a large European University,
Journal of Technology Transfer 34, 1–23.LEYDESDORFF L. and ETZKOWITZ H. (2003) Can ‘the public’ be considered as a fourth helix in university–industry–government
relations? Report of the Fourth Triple Helix Conference, Science and Public Policy 30, 55–61.MASSARD N. and MEHIER C. (2009) Proximity and Innovation through an ‘accessibility to knowledge’ lens, Regional Studies 43,
77–88.MCPHERSON M., SMITH-LOVIN L. and COOK J. M. (2001) Birds of a feather: homophily in social networks, Annual Review of
Sociology 27, 415–444.MENZEL M. P. (2008) Dynamic Proximities: Changing Relations by Creating and Bridging Distances. Papers in Evolutionary Economic
Geography Number 08-16. Section of Economic Geography, Utrecht University, Utrecht.MORRISON A. (2008) Gatekeepers of knowledge within industrial districts: who they are, how they interact, Regional Studies 42,
817–835.NOOTEBOOM B. (2000) Learning by interaction, absorptive capacity, cognitive distance and governance, Journal of Management and
Governance 4, 69–92.NOOTEBOOM B., VANHAVERBEKE W., DUYSTERS G., GILSING V. and VAN DEN OORD A. (2007) Optimal cognitive distance and
absorptive capacity, Research Policy 36, 1016–1034.NORRIS J. R. (1997) Markov Chains. Cambridge University Press, Cambridge.NORTH D. C. (1990) Institutions, Institutional Change and Economic Performance. Cambridge University Press, Cambridge.PAIER M. and SCHERNGELL T. (2008) Determinants of Collaboration in European R&D Networks: Empirical Evidence from a Binary Choice
Model Perspective. Social Science Research Network (SSRN) Working Paper Series, Rochester, NY.PONDS R., VAN OORT F. G. and FRENKEN K. (2007) The geographical and institutional proximity of research collaboration,
Papers in Regional Science 86, 423–443.POWELL W. W., WHITE D., KOPUT K. W. and OWEN-SMITH J. (2005) Network dynamics and field evolution: the growth of
interorganizational collaboration in the life sciences, American Journal of Sociology 110, 1132–1205.RALLET A. and TORRE A. (2001) Proximité géographique ou proximité organisationnelle? Une analyse spatiale des coopérations
technologiques dans les réseaux localisés d’innovation, Economie Appliquée 4, 147–171.ROBBINS H. and MONRO S. (1951) A stochastic approximation method, Annals of Mathematical Statistics 22, 400–407.ROBINS G. and ALEXANDER M. (2004) Small worlds among interlocking directors: network structure and distance in bipartite
graphs, Computational and Mathematical Organization Theory 10, 69–94.SCHERNGELL T. and BARBER M. (Forthcoming 2010) Distinct spatial characteristics of industrial and public research collaborations:
evidence from the 5th EU Framework Programme, Annals of Regional Science. DOI: 10.1007/s00168-009-0334-3.SCHILLING M. A. and PHELPS C. C. (2007) Interfirm collaboration networks: the impact of large scale network structure on firm
innovation, Management Science 53, 1113–1126.SNIJDERS T. A. B. (2001) The statistical evaluation of social network dynamics, in SOBEL M. and BECKER M. (Eds) Sociological
Methodology, pp. 361–395. Basil Blackwell, Boston, MA.SNIJDERS T. A. B. (2008) Longitudinal methods of network analysis, in MEYERS B. (Ed.) Encyclopedia of Complexity and System
Science, Springer, Berlin.SNIJDERS T. A. B., STEGLICH C., SCHWEINBERGER M. and HUISMAN M. (2007) Manual for SIENA Version 3.1. Department of
Statistics, University of Oxford, Oxford.SNIJDERS T. A. B., VAN DE BUNT G. G. and STEGLICH C. (2010) Introduction to actor-based models for network dynamics, Social
Networks 32, 44–60.STEGLICH C., SNIJDERS T. A. B. and WEST P. (2006) Applying SIENA: an illustrative analysis of the co-evolution of adolescents’
friendship networks, taste in music, and alcohol consumption, Methodology: Journal of Research Methods for the Behavioral and SocialSciences 2, 48–56.
STEGLICH C., SNIJDERS T. A. B. and PEARSON M. (2010) Dynamic networks and behavior: separating selection from influence,Sociological Methodology 40, 329–393.
SUIRE R. and VICENTE J. (2009) Why do some places succeed when others decline? A social interaction model of cluster viability,Journal of Economic Geography 9, 381–404.
Proximity and the Evolution of Collaboration Networks 755
Do
wn
load
ed b
y [
Un
iver
sity
Lib
rary
Utr
ech
t] a
t 2
3:5
6 0
3 J
un
e 2
01
2

TER WAL A. L. J. (2009) The dynamics of the inventor network in German biotechnology: geographical proximity versus triadicclosure. Paper presented at the Summer Danish Research Unit for Industrial Dynamics (DRUID) Conference, Copenhagen,Denmark, June 2009.
TER WAL A. L. J. and BOSCHMA R. A. (2009) Applying social network analysis in economic geography: theoretical and methodo-logical issues, Annals of Regional Science 43, 739–756.
TORRE A. (2008) On the role played by temporary geographical proximity in knowledge transmission, Regional Studies 42,869–889.
VAN DE BUNT G. G. and GROENEWEGEN P. (2007) An actor-oriented dynamic network approach: the case of interorganizationalnetwork evolution, Organizational Research Methods 10, 463–482.
VICENTE J. and SUIRE R. (2007) Informational cascades versus network externalities in locational choice: evidence of ICT clustersformation and stability, Regional Studies 41, 173–184.
VICENTE J., BALLAND P. A. and BROSSARD O. (Forthcoming 2010) Getting into networks and clusters: evidence on the GNSScomposite knowledge process in (and from) Midi-Pyrénées, Regional Studies. DOI: 10.1080/00343401003713340.
WETERINGS A. (2005) Do Firms Benefit from Spatial Proximity? Testing the Relation between Spatial Proximity and the Performance of SmallSoftware Firms in the Netherlands. Netherlands Geographical Studies Number 336, Utrecht.
756 Pierre-Alexandre Balland
Do
wn
load
ed b
y [
Un
iver
sity
Lib
rary
Utr
ech
t] a
t 2
3:5
6 0
3 J
un
e 2
01
2