Embed Size (px)
Citation preview

1
PROXAMA PLC
HALF YEARLY REPORT
FOR THE SIX MONTHS ENDED
30 JUNE 2016

2
29 September 2016
Proxama PLC
(“Proxama” or the “Company”)
Half-Year Results
Proxama PLC, (AIM: PROX), the mobile commerce company specialising in proximity marketing and a provider
of end-to-end payment solutions for card issuers and processors, is pleased to announce its half year results
for the six months ended 30th June 2016.
Highlights
Financial Highlights
Revenues increased by 26% to £1.21m (2015 £0.96m). Other operating income, which includes grant income,
has increased to £0.32m (2015 £0.04m) and therefore total income for the half year is £1.53m (2015 £1.0m).
EBITDA1 losses before exceptional items reduced significantly to £2.10m (2015: £3.48m).
Losses before tax decreased to £2.94m (2015: £4.6m).
Loss per share2 of 0.27p (2015: 0.44p).
Operational Highlights
Sale of the Digital Payments Division is proceeding with completion expected in 2016.
The Digital Payments Division has made good progress in H1 through accelerating the commercial availability of
Proxama’s cloud based mobile payments solutions.
The Proximity Marketing Division has enjoyed a strong period:
o Executed commercial mobile proximity engagement campaigns for Royal Bank of Canada, GLACÉAU
smartwater (a division of Coca Cola), Skyscanner and in collaboration with their partner the Mobile
Gamer Network, DraftKings and Crabbies.
o Establishing what is believed to be the largest beacon network in the UK, with a London focus, being
further expanded with a specific emphasis on adding new beacons in transport and leisure venues.
Post Period End
Completed an equity placing in July 2016 raising a further £2m (before expenses) and the Company is on track
to be cash breakeven by the end of 2017. Cash as at 30 June 2016 was £0.3m.
In September, Proxama became one of only two companies worldwide to be certified by Google as a “Location
Services Provider” to deliver Eddystone experiences for consumers, including the Physical Web (the use of
mobile technology to interact with objects and locations) after passing the technical requirements to
demonstrate full integration with the Google Beacon Platform.
With Apple’s iPhone 7 reliant of Bluetooth for its wireless functions such as headphones this is expected to
increase the use of Bluetooth in the UK, a positive development for Proxama’s Bluetooth enabled beacon
network.
1 EBITDA means earnings before interest, tax, depreciation, amortization and exceptional items
2 Loss per share is computed from statutory profits after tax adjusted to exclude exceptional items

3
Commenting on the results, John Kennedy, Chief Executive of Proxama, said,
“The calibre of the brands and businesses we are now working with on a day to day basis are a reflection of the future
potential of our business. We are excited about the advances in our network scale and reach, and how brands are using
this unique capability. The early revenues from advertising and data are promising and we are focused on looking to
maximise the opportunity for Proxama.”
Enquiries:
Proxama PLC John Kennedy, Chief Executive
020 3668 2888
Peel Hunt LLP (Nominated Adviser and Broker) Richard Kauffer Euan Brown
020 7418 8900
Novella Tim Robertson Toby Andrews
020 3151 7008
This announcement contains inside information for the purposes of Article 7 of regulation 596/2014.
Forward looking statements
Certain statements contained within the announcement are forward looking statements and are based on current expectations, estimates and projections about the potential returns of Proxama and industry and markets in which Proxama operates, the Directors' beliefs and assumptions made by the Directors. Words such as "expects", "anticipates", "should", "intends", "plans", "believes", "seeks", "estimates", "projects", "pipeline" and variations of such words and similar expressions are intended to identify such forward looking statements and expectations. These statements are not guarantees of future performance or the ability to identify and consummate investments and involve certain risks, uncertainties, outcomes of negotiations and due diligence and assumptions that are difficult to predict, qualify or quantify. Therefore, actual outcomes and results may differ materially from what is expressed in such forward looking statements or expectations. Among the factors that could cause actual results to differ materially are: the general economic climate, competition, interest rate levels, loss of key personnel, the result of legal and commercial due diligence, the availability of financing on acceptable terms and changes in the legal or regulatory environment.
These forward-looking statements speak only as of the date of this announcement. Proxama expressly disclaims any obligation or undertaking to disseminate any updates or revisions to any forward-looking statements contained herein to reflect any change in Proxama’s expectations with regard thereto, any new information or any change in events, conditions or circumstances on which any such statements are based, unless required to do so by law or any appropriate regulatory authority.”
About Proxama PLC
Proxama is an international commerce Company specialising in proximity marketing via mobile and providing end-to-end solutions for card issuers to migrate customers from magnetic stripe credit and debit cards to contactless mobile payments.
Today, Proxama’s solutions are used by banks, financial institutions, mobile app companies, media owners, stadium owners, retailers and brands.
The proximity marketing division focuses on connecting consumers to brands and retailers via Bluetooth Low Energy (BLE) beacon technology. Proxama establishes and owns beacon networks in high footfall locations such as City Centres, stadia, shopping malls and retail outlets, which are then able to communicate to consumers via messages to mobiles when the consumer is in close proximity to a beacon. The technology platform at the heart of this division is TapPoint®.

4
The payments division manages end-to-end credit and debit cards solutions on behalf of financial institutions in the United States, Europe and the Middle East and specialises in enabling the migration of cards from magnetic stripe cards, to chip and pin cards and from contactless chip cards to mobile devices. The technology behind this division is Proxama’s Digital Enablement Platform.

5
Chairman's Statement Introduction This is an exciting time for our business as we move firmly into the process of commercialising our technologies across our Proximity Marketing and Digital Payments Divisions. Within our Proximity Marketing Division our strategy and execution in the marketplace is evolving in line with the opportunities that arise. We believe our beacon network to be the largest in the UK of its type. The fundamental basis of our business model remains focused on generating revenue from both location based mobile marketing products and the sale of data to major Data Management Providers (DMPs). Major brands and advertising agencies are increasingly looking to see greater co-ordination between multi-channel campaigns such as integrating mobile advertising with Out of Home (“OOH”) advertising. In addition, the desire for attribution (evidencing mobile advertising has been effective) combined with transparent analysis of mobile campaign results. This is an important trend for the Company as Proxama’s technology is well positioned to help with both of these aspirations in the marketplace. Update on Sale of Digital Payments Division The business continues to focus on the successful strategic sale of the Digital Payments Division. As announced on 24 June 2016, discussions regarding the potential sale of the Digital Payments Division (the “Sale”) continue to take place with a potential buyer. The potential buyer's due diligence is ongoing and discussions are active. Whilst the Company is continuing discussions with this potential buyer, it is not in a period of exclusivity and there are encouraging conversations with other potential buyers. The Board expect that the Strategic Review will complete by the end of 2016. However, there can be no certainty that an offer will be made, any sales concluded, nor as to the terms of any offer or sale. Results The trading performance of the business is in line with management expectations. The Company grew revenues and other income by over 50% to £1.53m (2015: £1.0m) and the cost-base has continued to reduce whilst maintaining investment in key areas, resulting in an EBITDA1 loss of £2.10m (2015: £3.48m). The Proximity Marketing Division income and revenue accounted for approximately 24% (£0.4m) of Group income in first half of 2016, up from 5% (£0.1m) in 2015. The directors have taken steps to reduce the running costs of the Company to the minimum level consistent with the proper running of a public company. The costs of the business continue to be managed efficiently, reducing by more than 15% on a year on year basis, with the objective of extending, as far as possible, the cash resources of the Company and the period during which the Company can sell its Digital Payments Division. The Board believes the Company is well placed to fund the business through to being cash flow positive by the end of 2017. As at 30 June 2016, the Company had a cash balance of £0.3m and during July raised £2m (before expenses) from new and existing investors. Operating Review Proximity Marketing Division Key announcements affecting the mobile proximity marketing sector from Apple and Google have served to underline the importance of this marketplace to current and future participants. One of the most significant is that Google continue to invest and develop their Nearby and Physical Web propositions globally, with physical location, as identified by a BLE beacon and the Eddystone standards, being at the heart of Google’s development in mobile. With Proxama being one of only two companies in the world and the only one outside of the US to be certified by Google as a Location Services Provider, Proxama can offer services and experiences using these technologies, significantly increasing the

6
market opportunity. Apple’s new iPhone 7 launch has also focused the spotlight on Bluetooth adoption – with the increasing move to wireless functions which require Bluetooth, it is expected that more and more consumers will default to having Bluetooth permanently on. These decisions by the industry’s major players are all combining to support our positioning and the importance of continuing to build out our leading UK beacon network. All major London public transport types are now covered, with a majority using the latest dual beacons (supporting both Apple iBeacon and Google Eddystone formats); we have partnered with most of the major OOH media players, across London bars and pubs, cinemas, regional trains, buses, taxis, airports and bars around the 20 English Premier League football grounds. Our current proximity network capability stands at around 4,000 beacons. However, it is critical to understand that the fundamental KPI of a beacon network is not the number of beacons but the consumer reach of those beacons. For example, the Company currently estimates the potential consumer reach across its beacon enabled London zone 1 and 2 stations to be over 1 billion, which is sourced from TFL’s entry and exit footfall data. Our partnership with the Emblem Group across 97 of those stations enables us to maximise the opportunity as consumers pass each one of our beacons. The Company has a campaign pipeline containing some of the most recognisable brand names in the world. So far in 2016, Proxama has worked on campaigns with Royal Bank of Canada, GLACÉAU smartwater (a division of Coca Cola), Skyscanner and in collaboration with their partner the Mobile Gamer Network, DraftKings and Crabbies. The calibre of the brands the Company is now working with, on a consistent and regular basis, is an excellent indicator of the endorsement of the proximity marketing business and there is a growing pipeline of similar campaigns still to come this year and into 2017. An important next stage for our market is around greater campaign analysis, and in particular, the demand for greater attribution of mobile campaign spend for marketers. Even in 2016 it is difficult to execute and measure effective location based targeting, and location technology is often crudely used, missing or inaccurate. We believe only beacon technology is able to determine the exact proximity of a consumer to a physical location and also the context e.g. entering a station, on a moving bus, dwelling at a pub, bar or cinema. Once this moment has been identified, Proxama can help the brand or app publisher deliver the most appropriate notification, engaging message or advert. Today the Company is also announcing the completed integration of their Software Development Kit (“SDK”) into the Android version of the iconic London Tube Map app, with our partner Mapway. The app has circa 900,000 lifetime downloads and is another step change in the Proxama audience reach across our beacon network. The Company has a strong pipeline of other major app owners, who are focused across a range of sectors. Monetising the business is now underway with campaigns going beyond trials to having a commercial element, which we expect will see accelerated revenues throughout 2016. With Proxama’s audience reach expanding significantly every month, the Company has begun the process of commercialising the anonymised data this audience generates, through data partnership agreements with the major DMPs such as Oracle BlueKai, AdSquare and Nielson. The Company anticipates growing data revenues in line with the growth of the network and advertising campaigns run across it.
Digital Payments Division The Digital Payments Division has enjoyed a successful first half of 2016. Our focus has been on accelerating the commercial availability of our Cloud Based mobile payments solutions, delivering a first class service to our existing International clients and implementing software solutions to new clients in USA and EMEA. After previously winning contracts with new clients such as Navy Federal Credit Union, Diners Club South Africa (DCSA) and Tutuka in South Africa, a significant focus has been in ensuring that we exceeded these new clients’ expectations.

7
The Division is also at final stages of selection with a number of chip and pin migration and mobile payment prospects which will further increase market penetration. Proxama has invested heavily in expanding its mobile payments solutions and now for the first time, and in response to market feedback, we can offer a Software as a Service (SaaS) model for rapid implementation of our highly scalable and resilient solutions. People The Board is pleased to announce that John Kennedy has been appointed as permanent CEO of Proxama PLC. John has been interim CEO for the Group since 15th July 2015 and has been instrumental in restructuring the business and laying the rails for an exciting Proximity Marketing business. John will continue to combine this with the CFO role whilst the Board looks to commence a search for this position.
The Board would also like to recognise the contribution made by the Proxama staff in what has been a dynamic and
challenging few months, especially given the uncertainties over the future of the Digital Payments Division. We thank
them all for their commitment and professionalism.
Outlook The very good progress which has been made reinforces the Board’s belief that the Company is establishing itself as a real presence in this rapidly expanding market of location based marketing. We believe our beacon network represents the largest such network in the UK of its type and when combined with our proven ability to execute mobile proximity engagement campaigns puts the Company in a strong position. We can now focus on capitalising on our infrastructure from both location based mobile marketing products and the sale of data to major Data Management Providers.

8
UNAUDITED INTERIM CONSOLIDATED INCOME STATEMENT
FOR THE SIX MONTHS ENDED 30 JUNE 2016
Six months ended
30 June 2016
Unaudited
Six months ended
30 June 2015
Unaudited
Year ended 31
December 2015
Audited £ £ £ Revenue 1,206,766 964,033 2,543,644 Cost of sales (260,073) (49,612) (391,941)
Gross profit 946,693 914,421 2,151,703 Administrative expenses (4,097,029) (4,829,266) (8,562,679) Administrative expenses – exceptional item
- (656,250) 109,375
Other operating income 323,496 35,527 336,727
Operating loss (2,826,840) (4,535,568) (5,964,874) Finance income 654 9,515 11,641 Finance expense (115,820) (72,781) (139,624)
Loss on ordinary activities before taxation
(2,942,006) (4,598,834) (6,092,857)
Taxation 129,962 113,879 764,815
Loss for the period (2,812,044) (4,484,955) (5,328,042)
Loss per share – basic and fully diluted (0.27p) (0.44p) (0.52p)

9
UNAUDITED INTERIM CONSOLIDATED STATEMENT OF COMPREHENSIVE INCOME
FOR THE SIX MONTHS ENDED 30 JUNE 2016
Six months ended
30 June 2016
Unaudited
Six months ended
30 June 2015
Unaudited
Year ended 31
December 2015
Audited £ £ £ Loss for the period (2,812,044) (4,484,955) (5,328,042) Foreign exchange difference arising on consolidation
(12,347) (14,964) (34,654)
Total comprehensive loss for the period attributable to equity holders
(2,824,391) (4,499,919) (5,362,696)

10
UNAUDITED INTERIM CONSOLIDATED BALANCE SHEET
AS AT 30 JUNE 2016
As at 30 June
2016 Unaudited
As at 30 June 2015
Unaudited
As at 31
December 2015
Audited £ £ £ Assets Non-current assets Intangible assets Property, plant and equipment
4,479,709 105,538
4,634,819 183,674
5,000,609 127,070
4,585,247
4,818,493 5,127,679
Current assets Trade and other receivables 821,718 793,622 1,879,744 Current tax receivable - 519,923 684,277 Cash and cash equivalents 348,790 1,610,371 270,487
1,170,508 2,923,916 2,834,508 Current liabilities Trade and other payables (1,736,882) (2,070,111) (2,014,986) Current portion of long-term borrowings
(4,301)
(964,149)
(2,747)
(1,741,183) (3,034,260) (2,017,733) Net current assets (570,675) (110,344) 816,775
4,014,572 4,708,149 5,944,454 Non-current liabilities Non-current borrowings Deferred Tax liabilities
(2,893,305) (420,800)
(8,403) (553,600)
(1,967,456) (487,200)
Net assets 700,467 4,146,146 3,489,798
Equity Share capital 10,404,372 10,194,393 10,195,024 Share premium account 8,985,383 8,703,332 8,703,332 Share based payment reserve 969,605 729,169 934,966 Merger relief reserve Translation Reserve
11,605,556 (38,839)
11,605,556 (6,802)
11,605,556 (26,492)
Capital reserve 209,791 209,791 209,791 Equity reserve 44,160 546,178 535,138 Other reserve (9,225,108) (9,225,108) (9,225,108) Retained deficit (22,254,453) (18,610,363) (19,442,409)
Total equity 700,467 4,146,146 3,489,798

11
John Kennedy
Director

12
UNAUDITED INTERIM CONSOLIDATED CASH FLOW STATEMENT
AS AT 30 JUNE 2016
Six months ended
30 June 2016
Unaudited
Six months ended
30 June 2015
Unaudited
Year ended 31
December 2015
Audited £ £ £ Cash flows from operating activities Loss for the period (2,812,044) (4,598,834) (6,092,857) Adjustments for: Depreciation of property, plant and equipment 49,810 51,964 107,635 Amortisation of intangible assets 677,917 418,763 890,295 Impairment of intangibles assets 35,668 - 87,777 Profit on disposal of assets (2,460) - (2,512) Financial income (654) (9,515) (11,641) Financial expense 115,820 72,781 139,624 Foreign exchange difference (164) - (34,455) Share-based payments 34,639 129,720 335,517
(1,901,468) (3,935,121) (4,580,617) Decrease/(increase) in trade and other receivables 1,058,026 166,340 (976,044) Increase/(decrease) in trade and other payables (344,504) 93,483 (38,359)
Cash used in operations (1,187,946) (3,675,298) (5,518,302) Current tax credits 684,277 172,643 649,087
Net cash used in operating activities (503,669) (3,502,655) (4,869,215) Cash flows from investing activities Interest received 654 9,515 11,641 Purchase of intangible assets (192,685) (131,805) (1,056,904) Purchase of property, plant and equipment (28,114) (35,909) (39,314) Sale of property, plant and equipment 2,460 - 6,850
Net cash used in investing activities (217,685) (158,199) (1,077,727) Cash flows from financing activities Interest paid (95,820) (41,617) (93,082) Issue of share capital 421 6,721 7352 Convertible loan note redeemed (Interest) Convertible loan note redeemed (Principal)
- -
- -
(127,534) (100,000)
New HP Loans 11,699 - - New long-term loan 900,000 - 1,600,000 Repayment of bank loans - - (10,249) Repayments of finance lease agreements (4,296) - (6,014) Repayment of other borrowings - (182,482) (556,412)
Net cash from financing activities 812,004 (217,378) 714,061 Net increase/(decrease) in cash & cash equivalents 90,650 (3,878,232) (5,232,881) Cash and cash equivalents at beginning of period 270,487 361,379 5,503,567 Exchange differences on cash and cash equivalents (12,347) - (199)
Cash and cash equivalents at end of period 348,790 54,719 270,487

13
UNAUDITED INTERIM CONSOLIDATED STATEMENT OF CHANGES IN EQUITY
FOR THE PERIOD ENDED 30 JUNE 2016
Share capital
Share premium
Capital reserve
Translation Reserve
Merger relief
reserve
Share based
payment reserve
Equity reserve
Other reserve
Retained deficit
Total
£ £ £ £ £ £ £ £ £ £
At 1 January 2015 10,187,672 8,703,332 209,791 8,162 11,605,556 599,449 546,178 (9,225,108) (14,125,407) 8,509,625
Loss for the year - - - - - - - - (4,484,955) (4,484,955)
Other Comprehensive Income
- - - (14,964) - - - - - (14,964)
Total comprehensive income for the period attributable to equity holders
- - - (14,964) - - - - (4,484,955) (4,499,919)
Issue of shares 6,721 - - - - - - - - 6,721
Equity element of convertible loan
- - - - - - - - -
Share based payments
- - - - - 129,719 - - - 129,719
Share issue costs - - - - - - - - - -
Total transactions with owners
6,721 - - - - 129,719 - - - 342,869
Total movement in shareholder’s equity
6,721 - - (14,964) - 129,719 - - (4,484,955) (4,363,478)
At 30 June 2015 10,194,393 8,703,332 209,791 (6,802) 11,605,556 729,168 546,178 (9,225,108) (18,610,362) 4,146,146
At 1 July 2015 10,194,393 8,703,332 209,791 (6,802) 11,605,556 729,168 546,178 (9,225,108) (18,610,362) 4,146,146
Loss for the year
-
-
-
-
-
-
-
- (843,087) (843,087)
Other Comprehensive Income
- - - (19,690) - - - - - (19,690)
Total comprehensive income for the period attributable to equity holders
- - - (19,690) - - - - (843,087) (862,777)
Issue of shares 631 - - - - - - - - 631
Equity element of convertible loan
- - - - - - (11,040) - 11,040 -
Share based payments
- - - - - 205,798 - - - 205,798
Share issue costs - - - - - - - - - -
Total transactions with owners
631 - - - - 205,798 (11,040) - 11,040 206,429
Total movement in shareholder’s equity
631 - - (19,690) - 205,798 (11,040) - (832,047) (656,348)
At 31 December 2015 10,195,024 8,703,332 209,791 (26,492) 11,605,556 934,966 535,138 (9,225,108) (19,442,409) 3,489,798
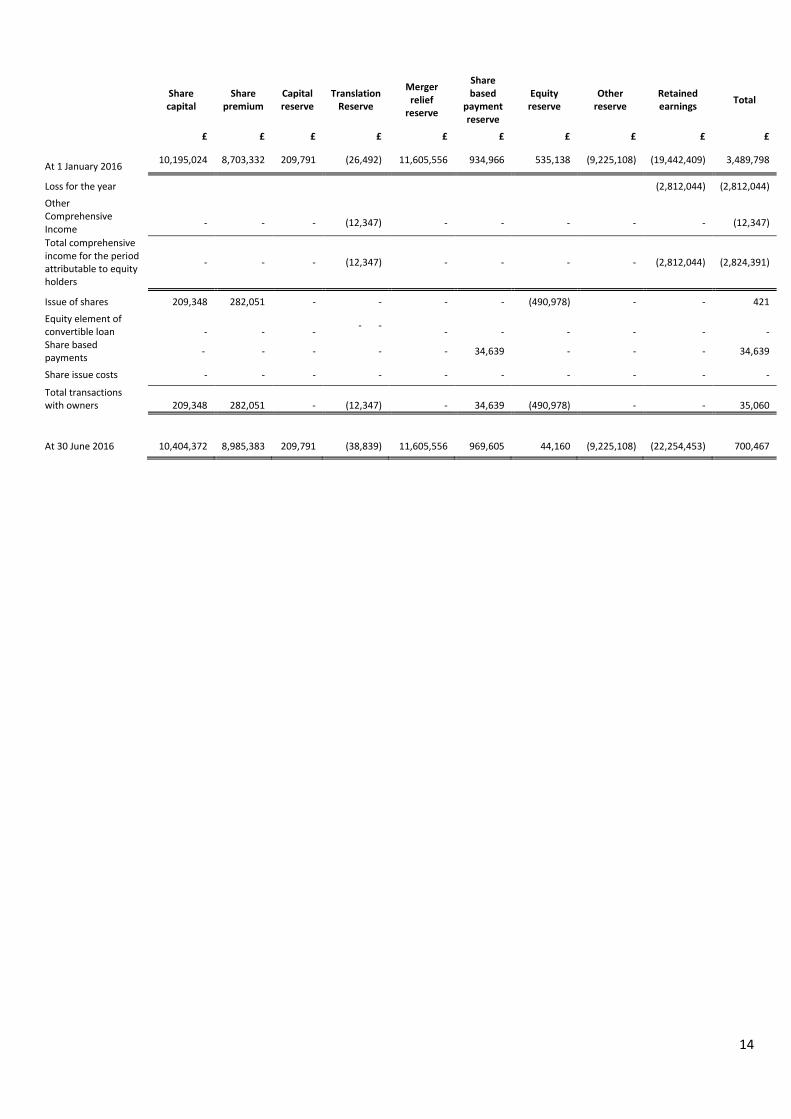
14
Share capital
Share premium
Capital reserve
Translation Reserve
Merger relief
reserve
Share based
payment reserve
Equity reserve
Other reserve
Retained earnings
Total
£ £ £ £ £ £ £ £ £ £
At 1 January 2016
10,195,024 8,703,332 209,791 (26,492) 11,605,556 934,966 535,138 (9,225,108) (19,442,409) 3,489,798
Loss for the year (2,812,044) (2,812,044)
Other Comprehensive Income
-
-
-
(12,347)
-
-
-
-
-
(12,347)
Total comprehensive income for the period attributable to equity holders
- - - (12,347) - - - - (2,812,044) (2,824,391)
Issue of shares 209,348 282,051 - - - - (490,978) - - 421
Equity element of convertible loan
-
-
-
- -
-
-
-
-
-
- Share based payments
- - - - - 34,639 - - - 34,639
Share issue costs - - - - - - - - - -
Total transactions with owners
209,348
282,051
-
(12,347)
-
34,639
(490,978)
-
-
35,060
At 30 June 2016 10,404,372 8,985,383 209,791 (38,839) 11,605,556 969,605 44,160 (9,225,108) (22,254,453) 700,467

15
NOTES TO THE UNAUDITED INTERIM CONSOLIDATED FINANCIAL STATEMENTS
FOR THE SIX MONTHS ENDED 30 JUNE 2016
1. GENERAL INFORMATION
Proxama PLC (“the Company”) and its subsidiaries are an international mobile commerce Company operating
across two divisions specialising in proximity marketing via mobile and providing end-to-end solutions for card
issuers to migrate customers from magnetic stripe credit and debit cards to contactless mobile payments.
Proxama has been at the forefront of this market for the last 10 years.
Today, Proxama’s solutions are used by banks, financial institutions, mobile app companies, media owners,
stadium owners, retailers and brands. Current clients include: Diners Club, Navy Credit Union, Fiserv, Nets,
Exterion Media, Skyscanner, O2 and Ubiquitous.
The Proximity Marketing Division:
Focuses on connecting consumers to brands and retailers via Bluetooth Low Energy (BLE) beacon
technology and Near Field Communication (NFC). Proxama establishes and owns beacon infrastructure
networks in high footfall locations such as City Centres, transport networks, stadia, shopping malls,
entertainment hubs and retail outlets, which are then able to communicate to consumers via messages to
mobiles when the consumer is in close proximity to a beacon. The technology platform at the heart of this
division is TapPoint®.
The Payments Division:
Manages end-to-end credit and debit cards solutions on behalf of financial institutions in the United States,
Europe, Africa and the Middle East and specialises in enabling the migration of cards from magnetic stripe
cards, to chip and pin cards and from contactless chip cards to mobile devices. The technology behind this
division is Proxama’s Digital Enablement Platform.
The Company is a public limited company which is listed on the Alternative Investment Market of the London
Stock Exchange and is incorporated and domiciled in the United Kingdom. The address of its registered office is
given on the Company Information page.
2. BASIS OF PREPARATION
The financial information has been prepared in accordance with International Financial Reporting Standards
(“IFRS”) as adopted by the European Union, IFRIC interpretations and with those parts of the Companies Act
2006 applicable to companies reporting under IFRS. The accounting policies adopted are consistent with those
of the financial statements for the year ended 31 December 2015, as described in those financial statements.
The figures for the six-month periods ended 30 June 2016 and 30 June 2015 have not been audited. The figures
for the year ended 31 December 2015 have been extracted from, but do not constitute, the consolidated
financial statements of Proxama PLC for that year. Those financial statements have been delivered to the
Registrar of Companies and included an auditors’ report, which was unqualified and did not contain a statement
under Section 498(2) or Section 498(3) Companies Act 2006.

16
3. LOSS PER SHARE
Six months ended
30 June 2016 Unaudited
Six months ended
30 June 2015 Unaudited
Year ended 31 December
2015 Audited
£ £ £ Loss attributable to shareholders (2,812,044) (4,484,955) (5,328,042)
Loss attributable to shareholders excluding exceptions items
(2,812,044)
(3,828,705)
(5,437,417)
Number Number Number
Weighted average number of shares (basic)
1,030,027,685 1,018,877,152
1,019,185,906
The calculation of basic loss per share is based on loss after taxation and the weighted average number of
ordinary shares of 1p each in issue during the period.
4. EXCEPTIONAL ITEMS
The 2015 exceptional item of £109,375 was the reversal of the previous year’s earn-out consideration
accounted for as contingent post acquisition remuneration on the acquisition of Aconite. This was reversed as
the conditions for the settlement were not met. The exceptional item of (£650,250) was the provision for 6
months’ contingent earn out consideration as at 30th June 2015. This was not required as at 31st December
2015.
5. AVAILABILITY OF HALF YEARLY REPORT
Copies of the half yearly report are available upon request to members of the public from the Company’s
registered office at 7/28 Eastcastle Street, London W1W 8DH. This half yearly report can also be viewed at
www.proxama.com/investors.