Embed Size (px)
Citation preview
8/8/2019 Prowess Example)
http://slidepdf.com/reader/full/prowess-example 1/9
What is Prowess?
Prowess is a database of the financial performance of around 25000 Indian
companies. It has been created by the Centre for Monitoring Indian Economy Pvt.
Ltd.(CMIE). It covers listed as well as unlisted companies, large and medium public
limited companies, government owned companies, some privately held companies,
some cooperatives and even some business entities that are not companies. It is a
database of the financials of companies.
Guide to Using PROWESS
Following is the home page of PROWESS that will appear on your screen when you
click on the PROWESS icon on your desktop.
8/8/2019 Prowess Example)
http://slidepdf.com/reader/full/prowess-example 2/9
Prowess is designed to help users access information for individual companies. There
are tools to search companies in the database that match search-criteria provided by
users. Prowess presents several tabulations (such as financial statements) and charts
(including those of share prices). These presentations help the user in quickly
analysing the companies in the database. It is useful to understand the Prowess
software as a system that undertakes two tasks for the user – first, it searches
companies in the database, and secondly, it presents information on companies in theform of tabulations and charts. Each is explained a little more below:
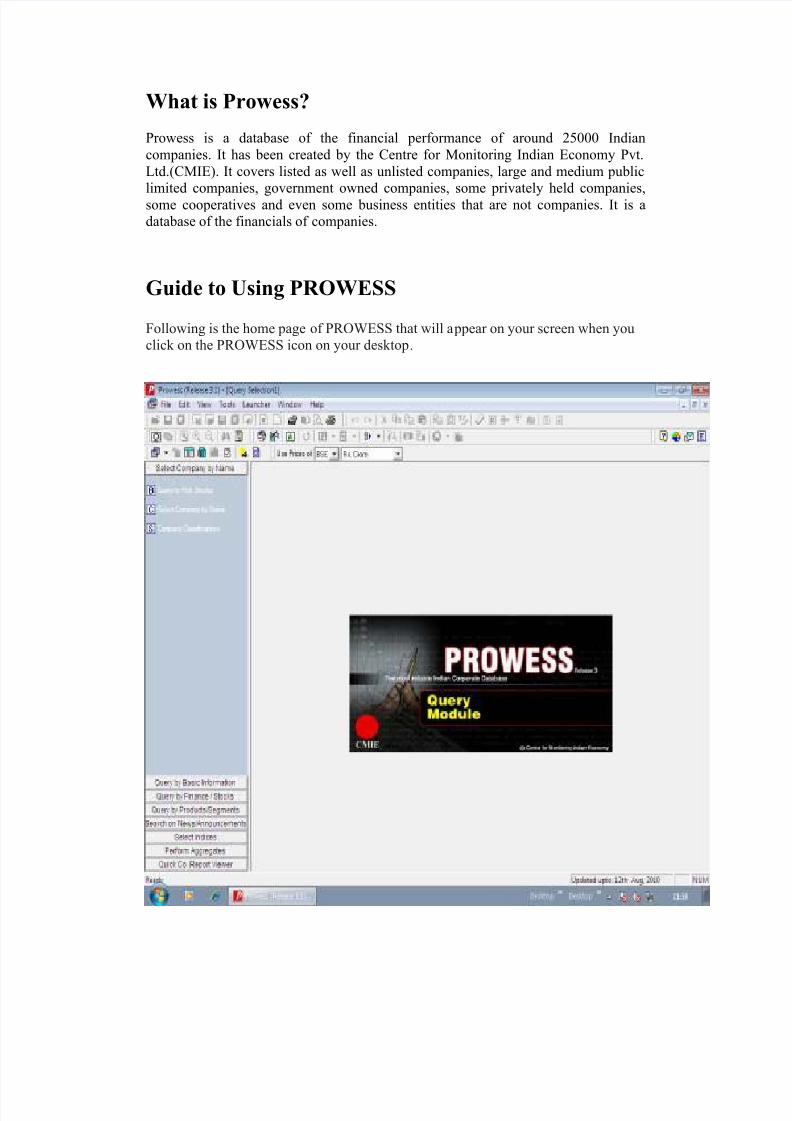
Suppose you want to know the sales price, profit, address, pin code etc of all the
companies registered in Madhya Parades. For processing this query you need to
follow these mentioned steps.
Please click on the Query by basic information
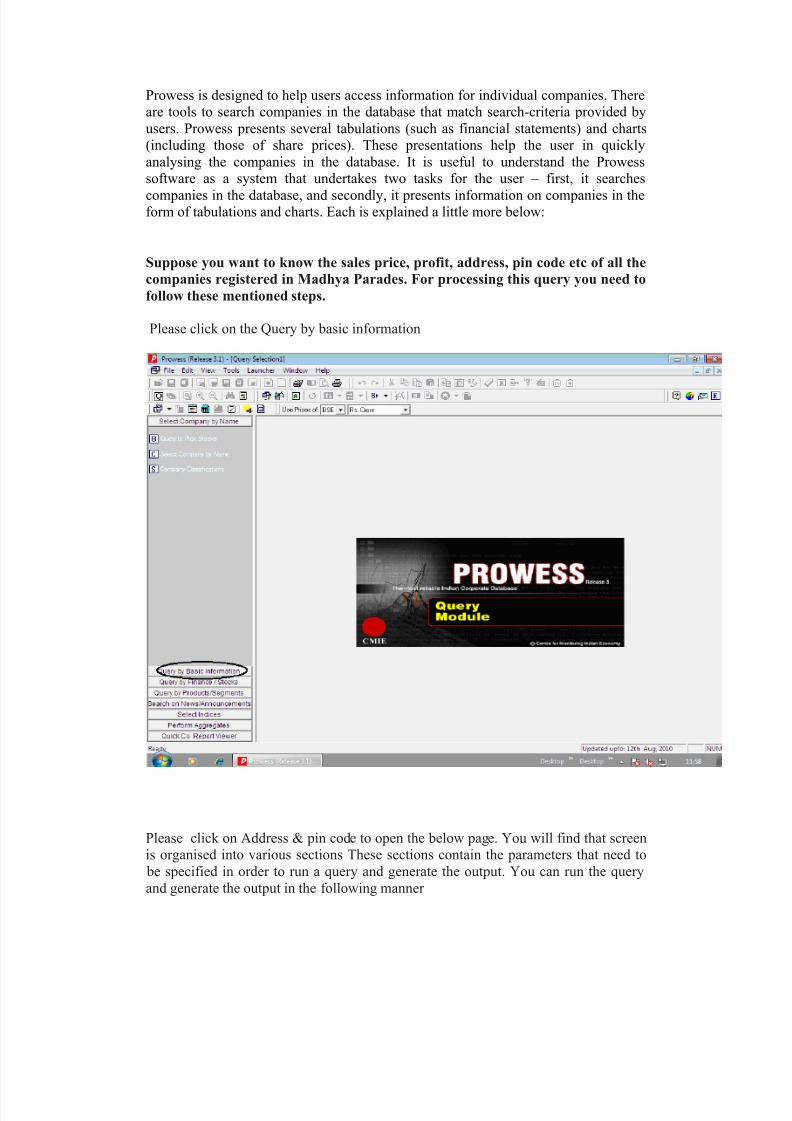
Please click on Address & pin code to open the below page. You will find that screen
is organised into various sections These sections contain the parameters that need to
be specified in order to run a query and generate the output. You can run the query
and generate the output in the following manner
8/8/2019 Prowess Example)
http://slidepdf.com/reader/full/prowess-example 3/9
State & District : Here, you will select the state for which you need to generate data,
say, Madhya Pradesh.
Select Address type to search by: Registered
Display Data: Show address with tel, fax, Email, Website Adress
Execute Commands: Having specified all the query parameters above, you need to
run the query by using one of the execute commands. This can be done by clicking on
‘New’ Buttton
8/8/2019 Prowess Example)
http://slidepdf.com/reader/full/prowess-example 4/9
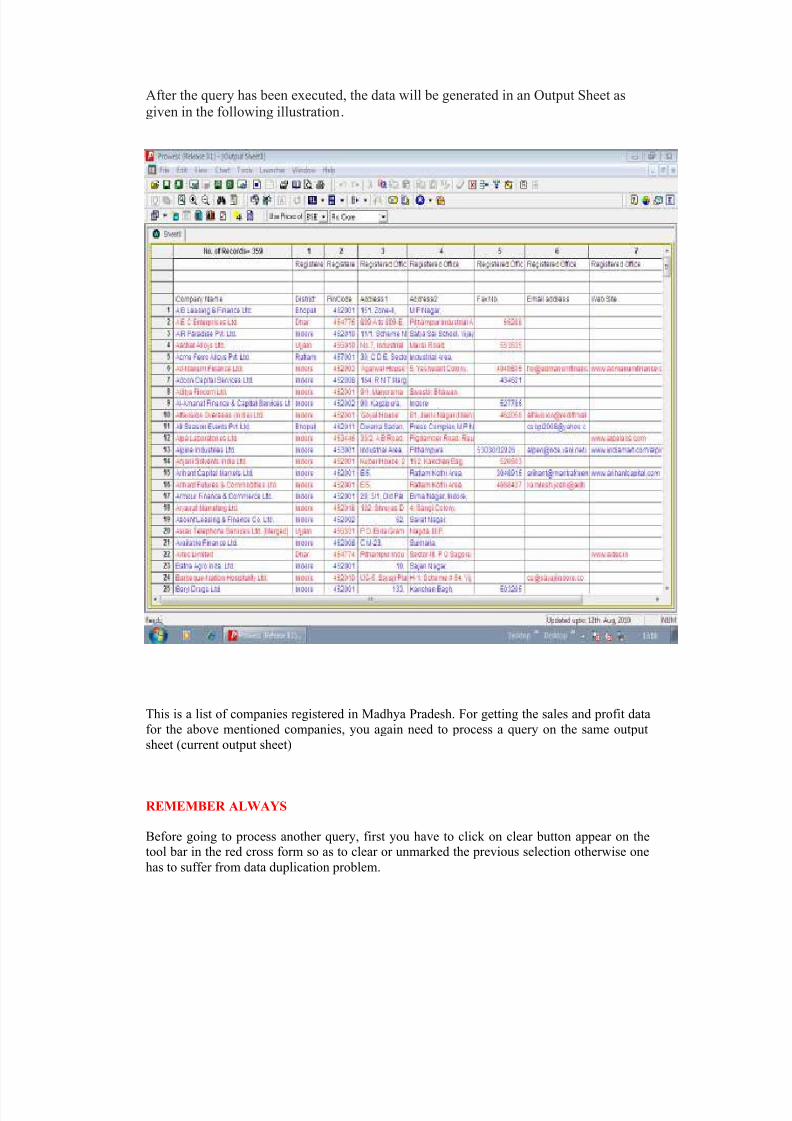
After the query has been executed, the data will be generated in an Output Sheet as
given in the following illustration.
This is a list of companies registered in Madhya Pradesh. For getting the sales and profit data
for the above mentioned companies, you again need to process a query on the same output
sheet (current output sheet)
REMEMBER ALWAYS
Before going to process another query, first you have to click on clear button appear on thetool bar in the red cross form so as to clear or unmarked the previous selection otherwise one
has to suffer from data duplication problem.
8/8/2019 Prowess Example)
http://slidepdf.com/reader/full/prowess-example 5/9
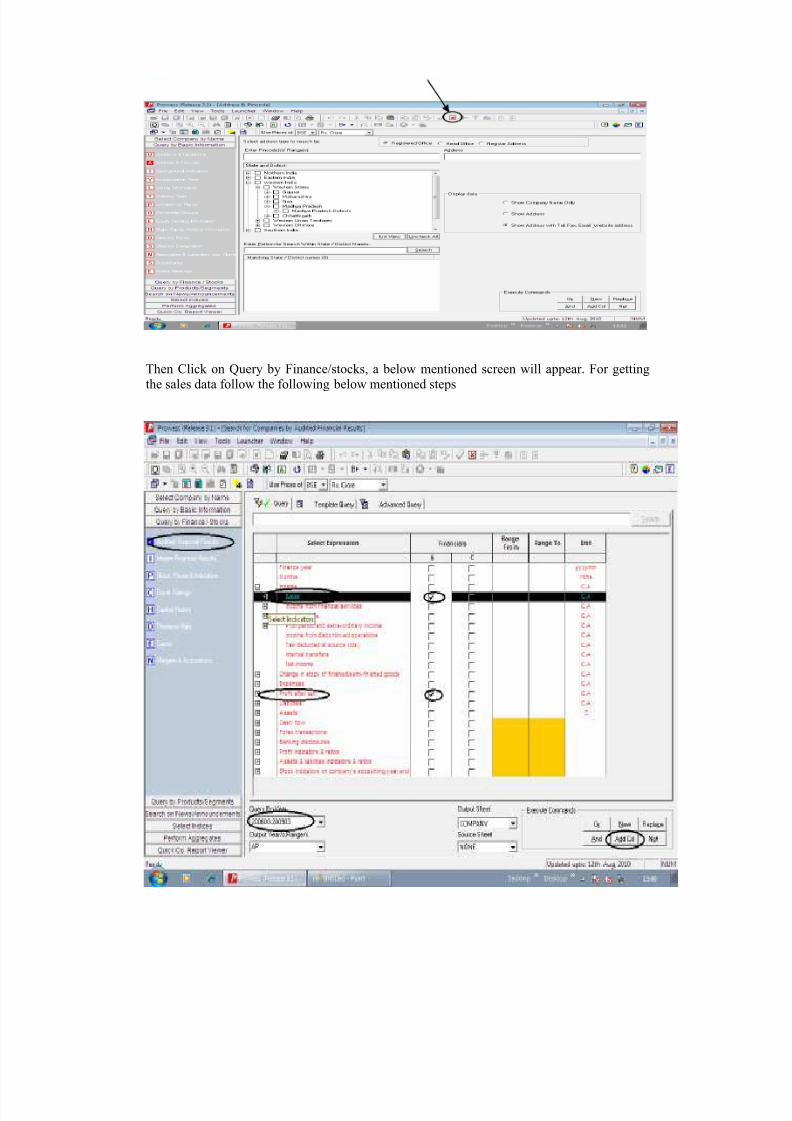
Then Click on Query by Finance/stocks, a below mentioned screen will appear. For gettingthe sales data follow the following below mentioned steps
8/8/2019 Prowess Example)
http://slidepdf.com/reader/full/prowess-example 6/9
Click on the Audited financial result on the extreme left hand side
Select expression: Click on Sales and profit after sales
Financial: Here S & C is given , S means Stand alone figure and C Means
Consolidated Figures. Click “S” for the both
Query on Year : This will define the range for which the data series has to be
generated. This can be specified in ‘dd/mm/yyyy - dd/mm/yyyy’ format or in
‘yyyymm - yyyymm’ format. Thus, a data series at the selected frequency and
expression type is generated for the date range specified in the ‘Query on year’ area.
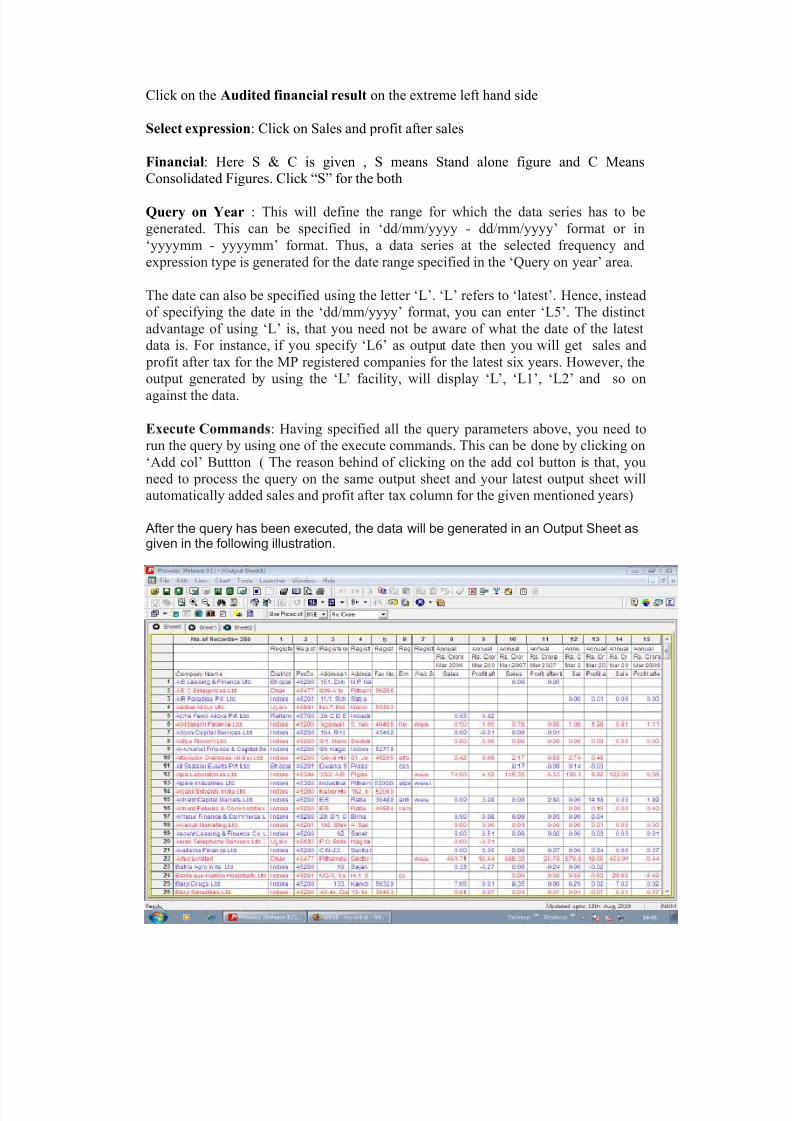
The date can also be specified using the letter ‘L’. ‘L’ refers to ‘latest’. Hence, instead
of specifying the date in the ‘dd/mm/yyyy’ format, you can enter ‘L5’. The distinct
advantage of using ‘L’ is, that you need not be aware of what the date of the latest
data is. For instance, if you specify ‘L6’ as output date then you will get sales and
profit after tax for the MP registered companies for the latest six years. However, the
output generated by using the ‘L’ facility, will display ‘L’, ‘L1’, ‘L2’ and so on
against the data.
Execute Commands: Having specified all the query parameters above, you need to
run the query by using one of the execute commands. This can be done by clicking on
‘Add col’ Buttton ( The reason behind of clicking on the add col button is that, you
need to process the query on the same output sheet and your latest output sheet will
automatically added sales and profit after tax column for the given mentioned years)
After the query has been executed, the data will be generated in an Output Sheet asgiven in the following illustration.
8/8/2019 Prowess Example)
http://slidepdf.com/reader/full/prowess-example 7/9
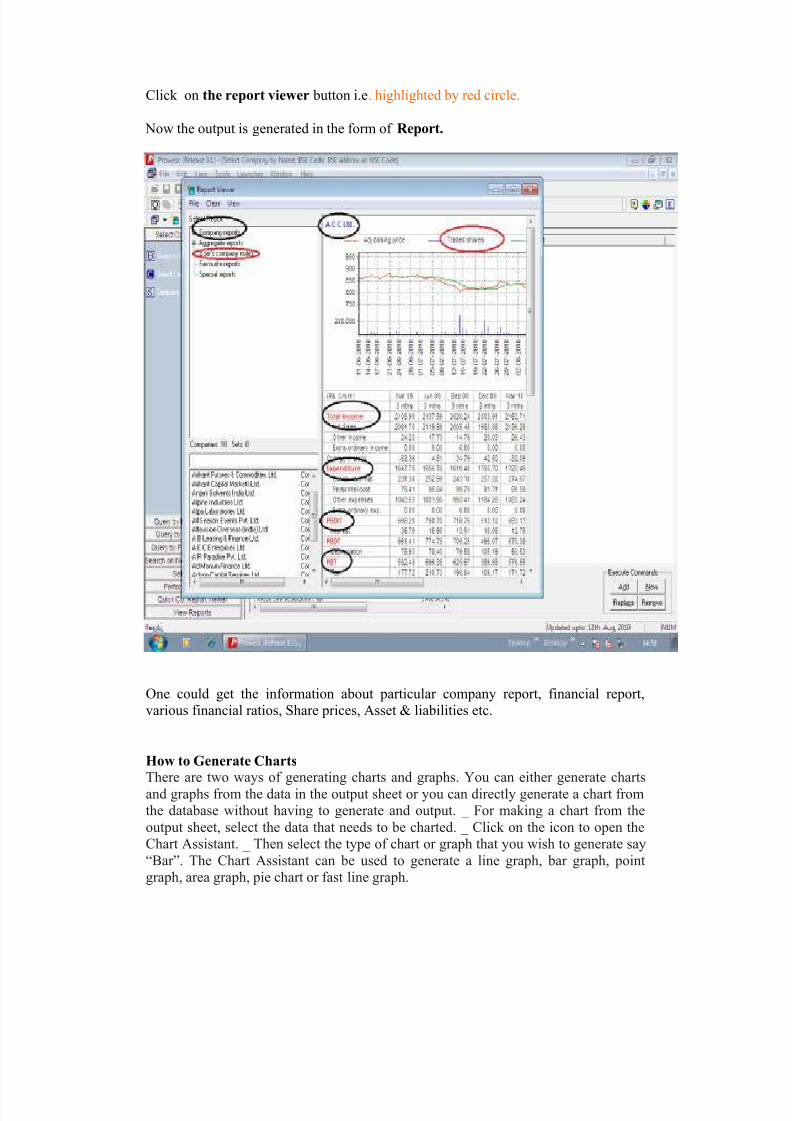
Prowess finds companies that satisfy conditions set by the user. The condition could
be as simple as the name of the company the user is interested in. The tabulations and
charts readily available in Prowess are the easier way of getting information on the
specific company.These tabulations and charts (seen in Prowess as the Report Viewer
and Charts Plotter) embody a great deal of understanding of disclosure practices of
companies in India, years of experience in dealing with hundreds of thousands of
Annual Reports and interim financial statements of companies and, most importantly,an expertise in analysing companies built over three decades. The tabulations have
been created by CMIE’s analysts. They are designed to help the user quickly
understand the strengths and weaknesses of a company. The reports are designed to
help the user understand the company’s performance in great detail, in the context of
its historical performance, in the context of the performance of its peers and in the
context of the performance of its industry.
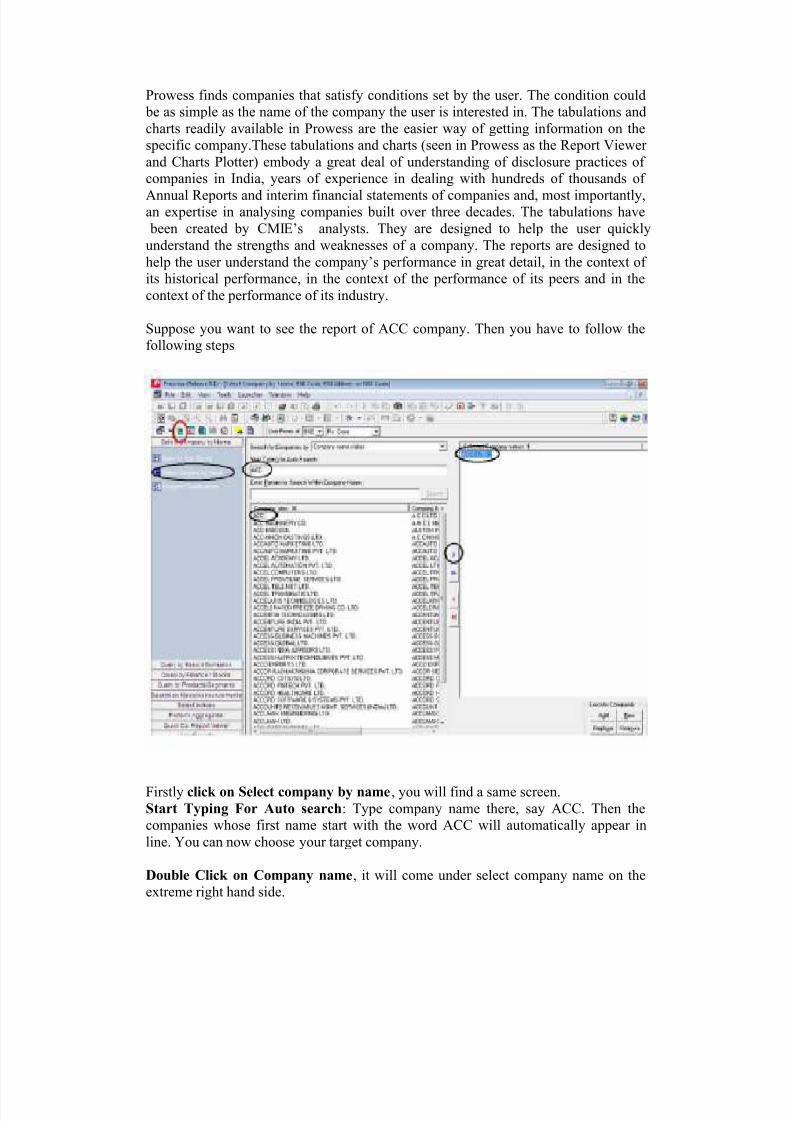
Suppose you want to see the report of ACC company. Then you have to follow the
following steps
Firstly click on Select company by name, you will find a same screen.
Start Typing For Auto search: Type company name there, say ACC. Then the
companies whose first name start with the word ACC will automatically appear in
line. You can now choose your target company.
Double Click on Company name, it will come under select company name on the
extreme right hand side.
8/8/2019 Prowess Example)
http://slidepdf.com/reader/full/prowess-example 8/9
8/8/2019 Prowess Example)
http://slidepdf.com/reader/full/prowess-example 9/9
_