Embed Size (px)
DESCRIPTION
how to use prowess
Citation preview
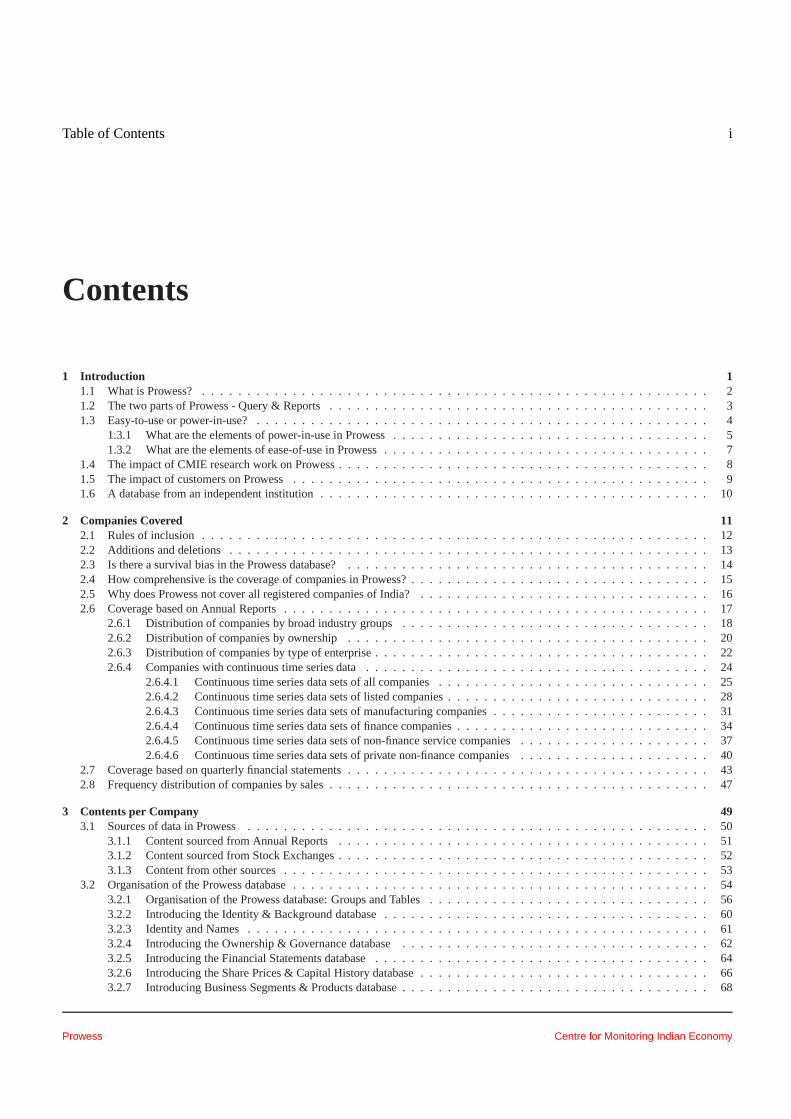
Table of Contents i
Contents
1 Introduction 11.1 What is Prowess? . . . . . . . . . . . . . . . . . . . . . . . . . . . . . . . . . .. . . . . . . . . . . . . . . . . . . . . . 21.2 The two parts of Prowess - Query & Reports . . . . . . . . . . . . . .. . . . . . . . . . . . . . . . . . . . . . . . . . . . 31.3 Easy-to-use or power-in-use? . . . . . . . . . . . . . . . . . . . . . .. . . . . . . . . . . . . . . . . . . . . . . . . . . . 4
1.3.1 What are the elements of power-in-use in Prowess . . . . .. . . . . . . . . . . . . . . . . . . . . . . . . . . . . . 51.3.2 What are the elements of ease-of-use in Prowess . . . . . .. . . . . . . . . . . . . . . . . . . . . . . . . . . . . . 7
1.4 The impact of CMIE research work on Prowess . . . . . . . . . . . .. . . . . . . . . . . . . . . . . . . . . . . . . . . . . 81.5 The impact of customers on Prowess . . . . . . . . . . . . . . . . . . .. . . . . . . . . . . . . . . . . . . . . . . . . . . 91.6 A database from an independent institution . . . . . . . . . . .. . . . . . . . . . . . . . . . . . . . . . . . . . . . . . . . 10
2 Companies Covered 112.1 Rules of inclusion . . . . . . . . . . . . . . . . . . . . . . . . . . . . . . . .. . . . . . . . . . . . . . . . . . . . . . . . 122.2 Additions and deletions . . . . . . . . . . . . . . . . . . . . . . . . . . .. . . . . . . . . . . . . . . . . . . . . . . . . . 132.3 Is there a survival bias in the Prowess database? . . . . . . .. . . . . . . . . . . . . . . . . . . . . . . . . . . . . . . . . 142.4 How comprehensive is the coverage of companies in Prowess? . . . . . . . . . . . . . . . . . . . . . . . . . . . . . . . . . 152.5 Why does Prowess not cover all registered companies of India? . . . . . . . . . . . . . . . . . . . . . . . . . . . . . . . . 162.6 Coverage based on Annual Reports . . . . . . . . . . . . . . . . . . . .. . . . . . . . . . . . . . . . . . . . . . . . . . . 17
2.6.1 Distribution of companies by broad industry groups . .. . . . . . . . . . . . . . . . . . . . . . . . . . . . . . . . 182.6.2 Distribution of companies by ownership . . . . . . . . . . . .. . . . . . . . . . . . . . . . . . . . . . . . . . . . 202.6.3 Distribution of companies by type of enterprise . . . . .. . . . . . . . . . . . . . . . . . . . . . . . . . . . . . . . 222.6.4 Companies with continuous time series data . . . . . . . . .. . . . . . . . . . . . . . . . . . . . . . . . . . . . . 24
2.6.4.1 Continuous time series data sets of all companies . .. . . . . . . . . . . . . . . . . . . . . . . . . . . . 252.6.4.2 Continuous time series data sets of listed companies . . . . . . . . . . . . . . . . . . . . . . . . . . . . . 282.6.4.3 Continuous time series data sets of manufacturing companies . . . . . . . . . . . . . . . . . . . . . . . . 312.6.4.4 Continuous time series data sets of finance companies . . . . . . . . . . . . . . . . . . . . . . . . . . . . 342.6.4.5 Continuous time series data sets of non-finance service companies . . . . . . . . . . . . . . . . . . . . . 372.6.4.6 Continuous time series data sets of private non-finance companies . . . . . . . . . . . . . . . . . . . . . 40
2.7 Coverage based on quarterly financial statements . . . . . .. . . . . . . . . . . . . . . . . . . . . . . . . . . . . . . . . . 432.8 Frequency distribution of companies by sales . . . . . . . . .. . . . . . . . . . . . . . . . . . . . . . . . . . . . . . . . . 47
3 Contents per Company 493.1 Sources of data in Prowess . . . . . . . . . . . . . . . . . . . . . . . . . .. . . . . . . . . . . . . . . . . . . . . . . . . 50
3.1.1 Content sourced from Annual Reports . . . . . . . . . . . . . . .. . . . . . . . . . . . . . . . . . . . . . . . . . 513.1.2 Content sourced from Stock Exchanges . . . . . . . . . . . . . .. . . . . . . . . . . . . . . . . . . . . . . . . . . 523.1.3 Content from other sources . . . . . . . . . . . . . . . . . . . . . . .. . . . . . . . . . . . . . . . . . . . . . . . 53
3.2 Organisation of the Prowess database . . . . . . . . . . . . . . . .. . . . . . . . . . . . . . . . . . . . . . . . . . . . . . 543.2.1 Organisation of the Prowess database: Groups and Tables . . . . . . . . . . . . . . . . . . . . . . . . . . . . . . . 563.2.2 Introducing the Identity & Background database . . . . .. . . . . . . . . . . . . . . . . . . . . . . . . . . . . . . 603.2.3 Identity and Names . . . . . . . . . . . . . . . . . . . . . . . . . . . . . .. . . . . . . . . . . . . . . . . . . . . 613.2.4 Introducing the Ownership & Governance database . . . .. . . . . . . . . . . . . . . . . . . . . . . . . . . . . . 623.2.5 Introducing the Financial Statements database . . . . .. . . . . . . . . . . . . . . . . . . . . . . . . . . . . . . . 643.2.6 Introducing the Share Prices & Capital History database . . . . . . . . . . . . . . . . . . . . . . . . . . . . . . . . 663.2.7 Introducing Business Segments & Products database . .. . . . . . . . . . . . . . . . . . . . . . . . . . . . . . . . 68
Prowess Centre for Monitoring Indian Economy
ii
3.2.8 Introducing the CapEx and M&A databases . . . . . . . . . . . .. . . . . . . . . . . . . . . . . . . . . . . . . . 703.3 What is Normalisation? . . . . . . . . . . . . . . . . . . . . . . . . . . . .. . . . . . . . . . . . . . . . . . . . . . . . . 71
3.3.1 The five essentials of normalisation . . . . . . . . . . . . . . .. . . . . . . . . . . . . . . . . . . . . . . . . . . . 733.3.2 Normalisation of the Identity & Background database .. . . . . . . . . . . . . . . . . . . . . . . . . . . . . . . . 753.3.3 Normalisation of the Ownership & Governance database. . . . . . . . . . . . . . . . . . . . . . . . . . . . . . . . 763.3.4 Normalisation of the Financial Statements database .. . . . . . . . . . . . . . . . . . . . . . . . . . . . . . . . . 773.3.5 Normalisation of the Share Prices & Capital History database . . . . . . . . . . . . . . . . . . . . . . . . . . . . . 793.3.6 Normalisation of the Business Segments & Products database . . . . . . . . . . . . . . . . . . . . . . . . . . . . . 803.3.7 Normalisation and its discontents . . . . . . . . . . . . . . . .. . . . . . . . . . . . . . . . . . . . . . . . . . . . 81
3.4 CMIE classifications of companies . . . . . . . . . . . . . . . . . . .. . . . . . . . . . . . . . . . . . . . . . . . . . . . 82
4 Indicators 83
Centre for Monitoring Indian Economy Prowess

1
Chapter 1
Introduction
Contents1.1 What is Prowess? . . . . . . . . . . . . . . . . . . . . . . . . . . . . . . . . . .. . . . . . . . . . . . . . . 2
1.2 The two parts of Prowess - Query & Reports . . . . . . . . . . . . . .. . . . . . . . . . . . . . . . . . . . 3
1.3 Easy-to-use or power-in-use? . . . . . . . . . . . . . . . . . . . . . .. . . . . . . . . . . . . . . . . . . . 4
1.3.1 What are the elements of power-in-use in Prowess . . . . .. . . . . . . . . . . . . . . . 5
1.3.2 What are the elements of ease-of-use in Prowess . . . . . .. . . . . . . . . . . . . . . . 71.4 The impact of CMIE research work on Prowess . . . . . . . . . . . .. . . . . . . . . . . . . . . . . . . . 8
1.5 The impact of customers on Prowess . . . . . . . . . . . . . . . . . . .. . . . . . . . . . . . . . . . . . . 91.6 A database from an independent institution . . . . . . . . . . .. . . . . . . . . . . . . . . . . . . . . . . 10
Prowess Centre for Monitoring Indian Economy
2 Introduction
1.1 What is Prowess?
Prowess is a database of the financial performance ofIndian companies. It has been created by the Cen-tre for Monitoring Indian Economy Pvt. Ltd.(CMIE)from essentially publicly available documents. It cov-ers listed companies, large and medium public lim-ited companies, government owned companies, someprivately held companies, some cooperatives and evensome business entities that are not companies. Prowessis not a directory. It is a database of the financials ofcompanies.
The Annual Report of the company is the most impor-tant source of the Prowess database. Prowess containsinformation relating to the finances of the company andratios based on these. For listed companies, Prowessalso provides data sourced from the stock exchanges.This includes share prices, changes in capital structureand announcements made by the companies or by theexchanges. Prowess also contains public informationreleased by the rating agencies, the company’s websitesand the media.
Prowess provides time-series data beginning 1989-90.The database is updated every day.
The Prowess database is packaged into a software. Thissoftware and the database are installed on the user’scomputer. The software enables database access, pre-sentation of tabulations, plotting of charts and updationof the database.
Prowess is designed to help users access informationfor individual companies. There are tools to searchcompanies in the database that match search-criteriaprovided by users. Prowess presents several tabula-tions (such as financial statements) and charts (includ-ing those of share prices). These presentations help theuser in quickly analysing the companies in the database.
It is useful to understand the Prowess software as a sys-tem that undertakes two tasks for the user – first, itsearches companies in the database, and secondly, itpresents information on companies in the form of tab-
ulations and charts. Each is explained a little more be-low:
1. Prowess finds companies that satisfy conditionsset by the user. The condition could be as sim-ple as the name of the company the user is in-terested in. Or it could be a condition on finan-cial attributes (such as size of profits or assets)or much more. It could be a ratio defined by theuser – a mathematical formula. Or, it could be asearch to find all companies belonging to a par-ticular industry or an ownership group. Prowesshas several specially designed search tools to findcompanies from the database.
This is the most powerful part of Prowess. It pro-vides tremendous flexibility to the user to filtercompanies by using an intelligent interface.
2. Prowess provides well-formatted tabulations ofthe financial statements, financial ratios, shareprices, and a lot more. These tabulations are de-signed by CMIE analysts to help the user quicklyevaluate a company’s performance during a year,or compared to its past performance, or comparedto the industry benchmarks or its peers. Prowessalso provides several plots that help the user un-derstand the company’s performance. The chart-plotting tool is interactive.
There are several dozen tabulations and charts.These collectively provide a fairly exhaustivepresentation of the performance of the com-pany as can be assessed from publicly availablesources.
Prowess is a database that is made available for usethrough several means. The installation on the user’scomputer is just one such medium to provide access.This is the oldest method of enabling access and there-fore, it (the Prowess database and the software) is alsocalled Prowess.
Centre for Monitoring Indian Economy Prowess
Introduction 3
1.2 The two parts of Prowess - Query & Reports
There are two ways in which the user can access infor-mation for companies from Prowess.
1. Users can conduct a search for companies thatmatch a set of criteria. For example, one cansearch for all companies with a profit margin ofmore than five per cent. Prowess will display allcompanies with a profit margin of more than fiveper cent with their respective profit margin val-ues. The search could have been more complex:find all non-government companies with a mar-ket capitalisation of over Rs.1,000 crore, a P/Eratio between 5 and 10, a dividend yield of over2 per cent and a debt:equity ratio of less than 1.Prowess will find all companies that meet sucha set of conditions and display their names withvalues of all the variables stated in the conditions.
The search for companies is a means of accessingthe database and asking precisely for the informa-tion you need.
2. Users may have a much simpler demand on thedatabase. They may simply want to see the profitand loss statement of the company for the re-cent years. While a profit and loss statement is asimple and well-understood construct to a persontrained in accounts, it’s precise composition is of-ten challenging for the non-accountant. Thingscan get a lot more complicated when there is aneed to see the liquidity ratios or the workingcapital cycle ratios for companies. Even a trainedaccountant would take some time and effort toconstruct such a tabulation from the raw data.
Prowess helps by having several such tabulationsbuilt-in. Users can merely pick a tabulation andsee it at the click of a button. There is no needto define it every time you need to see it. Theoptions are available through a menu-list. Thetabulations and charts are created by analysts atCMIE.
With this, if you need to look-up the financialstatements of a company, you can do so easilyfrom a large list of options.
While both the functions described above seem obviousonce they are understood, it is important to appreciatethese two tasks so that Prowess is exploited maximally.
The first option of searching companies (called theQuery Builder) gives the user complete freedom tospecify the conditions of a search or the precise datathat is sought in the output. Prowess allows users tocreate their own ratios from the basic data if they sodesire, and use such user-defined ratios in the searchcriteria. Thus, the search option is very versatile andpowerful.
The trade-off is that using this power requires training.Prowess comes packaged with several tools and func-tions. These are mostly available in the Query Buildersection. We strongly recommend that the user learnsthese and exploit the database fully.
The tabulations and charts readily available in Prowessare the easier way of getting started with Prowess.These tabulations and charts (seen in Prowess as theReport Viewer and Charts Plotter) embody a great dealof understanding of disclosure practices of companiesin India, years of experience in dealing with hundredsof thousands of Annual Reports and interim financialstatements of companies and, most importantly, an ex-pertise in analysing companies built over three decades.
The tabulations have been created by CMIE’s analysts.They are designed to help the user quickly understandthe strengths and weaknesses of a company. The reportsare designed to help the user understand the company’sperformance in great detail, in the context of its histor-ical performance, in the context of the performance ofits peers and in the context of the performance of itsindustry.
The two parts of Prowess – the Query and the Reports –compliment each other well. Query gives power to theuser and the Reports deliver sophisticated analysis.
Prowess Centre for Monitoring Indian Economy
4 Introduction
1.3 Easy-to-use or power-in-use?
There is a trade-off between an easy-to-use productand a powerful product. An easy-to-use product is onewhere all information is readily available in the mannerin which the user wants it. A powerful product gives theuser several handles to extract information in the man-ner desired. While the former has everything that ispossibly conceivable ready on a platter, the latter givesthe user the freedom to extract what is desired but itdoes not presume that it can pre-determine all the pos-sible requirements.
The choice between ease-of-use and power-in-use is notdiscrete. There is an entire spectrum of possibilities andCMIE offers several options on this spectrum.
At one end of the spectrum is a world where the userhas access to all the underlying data of Prowess withno software development from CMIE. Users can extractthe information from this raw data with the help of soft-ware engineers as desired. Such a datafeed is possible.CMIE does offer the raw data of Prowess too. This isavailable from www.prowess.cmie.com. In this setup,the user has complete freedom to develop software thatfocusses on meeting its specific requirements.
At the other end of the spectrum is a world where thedevelopers decide various views of the data and makethese available through a browser on the web. The webbrowser offers the easiest and most ubiquitous user-interface today. CMIE makes the Prowess databaseavailable in this form in www.business-beacon.com.
The Prowess desktop installation is an attempt to pro-vide the middle path – that gives power to the userto access information and it also provides easy-to-use,ready-to-view reports and charts. Thus, the Prowessdesktop installation has the best of both worlds.
The Prowess desktop installation is designed to assistthe professional analyst who would like to extract in-formation through a process of discovery. We visualisesuch an analyst to be engaged in an intensive searchfor companies that meet certain conditions and to studythe various performance parameters of a company ingreat detail. In reality, this is never a straight-forward
proposition. For example, the search for value stocks isalmost like searching for the holy grail.
The Prowess proposition is to help the professional an-alyst or the ardent student discover the companies thatare being sought without the need of professional soft-ware engineers but with as much power as a softwareengineer could bring to bear. This is the power ofProwess. We expect the professional analyst to un-dergo some simple training (possibly as much as ittakes to learn a little more than the basics of a spread-sheet). Once the user knows the basic tricks of runningProwess, the process of discovery becomes immenselyrewarding and enjoyable.
What has been described so far can be summarised tosay that Prowess has an intensive search system (theQuery Builder) that needs some training before it canbe used fruitfully, but once mastered, it is an extremelypowerful ally of the professional analyst. There is onemore element of Prowess that needs more than just alittle indulgence.
The Prowess database is not a mere copy from the orig-inal sources. The database has been built by CMIE an-alysts through a rich process of normalisation. Normal-isation is a process through which data collated fromheterogeneous sources over time are brought on to astandardised platform such that the data are compara-ble across companies and over time.
It is important that the user of the Prowess databaseunderstands this normalisation process. Lack of thisknowledge can, at times, lead to unnecessary doubts re-garding the reliability of the Prowess database. How-ever, with the knowledge of normalisation, the analysiscan get richer and the fruits of the analysis proportion-ately better.
A lack of full appreciation of the power of the QueryBuilder and of the normalisation process can sometimeslead to a feeling that Prowess is a difficult-to-use prod-uct. However, it is in fact, a powerful product that deliv-ers both, ease-of-use to the user and also power-in-useto the user.
Centre for Monitoring Indian Economy Prowess
Introduction 5
1.3.1 What are the elements of power-in-use in Prowess
Prowess is designed to help analysts harness a largenormalised database with the help of specially devel-oped analytical tools. It is designed to give power intothe hands of the user. The combination of a large nor-malised database and the analytical tools empowers theanalyst to explore the database. These deliver power tothe user to explore on his/her own. Why is a large nor-malised database necessary and what are these speciallydeveloped tools?
1. A large database.
A large database provides the perspective foranalysis. It provides a historical perspective tounderstand changes over time and over businesscycles. And, it provides a cross-sectional per-spective to understand performance in compar-ison to peers and the rest of the companies.Prowess delivers performance data on a large setof companies to enable a good comparative per-formance of individual companies.
2. A normalised database.
Normalisation is a necessary precondition inmaking comparisons. Normalisation is the pro-cess of transforming data that comes from het-erogeneous sources into a standardised formatto enable meaningful comparisons over time andacross companies. Disclosures in Annual Re-ports and many other sources vary widely acrosscompanies and over time. This makes the rawdata contained in them non-comparable for anyserious analysis. Normalisation is the processof standardising this information and rendering itmuch more useful for analysis. Prowess deliversa large and well normalised database.
3. Special functions.
The Prowess desktop installation comes pack-aged with a number of specially developed func-tions to help users exploit the database. Someof these are elementary and advanced algebraicfunctions to carry mathematical transformations.Elementary functions include those for addition,
subtraction, multiplication, division, etc. Ad-vanced functions include those to compute thecompound annual rate of growth (CARG). Suchfunctions take arguments and have a fair degreeof intelligence that make them superior to suchfunctions when used in a typical spreadsheet.Prowess functions that deal with time are par-ticularly intelligent. They understand time in anabsolute, relative and contextual sense. Prowessfunctions are perhaps, the most elementary levelof the power embedded in Prowess.
4. Query Triggers.
Query Triggers are specially designed user-interfaces that help you articulate a query cor-rectly. Often, articulating your thoughts into pre-cise actions to be executed by a computer is notsimple and straightforward. The human brain of-ten thinks in a flash. Translating such thoughtsinto precise actions takes patience in detailing.Sometimes this process gets frustrating even ifwe take the help of professional software engi-neers. The Query Triggers are templates that helpin this detailing, without the help of software en-gineers. Once you get familiar with the specialfunctions and the Query Triggers you can usethem to explore the database randomly. This isoften a very rewarding exercise.
5. Set management.
All Query Triggers deliver a set of companies thatmatch your query conditions. You may executemany queries and get many sets of companies.Prowess provides you with the system to man-age these – combine them with logical operands,And, Or, Not, etc. or to split them into compo-nents or to save them for later use, etc. CMIEdelivers many ready-to-use sets, but, it also em-powers the users to make and use sets as per theirown specific requirements.
6. Aggregates.
Prowess Centre for Monitoring Indian Economy
6 Introduction
Aggregation of data of multiple companies is ap-parently a straightforward issue. But, it gets verycomplicated when one deals with companies thathave different year-endings, different periods ofaccounting years and sometimes involve the ef-fects of mergers and acquisitions. Prowess han-dles all these complications and more to give you
the power of aggregating any set of companiesthat you may choose.
The points made above are not a description of thepower of Prowess. They are examples of the power thatProwess gives you in your hands to exploit the data effi-ciently. The power of Prowess is also in its ease-of-use,which is explained separately.
Centre for Monitoring Indian Economy Prowess
Introduction 7
1.3.2 What are the elements of ease-of-use in Prowess
The ease-of-use in Prowess is largely embedded in theReports and Charts viewer sections. Once you select acompany or a set of companies that you are interested inyou can see a range of reports and charts on these. Ana-lysts at CMIE have designed scores of tabulations basedon the normalised data available in Prowess. Similarly,a number of charts based on the share prices data areavailable in the Charts Viewer. A simple navigationsystem makes all these easily accessible.
1. Ratios.
Prowess comes packaged with several kinds ofready-to-use ratios. Many of these involve com-plex computations. Prowess ensures that theseare executed effortlessly. Ratios include those de-rived from financial statements such as on prof-itability, cost structures, liquidity ratios, work-ing capital cycle ratios, etc. Then, there are ra-tios based on share prices such as EPS, P/E, P/B,yield, etc. Users can use all these ratios directlyin a query, in reports or in charts. This is a greatconvenience compared to having to define the ra-tios everytime you need to use it. All ratios ben-efit directly from the fact that Prowess providesa normalised database. This ensures that the ra-tios are largely comparable across companies andacross time.
2. Tabulations.
CMIE analysts have designed xx tabulationsbased on the normalised data of companies andthe several ratios defined as explained above.These are organised into six parts that reflect thebasic analytical framework in Prowess. Theseare: company identity, governance, financial per-formance, share prices and changes in capital,business segments and capex and mergers & ac-quisitions. Each of these sections are presented
through several neatly laid-out tabulations withconsistent time-series in the columns. Referringto these, is an easy and quick way to analyse acompany or to understand its recent performance.
3. Comparisons.
Comparisons are very easy in Prowess. The toppanel in the Report Viewer enables the quickcomparison of a company’s performance with theaggregate performance of its peers and also withits individual peers. Prowess assumes responsi-bility for identifying the peers and for computingthe appropriate values. The same top panel in theReport Viewer also enables the computation ofgrowth and indexed values at the click of a but-ton. This is perhaps, the easiest way to analyseand compare performances of companies.
4. Charts.
The charting facility in Prowess is versatile andeasy-to-use. You can plot technical charts ofshare prices or of other indicators such as income,profits, assets or ratios based on these or share inownership of promoters, etc. All indicators areselectable from a drop-down menu. Use of theplotting facility is thus very easy. Charts can alsobe plotted from the output sheet which is gen-erated from a query. This again is very simple asthe chart gets plotted as you drag the cursor alongthe values to be plotted.
5. Batches.
Batches simplify your work enormously whenyou have to undertake a task repeatedly. Batchesstore a series of actions. A stored series of ac-tions can be executed at the click of a button inthe batches section.
Prowess Centre for Monitoring Indian Economy
8 Introduction
1.4 The impact of CMIE research work on Prowess
The Centre for Monitoring Indian Economy Pvt Ltd(CMIE) is the creator of the Prowess database. It con-ceptualised and developed this database and it main-tains it.
The Prowess database is part of a larger database on theIndian economy created by CMIE. This larger databasewas conceptualised by CMIE as a seamlessly integratedrepository of all kinds of information on the economybuilt from a large number of public and private sources.The database includes information sourced from gov-ernment departments, non-government institutions suchas regulators and exchanges, industry and trade associ-ations, company releases and from primary surveys in-cluding those conducted directly by CMIE.
This large and integrated database helps CMIE meet itsmission, which is to understand the dynamics of theeconomy and use this understanding to help its cus-tomers take informed decisions.
We believe that understanding the performance of com-panies is central to understanding any economy. Com-panies take investment decisions, create employment,provide goods and services and create investor value. Itis enterprise, more than any other institution, that drivesa modern economy.
CMIE uses the company-level data of Prowess, its ag-gregates and its various sub-aggregates (created by slic-ing and dicing the database appropriately) to gain in-sights into the workings of the economy.
CMIE is thus not a mere database vendor in the tradi-tional sense of the term. It does not merely collect theinformation from original sources, develop a navigationsoftware and deliver this to users. CMIE is first, an in-tensive user of the Prowess database.
One useful effect of the intensive use of the Prowessdatabase for internal research at CMIE is that the pro-cesses and tools we develop for using this database in-house are eventually ported to the Prowess desktop in-
stallations. Prowess users are direct beneficiaries ofCMIE’s experience and expertise as a Prowess databaseuser.
Normalisation is perhaps, the most important featurearising out of CMIE’s intensive research on disclo-sure practices by companies in India. Normalisationis inevitable in building databases from heterogenoussources. And, normalisation is critical in decipheringthe trend in a timeseries or in making comparisons ina cross-section of data on companies. CMIE’s study ofhundreds of thousands of Annual Reports over the pasttwo decades bestows it with unique capabilities to de-liver an appropriately normalised database that is bestsuited for analysis.
Normalisation facilitates superior ratio analysis. Thetabulations that incorporate these ratios reflect the re-search capabilities of the CMIE analysts team.
Aggregates is another very useful feature that hasemanated from CMIE’s intensive use of the Prowessdatabase. There is a lot that goes behind the makingof an aggregate. The algorithm to create a dataset foraggregation was honed by CMIE analysts for internaluse and this was then ported to the desktop Prowess.
The classification of companies into industry groups,ownership groups, age groups and size groups is the re-sult of CMIE’s inhouse research. Computation of totalreturns that includes changes in prices, dividends andother gains is also the outcome of CMIE’s inhouse re-search. These total returns are used to create the COSPIindices that include the largest number of frequentlytraded securities.
A pure database vendor would refrain from straying toofar from providing data feeds. Only a research organ-isation such as CMIE ventures out into the domain ofexperts – such as is required for normalisation, ratio cal-culations, etc. Prowess is thus more than just a databaseon Indian companies. It is also the encapsulation ofCMIE’s expertise on analysing companies.
Centre for Monitoring Indian Economy Prowess
Introduction 9
1.5 The impact of customers on Prowess
The Prowess database and the desktop installation ser-vice have been in existence for over two decades. Dur-ing this period, hundreds of thousands of users haveworked on the database and the software and many ofthem have given very useful feedback. Many have madesuggestions to make Prowess better suited to their spe-cific requirements. Some have even pointed out short-comings in the data or in the software.
We are grateful to all of those who provided us feed-back. We believe it would have been impossible forProwess to be the successful product it is today, with-out the active participation of users.
CMIE takes enormous efforts to ensure that thedatabase is free of any inconsistency or mistakes. Thereare validation rules at various levels of data-capture toensure that the data is free of any problems.
The probability of an error entering the database is ex-tremely small. Yet, given that the Prowess database iscreated out of a heterogeneous set of sources that havedifferent updation cycles and adhere to different stan-dards, it is possible that some problems may creep in.Problems are of many kinds. Some are genuine prob-lems that warrant immediate correction. Others are onlyapparent problems since they are the effect of CMIE’snormalisation, others are a matter of choice in the faceof imperfect information.
User feedback is critical to correct problems or explainnormalisation or clarify our choice in the face of imper-fect information.
The feedback is similarly very important in our devel-opmental work. Prowess is continuously upgraded. Wekeep adding new features and improving old ones. Userfeedback plays an important role in ensuring that thedevelopmental work is better suited to the customers’requirements.
Prowess feedback has increased over time for threegood reasons.
First, the number of active users has increased. AsProwess installations have kept increasing, the num-ber of active users has also kept increasing. This hasbrought in many new users. The steady increase in newusers ensures a steady stream of new suggestions. Wevalue this immensely.
Secondly, Prowess has become a part of the internalprocesses of several companies. And, it keeps findingnew applications in new companies. These applicationslead to new demands on Prowess that often culminatein enhancement of Prowess features.
Thirdly, seasoned users have kept raising the bar. Aspositive feedback from seasoned users leads to productenhancements, expectations of these seasoned users in-creases, which leads to greater feedback. The virtuousloop keeps helping the growth of Prowess.
Users’ demand led to intra-day updates to Prowess. Itled to the addition of the Template Query and .xls out-puts.
All feedback received by us does not get incorporatedin the product. We may disagree with some sugges-tions. For example, we have disagreed with suggestionsin the past that Prowess should include data from theabridged balance sheet of companies if the full balancesheet data is not available. We believe that complete in-formation is an important distinction that the Prowessdatabase makes from being a directory. Prowess is ananalytical tool and not a directory of companies.
Yet, there are features that have been added in spite ofa lack of our agreement on its full utility. For exam-ple, Prowess carries an interactive technicals chartingtoolkit. CMIE analysts do not use technicals chartingand we do not have a view on its utility. Nevertheless,since its addition in Prowess has not compromised anyother application and has apparently added to the utilityof the database to some of our clients, we have happilyadded the feature.
Prowess Centre for Monitoring Indian Economy
10 Introduction
1.6 A database from an independent institution
Prowess is a product of a completely independent or-ganisation. The Centre for Monitoring Indian EconomyPvt Ltd, the owner of the Prowess database, is a privateresearch organisation. It is not affiliated to any finan-cial broking company, or a merchant banker or an in-vestment bank. CMIE is a private company that is notfunded by any business house or any public or privateinstitution.
CMIE has no other businesses other than providing in-formation services. CMIE does not provide any in-vestment advisory services directly or indirectly to any-body. The information services provided by CMIE arethus not influenced in any way, by any other businesses.
CMIE does provide forecasting services. It does makeanalytical company reports that include forecasts of thecompany’s performance. However, CMIE does notmake any buy-sell-hold recommendations on stocks.
CMIE values its position as an independent serviceprovider.
The Prowess database is normalised to ensure inter-firmand inter-year comparability of the data. However, nor-
malisation does not imply a judgemental interpretationof the data. It does not involve any re-estimation of theprofit and loss statement or the balance sheet. Normal-isation effectively leads to re-classification of the avail-able information into a standardised format.
Normalisation often leads to values against variablesin the Prowess database that are at variance comparedto the values provided by the company. This varianceis not a result of any judgemental difference with thecompany. The variances reflect CMIE’s standardisedmethod of capturing and presenting the data.
The Prowess database is also independent of any par-ticular application. It was not built for any specific re-search program of CMIE or for any particular client’srequirement. Prowess is used extensively in the bankingsector, amongst investment companies, in transfer pric-ing applications, etc. But, Prowess is not specificallytailored for any of these applications. Each applicationis a special case from a generalised database.
Prowess is a general purpose database, from an inde-pendent organisation, that finds unique applications ina diverse set of institutions.
Centre for Monitoring Indian Economy Prowess

11
Chapter 2
Companies Covered
Contents2.1 Rules of inclusion . . . . . . . . . . . . . . . . . . . . . . . . . . . . . . . .. . . . . . . . . . . . . . . . . 12
2.2 Additions and deletions . . . . . . . . . . . . . . . . . . . . . . . . . . .. . . . . . . . . . . . . . . . . . 13
2.3 Is there a survival bias in the Prowess database? . . . . . . .. . . . . . . . . . . . . . . . . . . . . . . . . 14
2.4 How comprehensive is the coverage of companies in Prowess? . . . . . . . . . . . . . . . . . . . . . . . . 152.5 Why does Prowess not cover all registered companies of India? . . . . . . . . . . . . . . . . . . . . . . . 16
2.6 Coverage based on Annual Reports . . . . . . . . . . . . . . . . . . . .. . . . . . . . . . . . . . . . . . . 17
2.6.1 Distribution of companies by broad industry groups . .. . . . . . . . . . . . . . . . . . . 18
2.6.2 Distribution of companies by ownership . . . . . . . . . . . .. . . . . . . . . . . . . . . 20
2.6.3 Distribution of companies by type of enterprise . . . . .. . . . . . . . . . . . . . . . . . 22
2.6.4 Companies with continuous time series data . . . . . . . . .. . . . . . . . . . . . . . . . 24
2.6.4.1 Continuous time series data sets of all companies . .. . . . . . . . . . . . . . 25
2.6.4.2 Continuous time series data sets of listed companies . . . . . . . . . . . . . . . 28
2.6.4.3 Continuous time series data sets of manufacturing companies . . . . . . . . . . 31
2.6.4.4 Continuous time series data sets of finance companies . . . . . . . . . . . . . . 34
2.6.4.5 Continuous time series data sets of non-finance service companies . . . . . . . 37
2.6.4.6 Continuous time series data sets of private non-finance companies . . . . . . . . 402.7 Coverage based on quarterly financial statements . . . . . .. . . . . . . . . . . . . . . . . . . . . . . . . 43
2.8 Frequency distribution of companies by sales . . . . . . . . .. . . . . . . . . . . . . . . . . . . . . . . . 47
Prowess Centre for Monitoring Indian Economy
12 Companies Covered
2.1 Rules of inclusion
The Prowess database covers all Indian companies forwhich relevant data became available to CMIE withoutany restrictions of use. Companies included in Prowessare not selected or filtered by any process. Unencum-bered availability of information is the single most im-portant criteria for inclusion of companies in Prowess.
A company is included in Prowess if it meets any of thefollowing three criteria
• Availability of its annual audited profit and lossstatement, and balance sheet along with their var-ious schedules of details.
• Availability of prices of its shares from either theNational Stock Exchange or the Bombay StockExchange
• Availability of its quarterly financial statementsas mandated by the stock exchanges and regula-tors for listed companies.
In reality, Prowess contains information on all listedcompanies that are reasonably active on the major stockexchanges of India. Subsidiaries of such companies arealso covered individually in Prowess since their detailedfinancial statements are usually available in the parentcompany’s annual report.
Prowess also includes information on unlisted compa-nies. Unlisted companies include public limited com-panies and private limited companies. Information onthese companies, particularly private limited compa-nies, is not easily available. CMIE makes its best effortsto include as many public and private limited compa-nies as possible. It takes greater efforts to update in-formation on companies already included in Prowesscompared to its efforts to add new companies.
Not just companies
Strictly speaking, Prowess contains information on In-dian business entities that produce financial statements
as per generally accepted accounting practices and dis-closures. These are not necessarily companies. Acompany is necessarily registered with the Registrar ofCompanies. But, a business entity need not necessar-ily be a company. It could be a cooperative or a bankthat is not a company or, it could be a statutory body.If such an entity produces an Annual Report based onaudited annual accounts that is available to us, it will beincluded in Prowess.
Prowess contains information on cooperatives – suchas Indian Farmers Fertiliser Co-Op. Ltd. and KrishakBharati Co-Op. Ltd. Nearly a 100 cooperatives are in-cluded. This is a small proportion of all cooperativesbut these are the economically more important ones.In fact, the study of the fertiliser industry is incom-plete without studying these cooperatives. Similarly,the study of the electricity sector in India is incompletewithout studying the state electricity boards. These arealso included in Prowess. These are neither companiesnor are they cooperatives. Yet, they are economicallyvery important and do publish audited annual accounts.Nearly 200 such non-company, non-cooperatives are in-cluded in Prowess.
Availability of information on companies has improvedover time. As a result, the coverage in Prowess has im-proved over time. However, there is no guarantee thatthis will continue in the future. It is quite likely thatavailability of information on unlisted companies maydecline. CMIE will continue to provide information ona best-effort basis.
There is no survival bias imposed by us. If updates arenot available, we do not drop the company from thedatabase. It continues to exist in the database with olddata. As a result, there are companies in Prowess whoselatest information is quite dated. Also, the inclusion ofa company in the Prowess database does not imply thatthe company was formed or it began operations in thatyear. It merely means that, that was the first year forwhich CMIE could obtain data.
Centre for Monitoring Indian Economy Prowess
Companies Covered 13
2.2 Additions and deletions
The Prowess database keeps expanding in terms of thetotal number of companies covered. There are manyreasons why more and more companies will get addedto the database. And, there are good reasons why therewill be very few deletions. As a result, on a net basis,the count of companies in the Prowess database willkeep rising.
Additions don’t imply new companies
Companies keep getting added because new compa-nies are formed regularly. As information on suchnew companies become available, they get added intothe Prowess database. A company gets added into theProwess database only if it meets the conditions ofavailability of the audited and complete Annual Reportof a business entity or the availability of the interim fi-nancial statements of a listed company.
CMIE is constantly on the lookout for companies to addinto Prowess. As it finds companies with sufficient andreliable information, it adds these into the database.
An addition of a company into the Prowess databasedoes not mean that a new company was formed at thetime of the addition. It merely means that CMIE re-ceived information for the first time of the company thatgot added. Companies can get added into the databasewith historical information.
Deletions are rare
Companies rarely cease to exist in India. They do attimes get merged into other companies or they may stopoperations. Even in such cases, we do not delete thecompany’s old records from the database. We retain theold information since the old information is often use-ful.
There is only one condition under which a company canget deleted from the Prowess database. This is if a pri-vate limited company requests that its profit and lossstatement should be deleted from the database. Accord-ing to the Companies Act, the profit and loss statementof a private limited company is not available for publicexamination. The law refers to the availability to thepublic, such information from the official records of thegovernment. However, to the best of our understand-ing, there is no law that bars a private company fromprocessing or making available such information if ithas access to such information. CMIE is therefore, tothe best of our understanding, under no compulsion toabstain from using and making available such informa-tion. However, if a private limited company requests usto remove its information from Prowess, we do removeit in deference to its request for privacy.
Often, CMIE does gain access to information that per-mits only restricted use. Such information is not madeavailable in Prowess.
Impact on updatedness
As companies keep getting added and many old com-panies do not get updated because they have effectivelyceased to exist, the count of companies in the Prowessdatabase keeps increasing, but the number of compa-nies with data in a given year as a proportion of thetotal companies in the database keeps decreasing.
The number of companies for which information isavailable for a year keeps rising. This is because wekeep adding companies for all years. It is our endeav-our to keep increasing the panel of companies for whichdata is available – particularly since 1989-90.
The number of companies for which data is available inrecent years is much larger than the number of compa-nies for which data was available in the earlier years.
Prowess Centre for Monitoring Indian Economy
14 Companies Covered
2.3 Is there a survival bias in the Prowess database?
There is no deliberate survival bias in the Prowessdatabase. As a policy, companies are not removed fromthe database, once they have been added. In this sense,there is no survival bias that is caused by CMIE, in theProwess database.
In India, companies rarely cease to exist. They maycease all operations and yet remain alive, on paper. Theprocess of winding up a company is so time-consumingand complex that they are often left unclosed even ifthere are no operations.
In-operative companies
When a company ceases operations for all practical pur-poses but it continues to exist as an entity, it may stopproviding any information. In such cases, we retain allthe information available in the database till it did pro-vide information. Old information is not deleted justbecause new information is not available.
Merged companies
A merger is the most unambiguous observation ofa company ceasing to exist as a separate legal en-tity. Once a company merges into another company,it ceases to provide any information as a separate en-tity. In such cases, we retain all the information avail-able in the database regarding the company till it wasmerged. The information is retained against the nameof the company just before it was merged. If the com-pany into which the target company is merged adoptsthe name of the target company (as it often happens),then we add the suffix ”Merged” to the pre-mergedcompany records.
Name changes
Companies may undergo name changes and in suchcases, companies are addressed by their most recentname. And, all the information pertaining to the periodprior to the name change becomes available against thenew name obtained by the company. All old names ofcompanies are linked to new names. So, companies that
have changed their names can still be addressed by theirold names.
An automatic survival bias
CMIE does not delete companies that have ceased oper-ations or that have merged with other companies. How-ever, this does not guarantee no survival bias in thedatabase. This is so because, Prowess is not a databaseof all business enterprises registered in some way or theother in India.
A large number of companies that register themselvesfail to survive beyond the first few years. The likelihoodof such companies being added to the Prowess databaseis very low because the information of such companiesmay not become available to CMIE.
Only those companies get added to the Prowessdatabase that survive to provide Annual Reports basedon audited accounts. This condition automaticallykeeps out a large number of small business enterprisesthat do not prepare Annual Reports based on auditedaccounts. In a sense this is a built-in survival bias in theProwess database. But, there is no deliberate survivalbias in the Prowess database.
Prowess will also not contain information on the largenumber of private limited companies that operate in In-dia because their Annual Reports are not available pub-licly. Most of these companies are small. But, thereare many large private limited companies as well. Thisleads to a defacto selection bias. Again, this selectionbias is not because of a deliberate policy to keep suchcompanies out of Prowess database, but because infor-mation on such companies is not available.
A deliberate exclusion
We have refrained from adding investment companiesthat are of very small size. There are hundreds of thou-sands of such companies registered with the Ministry ofCompany Affairs. Their extremely small size of opera-tions (sales of no more than a hundred thousand rupees)make them unsuitable for the Prowess database.
Centre for Monitoring Indian Economy Prowess
Companies Covered 15
2.4 How comprehensive is the coverage of companies in Prowess?
Prowess covers more than just companies. It is adatabase of all economically active business entities inIndia, subject to the availability of their Annual Re-ports based on unabridged audited accounts. As a re-sult, Prowess includes non-company business entitiessuch as cooperatives and other entities created throughthe legislature or through the Banking Regulation Act.
There is effectively, no measure of the universe of allbusiness entities in India. The Central Statistical Organ-isation has proposed creating a Register of Businessesin India. However, there is no progress on this front. Asa result, the Prowess database does not have a universeagainst which it can be compared to assess the compre-hensiveness of its coverage.
In terms of numbers, the Prowess coverage is verysmall. It covers only three per cent of the registeredcompanies and an even lesser proportion of the cooper-atives. It does not cover any partnerships or proprietor-ship concerns. Yet, the coverage in Prowess is signifi-cant as it covers a fairly large proportion of the businessconducted in India.
The statistics presented below give an insight into thecoverage of the Prowess database:
1. The total income of all companies in the Prowessdatabase is about 84 per cent of India’s GDP. Thisratio provides a sense of the magnitude of thebusiness captured by the Prowess database.
2. The value of output of all companies in Prowessis about 47 per cent of the total value of output inthe non-agriculture and non-government servicessector. This is perhaps, the best summary mea-sure of the proportion of the country’s businesscaptured by Prowess.
3. The value of output of all manufacturing com-panies in Prowess is 79 per cent, of the valueof output of the registered manufacturing sectorof the country. This indicates the greater cov-erage of the organised manufacturing sector inthe Prowess database compared to the coverageof the small scale or unorganised sectors.
4. Prowess companies cover more than half of In-dia’s external trade. They cover about 55 per centof India’s exports and nearly 70 per cent of In-dia’s imports.
5. Corporate taxes paid by Prowess companies ac-count for 58 per cent of all taxes paid by en-terprises. Prowess has an almost comprehensivecoverage of companies paying excise duty. Thisagain, indicates the greater coverage of manufac-turing companies.
6. The services sector is quite heterogeneous. It in-cludes the highly organised and regulated bank-ing sector and also the highly unorganised andunregulated retail trade sector. Prowess has amuch greater coverage of the banking sector thanof the retail sector, although as the retail sectorgets organised its coverage in Prowess will in-crease.
All the comparisons made above are for the year 2008-09, the latest year for which data was available at thetime of writing. Data for 2008-09 was available for onlyabout ten thousand companies. Prowess includes nearly24,000 companies. If we include all the 24,000 com-panies in Prowess, the coverage would be higher thanwhat is stated above. In about a year the count of com-panies for 2008-09 will rise by about 25 per cent and intwo years it could rise by nearly 50 per cent. This willincrease the coverage marginally.
Prowess Centre for Monitoring Indian Economy
16 Companies Covered
2.5 Why does Prowess not cover all registered companies of India?
As of 31 March 2009 there were 7,86,774 compa-nies registered with the Registrar of Companies, an ad-ministrative arm of the Ministry of Company Affairs.Of these, 82,058 were public limited companies and7,04,716 were private limited companies. The profitand loss statement for the 7 lakh private limited com-panies is generally not available in the public domain.Therefore, it is generally not possible to cover thesecompanies in Prowess.
In comparison to the 82,058 public limited compa-nies, Prowess contains about 24,000 companies. It iswidely believed that over half of all the companies reg-istered with the Registrar of Companies exist only onpaper. This is a mere belief because there are no officialrecords to confirm this.
All registered companies are required, by law, to de-posit their annual financial statements with the Min-istry of Company Affairs. The Ministry has a reposi-tory of all accounts filed with it. But, it does not have adatabase of the financials of the companies. CMIE hada limited agreement with the Ministry between 1999and 2003.
During the period of the agreement, CMIE could com-pile financial information from the audited accountsfiled with the Registrar of Companies for 2,74,446 com-
panies. The maximum number of companies coveredfor a year was 1,69,965. This was for the year endedMarch 2000. These companies accounted for 31 percent of the total companies that were registered withthe Registrar of Companies then. CMIE’s coverage of31 per cent indicates that the number of companies thatare defunct or inactive could be much larger than half.
But, the large proportion of companies that exist merelyon paper with no records is only a part of the prob-lem. A greater revelation is in the characteristics ofthe 2,74,446 companies for which data was compiledby CMIE. We found that in 1999-00, 28 per cent ofthe companies had a sales of less than a mere Rs.1,000.Nearly 37 per cent of the companies had sales of lessthan Rs.5 lakh. And, 52 per cent of the companies hadsales of less than Rs.10 lakh. These 52 per cent of thecompanies accounted for a negligible 0.07 per cent ofall companies.
Given the above characteristics, it was clear that it wasperhaps not worth the effort to create a database ofall companies registered with the Registrar of Compa-nies. However, it is useful to scan the Ministry of Com-merce’s website for companies that are engaged in sig-nificant economic activities. And when we find suchcompanies, we try to obtain their Annual Reports to in-corporate their data into the Prowess database.
Centre for Monitoring Indian Economy Prowess
Companies Covered 17
2.6 Coverage based on Annual Reports
One of the most important sources of information usedto build the Prowess database is the audited AnnualReports of companies. The count of companies forwhich Annual Report based information is available istherefore the best measure of coverage of companies inProwess.
The Prowess database maintains a time-series of datafrom 1989-90. However Annual Reports are not avail-able for all companies for all years since 1989-90.
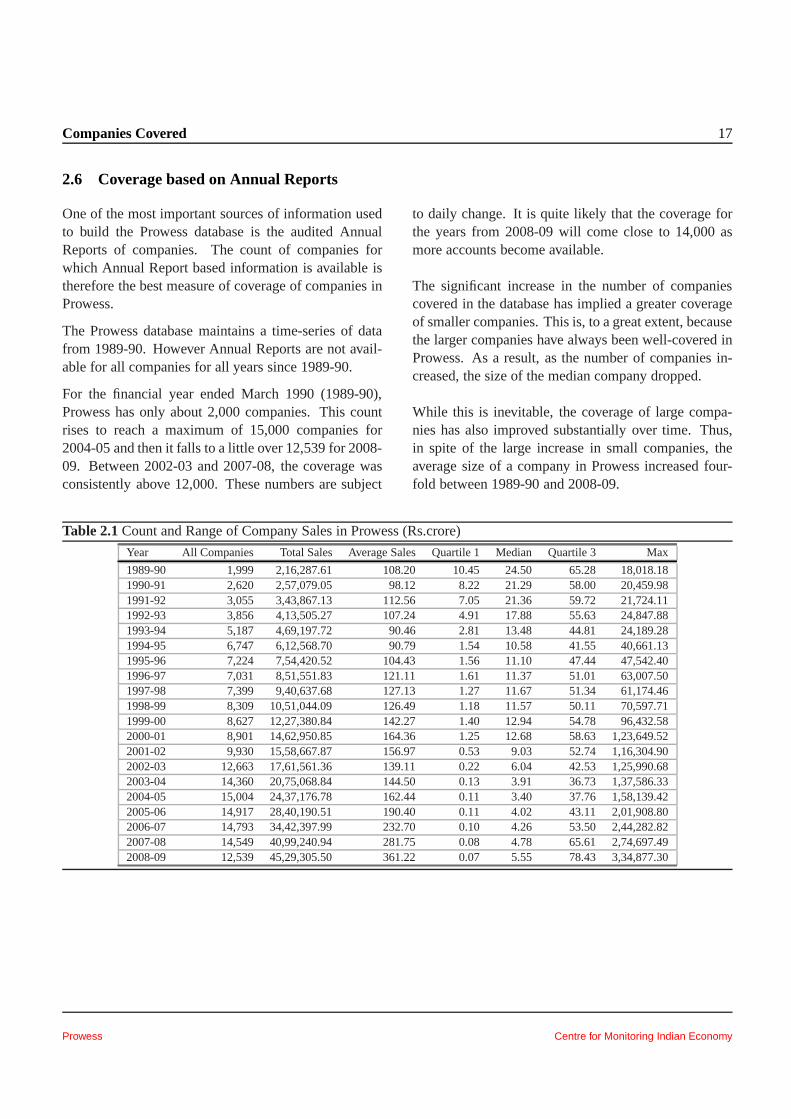
For the financial year ended March 1990 (1989-90),Prowess has only about 2,000 companies. This countrises to reach a maximum of 15,000 companies for2004-05 and then it falls to a little over 12,539 for 2008-09. Between 2002-03 and 2007-08, the coverage wasconsistently above 12,000. These numbers are subject
to daily change. It is quite likely that the coverage forthe years from 2008-09 will come close to 14,000 asmore accounts become available.
The significant increase in the number of companiescovered in the database has implied a greater coverageof smaller companies. This is, to a great extent, becausethe larger companies have always been well-covered inProwess. As a result, as the number of companies in-creased, the size of the median company dropped.
While this is inevitable, the coverage of large compa-nies has also improved substantially over time. Thus,in spite of the large increase in small companies, theaverage size of a company in Prowess increased four-fold between 1989-90 and 2008-09.
Table 2.1Count and Range of Company Sales in Prowess (Rs.crore)
Year All Companies Total Sales Average Sales Quartile 1 Median Quartile 3 Max
1989-90 1,999 2,16,287.61 108.20 10.45 24.50 65.28 18,018.181990-91 2,620 2,57,079.05 98.12 8.22 21.29 58.00 20,459.981991-92 3,055 3,43,867.13 112.56 7.05 21.36 59.72 21,724.111992-93 3,856 4,13,505.27 107.24 4.91 17.88 55.63 24,847.881993-94 5,187 4,69,197.72 90.46 2.81 13.48 44.81 24,189.281994-95 6,747 6,12,568.70 90.79 1.54 10.58 41.55 40,661.131995-96 7,224 7,54,420.52 104.43 1.56 11.10 47.44 47,542.401996-97 7,031 8,51,551.83 121.11 1.61 11.37 51.01 63,007.501997-98 7,399 9,40,637.68 127.13 1.27 11.67 51.34 61,174.461998-99 8,309 10,51,044.09 126.49 1.18 11.57 50.11 70,597.711999-00 8,627 12,27,380.84 142.27 1.40 12.94 54.78 96,432.582000-01 8,901 14,62,950.85 164.36 1.25 12.68 58.63 1,23,649.522001-02 9,930 15,58,667.87 156.97 0.53 9.03 52.74 1,16,304.902002-03 12,663 17,61,561.36 139.11 0.22 6.04 42.53 1,25,990.682003-04 14,360 20,75,068.84 144.50 0.13 3.91 36.73 1,37,586.332004-05 15,004 24,37,176.78 162.44 0.11 3.40 37.76 1,58,139.422005-06 14,917 28,40,190.51 190.40 0.11 4.02 43.11 2,01,908.802006-07 14,793 34,42,397.99 232.70 0.10 4.26 53.50 2,44,282.822007-08 14,549 40,99,240.94 281.75 0.08 4.78 65.61 2,74,697.492008-09 12,539 45,29,305.50 361.22 0.07 5.55 78.43 3,34,877.30
Prowess Centre for Monitoring Indian Economy
18 Companies Covered
2.6.1 Distribution of companies by broad industry groups
The sectoral composition of India’s growth has beena source of much debate in recent years. The rapidgrowth of the services sector and in particular, the spec-tacular growth of the IT and ITES industries had ledto a view that India would bypass the normal route ofan agrarian economy, first transiting to becoming anindustrialised economy before it becomes a services-dominated economy.
IT and ITES were not the only sectors that were grow-ing rapidly in the 1990s and in the 2000s. Reforms inthe financial sectors, in the transport sector (airlines)and the communications (mobile phones) sector wereequally successful in transforming the Indian sectoralgrowth composition.
Given its huge natural resources endowment, India hasa natural advantage in the manufacturing sector. How-ever, the exploitation of this advantage was in partialabeyance as the services sector led the growth in thetwo decades.
The Prowess database reflects this transformation of In-dia’s sectoral growth composition.
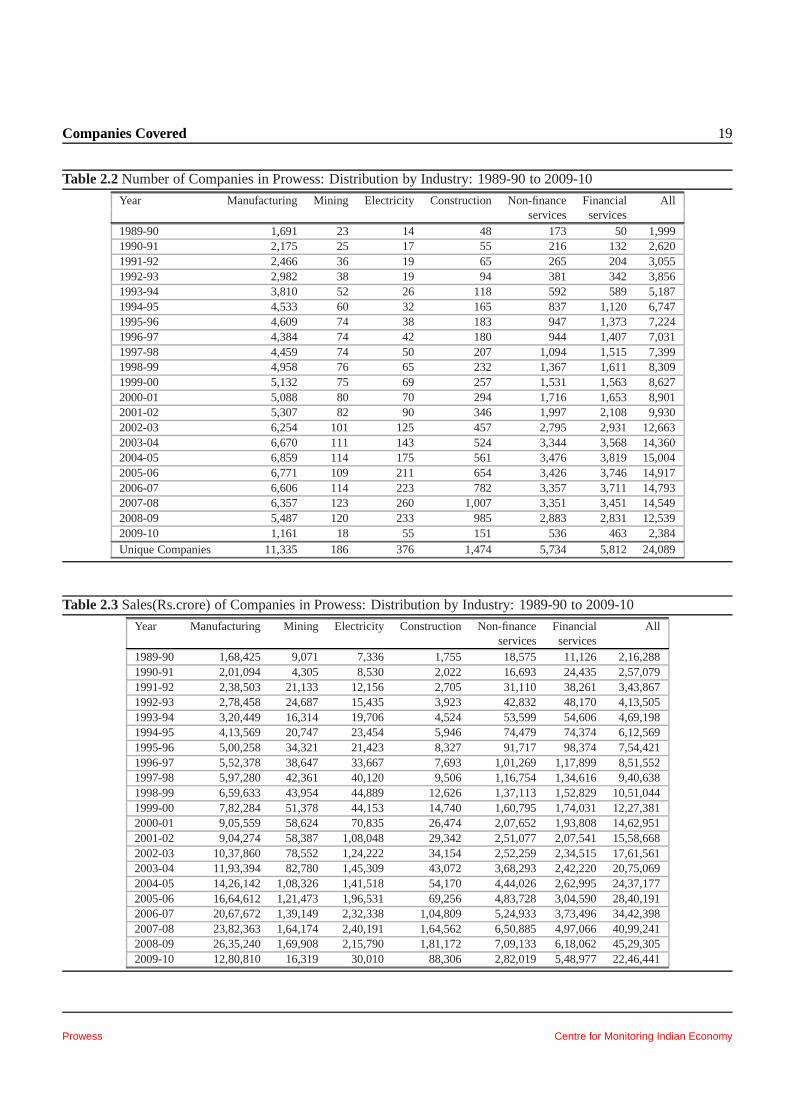
The number of companies covered in Prowess has mul-tiplied about seven times from about 2,000 to about14,000 over the two decades from 1989-90 to 2008-09.Aggregate sales multiplied 22 times of these companiesin the same period. The increase in both, the count andaggregate sales during the two decades has been morein the non-manufacturing and non-mining companies.
The manufacturing and mining sectors have seen thecount increase by around 3-4 times. And, their aggre-
gate sales increased by 16-18 times. On the other hand,the number of electricity companies has increased bynearly 15 times. And, their aggregate sales have in-creased by nearly 30 times. This is essentially becauseseveral state government owned departmental utilitieshave been converted into multiple utility companies. Itis also because of an increase in the number of privatesector power generating companies.
The construction sector has undergone considerablechange during the two decades. This sector was largelyin the unorganised sector till the 1980s. A boom in realestate development, particularly since 2004, has led toa big increase in the number of construction companiesin the Prowess database.
The non-finance services sector includes a large num-ber of the new and fast-growing sectors, such as theIT/ITES, telecom, airlines, entertainment and trade.The number of companies in this sector grew 17 timesover the past two decades. In the same time, the aggre-gate sales of these companies grew 38 times.
The biggest increase over the two decades has been inrespect of financial services companies. Their counthas increased from just 50 in 1989-90 to over 3,500 by2003-04. But, most of the increase is of small com-panies. In fact, the average size of the companies inthis sector dropped during the period of their largest in-crease.
While the average size of finance companies has de-clined or remained stable, that of the manufacturing,mining and construction companies have increased sig-nificantly.
Centre for Monitoring Indian Economy Prowess
Companies Covered 19
Table 2.2Number of Companies in Prowess: Distribution by Industry: 1989-90 to 2009-10
Year Manufacturing Mining Electricity Construction Non-finance Financial Allservices services
1989-90 1,691 23 14 48 173 50 1,9991990-91 2,175 25 17 55 216 132 2,6201991-92 2,466 36 19 65 265 204 3,0551992-93 2,982 38 19 94 381 342 3,8561993-94 3,810 52 26 118 592 589 5,1871994-95 4,533 60 32 165 837 1,120 6,7471995-96 4,609 74 38 183 947 1,373 7,2241996-97 4,384 74 42 180 944 1,407 7,0311997-98 4,459 74 50 207 1,094 1,515 7,3991998-99 4,958 76 65 232 1,367 1,611 8,3091999-00 5,132 75 69 257 1,531 1,563 8,6272000-01 5,088 80 70 294 1,716 1,653 8,9012001-02 5,307 82 90 346 1,997 2,108 9,9302002-03 6,254 101 125 457 2,795 2,931 12,6632003-04 6,670 111 143 524 3,344 3,568 14,3602004-05 6,859 114 175 561 3,476 3,819 15,0042005-06 6,771 109 211 654 3,426 3,746 14,9172006-07 6,606 114 223 782 3,357 3,711 14,7932007-08 6,357 123 260 1,007 3,351 3,451 14,5492008-09 5,487 120 233 985 2,883 2,831 12,5392009-10 1,161 18 55 151 536 463 2,384Unique Companies 11,335 186 376 1,474 5,734 5,812 24,089
Table 2.3Sales(Rs.crore) of Companies in Prowess: Distribution by Industry: 1989-90 to 2009-10
Year Manufacturing Mining Electricity Construction Non-finance Financial Allservices services
1989-90 1,68,425 9,071 7,336 1,755 18,575 11,126 2,16,2881990-91 2,01,094 4,305 8,530 2,022 16,693 24,435 2,57,0791991-92 2,38,503 21,133 12,156 2,705 31,110 38,261 3,43,8671992-93 2,78,458 24,687 15,435 3,923 42,832 48,170 4,13,5051993-94 3,20,449 16,314 19,706 4,524 53,599 54,606 4,69,1981994-95 4,13,569 20,747 23,454 5,946 74,479 74,374 6,12,5691995-96 5,00,258 34,321 21,423 8,327 91,717 98,374 7,54,4211996-97 5,52,378 38,647 33,667 7,693 1,01,269 1,17,899 8,51,5521997-98 5,97,280 42,361 40,120 9,506 1,16,754 1,34,616 9,40,6381998-99 6,59,633 43,954 44,889 12,626 1,37,113 1,52,829 10,51,0441999-00 7,82,284 51,378 44,153 14,740 1,60,795 1,74,031 12,27,3812000-01 9,05,559 58,624 70,835 26,474 2,07,652 1,93,808 14,62,9512001-02 9,04,274 58,387 1,08,048 29,342 2,51,077 2,07,54115,58,6682002-03 10,37,860 78,552 1,24,222 34,154 2,52,259 2,34,515 17,61,5612003-04 11,93,394 82,780 1,45,309 43,072 3,68,293 2,42,220 20,75,0692004-05 14,26,142 1,08,326 1,41,518 54,170 4,44,026 2,62,995 24,37,1772005-06 16,64,612 1,21,473 1,96,531 69,256 4,83,728 3,04,590 28,40,1912006-07 20,67,672 1,39,149 2,32,338 1,04,809 5,24,933 3,73,496 34,42,3982007-08 23,82,363 1,64,174 2,40,191 1,64,562 6,50,885 4,97,066 40,99,2412008-09 26,35,240 1,69,908 2,15,790 1,81,172 7,09,133 6,18,062 45,29,3052009-10 12,80,810 16,319 30,010 88,306 2,82,019 5,48,977 22,46,441
Prowess Centre for Monitoring Indian Economy
20 Companies Covered
2.6.2 Distribution of companies by ownership
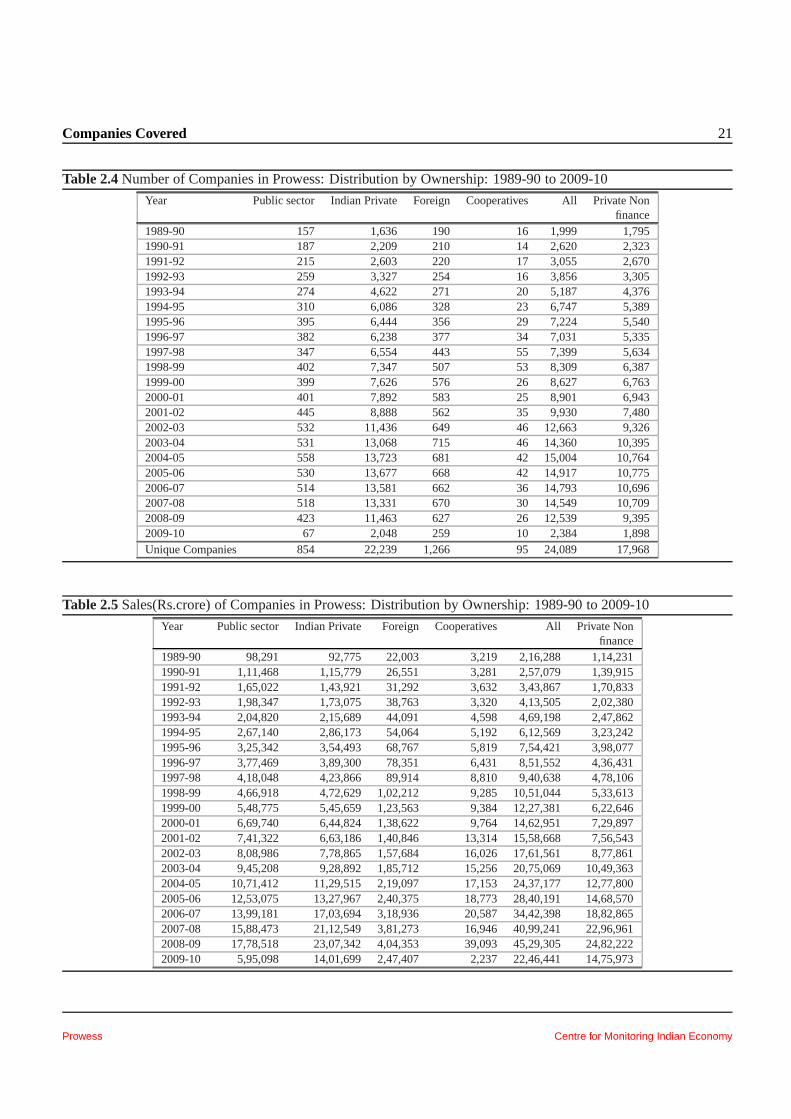
Private companies dominate the Prowess database.About 92 per cent of the companies in Prowess areowned essentially by private Indians. Another 3.5 percent of the companies are owned by the Indian publicsector (ie these are owned by the central or state gov-ernments of India). Foreign entities own about 5 percent of the companies. And, a very small proportionof the companies in the Prowess database are owned bycooperatives.
Although the universe of all business enterprises is notavailable, it is reasonable to state that the cooperativesare under-represented in Prowess and the share of for-eign companies is overstated, in terms of number ofcompanies.
During the two decades for which Prowess contains in-formation, many companies have changed their owner-ship. A number of Indian companies have been sold toforeign entities. As a result, such companies were clas-sified as Indian companies in some years and as foreigncompanies in other years. This leads to a correspond-ing double-counting of the company in the count ofunique companies in the Prowess database. While thetotal unique companies in Prowess is 23732, the sum ofthe constituents is greater at 24090. This implies thatthere were 358 companies in the Prowess database thatchanged their ownership during the two decades underconsideration.
The shares in terms of number of companies providesonly a partial understanding of the Prowess database.The composition of companies in the Prowess databaseis understood more completely if we also see the valueof business of the companies in each of the ownershipsegments.
In terms of share in total sales, the Indian private sec-tor companies continue to dominate, but the dominanceis much smaller than was evidenced in the numberof companies. Indian private sector companies thataccounted for 92 per cent of the total companies ofProwess, account for only 50 per cent of the sales. Pub-lic sector, that account for 3.5 per cent of the compa-nies, accounted for a substantial 40 per cent of the sales.And, the 5 per cent foreign-owned companies accountfor 9 per cent of the sales.
The private sector non-financial services companies hasa special place in the official statistical system of India.The Reserve Bank of India produces an annual studyon the financial performance of these companies. Apart of the sample for this study drawn by the ReserveBank is from Prowess. However, the RBI’s sample ismuch smaller than the sample for this segment avail-able in Prowess. This is because the RBI draws onlya small sample from the Prowess database. Results ofthe RBI’s study are used by the official statistical ma-chinery to estimate the savings of the private corporatesector.
Centre for Monitoring Indian Economy Prowess
Companies Covered 21
Table 2.4Number of Companies in Prowess: Distribution by Ownership:1989-90 to 2009-10
Year Public sector Indian Private Foreign Cooperatives AllPrivate Nonfinance
1989-90 157 1,636 190 16 1,999 1,7951990-91 187 2,209 210 14 2,620 2,3231991-92 215 2,603 220 17 3,055 2,6701992-93 259 3,327 254 16 3,856 3,3051993-94 274 4,622 271 20 5,187 4,3761994-95 310 6,086 328 23 6,747 5,3891995-96 395 6,444 356 29 7,224 5,5401996-97 382 6,238 377 34 7,031 5,3351997-98 347 6,554 443 55 7,399 5,6341998-99 402 7,347 507 53 8,309 6,3871999-00 399 7,626 576 26 8,627 6,7632000-01 401 7,892 583 25 8,901 6,9432001-02 445 8,888 562 35 9,930 7,4802002-03 532 11,436 649 46 12,663 9,3262003-04 531 13,068 715 46 14,360 10,3952004-05 558 13,723 681 42 15,004 10,7642005-06 530 13,677 668 42 14,917 10,7752006-07 514 13,581 662 36 14,793 10,6962007-08 518 13,331 670 30 14,549 10,7092008-09 423 11,463 627 26 12,539 9,3952009-10 67 2,048 259 10 2,384 1,898Unique Companies 854 22,239 1,266 95 24,089 17,968
Table 2.5Sales(Rs.crore) of Companies in Prowess: Distribution by Ownership: 1989-90 to 2009-10
Year Public sector Indian Private Foreign Cooperatives AllPrivate Nonfinance
1989-90 98,291 92,775 22,003 3,219 2,16,288 1,14,2311990-91 1,11,468 1,15,779 26,551 3,281 2,57,079 1,39,9151991-92 1,65,022 1,43,921 31,292 3,632 3,43,867 1,70,8331992-93 1,98,347 1,73,075 38,763 3,320 4,13,505 2,02,3801993-94 2,04,820 2,15,689 44,091 4,598 4,69,198 2,47,8621994-95 2,67,140 2,86,173 54,064 5,192 6,12,569 3,23,2421995-96 3,25,342 3,54,493 68,767 5,819 7,54,421 3,98,0771996-97 3,77,469 3,89,300 78,351 6,431 8,51,552 4,36,4311997-98 4,18,048 4,23,866 89,914 8,810 9,40,638 4,78,1061998-99 4,66,918 4,72,629 1,02,212 9,285 10,51,044 5,33,6131999-00 5,48,775 5,45,659 1,23,563 9,384 12,27,381 6,22,6462000-01 6,69,740 6,44,824 1,38,622 9,764 14,62,951 7,29,8972001-02 7,41,322 6,63,186 1,40,846 13,314 15,58,668 7,56,5432002-03 8,08,986 7,78,865 1,57,684 16,026 17,61,561 8,77,8612003-04 9,45,208 9,28,892 1,85,712 15,256 20,75,069 10,49,3632004-05 10,71,412 11,29,515 2,19,097 17,153 24,37,177 12,77,8002005-06 12,53,075 13,27,967 2,40,375 18,773 28,40,191 14,68,5702006-07 13,99,181 17,03,694 3,18,936 20,587 34,42,398 18,82,8652007-08 15,88,473 21,12,549 3,81,273 16,946 40,99,241 22,96,9612008-09 17,78,518 23,07,342 4,04,353 39,093 45,29,305 24,82,2222009-10 5,95,098 14,01,699 2,47,407 2,237 22,46,441 14,75,973
Prowess Centre for Monitoring Indian Economy
22 Companies Covered
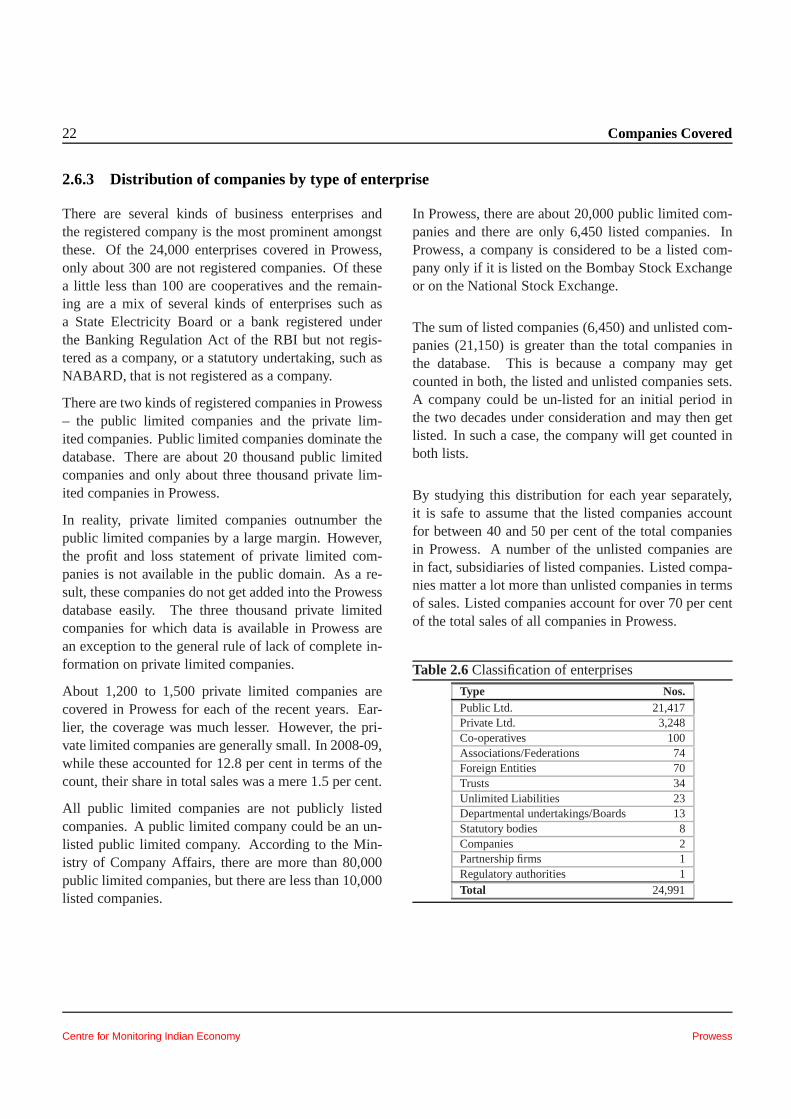
2.6.3 Distribution of companies by type of enterprise
There are several kinds of business enterprises andthe registered company is the most prominent amongstthese. Of the 24,000 enterprises covered in Prowess,only about 300 are not registered companies. Of thesea little less than 100 are cooperatives and the remain-ing are a mix of several kinds of enterprises such asa State Electricity Board or a bank registered underthe Banking Regulation Act of the RBI but not regis-tered as a company, or a statutory undertaking, such asNABARD, that is not registered as a company.
There are two kinds of registered companies in Prowess– the public limited companies and the private lim-ited companies. Public limited companies dominate thedatabase. There are about 20 thousand public limitedcompanies and only about three thousand private lim-ited companies in Prowess.
In reality, private limited companies outnumber thepublic limited companies by a large margin. However,the profit and loss statement of private limited com-panies is not available in the public domain. As a re-sult, these companies do not get added into the Prowessdatabase easily. The three thousand private limitedcompanies for which data is available in Prowess arean exception to the general rule of lack of complete in-formation on private limited companies.
About 1,200 to 1,500 private limited companies arecovered in Prowess for each of the recent years. Ear-lier, the coverage was much lesser. However, the pri-vate limited companies are generally small. In 2008-09,while these accounted for 12.8 per cent in terms of thecount, their share in total sales was a mere 1.5 per cent.
All public limited companies are not publicly listedcompanies. A public limited company could be an un-listed public limited company. According to the Min-istry of Company Affairs, there are more than 80,000public limited companies, but there are less than 10,000listed companies.
In Prowess, there are about 20,000 public limited com-panies and there are only 6,450 listed companies. InProwess, a company is considered to be a listed com-pany only if it is listed on the Bombay Stock Exchangeor on the National Stock Exchange.
The sum of listed companies (6,450) and unlisted com-panies (21,150) is greater than the total companies inthe database. This is because a company may getcounted in both, the listed and unlisted companies sets.A company could be un-listed for an initial period inthe two decades under consideration and may then getlisted. In such a case, the company will get counted inboth lists.
By studying this distribution for each year separately,it is safe to assume that the listed companies accountfor between 40 and 50 per cent of the total companiesin Prowess. A number of the unlisted companies arein fact, subsidiaries of listed companies. Listed compa-nies matter a lot more than unlisted companies in termsof sales. Listed companies account for over 70 per centof the total sales of all companies in Prowess.
Table 2.6Classification of enterprises
Type Nos.Public Ltd. 21,417Private Ltd. 3,248Co-operatives 100Associations/Federations 74Foreign Entities 70Trusts 34Unlimited Liabilities 23Departmental undertakings/Boards 13Statutory bodies 8Companies 2Partnership firms 1Regulatory authorities 1Total 24,991
Centre for Monitoring Indian Economy Prowess
Companies Covered 23
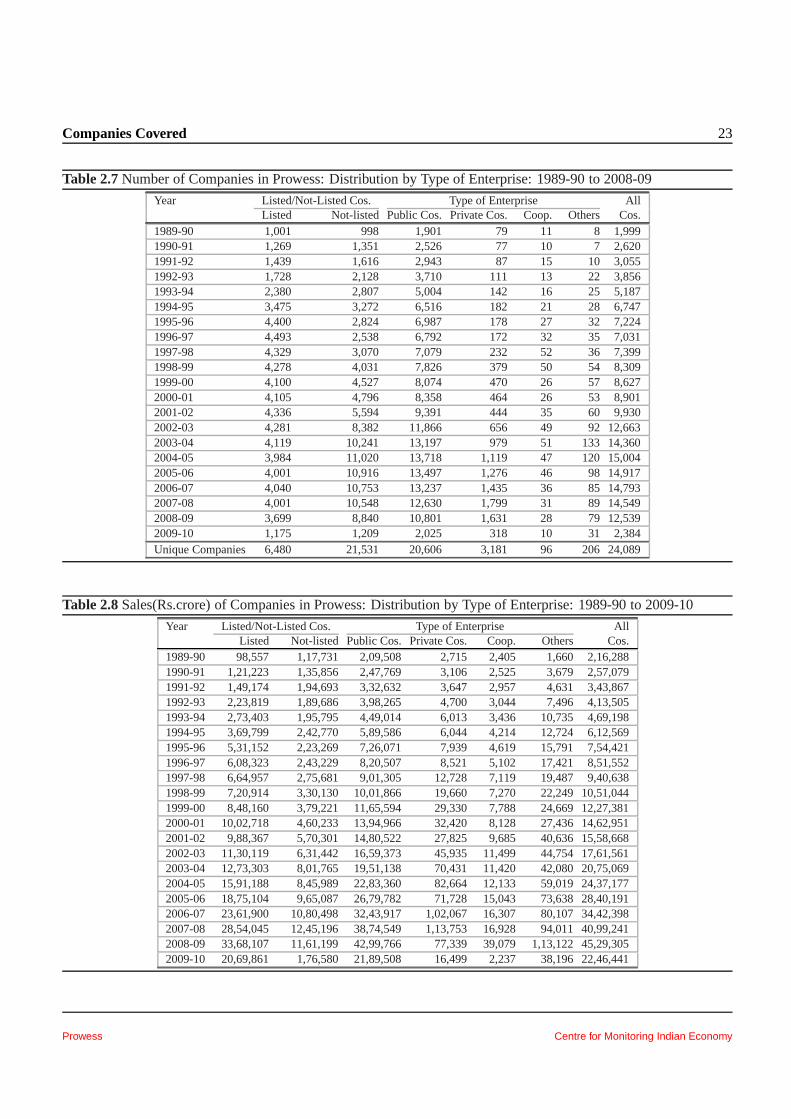
Table 2.7Number of Companies in Prowess: Distribution by Type of Enterprise: 1989-90 to 2008-09
Year Listed/Not-Listed Cos. Type of Enterprise AllListed Not-listed Public Cos. Private Cos. Coop. Others Cos.
1989-90 1,001 998 1,901 79 11 8 1,9991990-91 1,269 1,351 2,526 77 10 7 2,6201991-92 1,439 1,616 2,943 87 15 10 3,0551992-93 1,728 2,128 3,710 111 13 22 3,8561993-94 2,380 2,807 5,004 142 16 25 5,1871994-95 3,475 3,272 6,516 182 21 28 6,7471995-96 4,400 2,824 6,987 178 27 32 7,2241996-97 4,493 2,538 6,792 172 32 35 7,0311997-98 4,329 3,070 7,079 232 52 36 7,3991998-99 4,278 4,031 7,826 379 50 54 8,3091999-00 4,100 4,527 8,074 470 26 57 8,6272000-01 4,105 4,796 8,358 464 26 53 8,9012001-02 4,336 5,594 9,391 444 35 60 9,9302002-03 4,281 8,382 11,866 656 49 92 12,6632003-04 4,119 10,241 13,197 979 51 133 14,3602004-05 3,984 11,020 13,718 1,119 47 120 15,0042005-06 4,001 10,916 13,497 1,276 46 98 14,9172006-07 4,040 10,753 13,237 1,435 36 85 14,7932007-08 4,001 10,548 12,630 1,799 31 89 14,5492008-09 3,699 8,840 10,801 1,631 28 79 12,5392009-10 1,175 1,209 2,025 318 10 31 2,384Unique Companies 6,480 21,531 20,606 3,181 96 206 24,089
Table 2.8Sales(Rs.crore) of Companies in Prowess: Distribution by Type of Enterprise: 1989-90 to 2009-10
Year Listed/Not-Listed Cos. Type of Enterprise AllListed Not-listed Public Cos. Private Cos. Coop. Others Cos.
1989-90 98,557 1,17,731 2,09,508 2,715 2,405 1,660 2,16,2881990-91 1,21,223 1,35,856 2,47,769 3,106 2,525 3,679 2,57,0791991-92 1,49,174 1,94,693 3,32,632 3,647 2,957 4,631 3,43,8671992-93 2,23,819 1,89,686 3,98,265 4,700 3,044 7,496 4,13,5051993-94 2,73,403 1,95,795 4,49,014 6,013 3,436 10,735 4,69,1981994-95 3,69,799 2,42,770 5,89,586 6,044 4,214 12,724 6,12,5691995-96 5,31,152 2,23,269 7,26,071 7,939 4,619 15,791 7,54,4211996-97 6,08,323 2,43,229 8,20,507 8,521 5,102 17,421 8,51,5521997-98 6,64,957 2,75,681 9,01,305 12,728 7,119 19,487 9,40,6381998-99 7,20,914 3,30,130 10,01,866 19,660 7,270 22,249 10,51,0441999-00 8,48,160 3,79,221 11,65,594 29,330 7,788 24,669 12,27,3812000-01 10,02,718 4,60,233 13,94,966 32,420 8,128 27,436 14,62,9512001-02 9,88,367 5,70,301 14,80,522 27,825 9,685 40,636 15,58,6682002-03 11,30,119 6,31,442 16,59,373 45,935 11,499 44,75417,61,5612003-04 12,73,303 8,01,765 19,51,138 70,431 11,420 42,08020,75,0692004-05 15,91,188 8,45,989 22,83,360 82,664 12,133 59,01924,37,1772005-06 18,75,104 9,65,087 26,79,782 71,728 15,043 73,63828,40,1912006-07 23,61,900 10,80,498 32,43,917 1,02,067 16,307 80,107 34,42,3982007-08 28,54,045 12,45,196 38,74,549 1,13,753 16,928 94,011 40,99,2412008-09 33,68,107 11,61,199 42,99,766 77,339 39,079 1,13,122 45,29,3052009-10 20,69,861 1,76,580 21,89,508 16,499 2,237 38,196 22,46,441
Prowess Centre for Monitoring Indian Economy
24 Companies Covered
2.6.4 Companies with continuous time series data
The number of companies in the Prowess databasekeeps changing from year to year. There are severalreasons for this. New companies get incorporated andthese may get added into the Prowess database. Exist-ing closely held companies become public limited andthen they start making their information available moreeasily. This raises the chances of such companies beingadded to the Prowess database.
When a new company gets added it may not have olderdata because it may not be in existence then. Thus,if new companies (new either because the companieswere newly incorporated or because their informationbecame available for the first time) should be added (asthey are) in the Prowess database, then, the Prowessdatabase cannot have a continuous series for all com-panies for all years.
On the flip side, some companies stop functioning andtherefore stop preparing or publishing their financialstatements. When this happens to a company that ex-isted in Prowess, then a time-series of data is cut short.A time-series may also be truncated because a companygets merged into another company or if it is taken overby a privately held company that does not make its au-dited accounts public. For example, many listed com-panies with multinational affiliations have bought backshares, delisted the company and then stopped provid-ing any information publicly. This is within the legalsystem. But, it does lead to a cessation of informationthat was available earlier.
When companies cease to exist or when they stop pro-viding information, we face two choices – of either re-moving them from Prowess or retaining them with theold information. We chose to retain the companies withthe old information. And this choice leads to Prowessnot having a continuous series for all companies for allyears.
Addition of companies or ceasation of operations arenot the only reasons why Prowess cannot have a con-tinuous series of information for all companies for all
years. There are other reasons. One of them is thatCMIE may not have the Annual Report of a companyfor a specific year. This can lead to a “hole” in the time-series. This does happen for smaller or privately heldcompanies.
A “hole” in the time-series can also be caused by a com-pany if it chooses to extend its accounting period be-yond the usual 12 months. If it produces two consecu-tive Annual Reports of 18 months each, it will have pro-duced only two Annual Reports in three years. It willthereby have created a “hole” in the time-series of paneldata. A company can legitimately extend its accountingyear and while it may have not caused any “hole” in itsaccounting data, this does cause a hole in a panel thatcontains annual data.
As a result of the several reasons cited above, Prowessdoes not contain information for all companies for allyears.
Typically, in a recent year, Prowess would contain in-formation on about 12,000 companies. The number ofcompanies for which data is available for two consecu-tive years (a panel of two years) would be a tad smaller.If we look for companies that have information for threeconsecutive years, the count would fall further. And likethis, as the number of consecutive years for which com-panies have data increases, the count of companies de-creases. As the length of the panel increases, the countof companies in the panel decreases.
There are two ways of creating a panel. A panel can becreated of companies that have data for a given numberof years ending in a particular year. Or, a panel can becreated of companies that have data for a given numberof years starting from a particular year. Both have theiruses.
It is CMIE’s endeavour to build robust panels of longtime series. It tries to push the series into the past so asto maximise the length of the time-series for all compa-nies.
Centre for Monitoring Indian Economy Prowess
Companies Covered 25
2.6.4.1 Continuous time series data sets of all companies
The longest panel of companies that Prowess has is of645 companies. For these 645 companies, Prowess hasdata for each of the 20 years beginning in 1989-90 andending in 2008-09. These two decades cover the be-ginning of the economic crisis in 1990-91, the reformsinitiated in 1991-92, the economic boom soon there-after, then the prolonged slowdown, the IT and dotcomperiod around the turn of the century, the recovery from2004-05 and finally the global financial crisis in 2008-09. These 657 companies have seen it all through andpublished their performance for each of the interveningyears with systematic regularity.
If we reduce the length of the time-series to 15 years,then the panel size increases significantly to over twothousand companies. Thus, for over two thousand com-panies Prowess has data for each of the 15 years be-tween 1994-95 and 2008-09.
If we drop the time-span another five years to ten, thenwe gain another 1,500 companies or so. The panel sizerises to over 3,500. A further drop of five years in thetime-span gives a much bigger increase in the panelsize. It more than doubles from about 3,500 to nearly7,500.
The 657 companies for which Prowess has 20 years ofdata are the relatively larger companies. Their averagesales is of the order of Rs.2920 crore (in 2008-09) com-pared to an average of Rs.424 crore for all companiesin the same year.
As the time-span for the panel set of data drops, thenumber of companies increases. However, the gain interms of sales of the companies is much smaller. Thus,when the time-span drops from 20 to 15 years, the num-ber of companies increases three-fold – from 657 toover 2,000; but the gain in aggregate sales is only about50 per cent.
This indicates that the Prowess database contains longertime series data for the larger companies.
The count of companies in a panel beginning in a year isthe inverse of the count of companies in a panel endingin a year. There are about 10,789 companies for whichthree consecutive years of data ending in 2005-06 areavailable. The same 10,789 or so companies are avail-able with data for three consecutive years beginning in2003-04. Similarly, there are about 657 companies thathave 20 years of data beginning in 1989-90.
Finally, while the Prowess desktop installation has adatabase that begins in 1989-90, the Prowess databasewith CMIE has a longer time-series going into the past.For example, it has a thousand or so companies forwhich there are three years of data ending in 1989-90and it has a few companies for which ten years of datais available ending in 1989-90. CMIE intends to keepgrowing this database back into the past. But, the desk-top installation has data only from 1989-90.
Prowess Centre for Monitoring Indian Economy
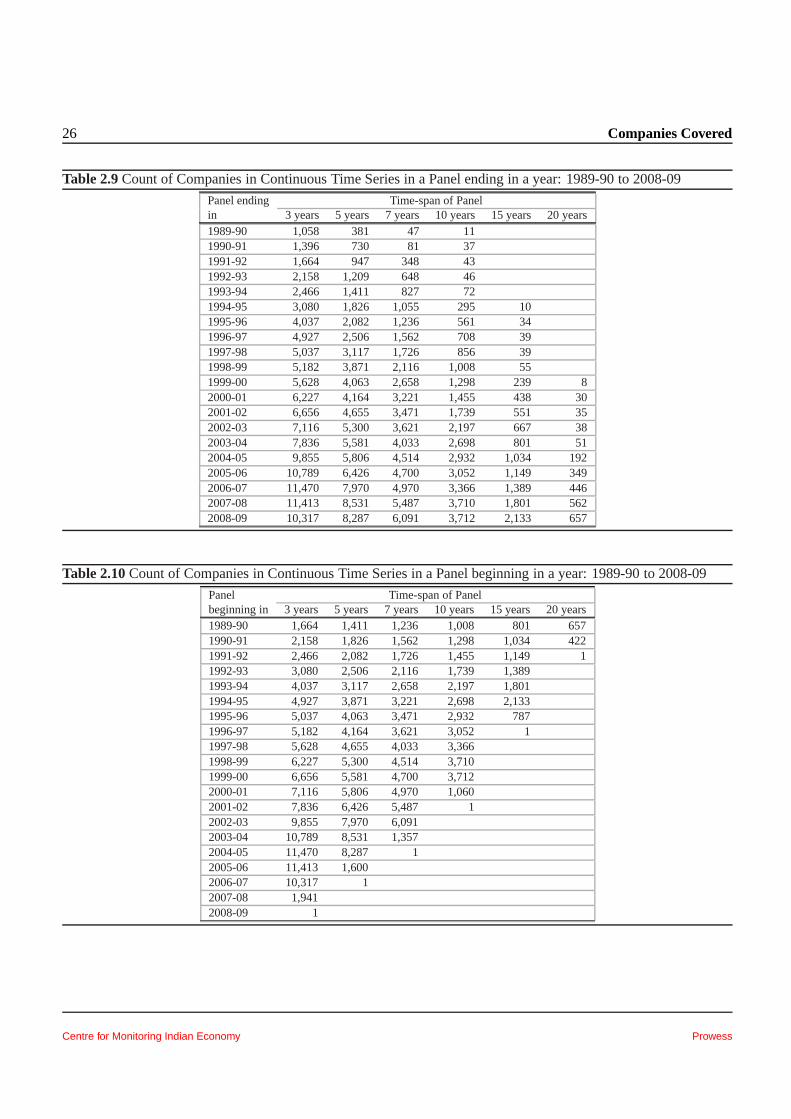
26 Companies Covered
Table 2.9Count of Companies in Continuous Time Series in a Panel ending in a year: 1989-90 to 2008-09
Panel ending Time-span of Panelin 3 years 5 years 7 years 10 years 15 years 20 years1989-90 1,058 381 47 111990-91 1,396 730 81 371991-92 1,664 947 348 431992-93 2,158 1,209 648 461993-94 2,466 1,411 827 721994-95 3,080 1,826 1,055 295 101995-96 4,037 2,082 1,236 561 341996-97 4,927 2,506 1,562 708 391997-98 5,037 3,117 1,726 856 391998-99 5,182 3,871 2,116 1,008 551999-00 5,628 4,063 2,658 1,298 239 82000-01 6,227 4,164 3,221 1,455 438 302001-02 6,656 4,655 3,471 1,739 551 352002-03 7,116 5,300 3,621 2,197 667 382003-04 7,836 5,581 4,033 2,698 801 512004-05 9,855 5,806 4,514 2,932 1,034 1922005-06 10,789 6,426 4,700 3,052 1,149 3492006-07 11,470 7,970 4,970 3,366 1,389 4462007-08 11,413 8,531 5,487 3,710 1,801 5622008-09 10,317 8,287 6,091 3,712 2,133 657
Table 2.10Count of Companies in Continuous Time Series in a Panel beginning in a year: 1989-90 to 2008-09
Panel Time-span of Panelbeginning in 3 years 5 years 7 years 10 years 15 years 20 years1989-90 1,664 1,411 1,236 1,008 801 6571990-91 2,158 1,826 1,562 1,298 1,034 4221991-92 2,466 2,082 1,726 1,455 1,149 11992-93 3,080 2,506 2,116 1,739 1,3891993-94 4,037 3,117 2,658 2,197 1,8011994-95 4,927 3,871 3,221 2,698 2,1331995-96 5,037 4,063 3,471 2,932 7871996-97 5,182 4,164 3,621 3,052 11997-98 5,628 4,655 4,033 3,3661998-99 6,227 5,300 4,514 3,7101999-00 6,656 5,581 4,700 3,7122000-01 7,116 5,806 4,970 1,0602001-02 7,836 6,426 5,487 12002-03 9,855 7,970 6,0912003-04 10,789 8,531 1,3572004-05 11,470 8,287 12005-06 11,413 1,6002006-07 10,317 12007-08 1,9412008-09 1
Centre for Monitoring Indian Economy Prowess
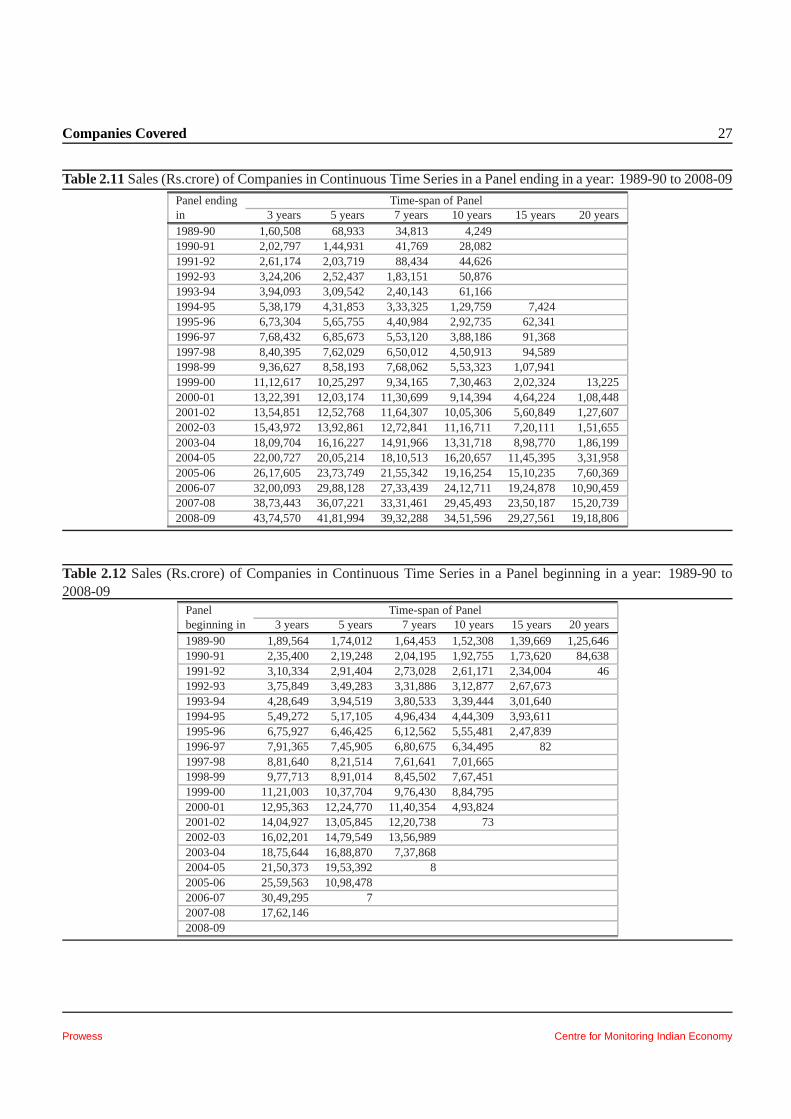
Companies Covered 27
Table 2.11Sales (Rs.crore) of Companies in Continuous Time Series in aPanel ending in a year: 1989-90 to 2008-09
Panel ending Time-span of Panelin 3 years 5 years 7 years 10 years 15 years 20 years1989-90 1,60,508 68,933 34,813 4,2491990-91 2,02,797 1,44,931 41,769 28,0821991-92 2,61,174 2,03,719 88,434 44,6261992-93 3,24,206 2,52,437 1,83,151 50,8761993-94 3,94,093 3,09,542 2,40,143 61,1661994-95 5,38,179 4,31,853 3,33,325 1,29,759 7,4241995-96 6,73,304 5,65,755 4,40,984 2,92,735 62,3411996-97 7,68,432 6,85,673 5,53,120 3,88,186 91,3681997-98 8,40,395 7,62,029 6,50,012 4,50,913 94,5891998-99 9,36,627 8,58,193 7,68,062 5,53,323 1,07,9411999-00 11,12,617 10,25,297 9,34,165 7,30,463 2,02,324 13,2252000-01 13,22,391 12,03,174 11,30,699 9,14,394 4,64,224 1,08,4482001-02 13,54,851 12,52,768 11,64,307 10,05,306 5,60,8491,27,6072002-03 15,43,972 13,92,861 12,72,841 11,16,711 7,20,1111,51,6552003-04 18,09,704 16,16,227 14,91,966 13,31,718 8,98,7701,86,1992004-05 22,00,727 20,05,214 18,10,513 16,20,657 11,45,395 3,31,9582005-06 26,17,605 23,73,749 21,55,342 19,16,254 15,10,235 7,60,3692006-07 32,00,093 29,88,128 27,33,439 24,12,711 19,24,878 10,90,4592007-08 38,73,443 36,07,221 33,31,461 29,45,493 23,50,187 15,20,7392008-09 43,74,570 41,81,994 39,32,288 34,51,596 29,27,561 19,18,806
Table 2.12Sales (Rs.crore) of Companies in Continuous Time Series in aPanel beginning in a year: 1989-90 to2008-09
Panel Time-span of Panelbeginning in 3 years 5 years 7 years 10 years 15 years 20 years1989-90 1,89,564 1,74,012 1,64,453 1,52,308 1,39,669 1,25,6461990-91 2,35,400 2,19,248 2,04,195 1,92,755 1,73,620 84,6381991-92 3,10,334 2,91,404 2,73,028 2,61,171 2,34,004 461992-93 3,75,849 3,49,283 3,31,886 3,12,877 2,67,6731993-94 4,28,649 3,94,519 3,80,533 3,39,444 3,01,6401994-95 5,49,272 5,17,105 4,96,434 4,44,309 3,93,6111995-96 6,75,927 6,46,425 6,12,562 5,55,481 2,47,8391996-97 7,91,365 7,45,905 6,80,675 6,34,495 821997-98 8,81,640 8,21,514 7,61,641 7,01,6651998-99 9,77,713 8,91,014 8,45,502 7,67,4511999-00 11,21,003 10,37,704 9,76,430 8,84,7952000-01 12,95,363 12,24,770 11,40,354 4,93,8242001-02 14,04,927 13,05,845 12,20,738 732002-03 16,02,201 14,79,549 13,56,9892003-04 18,75,644 16,88,870 7,37,8682004-05 21,50,373 19,53,392 82005-06 25,59,563 10,98,4782006-07 30,49,295 72007-08 17,62,1462008-09
Prowess Centre for Monitoring Indian Economy
28 Companies Covered
2.6.4.2 Continuous time series data sets of listed companies
Most of the companies for which Prowess has longtime-series data are listed companies. Listed companiesare required to disclose a lot more information than thenon-listed companies. Companies for which we havea long time-series are also those that are large in size.Thus, for larger, listed companies, Prowess has a longtime-series of data and these are the companies thathave copious amounts of disclosures.
There are 657 companies for which Prowess containsdata for each of the 20 years between 1989-90 and2008-09. Of these, 557 are listed companies.
As the time-span of the panel decreases, the numberof listed companies for which the time-series is avail-able increases. But, since there are a smaller numberof listed companies, the increase in the count is smallerthan the increase seen in all companies. There are onlyabout six thousand listed companies. Thus, the panelof companies for which all the years of information isavailable cannot exceed this.
As a result, if we take a set of companies for which wehave data for all seven years ended 2008-09, we wouldfind over 6,000 companies. But, we would find onlyabout 3,000 listed companies.
As a proportion of the available companies, the cover-age of listed companies would always be higher. But,in absolute terms it is always lower. For example, in theabove case, while only about 20 per cent of all compa-nies had a panel set for seven years, a higher proportion
of about 65 per cent of listed companies had a panel forthe same seven years.
There is a difference between the size of panel of com-panies ending in a year compared to the size of the panelof companies beginning in the corresponding base year.For example, while there are 557 companies that have20 years of data ending in 2008-09, there are only 437companies that have 20 years of data beginning in 1989-90.
This difference arises because all the 550 listed com-panies for which we have 20 years of data ending in2008-09, were not listed companies 20 years ago. And,20 years ago, in 1989-90, we had 438 listed companiesthat have provided data for each of the subsequent 20years.
Like it is not necessary that the 557 companies that werelisted as of 2008-09 were listed throughout the 20-yearperiod, it is also not necessary that the 438 companiesthat were listed in 1989-90 remained listed through thenext 20 years. In the tabulations presented here, wecount the number of companies for which data is avail-able for all the years during the time-span. The sta-tus of the company (such as listed or not listed) is con-sidered only in one year – the beginning or the endingyear in these computations. The status (such as listed ornot listed) is checked only in one year and not in eachyear of the time-span. This presentation is illustrative,to give some idea of the dataset available in Prowess.
Centre for Monitoring Indian Economy Prowess
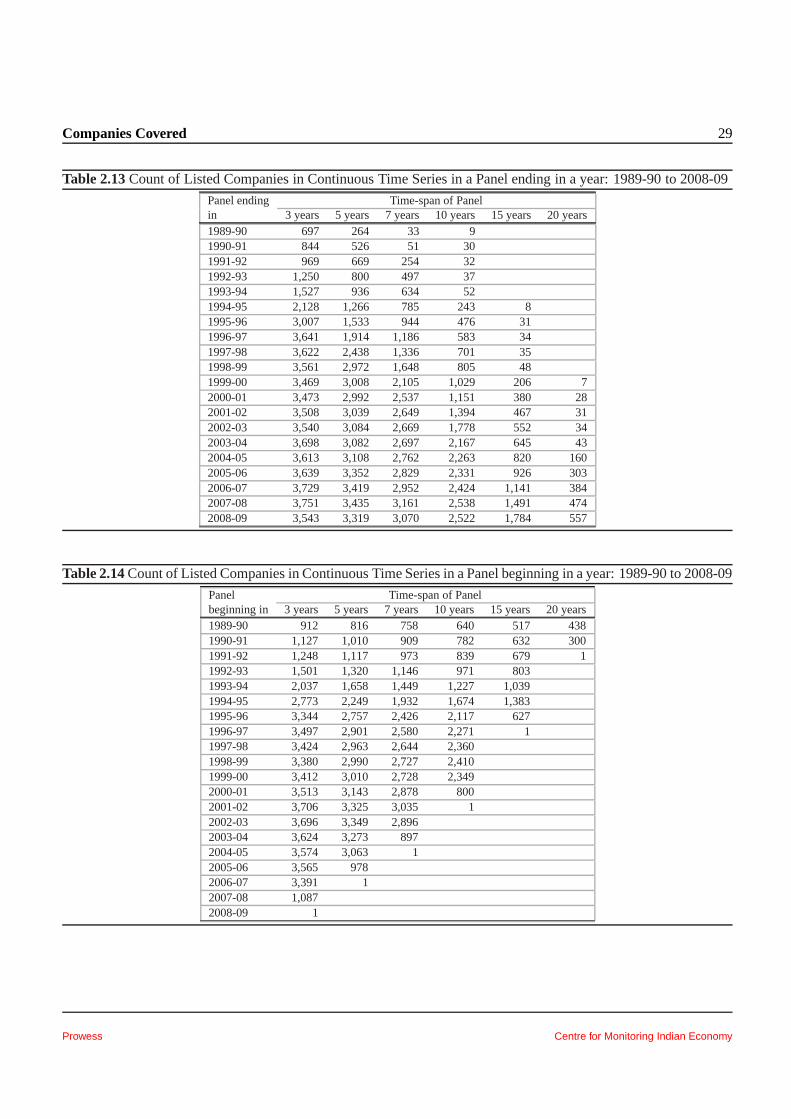
Companies Covered 29
Table 2.13Count of Listed Companies in Continuous Time Series in a Panel ending in a year: 1989-90 to 2008-09
Panel ending Time-span of Panelin 3 years 5 years 7 years 10 years 15 years 20 years1989-90 697 264 33 91990-91 844 526 51 301991-92 969 669 254 321992-93 1,250 800 497 371993-94 1,527 936 634 521994-95 2,128 1,266 785 243 81995-96 3,007 1,533 944 476 311996-97 3,641 1,914 1,186 583 341997-98 3,622 2,438 1,336 701 351998-99 3,561 2,972 1,648 805 481999-00 3,469 3,008 2,105 1,029 206 72000-01 3,473 2,992 2,537 1,151 380 282001-02 3,508 3,039 2,649 1,394 467 312002-03 3,540 3,084 2,669 1,778 552 342003-04 3,698 3,082 2,697 2,167 645 432004-05 3,613 3,108 2,762 2,263 820 1602005-06 3,639 3,352 2,829 2,331 926 3032006-07 3,729 3,419 2,952 2,424 1,141 3842007-08 3,751 3,435 3,161 2,538 1,491 4742008-09 3,543 3,319 3,070 2,522 1,784 557
Table 2.14Count of Listed Companies in Continuous Time Series in a Panel beginning in a year: 1989-90 to 2008-09
Panel Time-span of Panelbeginning in 3 years 5 years 7 years 10 years 15 years 20 years1989-90 912 816 758 640 517 4381990-91 1,127 1,010 909 782 632 3001991-92 1,248 1,117 973 839 679 11992-93 1,501 1,320 1,146 971 8031993-94 2,037 1,658 1,449 1,227 1,0391994-95 2,773 2,249 1,932 1,674 1,3831995-96 3,344 2,757 2,426 2,117 6271996-97 3,497 2,901 2,580 2,271 11997-98 3,424 2,963 2,644 2,3601998-99 3,380 2,990 2,727 2,4101999-00 3,412 3,010 2,728 2,3492000-01 3,513 3,143 2,878 8002001-02 3,706 3,325 3,035 12002-03 3,696 3,349 2,8962003-04 3,624 3,273 8972004-05 3,574 3,063 12005-06 3,565 9782006-07 3,391 12007-08 1,0872008-09 1
Prowess Centre for Monitoring Indian Economy
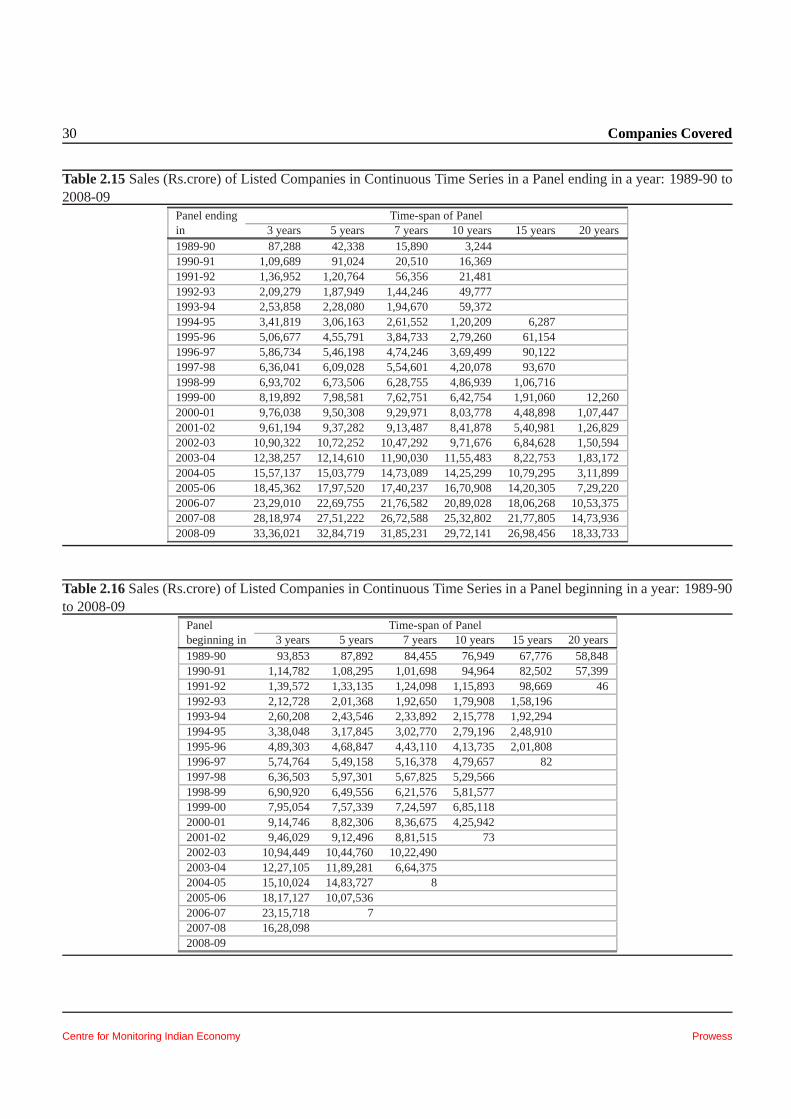
30 Companies Covered
Table 2.15Sales (Rs.crore) of Listed Companies in Continuous Time Series in a Panel ending in a year: 1989-90 to2008-09
Panel ending Time-span of Panelin 3 years 5 years 7 years 10 years 15 years 20 years1989-90 87,288 42,338 15,890 3,2441990-91 1,09,689 91,024 20,510 16,3691991-92 1,36,952 1,20,764 56,356 21,4811992-93 2,09,279 1,87,949 1,44,246 49,7771993-94 2,53,858 2,28,080 1,94,670 59,3721994-95 3,41,819 3,06,163 2,61,552 1,20,209 6,2871995-96 5,06,677 4,55,791 3,84,733 2,79,260 61,1541996-97 5,86,734 5,46,198 4,74,246 3,69,499 90,1221997-98 6,36,041 6,09,028 5,54,601 4,20,078 93,6701998-99 6,93,702 6,73,506 6,28,755 4,86,939 1,06,7161999-00 8,19,892 7,98,581 7,62,751 6,42,754 1,91,060 12,2602000-01 9,76,038 9,50,308 9,29,971 8,03,778 4,48,898 1,07,4472001-02 9,61,194 9,37,282 9,13,487 8,41,878 5,40,981 1,26,8292002-03 10,90,322 10,72,252 10,47,292 9,71,676 6,84,628 1,50,5942003-04 12,38,257 12,14,610 11,90,030 11,55,483 8,22,7531,83,1722004-05 15,57,137 15,03,779 14,73,089 14,25,299 10,79,295 3,11,8992005-06 18,45,362 17,97,520 17,40,237 16,70,908 14,20,305 7,29,2202006-07 23,29,010 22,69,755 21,76,582 20,89,028 18,06,268 10,53,3752007-08 28,18,974 27,51,222 26,72,588 25,32,802 21,77,805 14,73,9362008-09 33,36,021 32,84,719 31,85,231 29,72,141 26,98,456 18,33,733
Table 2.16Sales (Rs.crore) of Listed Companies in Continuous Time Series in a Panel beginning in a year: 1989-90to 2008-09
Panel Time-span of Panelbeginning in 3 years 5 years 7 years 10 years 15 years 20 years1989-90 93,853 87,892 84,455 76,949 67,776 58,8481990-91 1,14,782 1,08,295 1,01,698 94,964 82,502 57,3991991-92 1,39,572 1,33,135 1,24,098 1,15,893 98,669 461992-93 2,12,728 2,01,368 1,92,650 1,79,908 1,58,1961993-94 2,60,208 2,43,546 2,33,892 2,15,778 1,92,2941994-95 3,38,048 3,17,845 3,02,770 2,79,196 2,48,9101995-96 4,89,303 4,68,847 4,43,110 4,13,735 2,01,8081996-97 5,74,764 5,49,158 5,16,378 4,79,657 821997-98 6,36,503 5,97,301 5,67,825 5,29,5661998-99 6,90,920 6,49,556 6,21,576 5,81,5771999-00 7,95,054 7,57,339 7,24,597 6,85,1182000-01 9,14,746 8,82,306 8,36,675 4,25,9422001-02 9,46,029 9,12,496 8,81,515 732002-03 10,94,449 10,44,760 10,22,4902003-04 12,27,105 11,89,281 6,64,3752004-05 15,10,024 14,83,727 82005-06 18,17,127 10,07,5362006-07 23,15,718 72007-08 16,28,0982008-09
Centre for Monitoring Indian Economy Prowess
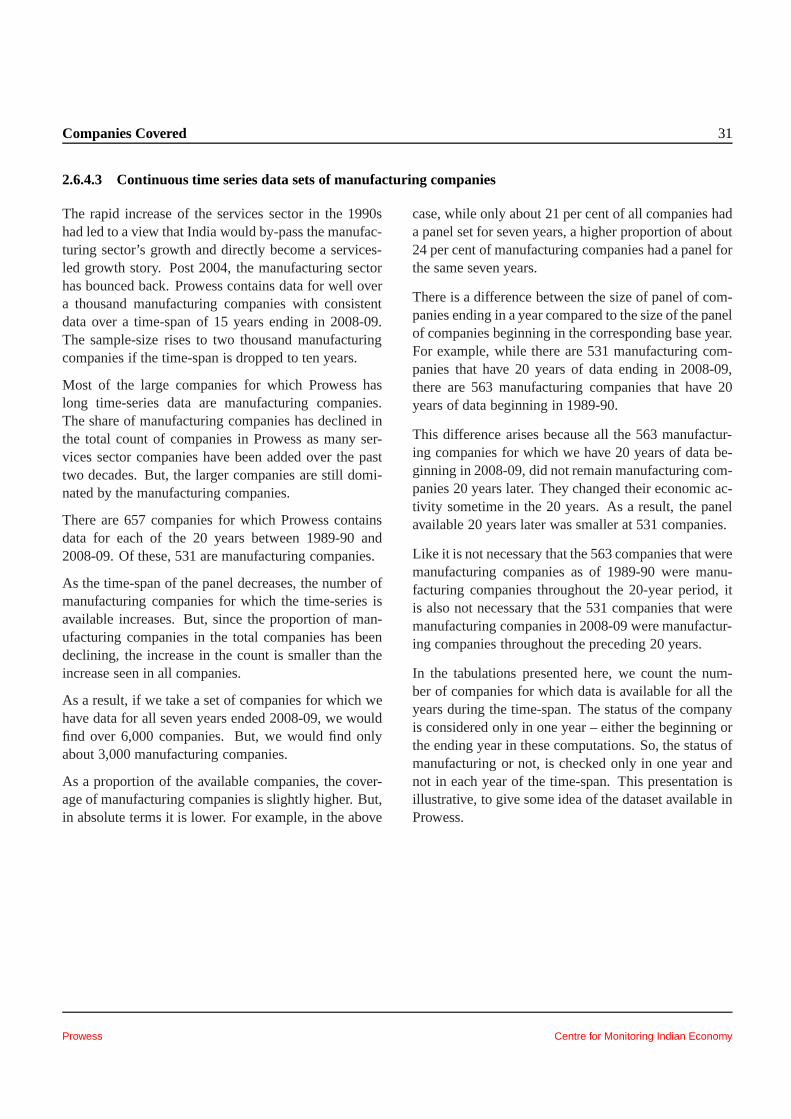
Companies Covered 31
2.6.4.3 Continuous time series data sets of manufacturing companies
The rapid increase of the services sector in the 1990shad led to a view that India would by-pass the manufac-turing sector’s growth and directly become a services-led growth story. Post 2004, the manufacturing sectorhas bounced back. Prowess contains data for well overa thousand manufacturing companies with consistentdata over a time-span of 15 years ending in 2008-09.The sample-size rises to two thousand manufacturingcompanies if the time-span is dropped to ten years.
Most of the large companies for which Prowess haslong time-series data are manufacturing companies.The share of manufacturing companies has declined inthe total count of companies in Prowess as many ser-vices sector companies have been added over the pasttwo decades. But, the larger companies are still domi-nated by the manufacturing companies.
There are 657 companies for which Prowess containsdata for each of the 20 years between 1989-90 and2008-09. Of these, 531 are manufacturing companies.
As the time-span of the panel decreases, the number ofmanufacturing companies for which the time-series isavailable increases. But, since the proportion of man-ufacturing companies in the total companies has beendeclining, the increase in the count is smaller than theincrease seen in all companies.
As a result, if we take a set of companies for which wehave data for all seven years ended 2008-09, we wouldfind over 6,000 companies. But, we would find onlyabout 3,000 manufacturing companies.
As a proportion of the available companies, the cover-age of manufacturing companies is slightly higher. But,in absolute terms it is lower. For example, in the above
case, while only about 21 per cent of all companies hada panel set for seven years, a higher proportion of about24 per cent of manufacturing companies had a panel forthe same seven years.
There is a difference between the size of panel of com-panies ending in a year compared to the size of the panelof companies beginning in the corresponding base year.For example, while there are 531 manufacturing com-panies that have 20 years of data ending in 2008-09,there are 563 manufacturing companies that have 20years of data beginning in 1989-90.
This difference arises because all the 563 manufactur-ing companies for which we have 20 years of data be-ginning in 2008-09, did not remain manufacturing com-panies 20 years later. They changed their economic ac-tivity sometime in the 20 years. As a result, the panelavailable 20 years later was smaller at 531 companies.
Like it is not necessary that the 563 companies that weremanufacturing companies as of 1989-90 were manu-facturing companies throughout the 20-year period, itis also not necessary that the 531 companies that weremanufacturing companies in 2008-09 were manufactur-ing companies throughout the preceding 20 years.
In the tabulations presented here, we count the num-ber of companies for which data is available for all theyears during the time-span. The status of the companyis considered only in one year – either the beginning orthe ending year in these computations. So, the status ofmanufacturing or not, is checked only in one year andnot in each year of the time-span. This presentation isillustrative, to give some idea of the dataset available inProwess.
Prowess Centre for Monitoring Indian Economy
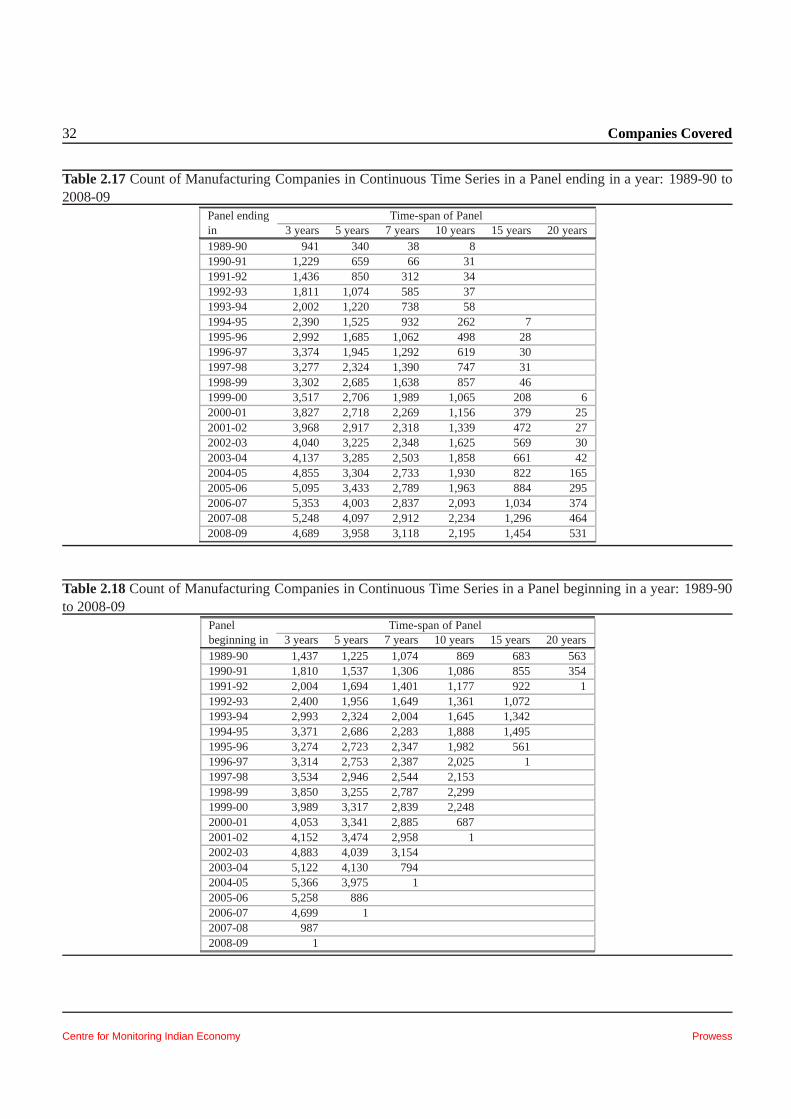
32 Companies Covered
Table 2.17Count of Manufacturing Companies in Continuous Time Seriesin a Panel ending in a year: 1989-90 to2008-09
Panel ending Time-span of Panelin 3 years 5 years 7 years 10 years 15 years 20 years1989-90 941 340 38 81990-91 1,229 659 66 311991-92 1,436 850 312 341992-93 1,811 1,074 585 371993-94 2,002 1,220 738 581994-95 2,390 1,525 932 262 71995-96 2,992 1,685 1,062 498 281996-97 3,374 1,945 1,292 619 301997-98 3,277 2,324 1,390 747 311998-99 3,302 2,685 1,638 857 461999-00 3,517 2,706 1,989 1,065 208 62000-01 3,827 2,718 2,269 1,156 379 252001-02 3,968 2,917 2,318 1,339 472 272002-03 4,040 3,225 2,348 1,625 569 302003-04 4,137 3,285 2,503 1,858 661 422004-05 4,855 3,304 2,733 1,930 822 1652005-06 5,095 3,433 2,789 1,963 884 2952006-07 5,353 4,003 2,837 2,093 1,034 3742007-08 5,248 4,097 2,912 2,234 1,296 4642008-09 4,689 3,958 3,118 2,195 1,454 531
Table 2.18Count of Manufacturing Companies in Continuous Time Seriesin a Panel beginning in a year: 1989-90to 2008-09
Panel Time-span of Panelbeginning in 3 years 5 years 7 years 10 years 15 years 20 years1989-90 1,437 1,225 1,074 869 683 5631990-91 1,810 1,537 1,306 1,086 855 3541991-92 2,004 1,694 1,401 1,177 922 11992-93 2,400 1,956 1,649 1,361 1,0721993-94 2,993 2,324 2,004 1,645 1,3421994-95 3,371 2,686 2,283 1,888 1,4951995-96 3,274 2,723 2,347 1,982 5611996-97 3,314 2,753 2,387 2,025 11997-98 3,534 2,946 2,544 2,1531998-99 3,850 3,255 2,787 2,2991999-00 3,989 3,317 2,839 2,2482000-01 4,053 3,341 2,885 6872001-02 4,152 3,474 2,958 12002-03 4,883 4,039 3,1542003-04 5,122 4,130 7942004-05 5,366 3,975 12005-06 5,258 8862006-07 4,699 12007-08 9872008-09 1
Centre for Monitoring Indian Economy Prowess
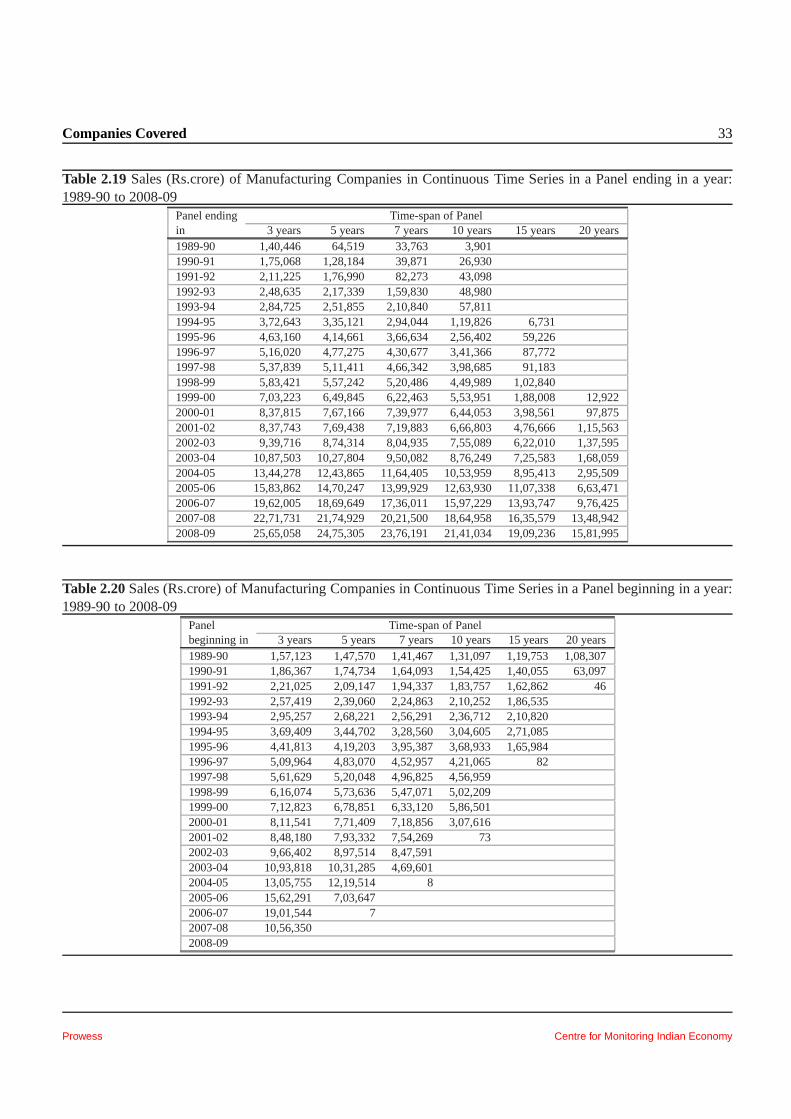
Companies Covered 33
Table 2.19Sales (Rs.crore) of Manufacturing Companies in ContinuousTime Series in a Panel ending in a year:1989-90 to 2008-09
Panel ending Time-span of Panelin 3 years 5 years 7 years 10 years 15 years 20 years1989-90 1,40,446 64,519 33,763 3,9011990-91 1,75,068 1,28,184 39,871 26,9301991-92 2,11,225 1,76,990 82,273 43,0981992-93 2,48,635 2,17,339 1,59,830 48,9801993-94 2,84,725 2,51,855 2,10,840 57,8111994-95 3,72,643 3,35,121 2,94,044 1,19,826 6,7311995-96 4,63,160 4,14,661 3,66,634 2,56,402 59,2261996-97 5,16,020 4,77,275 4,30,677 3,41,366 87,7721997-98 5,37,839 5,11,411 4,66,342 3,98,685 91,1831998-99 5,83,421 5,57,242 5,20,486 4,49,989 1,02,8401999-00 7,03,223 6,49,845 6,22,463 5,53,951 1,88,008 12,9222000-01 8,37,815 7,67,166 7,39,977 6,44,053 3,98,561 97,8752001-02 8,37,743 7,69,438 7,19,883 6,66,803 4,76,666 1,15,5632002-03 9,39,716 8,74,314 8,04,935 7,55,089 6,22,010 1,37,5952003-04 10,87,503 10,27,804 9,50,082 8,76,249 7,25,583 1,68,0592004-05 13,44,278 12,43,865 11,64,405 10,53,959 8,95,4132,95,5092005-06 15,83,862 14,70,247 13,99,929 12,63,930 11,07,338 6,63,4712006-07 19,62,005 18,69,649 17,36,011 15,97,229 13,93,747 9,76,4252007-08 22,71,731 21,74,929 20,21,500 18,64,958 16,35,579 13,48,9422008-09 25,65,058 24,75,305 23,76,191 21,41,034 19,09,236 15,81,995
Table 2.20Sales (Rs.crore) of Manufacturing Companies in ContinuousTime Series in a Panel beginning in a year:1989-90 to 2008-09
Panel Time-span of Panelbeginning in 3 years 5 years 7 years 10 years 15 years 20 years1989-90 1,57,123 1,47,570 1,41,467 1,31,097 1,19,753 1,08,3071990-91 1,86,367 1,74,734 1,64,093 1,54,425 1,40,055 63,0971991-92 2,21,025 2,09,147 1,94,337 1,83,757 1,62,862 461992-93 2,57,419 2,39,060 2,24,863 2,10,252 1,86,5351993-94 2,95,257 2,68,221 2,56,291 2,36,712 2,10,8201994-95 3,69,409 3,44,702 3,28,560 3,04,605 2,71,0851995-96 4,41,813 4,19,203 3,95,387 3,68,933 1,65,9841996-97 5,09,964 4,83,070 4,52,957 4,21,065 821997-98 5,61,629 5,20,048 4,96,825 4,56,9591998-99 6,16,074 5,73,636 5,47,071 5,02,2091999-00 7,12,823 6,78,851 6,33,120 5,86,5012000-01 8,11,541 7,71,409 7,18,856 3,07,6162001-02 8,48,180 7,93,332 7,54,269 732002-03 9,66,402 8,97,514 8,47,5912003-04 10,93,818 10,31,285 4,69,6012004-05 13,05,755 12,19,514 82005-06 15,62,291 7,03,6472006-07 19,01,544 72007-08 10,56,3502008-09
Prowess Centre for Monitoring Indian Economy
34 Companies Covered
2.6.4.4 Continuous time series data sets of finance companies
The number of finance companies has grown rapidlyonly in recent years. As a result, the count of companiesin a panel over a long time-span is relatively low. Thereare around 600 finance companies for which data canbe found for 10 consecutive years ending in 2007-08 or2008-09. In comparison there are over 2,000 manufac-turing companies with 10 years of data ending in thesame two years.
There are only 25 finance companies with 20 years ofdata compared to the 632 non-finance companies thathave 20 years of data ending in 2008-09.
The life-span of many finance companies in theProwess database is low. These are investment com-panies – mostly subsidiary investment companies – oflarge, often listed, companies. Such companies appearin the Annual Reports of the parent companies in oneyear and may disappear in the next.
Finance companies are also vulnerable to changes ineconomic activity classification. An ”idle” company isoften classified as a finance company, because its onlyincome may be interest on deposits or dividends on in-vestments. However, when it stops being an idle com-pany and starts operations it is not classified as a financecompany. Companies do flip between being a tradingcompany and an idle finance company from one year toanother.
This explains, partly, the difference in the count of com-panies in a panel beginning and ending for the sametime-span.
There is, usually, a difference between the size of apanel of companies ending in a year compared to thesize of the panel of companies beginning in the corre-sponding base year. For example, while there are 25companies that have 20 years of data ending in 2008-09, there are only 13 companies that have 20 years ofdata beginning in 1989-90.
This difference arises because all the 25 that were fi-nance companies for which we have 20 years of dataending in 2008-09, were not finance companies 20years ago. They changed their economic activity fromnon-finance to finance sometime in the 20 years. As aresult, the panel available 20 years ago was smaller at13 companies.
Like it is not necessary that the 25 companies that werefinance companies as of 2008-09 were finance compa-nies throughout the 20 year period, it is also not nec-essary that the 13 companies that were finance compa-nies in 1989-90 remained finance companies throughthe next 20 years.
In the tabulations presented here, we count the num-ber of companies for which data is available for all theyears during the time-span. The status of the companyis considered only in one year – either in the beginningor in the ending year in these computations. So, the sta-tus of finance or not, is checked only in one year andnot in each year of the time-span. This presentation isillustrative, to give some idea of the dataset available inProwess.
Centre for Monitoring Indian Economy Prowess
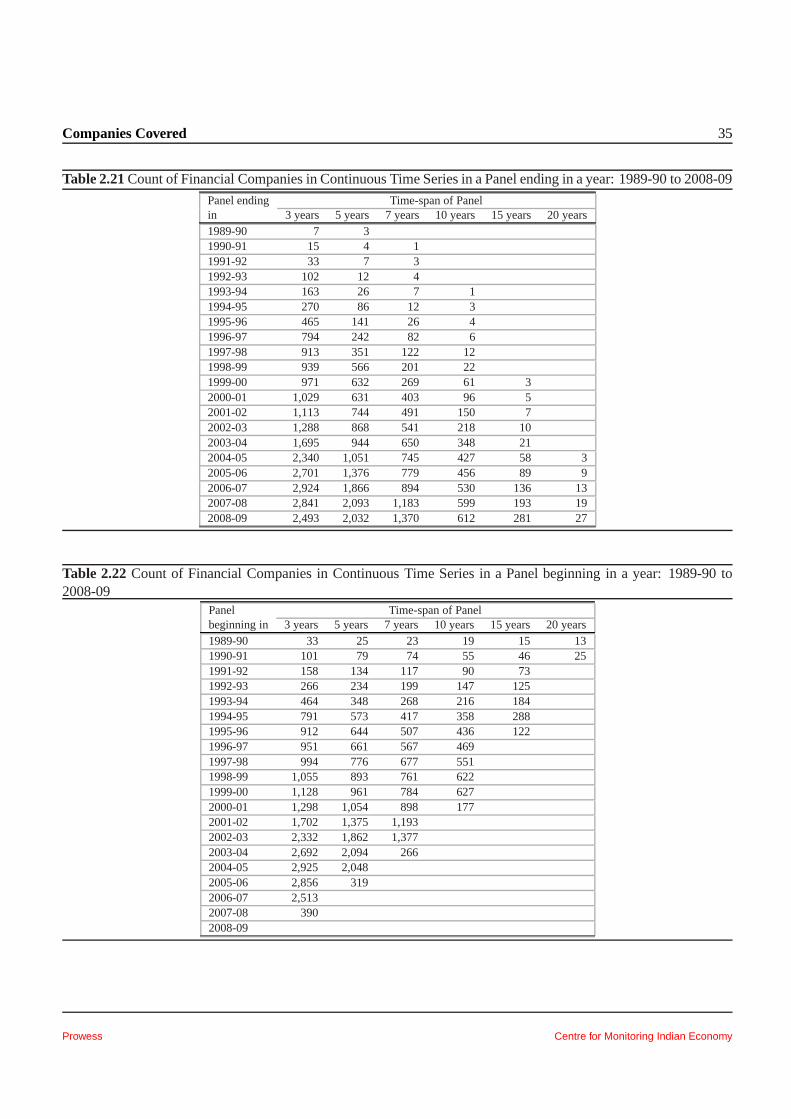
Companies Covered 35
Table 2.21Count of Financial Companies in Continuous Time Series in a Panel ending in a year: 1989-90 to 2008-09
Panel ending Time-span of Panelin 3 years 5 years 7 years 10 years 15 years 20 years1989-90 7 31990-91 15 4 11991-92 33 7 31992-93 102 12 41993-94 163 26 7 11994-95 270 86 12 31995-96 465 141 26 41996-97 794 242 82 61997-98 913 351 122 121998-99 939 566 201 221999-00 971 632 269 61 32000-01 1,029 631 403 96 52001-02 1,113 744 491 150 72002-03 1,288 868 541 218 102003-04 1,695 944 650 348 212004-05 2,340 1,051 745 427 58 32005-06 2,701 1,376 779 456 89 92006-07 2,924 1,866 894 530 136 132007-08 2,841 2,093 1,183 599 193 192008-09 2,493 2,032 1,370 612 281 27
Table 2.22Count of Financial Companies in Continuous Time Series in a Panel beginning in a year: 1989-90 to2008-09
Panel Time-span of Panelbeginning in 3 years 5 years 7 years 10 years 15 years 20 years1989-90 33 25 23 19 15 131990-91 101 79 74 55 46 251991-92 158 134 117 90 731992-93 266 234 199 147 1251993-94 464 348 268 216 1841994-95 791 573 417 358 2881995-96 912 644 507 436 1221996-97 951 661 567 4691997-98 994 776 677 5511998-99 1,055 893 761 6221999-00 1,128 961 784 6272000-01 1,298 1,054 898 1772001-02 1,702 1,375 1,1932002-03 2,332 1,862 1,3772003-04 2,692 2,094 2662004-05 2,925 2,0482005-06 2,856 3192006-07 2,5132007-08 3902008-09
Prowess Centre for Monitoring Indian Economy
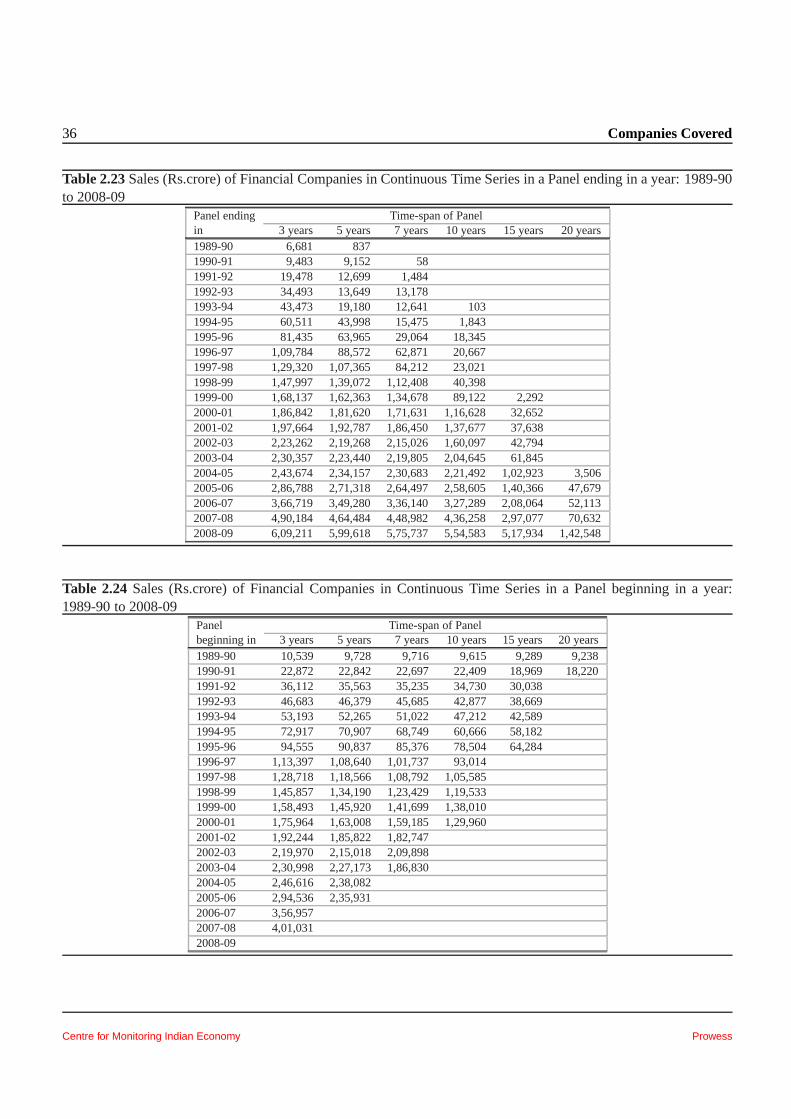
36 Companies Covered
Table 2.23Sales (Rs.crore) of Financial Companies in Continuous TimeSeries in a Panel ending in a year: 1989-90to 2008-09
Panel ending Time-span of Panelin 3 years 5 years 7 years 10 years 15 years 20 years1989-90 6,681 8371990-91 9,483 9,152 581991-92 19,478 12,699 1,4841992-93 34,493 13,649 13,1781993-94 43,473 19,180 12,641 1031994-95 60,511 43,998 15,475 1,8431995-96 81,435 63,965 29,064 18,3451996-97 1,09,784 88,572 62,871 20,6671997-98 1,29,320 1,07,365 84,212 23,0211998-99 1,47,997 1,39,072 1,12,408 40,3981999-00 1,68,137 1,62,363 1,34,678 89,122 2,2922000-01 1,86,842 1,81,620 1,71,631 1,16,628 32,6522001-02 1,97,664 1,92,787 1,86,450 1,37,677 37,6382002-03 2,23,262 2,19,268 2,15,026 1,60,097 42,7942003-04 2,30,357 2,23,440 2,19,805 2,04,645 61,8452004-05 2,43,674 2,34,157 2,30,683 2,21,492 1,02,923 3,5062005-06 2,86,788 2,71,318 2,64,497 2,58,605 1,40,366 47,6792006-07 3,66,719 3,49,280 3,36,140 3,27,289 2,08,064 52,1132007-08 4,90,184 4,64,484 4,48,982 4,36,258 2,97,077 70,6322008-09 6,09,211 5,99,618 5,75,737 5,54,583 5,17,934 1,42,548
Table 2.24Sales (Rs.crore) of Financial Companies in Continuous TimeSeries in a Panel beginning in a year:1989-90 to 2008-09
Panel Time-span of Panelbeginning in 3 years 5 years 7 years 10 years 15 years 20 years1989-90 10,539 9,728 9,716 9,615 9,289 9,2381990-91 22,872 22,842 22,697 22,409 18,969 18,2201991-92 36,112 35,563 35,235 34,730 30,0381992-93 46,683 46,379 45,685 42,877 38,6691993-94 53,193 52,265 51,022 47,212 42,5891994-95 72,917 70,907 68,749 60,666 58,1821995-96 94,555 90,837 85,376 78,504 64,2841996-97 1,13,397 1,08,640 1,01,737 93,0141997-98 1,28,718 1,18,566 1,08,792 1,05,5851998-99 1,45,857 1,34,190 1,23,429 1,19,5331999-00 1,58,493 1,45,920 1,41,699 1,38,0102000-01 1,75,964 1,63,008 1,59,185 1,29,9602001-02 1,92,244 1,85,822 1,82,7472002-03 2,19,970 2,15,018 2,09,8982003-04 2,30,998 2,27,173 1,86,8302004-05 2,46,616 2,38,0822005-06 2,94,536 2,35,9312006-07 3,56,9572007-08 4,01,0312008-09
Centre for Monitoring Indian Economy Prowess
Companies Covered 37
2.6.4.5 Continuous time series data sets of non-finance service companies
Non-financial services companies form a heteroge-neous mix. They range from the highly organisedtelecommunication sector to the unorganised retailtrade sector, from the capital-intensive aviation sectorto the low capital intensity sectors such as trading.
The number of non-finance services companies hasgrown rapidly in recent years. As a result, the count ofcompanies in a panel over a long time-span is relativelylow. There are only around 600 non-financial servicescompanies for which data can be found for 10 consecu-tive years ending in 2007-08 or 2008-09. In comparisonthere are over 2,000 manufacturing companies with 10years of data ending in the same two years.
There are only 64 non-financial services companieswith 20 years of data compared to the over 500 man-ufacturing companies that have 20 years of data endingin 2008-09.
There is, usually, a difference between the size of apanel of companies ending in a year compared to thesize of the panel of companies beginning in the corre-sponding base year. For example, while there are 64non-financial services companies that have 20 years ofdata ending in 2008-09, there are only 49 non-financialservices companies that have 20 years of data beginningin 1989-90.
This difference arises because all the 64 that were non-financial service companies for which we have 20 yearsof data ending in 2008-09, were not non-financial ser-vice companies 20 years ago. They changed their eco-nomic activity sometime in the 20 years. As a result,the panel available 20 years ago was smaller at 49 com-panies.
Like it is not necessary that the 64 companies thatwere non-financial services companies as of 2008-09were also non-financial services companies throughoutthe 20-year period, it is also not necessary that the 49companies that were non-financial services companiesin 1989-90 remained non-financial services companiesthrough the next 20 years.
In the tabulations presented here, we count the numberof companies for which data is available for all the yearsduring the time-span. The status of the company is con-sidered only in one year – either in the beginning or inthe ending year in these computations. So, the status ofa company being a non-financial services company ornot, is checked only in one year and not in each year ofthe time-span. This presentation is illustrative, to givesome idea of the dataset available in Prowess.
Prowess Centre for Monitoring Indian Economy
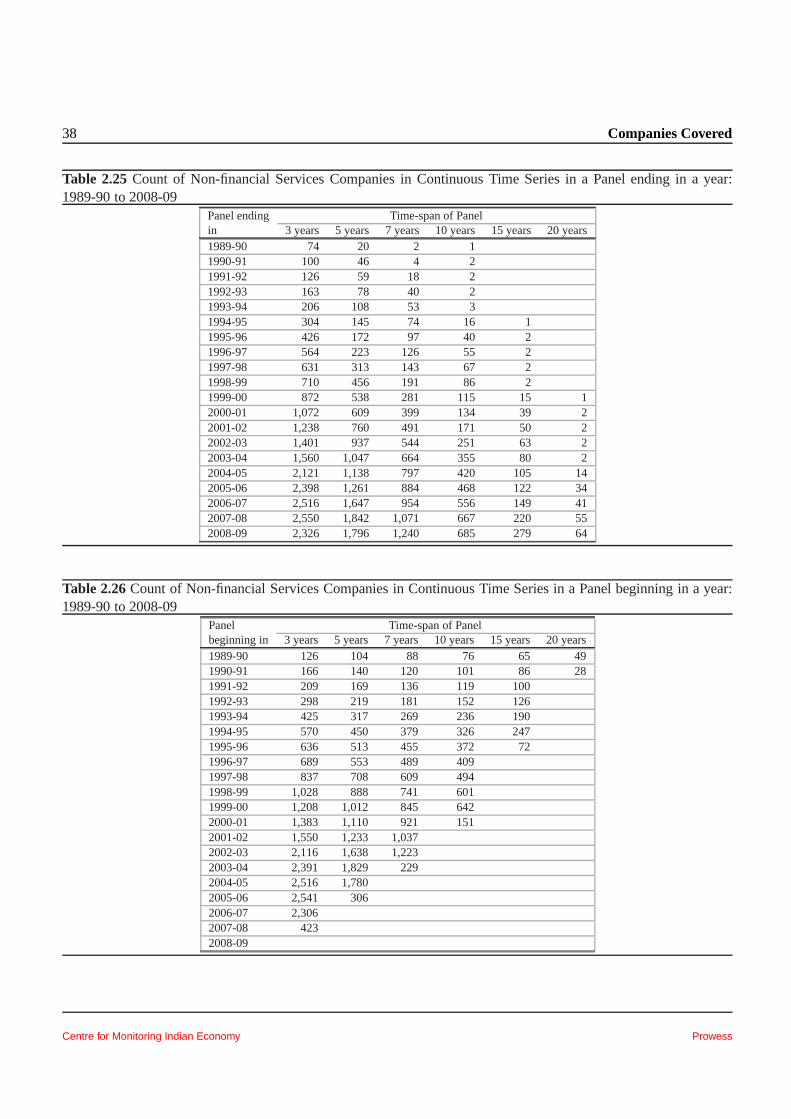
38 Companies Covered
Table 2.25Count of Non-financial Services Companies in Continuous Time Series in a Panel ending in a year:1989-90 to 2008-09
Panel ending Time-span of Panelin 3 years 5 years 7 years 10 years 15 years 20 years1989-90 74 20 2 11990-91 100 46 4 21991-92 126 59 18 21992-93 163 78 40 21993-94 206 108 53 31994-95 304 145 74 16 11995-96 426 172 97 40 21996-97 564 223 126 55 21997-98 631 313 143 67 21998-99 710 456 191 86 21999-00 872 538 281 115 15 12000-01 1,072 609 399 134 39 22001-02 1,238 760 491 171 50 22002-03 1,401 937 544 251 63 22003-04 1,560 1,047 664 355 80 22004-05 2,121 1,138 797 420 105 142005-06 2,398 1,261 884 468 122 342006-07 2,516 1,647 954 556 149 412007-08 2,550 1,842 1,071 667 220 552008-09 2,326 1,796 1,240 685 279 64
Table 2.26Count of Non-financial Services Companies in Continuous Time Series in a Panel beginning in a year:1989-90 to 2008-09
Panel Time-span of Panelbeginning in 3 years 5 years 7 years 10 years 15 years 20 years1989-90 126 104 88 76 65 491990-91 166 140 120 101 86 281991-92 209 169 136 119 1001992-93 298 219 181 152 1261993-94 425 317 269 236 1901994-95 570 450 379 326 2471995-96 636 513 455 372 721996-97 689 553 489 4091997-98 837 708 609 4941998-99 1,028 888 741 6011999-00 1,208 1,012 845 6422000-01 1,383 1,110 921 1512001-02 1,550 1,233 1,0372002-03 2,116 1,638 1,2232003-04 2,391 1,829 2292004-05 2,516 1,7802005-06 2,541 3062006-07 2,3062007-08 4232008-09
Centre for Monitoring Indian Economy Prowess
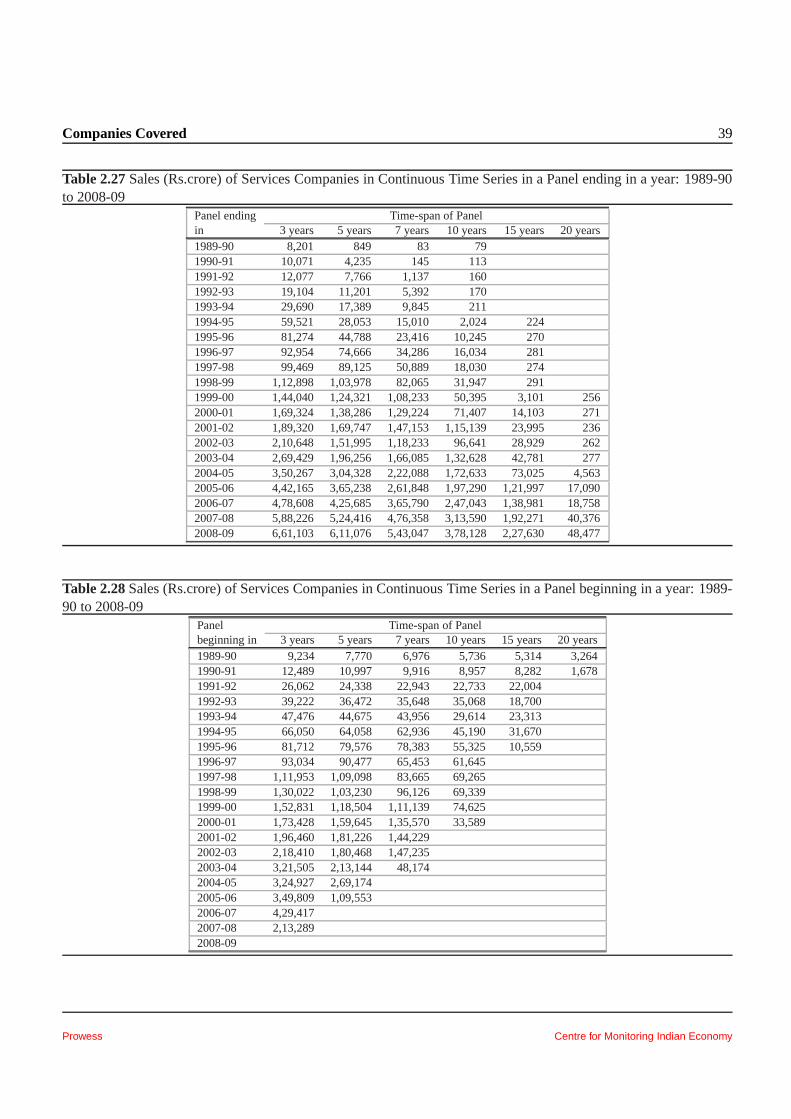
Companies Covered 39
Table 2.27Sales (Rs.crore) of Services Companies in Continuous Time Series in a Panel ending in a year: 1989-90to 2008-09
Panel ending Time-span of Panelin 3 years 5 years 7 years 10 years 15 years 20 years1989-90 8,201 849 83 791990-91 10,071 4,235 145 1131991-92 12,077 7,766 1,137 1601992-93 19,104 11,201 5,392 1701993-94 29,690 17,389 9,845 2111994-95 59,521 28,053 15,010 2,024 2241995-96 81,274 44,788 23,416 10,245 2701996-97 92,954 74,666 34,286 16,034 2811997-98 99,469 89,125 50,889 18,030 2741998-99 1,12,898 1,03,978 82,065 31,947 2911999-00 1,44,040 1,24,321 1,08,233 50,395 3,101 2562000-01 1,69,324 1,38,286 1,29,224 71,407 14,103 2712001-02 1,89,320 1,69,747 1,47,153 1,15,139 23,995 2362002-03 2,10,648 1,51,995 1,18,233 96,641 28,929 2622003-04 2,69,429 1,96,256 1,66,085 1,32,628 42,781 2772004-05 3,50,267 3,04,328 2,22,088 1,72,633 73,025 4,5632005-06 4,42,165 3,65,238 2,61,848 1,97,290 1,21,997 17,0902006-07 4,78,608 4,25,685 3,65,790 2,47,043 1,38,981 18,7582007-08 5,88,226 5,24,416 4,76,358 3,13,590 1,92,271 40,3762008-09 6,61,103 6,11,076 5,43,047 3,78,128 2,27,630 48,477
Table 2.28Sales (Rs.crore) of Services Companies in Continuous Time Series in a Panel beginning in a year: 1989-90 to 2008-09
Panel Time-span of Panelbeginning in 3 years 5 years 7 years 10 years 15 years 20 years1989-90 9,234 7,770 6,976 5,736 5,314 3,2641990-91 12,489 10,997 9,916 8,957 8,282 1,6781991-92 26,062 24,338 22,943 22,733 22,0041992-93 39,222 36,472 35,648 35,068 18,7001993-94 47,476 44,675 43,956 29,614 23,3131994-95 66,050 64,058 62,936 45,190 31,6701995-96 81,712 79,576 78,383 55,325 10,5591996-97 93,034 90,477 65,453 61,6451997-98 1,11,953 1,09,098 83,665 69,2651998-99 1,30,022 1,03,230 96,126 69,3391999-00 1,52,831 1,18,504 1,11,139 74,6252000-01 1,73,428 1,59,645 1,35,570 33,5892001-02 1,96,460 1,81,226 1,44,2292002-03 2,18,410 1,80,468 1,47,2352003-04 3,21,505 2,13,144 48,1742004-05 3,24,927 2,69,1742005-06 3,49,809 1,09,5532006-07 4,29,4172007-08 2,13,2892008-09
Prowess Centre for Monitoring Indian Economy
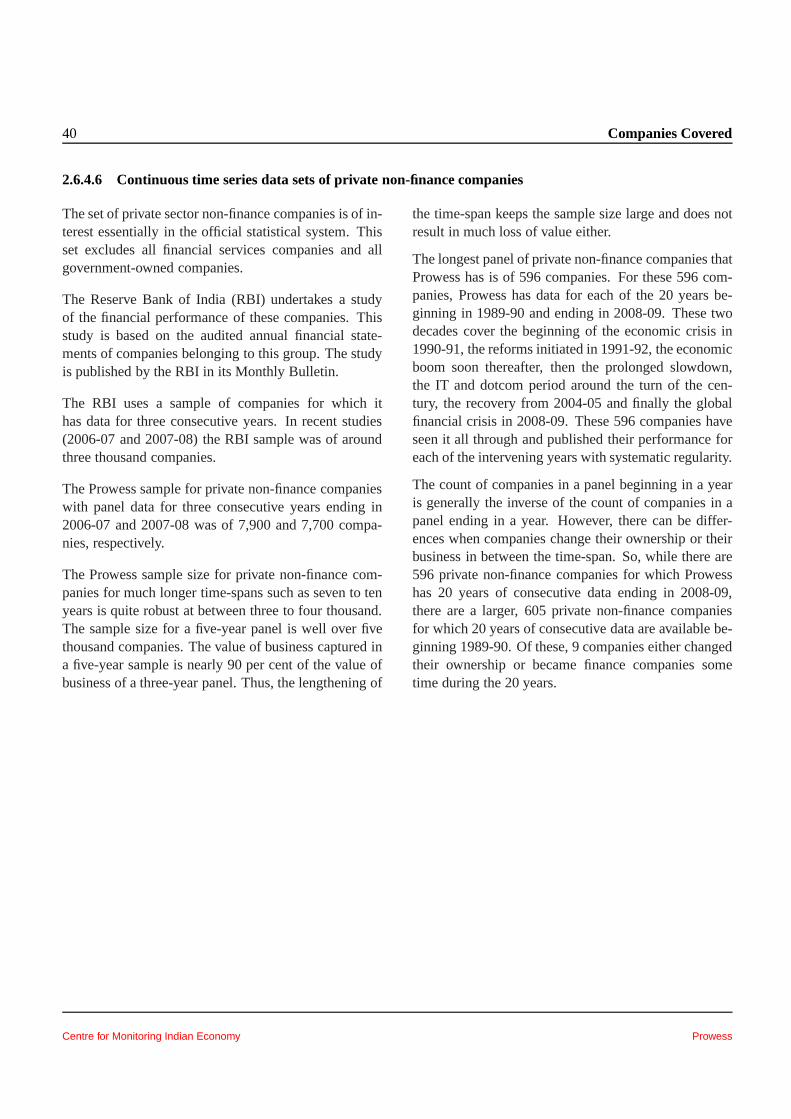
40 Companies Covered
2.6.4.6 Continuous time series data sets of private non-finance companies
The set of private sector non-finance companies is of in-terest essentially in the official statistical system. Thisset excludes all financial services companies and allgovernment-owned companies.
The Reserve Bank of India (RBI) undertakes a studyof the financial performance of these companies. Thisstudy is based on the audited annual financial state-ments of companies belonging to this group. The studyis published by the RBI in its Monthly Bulletin.
The RBI uses a sample of companies for which ithas data for three consecutive years. In recent studies(2006-07 and 2007-08) the RBI sample was of aroundthree thousand companies.
The Prowess sample for private non-finance companieswith panel data for three consecutive years ending in2006-07 and 2007-08 was of 7,900 and 7,700 compa-nies, respectively.
The Prowess sample size for private non-finance com-panies for much longer time-spans such as seven to tenyears is quite robust at between three to four thousand.The sample size for a five-year panel is well over fivethousand companies. The value of business captured ina five-year sample is nearly 90 per cent of the value ofbusiness of a three-year panel. Thus, the lengthening of
the time-span keeps the sample size large and does notresult in much loss of value either.
The longest panel of private non-finance companies thatProwess has is of 596 companies. For these 596 com-panies, Prowess has data for each of the 20 years be-ginning in 1989-90 and ending in 2008-09. These twodecades cover the beginning of the economic crisis in1990-91, the reforms initiated in 1991-92, the economicboom soon thereafter, then the prolonged slowdown,the IT and dotcom period around the turn of the cen-tury, the recovery from 2004-05 and finally the globalfinancial crisis in 2008-09. These 596 companies haveseen it all through and published their performance foreach of the intervening years with systematic regularity.
The count of companies in a panel beginning in a yearis generally the inverse of the count of companies in apanel ending in a year. However, there can be differ-ences when companies change their ownership or theirbusiness in between the time-span. So, while there are596 private non-finance companies for which Prowesshas 20 years of consecutive data ending in 2008-09,there are a larger, 605 private non-finance companiesfor which 20 years of consecutive data are available be-ginning 1989-90. Of these, 9 companies either changedtheir ownership or became finance companies sometime during the 20 years.
Centre for Monitoring Indian Economy Prowess
Companies Covered 41
Table 2.29Count of Private Non finance Companies in Continuous Time Series in a Panel ending in a year: 1989-90to 2008-09
Panel ending Time-span of Panelin 3 years 5 years 7 years 10 years 15 years 20 years1989-90 969 355 41 91990-91 1,284 693 72 331991-92 1,536 884 330 381992-93 1,942 1,133 625 401993-94 2,167 1,311 774 641994-95 2,664 1,650 986 280 81995-96 3,400 1,824 1,141 539 301996-97 3,943 2,136 1,395 659 341997-98 3,938 2,638 1,516 793 341998-99 4,061 3,168 1,817 926 491999-00 4,463 3,280 2,276 1,169 227 72000-01 4,967 3,386 2,703 1,281 420 282001-02 5,306 3,744 2,848 1,505 511 322002-03 5,573 4,232 2,952 1,886 617 342003-04 5,876 4,441 3,239 2,253 733 472004-05 7,198 4,543 3,599 2,393 922 1822005-06 7,788 4,836 3,765 2,490 1,001 3292006-07 8,238 5,869 3,915 2,728 1,189 4082007-08 8,262 6,203 4,137 2,988 1,534 5152008-09 7,556 6,031 4,545 2,984 1,778 596
Table 2.30Count of Private Non finance Companies in Continuous Time Series in a Panel beginning in a year:1989-90 to 2008-09
Panel Time-span of Panelbeginning in 3 years 5 years 7 years 10 years 15 years 20 years1989-90 1,536 1,312 1,144 930 734 6051990-91 1,942 1,655 1,402 1,173 928 3871991-92 2,171 1,830 1,520 1,282 1,008 11992-93 2,667 2,143 1,818 1,504 1,1941993-94 3,401 2,642 2,275 1,883 1,5381994-95 3,947 3,161 2,685 2,237 1,7661995-96 3,938 3,264 2,826 2,375 6511996-97 4,047 3,351 2,919 2,468 11997-98 4,437 3,706 3,205 2,6991998-99 4,936 4,198 3,574 2,9571999-00 5,285 4,416 3,751 2,9622000-01 5,559 4,535 3,906 8662001-02 5,866 4,833 4,125 12002-03 7,202 5,870 4,5362003-04 7,794 6,199 1,0732004-05 8,236 6,014 12005-06 8,247 1,2632006-07 7,536 12007-08 1,5312008-09 1
Prowess Centre for Monitoring Indian Economy
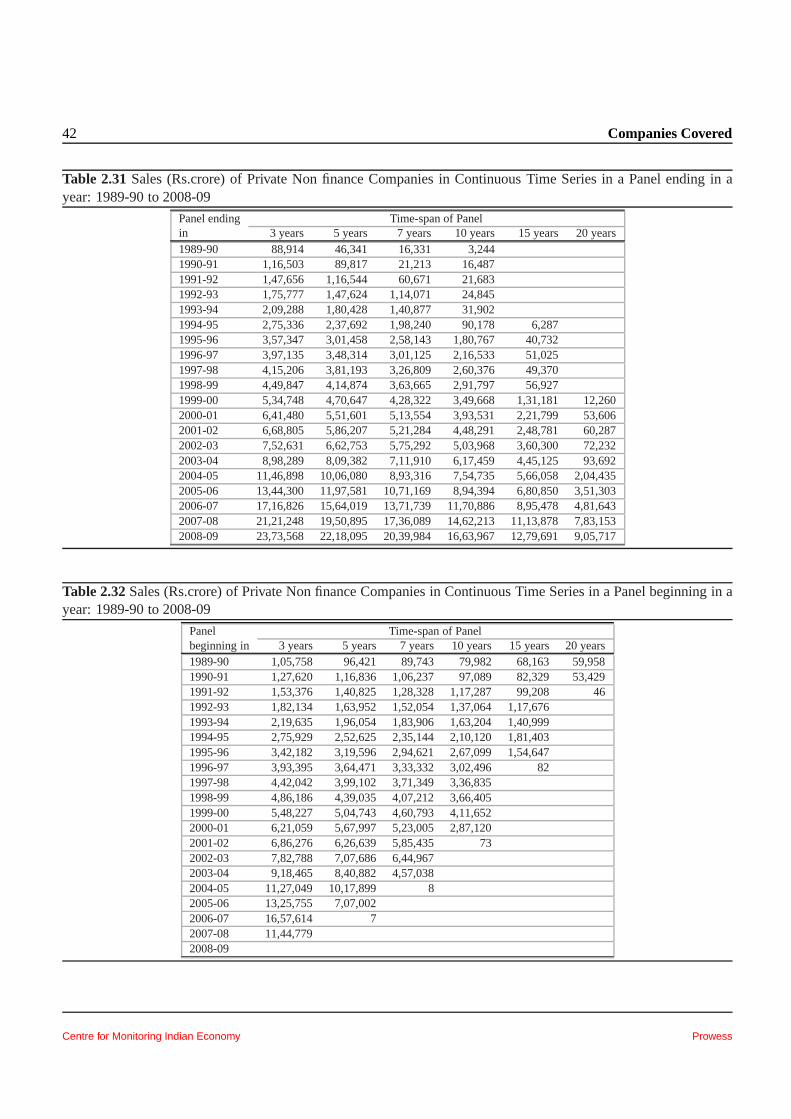
42 Companies Covered
Table 2.31Sales (Rs.crore) of Private Non finance Companies in Continuous Time Series in a Panel ending in ayear: 1989-90 to 2008-09
Panel ending Time-span of Panelin 3 years 5 years 7 years 10 years 15 years 20 years1989-90 88,914 46,341 16,331 3,2441990-91 1,16,503 89,817 21,213 16,4871991-92 1,47,656 1,16,544 60,671 21,6831992-93 1,75,777 1,47,624 1,14,071 24,8451993-94 2,09,288 1,80,428 1,40,877 31,9021994-95 2,75,336 2,37,692 1,98,240 90,178 6,2871995-96 3,57,347 3,01,458 2,58,143 1,80,767 40,7321996-97 3,97,135 3,48,314 3,01,125 2,16,533 51,0251997-98 4,15,206 3,81,193 3,26,809 2,60,376 49,3701998-99 4,49,847 4,14,874 3,63,665 2,91,797 56,9271999-00 5,34,748 4,70,647 4,28,322 3,49,668 1,31,181 12,2602000-01 6,41,480 5,51,601 5,13,554 3,93,531 2,21,799 53,6062001-02 6,68,805 5,86,207 5,21,284 4,48,291 2,48,781 60,2872002-03 7,52,631 6,62,753 5,75,292 5,03,968 3,60,300 72,2322003-04 8,98,289 8,09,382 7,11,910 6,17,459 4,45,125 93,6922004-05 11,46,898 10,06,080 8,93,316 7,54,735 5,66,058 2,04,4352005-06 13,44,300 11,97,581 10,71,169 8,94,394 6,80,850 3,51,3032006-07 17,16,826 15,64,019 13,71,739 11,70,886 8,95,4784,81,6432007-08 21,21,248 19,50,895 17,36,089 14,62,213 11,13,878 7,83,1532008-09 23,73,568 22,18,095 20,39,984 16,63,967 12,79,691 9,05,717
Table 2.32Sales (Rs.crore) of Private Non finance Companies in Continuous Time Series in a Panel beginning in ayear: 1989-90 to 2008-09
Panel Time-span of Panelbeginning in 3 years 5 years 7 years 10 years 15 years 20 years1989-90 1,05,758 96,421 89,743 79,982 68,163 59,9581990-91 1,27,620 1,16,836 1,06,237 97,089 82,329 53,4291991-92 1,53,376 1,40,825 1,28,328 1,17,287 99,208 461992-93 1,82,134 1,63,952 1,52,054 1,37,064 1,17,6761993-94 2,19,635 1,96,054 1,83,906 1,63,204 1,40,9991994-95 2,75,929 2,52,625 2,35,144 2,10,120 1,81,4031995-96 3,42,182 3,19,596 2,94,621 2,67,099 1,54,6471996-97 3,93,395 3,64,471 3,33,332 3,02,496 821997-98 4,42,042 3,99,102 3,71,349 3,36,8351998-99 4,86,186 4,39,035 4,07,212 3,66,4051999-00 5,48,227 5,04,743 4,60,793 4,11,6522000-01 6,21,059 5,67,997 5,23,005 2,87,1202001-02 6,86,276 6,26,639 5,85,435 732002-03 7,82,788 7,07,686 6,44,9672003-04 9,18,465 8,40,882 4,57,0382004-05 11,27,049 10,17,899 82005-06 13,25,755 7,07,0022006-07 16,57,614 72007-08 11,44,7792008-09
Centre for Monitoring Indian Economy Prowess
Companies Covered 43
2.7 Coverage based on quarterly financial statements
Quarterly financial statements are published by listedcompanies. Their publication is a regulatory require-ment since 1998. Prior to 1998, listed companies wererequired to publish six-monthly financial statements.
Quarterly (and earlier six-monthly) financial statementsare limited to the profit and loss statement and eventhese are quite abridged compared to the amount of in-formation available in the Annual Report. Publicationof the balance sheet was not mandatory till 2010.
Interim financial statements are available for about4,500 companies. The number has declined since 2005-06 when such data was available for about 5,000 com-panies. During 2002-03, 2003-04 and 2004-05, the av-erage number of companies releasing their quarterly fi-nancial statements was well over 5,000.
There has been a decline in the number financial com-panies releasing their quarterly financial statementssince March 2006. From an average of over 1,300 com-panies per quarter, the number of companies releasingquarterly financial statements has fallen to close to justa thousand.
There has been a smaller decline in the number of man-ufacturing companies releasing their quarterly financialstatements in the same period.
This fall of about ten per cent in the number of com-panies releasing their quarterly financial statementsnotwithstanding, listed companies are a lot more regu-lar in releasing data. The financial statements are avail-able within six weeks of the end of the quarter. In thepast they were required to be released within a monthof the close of the quarter. However, after the additionof the balance sheet in the disclosures from 2010, thistime-limit has been extended to six weeks.
Quarterly financial statements are available for morecompanies than companies that are traded on thebourses. About five thousand companies release theirfinancial statements every quarter. However, only aboutfour thousand companies get traded. Disclosure of fi-nancial statements is mandatory, liquidity is not.
A fairly large proportion of the companies that aretraded, trade very thinly. Thus while nearly five thou-sand companies provide quarterly financial statements,less than three thousand trade reasonably frequently tobe included in the COSPI.
The regularity, the faster frequency and the timelinessof the quarterly financial statements information makesit a favourite amongst users.
Regulations require that listed companies also releasetheir segment-wise performance along with the basic fi-nancial statements.
Prowess Centre for Monitoring Indian Economy
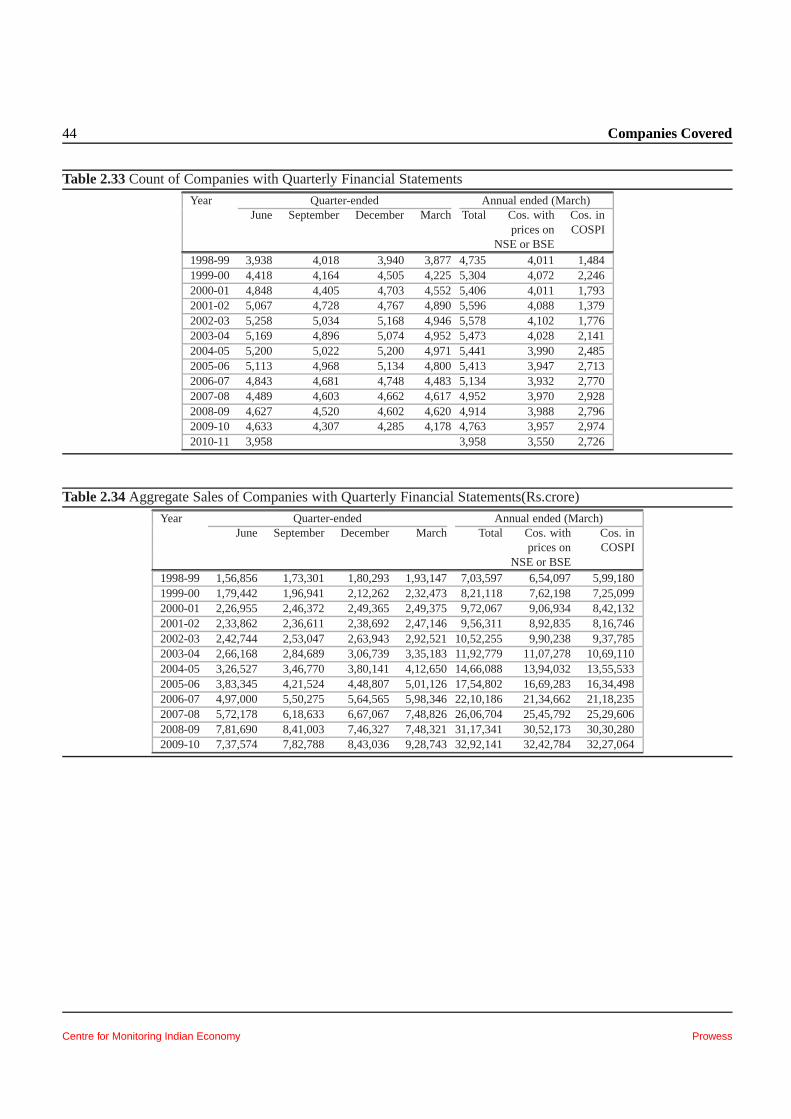
44 Companies Covered
Table 2.33Count of Companies with Quarterly Financial Statements
Year Quarter-ended Annual ended (March)June September December March Total Cos. with Cos. in
prices on COSPINSE or BSE
1998-99 3,938 4,018 3,940 3,877 4,735 4,011 1,4841999-00 4,418 4,164 4,505 4,225 5,304 4,072 2,2462000-01 4,848 4,405 4,703 4,552 5,406 4,011 1,7932001-02 5,067 4,728 4,767 4,890 5,596 4,088 1,3792002-03 5,258 5,034 5,168 4,946 5,578 4,102 1,7762003-04 5,169 4,896 5,074 4,952 5,473 4,028 2,1412004-05 5,200 5,022 5,200 4,971 5,441 3,990 2,4852005-06 5,113 4,968 5,134 4,800 5,413 3,947 2,7132006-07 4,843 4,681 4,748 4,483 5,134 3,932 2,7702007-08 4,489 4,603 4,662 4,617 4,952 3,970 2,9282008-09 4,627 4,520 4,602 4,620 4,914 3,988 2,7962009-10 4,633 4,307 4,285 4,178 4,763 3,957 2,9742010-11 3,958 3,958 3,550 2,726
Table 2.34Aggregate Sales of Companies with Quarterly Financial Statements(Rs.crore)
Year Quarter-ended Annual ended (March)June September December March Total Cos. with Cos. in
prices on COSPINSE or BSE
1998-99 1,56,856 1,73,301 1,80,293 1,93,147 7,03,597 6,54,097 5,99,1801999-00 1,79,442 1,96,941 2,12,262 2,32,473 8,21,118 7,62,198 7,25,0992000-01 2,26,955 2,46,372 2,49,365 2,49,375 9,72,067 9,06,934 8,42,1322001-02 2,33,862 2,36,611 2,38,692 2,47,146 9,56,311 8,92,835 8,16,7462002-03 2,42,744 2,53,047 2,63,943 2,92,521 10,52,255 9,90,238 9,37,7852003-04 2,66,168 2,84,689 3,06,739 3,35,183 11,92,779 11,07,278 10,69,1102004-05 3,26,527 3,46,770 3,80,141 4,12,650 14,66,088 13,94,032 13,55,5332005-06 3,83,345 4,21,524 4,48,807 5,01,126 17,54,802 16,69,283 16,34,4982006-07 4,97,000 5,50,275 5,64,565 5,98,346 22,10,186 21,34,662 21,18,2352007-08 5,72,178 6,18,633 6,67,067 7,48,826 26,06,704 25,45,792 25,29,6062008-09 7,81,690 8,41,003 7,46,327 7,48,321 31,17,341 30,52,173 30,30,2802009-10 7,37,574 7,82,788 8,43,036 9,28,743 32,92,141 32,42,784 32,27,064
Centre for Monitoring Indian Economy Prowess
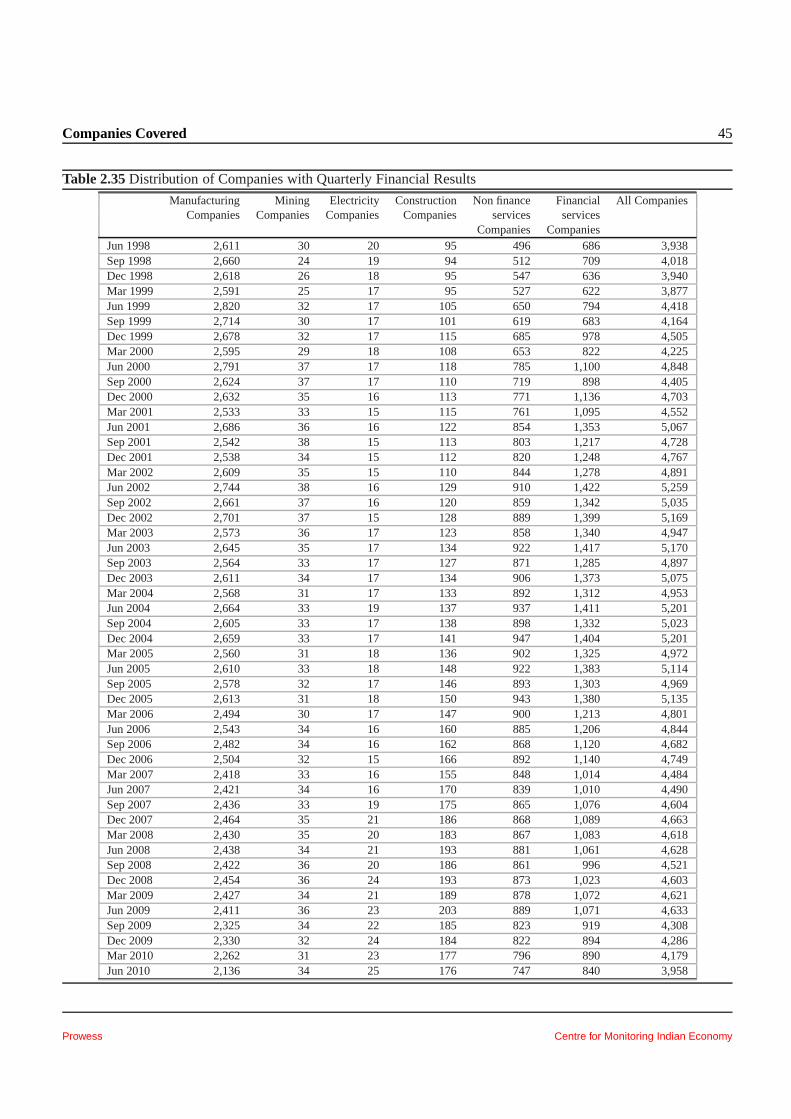
Companies Covered 45
Table 2.35Distribution of Companies with Quarterly Financial Results
Manufacturing Mining Electricity Construction Non finance Financial All CompaniesCompanies Companies Companies Companies services services
Companies CompaniesJun 1998 2,611 30 20 95 496 686 3,938Sep 1998 2,660 24 19 94 512 709 4,018Dec 1998 2,618 26 18 95 547 636 3,940Mar 1999 2,591 25 17 95 527 622 3,877Jun 1999 2,820 32 17 105 650 794 4,418Sep 1999 2,714 30 17 101 619 683 4,164Dec 1999 2,678 32 17 115 685 978 4,505Mar 2000 2,595 29 18 108 653 822 4,225Jun 2000 2,791 37 17 118 785 1,100 4,848Sep 2000 2,624 37 17 110 719 898 4,405Dec 2000 2,632 35 16 113 771 1,136 4,703Mar 2001 2,533 33 15 115 761 1,095 4,552Jun 2001 2,686 36 16 122 854 1,353 5,067Sep 2001 2,542 38 15 113 803 1,217 4,728Dec 2001 2,538 34 15 112 820 1,248 4,767Mar 2002 2,609 35 15 110 844 1,278 4,891Jun 2002 2,744 38 16 129 910 1,422 5,259Sep 2002 2,661 37 16 120 859 1,342 5,035Dec 2002 2,701 37 15 128 889 1,399 5,169Mar 2003 2,573 36 17 123 858 1,340 4,947Jun 2003 2,645 35 17 134 922 1,417 5,170Sep 2003 2,564 33 17 127 871 1,285 4,897Dec 2003 2,611 34 17 134 906 1,373 5,075Mar 2004 2,568 31 17 133 892 1,312 4,953Jun 2004 2,664 33 19 137 937 1,411 5,201Sep 2004 2,605 33 17 138 898 1,332 5,023Dec 2004 2,659 33 17 141 947 1,404 5,201Mar 2005 2,560 31 18 136 902 1,325 4,972Jun 2005 2,610 33 18 148 922 1,383 5,114Sep 2005 2,578 32 17 146 893 1,303 4,969Dec 2005 2,613 31 18 150 943 1,380 5,135Mar 2006 2,494 30 17 147 900 1,213 4,801Jun 2006 2,543 34 16 160 885 1,206 4,844Sep 2006 2,482 34 16 162 868 1,120 4,682Dec 2006 2,504 32 15 166 892 1,140 4,749Mar 2007 2,418 33 16 155 848 1,014 4,484Jun 2007 2,421 34 16 170 839 1,010 4,490Sep 2007 2,436 33 19 175 865 1,076 4,604Dec 2007 2,464 35 21 186 868 1,089 4,663Mar 2008 2,430 35 20 183 867 1,083 4,618Jun 2008 2,438 34 21 193 881 1,061 4,628Sep 2008 2,422 36 20 186 861 996 4,521Dec 2008 2,454 36 24 193 873 1,023 4,603Mar 2009 2,427 34 21 189 878 1,072 4,621Jun 2009 2,411 36 23 203 889 1,071 4,633Sep 2009 2,325 34 22 185 823 919 4,308Dec 2009 2,330 32 24 184 822 894 4,286Mar 2010 2,262 31 23 177 796 890 4,179Jun 2010 2,136 34 25 176 747 840 3,958
Prowess Centre for Monitoring Indian Economy
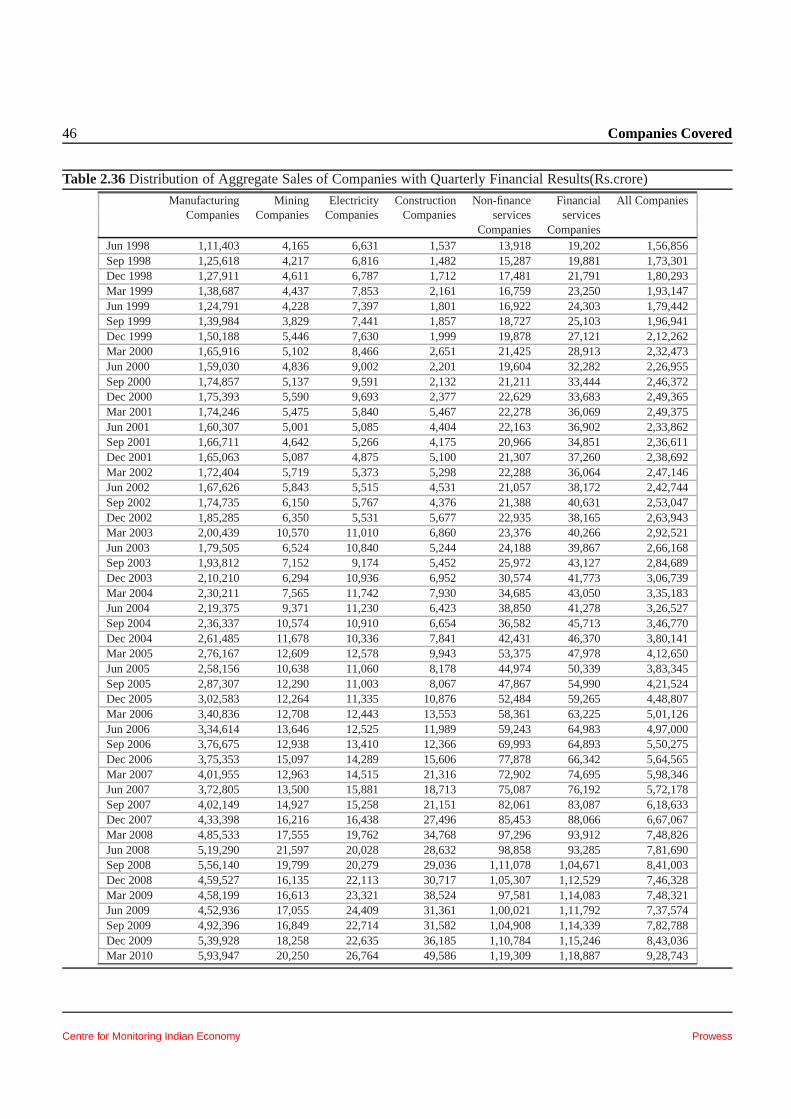
46 Companies Covered
Table 2.36Distribution of Aggregate Sales of Companies with Quarterly Financial Results(Rs.crore)
Manufacturing Mining Electricity Construction Non-finance Financial All CompaniesCompanies Companies Companies Companies services services
Companies CompaniesJun 1998 1,11,403 4,165 6,631 1,537 13,918 19,202 1,56,856Sep 1998 1,25,618 4,217 6,816 1,482 15,287 19,881 1,73,301Dec 1998 1,27,911 4,611 6,787 1,712 17,481 21,791 1,80,293Mar 1999 1,38,687 4,437 7,853 2,161 16,759 23,250 1,93,147Jun 1999 1,24,791 4,228 7,397 1,801 16,922 24,303 1,79,442Sep 1999 1,39,984 3,829 7,441 1,857 18,727 25,103 1,96,941Dec 1999 1,50,188 5,446 7,630 1,999 19,878 27,121 2,12,262Mar 2000 1,65,916 5,102 8,466 2,651 21,425 28,913 2,32,473Jun 2000 1,59,030 4,836 9,002 2,201 19,604 32,282 2,26,955Sep 2000 1,74,857 5,137 9,591 2,132 21,211 33,444 2,46,372Dec 2000 1,75,393 5,590 9,693 2,377 22,629 33,683 2,49,365Mar 2001 1,74,246 5,475 5,840 5,467 22,278 36,069 2,49,375Jun 2001 1,60,307 5,001 5,085 4,404 22,163 36,902 2,33,862Sep 2001 1,66,711 4,642 5,266 4,175 20,966 34,851 2,36,611Dec 2001 1,65,063 5,087 4,875 5,100 21,307 37,260 2,38,692Mar 2002 1,72,404 5,719 5,373 5,298 22,288 36,064 2,47,146Jun 2002 1,67,626 5,843 5,515 4,531 21,057 38,172 2,42,744Sep 2002 1,74,735 6,150 5,767 4,376 21,388 40,631 2,53,047Dec 2002 1,85,285 6,350 5,531 5,677 22,935 38,165 2,63,943Mar 2003 2,00,439 10,570 11,010 6,860 23,376 40,266 2,92,521Jun 2003 1,79,505 6,524 10,840 5,244 24,188 39,867 2,66,168Sep 2003 1,93,812 7,152 9,174 5,452 25,972 43,127 2,84,689Dec 2003 2,10,210 6,294 10,936 6,952 30,574 41,773 3,06,739Mar 2004 2,30,211 7,565 11,742 7,930 34,685 43,050 3,35,183Jun 2004 2,19,375 9,371 11,230 6,423 38,850 41,278 3,26,527Sep 2004 2,36,337 10,574 10,910 6,654 36,582 45,713 3,46,770Dec 2004 2,61,485 11,678 10,336 7,841 42,431 46,370 3,80,141Mar 2005 2,76,167 12,609 12,578 9,943 53,375 47,978 4,12,650Jun 2005 2,58,156 10,638 11,060 8,178 44,974 50,339 3,83,345Sep 2005 2,87,307 12,290 11,003 8,067 47,867 54,990 4,21,524Dec 2005 3,02,583 12,264 11,335 10,876 52,484 59,265 4,48,807Mar 2006 3,40,836 12,708 12,443 13,553 58,361 63,225 5,01,126Jun 2006 3,34,614 13,646 12,525 11,989 59,243 64,983 4,97,000Sep 2006 3,76,675 12,938 13,410 12,366 69,993 64,893 5,50,275Dec 2006 3,75,353 15,097 14,289 15,606 77,878 66,342 5,64,565Mar 2007 4,01,955 12,963 14,515 21,316 72,902 74,695 5,98,346Jun 2007 3,72,805 13,500 15,881 18,713 75,087 76,192 5,72,178Sep 2007 4,02,149 14,927 15,258 21,151 82,061 83,087 6,18,633Dec 2007 4,33,398 16,216 16,438 27,496 85,453 88,066 6,67,067Mar 2008 4,85,533 17,555 19,762 34,768 97,296 93,912 7,48,826Jun 2008 5,19,290 21,597 20,028 28,632 98,858 93,285 7,81,690Sep 2008 5,56,140 19,799 20,279 29,036 1,11,078 1,04,671 8,41,003Dec 2008 4,59,527 16,135 22,113 30,717 1,05,307 1,12,529 7,46,328Mar 2009 4,58,199 16,613 23,321 38,524 97,581 1,14,083 7,48,321Jun 2009 4,52,936 17,055 24,409 31,361 1,00,021 1,11,792 7,37,574Sep 2009 4,92,396 16,849 22,714 31,582 1,04,908 1,14,339 7,82,788Dec 2009 5,39,928 18,258 22,635 36,185 1,10,784 1,15,246 8,43,036Mar 2010 5,93,947 20,250 26,764 49,586 1,19,309 1,18,887 9,28,743
Centre for Monitoring Indian Economy Prowess
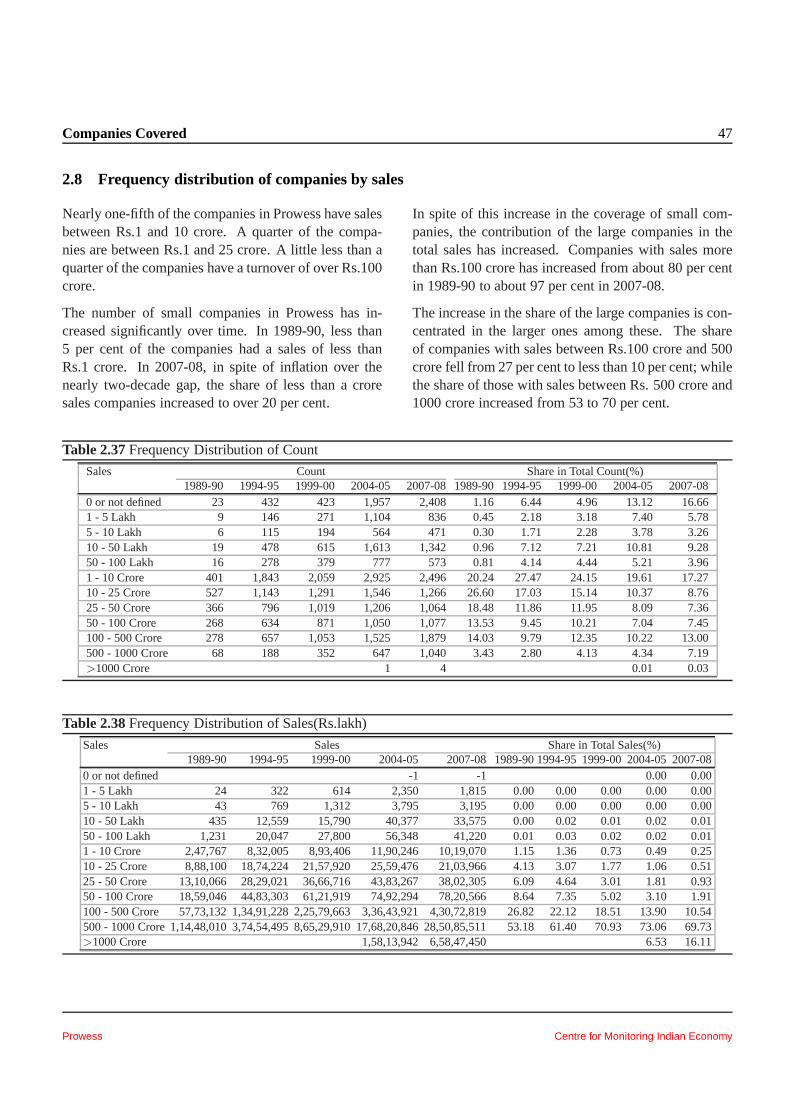
Companies Covered 47
2.8 Frequency distribution of companies by sales
Nearly one-fifth of the companies in Prowess have salesbetween Rs.1 and 10 crore. A quarter of the compa-nies are between Rs.1 and 25 crore. A little less than aquarter of the companies have a turnover of over Rs.100crore.
The number of small companies in Prowess has in-creased significantly over time. In 1989-90, less than5 per cent of the companies had a sales of less thanRs.1 crore. In 2007-08, in spite of inflation over thenearly two-decade gap, the share of less than a croresales companies increased to over 20 per cent.
In spite of this increase in the coverage of small com-panies, the contribution of the large companies in thetotal sales has increased. Companies with sales morethan Rs.100 crore has increased from about 80 per centin 1989-90 to about 97 per cent in 2007-08.
The increase in the share of the large companies is con-centrated in the larger ones among these. The shareof companies with sales between Rs.100 crore and 500crore fell from 27 per cent to less than 10 per cent; whilethe share of those with sales between Rs. 500 crore and1000 crore increased from 53 to 70 per cent.
Table 2.37Frequency Distribution of Count
Sales Count Share in Total Count(%)1989-90 1994-95 1999-00 2004-05 2007-08 1989-90 1994-95 1999-00 2004-05 2007-08
0 or not defined 23 432 423 1,957 2,408 1.16 6.44 4.96 13.12 16.661 - 5 Lakh 9 146 271 1,104 836 0.45 2.18 3.18 7.40 5.785 - 10 Lakh 6 115 194 564 471 0.30 1.71 2.28 3.78 3.2610 - 50 Lakh 19 478 615 1,613 1,342 0.96 7.12 7.21 10.81 9.2850 - 100 Lakh 16 278 379 777 573 0.81 4.14 4.44 5.21 3.961 - 10 Crore 401 1,843 2,059 2,925 2,496 20.24 27.47 24.15 19.61 17.2710 - 25 Crore 527 1,143 1,291 1,546 1,266 26.60 17.03 15.14 10.37 8.7625 - 50 Crore 366 796 1,019 1,206 1,064 18.48 11.86 11.95 8.09 7.3650 - 100 Crore 268 634 871 1,050 1,077 13.53 9.45 10.21 7.04 7.45100 - 500 Crore 278 657 1,053 1,525 1,879 14.03 9.79 12.35 10.22 13.00500 - 1000 Crore 68 188 352 647 1,040 3.43 2.80 4.13 4.34 7.19>1000 Crore 1 4 0.01 0.03
Table 2.38Frequency Distribution of Sales(Rs.lakh)
Sales Sales Share in Total Sales(%)1989-90 1994-95 1999-00 2004-05 2007-08 1989-90 1994-95 1999-00 2004-05 2007-08
0 or not defined -1 -1 0.00 0.001 - 5 Lakh 24 322 614 2,350 1,815 0.00 0.00 0.00 0.00 0.005 - 10 Lakh 43 769 1,312 3,795 3,195 0.00 0.00 0.00 0.00 0.0010 - 50 Lakh 435 12,559 15,790 40,377 33,575 0.00 0.02 0.01 0.02 0.0150 - 100 Lakh 1,231 20,047 27,800 56,348 41,220 0.01 0.03 0.020.02 0.011 - 10 Crore 2,47,767 8,32,005 8,93,406 11,90,246 10,19,0701.15 1.36 0.73 0.49 0.2510 - 25 Crore 8,88,100 18,74,224 21,57,920 25,59,476 21,03,966 4.13 3.07 1.77 1.06 0.5125 - 50 Crore 13,10,066 28,29,021 36,66,716 43,83,267 38,02,305 6.09 4.64 3.01 1.81 0.9350 - 100 Crore 18,59,046 44,83,303 61,21,919 74,92,294 78,20,566 8.64 7.35 5.02 3.10 1.91100 - 500 Crore 57,73,132 1,34,91,228 2,25,79,663 3,36,43,921 4,30,72,819 26.82 22.12 18.51 13.90 10.54500 - 1000 Crore 1,14,48,010 3,74,54,495 8,65,29,910 17,68,20,846 28,50,85,511 53.18 61.40 70.93 73.06 69.73>1000 Crore 1,58,13,942 6,58,47,450 6.53 16.11
Prowess Centre for Monitoring Indian Economy

48
Centre for Monitoring Indian Economy Prowess
49
Chapter 3
Contents per Company
Contents3.1 Sources of data in Prowess . . . . . . . . . . . . . . . . . . . . . . . . . .. . . . . . . . . . . . . . . . . . 50
3.1.1 Content sourced from Annual Reports . . . . . . . . . . . . . . .. . . . . . . . . . . . . 51
3.1.2 Content sourced from Stock Exchanges . . . . . . . . . . . . . .. . . . . . . . . . . . . 52
3.1.3 Content from other sources . . . . . . . . . . . . . . . . . . . . . . .. . . . . . . . . . . 533.2 Organisation of the Prowess database . . . . . . . . . . . . . . . .. . . . . . . . . . . . . . . . . . . . . . 54
3.2.1 Organisation of the Prowess database: Groups and Tables . . . . . . . . . . . . . . . . . 56
3.2.2 Introducing the Identity & Background database . . . . .. . . . . . . . . . . . . . . . . 60
3.2.3 Identity and Names . . . . . . . . . . . . . . . . . . . . . . . . . . . . . .. . . . . . . . 61
3.2.4 Introducing the Ownership & Governance database . . . .. . . . . . . . . . . . . . . . . 62
3.2.5 Introducing the Financial Statements database . . . . .. . . . . . . . . . . . . . . . . . . 64
3.2.6 Introducing the Share Prices & Capital History database . . . . . . . . . . . . . . . . . . 66
3.2.7 Introducing Business Segments & Products database . .. . . . . . . . . . . . . . . . . . 68
3.2.8 Introducing the CapEx and M&A databases . . . . . . . . . . . .. . . . . . . . . . . . . 703.3 What is Normalisation? . . . . . . . . . . . . . . . . . . . . . . . . . . . .. . . . . . . . . . . . . . . . . 71
3.3.1 The five essentials of normalisation . . . . . . . . . . . . . . .. . . . . . . . . . . . . . 73
3.3.2 Normalisation of the Identity & Background database .. . . . . . . . . . . . . . . . . . . 75
3.3.3 Normalisation of the Ownership & Governance database. . . . . . . . . . . . . . . . . . 76
3.3.4 Normalisation of the Financial Statements database .. . . . . . . . . . . . . . . . . . . . 77
3.3.5 Normalisation of the Share Prices & Capital History database . . . . . . . . . . . . . . . 79
3.3.6 Normalisation of the Business Segments & Products database . . . . . . . . . . . . . . . 80
3.3.7 Normalisation and its discontents . . . . . . . . . . . . . . . .. . . . . . . . . . . . . . 813.4 CMIE classifications of companies . . . . . . . . . . . . . . . . . . .. . . . . . . . . . . . . . . . . . . . 82
Prowess Centre for Monitoring Indian Economy
50 Contents per Company
3.1 Sources of data in Prowess
There is no single source of the data contained inProwess. The Prowess database has been assembledfrom a number of sources. These provide data on com-panies for different purposes. They meet different dis-closure requirements and address different issues foreven different segments of consumers. The Annual Re-port is prepared largely in line with the requirements ofthe Companies Act and is addressed to the sharehold-ers of the company. Disclosures made by the Stock Ex-change are more in line with the Listing Agreement andare directed to the investing public at large, not merelythe shareholders.
The sources have been selected by CMIE keeping inmind the objective of the database, which is to provideinformation regarding the performance of a businessenterprise. Prowess is not a directory of companies.Therefore, its contents are not like that of a telephonedirectory or like the Yellow Pages. Prowess is also not arepository of documents pertaining to companies suchas the official site of the Ministry of Company Affairs.
Prowess is a database of the performance of a company.It is a database of the actions taken by the company andthe outcomes from its actions. The sources selected byCMIE reflect this objective.
CMIE makes choices regarding the companies coveredin Prowess (this is explained in detail elsewhere) andthen it makes choices regarding the inclusion of the typeof source being used and specifically a particular docu-ment from the source. There is a significant element ofchoice (which is clearly articulated) in the creation ofthe Prowess database.
The Annual Report prepared by the company is themost important source of information in Prowess. Foran Annual Report to be included in Prowess, it is neces-sary that it is reasonably complete and is available to uswithout any conditions on usage. Information releasedby the Stock Exchanges is an important source of in-
formation for listed companies. The Reserve Bank ofIndia, Securities and Exchange Board of India and thedepositories are other important standard sources of in-formation.
The official website of companies is not a uniformlyreliable source of information. The variation in termsof content and updatedness is very large. Most com-panies that have designed useful websites have done sofor their customers. Such sites are full of informationregarding the company’s products and services. But,their content on performance is often scanty. In somecases, the data on the websites is outdated. Thus, thewebsite is a useful but not entirely reliable source ofup-to-date information.
Reliable data sources have increased and they have im-proved in content and delivery over time. This re-flects on the Prowess database. The amount of infor-mation provided in the Annual Report has improveddramatically in recent years. Companies now providestandalone and consolidated financial statements. TheStock Exchanges have become a very important sourceon companies today. This was not the case till the mid1990s.
Regulations and guidelines regarding disclosures haveimproved. Clause 49 of the Listing Agreement for listedcompanies require companies to disclose a lot more to-day than they did earlier, i.e. before 2005. The Insti-tute of Chartered Accountants of India has increased thenumber of Accounting Standards and thereby increasedthe disclosures companies have to make in their AnnualReports. The Reserve Bank of India has done the samefor banking and non-banking finance companies.
Disclosures have improved in terms of quantity, qual-ity and frequency. This has yielded a rich databaseof a large number of companies operating in India.The Prowess database has evolved to incorporate thesechanges in disclosures.
Centre for Monitoring Indian Economy Prowess
Contents per Company 51
3.1.1 Content sourced from Annual Reports
The Annual Report of a company is the single most im-portant source of information on a company.
The Income and Expenditure Statement, the BalanceSheet and its Schedules form the main source of thefinancial information on the companies. Listed compa-nies are also required to publish their Cash Flow State-ment. And, companies that have subsidiaries or asso-ciate companies are required to publish the Consoli-dated financial statements in addition to the Standalonefinancial statements. Indian companies are required topublish, or make available upon request, the financialstatements of their subsidiaries as well.
An Annual Report is required to also contain a Direc-tors’ Report, an Auditors’ Report, Notes to Accountsand a Balance Sheet Abstract and Company’s GeneralBusiness Profile. Sometimes, it contains additional in-formation such as a Chairman’s Statement.
Prowess captures all the above-mentioned types of in-formation.
For information of an Annual Report to be included inProwess, it is necessary that the Report contains thecomplete financial statements of the Income and Ex-penditure Statement, the Balance Sheet and all Sched-ules pertaining to these two statements. If the AnnualReport copy available with CMIE does not contain seg-ments of information, Prowess may still include all theinformation relating to the financial statements. AnnualReports available for many small companies often haveonly the financial statements.
Sometimes, the Balance Sheet of a company is availablebut its Income and Expenditure Statement is not avail-able. Such an incomplete Annual Report is encoun-tered often in the case of private limited companies.Sometimes, the schedules to the Balance Sheet and theIncome and Expenditure Statements are not available.In such cases, the Annual Report is considered incom-plete, and it is not included in the Prowess database.
Listed companies are required to provide ManagementDiscussion and Analysis and a report on Corporate
Governance as a part of the Annual Report. Data avail-able in both these statements are included in Prowess.
The Prowess database endeavours to capture all the in-formation published by companies in their Annual Re-ports. It captures this information in a structured man-ner to enable easy access and mathematical exploitationof the data.
There are three elements of transformation of the datacaptured from the Annual Report as it is converted intoa database.
1. Data organisation.
The data are organised differently in the Prowessdatabase compared to the way they are presentedin the Annual Reports. In the Annual Report, thefinancial statements are presented first, at a sum-mary level and the details are shown separatelyin the schedules. Then, there are notes and foot-notes and then some additional statements as maybe required by the law.
In the Prowess database, there are no sum-mary statements, schedules, notes or footnotesalthough almost all the data available in theseare captured and are available in the Prowessdatabase.
2. Nomenclature.
Different companies use different terms for thesame financial statement term. For example, itis possible what one company calls as ”compen-sation to employees” another calls ”salaries andwages”. Prowess standardises the nomenclature.
3. Standardised classification
The Prowess database standardises the classifica-tion of the various pieces of information availablein Annual Reports. This brings about a degreeof uniformity in the information of all compa-nies. But, in the process, the presentation devi-ates from the exact presentation of the informa-tion in the Annual Report.
Prowess Centre for Monitoring Indian Economy
52 Contents per Company
3.1.2 Content sourced from Stock Exchanges
Listed companies constitute about 27 per cent of allcompanies in the Prowess database. These companiesare required to disclose a lot more information and alsoto provide information at a faster frequency than the un-listed companies.
The quarterly financial performance statements are themost important and most eagerly awaited informationon listed companies. Companies are required to makethese available to the Stock Exchanges on which theyare listed in India within a few hours of the conclusionof the meeting of the Board of Directors that approvedthe results. The Stock Exchange in return makes theresults available on its website. Listed companies arealso required to publish the financial statements in onenational and one local newspaper.
CMIE procures these quarterly financial statementsfrom the Stock Exchanges or the newspapers or fromthe official website of the company and makes the datacollated from them available in Prowess. CMIE doesnot rely exclusively on the Stock Exchanges for thisinformation. Often, a newspaper advertisement or thecompany’s official website provides more details onquarterly financial performance than the Exchanges.
The disclosure of quarterly financial statements bylisted companies began only in 1997. The indicators ofdisclosures are limited, and these have expanded overtime. Listed companies are required to publish onlythe abridged income and expenditure statement, thesegment-wise business and related party transactions,every quarter.
Many companies disclose more information than whatis mandatory. CMIE has studied the pattern of these dis-closures, made judgements about the consistency andutility of these additional indicators and accordinglyincluded them in the Prowess database. As a result,Prowess contains nearly 80 indicators for the interimincome and expenditure statements of listed companies.This is besides the capture of the segment-wise and re-lated party disclosures.
Companies are not required to publish their balancesheet data every quarter. Very few companies do pub-lish their balance sheet data as well. But, since theseare too few, Prowess does not carry these. However, asdisclosures improve, the interim balance sheet data willalso get incorporated into the Prowess database.
Prowess contains the prices of the listed equity shares ofcompanies provided by the two major stock exchangesof the country – the National Stock Exchange and theBombay Stock Exchange. The exchanges provided a lotof related information such as the dates since when theprices are traded ex-dividends or ex-bonus or ex-rights,etc. Such information is useful to understand part of thereason why prices may change from one day to another.Such data is available in Prowess.
Listed companies are required to provide to the StockExchanges, the structure of ownership of their equityshares and the ownership details of the top sharehold-ers. The Stock Exchange makes this information avail-able to the public on a quarterly basis. Such informationis also available in Prowess.
Companies disclose to the Stock Exchange a lot morethan mere quarterly financial statements and the equityownership details. It discloses the announcement ofboard meetings, annual general and extraordinary meet-ings, dividend declaration, mergers and acquisitions,details of equity transactions on the secondary marketby its directors and any other material event or trans-action. The Stock Exchange makes such informationavailable to the public. And, CMIE makes these an-nouncements available in Prowess.
The Stock Exchange itself generates a lot of informa-tion on listed companies. Besides the price of the equi-ties or bonds traded on the Exchange, this includes thevolume of transactions, opening, closing, high and lowprice of the day, etc. It also announces details of newcompanies being listed, or listed companies being sus-pended, de-listed, or specific securities being listed, etc.All of this is also available in Prowess.
Centre for Monitoring Indian Economy Prowess
Contents per Company 53
3.1.3 Content from other sources
The Annual Report and the Stock Exchanges are thetwo most important sources of information for theProwess database. We list below, the other sources ofinformation.
1. The company’s official website
Most companies, though not all, have an officialwebsite. Some of the companies that have an offi-cial website do provide a lot of useful informationsuch as their Annual Reports, quarterly financialstatements, transcripts of analysts meetings andmore. CMIE visits the sites of companies regu-larly to look out for useful information that maybe used in the creation of the Prowess database.Information on plants, expansions and transcriptsof analysts meets is sourced from the company’swebsite.
2. Regulators such as the SEBI and RBI
Unlike the Securities and Exchange Commissionof the USA, SEBI is not a very useful sourceto get data on listed companies. SEBI had ini-tiated the EDIFAR project to disseminate data.However, this was abandoned after a short while.Nevertheless, the SEBI website provides infor-mation on any action that it may initiate against alisted company. Such information is captured byCMIE and is ploughed into the Prowess database.RBI provides very little information on individ-ual companies. The most useful informationsourced from the RBI is the approvals it grantsfor companies raising capital overseas.
3. Ministry of Company Affairs
The Ministry of Company Affairs providescopies of the Annual Reports of companies onits website. Usually, these are available with alarge lag between the public availability of suchreports and their availability from the Ministry.Yet, this is a useful source for reports that are noteasily available from any other source. The Min-istry is also the source of the registration number,official name and some more basic identificationinformation on a number of unlisted companies.
4. Rating agencies
Rating agencies provide information on the rat-ing they assign to securities issued by companies.CMIE uses this information in Prowess. CMIEalso normalises the various kinds of ratings as-signed by the different rating agencies to create auniform and comparable scale of the various rat-ing symbols.
5. Depositories such as the NSDL
The NSDL provides details of the debt securi-ties of business entities. It also provides the ISINcode. This information is used in Prowess.
6. Advertisements
Companies often place advertisements in thepopular media when it changes its name, changesits registered office or when it makes a public of-fering or when it announces a big new expansion,etc. CMIE tracks such advertisements (not themarketing advertisements) to capture useful in-formation for the Prowess database. Sometimesadvertisements are the source of creating the setof companies that belong to an ownership group.
7. News reports in the media
CMIE has its own news abstraction team thatscans the daily newspapers for relevant newson companies. These abstracts are available inProwess. Media news is a useful source for dataon investment plans, mergers and acquisitions ofunlisted companies and also for the general back-ground information on companies.
Evidently, the Prowess database is not sourced fromany one single source. It is the result of an aggre-gation and normalisation of information from multiplesources. The objective is to provide all possible pub-licly available information on business entities. The listpresented above therefore, may not be exhaustive. Newsources keep getting added as they emerge. However,we are careful to provide only those pieces of informa-tion that are reasonably reliable or official.
Prowess Centre for Monitoring Indian Economy
54 Contents per Company
3.2 Organisation of the Prowess database
The Prowess database can be visualised in terms of sixgroups of information.
1. Company Identity
Here we store the company’s name, its variousalternate names, its addresses, telephone and faxnumbers and website.Various classifications andcodes that are assigned to the company by CMIEand various other organisations such as the StockExchanges are also stored here and we describethe background of the company here.
2. Governance
Governance information is available mostly forlisted companies. This includes most impor-tantly, the pattern of ownership of the equity cap-ital of the company. This information is standard-ised by the regulator and it provides a reason-ably detailed break-up of the ownership of equitycapital between the promoter(s), institutional in-vestors and other investors including the public.It also provides the ownership of equity by themajor investors. Such information is available ona quarterly basis and is sourced from the StockExchanges.
Composition of the Board of Directors and thedates of their various meetings, names of sub-sidiaries, auditors and related party-transactionsare the other kinds of information related to Gov-ernance that are available in Prowess. Most ofthis is sourced from the Annual Reports of thecompanies.
3. Financial Statements
This is the largest part of the Prowess database. Itincludes data extracted from the Income and Ex-penditure Statement, the Balance Sheet and de-tails in their various Schedules, the Cash FlowStatement and contingent liabilities. It also in-cludes all disclosures made by banks and non-banking finance companies as per the guidelinesissued by the RBI. All this information is ex-tracted from the Annual Report of the company.
Besides the annual financial statements describedabove, Prowess also contains quarterly financialstatements released by listed companies. Thesestatements are brief compared to the annual fi-nancial statements sourced from the Annual Re-ports. This data is sourced from the Stock Ex-changes and the media advertisements made bythe companies.
Ratings information is sourced from the ratingagencies as and when such information is re-leased by these agencies.
4. Share Prices & Capital History
There are two kinds of information here – pricesof shares of listed companies and, the historyof changes in the equity capital of companies.These two are placed together because they areclosely linked. Changes in equity capital deter-mines the number of outstanding shares, whichwhen multiplied by the share price gives the mar-ket capitalisation of a company. The number ofoutstanding shares is similarly important in de-termining the earnings per share and the price ofa share divided by the earnings per share yieldsa useful ratio, the price-to-earnings ratio. Whilethe share prices are available from the stock ex-changes, the number of shares outstanding is de-rived by CMIE by a careful monitoring of theissuance of fresh capital (or buy-backs) by thecompanies.
Prowess contains share prices from NSE (sinceinception) and BSE since (1990). Disclosureshave improved in recent years and therefore thereis a shorter history of bulk and block deals on theExchanges, insider trades and options.
In this section we also have index values of themajor equity indices. This includes CMIE’s ownindices, the COSPI.
5. Business Segments & Products
Listed companies are required to provide finan-cial indicators in terms of their major business
Centre for Monitoring Indian Economy Prowess
Contents per Company 55
segments. There is no standardisation of whatis understood as a segment. This is left to thecompany’s discretion. All registered companiesare required by the Companies Act to disclose intheir Annual Report, the products manufacturedor traded in, and the raw materials consumedalong with quantitative data on production, sales,consumption, etc. Select energy-intensive indus-tries are also required to disclose the source ofenergy consumed and the energy intensity of theproducts manufactured.
While the segment-wise data is available withquarterly frequency, the rest of the data is avail-able annually. All of the above is provided in theProwess database.
6. Capex and M&A
Prowess includes all the major capital expendi-ture projects that a company announces. It alsoprovides details of the mergers and the acquisi-tion of assets by companies.
Prowess Centre for Monitoring Indian Economy
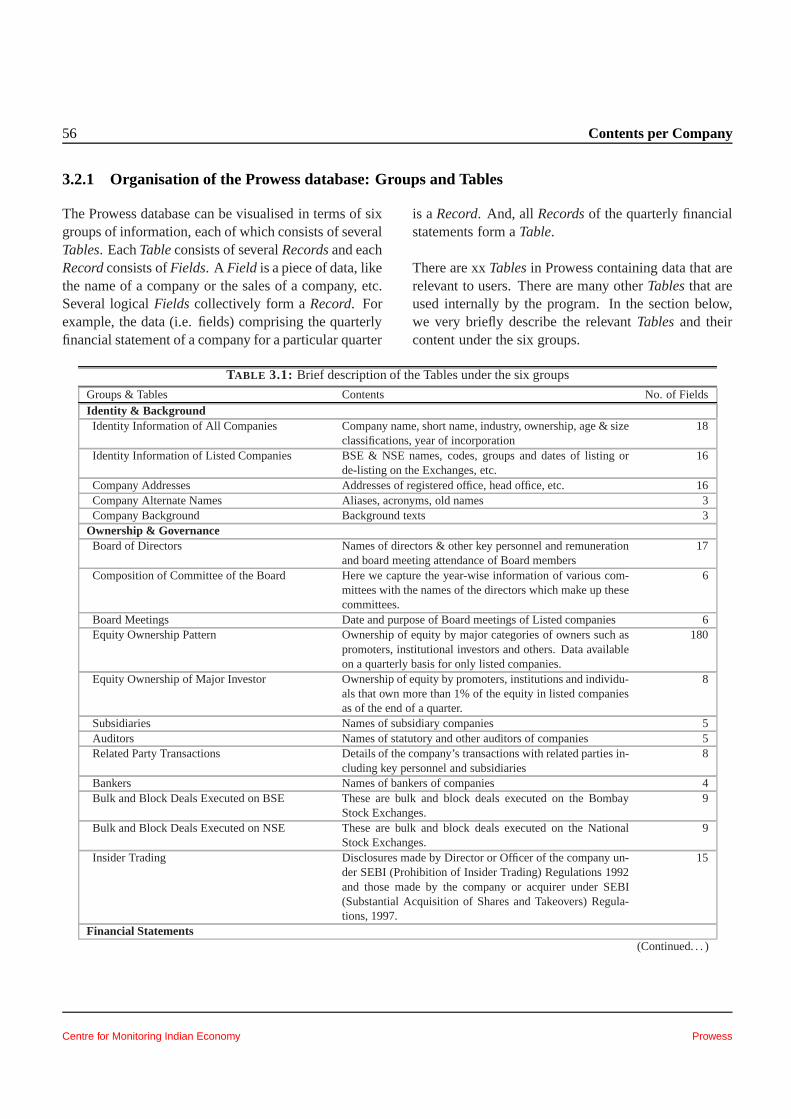
56 Contents per Company
3.2.1 Organisation of the Prowess database: Groups and Tables
The Prowess database can be visualised in terms of sixgroups of information, each of which consists of severalTables. EachTable consists of severalRecords and eachRecord consists ofFields. A Field is a piece of data, likethe name of a company or the sales of a company, etc.Several logicalFields collectively form aRecord. Forexample, the data (i.e. fields) comprising the quarterlyfinancial statement of a company for a particular quarter
is aRecord. And, all Records of the quarterly financialstatements form aTable.
There are xxTables in Prowess containing data that arerelevant to users. There are many otherTables that areused internally by the program. In the section below,we very briefly describe the relevantTables and theircontent under the six groups.
TABLE 3.1: Brief description of the Tables under the six groups
Groups & Tables Contents No. of FieldsIdentity & BackgroundIdentity Information of All Companies Company name, short name, industry, ownership, age & size
classifications, year of incorporation18
Identity Information of Listed Companies BSE & NSE names, codes, groups and dates of listing orde-listing on the Exchanges, etc.
16
Company Addresses Addresses of registered office, head office, etc. 16Company Alternate Names Aliases, acronyms, old names 3Company Background Background texts 3
Ownership & GovernanceBoard of Directors Names of directors & other key personnel and remuneration
and board meeting attendance of Board members17
Composition of Committee of the Board Here we capture the year-wise information of various com-mittees with the names of the directors which make up thesecommittees.
6
Board Meetings Date and purpose of Board meetings of Listed companies 6Equity Ownership Pattern Ownership of equity by major categories of owners such as
promoters, institutional investors and others. Data availableon a quarterly basis for only listed companies.
180
Equity Ownership of Major Investor Ownership of equity by promoters, institutions and individu-als that own more than 1% of the equity in listed companiesas of the end of a quarter.
8
Subsidiaries Names of subsidiary companies 5Auditors Names of statutory and other auditors of companies 5Related Party Transactions Details of the company’s transactions with related parties in-
cluding key personnel and subsidiaries8
Bankers Names of bankers of companies 4Bulk and Block Deals Executed on BSE These are bulk and block deals executed on the Bombay
Stock Exchanges.9
Bulk and Block Deals Executed on NSE These are bulk and block deals executed on the NationalStock Exchanges.
9
Insider Trading Disclosures made by Director or Officer of the company un-der SEBI (Prohibition of Insider Trading) Regulations 1992and those made by the company or acquirer under SEBI(Substantial Acquisition of Shares and Takeovers) Regula-tions, 1997.
15
Financial Statements(Continued. . . )
Centre for Monitoring Indian Economy Prowess
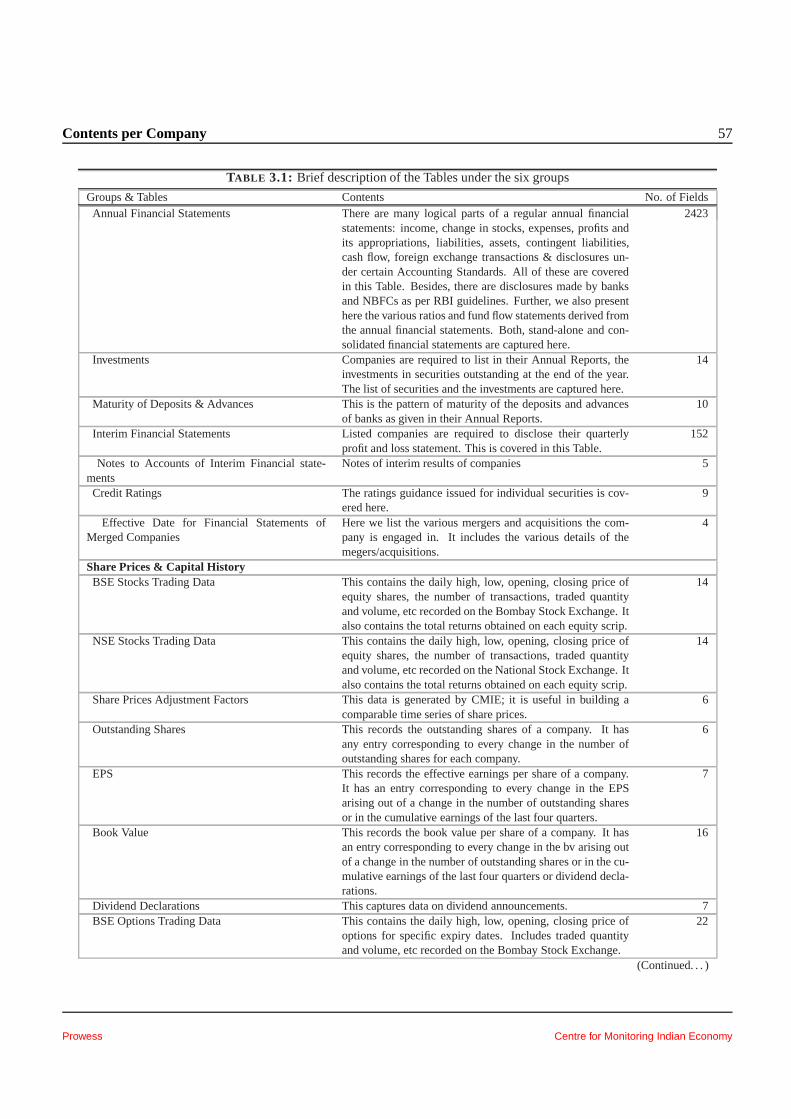
Contents per Company 57
TABLE 3.1: Brief description of the Tables under the six groups
Groups & Tables Contents No. of FieldsAnnual Financial Statements There are many logical parts ofa regular annual financial
statements: income, change in stocks, expenses, profits andits appropriations, liabilities, assets, contingent liabilities,cash flow, foreign exchange transactions & disclosures un-der certain Accounting Standards. All of these are coveredin this Table. Besides, there are disclosures made by banksand NBFCs as per RBI guidelines. Further, we also presenthere the various ratios and fund flow statements derived fromthe annual financial statements. Both, stand-alone and con-solidated financial statements are captured here.
2423
Investments Companies are required to list in their Annual Reports, theinvestments in securities outstanding at the end of the year.The list of securities and the investments are captured here.
14
Maturity of Deposits & Advances This is the pattern of maturity of the deposits and advancesof banks as given in their Annual Reports.
10
Interim Financial Statements Listed companies are required to disclose their quarterlyprofit and loss statement. This is covered in this Table.
152
Notes to Accounts of Interim Financial state-ments
Notes of interim results of companies 5
Credit Ratings The ratings guidance issued for individual securities is cov-ered here.
9
Effective Date for Financial Statements ofMerged Companies
Here we list the various mergers and acquisitions the com-pany is engaged in. It includes the various details of themegers/acquisitions.
4
Share Prices & Capital HistoryBSE Stocks Trading Data This contains the daily high, low, opening, closing price of
equity shares, the number of transactions, traded quantityand volume, etc recorded on the Bombay Stock Exchange. Italso contains the total returns obtained on each equity scrip.
14
NSE Stocks Trading Data This contains the daily high, low, opening, closing price ofequity shares, the number of transactions, traded quantityand volume, etc recorded on the National Stock Exchange. Italso contains the total returns obtained on each equity scrip.
14
Share Prices Adjustment Factors This data is generated by CMIE; it is useful in building acomparable time series of share prices.
6
Outstanding Shares This records the outstanding shares of acompany. It hasany entry corresponding to every change in the number ofoutstanding shares for each company.
6
EPS This records the effective earnings per share of a company.It has an entry corresponding to every change in the EPSarising out of a change in the number of outstanding sharesor in the cumulative earnings of the last four quarters.
7
Book Value This records the book value per share of a company.It hasan entry corresponding to every change in the bv arising outof a change in the number of outstanding shares or in the cu-mulative earnings of the last four quarters or dividend decla-rations.
16
Dividend Declarations This captures data on dividend announcements. 7BSE Options Trading Data This contains the daily high, low, opening, closing price of
options for specific expiry dates. Includes traded quantityand volume, etc recorded on the Bombay Stock Exchange.
22
(Continued. . . )
Prowess Centre for Monitoring Indian Economy
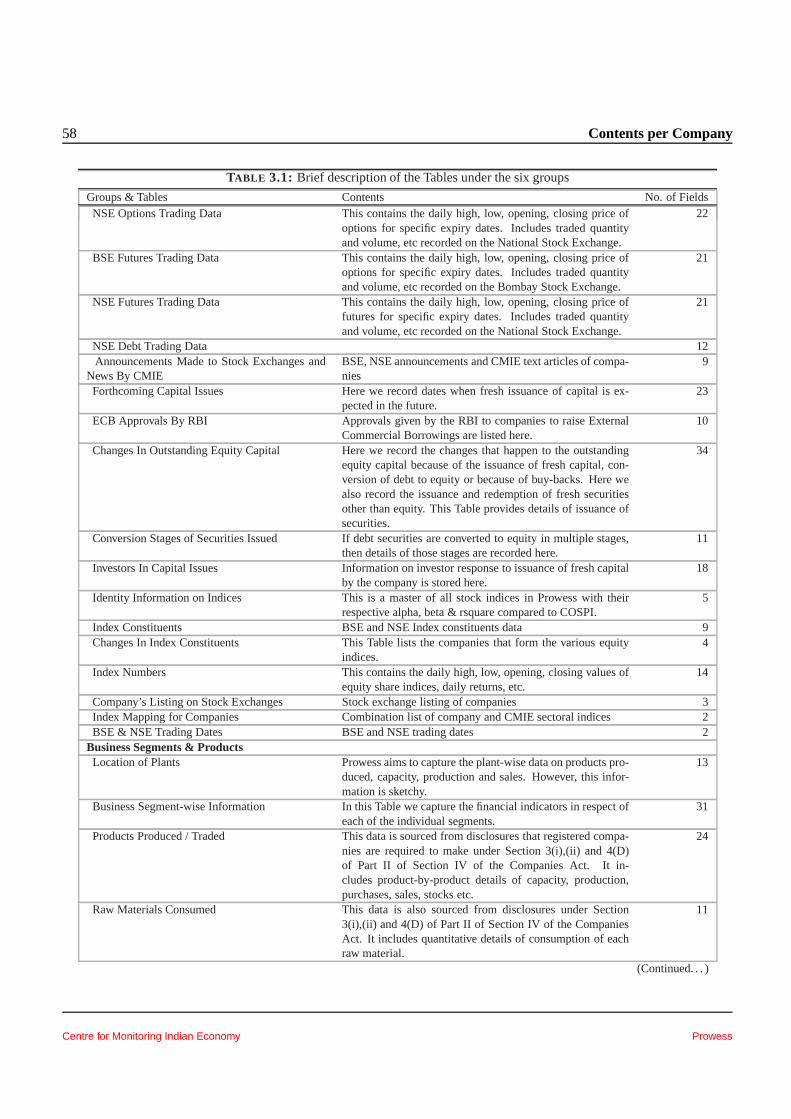
58 Contents per Company
TABLE 3.1: Brief description of the Tables under the six groups
Groups & Tables Contents No. of FieldsNSE Options Trading Data This contains the daily high, low, opening, closing price of
options for specific expiry dates. Includes traded quantityand volume, etc recorded on the National Stock Exchange.
22
BSE Futures Trading Data This contains the daily high, low, opening, closing price ofoptions for specific expiry dates. Includes traded quantityand volume, etc recorded on the Bombay Stock Exchange.
21
NSE Futures Trading Data This contains the daily high, low, opening, closing price offutures for specific expiry dates. Includes traded quantityand volume, etc recorded on the National Stock Exchange.
21
NSE Debt Trading Data 12Announcements Made to Stock Exchanges and
News By CMIEBSE, NSE announcements and CMIE text articles of compa-nies
9
Forthcoming Capital Issues Here we record dates when fresh issuance of capital is ex-pected in the future.
23
ECB Approvals By RBI Approvals given by the RBI to companies to raise ExternalCommercial Borrowings are listed here.
10
Changes In Outstanding Equity Capital Here we record the changes that happen to the outstandingequity capital because of the issuance of fresh capital, con-version of debt to equity or because of buy-backs. Here wealso record the issuance and redemption of fresh securitiesother than equity. This Table provides details of issuance ofsecurities.
34
Conversion Stages of Securities Issued If debt securities are converted to equity in multiple stages,then details of those stages are recorded here.
11
Investors In Capital Issues Information on investor response to issuance of fresh capitalby the company is stored here.
18
Identity Information on Indices This is a master of all stockindices in Prowess with theirrespective alpha, beta & rsquare compared to COSPI.
5
Index Constituents BSE and NSE Index constituents data 9Changes In Index Constituents This Table lists the companies that form the various equity
indices.4
Index Numbers This contains the daily high, low, opening, closing values ofequity share indices, daily returns, etc.
14
Company’s Listing on Stock Exchanges Stock exchange listing of companies 3Index Mapping for Companies Combination list of company andCMIE sectoral indices 2BSE & NSE Trading Dates BSE and NSE trading dates 2
Business Segments & ProductsLocation of Plants Prowess aims to capture the plant-wise data on products pro-
duced, capacity, production and sales. However, this infor-mation is sketchy.
13
Business Segment-wise Information In this Table we capturethe financial indicators in respect ofeach of the individual segments.
31
Products Produced / Traded This data is sourced from disclosures that registered compa-nies are required to make under Section 3(i),(ii) and 4(D)of Part II of Section IV of the Companies Act. It in-cludes product-by-product details of capacity, production,purchases, sales, stocks etc.
24
Raw Materials Consumed This data is also sourced from disclosures under Section3(i),(ii) and 4(D) of Part II of Section IV of the CompaniesAct. It includes quantitative details of consumption of eachraw material.
11
(Continued. . . )
Centre for Monitoring Indian Economy Prowess
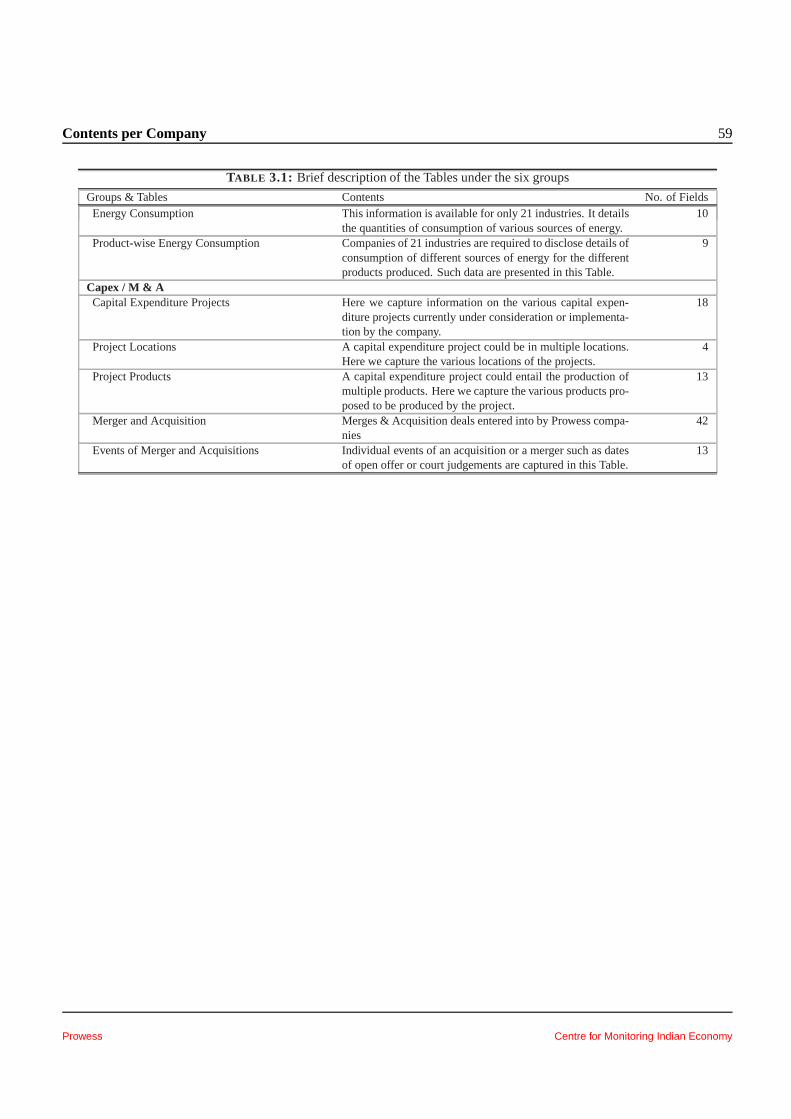
Contents per Company 59
TABLE 3.1: Brief description of the Tables under the six groups
Groups & Tables Contents No. of FieldsEnergy Consumption This information is available for only 21 industries. It details
the quantities of consumption of various sources of energy.10
Product-wise Energy Consumption Companies of 21 industries are required to disclose details ofconsumption of different sources of energy for the differentproducts produced. Such data are presented in this Table.
9
Capex / M & ACapital Expenditure Projects Here we capture information on the various capital expen-
diture projects currently under consideration or implementa-tion by the company.
18
Project Locations A capital expenditure project could be inmultiple locations.Here we capture the various locations of the projects.
4
Project Products A capital expenditure project could entail the production ofmultiple products. Here we capture the various products pro-posed to be produced by the project.
13
Merger and Acquisition Merges & Acquisition deals entered into by Prowess compa-nies
42
Events of Merger and Acquisitions Individual events of an acquisition or a merger such as datesof open offer or court judgements are captured in this Table.
13
Prowess Centre for Monitoring Indian Economy
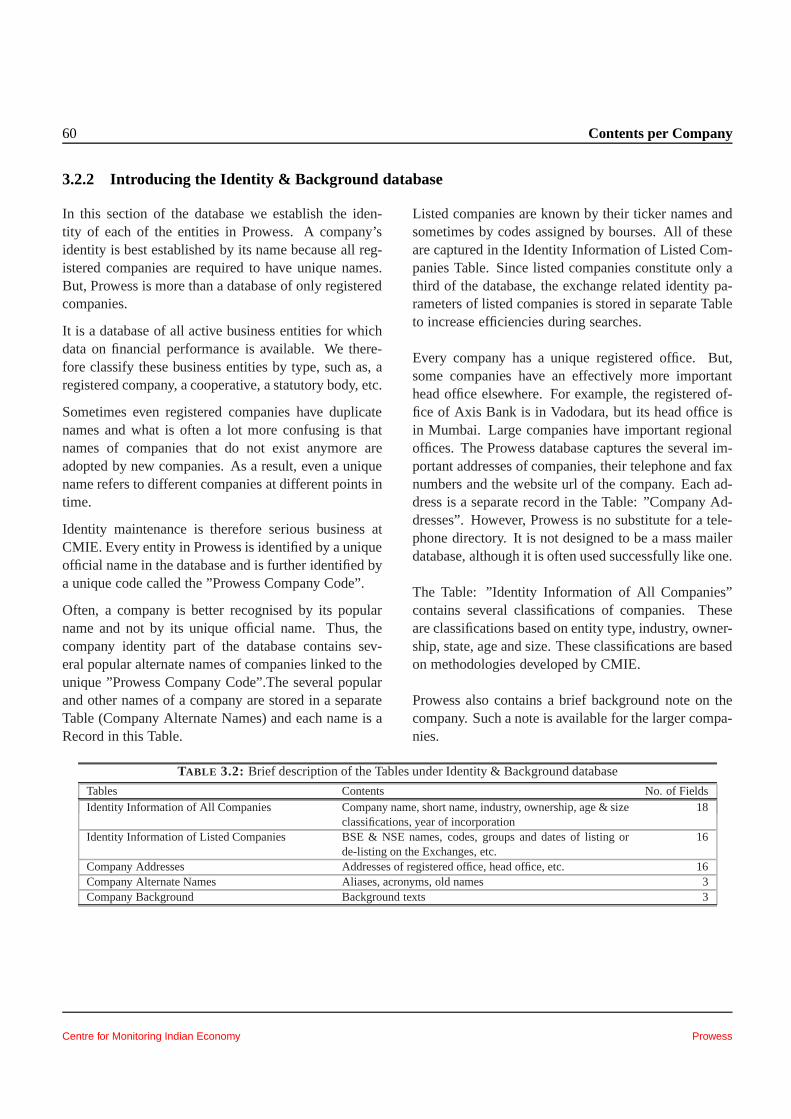
60 Contents per Company
3.2.2 Introducing the Identity & Background database
In this section of the database we establish the iden-tity of each of the entities in Prowess. A company’sidentity is best established by its name because all reg-istered companies are required to have unique names.But, Prowess is more than a database of only registeredcompanies.
It is a database of all active business entities for whichdata on financial performance is available. We there-fore classify these business entities by type, such as, aregistered company, a cooperative, a statutory body, etc.
Sometimes even registered companies have duplicatenames and what is often a lot more confusing is thatnames of companies that do not exist anymore areadopted by new companies. As a result, even a uniquename refers to different companies at different points intime.
Identity maintenance is therefore serious business atCMIE. Every entity in Prowess is identified by a uniqueofficial name in the database and is further identified bya unique code called the ”Prowess Company Code”.
Often, a company is better recognised by its popularname and not by its unique official name. Thus, thecompany identity part of the database contains sev-eral popular alternate names of companies linked to theunique ”Prowess Company Code”.The several popularand other names of a company are stored in a separateTable (Company Alternate Names) and each name is aRecord in this Table.
Listed companies are known by their ticker names andsometimes by codes assigned by bourses. All of theseare captured in the Identity Information of Listed Com-panies Table. Since listed companies constitute only athird of the database, the exchange related identity pa-rameters of listed companies is stored in separate Tableto increase efficiencies during searches.
Every company has a unique registered office. But,some companies have an effectively more importanthead office elsewhere. For example, the registered of-fice of Axis Bank is in Vadodara, but its head office isin Mumbai. Large companies have important regionaloffices. The Prowess database captures the several im-portant addresses of companies, their telephone and faxnumbers and the website url of the company. Each ad-dress is a separate record in the Table: ”Company Ad-dresses”. However, Prowess is no substitute for a tele-phone directory. It is not designed to be a mass mailerdatabase, although it is often used successfully like one.
The Table: ”Identity Information of All Companies”contains several classifications of companies. Theseare classifications based on entity type, industry, owner-ship, state, age and size. These classifications are basedon methodologies developed by CMIE.
Prowess also contains a brief background note on thecompany. Such a note is available for the larger compa-nies.
TABLE 3.2: Brief description of the Tables under Identity & Backgrounddatabase
Tables Contents No. of FieldsIdentity Information of All Companies Company name, short name, industry, ownership, age & size
classifications, year of incorporation18
Identity Information of Listed Companies BSE & NSE names, codes, groups and dates of listing orde-listing on the Exchanges, etc.
16
Company Addresses Addresses of registered office, head office, etc. 16Company Alternate Names Aliases, acronyms, old names 3Company Background Background texts 3
Centre for Monitoring Indian Economy Prowess

Contents per Company 61
3.2.3 Identity and Names
There is no official catalogue of business enterprisesin India created or maintained by any official or non-official agency. CMIE creates and maintains its owncatalogue of business enterprises whose performancecan be measured.
CMIE identifies business entities by scanning a host ofsources including the official lists such as those avail-able with the Stock Exchanges and the Ministry ofCompany Affairs. It approaches the problem of associ-ating names with the business entities in a formal way.There is surprisingly much to do here.
"What’s is a name? that which we call a rose By anyother name would smell as sweet;"
That was the famous quote from William Shakespeare’sRomeo & Juliet. But, if some of us called a rose a roseand if others called it a lilly and if still others called ita daisy or a marigold we would not be able to conversewith each other meaningfully although the rose wouldstill smell as sweet as ever.
If Prowess were to be a database of flowers it would en-sure that we all call a rose a rose; and if it were to beaddressed by any alternate name (such as gulab in Hindior rosapu in colloquial Tamil), we may still understandthat what was meant was the sweet smelling rose.
Official names of business entities are not neces-sarily unique. There are rare cases of even regis-tered names of companies being the same. For ex-ample, there were three Wrigley India Private Ltd.companies on the list of the Registrar of Companieswith three distinct codes (U99999KA1995PTC019415,U74900DL1993ULT055527 and U1543DL1993PTC-132563). This is potentially disastrous.
Official names do not remain constant over time. Com-panies do change and re-change their names. Whenthey do so, they often get addressed by multiple names.Glaxo Ltd. became Glindia Ltd. and then reverted toGlaxo Ltd. Tata Engineering & Locomotive Co. Ltd.became Tata Motors but was called TELCO for long.These are easy cases. But, sometimes the names flip-
flop such that it becomes difficult to understand whichcompany one is referring to.
Bajaj Auto Ltd. was demerged into Bajaj Holdings andInvestments Ltd. and Bajaj Finserv Ltd. and then theformer was renamed to Bajaj Auto Ltd. Videocon In-dustries Ltd. merged into an existing company, Video-con International Ltd. and then Videocon InternationalLtd. was renamed to Videocon Industries Ltd. In bothcases, the names Bajaj Auto and Videocon Industriesrefer to different companies, respectively, over time.
The challenge we face here is three-fold. First, to iden-tify a business enterprise uniquely. Are there reallythree Wrigley Indias? Is Glaxo and Glindia the samecompany?
The second challenge is to trace a business entity overtime. Is Videocon International and Videocon Indus-tries the same company over time? What is the historyof the company, Bajaj Auto Ltd.?
These two challenges are related to establishing theidentity of a business enterprise.
The third challenge is to associate the various namesof business enterprises with the appropriate entity. Itis about establishing an unambiguous association of aname with an identity such as associating Tata Engi-neering & Locomotive Co. Ltd and TELCO with abusiness entity that is now called Tata Motors Ltd.
Each entity in Prowess has a unique formal name andseveral alternate names, such as TELCO. Listed com-panies are also addressed by codes assigned to them bythe Stock Exchanges, Ministry of Companies and by theNSDL. Even CMIE has a unique numerical code for allcompanies in the database. There is a plethora of namesand codes for the entities in the Prowess database. Eachhas its own use. Each name is mapped to an appropriateand unique business entity.
In Prowess, a company can have many names but, anyone name necessarily leads to one and only one com-pany.
Prowess Centre for Monitoring Indian Economy
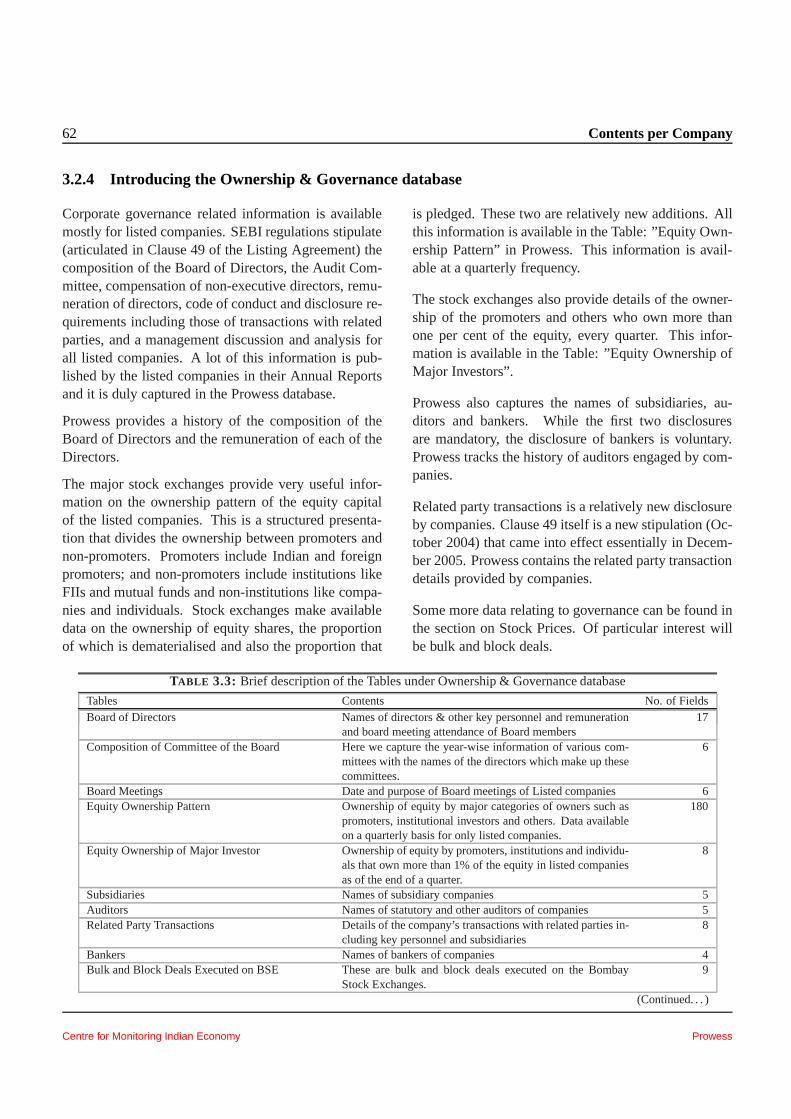
62 Contents per Company
3.2.4 Introducing the Ownership & Governance database
Corporate governance related information is availablemostly for listed companies. SEBI regulations stipulate(articulated in Clause 49 of the Listing Agreement) thecomposition of the Board of Directors, the Audit Com-mittee, compensation of non-executive directors, remu-neration of directors, code of conduct and disclosure re-quirements including those of transactions with relatedparties, and a management discussion and analysis forall listed companies. A lot of this information is pub-lished by the listed companies in their Annual Reportsand it is duly captured in the Prowess database.
Prowess provides a history of the composition of theBoard of Directors and the remuneration of each of theDirectors.
The major stock exchanges provide very useful infor-mation on the ownership pattern of the equity capitalof the listed companies. This is a structured presenta-tion that divides the ownership between promoters andnon-promoters. Promoters include Indian and foreignpromoters; and non-promoters include institutions likeFIIs and mutual funds and non-institutions like compa-nies and individuals. Stock exchanges make availabledata on the ownership of equity shares, the proportionof which is dematerialised and also the proportion that
is pledged. These two are relatively new additions. Allthis information is available in the Table: ”Equity Own-ership Pattern” in Prowess. This information is avail-able at a quarterly frequency.
The stock exchanges also provide details of the owner-ship of the promoters and others who own more thanone per cent of the equity, every quarter. This infor-mation is available in the Table: ”Equity Ownership ofMajor Investors”.
Prowess also captures the names of subsidiaries, au-ditors and bankers. While the first two disclosuresare mandatory, the disclosure of bankers is voluntary.Prowess tracks the history of auditors engaged by com-panies.
Related party transactions is a relatively new disclosureby companies. Clause 49 itself is a new stipulation (Oc-tober 2004) that came into effect essentially in Decem-ber 2005. Prowess contains the related party transactiondetails provided by companies.
Some more data relating to governance can be found inthe section on Stock Prices. Of particular interest willbe bulk and block deals.
TABLE 3.3: Brief description of the Tables under Ownership & Governance database
Tables Contents No. of FieldsBoard of Directors Names of directors & other key personnel and remuneration
and board meeting attendance of Board members17
Composition of Committee of the Board Here we capture the year-wise information of various com-mittees with the names of the directors which make up thesecommittees.
6
Board Meetings Date and purpose of Board meetings of Listed companies 6Equity Ownership Pattern Ownership of equity by major categories of owners such as
promoters, institutional investors and others. Data availableon a quarterly basis for only listed companies.
180
Equity Ownership of Major Investor Ownership of equity by promoters, institutions and individu-als that own more than 1% of the equity in listed companiesas of the end of a quarter.
8
Subsidiaries Names of subsidiary companies 5Auditors Names of statutory and other auditors of companies 5Related Party Transactions Details of the company’s transactions with related parties in-
cluding key personnel and subsidiaries8
Bankers Names of bankers of companies 4Bulk and Block Deals Executed on BSE These are bulk and block deals executed on the Bombay
Stock Exchanges.9
(Continued. . . )
Centre for Monitoring Indian Economy Prowess
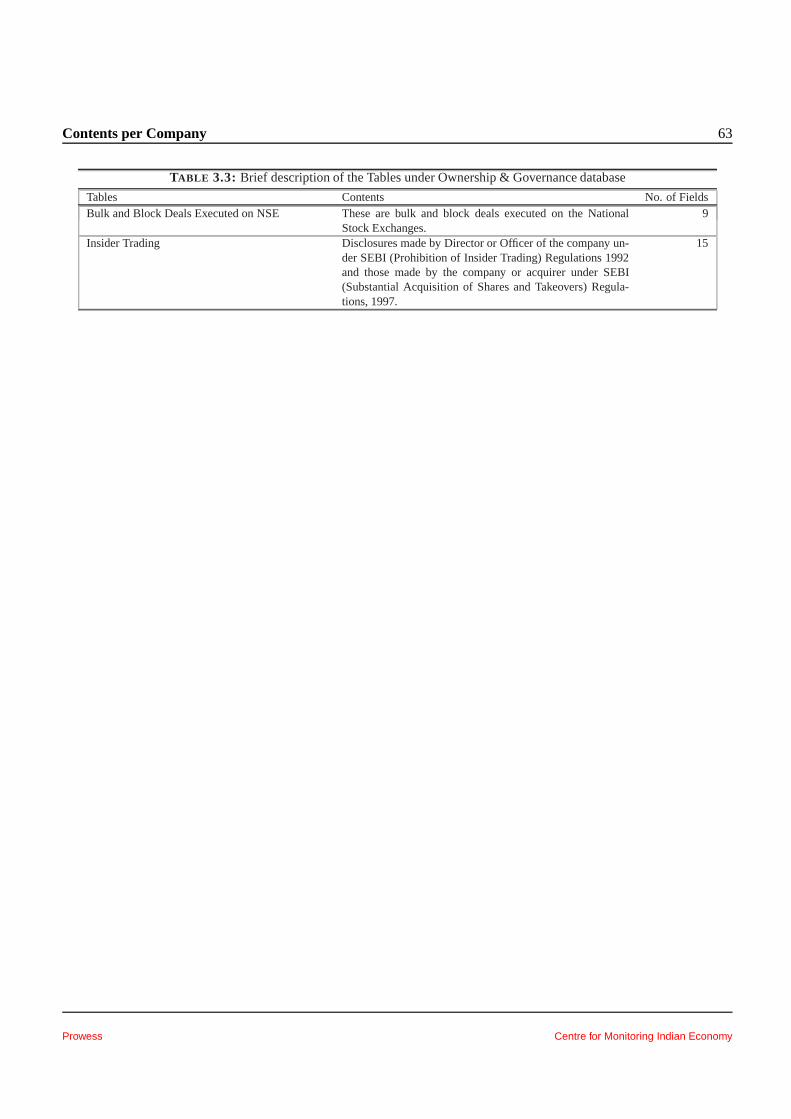
Contents per Company 63
TABLE 3.3: Brief description of the Tables under Ownership & Governance database
Tables Contents No. of FieldsBulk and Block Deals Executed on NSE These are bulk and block deals executed on the National
Stock Exchanges.9
Insider Trading Disclosures made by Director or Officer of the company un-der SEBI (Prohibition of Insider Trading) Regulations 1992and those made by the company or acquirer under SEBI(Substantial Acquisition of Shares and Takeovers) Regula-tions, 1997.
15
Prowess Centre for Monitoring Indian Economy
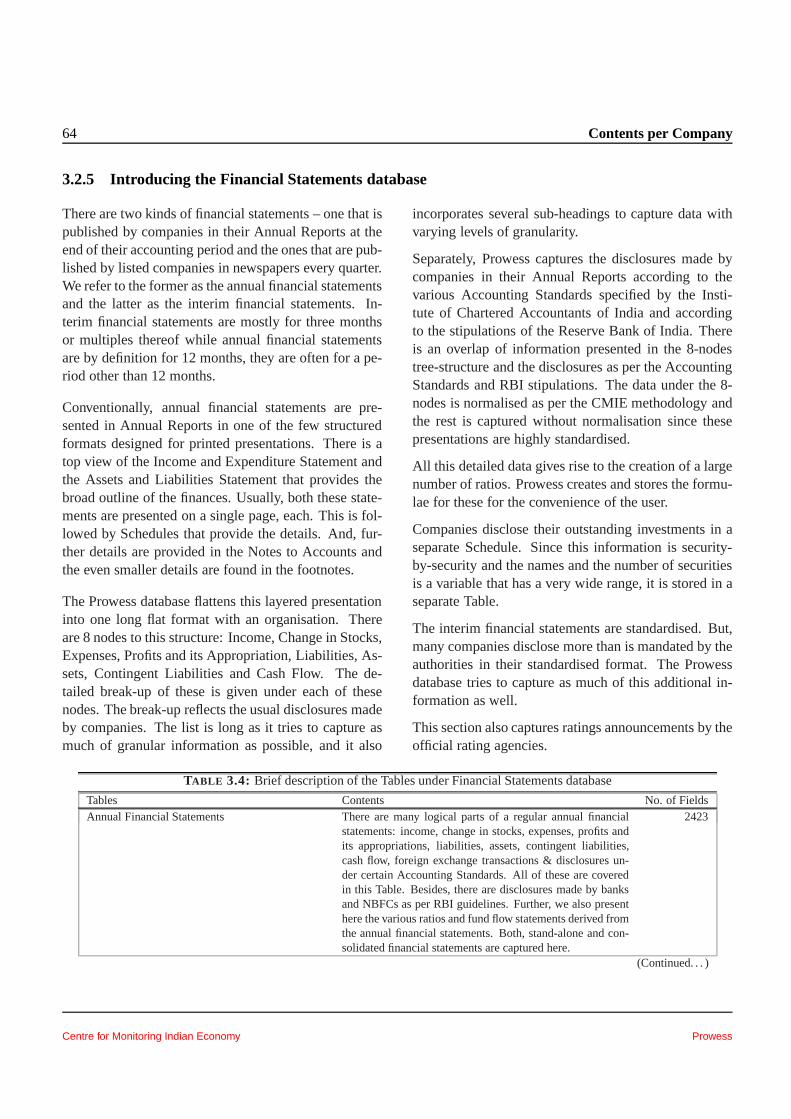
64 Contents per Company
3.2.5 Introducing the Financial Statements database
There are two kinds of financial statements – one that ispublished by companies in their Annual Reports at theend of their accounting period and the ones that are pub-lished by listed companies in newspapers every quarter.We refer to the former as the annual financial statementsand the latter as the interim financial statements. In-terim financial statements are mostly for three monthsor multiples thereof while annual financial statementsare by definition for 12 months, they are often for a pe-riod other than 12 months.
Conventionally, annual financial statements are pre-sented in Annual Reports in one of the few structuredformats designed for printed presentations. There is atop view of the Income and Expenditure Statement andthe Assets and Liabilities Statement that provides thebroad outline of the finances. Usually, both these state-ments are presented on a single page, each. This is fol-lowed by Schedules that provide the details. And, fur-ther details are provided in the Notes to Accounts andthe even smaller details are found in the footnotes.
The Prowess database flattens this layered presentationinto one long flat format with an organisation. Thereare 8 nodes to this structure: Income, Change in Stocks,Expenses, Profits and its Appropriation, Liabilities, As-sets, Contingent Liabilities and Cash Flow. The de-tailed break-up of these is given under each of thesenodes. The break-up reflects the usual disclosures madeby companies. The list is long as it tries to capture asmuch of granular information as possible, and it also
incorporates several sub-headings to capture data withvarying levels of granularity.
Separately, Prowess captures the disclosures made bycompanies in their Annual Reports according to thevarious Accounting Standards specified by the Insti-tute of Chartered Accountants of India and accordingto the stipulations of the Reserve Bank of India. Thereis an overlap of information presented in the 8-nodestree-structure and the disclosures as per the AccountingStandards and RBI stipulations. The data under the 8-nodes is normalised as per the CMIE methodology andthe rest is captured without normalisation since thesepresentations are highly standardised.
All this detailed data gives rise to the creation of a largenumber of ratios. Prowess creates and stores the formu-lae for these for the convenience of the user.
Companies disclose their outstanding investments in aseparate Schedule. Since this information is security-by-security and the names and the number of securitiesis a variable that has a very wide range, it is stored in aseparate Table.
The interim financial statements are standardised. But,many companies disclose more than is mandated by theauthorities in their standardised format. The Prowessdatabase tries to capture as much of this additional in-formation as well.
This section also captures ratings announcements by theofficial rating agencies.
TABLE 3.4: Brief description of the Tables under Financial Statementsdatabase
Tables Contents No. of FieldsAnnual Financial Statements There are many logical parts ofa regular annual financial
statements: income, change in stocks, expenses, profits andits appropriations, liabilities, assets, contingent liabilities,cash flow, foreign exchange transactions & disclosures un-der certain Accounting Standards. All of these are coveredin this Table. Besides, there are disclosures made by banksand NBFCs as per RBI guidelines. Further, we also presenthere the various ratios and fund flow statements derived fromthe annual financial statements. Both, stand-alone and con-solidated financial statements are captured here.
2423
(Continued. . . )
Centre for Monitoring Indian Economy Prowess
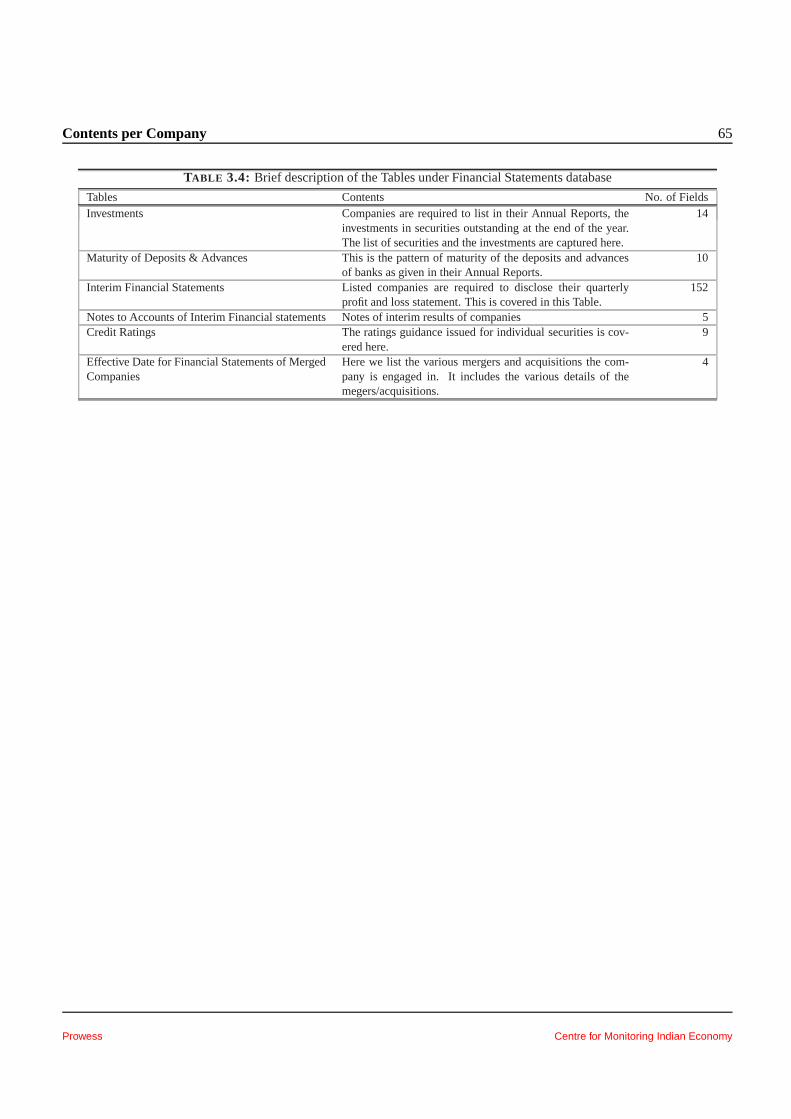
Contents per Company 65
TABLE 3.4: Brief description of the Tables under Financial Statementsdatabase
Tables Contents No. of FieldsInvestments Companies are required to list in their Annual Reports, the
investments in securities outstanding at the end of the year.The list of securities and the investments are captured here.
14
Maturity of Deposits & Advances This is the pattern of maturity of the deposits and advancesof banks as given in their Annual Reports.
10
Interim Financial Statements Listed companies are required to disclose their quarterlyprofit and loss statement. This is covered in this Table.
152
Notes to Accounts of Interim Financial statements Notes of interim results of companies 5Credit Ratings The ratings guidance issued for individual securities is cov-
ered here.9
Effective Date for Financial Statements of MergedCompanies
Here we list the various mergers and acquisitions the com-pany is engaged in. It includes the various details of themegers/acquisitions.
4
Prowess Centre for Monitoring Indian Economy
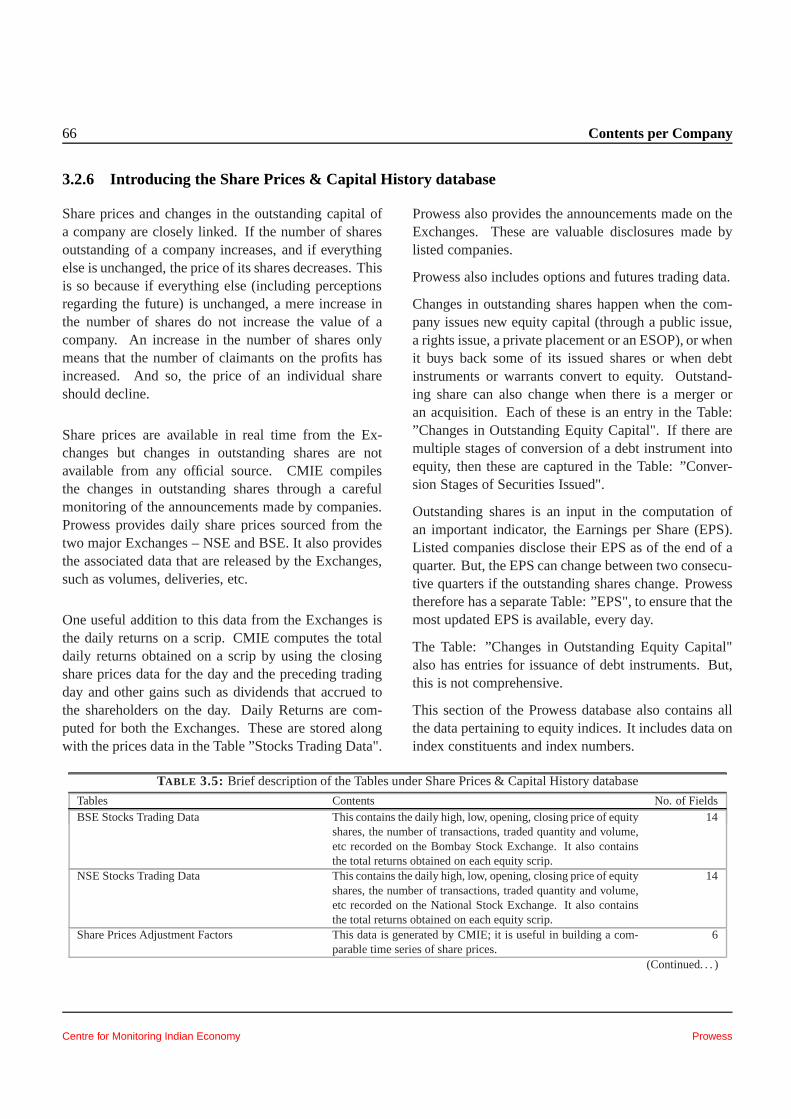
66 Contents per Company
3.2.6 Introducing the Share Prices & Capital History database
Share prices and changes in the outstanding capital ofa company are closely linked. If the number of sharesoutstanding of a company increases, and if everythingelse is unchanged, the price of its shares decreases. Thisis so because if everything else (including perceptionsregarding the future) is unchanged, a mere increase inthe number of shares do not increase the value of acompany. An increase in the number of shares onlymeans that the number of claimants on the profits hasincreased. And so, the price of an individual shareshould decline.
Share prices are available in real time from the Ex-changes but changes in outstanding shares are notavailable from any official source. CMIE compilesthe changes in outstanding shares through a carefulmonitoring of the announcements made by companies.Prowess provides daily share prices sourced from thetwo major Exchanges – NSE and BSE. It also providesthe associated data that are released by the Exchanges,such as volumes, deliveries, etc.
One useful addition to this data from the Exchanges isthe daily returns on a scrip. CMIE computes the totaldaily returns obtained on a scrip by using the closingshare prices data for the day and the preceding tradingday and other gains such as dividends that accrued tothe shareholders on the day. Daily Returns are com-puted for both the Exchanges. These are stored alongwith the prices data in the Table ”Stocks Trading Data".
Prowess also provides the announcements made on theExchanges. These are valuable disclosures made bylisted companies.
Prowess also includes options and futures trading data.
Changes in outstanding shares happen when the com-pany issues new equity capital (through a public issue,a rights issue, a private placement or an ESOP), or whenit buys back some of its issued shares or when debtinstruments or warrants convert to equity. Outstand-ing share can also change when there is a merger oran acquisition. Each of these is an entry in the Table:”Changes in Outstanding Equity Capital". If there aremultiple stages of conversion of a debt instrument intoequity, then these are captured in the Table: ”Conver-sion Stages of Securities Issued".
Outstanding shares is an input in the computation ofan important indicator, the Earnings per Share (EPS).Listed companies disclose their EPS as of the end of aquarter. But, the EPS can change between two consecu-tive quarters if the outstanding shares change. Prowesstherefore has a separate Table: ”EPS", to ensure that themost updated EPS is available, every day.
The Table: ”Changes in Outstanding Equity Capital"also has entries for issuance of debt instruments. But,this is not comprehensive.
This section of the Prowess database also contains allthe data pertaining to equity indices. It includes data onindex constituents and index numbers.
TABLE 3.5: Brief description of the Tables under Share Prices & CapitalHistory database
Tables Contents No. of FieldsBSE Stocks Trading Data This contains the daily high, low, opening, closing price of equity
shares, the number of transactions, traded quantity and volume,etc recorded on the Bombay Stock Exchange. It also containsthe total returns obtained on each equity scrip.
14
NSE Stocks Trading Data This contains the daily high, low, opening, closing price of equityshares, the number of transactions, traded quantity and volume,etc recorded on the National Stock Exchange. It also containsthe total returns obtained on each equity scrip.
14
Share Prices Adjustment Factors This data is generated by CMIE; it is useful in building a com-parable time series of share prices.
6
(Continued. . . )
Centre for Monitoring Indian Economy Prowess
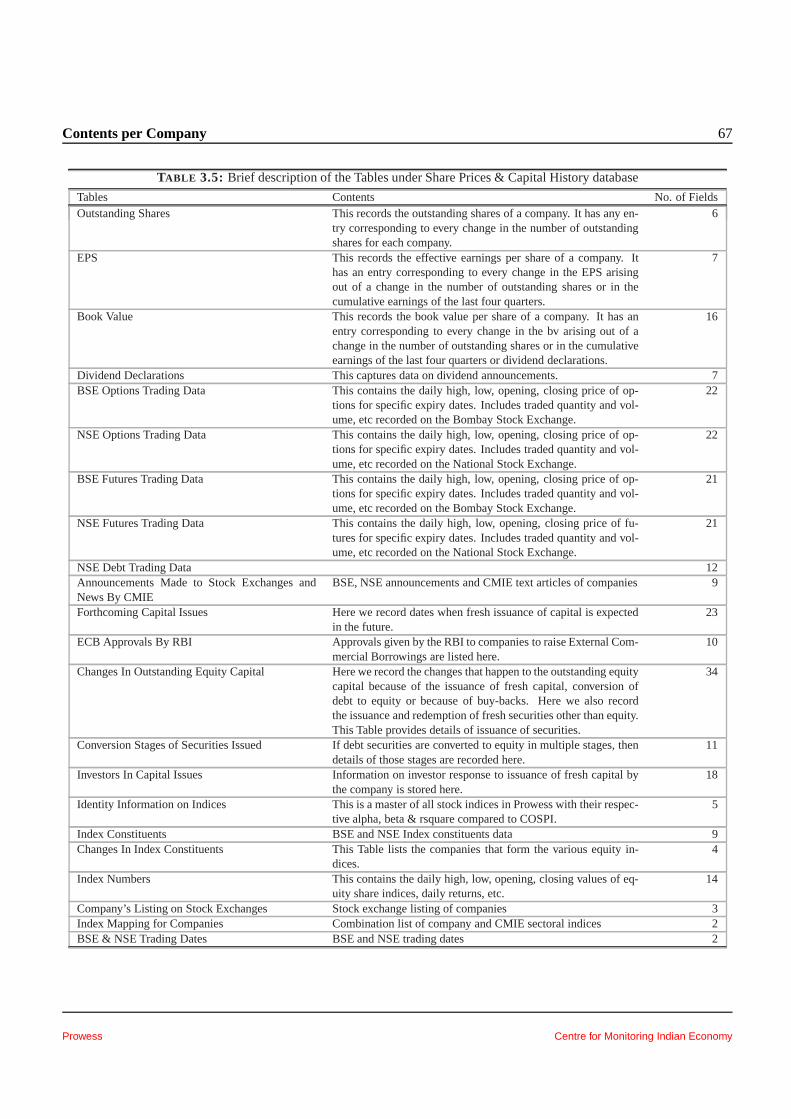
Contents per Company 67
TABLE 3.5: Brief description of the Tables under Share Prices & CapitalHistory database
Tables Contents No. of FieldsOutstanding Shares This records the outstanding shares of acompany. It has any en-
try corresponding to every change in the number of outstandingshares for each company.
6
EPS This records the effective earnings per share of a company. Ithas an entry corresponding to every change in the EPS arisingout of a change in the number of outstanding shares or in thecumulative earnings of the last four quarters.
7
Book Value This records the book value per share of a company. It has anentry corresponding to every change in the bv arising out of achange in the number of outstanding shares or in the cumulativeearnings of the last four quarters or dividend declarations.
16
Dividend Declarations This captures data on dividend announcements. 7BSE Options Trading Data This contains the daily high, low, opening, closing price of op-
tions for specific expiry dates. Includes traded quantity and vol-ume, etc recorded on the Bombay Stock Exchange.
22
NSE Options Trading Data This contains the daily high, low, opening, closing price of op-tions for specific expiry dates. Includes traded quantity and vol-ume, etc recorded on the National Stock Exchange.
22
BSE Futures Trading Data This contains the daily high, low, opening, closing price of op-tions for specific expiry dates. Includes traded quantity and vol-ume, etc recorded on the Bombay Stock Exchange.
21
NSE Futures Trading Data This contains the daily high, low, opening, closing price of fu-tures for specific expiry dates. Includes traded quantity and vol-ume, etc recorded on the National Stock Exchange.
21
NSE Debt Trading Data 12Announcements Made to Stock Exchanges andNews By CMIE
BSE, NSE announcements and CMIE text articles of companies 9
Forthcoming Capital Issues Here we record dates when fresh issuance of capital is expectedin the future.
23
ECB Approvals By RBI Approvals given by the RBI to companies to raise External Com-mercial Borrowings are listed here.
10
Changes In Outstanding Equity Capital Here we record the changes that happen to the outstanding equitycapital because of the issuance of fresh capital, conversion ofdebt to equity or because of buy-backs. Here we also recordthe issuance and redemption of fresh securities other than equity.This Table provides details of issuance of securities.
34
Conversion Stages of Securities Issued If debt securities are converted to equity in multiple stages, thendetails of those stages are recorded here.
11
Investors In Capital Issues Information on investor response to issuance of fresh capital bythe company is stored here.
18
Identity Information on Indices This is a master of all stockindices in Prowess with their respec-tive alpha, beta & rsquare compared to COSPI.
5
Index Constituents BSE and NSE Index constituents data 9Changes In Index Constituents This Table lists the companies that form the various equity in-
dices.4
Index Numbers This contains the daily high, low, opening, closing values of eq-uity share indices, daily returns, etc.
14
Company’s Listing on Stock Exchanges Stock exchange listing of companies 3Index Mapping for Companies Combination list of company andCMIE sectoral indices 2BSE & NSE Trading Dates BSE and NSE trading dates 2
Prowess Centre for Monitoring Indian Economy
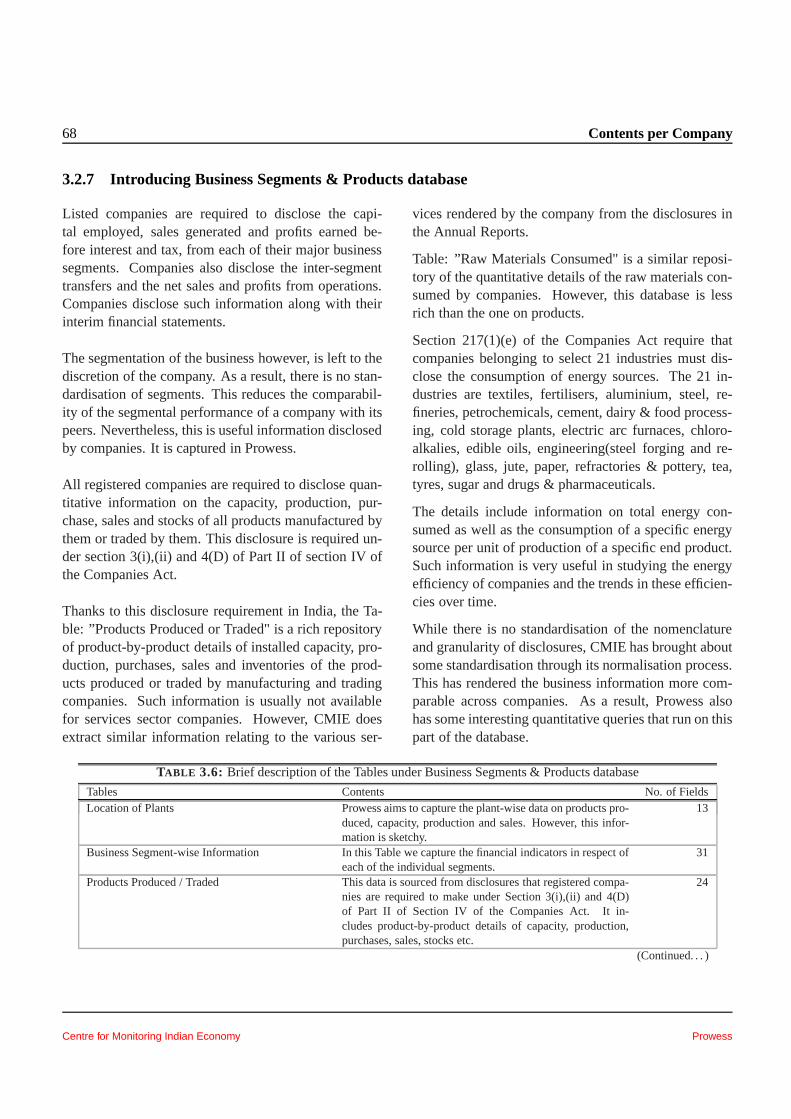
68 Contents per Company
3.2.7 Introducing Business Segments & Products database
Listed companies are required to disclose the capi-tal employed, sales generated and profits earned be-fore interest and tax, from each of their major businesssegments. Companies also disclose the inter-segmenttransfers and the net sales and profits from operations.Companies disclose such information along with theirinterim financial statements.
The segmentation of the business however, is left to thediscretion of the company. As a result, there is no stan-dardisation of segments. This reduces the comparabil-ity of the segmental performance of a company with itspeers. Nevertheless, this is useful information disclosedby companies. It is captured in Prowess.
All registered companies are required to disclose quan-titative information on the capacity, production, pur-chase, sales and stocks of all products manufactured bythem or traded by them. This disclosure is required un-der section 3(i),(ii) and 4(D) of Part II of section IV ofthe Companies Act.
Thanks to this disclosure requirement in India, the Ta-ble: ”Products Produced or Traded" is a rich repositoryof product-by-product details of installed capacity, pro-duction, purchases, sales and inventories of the prod-ucts produced or traded by manufacturing and tradingcompanies. Such information is usually not availablefor services sector companies. However, CMIE doesextract similar information relating to the various ser-
vices rendered by the company from the disclosures inthe Annual Reports.
Table: ”Raw Materials Consumed" is a similar reposi-tory of the quantitative details of the raw materials con-sumed by companies. However, this database is lessrich than the one on products.
Section 217(1)(e) of the Companies Act require thatcompanies belonging to select 21 industries must dis-close the consumption of energy sources. The 21 in-dustries are textiles, fertilisers, aluminium, steel, re-fineries, petrochemicals, cement, dairy & food process-ing, cold storage plants, electric arc furnaces, chloro-alkalies, edible oils, engineering(steel forging and re-rolling), glass, jute, paper, refractories & pottery, tea,tyres, sugar and drugs & pharmaceuticals.
The details include information on total energy con-sumed as well as the consumption of a specific energysource per unit of production of a specific end product.Such information is very useful in studying the energyefficiency of companies and the trends in these efficien-cies over time.
While there is no standardisation of the nomenclatureand granularity of disclosures, CMIE has brought aboutsome standardisation through its normalisation process.This has rendered the business information more com-parable across companies. As a result, Prowess alsohas some interesting quantitative queries that run on thispart of the database.
TABLE 3.6: Brief description of the Tables under Business Segments & Products database
Tables Contents No. of FieldsLocation of Plants Prowess aims to capture the plant-wise data on products pro-
duced, capacity, production and sales. However, this infor-mation is sketchy.
13
Business Segment-wise Information In this Table we capturethe financial indicators in respect ofeach of the individual segments.
31
Products Produced / Traded This data is sourced from disclosures that registered compa-nies are required to make under Section 3(i),(ii) and 4(D)of Part II of Section IV of the Companies Act. It in-cludes product-by-product details of capacity, production,purchases, sales, stocks etc.
24
(Continued. . . )
Centre for Monitoring Indian Economy Prowess
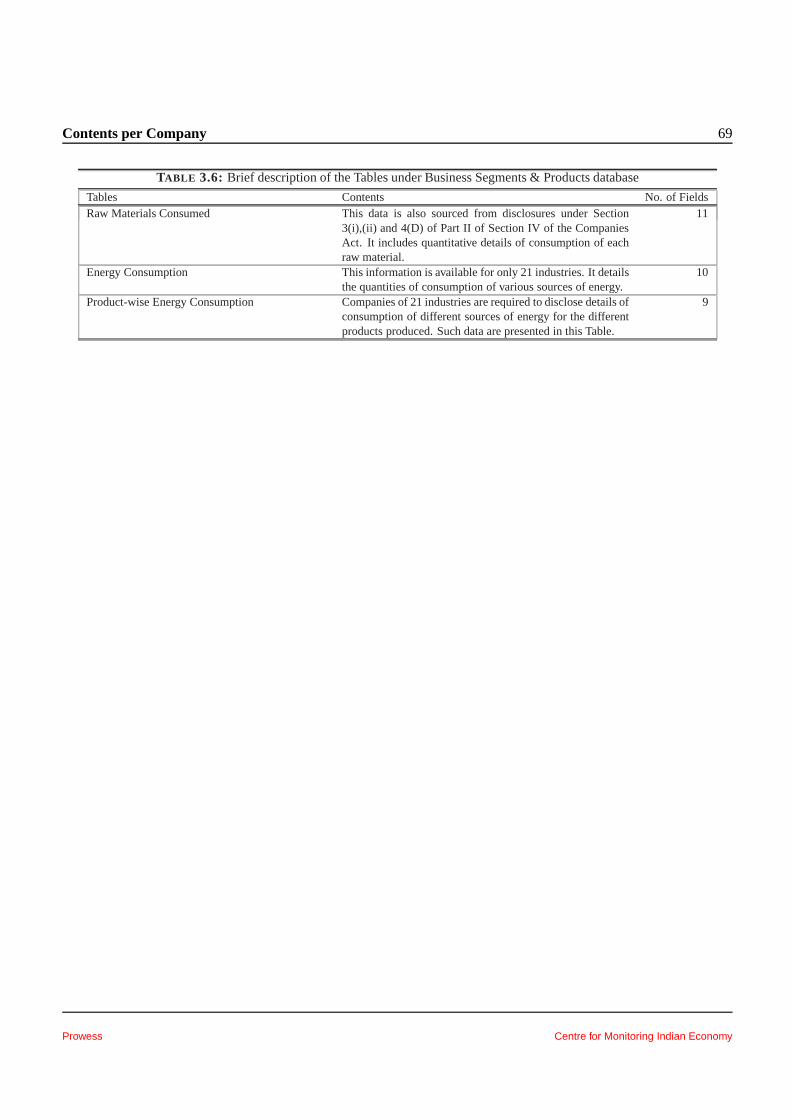
Contents per Company 69
TABLE 3.6: Brief description of the Tables under Business Segments & Products database
Tables Contents No. of FieldsRaw Materials Consumed This data is also sourced from disclosures under Section
3(i),(ii) and 4(D) of Part II of Section IV of the CompaniesAct. It includes quantitative details of consumption of eachraw material.
11
Energy Consumption This information is available for only 21 industries. It detailsthe quantities of consumption of various sources of energy.
10
Product-wise Energy Consumption Companies of 21 industries are required to disclose details ofconsumption of different sources of energy for the differentproducts produced. Such data are presented in this Table.
9
Prowess Centre for Monitoring Indian Economy
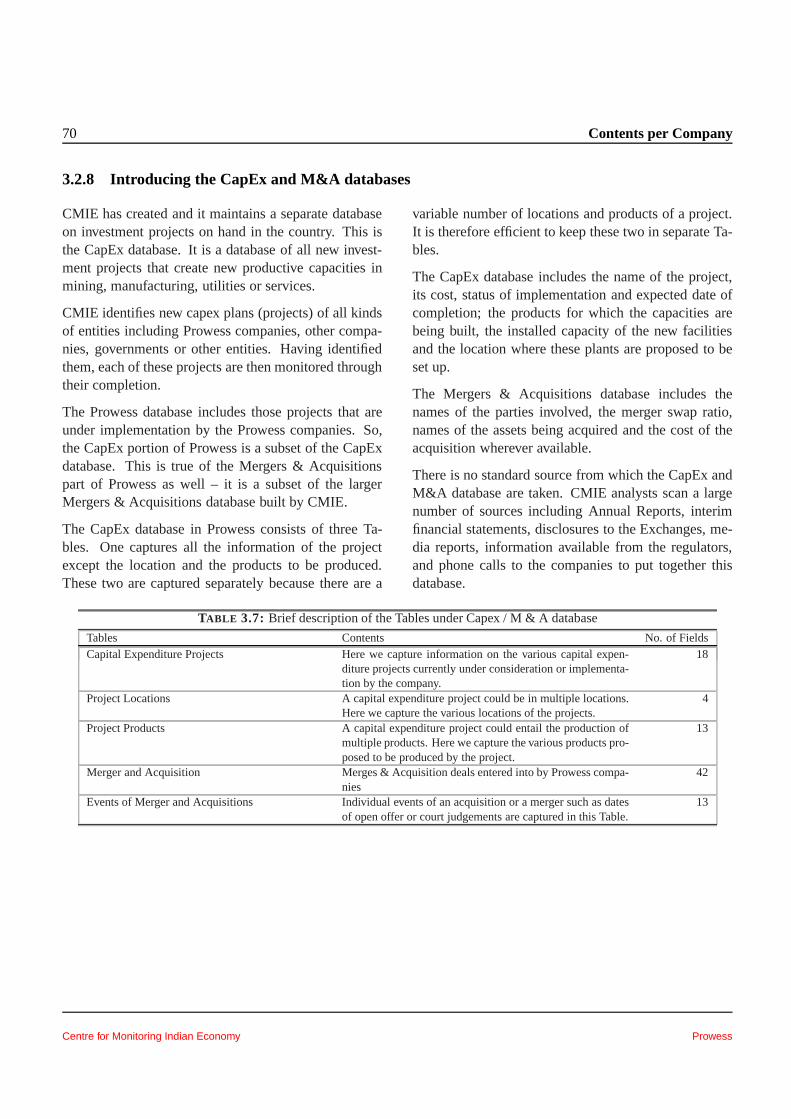
70 Contents per Company
3.2.8 Introducing the CapEx and M&A databases
CMIE has created and it maintains a separate databaseon investment projects on hand in the country. This isthe CapEx database. It is a database of all new invest-ment projects that create new productive capacities inmining, manufacturing, utilities or services.
CMIE identifies new capex plans (projects) of all kindsof entities including Prowess companies, other compa-nies, governments or other entities. Having identifiedthem, each of these projects are then monitored throughtheir completion.
The Prowess database includes those projects that areunder implementation by the Prowess companies. So,the CapEx portion of Prowess is a subset of the CapExdatabase. This is true of the Mergers & Acquisitionspart of Prowess as well – it is a subset of the largerMergers & Acquisitions database built by CMIE.
The CapEx database in Prowess consists of three Ta-bles. One captures all the information of the projectexcept the location and the products to be produced.These two are captured separately because there are a
variable number of locations and products of a project.It is therefore efficient to keep these two in separate Ta-bles.
The CapEx database includes the name of the project,its cost, status of implementation and expected date ofcompletion; the products for which the capacities arebeing built, the installed capacity of the new facilitiesand the location where these plants are proposed to beset up.
The Mergers & Acquisitions database includes thenames of the parties involved, the merger swap ratio,names of the assets being acquired and the cost of theacquisition wherever available.
There is no standard source from which the CapEx andM&A database are taken. CMIE analysts scan a largenumber of sources including Annual Reports, interimfinancial statements, disclosures to the Exchanges, me-dia reports, information available from the regulators,and phone calls to the companies to put together thisdatabase.
TABLE 3.7: Brief description of the Tables under Capex / M & A database
Tables Contents No. of FieldsCapital Expenditure Projects Here we capture information on the various capital expen-
diture projects currently under consideration or implementa-tion by the company.
18
Project Locations A capital expenditure project could be inmultiple locations.Here we capture the various locations of the projects.
4
Project Products A capital expenditure project could entail the production ofmultiple products. Here we capture the various products pro-posed to be produced by the project.
13
Merger and Acquisition Merges & Acquisition deals entered into by Prowess compa-nies
42
Events of Merger and Acquisitions Individual events of an acquisition or a merger such as datesof open offer or court judgements are captured in this Table.
13
Centre for Monitoring Indian Economy Prowess
Contents per Company 71
3.3 What is Normalisation?
Normalisation is the process of capturing heteroge-neous information into a standardised format.
Standardisation formats applies to nomenclature, unitsof measurement, classification, granularity of detail anddefinition of data items. There is a great deal of hetero-genity in disclosures in respect of these attributes. Thenormalisation process overcomes the limitations par-ticularly in inter-company and temporal comparisonscaused by such heterogenity.
The forms that we fill to obtain admission into an edu-cational institute, or to open a bank account, or to openan account with Amazon are all standardised forms.Such forms are created by the service provider andfilled in by the service seeker as per instructions givenby the former. The instructions include the manner inwhich we enter our names, the units in which we spec-ify our income and the level of detail that is required.Forms often clarify the meaning of each informationsought.
The Prowess database is created differently. Companiesdo not fill in forms created by CMIE. The Annual Re-port of the companies is the most important source ofdata in Prowess. Companies prepare Annual Reportsfor their shareholders. While there are guidelines toprepare an Annual Report, companies have substantialfreedom in deciding the presentation format, the em-phasis and the degree of detail that it wishes to share.Often the disclosures are far beyond what is statutorilyrequired. The Annual Report is presented in a mannerthe Directors feel best reflects the performance of thecompany during a period and its financial position atthe end of the period.
These presentations vary substantially across compa-nies and over time. Nomenclature for the same itemsdiffer, units of measurement differs and level of detailsdiffer. Heterogenous presentation of information is notlimited to only Annual Reports. It is equally likely ininterim financial statements or other kinds of informa-tion.
Building a database of such heterogenous data canmean two things. One, we can build a database of all the
documents that contain the information. This would be,for example, a database of the electronic copies of allthe Annual Reports and other documents of all compa-nies. However, such a database of documents has lim-itations. It is not straightforward to add all the sales ofall companies from such a database. It would similarlynot be straightforward to do a search based on the val-ues of certain attributes in such a database. To harnessthe underlying informaiton contained in the documents,we need to build a database of the values in the docu-ments.
This second kind of database would compile all therelevant information available in the documents into astandardised format. Such a database is created to en-hance the utility of the information that resides in thedocuments. However, in doing so, we lose inevitablysome of the fidelity of the informaiton contained in theoriginal document. In the simplest case, a line item ofthe document is mapped to a different but similar mean-ing line item in the standardised document. The originalline item is mapped to, not re-produced, in the standard-ised database format.
The challenge then is to retain as much of the origi-nal information as possible and yet bring in flexibilityto enhance the utility of the information. One way ofdoing this is to increase the number of entries in thestandardised format to incorporate as much of the het-erogenity in disclosures as possible. However, beyonda point, an increase in the number of entries in the stan-dardised format can increase confusion and reduce theutility of the database or increase the complexity in us-ing the database. The wizardry in building a standard-ised format is in appropriately balancing the tradeoffbetween fidelity and utility.
The creation of such a standardised format is the firstand most important step in normalisation.
The next step in normalisation is the mapping of theentries in the original document to the entries in thestandardised format. This is not a straightforward taskbecause disclosures vary across sources and over time.The mapping is therefore the task of a professional ana-
Prowess Centre for Monitoring Indian Economy
72 Contents per Company
lyst who is trained to understand the full disclosures ina document and then comprehensively map this piece-by-piece into the standardised format.
Normalisation at CMIE never implies imposing a valuejudgement on the information in the original source.
We never disregard any piece of information in the orig-inal document. Normalisation essentially means map-ping the available information to the standardised for-mat.
Centre for Monitoring Indian Economy Prowess
Contents per Company 73
3.3.1 The five essentials of normalisation
There are five essential attributes of normalisation.These govern the method by which the original data istransformed into the standardised, normalised format.
1. Nomenclature.
The Prowess database deals with companies,products, locations, data fields, etc. Each of thesehas a name and often a set of names. There aremultiple ways in which we address a company, aproduct, locations or data fields. To ensure thatwe know what we mean when we use a name, itis important to associate all possible names withtheir appropriate meaning, in this case with theappropriate entity. The Prowess database ensuresthis. For example, it associates Gujarat AmbujaLtd. and Ambuja Cements Ltd. to the samecompany and methanol and methyl alcohol to thesame product and so on. It also ensures that onename does not stand for multiple entities. It en-sures that Videocon does not sometimes meanVideocon Industries and sometimes Videocon In-ternational.
In general, the normalisation of nomenclatureensures that all names are uniquely mapped toentities and entities can be mapped to multiplenames.
2. Units of measurement.
The unit of measurement for each data item isstandardised in the Prowess database. All fi-nancial data fields for example, are capture inRs.lakh. They are usually displayed in crore, butthey are captured in lakh independent of the unitsin which the original source displays it. This nor-malisation is very useful (and also tedious andsometimes impossible) in the case of physicalunits of production, purchases, sales or invento-ries. Prowess endeavours to bring in as much uni-formity in the units of measurement of individualdata items.
3. Granularity.
Different companies reveal different details oftheir companies. This is understandable and isalso appreciated as different items are importantto different companies. This great variation isone of the strengths of the disclosures by com-panies.
The normalisation process aims to maximise thegranularity of data captured. The idea is to cap-ture as much of the micro-details provided bycompanies. The emphasis in the data captureis on the micro-details and not on the broad ac-counting heads. The broad accounting heads aremostly derived by using the constituents as is de-fined by the classification system, which is de-scribed separately.
Granularity also deals with different levels of de-tails provided by companies. The standardisedformat ensures that data can be captured evenwith variations in the levels of details providedby companies. The standardised format has lay-ers of granularity and aggregation to overcomethe problem of different levels of granularity inthe disclosure of information by companies.
4. Classification.
Is ammonium chloride a fertiliser or is it an in-organic chemical? Is income from sale of scrapa part of main income or other income? Is in-terest accrued and due a current liability or isit a borrowing? There are many such questionswhere the precise classification is contextual oreven subjective. Often, there are no fixed rulesor generally accepted norms to decide amongstmultiple options.
The normalisation process standardises this clas-sification. It decides what the various heads andsub-heads would be and what would be containedin each of these. This is, perhaps, the most impor-tant part of the normalisation process. The stan-dardisation of classification of individual itemheads into sub-heads and higher sub-heads en-sures that the information across companies be-
Prowess Centre for Monitoring Indian Economy
74 Contents per Company
comes comparable. The classification of ammo-nium chloride or sale of scrap or interest accruedand due and many such cases is now not mat-ter of subjective judgement, but is fixed by thenormalisation process. This ensures a consis-tent understanding of the meaning of the variousaccounting heads and also makes inter-companyand inter-temporal comparisons meaningful.
CMIE does not claim that the standardised classi-fication is superior compared to the classificationadopted by the companies or by any other agency.The attempt is not to claim superiority but to beconsistent in the building of a database.
5. Definition.
The classification system bestows a certain defi-nition on the broad accounting heads in CMIE’sstandardised system. However, meanings of themicro-details need to be explained. The normal-isation process does this. It explains every datafield in detail so that the information in the orig-inal source is mapped to the standardised formatdeveloped by CMIE appropriately. Analysts arerequired to understand the definitions in CMIE’sstandardised formats and understand the disclo-sures available in the original source and thenmap these two as closely as possible and as com-prehensively as possible to ensure that we havea normalised database with the highest possiblefidelity.
Centre for Monitoring Indian Economy Prowess
Contents per Company 75
3.3.2 Normalisation of the Identity & Background database
The Identity database involves normalisation of nomen-clature and of classification.
Names of companies are normalised to introduce a de-gree of predictability in the use of abbreviations. Forexample, “Limited” is always abbreviated to “Ltd.”. Ingeneral, the Prowess database retains the official nameof the company as is printed by the company in itsAnnual Report. However, there are small deviations.These deviations were created to introduce some sys-tematic reduction in the length of the name of the com-panies.
In the past, companies had exceptionally long names.Apparently, there was a propensity to announce thecompany in a rather elaborate way. For example,Rao Saheb Rekhchand Mohota Spinning and WeavingMills Ltd. (incorporated in 1946) or Madurai Vetri-lai Pakku Beedi Cigarette Varthaga Sangathargal StoresLtd. (1945). Industries such as textiles, sugar, financeand investments also had long names to describe theiractivities.
This led to the creation of abbreviations. And, CMIEstandardised these.
In recent times, companies have started shortening theirnames and using popular acronyms as their officialnames. Thus, Tata Engineering and Locomotive Com-pany Ltd. has become Tata Motors Ltd and AssociatedCement Companies Ltd. has now become ACC Ltd.CMIE has standardised the way in which acronyms areentered. We always add a space between alphabets inan acronym, we do not insert dots.
Classification of companies by industry or ownership isa useful feature of Prowess. Companies are also classi-fied by age and size. Companies do not classify them-selves in any systematic manner. This work is done byCMIE.
CMIE undertakes the task of creating a methodologyand a process to classify each company in the database
by the four types of classification – industry, ownership,age and size. The industry classification is done at twolevels. First, a company is classified as belonging toan industry depending on the contribution of the vari-ous products and services to its total business. This canlead to a company being classified as belonging to avery niche industry in which (possibly) it may have nopeers. The second level industry classification is done ata broader level. This is called the industry-group clas-sification.
The organisation of industries at both levels is devel-oped by CMIE. Similarly, the organisation of owner-ship groups is developed by CMIE. The age classifica-tion is based on year of incorporation and the size clas-sification is based on a combination of sales and assets.Each of these are developed by CMIE.
Companies are uniquely classified into each of the clas-sification systems.
Table 3.8Abbreviations used in ProwessWords Conventions in Prowessand &Company Co.Companies Cos.Co-operative Co-op.Corporation Corpn.Development Devp.Engineering Engg.Ginning Gng.Industrial Indl.Industries Inds.Investment Invst.Limited Ltd.Manufacturers Mfrs.Manufacturing Mfg.Pressing Prsg.Sahakari Sakhar Karkhana S.S.K.Spinning Spg.Trading Trdg.Weaving Wvg.
Prowess Centre for Monitoring Indian Economy
76 Contents per Company
3.3.3 Normalisation of the Ownership & Governance database
The scope of normalisation is limited in the governancedatabase of Prowess. This is because a large part of thisdatabase is available in standardised formats from theoriginal sources.
Names of directors is taken as they are given in the An-nual Report of the company as of the date of the An-nual Report. Earlier versions of Prowess provided the”latest” composition of the Board of Directors. In thisversion, we updated the changes in the Board as andwhen they happened. This practice was stopped andnow Prowess provides a time-series of the compositionof the Board of Directors as seen in the Annual Reports.
In building a time-series we face a nomenclature prob-lem. Often, the same person on the Board of Directorsis spelt differently over time. This makes comparison ofthe composition of the Board over time difficult. CMIEmakes efforts to ”clean” this database to the extent pos-sible. This involves making some assumptions. Whilewe do make small assumptions, we refrain from stray-ing too far from the original source.
Clause 49 of the Listing Agreement requires that alllisted companies ensure that half the Board of Direc-tors consists of non-executive directors. Further, ifthe Chairperson is an executive director, then, half theBoard of Directors should comprise of independent di-rectors and if the Chairperson is a non-executive direc-
tor, then at least one-third of the directors need to beindependent.
Companies however, do not systematically make thisclassification of executive/non-executive and indepen-dent directors clear in their Annual Reports. We makeefforts to systematically classify the directors into thetwo categories – executive and non-executive and, in-dependent and non-independent.
Ownership of equity is a major part of this database.The pattern of equity ownership is provided by the Ex-changes in a standardised format. The categories ofowners is well defined and therefore the information iscomparable across companies. Further, this format hasremained reasonably stable since 1990 and is thereforecomparable over time. We therefore find no need tonormalise this data.
The ownership of equity by stake holders with an own-ership of more than one per cent of the total equity cap-ital suffers from nomenclature problems. The same en-tity is spelt differently over time and this causes prob-lems in comparison of the information over time. CMIEmakes efforts to ”clean” this database to the extent pos-sible. This again involves making some assumptions.While we do make some, we refrain from straying toofar from the original source.
Centre for Monitoring Indian Economy Prowess
Contents per Company 77
3.3.4 Normalisation of the Financial Statements database
Financial statements published by companies in theirAnnual Reports are subjected to maximum normalisa-tion in the Prowess database. These statements showthe greatest heterogenity in disclosures across compa-nies and over time, and therefore they demand the great-est effort at normalisation. Financial statements showheterogenity in terms of:
• Non-standard nomenclature.
What one company calls as ”Sales” another calls”Income”; what some call ”Salaries and Wages”others call ”Compensation to Employees” and”Gross fixed assets” is alternately called ”Grossblock”.
• Non-standard unit of measurement.
Companies are free to present information in ru-pees or in any multiple thereof such as thousandrupees, lakh, million or crore rupees.
• Non-standard granularity.
While some companies provide both ”interestearned” and ”interest paid”, others only provide”net interest payments”.
• Non-standard classification.
While some companies classify ”dividendsearned” as ”other income” others do not.
• Non-standard definition.
Organisations involved in stipulating what shouldbe included in an Annual Report provide guide-lines on how financial transactions should betreated. However, the final presentation in theAnnual Report is left to the company. As a re-sult, there is no standard definition prescribed byany authority for the various heads displayed ina company’s Annual Report. Many items areunderstood contextually. For example, ”miscel-laneous expenditure” is understood contextuallydepending upon the expenditure items that arementioned explicitly elsewhere.
The normalisation process overcomes many of theproblems posed by such heterogenity by creating a stan-dardised format with the following attributes:
• High granularity.
The Prowess database has attempted to capture asmuch of detail as is possible. This has explodedthe number of line items. There are 79 datafieldsunder income, 231 under expenses, 104 detail-ing profits and its appropriation, 238 under liabil-ities and 360 under assets. This adds up to 1,012datafields. If we add to this contingent liabilities,cash flow, forex transactions, disclosures underthe various Accounting Standards of the ICAI, re-quirements as per RBI guidelines, etc. then thetotal datafields adds up to 2,423. The averagenumber of datafields filled for a non-financial ser-vices company that is a part of the Nifty index isxx per cent of the total. The average for a finan-cial services company of the Nifty is higher at xxper cent.
The high degree of granularity leaves a lot ofblank datafields in the data capture of any onecompany because they may not be relevant to thespecific company. But, the granularity increasesthe probability of capturing a lot of the details asclosely as provided by the companies.
• Layered classification.
The large number of datafields resulting fromhigh granularity can cause confusion if these arenot organised into some logical structure. Thebroad structure of financial statements providesthe starting point of such a structure. To this weadd layers of detail, or we may call this levelsof granularity. Thus, for example, we begin witha broad heading called ”Total Income” and thenadd levels of detail under this such as ”Sales”,”Income from Financial services”, ”Other In-come” and ”Prior period and Extra-ordinary In-come”. Within each of these are layers of furtherdetails and so on, till we reach the highest levelof granularity possible.
Prowess Centre for Monitoring Indian Economy
78 Contents per Company
These levels of granularities help in overcomingheterogenity in the levels of granularity in the dis-closures by companies. A greater utility of thisapproach of levels of granularity is that it stan-dardises the classification of datafields. As a re-sult, for example, interest earned is always con-sidered as income from financial services pro-vided and is not considered as the ubiquitous butundefined ”other” income.
• Mapping guidelines (Definitions).
Each datafield of the standardised format is de-fined by CMIE to enable the mapping of the in-formation available in the Annual Reports intothe standardised format. To a great extent, the
definitions are evident in the classification ex-plained above. But, there is a lot to be said evenafter that. These definitions draw upon our expe-rience in dealing with the heterogenity of disclo-sures in Annual Report.
These definitions do not explain accounting con-cepts. They assume that basic accounting prin-ciples are understood. So, they concentrate ondefining the mapping of the information from theAnnual Reports to the standardised format. Thestructured format, the layered classifications andthe definitions collectively ensure that the datafields are exhaustive and the atomic data fieldsare mutually exclusive except in cases wheremore than one classification is useful.
Centre for Monitoring Indian Economy Prowess

Contents per Company 79
3.3.5 Normalisation of the Share Prices & Capital History database
The share prices data and its associated data such asthe volume of transactions and business pertaining toindividual stocks on the exchanges is sourced from thetwo major stock exchanges – the Bombay Stock Ex-change and the National Stock Exchange. The stockexchanges provide a data feed that is highly standard-ised and therefore there is no need to normalise this in-formation.
The Exchanges also provide information on bulk andblock deals, announcements by the companies, etc.Much of this is taken as is provided by the Exchangesand is fed into the Prowess database directly.
Some of the information provided by the companies inthe announcements is processed for the Capital History
database. The Capital History database has no specificsource. It is created out of data available from all kindsof sources. Listed companies are required to inform thestock exchanges of any addition or deletion of its issuedequity shares. Stock exchanges in turn make a publicannouncement of these additions or deletion of shares.CMIE captures this information into the database andwith this, it updates the outstanding shares of a com-pany.
Companies announce the outstanding shares in the An-nual Reports and listed companies announce the out-standing share in their equity ownership disclosures ev-ery quarter. These are used to cross-check the dailymonitoring that populates the Capital History database.
Prowess Centre for Monitoring Indian Economy
80 Contents per Company
3.3.6 Normalisation of the Business Segments & Products database
Disclosure made by companies in their Annual Reportsas required under Sec 3(i),(ii) and 4(D) of Part II ofsection IV of the Companies Act is a valuable sourceof data to understand the composition of the businessand also the sources of growth. This data as availablein the Annual Reports suffers from the following prob-lems that limit its use:
• Nomenclature.
The problem of nomenclature is two-fold here.First, one term can carry more than one mean-ing. For example, ”crude oil” could mean crudepetroleum oil or crude vegetable oil, dependingupon the nature of the company. The secondproblem is that the same product could be ad-dressed by more than one different names. Forexample, methanol and methyl alcohol are thesame product with two different names.
• Units of measurement.
There are vast differences in the units of measure-ment. Values could be in rupees or multiples suchas thousands, lakhs, millions, crores, etc. Quanti-ties could be in different multiples similarly. Wemay have tonnes of cement, or thousand tonnesof cement, lakh tonnes, and so on. Further, ce-ment could also be in bags. This gets worse insome products such as in beer whose productioncould be expressed in litres, bottles or crates.
We overcome these problems with the help of two kindsof standardisations.
• Product coding system.
CMIE has developed a system of classifyingproducts and services. This system is ambitiousin trying to be quite comprehensive across prod-ucts of all kinds – agriculture, mining, manufac-turing, utilities and services of all kinds.
CMIE’s products and services coding system ishighly granular. This ensures capture of a largenumber of products and services. It has a layeredstructure to enable entries of different levels ofgranularity. For example, it is possible to makean entry at a broad level such as for fertilisers, orfor a little more specific product category such asnitrogeneous fertilisers or a very specific productsuch as urea.
In the above example, urea is a nitrogeneous fer-tiliser, which is a fertiliser. The layered structureof the product coding system contains this knowl-edge of the classification of products.
All product names seen in the disclosures bycompanies are mapped to this product codingsystem. A product code is assigned to each prod-uct or service. This ensures that every productname has a specific meaning as is assigned bythe product coding system.
• Standardisation of units.
CMIE has decided the most preferred unit ofmeasurement of all values. If the company ex-presses values in units that are different fromthese then CMIE converts them into the preferredunits if such a conversion is possible. For exam-ple, in the case of cement, the preferred unit ofmeasurement of production is in thousand tonnes.If a company provides data in terms of cementbags then these are converted into tonnes usingthe standard conversion of 50 kgs per cement bag.Such conversions are industry specific.
In spite of CMIE’s efforts, Prowess does containsome heterogeneity in units of measurement ofquantitative data because it is not possible to con-vert all data into standardised units.
Centre for Monitoring Indian Economy Prowess
Contents per Company 81
3.3.7 Normalisation and its discontents
Many analysts are instantly repulsed by their initial en-counter with the data in Prowess. The topline data oftendoes not match the numbers put out by the companies.This makes them understandably suspicious of the qual-ity of the data in Prowess. CMIE, however, believes thatthe numbers it puts out in Prowess are reliable and infact in many ways more useful than the numbers givenby the companies in their statements.
Topline numbers in Prowess, such as total income ortotal expenses or total borrowings in Prowess ofen tendvary a significantly compared to the numbers publishedby the companies in their statements. Interestingly, thesmaller details do not differ as much although even theydo sometimes.
What explains this lower differences at the level of thesmaller numbers and greater differences at the levelof the larger numbers. It is the classification used byCMIE.
CMIE does capture the information correctly from theoriginal source. For example, it may correctly capturethe value of “sale from scrap” from the Annual Report.But, the company may have classified this as “other in-come” and CMIE classifies this always under “sales”.As a result, while CMIE’s entries on “sale of scrap” willmatch, those on “sales” and “other income” will not.
Like there are differences in the topline values, thereare also differences that arise from the constituents ofthe uniquitous “other” entries. “Other income”, “Mis-cellaneous expenses”, “Other borrowings”, etc are con-textual entries in Annual Reports. CMIE’s normalisa-tion process posts the constituents of these into appro-priate individual heads. This almost always reduces theamount available in the “other” entries in Prowess com-pared to the original source. CMIE’s normalisation pro-cess minimises the amounts classified under the “other”entries because of the principle of maximising granular-ity.
Differences arise essentially because of the standard-ised classification system followed by CMIE.
Differences can also arise because of CMIE’s approachof maximising capture of information through greatergranularity. Typically, this leads to a mis-understandingof the following kind. The company may present its fi-nancial statements with “net sales” and may provide thevalue of “indirect taxes” in the notes to accounts or foot-notes. CMIE adds this to the sales and derives a grosssales figure with a corresponding entry on the expensesside. This “inflates” the income and expenses. But,this is done so as to draw in as much of information aspossible without materially changing the financial state-ments.
Prowess Centre for Monitoring Indian Economy
82 Contents per Company
3.4 CMIE classifications of companies
CMIE classifies companies in the Prowess database infour-and-half ways.
Each company is classified by its main economic activ-ity. This is its industry classification. Then, and thisis the half, it is also classified by industry groups. Thesecond is derived from the first, and it is a useful addi-tion.
The industry classification of companies is facilitated togreat extent by some excellent disclosure requirementsof companies in India. Section 3(i), (ii) and 4(D) ofPart II of Section VI of the Companies Act, 1956 man-dates that all companies disclose, in its Annual Reports,quantitative details of all products purchased, producedor traded by the company. This is the most important,but not the only source of information used by CMIE toclassify a company by its main economic activity.
CMIE has developed a products and services classifi-cation system to map the activities of companies to aclassification structure. The products segment of thisclassification is derived from the International TradeClassification. The services segment is patched fromother sources. Each product produced or traded by acompany and each service rendered is mapped to thisclassification. A company is classified as belonging toa particular industry, if the industry accounts for morethan half the sales of the company. For this purpose anindustry is any entry in the products and services clas-sification.
The industry group classification is a set of indsutrygroups derived from the above based on the concentra-tion of companies around a cluster of industries.
CMIE also classifies companies into ownership groups,size groups and age groups.
The classification structure for the ownership group istotally indigenous. There is little by way of precedent.Thus, CMIE has evolved its own structure of classifica-tion of ownership groups and business houses.
Listed companies are required to disclose the structureof ownership of their equity capital. CMIE uses thisand other sources of information to classify the com-pany into ownership groups.
CMIE divides companies into ten deciles by size withroughly equal number of companies in each decile. Acompany’s size is defined by its sales and assets in thelast three years. The size-wise distribution of compa-nies is based on the distribution of companies by size.This is therefore a relative classification. A companybelongs to a size group depending upon its place in theoverall distribution of the size of other companies.
The classification system for age is very different fromthe other three classifications. This one creates timeslots based on the economic policy environment in In-dia. For example, there is a pre-Independence era andthere is a post liberalisation era. Companies are thenslotted into these eras based on the year in which theywere incorporated. The year of incorporation is used asan indicator of the age of the company.
An important characteristic of all the classificationsmade by CMIE is that all of them are based on elementsthat are mutually exclusive and collectively exhaustive.Further, it is ensured that all companies in the Prowessdatabase are uniquely associated with exactly one entryin the classification system.
The four-and-half classification of companies describedbriefly here are not necessarily the only classificationsthat can be made. There are many more. The classi-fications made by CMIE are the most commonly used.Note that there are no official classification of compa-nies. The classification described here are constructs ofCMIE.
There is one classification that has its appeal but, isimpractical to implement. This is the classification ofcompanies by region – for example by State. A plantclearly has a geographical mapping. But, the companythat owns the plant may not. A company may havemany plants, offices, laboratories, etc strewn all overthe country or even the globe. It may have a regis-tered office in one part of the country but everythingelse including a head office in another part of the coun-try. Given this spread of the activities of a company, wehave not tried to classify companies by their geography.
Centre for Monitoring Indian Economy Prowess
83
Chapter 4
Indicators
Prowess Centre for Monitoring Indian Economy
Table of Contents i
Contents
Number of fields in Prowess . . . . . . . . . . . . . . . . . . . . . . . . . . . . .. . . . . . . . . . . . . . . . . . . . . . . . . . . . . . . . . . . . . . . . . . . . . . . . . . .. . . . . . . . . . . . . 1
1 Identity & Background 3The Company Identity database Tables . . . . . . . . . . . . . . . . . . .. . . . . . . . . . . . . . . . . . . . . . . . . . . . . . . . . . . . . . . . . . . . . . . . . . .. . . . . . . . . . . . . . . . . 4Identity Information of All Companies . . . . . . . . . . . . . . . . . .. . . . . . . . . . . . . . . . . . . . . . . . . . . . . . . . . . . . . . . . . . . . . . . . . . .. . . . . . . . . . . . . . . . . . 5Identity Information of Listed Companies . . . . . . . . . . . . . . .. . . . . . . . . . . . . . . . . . . . . . . . . . . . . . . . . . . . . . . . . . . . . . . . . . .. . . . . . . . . . . . . . . . . . . . 6Company Addresses . . . . . . . . . . . . . . . . . . . . . . . . . . . . . . . . . . .. . . . . . . . . . . . . . . . . . . . . . . . . . . . . . . . . . . . . . . . . . . . . . . . . . .. . . . . . . . . . . 7Company Alternate Names . . . . . . . . . . . . . . . . . . . . . . . . . . . . . .. . . . . . . . . . . . . . . . . . . . . . . . . . . . . . . . . . . . . . . . . . . . . . . . . . .. . . . . . . . . . . . 8Company Background . . . . . . . . . . . . . . . . . . . . . . . . . . . . . . . . . .. . . . . . . . . . . . . . . . . . . . . . . . . . . . . . . . . . . . . . . . . . . . . . . . . . .. . . . . . . . . . . 9
2 Ownership & Governance 11The Corporate Governance database Tables . . . . . . . . . . . . . . .. . . . . . . . . . . . . . . . . . . . . . . . . . . . . . . . . . . . . . . . . . . . . . . . . . .. . . . . . . . . . . . . . . . . . . 12Board of Directors . . . . . . . . . . . . . . . . . . . . . . . . . . . . . . . . . . .. . . . . . . . . . . . . . . . . . . . . . . . . . . . . . . . . . . . . . . . . . . . . . . . . . .. . . . . . . . . . . . 14Composition of Committee of the Board . . . . . . . . . . . . . . . . . . .. . . . . . . . . . . . . . . . . . . . . . . . . . . . . . . . . . . . . . . . . . . . . . . . . . .. . . . . . . . . . . . . . . . 15Board Meetings . . . . . . . . . . . . . . . . . . . . . . . . . . . . . . . . . . . . . .. . . . . . . . . . . . . . . . . . . . . . . . . . . . . . . . . . . . . . . . . . . . . . . . . . .. . . . . . . . . . 16Equity Ownership Pattern . . . . . . . . . . . . . . . . . . . . . . . . . . . . .. . . . . . . . . . . . . . . . . . . . . . . . . . . . . . . . . . . . . . . . . . . . . . . . . . .. . . . . . . . . . . . . . 17Equity Ownership of Major Investor . . . . . . . . . . . . . . . . . . . . .. . . . . . . . . . . . . . . . . . . . . . . . . . . . . . . . . . . . . . . . . . . . . . . . . . .. . . . . . . . . . . . . . . . 23Subsidiaries . . . . . . . . . . . . . . . . . . . . . . . . . . . . . . . . . . . . . . .. . . . . . . . . . . . . . . . . . . . . . . . . . . . . . . . . . . . . . . . . . . . . . . . . . .. . . . . . . . . . . 24Auditors . . . . . . . . . . . . . . . . . . . . . . . . . . . . . . . . . . . . . . . . . . .. . . . . . . . . . . . . . . . . . . . . . . . . . . . . . . . . . . . . . . . . . . . . . . . . . .. . . . . . . . . 25Related Party Transactions . . . . . . . . . . . . . . . . . . . . . . . . . . .. . . . . . . . . . . . . . . . . . . . . . . . . . . . . . . . . . . . . . . . . . . . . . . . . . .. . . . . . . . . . . . . . . 26Bankers . . . . . . . . . . . . . . . . . . . . . . . . . . . . . . . . . . . . . . . . . . . .. . . . . . . . . . . . . . . . . . . . . . . . . . . . . . . . . . . . . . . . . . . . . . . . . . .. . . . . . . . 27Bulk and Block Deals Executed on BSE . . . . . . . . . . . . . . . . . . . . .. . . . . . . . . . . . . . . . . . . . . . . . . . . . . . . . . . . . . . . . . . . . . . . . . . .. . . . . . . . . . . . . . 28Bulk and Block Deals Executed on NSE . . . . . . . . . . . . . . . . . . . . .. . . . . . . . . . . . . . . . . . . . . . . . . . . . . . . . . . . . . . . . . . . . . . . . . . .. . . . . . . . . . . . . . 29Insider Trading . . . . . . . . . . . . . . . . . . . . . . . . . . . . . . . . . . . . .. . . . . . . . . . . . . . . . . . . . . . . . . . . . . . . . . . . . . . . . . . . . . . . . . . .. . . . . . . . . . . 30
3 Financial Statements 31The Financial Statements Tables . . . . . . . . . . . . . . . . . . . . . . .. . . . . . . . . . . . . . . . . . . . . . . . . . . . . . . . . . . . . . . . . . . . . . . . . . .. . . . . . . . . . . . . . . . . 34Annual financial statement: Income . . . . . . . . . . . . . . . . . . . . .. . . . . . . . . . . . . . . . . . . . . . . . . . . . . . . . . . . . . . . . . . . . . . . . . . .. . . . . . . . . . . . . . . . . 36Annual financial statement: Change in Stocks . . . . . . . . . . . . .. . . . . . . . . . . . . . . . . . . . . . . . . . . . . . . . . . . . . . . . . . . . . . . . . . .. . . . . . . . . . . . . . . . . . . . 40Annual financial statement: Expenses . . . . . . . . . . . . . . . . . . .. . . . . . . . . . . . . . . . . . . . . . . . . . . . . . . . . . . . . . . . . . . . . . . . . . .. . . . . . . . . . . . . . . . . . 41
Indicators August 2010
ii Table of Contents
Annual financial statement: Derived Expenses Indicators . .. . . . . . . . . . . . . . . . . . . . . . . . . . . . . . . . . . . . . . . . . . . . . . . . . . .. . . . . . . . . . . . . . . . . . . . . . . . . 50Annual financial statement: Derived Expenses Indicators: Compensation to Employees . . . . . . . . . . . . . . . . . . . . . . . . . . . . .. . . . . . . . . . . . . . . . . . . . . . . . . . . . . . . . . 51Annual financial statement: Derived Expenses Indicators: Contribution to Exchequer . . . . . . . . . . . . . . . . . . . . . . . . . . . . .. . . . . . . . . . . . . . . . . . . . . . . . . . . . . . . . . . 52Annual financial statement: Distribution of Costs: Non-finance companies . . . . . . . . . . . . . . . . . . . . . . . . . . . . . . . . . . . . . . .. . . . . . . . . . . . . . . . . . . . . . . . . . . . . . 53Annual financial statement: Distribution of Costs: Financecompanies . . . . . . . . . . . . . . . . . . . . . . . . . . . . . . . . . . . . . . . . . .. . . . . . . . . . . . . . . . . . . . . . . . . . . . . 55Annual financial statement: Operating Costs as per cent of Sales . . . . . . . . . . . . . . . . . . . . . . . . . . . . . . . . . . . . . . . . . . . . . . . .. . . . . . . . . . . . . . . . . . . . . . . . . . 58Annual financial statement: Operating Costs as per cent of Income . . . . . . . . . . . . . . . . . . . . . . . . . . . . . . . . . . . . . . . . . . . . . . .. . . . . . . . . . . . . . . . . . . . . . . . . . 60Annual financial statement: Import Intensity of Raw Materials . . . . . . . . . . . . . . . . . . . . . . . . . . . . . . . . . . . . . . . . . . . . . . . . .. . . . . . . . . . . . . . . . . . . . . . . . . . 62Annual financial statement: Profits & Its Appropriation . . . .. . . . . . . . . . . . . . . . . . . . . . . . . . . . . . . . . . . . . . . . . . . . . . . . . . .. . . . . . . . . . . . . . . . . . . . . . . . 63Annual financial statement: Derived Measures of Profits . . . .. . . . . . . . . . . . . . . . . . . . . . . . . . . . . . . . . . . . . . . . . . . . . . . . . . .. . . . . . . . . . . . . . . . . . . . . . . 67Annual financial statement: Profitability Ratios . . . . . . . . .. . . . . . . . . . . . . . . . . . . . . . . . . . . . . . . . . . . . . . . . . . . . . . . . . . .. . . . . . . . . . . . . . . . . . . . . . . 69Annual financial statement: Liabilities . . . . . . . . . . . . . . . .. . . . . . . . . . . . . . . . . . . . . . . . . . . . . . . . . . . . . . . . . . . . . . . . . . .. . . . . . . . . . . . . . . . . . . . 74Annual financial statement: Derived Liabilities Indicators . . . . . . . . . . . . . . . . . . . . . . . . . . . . . . . . . . . . . . . . . . . . . . . . . .. . . . . . . . . . . . . . . . . . . . . . . . . . . 84Annual financial statement: Derived Liabilities Indicators: Shareholder’s Funds . . . . . . . . . . . . . . . . . . . . . . . . . . . . . . .. . . . . . . . . . . . . . . . . . . . . . . . . . . . . . . . . . . 86Annual financial statement: Derived Liabilities Indicators: Borrowings . . . . . . . . . . . . . . . . . . . . . . . . . . . . . . . . . . . . . . .. . . . . . . . . . . . . . . . . . . . . . . . . . . . . . . 87Annual financial statement: Derived Liabilities Indicators: Current Liabilities & Provisions . . . . . . . . . . . . . . . . . . . .. . . . . . . . . . . . . . . . . . . . . . . . . . . . . . . . . . . . . . . . 88Annual financial statement: Contingent Liabilities . . . . . .. . . . . . . . . . . . . . . . . . . . . . . . . . . . . . . . . . . . . . . . . . . . . . . . . . .. . . . . . . . . . . . . . . . . . . . . . . . 89Annual financial statement: Derived Contingent Liabilities Indicators . . . . . . . . . . . . . . . . . . . . . . . . . . . . . . . . . . . . . . . .. . . . . . . . . . . . . . . . . . . . . . . . . . . . . . . 91Annual financial statement: Liquidity, Working Cycle & Turnover Ratios . . . . . . . . . . . . . . . . . . . . . . . . . . . . . . . . . . . . . . . . .. . . . . . . . . . . . . . . . . . . . . . . . . . . . 92Annual financial statement: Assets . . . . . . . . . . . . . . . . . . . . .. . . . . . . . . . . . . . . . . . . . . . . . . . . . . . . . . . . . . . . . . . . . . . . . . . .. . . . . . . . . . . . . . . . . 96Annual financial statement: Derived Assets Indicators . . . .. . . . . . . . . . . . . . . . . . . . . . . . . . . . . . . . . . . . . . . . . . . . . . . . . . .. . . . . . . . . . . . . . . . . . . . . . . . 112Annual financial statement: Derived Assets Indicators: Fixed Assets . . . . . . . . . . . . . . . . . . . . . . . . . . . . . . . . . . . . . . . . . . .. . . . . . . . . . . . . . . . . . . . . . . . . . . . . 113Annual financial statement: Derived Assets Indicators: Investments . . . . . . . . . . . . . . . . . . . . . . . . . . . . . . . . . . . . . . . . . . .. . . . . . . . . . . . . . . . . . . . . . . . . . . . . 115Annual financial statement: Derived Assets Indicators: Current Assets & Loans and Advances . . . . . . . . . . . . . . . . . . . . . . . .. . . . . . . . . . . . . . . . . . . . . . . . . . . . . . . . . . 116Annual financial statement: Cash Flow . . . . . . . . . . . . . . . . . . .. . . . . . . . . . . . . . . . . . . . . . . . . . . . . . . . . . . . . . . . . . . . . . . . . . .. . . . . . . . . . . . . . . . . 117Annual financial statement: Derived Cash Flow Indicators . .. . . . . . . . . . . . . . . . . . . . . . . . . . . . . . . . . . . . . . . . . . . . . . . . . . .. . . . . . . . . . . . . . . . . . . . . . . . 119Annual financial statement: Sources & Uses of Funds . . . . . . . .. . . . . . . . . . . . . . . . . . . . . . . . . . . . . . . . . . . . . . . . . . . . . . . . . . .. . . . . . . . . . . . . . . . . . . . 125Annual financial statement: Structure of Funds Used . . . . . . .. . . . . . . . . . . . . . . . . . . . . . . . . . . . . . . . . . . . . . . . . . . . . . . . . . .. . . . . . . . . . . . . . . . . . . . . . 131Annual financial statement: Sources of Growth in Income . . . .. . . . . . . . . . . . . . . . . . . . . . . . . . . . . . . . . . . . . . . . . . . . . . . . . . .. . . . . . . . . . . . . . . . . . . . . . 162Annual financial statement: Sources of Growth in Profits: Non-finance companies . . . . . . . . . . . . . . . . . . . . . . . . . . . . . . . . . . .. . . . . . . . . . . . . . . . . . . . . . . . . . . . . . 165Annual financial statement: Sources of Growth in Profits: Finance companies . . . . . . . . . . . . . . . . . . . . . . . . . . . . . . . . . . . . . .. . . . . . . . . . . . . . . . . . . . . . . . . . . . . 168Annual financial statement: Foreign Exchange Transactions. . . . . . . . . . . . . . . . . . . . . . . . . . . . . . . . . . . . . . . . . . . . . . . . . . .. . . . . . . . . . . . . . . . . . . . . . . . . 171Annual financial statement: Derived Foreign Exchange Transactions Indicators . . . . . . . . . . . . . . . . . . . . . . . . . . . . . . . . . .. . . . . . . . . . . . . . . . . . . . . . . . . . . . . . . . 172Annual financial statement: Miscellaneous Disclosures . . .. . . . . . . . . . . . . . . . . . . . . . . . . . . . . . . . . . . . . . . . . . . . . . . . . . .. . . . . . . . . . . . . . . . . . . . . . . . . 173Annual financial statement: Statutory Disclosures by Banks. . . . . . . . . . . . . . . . . . . . . . . . . . . . . . . . . . . . . . . . . . . . . . . . . . .. . . . . . . . . . . . . . . . . . . . . . . . . 177Annual financial statement: Banking Disclosures Based on Basel II (Pillar 3) Norms . . . . . . . . . . . . . . . . . . . . . . . . . . . . . . . .. . . . . . . . . . . . . . . . . . . . . . . . . . . . . . . 184Annual financial statement: Capital Requirement for Risk Areas . . . . . . . . . . . . . . . . . . . . . . . . . . . . . . . . . . . . . . . . . . . . . . . .. . . . . . . . . . . . . . . . . . . . . . . . . . 193Annual financial statement: Disclosures by Housing Financeand NBFCs . . . . . . . . . . . . . . . . . . . . . . . . . . . . . . . . . . . . . . . . . . .. . . . . . . . . . . . . . . . . . . . . . . . . . 194Annual financial statement: Banking Maturity Pattern . . . . .. . . . . . . . . . . . . . . . . . . . . . . . . . . . . . . . . . . . . . . . . . . . . . . . . . .. . . . . . . . . . . . . . . . . . . . . . . 198Annual financial statement: Share Prices Ratios & Misc. Indicators . . . . . . . . . . . . . . . . . . . . . . . . . . . . . . . . . . . . . . . . . . . . .. . . . . . . . . . . . . . . . . . . . . . . . . . . 201Investments . . . . . . . . . . . . . . . . . . . . . . . . . . . . . . . . . . . . . . . .. . . . . . . . . . . . . . . . . . . . . . . . . . . . . . . . . . . . . . . . . . . . . . . . . . .. . . . . . . . . . 202Maturity of Deposits & Advances . . . . . . . . . . . . . . . . . . . . . . . .. . . . . . . . . . . . . . . . . . . . . . . . . . . . . . . . . . . . . . . . . . . . . . . . . . .. . . . . . . . . . . . . . . 203
August 2010 Indicators
Table of Contents iii
Interim Financial Statements . . . . . . . . . . . . . . . . . . . . . . . . .. . . . . . . . . . . . . . . . . . . . . . . . . . . . . . . . . . . . . . . . . . . . . . . . . . .. . . . . . . . . . . . . . . . 204Notes to Accounts of Interim Financial statements . . . . . . . .. . . . . . . . . . . . . . . . . . . . . . . . . . . . . . . . . . . . . . . . . . . . . . . . . . .. . . . . . . . . . . . . . . . . . . . . . 208Credit Ratings . . . . . . . . . . . . . . . . . . . . . . . . . . . . . . . . . . . . . .. . . . . . . . . . . . . . . . . . . . . . . . . . . . . . . . . . . . . . . . . . . . . . . . . . .. . . . . . . . . . . 209Effective Date for Financial Statements of Merged Companies . . . . . . . . . . . . . . . . . . . . . . . . . . . . . . . . . . . . . . . . . . . . . . . . . .. . . . . . . . . . . . . . . . . . . . . . . . . 210
4 Share Prices & Capital History 211Introducing the Share Prices & Capital History database . . .. . . . . . . . . . . . . . . . . . . . . . . . . . . . . . . . . . . . . . . . . . . . . . . . . . .. . . . . . . . . . . . . . . . . . . . . . . . 213BSE Stocks Trading Data . . . . . . . . . . . . . . . . . . . . . . . . . . . . . . .. . . . . . . . . . . . . . . . . . . . . . . . . . . . . . . . . . . . . . . . . . . . . . . . . . .. . . . . . . . . . . . 214NSE Stocks Trading Data . . . . . . . . . . . . . . . . . . . . . . . . . . . . . . .. . . . . . . . . . . . . . . . . . . . . . . . . . . . . . . . . . . . . . . . . . . . . . . . . . .. . . . . . . . . . . . 215Share Prices Adjustment Factors . . . . . . . . . . . . . . . . . . . . . . .. . . . . . . . . . . . . . . . . . . . . . . . . . . . . . . . . . . . . . . . . . . . . . . . . . .. . . . . . . . . . . . . . . . 216Outstanding Shares . . . . . . . . . . . . . . . . . . . . . . . . . . . . . . . . . .. . . . . . . . . . . . . . . . . . . . . . . . . . . . . . . . . . . . . . . . . . . . . . . . . . .. . . . . . . . . . . . 217EPS . . . . . . . . . . . . . . . . . . . . . . . . . . . . . . . . . . . . . . . . . . . . . . . .. . . . . . . . . . . . . . . . . . . . . . . . . . . . . . . . . . . . . . . . . . . . . . . . . . .. . . . . . 218Book Value . . . . . . . . . . . . . . . . . . . . . . . . . . . . . . . . . . . . . . . . . .. . . . . . . . . . . . . . . . . . . . . . . . . . . . . . . . . . . . . . . . . . . . . . . . . . .. . . . . . . . 219Dividend Declarations . . . . . . . . . . . . . . . . . . . . . . . . . . . . . . .. . . . . . . . . . . . . . . . . . . . . . . . . . . . . . . . . . . . . . . . . . . . . . . . . . .. . . . . . . . . . . . . . 220BSE Options Trading Data . . . . . . . . . . . . . . . . . . . . . . . . . . . . . .. . . . . . . . . . . . . . . . . . . . . . . . . . . . . . . . . . . . . . . . . . . . . . . . . . .. . . . . . . . . . . . 221NSE Options Trading Data . . . . . . . . . . . . . . . . . . . . . . . . . . . . . .. . . . . . . . . . . . . . . . . . . . . . . . . . . . . . . . . . . . . . . . . . . . . . . . . . .. . . . . . . . . . . . 222BSE Futures Trading Data . . . . . . . . . . . . . . . . . . . . . . . . . . . . . .. . . . . . . . . . . . . . . . . . . . . . . . . . . . . . . . . . . . . . . . . . . . . . . . . . .. . . . . . . . . . . . . 223NSE Futures Trading Data . . . . . . . . . . . . . . . . . . . . . . . . . . . . . .. . . . . . . . . . . . . . . . . . . . . . . . . . . . . . . . . . . . . . . . . . . . . . . . . . .. . . . . . . . . . . . . 224NSE Debt Trading Data . . . . . . . . . . . . . . . . . . . . . . . . . . . . . . . . .. . . . . . . . . . . . . . . . . . . . . . . . . . . . . . . . . . . . . . . . . . . . . . . . . . .. . . . . . . . . . . 225Announcements Made to Stock Exchanges and News By CMIE . . . . .. . . . . . . . . . . . . . . . . . . . . . . . . . . . . . . . . . . . . . . . . . . . . . . . . . .. . . . . . . . . . . . . . . . . . 226Forthcoming Capital Issues . . . . . . . . . . . . . . . . . . . . . . . . . . .. . . . . . . . . . . . . . . . . . . . . . . . . . . . . . . . . . . . . . . . . . . . . . . . . . .. . . . . . . . . . . . . . . 227ECB Approvals By RBI . . . . . . . . . . . . . . . . . . . . . . . . . . . . . . . . . .. . . . . . . . . . . . . . . . . . . . . . . . . . . . . . . . . . . . . . . . . . . . . . . . . . .. . . . . . . . . . 228Changes In Outstanding Equity Capital . . . . . . . . . . . . . . . . . .. . . . . . . . . . . . . . . . . . . . . . . . . . . . . . . . . . . . . . . . . . . . . . . . . . .. . . . . . . . . . . . . . . . . . 229Conversion Stages of Securities Issued . . . . . . . . . . . . . . . . .. . . . . . . . . . . . . . . . . . . . . . . . . . . . . . . . . . . . . . . . . . . . . . . . . . .. . . . . . . . . . . . . . . . . . . 230Investors In Capital Issues . . . . . . . . . . . . . . . . . . . . . . . . . . .. . . . . . . . . . . . . . . . . . . . . . . . . . . . . . . . . . . . . . . . . . . . . . . . . . .. . . . . . . . . . . . . . . . 231Identity Information on Indices . . . . . . . . . . . . . . . . . . . . . . .. . . . . . . . . . . . . . . . . . . . . . . . . . . . . . . . . . . . . . . . . . . . . . . . . . .. . . . . . . . . . . . . . . . . 232Index Constituents . . . . . . . . . . . . . . . . . . . . . . . . . . . . . . . . . .. . . . . . . . . . . . . . . . . . . . . . . . . . . . . . . . . . . . . . . . . . . . . . . . . . .. . . . . . . . . . . . . 233Changes In Index Constituents . . . . . . . . . . . . . . . . . . . . . . . . .. . . . . . . . . . . . . . . . . . . . . . . . . . . . . . . . . . . . . . . . . . . . . . . . . . .. . . . . . . . . . . . . . . 234Index Numbers . . . . . . . . . . . . . . . . . . . . . . . . . . . . . . . . . . . . . . .. . . . . . . . . . . . . . . . . . . . . . . . . . . . . . . . . . . . . . . . . . . . . . . . . . .. . . . . . . . . 235Company’s Listing on Stock Exchanges . . . . . . . . . . . . . . . . . . .. . . . . . . . . . . . . . . . . . . . . . . . . . . . . . . . . . . . . . . . . . . . . . . . . . .. . . . . . . . . . . . . . . . . 236Index Mapping for Companies . . . . . . . . . . . . . . . . . . . . . . . . . . .. . . . . . . . . . . . . . . . . . . . . . . . . . . . . . . . . . . . . . . . . . . . . . . . . . .. . . . . . . . . . . . . 237BSE & NSE Trading Dates . . . . . . . . . . . . . . . . . . . . . . . . . . . . . . . .. . . . . . . . . . . . . . . . . . . . . . . . . . . . . . . . . . . . . . . . . . . . . . . . . . .. . . . . . . . . . 238
5 Business Segments & Products 239Tables of Business Segments and Products database . . . . . . . .. . . . . . . . . . . . . . . . . . . . . . . . . . . . . . . . . . . . . . . . . . . . . . . . . . .. . . . . . . . . . . . . . . . . . . . . 240Location of Plants . . . . . . . . . . . . . . . . . . . . . . . . . . . . . . . . . . .. . . . . . . . . . . . . . . . . . . . . . . . . . . . . . . . . . . . . . . . . . . . . . . . . . .. . . . . . . . . . . . 241Business Segment-wise Information . . . . . . . . . . . . . . . . . . . .. . . . . . . . . . . . . . . . . . . . . . . . . . . . . . . . . . . . . . . . . . . . . . . . . . .. . . . . . . . . . . . . . . . . . 242Products Produced / Traded . . . . . . . . . . . . . . . . . . . . . . . . . . . .. . . . . . . . . . . . . . . . . . . . . . . . . . . . . . . . . . . . . . . . . . . . . . . . . . .. . . . . . . . . . . . . . 243Raw Materials Consumed . . . . . . . . . . . . . . . . . . . . . . . . . . . . . . .. . . . . . . . . . . . . . . . . . . . . . . . . . . . . . . . . . . . . . . . . . . . . . . . . . .. . . . . . . . . . . . 244Energy Consumption . . . . . . . . . . . . . . . . . . . . . . . . . . . . . . . . . .. . . . . . . . . . . . . . . . . . . . . . . . . . . . . . . . . . . . . . . . . . . . . . . . . . .. . . . . . . . . . . 245Product-wise Energy Consumption . . . . . . . . . . . . . . . . . . . . . .. . . . . . . . . . . . . . . . . . . . . . . . . . . . . . . . . . . . . . . . . . . . . . . . . . .. . . . . . . . . . . . . . . . 246
6 Capex / M & A 247
Indicators August 2010
iv
The CapEx and M&A Tables in the database . . . . . . . . . . . . . . . . . .. . . . . . . . . . . . . . . . . . . . . . . . . . . . . . . . . . . . . . . . . . . . . . . . . . .. . . . . . . . . . . . . . . 248Capital Expenditure Projects . . . . . . . . . . . . . . . . . . . . . . . . .. . . . . . . . . . . . . . . . . . . . . . . . . . . . . . . . . . . . . . . . . . . . . . . . . . .. . . . . . . . . . . . . . . . 249Project Locations . . . . . . . . . . . . . . . . . . . . . . . . . . . . . . . . . . .. . . . . . . . . . . . . . . . . . . . . . . . . . . . . . . . . . . . . . . . . . . . . . . . . . .. . . . . . . . . . . . 250Project Products . . . . . . . . . . . . . . . . . . . . . . . . . . . . . . . . . . . .. . . . . . . . . . . . . . . . . . . . . . . . . . . . . . . . . . . . . . . . . . . . . . . . . . .. . . . . . . . . . . . 251Merger and Acquisition . . . . . . . . . . . . . . . . . . . . . . . . . . . . . . .. . . . . . . . . . . . . . . . . . . . . . . . . . . . . . . . . . . . . . . . . . . . . . . . . . .. . . . . . . . . . . . . 252Events of Merger and Acquisitions . . . . . . . . . . . . . . . . . . . . . .. . . . . . . . . . . . . . . . . . . . . . . . . . . . . . . . . . . . . . . . . . . . . . . . . . .. . . . . . . . . . . . . . . . 254
7 Masters information 255Masters information . . . . . . . . . . . . . . . . . . . . . . . . . . . . . . . . .. . . . . . . . . . . . . . . . . . . . . . . . . . . . . . . . . . . . . . . . . . . . . . . . . . .. . . . . . . . . . . . . 256CMIE Industry Classification Master . . . . . . . . . . . . . . . . . . . .. . . . . . . . . . . . . . . . . . . . . . . . . . . . . . . . . . . . . . . . . . . . . . . . . . .. . . . . . . . . . . . . . . . . 257Industry Aliases . . . . . . . . . . . . . . . . . . . . . . . . . . . . . . . . . . . .. . . . . . . . . . . . . . . . . . . . . . . . . . . . . . . . . . . . . . . . . . . . . . . . . . .. . . . . . . . . . . . 258CMIE Ownership Classificaiton Master . . . . . . . . . . . . . . . . . . .. . . . . . . . . . . . . . . . . . . . . . . . . . . . . . . . . . . . . . . . . . . . . . . . . . .. . . . . . . . . . . . . . . . . 259CMIE District Master . . . . . . . . . . . . . . . . . . . . . . . . . . . . . . . . .. . . . . . . . . . . . . . . . . . . . . . . . . . . . . . . . . . . . . . . . . . . . . . . . . . .. . . . . . . . . . . . 260CMIE Company Sets Master . . . . . . . . . . . . . . . . . . . . . . . . . . . . . .. . . . . . . . . . . . . . . . . . . . . . . . . . . . . . . . . . . . . . . . . . . . . . . . . . .. . . . . . . . . . . 261NIC Master . . . . . . . . . . . . . . . . . . . . . . . . . . . . . . . . . . . . . . . . . .. . . . . . . . . . . . . . . . . . . . . . . . . . . . . . . . . . . . . . . . . . . . . . . . . . .. . . . . . . . 262
8 Functions 263
August 2010 Indicators
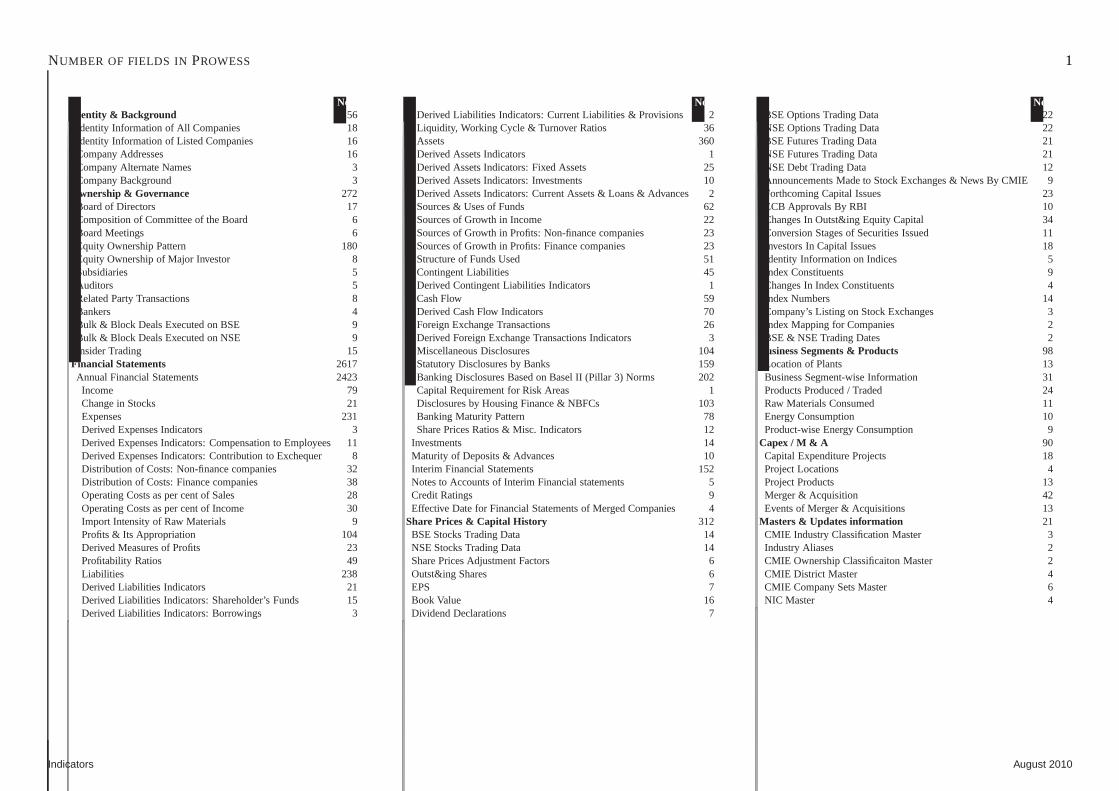
NUMBER OF FIELDS IN PROWESS 1
Table Name Nos.Identity & Background 56Identity Information of All Companies 18Identity Information of Listed Companies 16Company Addresses 16Company Alternate Names 3Company Background 3
Ownership & Governance 272Board of Directors 17Composition of Committee of the Board 6Board Meetings 6Equity Ownership Pattern 180Equity Ownership of Major Investor 8Subsidiaries 5Auditors 5Related Party Transactions 8Bankers 4Bulk & Block Deals Executed on BSE 9Bulk & Block Deals Executed on NSE 9Insider Trading 15
Financial Statements 2617Annual Financial Statements 2423Income 79Change in Stocks 21Expenses 231Derived Expenses Indicators 3Derived Expenses Indicators: Compensation to Employees 11Derived Expenses Indicators: Contribution to Exchequer 8Distribution of Costs: Non-finance companies 32Distribution of Costs: Finance companies 38Operating Costs as per cent of Sales 28Operating Costs as per cent of Income 30Import Intensity of Raw Materials 9Profits & Its Appropriation 104Derived Measures of Profits 23Profitability Ratios 49Liabilities 238Derived Liabilities Indicators 21Derived Liabilities Indicators: Shareholder’s Funds 15Derived Liabilities Indicators: Borrowings 3
Table Name Nos.Derived Liabilities Indicators: Current Liabilities & Provisions 2Liquidity, Working Cycle & Turnover Ratios 36Assets 360Derived Assets Indicators 1Derived Assets Indicators: Fixed Assets 25Derived Assets Indicators: Investments 10Derived Assets Indicators: Current Assets & Loans & Advances 2Sources & Uses of Funds 62Sources of Growth in Income 22Sources of Growth in Profits: Non-finance companies 23Sources of Growth in Profits: Finance companies 23Structure of Funds Used 51Contingent Liabilities 45Derived Contingent Liabilities Indicators 1Cash Flow 59Derived Cash Flow Indicators 70Foreign Exchange Transactions 26Derived Foreign Exchange Transactions Indicators 3Miscellaneous Disclosures 104Statutory Disclosures by Banks 159Banking Disclosures Based on Basel II (Pillar 3) Norms 202Capital Requirement for Risk Areas 1Disclosures by Housing Finance & NBFCs 103Banking Maturity Pattern 78Share Prices Ratios & Misc. Indicators 12
Investments 14Maturity of Deposits & Advances 10Interim Financial Statements 152Notes to Accounts of Interim Financial statements 5Credit Ratings 9Effective Date for Financial Statements of Merged Companies 4
Share Prices & Capital History 312BSE Stocks Trading Data 14NSE Stocks Trading Data 14Share Prices Adjustment Factors 6Outst&ing Shares 6EPS 7Book Value 16Dividend Declarations 7
Table Name Nos.BSE Options Trading Data 22NSE Options Trading Data 22BSE Futures Trading Data 21NSE Futures Trading Data 21NSE Debt Trading Data 12Announcements Made to Stock Exchanges & News By CMIE 9Forthcoming Capital Issues 23ECB Approvals By RBI 10Changes In Outst&ing Equity Capital 34Conversion Stages of Securities Issued 11Investors In Capital Issues 18Identity Information on Indices 5Index Constituents 9Changes In Index Constituents 4Index Numbers 14Company’s Listing on Stock Exchanges 3Index Mapping for Companies 2BSE & NSE Trading Dates 2
Business Segments & Products 98Location of Plants 13Business Segment-wise Information 31Products Produced / Traded 24Raw Materials Consumed 11Energy Consumption 10Product-wise Energy Consumption 9
Capex / M & A 90Capital Expenditure Projects 18Project Locations 4Project Products 13Merger & Acquisition 42Events of Merger & Acquisitions 13
Masters & Updates information 21CMIE Industry Classification Master 3Industry Aliases 2CMIE Ownership Classificaiton Master 2CMIE District Master 4CMIE Company Sets Master 6NIC Master 4
Indicators August 2010

2
August 2010 Indicators
3
Chapter 1
Identity & Background
ContentsThe Company Identity database Tables . . . . . . . . . . . . . . . . . . .. . . . . . . . . . . . . . . . . . . . . . . . . . . . . . . . . . . . . . . . . . . . . . . . . . 4
Identity Information of All Companies . . . . . . . . . . . . . . . . . . . . . . . . . . . . . . . . . . . . . . . . . . . . . . . . . . . . . . . . . . . . . . . . . . . . .. 5
Identity Information of Listed Companies . . . . . . . . . . . . . . . . . . . . . . . . . . . . . . . . . . . . . . . . . . . . . . . . . . . . . . . . . . . . . . . . . .. . 6
Company Addresses . . . . . . . . . . . . . . . . . . . . . . . . . . . . . . . . . . .. . . . . . . . . . . . . . . . . . . . . . . . . . . . . . . . . . . . . . . . . . . . . 7
Company Alternate Names . . . . . . . . . . . . . . . . . . . . . . . . . . . . . .. . . . . . . . . . . . . . . . . . . . . . . . . . . . . . . . . . . . . . . . . . . . . . 8
Company Background . . . . . . . . . . . . . . . . . . . . . . . . . . . . . . . . . .. . . . . . . . . . . . . . . . . . . . . . . . . . . . . . . . . . . . . . . . . . . . . 9
Indicators August 2010
4
The Company Identity database Tables
In this section of the database we establish the identity of each of the entities in Prowess.A company’s identity is best established by its name. All registered companies are re-quired to have unique names. These unique names are the most intuitive way to identifya business entity. Prowess addresses each company by a unique name.
But, Prowess is more than a database of only registered companies. It includes manyother kinds of business entities. We therefore classify business entities by type, such as,a company, a co-operative, a statutory body, etc.
Every entity in Prowess is identified by a unique official namein the database. Theofficial name is spelt as per a methodology laid down by CMIE. Further, every businessentity is identified by a unique code called the ”Prowess Company Code”. This fieldis in all Tables of the database. The “Prowess Company Code” links the informationrelating to a company in the various Tables in the database.
The Table: “Identity Information of All Companies” contains the official name of thecompany, its short name and its various classifications. These classification are basedon entity typle, industry tyle, ownership type, age-group and size-group. These classi-fications are based on methodologies developed by CMIE. All the information in thisTable is as of the latest status. There is no time-dimension in this data.
Some indentity related information is applicable to only listed companies. Listed com-panies account for only about a quarter of the entire database. As a result, for the sakeof efficiency, identity related information that is specificto listed companies is capturedin a separate Table: “Identity Information on Listed Companies”. This contains data
on the BSE codes, demat codes, short names, etc. It also contains the alpha and betameasures of the returns on the share prices of companies. Allthe information in thisTable is as of the latest status. There is no time-dimestion.
Every company has a unique registered office. But, some companies have a (effectivelymore important) head office elsewhere. For example, the registered office of Axis Bankis in Vadodara, but its Head Office in in Mumbai. Large companies have importantregional offices. The Prowess database captures several important addresses of compa-nies, their telephone and fax numbers and the website url. Each address is a separaterecord in the Table: ”Company Addresses”. However, Prowessis no substitute for atelephone directory. It is not designed to be a mass mailer database, although it is of-ten used successfully like one. There is no time-dimension –there is no record of thechanges in the addresses of companies.
Often, a company is better recognised by its popular name andnot by its unique officialname. Thus, the company identity part of the database contains several popular alternatenames of companies linked to the unique “Prowess Company Code”. These are storedin the Table “Company Alternate Names”. There is nothing official about the variousnames in this Table. The names include old names (after a company changes its name),acronyms or popular shortforms. The official ticker names and codes are stored in theTable “Identity Information on Listed Companies”.
Prowess also contains brief background note on the company.Such a note is availablefor the larger companies. There is brief background note anda slightly longer back-ground note. There is only one of each. These are stored in “Company Background”.
August 2010 Indicators

IDENTITY INFORMATION OF ALL COMPANIES 5
Sr.No. Indicator Fields & formula1 Prowess company code = co code2 Name = companyname3 Short name = shortname4 MCA’s CIN code = cin code5 ISIN code = isin codeequity6 State code = statecode7 ROC registration number = registrationno8 Entity type = entity type code9 Ownership code = ownercode10 Industry type = co industry type11 Main activity code = co industry code12 Industry code = co industry gp code13 NIC code = co nic code14 Incorporation year = incorporationyear15 Age code by year of incorporation = agecode16 Size code by deciles = decilesize17 Registrar’s name = registrarname
Indicators August 2010
6 IDENTITY INFORMATION OF L ISTED COMPANIES
Sr.No. Indicator Fields & formula1 Prowess company code = cobkstkcocode2 NSE code = nsecode3 BSE demat code = bsedematcode4 BSE code = bsecode5 BSE short name = bsealias6 BSE group = bselisting flag7 First trading date on NSE = nsefirst tradeddate8 Date of suspension on NSE = nsesuspendedfrom date9 Date of end of suspension on NSE = nsesuspendedto date10 Delisting date on NSE = nsedelist date11 First trading date on BSE = bsefirst tradeddate12 Date of suspension on BSE = bsesuspendedfrom date13 Date of end of suspension on BSE = bsesuspendedto date14 Delisting date on BSE = bsedelist date15 Measurement of Alpha = co alpha16 Measurement of Beta = co beta
August 2010 Indicators

COMPANY ADDRESSES 7
Sr.No. Indicator Fields & formula1 Prowess company code = coaddrcocode2 Address type = coaddraddresstype3 Address part 1 = address14 Address part 2 = address25 Address part 3 = address36 City = cityname7 State = statename8 Pincode = pincode9 Email ID = email id10 Website address = web site11 ISD code for telephone number = tel isd12 STD code for telephone number = tel std13 Telephone number = tel no14 ISD code for Fax number = fax isd15 STD code for Fax number = fax std16 Fax number = fax no
Indicators August 2010

8 COMPANY ALTERNATE NAMES
Sr.No. Indicator Fields & formula1 Prowess company code = alliasescocode2 Company alias/id type = alliasescoid type3 Alternate name = aliasname
August 2010 Indicators

COMPANY BACKGROUND 9
Sr.No. Indicator Fields & formula1 Prowess company code = cobktxt cocode2 Background text = backgroundtext3 Brief business = backgroundshort text
Indicators August 2010
10
August 2010 Indicators

11
Chapter 2
Ownership & Governance
ContentsThe Corporate Governance database Tables . . . . . . . . . . . . . . .. . . . . . . . . . . . . . . . . . . . . . . . . . . . . . . . . . . . . . . . . . . . . . . . . . .12
Board of Directors . . . . . . . . . . . . . . . . . . . . . . . . . . . . . . . . . . .. . . . . . . . . . . . . . . . . . . . . . . . . . . . . . . . . . . . . . . . . . . . . . 14
Composition of Committee of the Board . . . . . . . . . . . . . . . . . . .. . . . . . . . . . . . . . . . . . . . . . . . . . . . . . . . . . . . . . . . . . . . . . . . . . 15
Board Meetings . . . . . . . . . . . . . . . . . . . . . . . . . . . . . . . . . . . . . .. . . . . . . . . . . . . . . . . . . . . . . . . . . . . . . . . . . . . . . . . . . . 16
Equity Ownership Pattern . . . . . . . . . . . . . . . . . . . . . . . . . . . . .. . . . . . . . . . . . . . . . . . . . . . . . . . . . . . . . . . . . . . . . . . . . . . . 17
Equity Ownership of Major Investor . . . . . . . . . . . . . . . . . . . . . . . . . . . . . . . . . . . . . . . . . . . . . . . . . . . . . . . . . . . . . . . . . . . . . . . 23
Subsidiaries . . . . . . . . . . . . . . . . . . . . . . . . . . . . . . . . . . . . . . .. . . . . . . . . . . . . . . . . . . . . . . . . . . . . . . . . . . . . . . . . . . . . . 24
Auditors . . . . . . . . . . . . . . . . . . . . . . . . . . . . . . . . . . . . . . . . . . .. . . . . . . . . . . . . . . . . . . . . . . . . . . . . . . . . . . . . . . . . . . . 25
Related Party Transactions . . . . . . . . . . . . . . . . . . . . . . . . . . .. . . . . . . . . . . . . . . . . . . . . . . . . . . . . . . . . . . . . . . . . . . . . . . . . 26
Bankers . . . . . . . . . . . . . . . . . . . . . . . . . . . . . . . . . . . . . . . . . . . .. . . . . . . . . . . . . . . . . . . . . . . . . . . . . . . . . . . . . . . . . . . 27
Bulk and Block Deals Executed on BSE . . . . . . . . . . . . . . . . . . . . .. . . . . . . . . . . . . . . . . . . . . . . . . . . . . . . . . . . . . . . . . . . . . . . . 28
Bulk and Block Deals Executed on NSE . . . . . . . . . . . . . . . . . . . . .. . . . . . . . . . . . . . . . . . . . . . . . . . . . . . . . . . . . . . . . . . . . . . . . 29
Insider Trading . . . . . . . . . . . . . . . . . . . . . . . . . . . . . . . . . . . . .. . . . . . . . . . . . . . . . . . . . . . . . . . . . . . . . . . . . . . . . . . . . . . 30
Indicators August 2010
12
The Corporate Governance database Tables
Corporate governance related information is available mostly for listed companies.SEBI regulations stipulate (in Clause 49 of the Listing Agreement) the compositionof the Board of Directors, the Audit Committee of the Board, compensation of non-executive directors, remuneration of directors, code of conduct and disclosure require-ments including those with related parties, and a management discussion and analysis.
A lot of this information is published by the companies in their Annual Reports and itis duly captured in the Prowess database.
Names of the Board of Directors, their designation and theirremuneration is capturedin the Table “Board of Directors”. Such information is available as of the date of theAnnual Report of the company.
Clause 49 stipulates the composition of the Board of Directors of listed companies interms of independent and non-executive directors. However, companies do not clearlyor consistently classify directors into such a classification. CMIE uses the availableinformation (essentially the officially stated designation) and classifies directors into in-dependent or non-independent and executive or non-executive. Such a classification isdone by CMIE and not by the company. Such information is provided in the “Board ofDirectors” Table.
Prowess provides a history of the membership of the members of the Board of Direc-tors, in the various committees of the Board and their attendance on each of these. Theseare snapshots in time, as of the date of the balance sheet. Thehistory is relatively re-cent since disclosures have improved only in the past few years. This information ispresented in the Table: “Board of Directors Committees”.
Changes announced in the composition of the Board of Directors after the last AnnualReport was published are not included in the database. Sometimes, when changes in theBoard of Directors are made public through an announcement,the Prowess databasecaptures this as a news item. However, since such announcements do not assure us ofyielding a complete picture of the composition of the Board of Directors, we do notinclude them into the database of Board of Directors.
The Prowess database can be seen as one of several time-series. The composition ofthe Board of Directors is also seen as a set of time-series. Inconstructing such a time-series, we face a problem in the heterogenity of names of directors. Companies do notensure that all members of the Board of Directors are spelt inthe same manner for theirentire tenure. At times, CMIE does edit the names to ensure that the names are splet ina consistent manner over time and possibly also across companies. Thus, the Prowessdatabase contains a master of names of Board of Directors. But, this is far from perfectbecause beyond a point we cannot change the spelling of names.
Major stock exchanges provide very useful information on the ownership pattern of theequity capital of listed companies. This is a structured presentation that divides theownership between promoters and non-promoters. Promotersinclude Indian and for-eign promoters; and non-promoters include institutions like FIIs and mutual funds andnon-institutions like companies and individuals. Stock exchanges make available dataon the ownership of equity shares, the proportion of which isdematerialised and also theprorportion that is pledged. Disclosures regarding pledged shares is a relatively recentphenomenon. Such data is captured in the Table: “Equity Ownership Pattern”.
The stock exchanges also provide details of the ownership ofshares by the promotersand others who own more than one per cent of the outstanding capital. Such data iscaptured separately in the Table: “Equity Ownership of Major Investors”.
Data on the ownership of equity shaers is available on a quarterly basis from the stockexchanges. Sometimes, such information is also available from other sources on an adhoc basis. We do not include such ad hoc data into the database.
The quarter-by-quarter changes in the structure of ownership, and the changes in theownership of the major share owners provide a useful insightinto the actions of themajor stake holders. A part of the day-to-day changes in suchownership is seen in thebulk and block deals on the Exchanges. The Exchanges providedetails of such dealsexecuted on a daily basis. Bulk deals are those that involvedmore than half per centof the equity capital of a company in a single transaction. Block deals are those thatinvolved more than five hundred thousand shares or more than Rs.5 crore in value. Suchinformation is covered separately in Prowess in Tables relating to bulk and block deals
August 2010 Indicators

13
executed on the two exchanges. Further, all transactions made by the promoters and di-rectors of a company are reported by the Exchanges and these are captured in the Table:“Insider Trading”.
The list of subidiaries as of the end of each accounting period is provided in a separateTable: “Subsidiaries”. The name of the statutory auditing firm and that of the part-ner who signs the financial statements of the company is captured in a separate Table:“Auditors”. Capture of the name of the partner is a recent phenomenon.
Companies are required to disclose in their Annual Reports,details of the transactionsthey have with related parties during an accounting period.Related parties are sub-sidiaries, parties where control exists, holding companies, key personnel and their rel-atives. Prowess captures this information in a separate table: “Related Party Transac-tions”. The transactions include income from related parties, payments to them, capitalreceipts or capital payments and also outstanding assets and liabilities with them.
Indicators August 2010
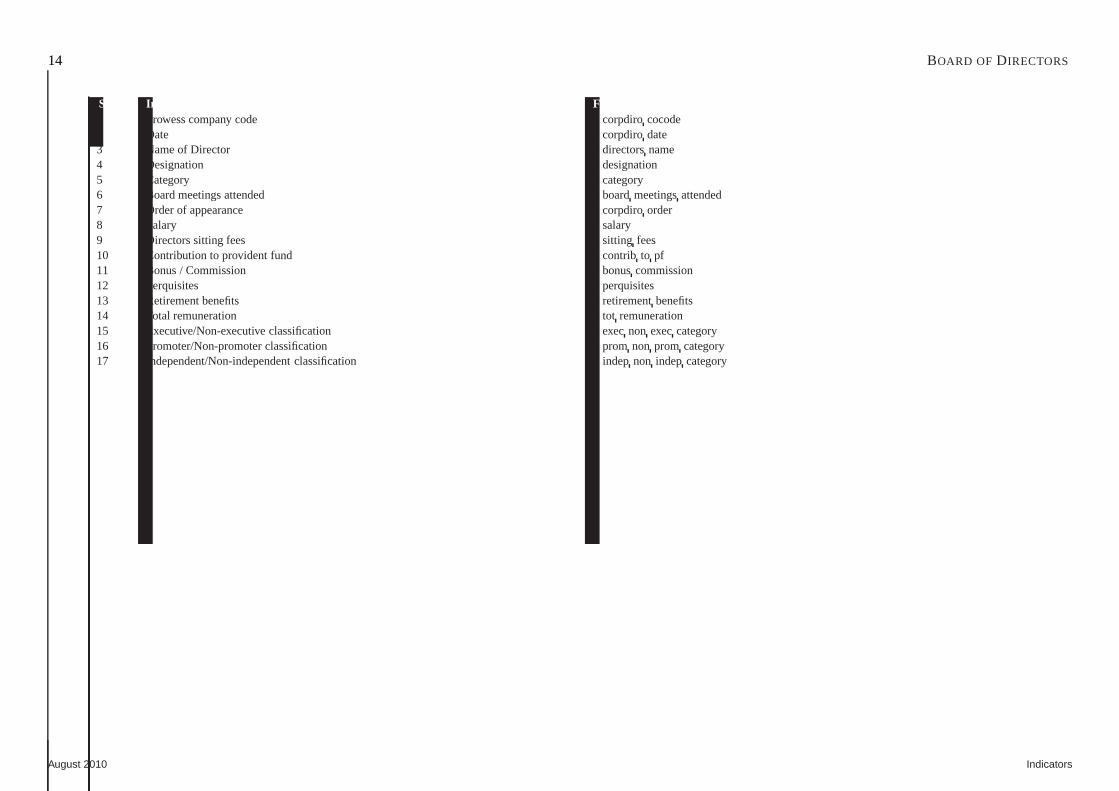
14 BOARD OF DIRECTORS
Sr.No. Indicator Fields & formula1 Prowess company code = corpdirococode2 Date = corpdirodate3 Name of Director = directorsname4 Designation = designation5 Category = category6 Board meetings attended = boardmeetingsattended7 Order of appearance = corpdiroorder8 Salary = salary9 Directors sitting fees = sitting fees10 Contribution to provident fund = contrib to pf11 Bonus / Commission = bonuscommission12 Perquisites = perquisites13 Retirement benefits = retirementbenefits14 Total remuneration = tot remuneration15 Executive/Non-executive classification = execnon execcategory16 Promoter/Non-promoter classification = prom non prom category17 Independent/Non-independent classification = indepnon indep category
August 2010 Indicators

COMPOSITION OFCOMMITTEE OF THE BOARD 15
Sr.No. Indicator Fields & formula1 Prowess company code = dirocomit cocode2 Date = dirocomit date3 Name of director = dirocomit directorname4 Commitee name = committeename5 Designation in committee = desigin committee6 Number of meetings attended = meetingsattended
Indicators August 2010

16 BOARD MEETINGS
Sr.No. Indicator Fields & formula1 Prowess company code = boardmtcocode2 Date = bm date3 Abbreviated purpose = bm abbv purpose4 Purpose of meeting = bm purpose5 Announcement date = bm announcementdate6 Exchange name = bm announcementexch
August 2010 Indicators
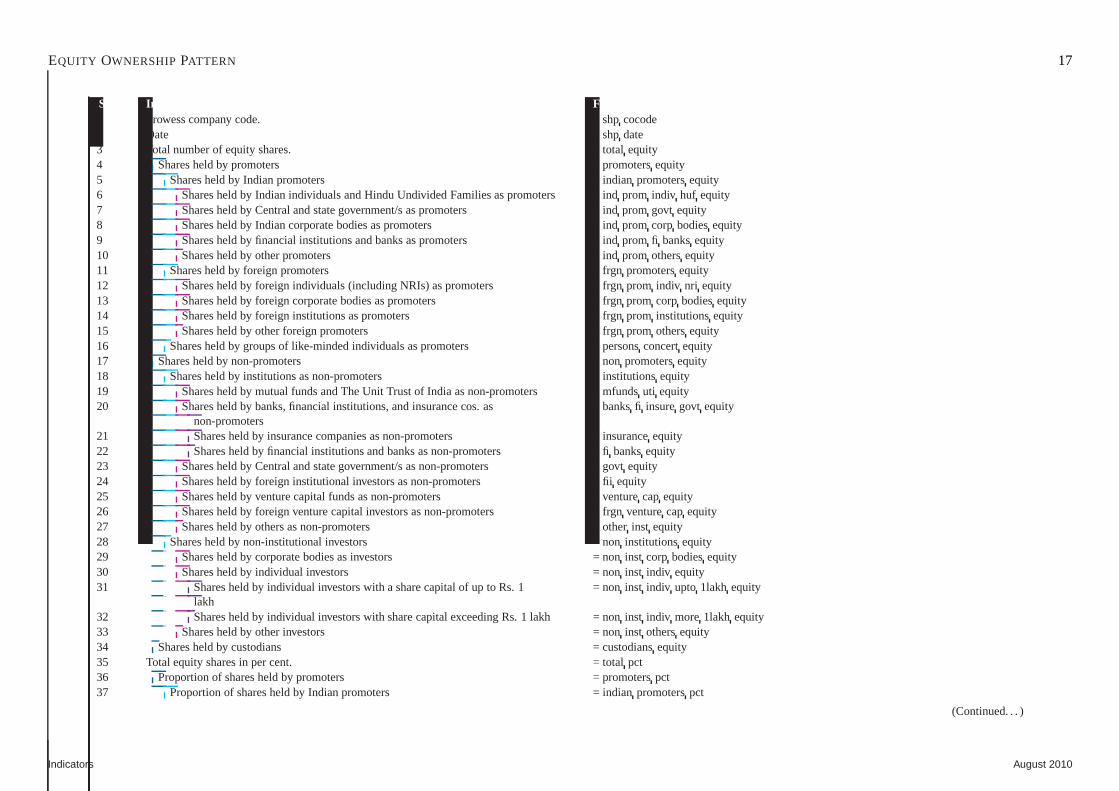
EQUITY OWNERSHIPPATTERN 17
Sr.No. Indicator Fields & formula1 Prowess company code. = shpcocode2 Date = shpdate3 Total number of equity shares. = total equity4 Shares held by promoters = promotersequity5 Shares held by Indian promoters = indian promotersequity6 Shares held by Indian individuals and Hindu Undivided Families as promoters = indprom indiv huf equity7 Shares held by Central and state government/s as promoters =ind prom govt equity8 Shares held by Indian corporate bodies as promoters = indprom corp bodiesequity9 Shares held by financial institutions and banks as promoters = ind prom fi banksequity10 Shares held by other promoters = ind prom othersequity11 Shares held by foreign promoters = frgn promotersequity12 Shares held by foreign individuals (including NRIs) as promoters = frgnprom indiv nri equity13 Shares held by foreign corporate bodies as promoters = frgnprom corp bodiesequity14 Shares held by foreign institutions as promoters = frgnprom institutionsequity15 Shares held by other foreign promoters = frgn prom othersequity16 Shares held by groups of like-minded individuals as promoters = personsconcertequity17 Shares held by non-promoters = non promotersequity18 Shares held by institutions as non-promoters = institutionsequity19 Shares held by mutual funds and The Unit Trust of India as non-promoters = mfundsuti equity20 Shares held by banks, financial institutions, and insurancecos. as = banksfi insuregovt equity
non-promoters21 Shares held by insurance companies as non-promoters = insuranceequity22 Shares held by financial institutions and banks as non-promoters = fi banksequity23 Shares held by Central and state government/s as non-promoters = govtequity24 Shares held by foreign institutional investors as non-promoters = fii equity25 Shares held by venture capital funds as non-promoters = venture cap equity26 Shares held by foreign venture capital investors as non-promoters = frgnventurecap equity27 Shares held by others as non-promoters = other inst equity28 Shares held by non-institutional investors = non institutionsequity29 Shares held by corporate bodies as investors = non inst corp bodiesequity30 Shares held by individual investors = non inst indiv equity31 Shares held by individual investors with a share capital of up to Rs. 1 = noninst indiv upto 1lakh equity
lakh32 Shares held by individual investors with share capital exceeding Rs. 1 lakh = noninst indiv more1lakh equity33 Shares held by other investors = non inst othersequity34 Shares held by custodians = custodiansequity35 Total equity shares in per cent. = total pct36 Proportion of shares held by promoters = promoterspct37 Proportion of shares held by Indian promoters = indian promoterspct
(Continued. . . )
Indicators August 2010
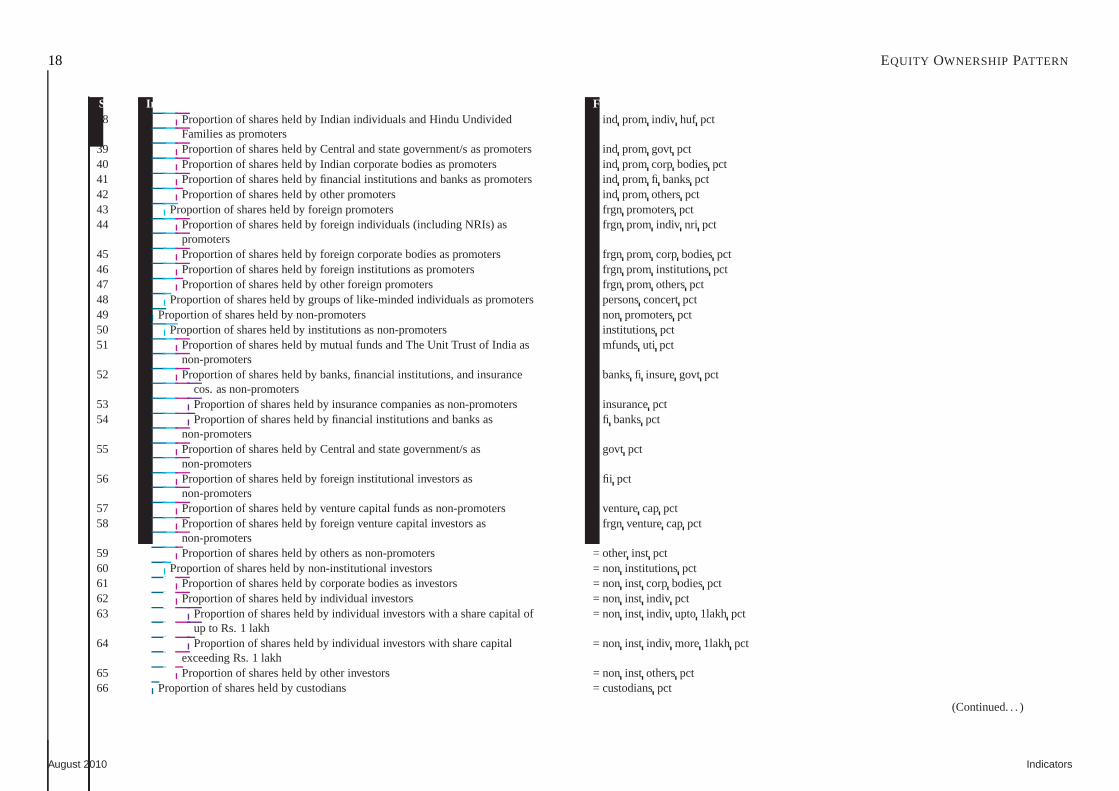
18 EQUITY OWNERSHIPPATTERN
Sr.No. Indicator Fields & formula38 Proportion of shares held by Indian individuals and Hindu Undivided = indprom indiv huf pct
Families as promoters39 Proportion of shares held by Central and state government/sas promoters = indprom govt pct40 Proportion of shares held by Indian corporate bodies as promoters = indprom corp bodiespct41 Proportion of shares held by financial institutions and banks as promoters = indprom fi bankspct42 Proportion of shares held by other promoters = ind prom otherspct43 Proportion of shares held by foreign promoters = frgn promoterspct44 Proportion of shares held by foreign individuals (including NRIs) as = frgnprom indiv nri pct
promoters45 Proportion of shares held by foreign corporate bodies as promoters = frgnprom corp bodiespct46 Proportion of shares held by foreign institutions as promoters = frgnprom institutionspct47 Proportion of shares held by other foreign promoters = frgnprom otherspct48 Proportion of shares held by groups of like-minded individuals as promoters = personsconcertpct49 Proportion of shares held by non-promoters = non promoterspct50 Proportion of shares held by institutions as non-promoters = institutionspct51 Proportion of shares held by mutual funds and The Unit Trust of India as = mfundsuti pct
non-promoters52 Proportion of shares held by banks, financial institutions,and insurance = banksfi insuregovt pct
cos. as non-promoters53 Proportion of shares held by insurance companies as non-promoters = insurancepct54 Proportion of shares held by financial institutions and banks as = fibankspct
non-promoters55 Proportion of shares held by Central and state government/sas = govtpct
non-promoters56 Proportion of shares held by foreign institutional investors as = fiipct
non-promoters57 Proportion of shares held by venture capital funds as non-promoters = venturecap pct58 Proportion of shares held by foreign venture capital investors as = frgnventurecap pct
non-promoters59 Proportion of shares held by others as non-promoters = otherinst pct60 Proportion of shares held by non-institutional investors =non institutionspct61 Proportion of shares held by corporate bodies as investors =non inst corp bodiespct62 Proportion of shares held by individual investors = noninst indiv pct63 Proportion of shares held by individual investors with a share capital of = noninst indiv upto 1lakh pct
up to Rs. 1 lakh64 Proportion of shares held by individual investors with share capital = noninst indiv more1lakh pct
exceeding Rs. 1 lakh65 Proportion of shares held by other investors = non inst otherspct66 Proportion of shares held by custodians = custodianspct
(Continued. . . )
August 2010 Indicators
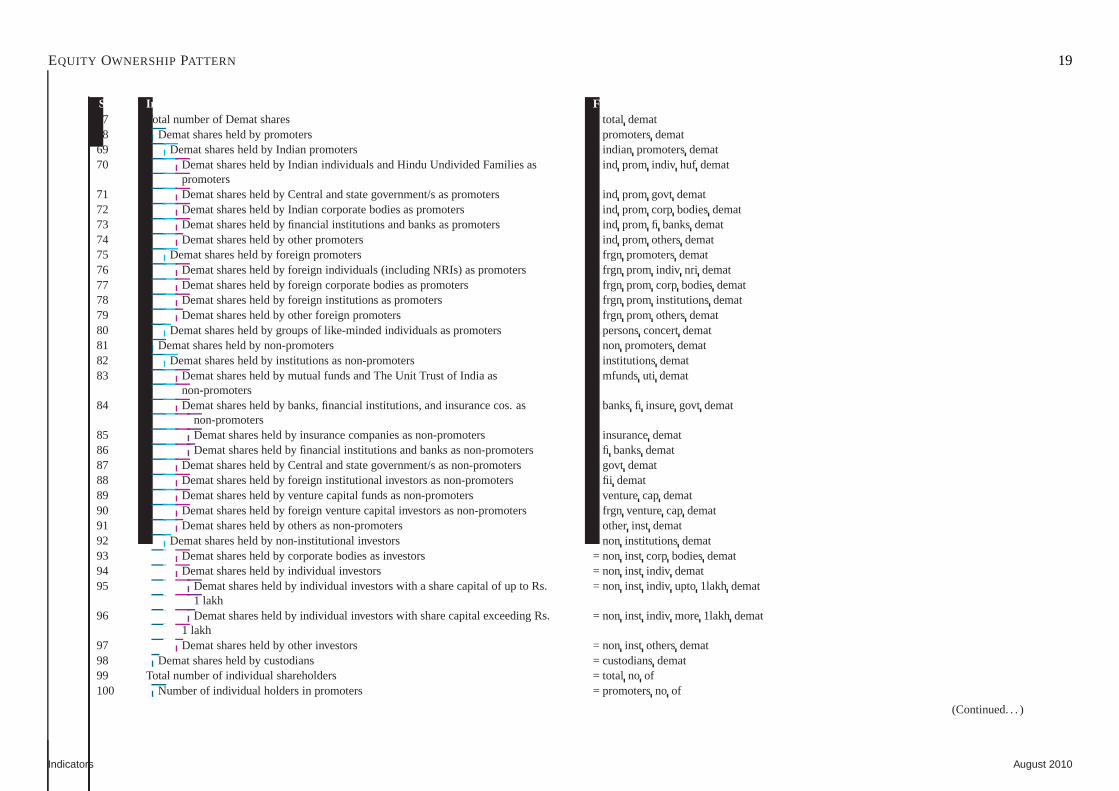
EQUITY OWNERSHIPPATTERN 19
Sr.No. Indicator Fields & formula67 Total number of Demat shares = total demat68 Demat shares held by promoters = promotersdemat69 Demat shares held by Indian promoters = indian promotersdemat70 Demat shares held by Indian individuals and Hindu UndividedFamilies as = indprom indiv huf demat
promoters71 Demat shares held by Central and state government/s as promoters = indprom govt demat72 Demat shares held by Indian corporate bodies as promoters = ind prom corp bodiesdemat73 Demat shares held by financial institutions and banks as promoters = indprom fi banksdemat74 Demat shares held by other promoters = ind prom othersdemat75 Demat shares held by foreign promoters = frgn promotersdemat76 Demat shares held by foreign individuals (including NRIs) as promoters = frgnprom indiv nri demat77 Demat shares held by foreign corporate bodies as promoters =frgn prom corp bodiesdemat78 Demat shares held by foreign institutions as promoters = frgn prom institutionsdemat79 Demat shares held by other foreign promoters = frgnprom othersdemat80 Demat shares held by groups of like-minded individuals as promoters = personsconcertdemat81 Demat shares held by non-promoters = non promotersdemat82 Demat shares held by institutions as non-promoters = institutions demat83 Demat shares held by mutual funds and The Unit Trust of India as = mfundsuti demat
non-promoters84 Demat shares held by banks, financial institutions, and insurance cos. as = banksfi insuregovt demat
non-promoters85 Demat shares held by insurance companies as non-promoters =insurancedemat86 Demat shares held by financial institutions and banks as non-promoters = fibanksdemat87 Demat shares held by Central and state government/s as non-promoters = govtdemat88 Demat shares held by foreign institutional investors as non-promoters = fiidemat89 Demat shares held by venture capital funds as non-promoters = venturecap demat90 Demat shares held by foreign venture capital investors as non-promoters = frgnventurecap demat91 Demat shares held by others as non-promoters = otherinst demat92 Demat shares held by non-institutional investors = noninstitutionsdemat93 Demat shares held by corporate bodies as investors = noninst corp bodiesdemat94 Demat shares held by individual investors = non inst indiv demat95 Demat shares held by individual investors with a share capital of up to Rs. = noninst indiv upto 1lakh demat
1 lakh96 Demat shares held by individual investors with share capital exceeding Rs. = noninst indiv more1lakh demat
1 lakh97 Demat shares held by other investors = non inst othersdemat98 Demat shares held by custodians = custodiansdemat99 Total number of individual shareholders = total no of100 Number of individual holders in promoters = promotersno of
(Continued. . . )
Indicators August 2010
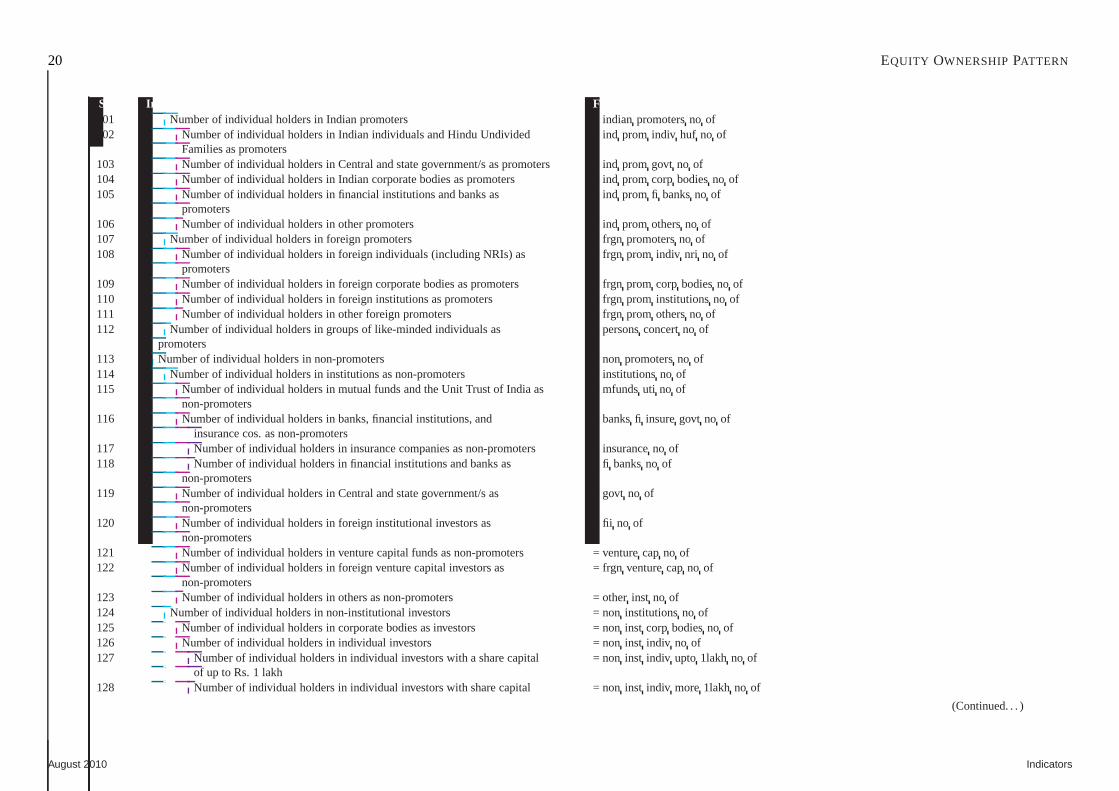
20 EQUITY OWNERSHIPPATTERN
Sr.No. Indicator Fields & formula101 Number of individual holders in Indian promoters = indianpromotersno of102 Number of individual holders in Indian individuals and Hindu Undivided = indprom indiv huf no of
Families as promoters103 Number of individual holders in Central and state government/s as promoters = indprom govt no of104 Number of individual holders in Indian corporate bodies as promoters = indprom corp bodiesno of105 Number of individual holders in financial institutions and banks as = indprom fi banksno of
promoters106 Number of individual holders in other promoters = indprom othersno of107 Number of individual holders in foreign promoters = frgnpromotersno of108 Number of individual holders in foreign individuals (including NRIs) as = frgnprom indiv nri no of
promoters109 Number of individual holders in foreign corporate bodies aspromoters = frgnprom corp bodiesno of110 Number of individual holders in foreign institutions as promoters = frgnprom institutionsno of111 Number of individual holders in other foreign promoters = frgn prom othersno of112 Number of individual holders in groups of like-minded individuals as = personsconcertno of
promoters113 Number of individual holders in non-promoters = non promotersno of114 Number of individual holders in institutions as non-promoters = institutionsno of115 Number of individual holders in mutual funds and the Unit Trust of India as = mfundsuti no of
non-promoters116 Number of individual holders in banks, financial institutions, and = banksfi insuregovt no of
insurance cos. as non-promoters117 Number of individual holders in insurance companies as non-promoters = insuranceno of118 Number of individual holders in financial institutions and banks as = fibanksno of
non-promoters119 Number of individual holders in Central and state government/s as = govtno of
non-promoters120 Number of individual holders in foreign institutional investors as = fiino of
non-promoters121 Number of individual holders in venture capital funds as non-promoters = venturecap no of122 Number of individual holders in foreign venture capital investors as = frgnventurecap no of
non-promoters123 Number of individual holders in others as non-promoters = other inst no of124 Number of individual holders in non-institutional investors = noninstitutionsno of125 Number of individual holders in corporate bodies as investors = noninst corp bodiesno of126 Number of individual holders in individual investors = noninst indiv no of127 Number of individual holders in individual investors with ashare capital = noninst indiv upto 1lakh no of
of up to Rs. 1 lakh128 Number of individual holders in individual investors with share capital = noninst indiv more1lakh no of
(Continued. . . )
August 2010 Indicators
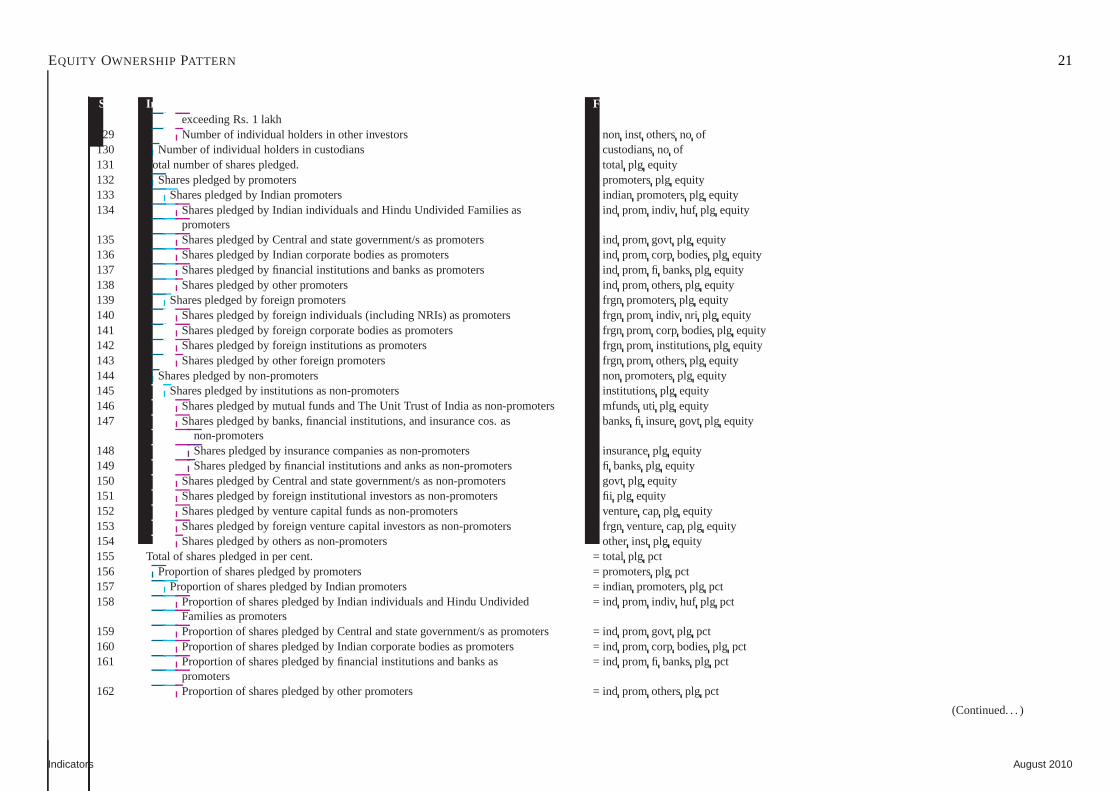
EQUITY OWNERSHIPPATTERN 21
Sr.No. Indicator Fields & formulaexceeding Rs. 1 lakh
129 Number of individual holders in other investors = noninst othersno of130 Number of individual holders in custodians = custodiansno of131 Total number of shares pledged. = total plg equity132 Shares pledged by promoters = promotersplg equity133 Shares pledged by Indian promoters = indian promotersplg equity134 Shares pledged by Indian individuals and Hindu Undivided Families as = indprom indiv huf plg equity
promoters135 Shares pledged by Central and state government/s as promoters = ind prom govt plg equity136 Shares pledged by Indian corporate bodies as promoters = indprom corp bodiesplg equity137 Shares pledged by financial institutions and banks as promoters = indprom fi banksplg equity138 Shares pledged by other promoters = ind prom othersplg equity139 Shares pledged by foreign promoters = frgn promotersplg equity140 Shares pledged by foreign individuals (including NRIs) as promoters = frgnprom indiv nri plg equity141 Shares pledged by foreign corporate bodies as promoters = frgn prom corp bodiesplg equity142 Shares pledged by foreign institutions as promoters = frgnprom institutionsplg equity143 Shares pledged by other foreign promoters = frgn prom othersplg equity144 Shares pledged by non-promoters = non promotersplg equity145 Shares pledged by institutions as non-promoters = institutions plg equity146 Shares pledged by mutual funds and The Unit Trust of India as non-promoters = mfundsuti plg equity147 Shares pledged by banks, financial institutions, and insurance cos. as = banksfi insuregovt plg equity
non-promoters148 Shares pledged by insurance companies as non-promoters = insuranceplg equity149 Shares pledged by financial institutions and anks as non-promoters = fibanksplg equity150 Shares pledged by Central and state government/s as non-promoters = govtplg equity151 Shares pledged by foreign institutional investors as non-promoters = fiiplg equity152 Shares pledged by venture capital funds as non-promoters = venturecap plg equity153 Shares pledged by foreign venture capital investors as non-promoters = frgnventurecap plg equity154 Shares pledged by others as non-promoters = other inst plg equity155 Total of shares pledged in per cent. = total plg pct156 Proportion of shares pledged by promoters = promotersplg pct157 Proportion of shares pledged by Indian promoters = indianpromotersplg pct158 Proportion of shares pledged by Indian individuals and Hindu Undivided = indprom indiv huf plg pct
Families as promoters159 Proportion of shares pledged by Central and state government/s as promoters = indprom govt plg pct160 Proportion of shares pledged by Indian corporate bodies as promoters = indprom corp bodiesplg pct161 Proportion of shares pledged by financial institutions and banks as = indprom fi banksplg pct
promoters162 Proportion of shares pledged by other promoters = indprom othersplg pct
(Continued. . . )
Indicators August 2010
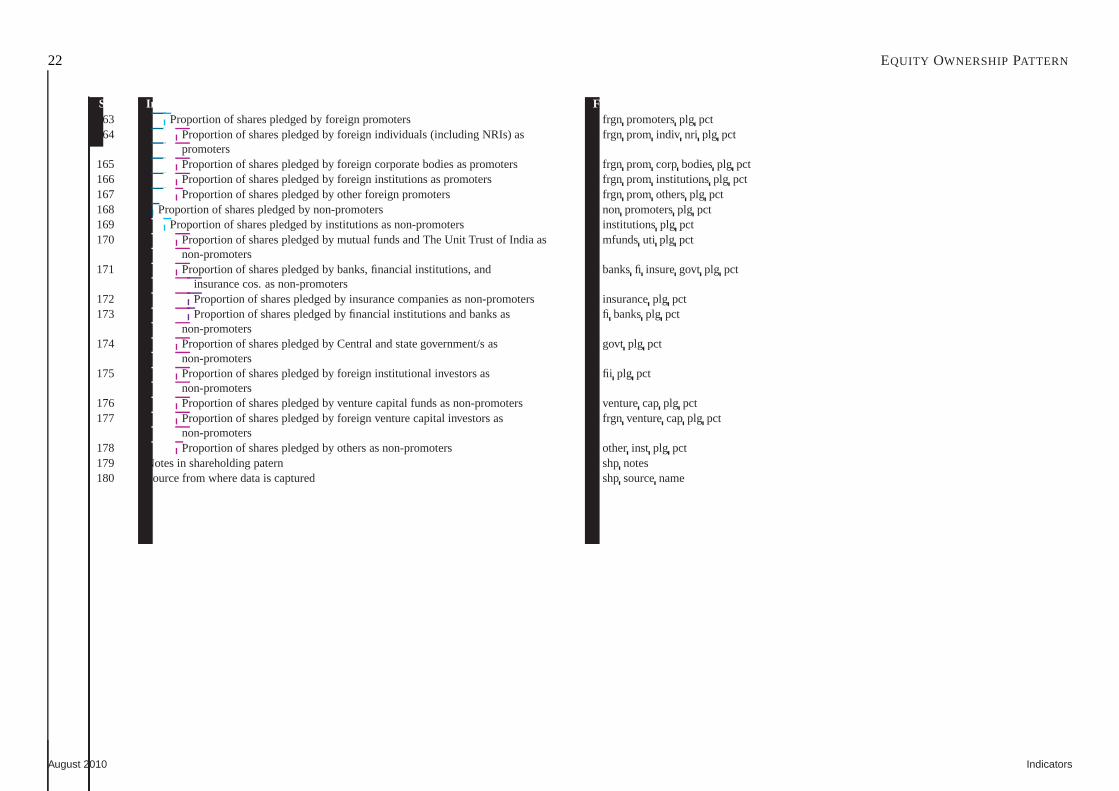
22 EQUITY OWNERSHIPPATTERN
Sr.No. Indicator Fields & formula163 Proportion of shares pledged by foreign promoters = frgnpromotersplg pct164 Proportion of shares pledged by foreign individuals (including NRIs) as = frgnprom indiv nri plg pct
promoters165 Proportion of shares pledged by foreign corporate bodies aspromoters = frgnprom corp bodiesplg pct166 Proportion of shares pledged by foreign institutions as promoters = frgnprom institutionsplg pct167 Proportion of shares pledged by other foreign promoters = frgn prom othersplg pct168 Proportion of shares pledged by non-promoters = non promotersplg pct169 Proportion of shares pledged by institutions as non-promoters = institutionsplg pct170 Proportion of shares pledged by mutual funds and The Unit Trust of India as = mfundsuti plg pct
non-promoters171 Proportion of shares pledged by banks, financial institutions, and = banksfi insuregovt plg pct
insurance cos. as non-promoters172 Proportion of shares pledged by insurance companies as non-promoters = insuranceplg pct173 Proportion of shares pledged by financial institutions and banks as = fibanksplg pct
non-promoters174 Proportion of shares pledged by Central and state government/s as = govtplg pct
non-promoters175 Proportion of shares pledged by foreign institutional investors as = fiiplg pct
non-promoters176 Proportion of shares pledged by venture capital funds as non-promoters = venturecap plg pct177 Proportion of shares pledged by foreign venture capital investors as = frgnventurecap plg pct
non-promoters178 Proportion of shares pledged by others as non-promoters = other inst plg pct179 Notes in shareholding patern = shpnotes180 Source from where data is captured = shpsourcename
August 2010 Indicators
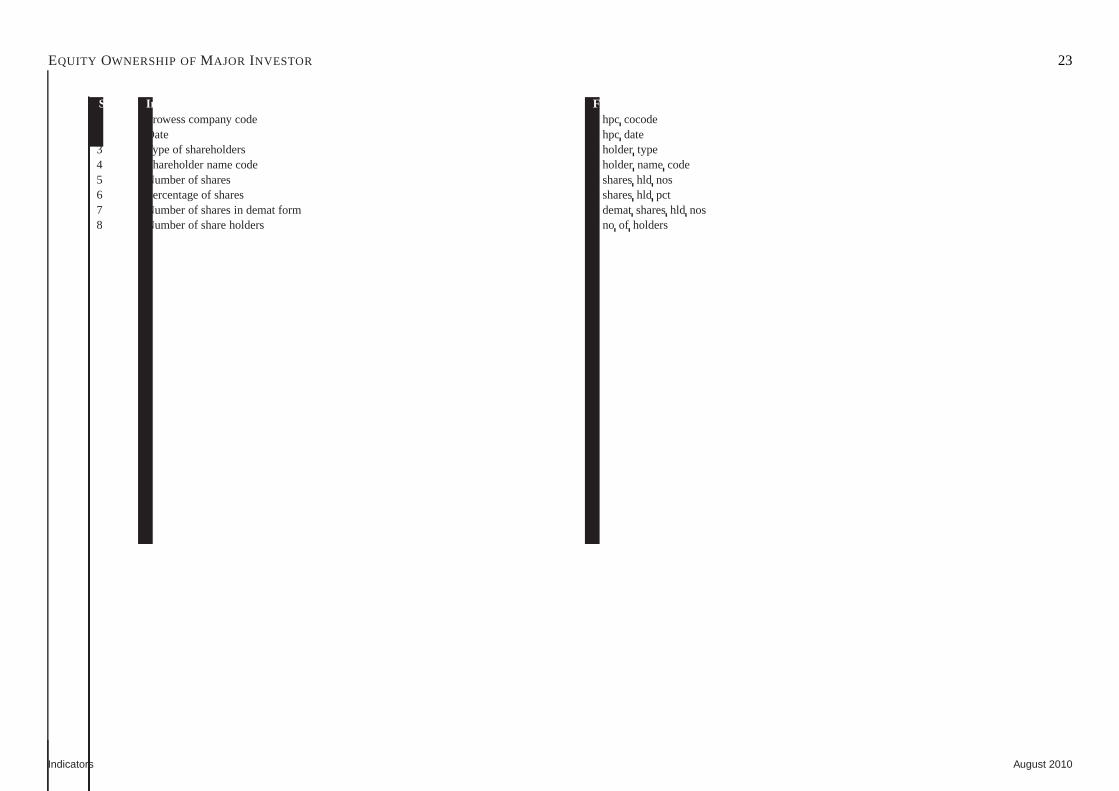
EQUITY OWNERSHIP OFMAJOR INVESTOR 23
Sr.No. Indicator Fields & formula1 Prowess company code = hpc cocode2 Date = hpc date3 Type of shareholders = holder type4 Shareholder name code = holdernamecode5 Number of shares = shareshld nos6 Percentage of shares = shareshld pct7 Number of shares in demat form = dematshareshld nos8 Number of share holders = no of holders
Indicators August 2010

24 SUBSIDIARIES
Sr.No. Indicator Fields & formula1 Prowess company code = sbshistcocode2 Date = sbshistdate3 Name of subsidiary = subsiname4 Effective date = subsieffectivedate5 Order of appearance of subsidiary = sbshistorder
August 2010 Indicators

AUDITORS 25
Sr.No. Indicator Fields & formula1 Prowess company code = audhistcocode2 Date = audhistdate3 Auditor = auditorname4 Partner name = auditorpartnername5 Order = audhistorder
Indicators August 2010
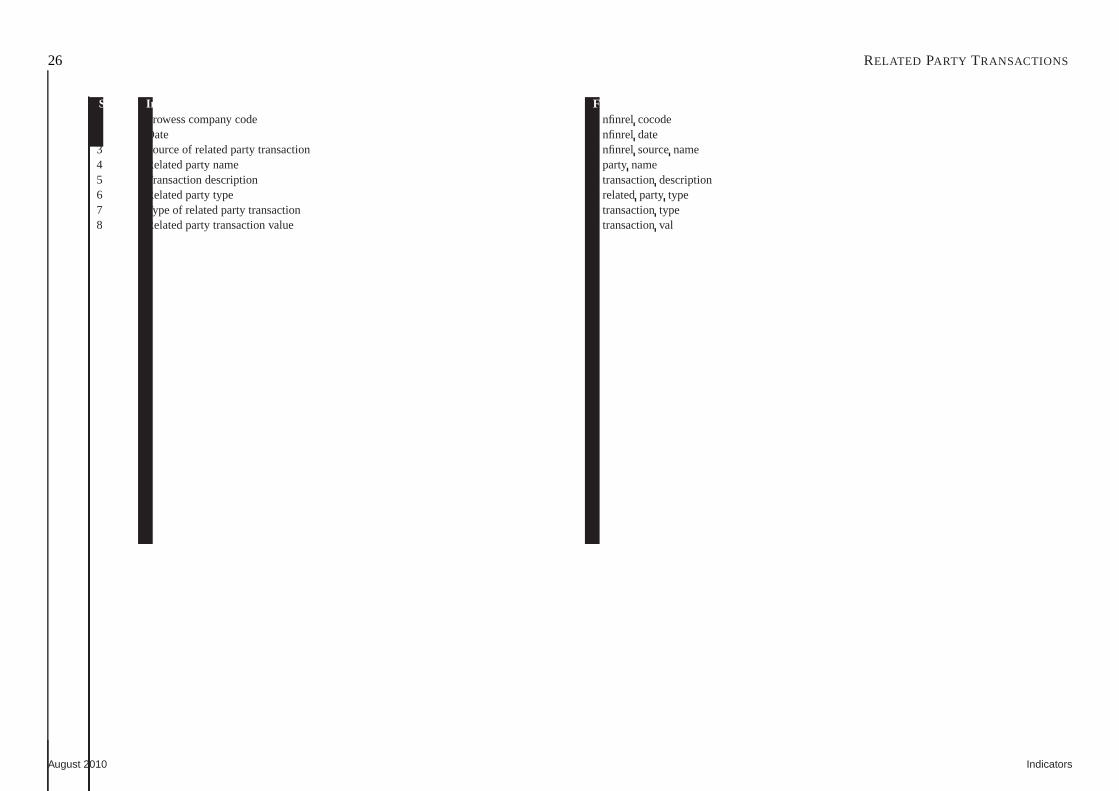
26 RELATED PARTY TRANSACTIONS
Sr.No. Indicator Fields & formula1 Prowess company code = nfinrel cocode2 Date = nfinrel date3 Source of related party transaction = nfinrel sourcename4 Related party name = party name5 Transaction description = transactiondescription6 Related party type = relatedparty type7 Type of related party transaction = transactiontype8 Related party transaction value = transactionval
August 2010 Indicators

BANKERS 27
Sr.No. Indicator Fields & formula1 Prowess company code = bnkhist cocode2 Date = bnkhistdate3 Bank = bankername4 Order = bnkhistorder
Indicators August 2010
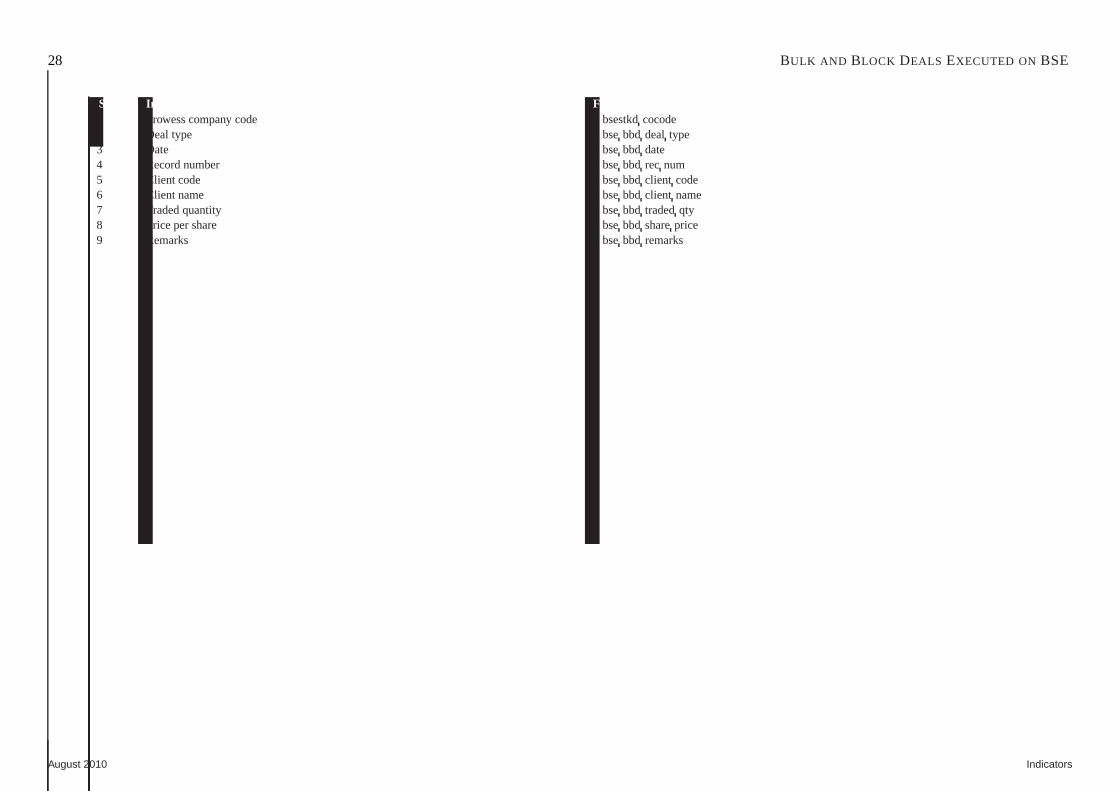
28 BULK AND BLOCK DEALS EXECUTED ON BSE
Sr.No. Indicator Fields & formula1 Prowess company code = bsestkdcocode2 Deal type = bsebbd deal type3 Date = bsebbd date4 Record number = bsebbd rec num5 Client code = bsebbd client code6 Client name = bsebbd client name7 Traded quantity = bsebbd tradedqty8 Price per share = bsebbd shareprice9 Remarks = bsebbd remarks
August 2010 Indicators

BULK AND BLOCK DEALS EXECUTED ON NSE 29
Sr.No. Indicator Fields & formula1 Prowess company code = nsestkdcocode2 Deal type = nsebbd deal type3 Date = nsebbd date4 Record number = nsebbd rec num5 Client’s code = nsebbd client code6 Client’s name = nsebbd client name7 Trading quantity = nsebbd tradedqty8 Price per share = nsebbd shareprice9 Remarks = nsebbd remarks
Indicators August 2010
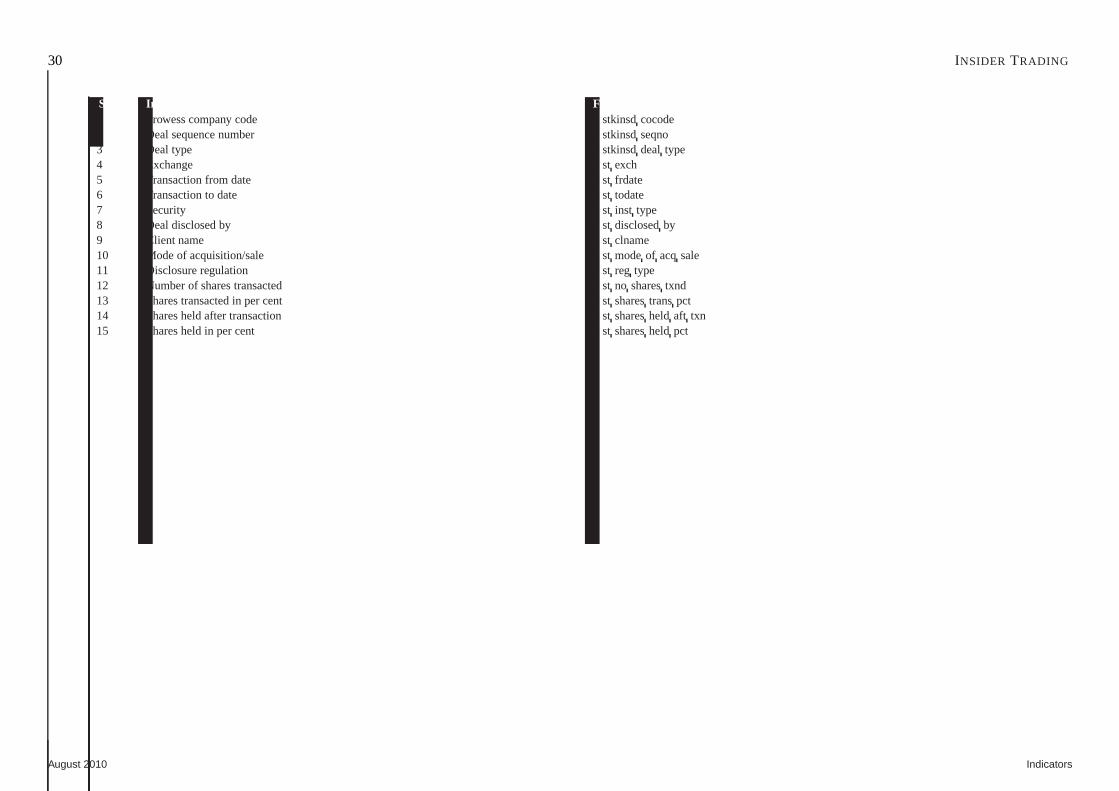
30 INSIDER TRADING
Sr.No. Indicator Fields & formula1 Prowess company code = stkinsdcocode2 Deal sequence number = stkinsdseqno3 Deal type = stkinsddeal type4 Exchange = st exch5 Transaction from date = st frdate6 Transaction to date = st todate7 Security = st inst type8 Deal disclosed by = st disclosedby9 Client name = st clname10 Mode of acquisition/sale = st modeof acq sale11 Disclosure regulation = st reg type12 Number of shares transacted = st no sharestxnd13 Shares transacted in per cent = st sharestranspct14 Shares held after transaction = st sharesheld aft txn15 Shares held in per cent = st sharesheld pct
August 2010 Indicators

31
Chapter 3
Financial Statements
ContentsThe Financial Statements Tables . . . . . . . . . . . . . . . . . . . . . . .. . . . . . . . . . . . . . . . . . . . . . . . . . . . . . . . . . . . . . . . . . . . . . . . . . 34
Annual financial statement: Income . . . . . . . . . . . . . . . . . . . . .. . . . . . . . . . . . . . . . . . . . . . . . . . . . . . . . . . . . . . . . . . . . . . . . . . 36
Annual financial statement: Change in Stocks . . . . . . . . . . . . .. . . . . . . . . . . . . . . . . . . . . . . . . . . . . . . . . . . . . . . . . . . . . . . . . . .. 40
Annual financial statement: Expenses . . . . . . . . . . . . . . . . . . .. . . . . . . . . . . . . . . . . . . . . . . . . . . . . . . . . . . . . . . . . . . . . . . . . . .41
Annual financial statement: Derived Expenses Indicators . .. . . . . . . . . . . . . . . . . . . . . . . . . . . . . . . . . . . . . . . . . . . . . . . . . . .. . . . . . 50
Annual financial statement: Derived Expenses Indicators: Compensation to Employees . . . . . . . . . . . . . . . . . . . . . . . . . . . . .. . . . . . . . . . . . . 51
Annual financial statement: Derived Expenses Indicators: Contribution to Exchequer . . . . . . . . . . . . . . . . . . . . . . . . . . . . .. . . . . . . . . . . . . . 52
Annual financial statement: Distribution of Costs: Non-finance companies . . . . . . . . . . . . . . . . . . . . . . . . . . . . . . . . . . . . . . .. . . . . . . . . . 53
Annual financial statement: Distribution of Costs: Financecompanies . . . . . . . . . . . . . . . . . . . . . . . . . . . . . . . . . . . . . . . . . .. . . . . . . . . . 55
Annual financial statement: Operating Costs as per cent of Sales . . . . . . . . . . . . . . . . . . . . . . . . . . . . . . . . . . . . . . . . . . . . . . . .. . . . . . . 58
Annual financial statement: Operating Costs as per cent of Income . . . . . . . . . . . . . . . . . . . . . . . . . . . . . . . . . . . . . . . . . . . . . . .. . . . . . . 60
Annual financial statement: Import Intensity of Raw Materia ls . . . . . . . . . . . . . . . . . . . . . . . . . . . . . . . . . . . . . . . . . . . . . . . . .. . . . . . . 62
Annual financial statement: Profits & Its Appropriation . . . . . . . . . . . . . . . . . . . . . . . . . . . . . . . . . . . . . . . . . . . . . . . . . . . . . . .. . . . . 63
Annual financial statement: Derived Measures of Profits . . . .. . . . . . . . . . . . . . . . . . . . . . . . . . . . . . . . . . . . . . . . . . . . . . . . . . .. . . . 67
Annual financial statement: Profitability Ratios . . . . . . . . . . . . . . . . . . . . . . . . . . . . . . . . . . . . . . . . . . . . . . . . . . . . . . . . . . . .. . . . 69
Annual financial statement: Liabilities . . . . . . . . . . . . . . . . . . . . . . . . . . . . . . . . . . . . . . . . . . . . . . . . . . . . . . . . . . . . . . . . . . .. . . 74
Annual financial statement: Derived Liabilities Indicator s . . . . . . . . . . . . . . . . . . . . . . . . . . . . . . . . . . . . . . . . . . . . . . . . . .. . . . . . . . . 84
Indicators August 2010
32
Annual financial statement: Derived Liabilities Indicator s: Shareholder’s Funds . . . . . . . . . . . . . . . . . . . . . . . . . . . . . . .. . . . . . . . . . . . . . . 86
Annual financial statement: Derived Liabilities Indicator s: Borrowings . . . . . . . . . . . . . . . . . . . . . . . . . . . . . . . . . . . . . . .. . . . . . . . . . . . 87
Annual financial statement: Derived Liabilities Indicator s: Current Liabilities & Provisions . . . . . . . . . . . . . . . . . . . . . . . . . . . . . . . . . . . . . . . 88
Annual financial statement: Contingent Liabilities . . . . . . . . . . . . . . . . . . . . . . . . . . . . . . . . . . . . . . . . . . . . . . . . . . . . . . . . .. . . . . . 89
Annual financial statement: Derived Contingent Liabilities Indicators . . . . . . . . . . . . . . . . . . . . . . . . . . . . . . . . . . . . . . . .. . . . . . . . . . . . 91
Annual financial statement: Liquidity, Working Cycle & Turn over Ratios . . . . . . . . . . . . . . . . . . . . . . . . . . . . . . . . . . . . . . . . .. . . . . . . . . 92
Annual financial statement: Assets . . . . . . . . . . . . . . . . . . . . .. . . . . . . . . . . . . . . . . . . . . . . . . . . . . . . . . . . . . . . . . . . . . . . . . . .96
Annual financial statement: Derived Assets Indicators . . . .. . . . . . . . . . . . . . . . . . . . . . . . . . . . . . . . . . . . . . . . . . . . . . . . . . .. . . . . . 112
Annual financial statement: Derived Assets Indicators: Fixed Assets . . . . . . . . . . . . . . . . . . . . . . . . . . . . . . . . . . . . . . . . . . .. . . . . . . . . . 113
Annual financial statement: Derived Assets Indicators: Investments . . . . . . . . . . . . . . . . . . . . . . . . . . . . . . . . . . . . . . . . . . .. . . . . . . . . . 115
Annual financial statement: Derived Assets Indicators: Current Assets & Loans and Advances . . . . . . . . . . . . . . . . . . . . . . . .. . . . . . . . . . . . . . 116
Annual financial statement: Cash Flow . . . . . . . . . . . . . . . . . . .. . . . . . . . . . . . . . . . . . . . . . . . . . . . . . . . . . . . . . . . . . . . . . . . . . 117
Annual financial statement: Derived Cash Flow Indicators . . . . . . . . . . . . . . . . . . . . . . . . . . . . . . . . . . . . . . . . . . . . . . . . . . . . .. . . . . 119
Annual financial statement: Sources & Uses of Funds . . . . . . . .. . . . . . . . . . . . . . . . . . . . . . . . . . . . . . . . . . . . . . . . . . . . . . . . . . .. . 125
Annual financial statement: Structure of Funds Used . . . . . . .. . . . . . . . . . . . . . . . . . . . . . . . . . . . . . . . . . . . . . . . . . . . . . . . . . .. . . 131
Annual financial statement: Sources of Growth in Income . . . .. . . . . . . . . . . . . . . . . . . . . . . . . . . . . . . . . . . . . . . . . . . . . . . . . . .. . . . 162
Annual financial statement: Sources of Growth in Profits: Non-finance companies . . . . . . . . . . . . . . . . . . . . . . . . . . . . . . . . . . .. . . . . . . . . . 165
Annual financial statement: Sources of Growth in Profits: Finance companies . . . . . . . . . . . . . . . . . . . . . . . . . . . . . . . . . . . . . .. . . . . . . . . 168
Annual financial statement: Foreign Exchange Transactions . . . . . . . . . . . . . . . . . . . . . . . . . . . . . . . . . . . . . . . . . . . . . . . . . . .. . . . . . 171
Annual financial statement: Derived Foreign Exchange Transactions Indicators . . . . . . . . . . . . . . . . . . . . . . . . . . . . . . . . . .. . . . . . . . . . . . 172
Annual financial statement: Miscellaneous Disclosures . . .. . . . . . . . . . . . . . . . . . . . . . . . . . . . . . . . . . . . . . . . . . . . . . . . . . .. . . . . . . 173
Annual financial statement: Statutory Disclosures by Banks. . . . . . . . . . . . . . . . . . . . . . . . . . . . . . . . . . . . . . . . . . . . . . . . . . .. . . . . . . 177
Annual financial statement: Banking Disclosures Based on Basel II (Pillar 3) Norms . . . . . . . . . . . . . . . . . . . . . . . . . . . . . . . .. . . . . . . . . . . . 184
Annual financial statement: Capital Requirement for Risk Areas . . . . . . . . . . . . . . . . . . . . . . . . . . . . . . . . . . . . . . . . . . . . . . . .. . . . . . . 193
Annual financial statement: Disclosures by Housing Financeand NBFCs . . . . . . . . . . . . . . . . . . . . . . . . . . . . . . . . . . . . . . . . . . .. . . . . . . 194
Annual financial statement: Banking Maturity Pattern . . . . . . . . . . . . . . . . . . . . . . . . . . . . . . . . . . . . . . . . . . . . . . . . . . . . . . . .. . . . 198
Annual financial statement: Share Prices Ratios & Misc. Indicators . . . . . . . . . . . . . . . . . . . . . . . . . . . . . . . . . . . . . . . . . . . . .. . . . . . . . 201
Investments . . . . . . . . . . . . . . . . . . . . . . . . . . . . . . . . . . . . . . . .. . . . . . . . . . . . . . . . . . . . . . . . . . . . . . . . . . . . . . . . . . . . . 202
Maturity of Deposits & Advances . . . . . . . . . . . . . . . . . . . . . . . .. . . . . . . . . . . . . . . . . . . . . . . . . . . . . . . . . . . . . . . . . . . . . . . . 203
Interim Financial Statements . . . . . . . . . . . . . . . . . . . . . . . . .. . . . . . . . . . . . . . . . . . . . . . . . . . . . . . . . . . . . . . . . . . . . . . . . . . 204
Notes to Accounts of Interim Financial statements . . . . . . . .. . . . . . . . . . . . . . . . . . . . . . . . . . . . . . . . . . . . . . . . . . . . . . . . . . .. . . . 208
August 2010 Indicators
33
Credit Ratings . . . . . . . . . . . . . . . . . . . . . . . . . . . . . . . . . . . . . .. . . . . . . . . . . . . . . . . . . . . . . . . . . . . . . . . . . . . . . . . . . . . 209
Effective Date for Financial Statements of Merged Companies . . . . . . . . . . . . . . . . . . . . . . . . . . . . . . . . . . . . . . . . . . . . . . . . . .. . . . . . 210
Indicators August 2010
34
The Financial Statements Tables
The Table: “Annual Financial Statements” captures the individual datafields that areseen in financial statements published by companies in theirAnnual Reports. While theAnnual Report presents such information in manner such thatthe broad view of the In-come and Expenditure Statement and the Assets and Liabilities Statements is presentedfirst, and then Schedules provide the details. Further details are made available in notesto accounts and footnotes.
In Prowess, in the Table: “Annual Financial Statements” thedata is organised into onelong and structured list of over 2,400 indicators. This includes many atomic indicators(that cannot be subdivided any further), sub-totals and totals (that are summations of theatomic indicators), derived values (which are derived fromthe atomic values but are notnecessarily sub-divisions) and ratios.
Totals, sub-totals and atomic indicators are part of an arrangement to capture infor-mation from the Annual Reports effectively. They together,ensure standardisation ofnomenclature, granularity of data capture, consistent classification of atomic values,comprehensiveness of data capture and internal consistency.
The derived values and ratios are lateral extractions from the set of totals, sub-totals andatomic values. The presentation is organised such that the totals, sub-totals and atomicvalues are listed first, these are then followed by the derived values and finally the ratios.
The long list of indicators may be divided into the followinglogical groups:
1. Income. This contains the sources of total income of a company. The componentsinclude sales from all kinds of industrial products, incomefrom non-financial ser-vices, income from financial services, other income and prior-period and extra-ordinary incomes. There are over 75 indicators within income.
2. Change in stocks. There are about 20 indicators to capturethe change in stock offinished and semi-finished goods during a year.
3. Expenses. Prowess contains a list of over 225 total, sub-total and atomic indica-tors to capture details of expenses from the Annual Report. There are xx broadheads under which the expenditure indicators are organised. There are xx expen-
diture items that are derived from these 225 indicators. Separately, we have xxratios relating to the cost structure of companies.
4. Profits. Prowess contains detailed data on profits and its appropriation. It alsocontains data on the various measures of profits such as PBDITA, PBDIT, PBDT,PBT, PAT. Each of these are also measured net of prior period transactions andnet extra-ordinary income. Often, the PAT captured in Prowess differs from thePAT provided by the company in its Annual Reports. Several data fields explainthis difference. Finally, this section also contains several profitability ratios.
5. Liabilities. Includes indicators of equity capital, reserves, borrowings, and cur-rent liabilities and provisions and a few indicators derived from these. This groupalso include a few liquidity and working capital cycle and turnover ratios. Theseratios involve some lengthy formulae. Contigent liabilities are also covered com-prehensively.
6. Assets. There are about xx totals, sub-totals and atomic indicators of assets. Theserelate to the gross fixed assets, net fixed assets, investments, inventories, receiv-ables, loans and advances, cash and bank balances and miscellaneous expensesnot written off. Besides, there are xx derived indicators.
7. Cash Flow & incrementals. Listed companies are required to provide a CashFlow Statement in their Annual Report. This is captured in the “Annual FinancialStatements” Table. Besides, there is a set of indicators derived from two consec-utive balance sheets to reflect the sources and uses of funds.Thus, for each year’srecord, Prowess also provides the indicators for sources and uses of funds, whichis derived from the balance sheet for the year and the balancesheet for the corre-sponding previous year. Similarly, there are indicators that have ben developed byCMIE to estimate the sources of growth in income and in profits, which are alsobased on the difference in the values in financial statementsfor two consecutiveyears.
8. Miscellaneous disclosures. Here we capture data on the foreign exchange trans-actions of the company during a year. These are usually provided by the companyas additional notes. These do not flow from the main financial statements. Similar
August 2010 Indicators
35
is the case with a lot of additional data provided by companies under various Ac-counting Standards set by the Institute of Chartered Accountants. Presentation ofthese data are highly standardised by the Institute and is therefore not subjectedto normalisation.
9. Disclosures by finance companies. Banks and non-banking finance companiesare required, by RBI, to provide a lot of additional data. Thepresentation of thisinformation is fixed and therefore this data is not subjectedto normalisation.
Security-wise details of investments outstanding of a company as of the date of the bal-ance sheet is captured in a separate Table:“Investments” since each record pertains to
one security. Similarly the maturity pattern of the deposits and advances of banks iscaptured in a separate Table where each “bucket” is a separate record.
The Table: “Interim Financial Statements” captures data onthe quarterly financial per-formance of listed companies. The data indicators are lesser than those that are availablein the Annual Report. This Table also captures data for annual and “year-to-date” valuesas presented by the company. Each is time-period – a quarter,a half-year, three-quartersor a year is a separate record in this Table.
There is a separate Table for Notes for interim financial statements because these aredatabased. Notes to the financial statements from Annual Reports are available asscanned images extracted from the Annual Reports.
Abbreviations used:
ai: Addendum informationpncc: Part of non-comprehensive constituentspcc: Part of comprehensive constituents
Indicators August 2010
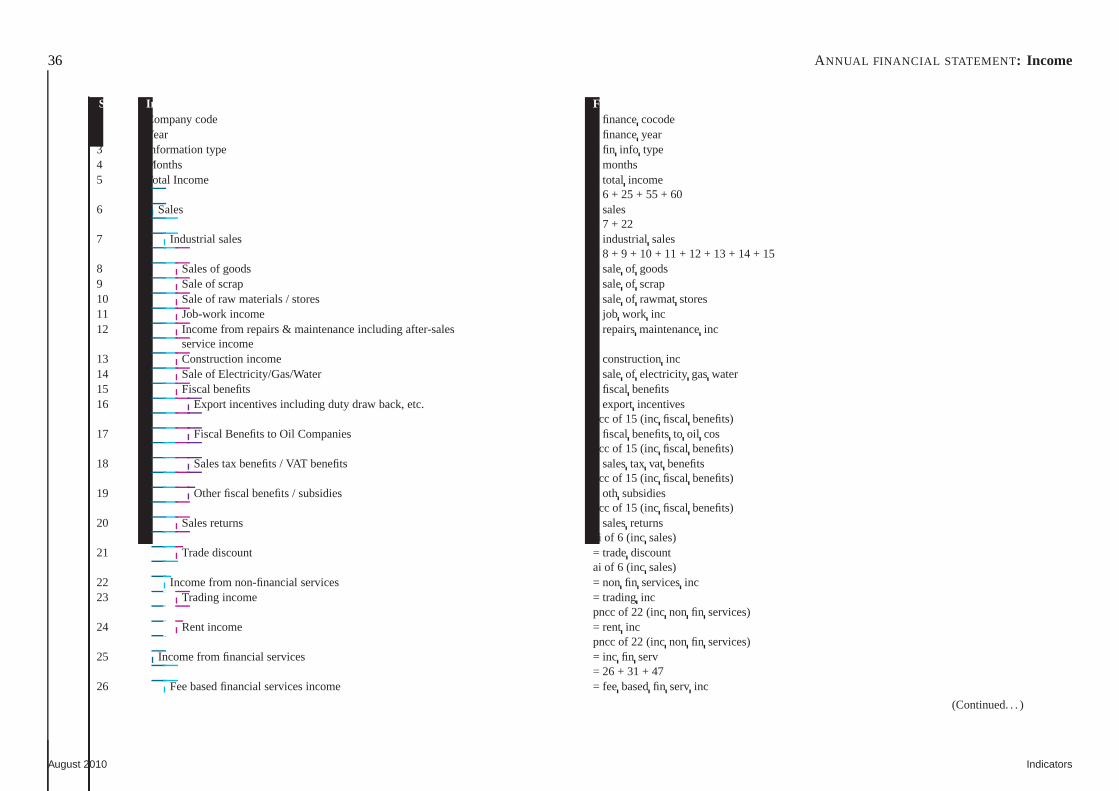
36 ANNUAL FINANCIAL STATEMENT : Income
Sr.No. Indicator Fields & formula1 Company code = financecocode2 Year = financeyear3 Information type = fin info type4 Months = months5 Total Income = total income
= 6 + 25 + 55 + 606 Sales = sales
= 7 + 227 Industrial sales = industrial sales
= 8 + 9 + 10 + 11 + 12 + 13 + 14 + 158 Sales of goods = saleof goods9 Sale of scrap = saleof scrap10 Sale of raw materials / stores = saleof rawmatstores11 Job-work income = job work inc12 Income from repairs & maintenance including after-sales = repairsmaintenanceinc
service income13 Construction income = constructioninc14 Sale of Electricity/Gas/Water = saleof electricity gaswater15 Fiscal benefits = fiscal benefits16 Export incentives including duty draw back, etc. = exportincentives
pcc of 15 (incfiscal benefits)17 Fiscal Benefits to Oil Companies = fiscal benefitsto oil cos
pcc of 15 (incfiscal benefits)18 Sales tax benefits / VAT benefits = salestax vat benefits
pcc of 15 (incfiscal benefits)19 Other fiscal benefits / subsidies = oth subsidies
pcc of 15 (incfiscal benefits)20 Sales returns = salesreturns
ai of 6 (inc sales)21 Trade discount = tradediscount
ai of 6 (inc sales)22 Income from non-financial services = non fin servicesinc23 Trading income = trading inc
pncc of 22 (incnon fin services)24 Rent income = rent inc
pncc of 22 (incnon fin services)25 Income from financial services = inc fin serv
= 26 + 31 + 4726 Fee based financial services income = fee basedfin serv inc
(Continued. . . )
August 2010 Indicators
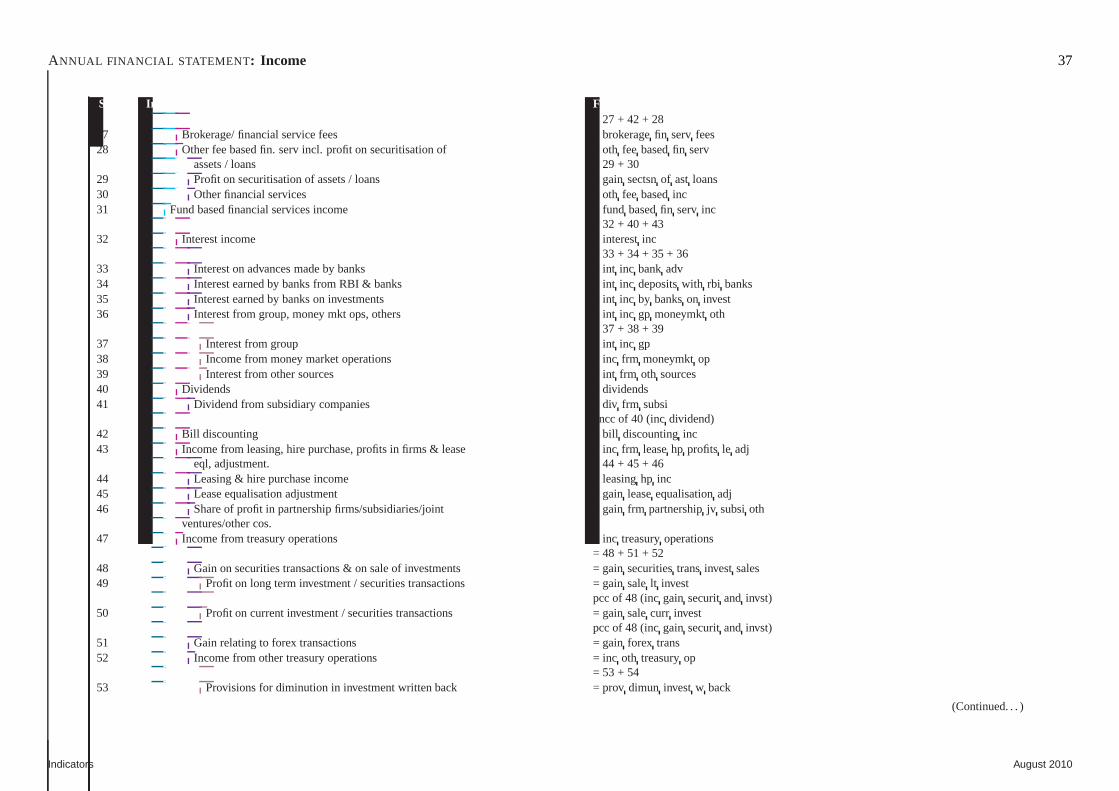
ANNUAL FINANCIAL STATEMENT : Income 37
Sr.No. Indicator Fields & formula= 27 + 42 + 28
27 Brokerage/ financial service fees = brokeragefin serv fees28 Other fee based fin. serv incl. profit on securitisation of = oth fee basedfin serv
assets / loans = 29 + 3029 Profit on securitisation of assets / loans = gain sectsnof ast loans30 Other financial services = oth fee basedinc31 Fund based financial services income = fund basedfin serv inc
= 32 + 40 + 4332 Interest income = interestinc
= 33 + 34 + 35 + 3633 Interest on advances made by banks = int inc bank adv34 Interest earned by banks from RBI & banks = intinc depositswith rbi banks35 Interest earned by banks on investments = int inc by bankson invest36 Interest from group, money mkt ops, others = intinc gp moneymktoth
= 37 + 38 + 3937 Interest from group = int inc gp38 Income from money market operations = inc frm moneymktop39 Interest from other sources = int frm oth sources40 Dividends = dividends41 Dividend from subsidiary companies = div frm subsi
pncc of 40 (incdividend)42 Bill discounting = bill discountinginc43 Income from leasing, hire purchase, profits in firms & lease = inc frm leasehp profits le adj
eql, adjustment. = 44 + 45 + 4644 Leasing & hire purchase income = leasinghp inc45 Lease equalisation adjustment = gain leaseequalisationadj46 Share of profit in partnership firms/subsidiaries/joint = gain frm partnershipjv subsioth
ventures/other cos.47 Income from treasury operations = inc treasuryoperations
= 48 + 51 + 5248 Gain on securities transactions & on sale of investments = gain securitiestransinvest sales49 Profit on long term investment / securities transactions = gain salelt invest
pcc of 48 (incgain securitand invst)50 Profit on current investment / securities transactions = gain salecurr invest
pcc of 48 (incgain securitand invst)51 Gain relating to forex transactions = gain forex trans52 Income from other treasury operations = inc oth treasuryop
= 53 + 5453 Provisions for diminution in investment written back = provdimun invest w back
(Continued. . . )
Indicators August 2010
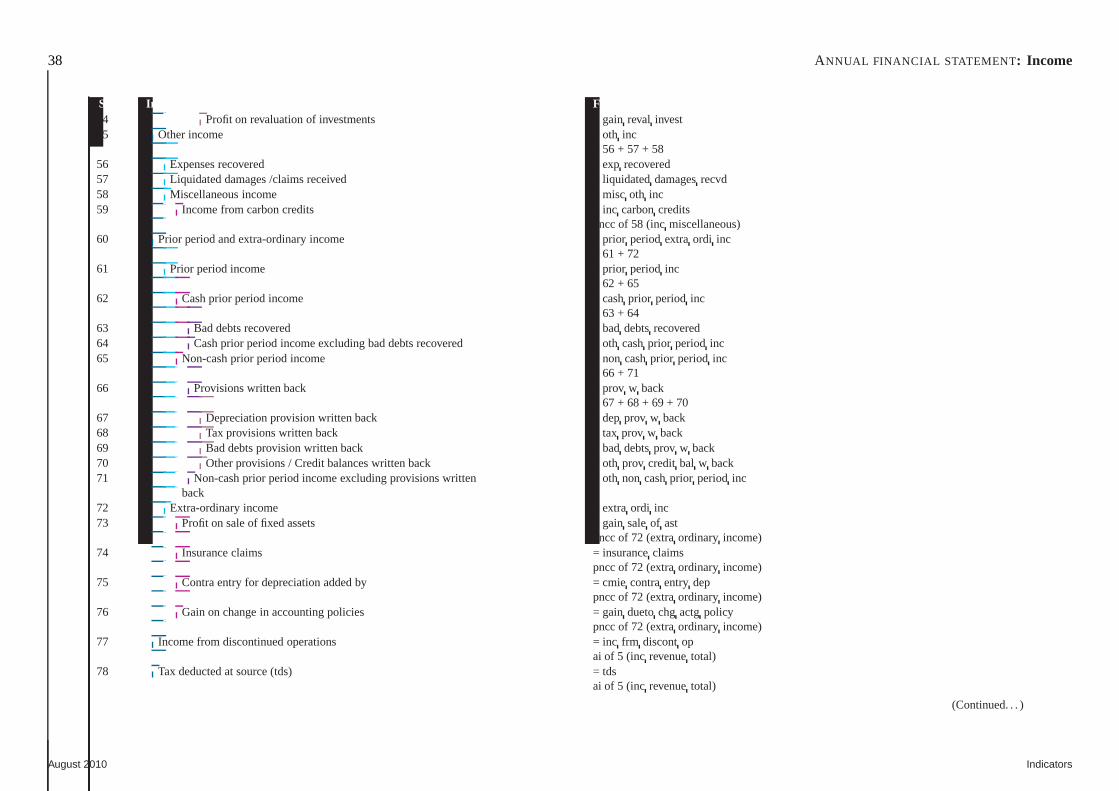
38 ANNUAL FINANCIAL STATEMENT : Income
Sr.No. Indicator Fields & formula54 Profit on revaluation of investments = gain reval invest55 Other income = oth inc
= 56 + 57 + 5856 Expenses recovered = exp recovered57 Liquidated damages /claims received = liquidateddamagesrecvd58 Miscellaneous income = misc oth inc59 Income from carbon credits = inc carboncredits
pncc of 58 (incmiscellaneous)60 Prior period and extra-ordinary income = prior periodextra ordi inc
= 61 + 7261 Prior period income = prior period inc
= 62 + 6562 Cash prior period income = cashprior period inc
= 63 + 6463 Bad debts recovered = baddebtsrecovered64 Cash prior period income excluding bad debts recovered = othcashprior period inc65 Non-cash prior period income = non cashprior period inc
= 66 + 7166 Provisions written back = prov w back
= 67 + 68 + 69 + 7067 Depreciation provision written back = depprov w back68 Tax provisions written back = tax prov w back69 Bad debts provision written back = baddebtsprov w back70 Other provisions / Credit balances written back = othprov credit bal w back71 Non-cash prior period income excluding provisions written = oth non cashprior period inc
back72 Extra-ordinary income = extraordi inc73 Profit on sale of fixed assets = gain saleof ast
pncc of 72 (extraordinary income)74 Insurance claims = insuranceclaims
pncc of 72 (extraordinary income)75 Contra entry for depreciation added by = cmie contraentry dep
pncc of 72 (extraordinary income)76 Gain on change in accounting policies = gain duetochg actg policy
pncc of 72 (extraordinary income)77 Income from discontinued operations = inc frm discontop
ai of 5 (inc revenuetotal)78 Tax deducted at source (tds) = tds
ai of 5 (inc revenuetotal)
(Continued. . . )
August 2010 Indicators

ANNUAL FINANCIAL STATEMENT : Income 39
Sr.No. Indicator Fields & formula79 Internal transfers = internal trf
Indicators August 2010
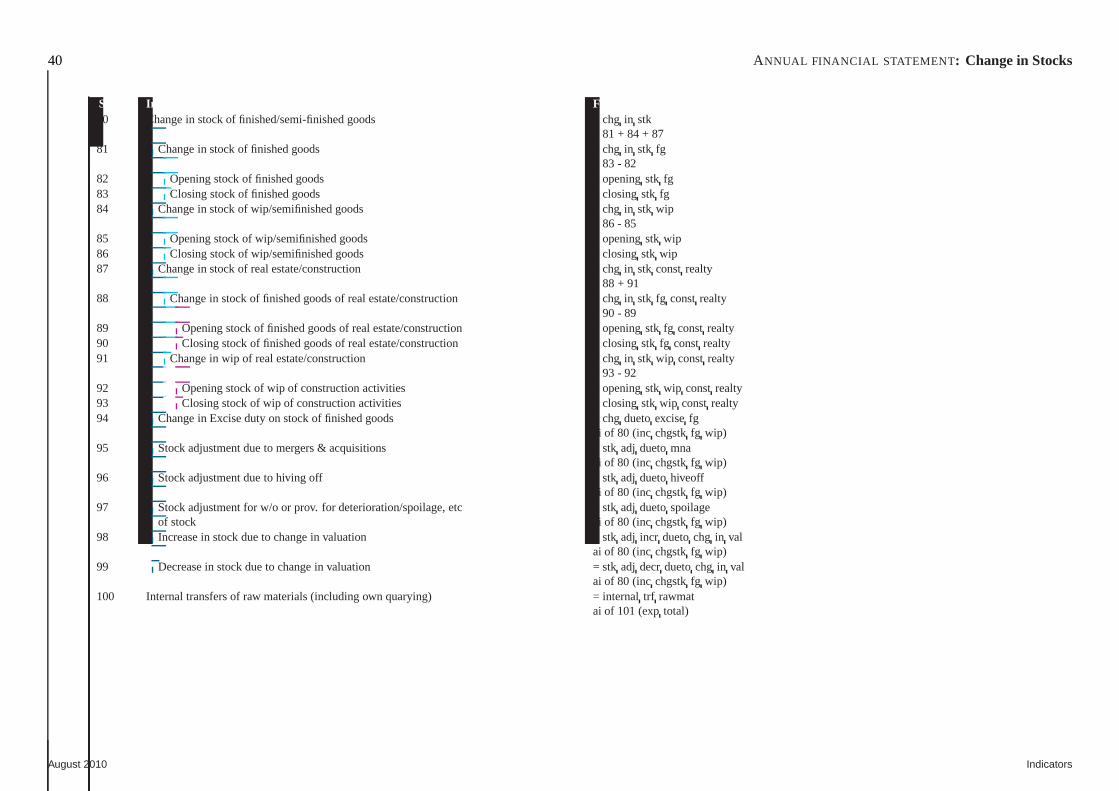
40 ANNUAL FINANCIAL STATEMENT : Change in Stocks
Sr.No. Indicator Fields & formula80 Change in stock of finished/semi-finished goods = chg in stk
= 81 + 84 + 8781 Change in stock of finished goods = chg in stk fg
= 83 - 8282 Opening stock of finished goods = openingstk fg83 Closing stock of finished goods = closingstk fg84 Change in stock of wip/semifinished goods = chg in stk wip
= 86 - 8585 Opening stock of wip/semifinished goods = openingstk wip86 Closing stock of wip/semifinished goods = closingstk wip87 Change in stock of real estate/construction = chg in stk constrealty
= 88 + 9188 Change in stock of finished goods of real estate/construction = chg in stk fg constrealty
= 90 - 8989 Opening stock of finished goods of real estate/construction = openingstk fg constrealty90 Closing stock of finished goods of real estate/construction = closingstk fg constrealty91 Change in wip of real estate/construction = chg in stk wip constrealty
= 93 - 9292 Opening stock of wip of construction activities = openingstk wip constrealty93 Closing stock of wip of construction activities = closingstk wip constrealty94 Change in Excise duty on stock of finished goods = chg duetoexcisefg
ai of 80 (incchgstkfg wip)95 Stock adjustment due to mergers & acquisitions = stk adj duetomna
ai of 80 (incchgstkfg wip)96 Stock adjustment due to hiving off = stk adj duetohiveoff
ai of 80 (incchgstkfg wip)97 Stock adjustment for w/o or prov. for deterioration/spoilage, etc = stkadj duetospoilage
of stock ai of 80 (incchgstkfg wip)98 Increase in stock due to change in valuation = stk adj incr duetochg in val
ai of 80 (incchgstkfg wip)99 Decrease in stock due to change in valuation = stk adj decrduetochg in val
ai of 80 (incchgstkfg wip)100 Internal transfers of raw materials (including own quarying) = internaltrf rawmat
ai of 101 (exptotal)
August 2010 Indicators
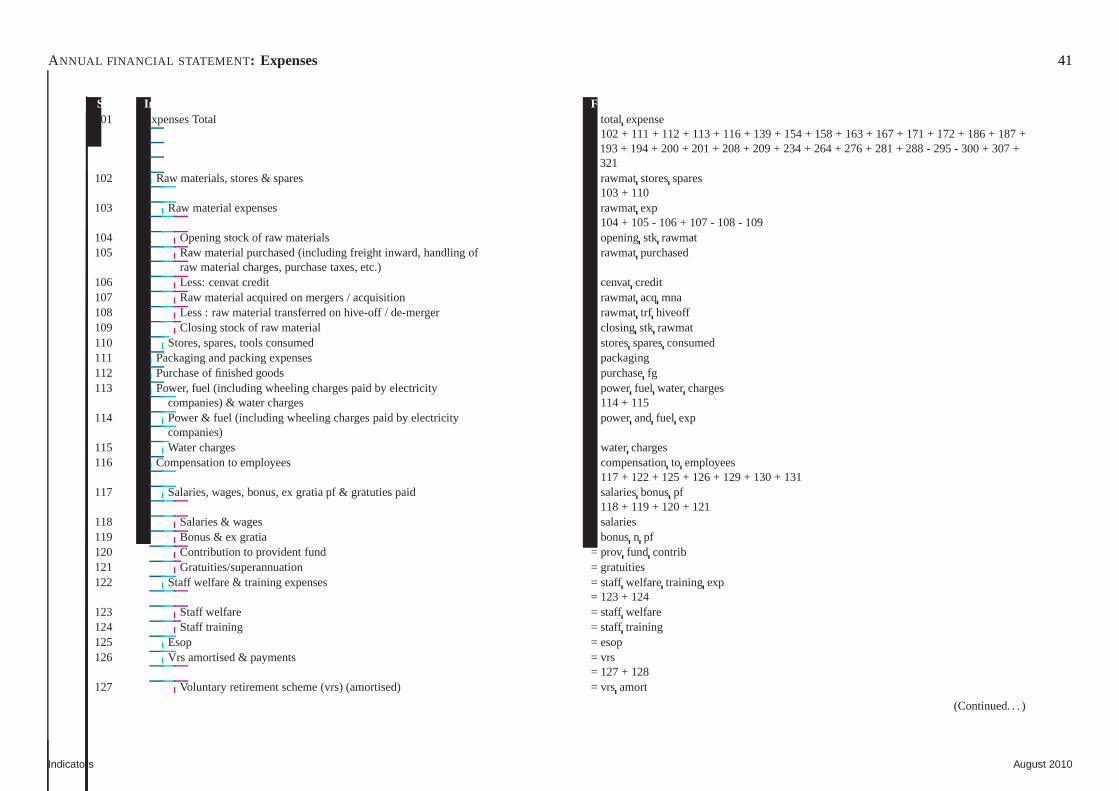
ANNUAL FINANCIAL STATEMENT : Expenses 41
Sr.No. Indicator Fields & formula101 Expenses Total = total expense
= 102 + 111 + 112 + 113 + 116 + 139 + 154 + 158 + 163 + 167 + 171 + 172 + 186 + 187 +193 + 194 + 200 + 201 + 208 + 209 + 234 + 264 + 276 + 281 + 288 - 295 - 300+ 307 +321
102 Raw materials, stores & spares = rawmatstoresspares= 103 + 110
103 Raw material expenses = rawmatexp= 104 + 105 - 106 + 107 - 108 - 109
104 Opening stock of raw materials = openingstk rawmat105 Raw material purchased (including freight inward, handling of = rawmatpurchased
raw material charges, purchase taxes, etc.)106 Less: cenvat credit = cenvatcredit107 Raw material acquired on mergers / acquisition = rawmatacq mna108 Less : raw material transferred on hive-off / de-merger = rawmat trf hiveoff109 Closing stock of raw material = closingstk rawmat110 Stores, spares, tools consumed = storessparesconsumed111 Packaging and packing expenses = packaging112 Purchase of finished goods = purchasefg113 Power, fuel (including wheeling charges paid by electricity = power fuel water charges
companies) & water charges = 114 + 115114 Power & fuel (including wheeling charges paid by electricity = powerand fuel exp
companies)115 Water charges = watercharges116 Compensation to employees = compensationto employees
= 117 + 122 + 125 + 126 + 129 + 130 + 131117 Salaries, wages, bonus, ex gratia pf & gratuties paid = salaries bonuspf
= 118 + 119 + 120 + 121118 Salaries & wages = salaries119 Bonus & ex gratia = bonusn pf120 Contribution to provident fund = prov fund contrib121 Gratuities/superannuation = gratuities122 Staff welfare & training expenses = staff welfare training exp
= 123 + 124123 Staff welfare = staff welfare124 Staff training = staff training125 Esop = esop126 Vrs amortised & payments = vrs
= 127 + 128127 Voluntary retirement scheme (vrs) (amortised) = vrsamort
(Continued. . . )
Indicators August 2010
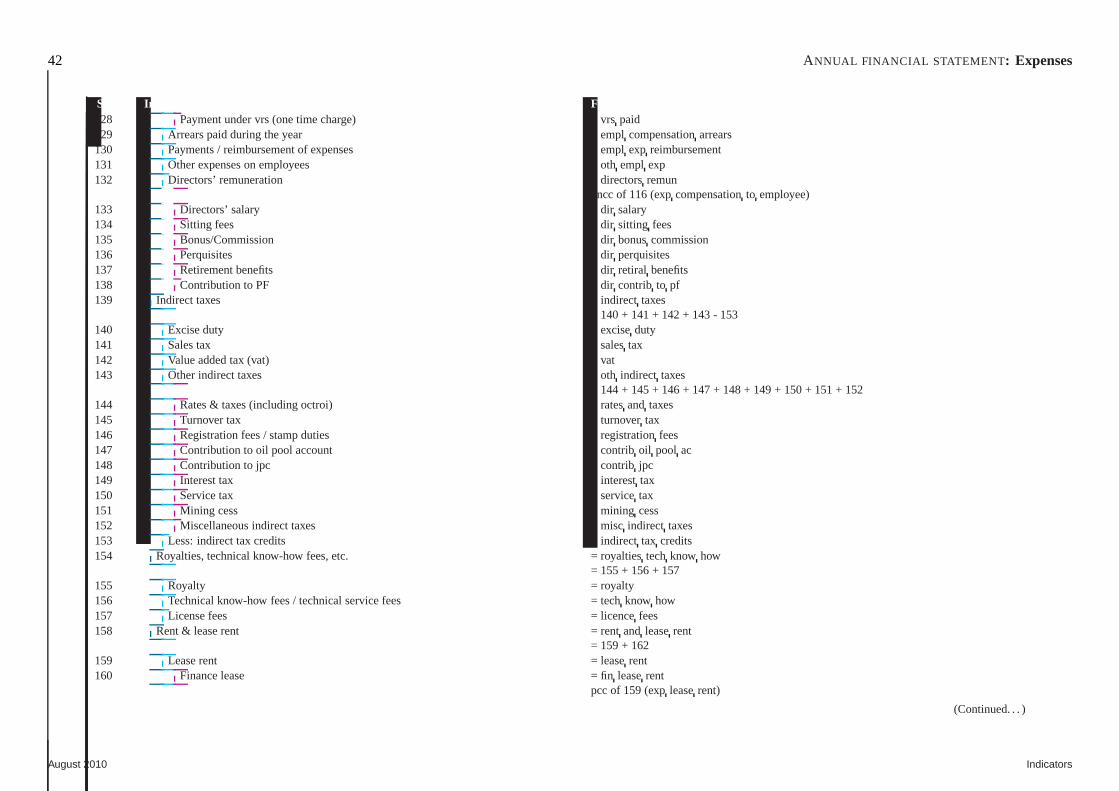
42 ANNUAL FINANCIAL STATEMENT : Expenses
Sr.No. Indicator Fields & formula128 Payment under vrs (one time charge) = vrs paid129 Arrears paid during the year = empl compensationarrears130 Payments / reimbursement of expenses = empl exp reimbursement131 Other expenses on employees = oth empl exp132 Directors’ remuneration = directorsremun
pncc of 116 (expcompensationto employee)133 Directors’ salary = dir salary134 Sitting fees = dir sitting fees135 Bonus/Commission = dir bonuscommission136 Perquisites = dir perquisites137 Retirement benefits = dir retiral benefits138 Contribution to PF = dir contrib to pf139 Indirect taxes = indirect taxes
= 140 + 141 + 142 + 143 - 153140 Excise duty = exciseduty141 Sales tax = salestax142 Value added tax (vat) = vat143 Other indirect taxes = oth indirect taxes
= 144 + 145 + 146 + 147 + 148 + 149 + 150 + 151 + 152144 Rates & taxes (including octroi) = ratesand taxes145 Turnover tax = turnovertax146 Registration fees / stamp duties = registrationfees147 Contribution to oil pool account = contrib oil pool ac148 Contribution to jpc = contrib jpc149 Interest tax = interesttax150 Service tax = servicetax151 Mining cess = mining cess152 Miscellaneous indirect taxes = misc indirect taxes153 Less: indirect tax credits = indirect tax credits154 Royalties, technical know-how fees, etc. = royaltiestechknow how
= 155 + 156 + 157155 Royalty = royalty156 Technical know-how fees / technical service fees = techknow how157 License fees = licencefees158 Rent & lease rent = rent and leaserent
= 159 + 162159 Lease rent = leaserent160 Finance lease = fin leaserent
pcc of 159 (expleaserent)
(Continued. . . )
August 2010 Indicators
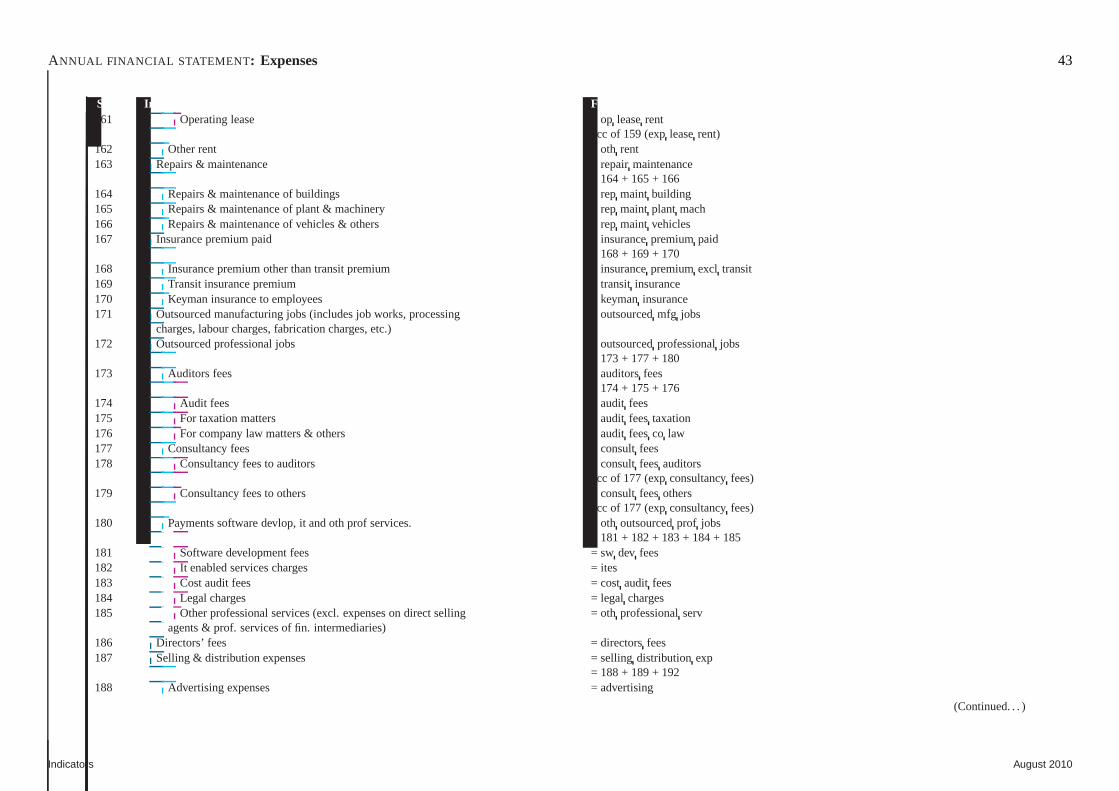
ANNUAL FINANCIAL STATEMENT : Expenses 43
Sr.No. Indicator Fields & formula161 Operating lease = op leaserent
pcc of 159 (expleaserent)162 Other rent = oth rent163 Repairs & maintenance = repairmaintenance
= 164 + 165 + 166164 Repairs & maintenance of buildings = rep maint building165 Repairs & maintenance of plant & machinery = rep maint plant mach166 Repairs & maintenance of vehicles & others = rep maint vehicles167 Insurance premium paid = insurancepremiumpaid
= 168 + 169 + 170168 Insurance premium other than transit premium = insurancepremiumexcl transit169 Transit insurance premium = transit insurance170 Keyman insurance to employees = keymaninsurance171 Outsourced manufacturing jobs (includes job works, processing = outsourcedmfg jobs
charges, labour charges, fabrication charges, etc.)172 Outsourced professional jobs = outsourcedprofessionaljobs
= 173 + 177 + 180173 Auditors fees = auditorsfees
= 174 + 175 + 176174 Audit fees = audit fees175 For taxation matters = audit feestaxation176 For company law matters & others = audit feesco law177 Consultancy fees = consultfees178 Consultancy fees to auditors = consultfeesauditors
pcc of 177 (expconsultancyfees)179 Consultancy fees to others = consultfeesothers
pcc of 177 (expconsultancyfees)180 Payments software devlop, it and oth prof services. = othoutsourcedprof jobs
= 181 + 182 + 183 + 184 + 185181 Software development fees = sw dev fees182 It enabled services charges = ites183 Cost audit fees = costaudit fees184 Legal charges = legal charges185 Other professional services (excl. expenses on direct selling = oth professionalserv
agents & prof. services of fin. intermediaries)186 Directors’ fees = directorsfees187 Selling & distribution expenses = selling distributionexp
= 188 + 189 + 192188 Advertising expenses = advertising
(Continued. . . )
Indicators August 2010
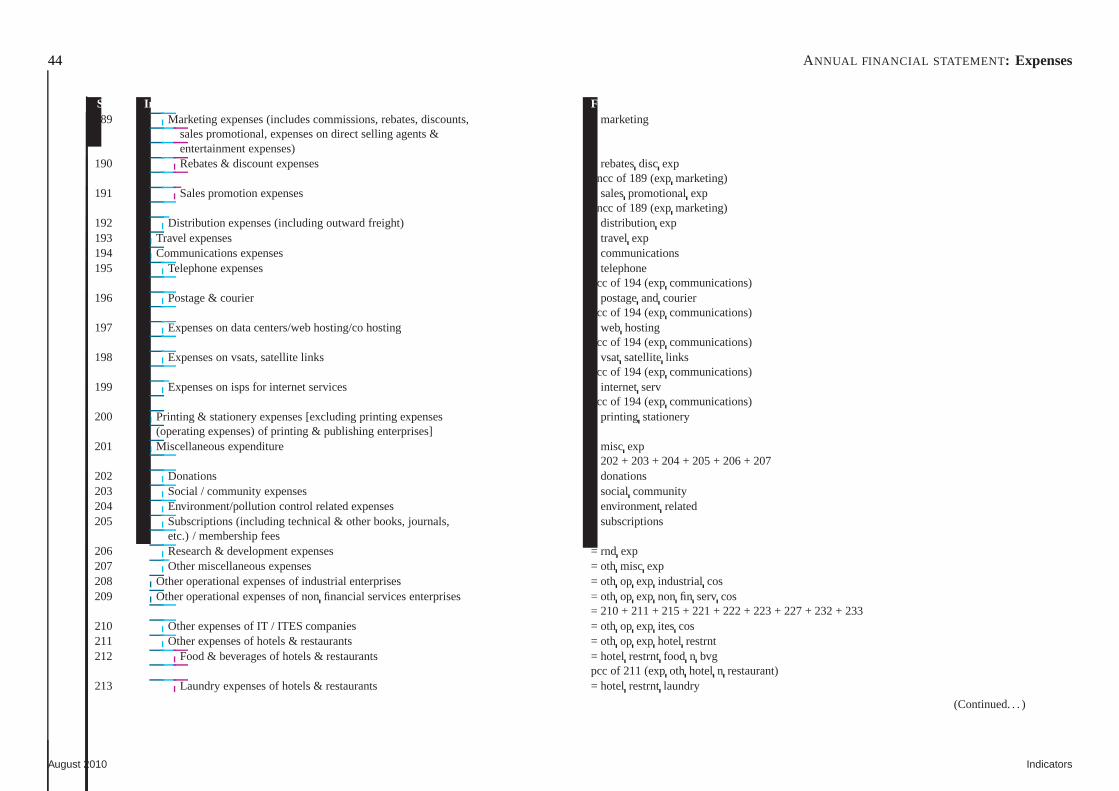
44 ANNUAL FINANCIAL STATEMENT : Expenses
Sr.No. Indicator Fields & formula189 Marketing expenses (includes commissions, rebates, discounts, = marketing
sales promotional, expenses on direct selling agents &entertainment expenses)
190 Rebates & discount expenses = rebatesdisc exppncc of 189 (expmarketing)
191 Sales promotion expenses = salespromotionalexppncc of 189 (expmarketing)
192 Distribution expenses (including outward freight) = distribution exp193 Travel expenses = travel exp194 Communications expenses = communications195 Telephone expenses = telephone
pcc of 194 (expcommunications)196 Postage & courier = postageand courier
pcc of 194 (expcommunications)197 Expenses on data centers/web hosting/co hosting = webhosting
pcc of 194 (expcommunications)198 Expenses on vsats, satellite links = vsatsatellitelinks
pcc of 194 (expcommunications)199 Expenses on isps for internet services = internetserv
pcc of 194 (expcommunications)200 Printing & stationery expenses [excluding printing expenses = printingstationery
(operating expenses) of printing & publishing enterprises]201 Miscellaneous expenditure = misc exp
= 202 + 203 + 204 + 205 + 206 + 207202 Donations = donations203 Social / community expenses = social community204 Environment/pollution control related expenses = environmentrelated205 Subscriptions (including technical & other books, journals, = subscriptions
etc.) / membership fees206 Research & development expenses = rnd exp207 Other miscellaneous expenses = oth misc exp208 Other operational expenses of industrial enterprises = othop exp industrial cos209 Other operational expenses of nonfinancial services enterprises = othop exp non fin servcos
= 210 + 211 + 215 + 221 + 222 + 223 + 227 + 232 + 233210 Other expenses of IT / ITES companies = oth op exp ites cos211 Other expenses of hotels & restaurants = oth op exp hotel restrnt212 Food & beverages of hotels & restaurants = hotel restrntfood n bvg
pcc of 211 (expoth hotel n restaurant)213 Laundry expenses of hotels & restaurants = hotel restrntlaundry
(Continued. . . )
August 2010 Indicators
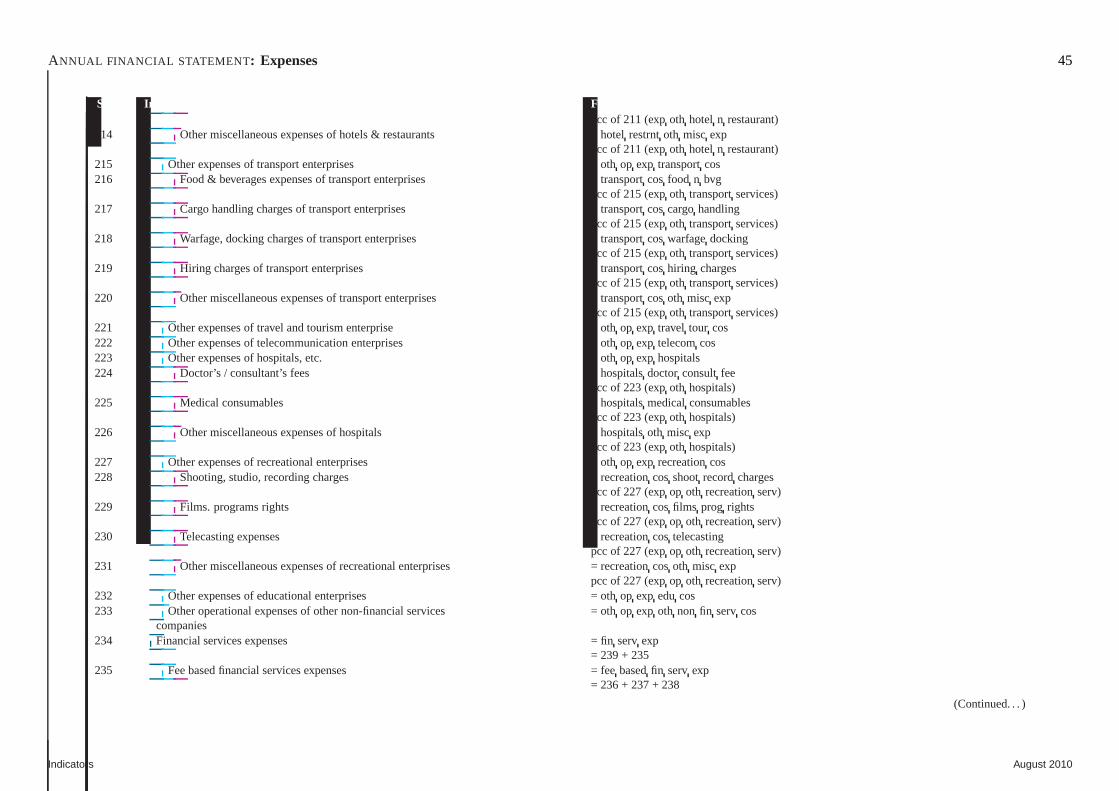
ANNUAL FINANCIAL STATEMENT : Expenses 45
Sr.No. Indicator Fields & formulapcc of 211 (expoth hotel n restaurant)
214 Other miscellaneous expenses of hotels & restaurants = hotel restrntoth misc exppcc of 211 (expoth hotel n restaurant)
215 Other expenses of transport enterprises = oth op exp transportcos216 Food & beverages expenses of transport enterprises = transport cos food n bvg
pcc of 215 (expoth transportservices)217 Cargo handling charges of transport enterprises = transport coscargohandling
pcc of 215 (expoth transportservices)218 Warfage, docking charges of transport enterprises = transport coswarfagedocking
pcc of 215 (expoth transportservices)219 Hiring charges of transport enterprises = transportcoshiring charges
pcc of 215 (expoth transportservices)220 Other miscellaneous expenses of transport enterprises = transportcosoth misc exp
pcc of 215 (expoth transportservices)221 Other expenses of travel and tourism enterprise = oth op exp travel tour cos222 Other expenses of telecommunication enterprises = othop exp telecomcos223 Other expenses of hospitals, etc. = oth op exp hospitals224 Doctor’s / consultant’s fees = hospitalsdoctor consultfee
pcc of 223 (expoth hospitals)225 Medical consumables = hospitalsmedicalconsumables
pcc of 223 (expoth hospitals)226 Other miscellaneous expenses of hospitals = hospitalsoth misc exp
pcc of 223 (expoth hospitals)227 Other expenses of recreational enterprises = oth op exp recreationcos228 Shooting, studio, recording charges = recreationcosshootrecordcharges
pcc of 227 (expop oth recreationserv)229 Films. programs rights = recreationcosfilms prog rights
pcc of 227 (expop oth recreationserv)230 Telecasting expenses = recreationcos telecasting
pcc of 227 (expop oth recreationserv)231 Other miscellaneous expenses of recreational enterprises = recreationcosoth misc exp
pcc of 227 (expop oth recreationserv)232 Other expenses of educational enterprises = oth op exp edu cos233 Other operational expenses of other non-financial services = oth op exp oth non fin serv cos
companies234 Financial services expenses = fin servexp
= 239 + 235235 Fee based financial services expenses = fee basedfin serv exp
= 236 + 237 + 238
(Continued. . . )
Indicators August 2010
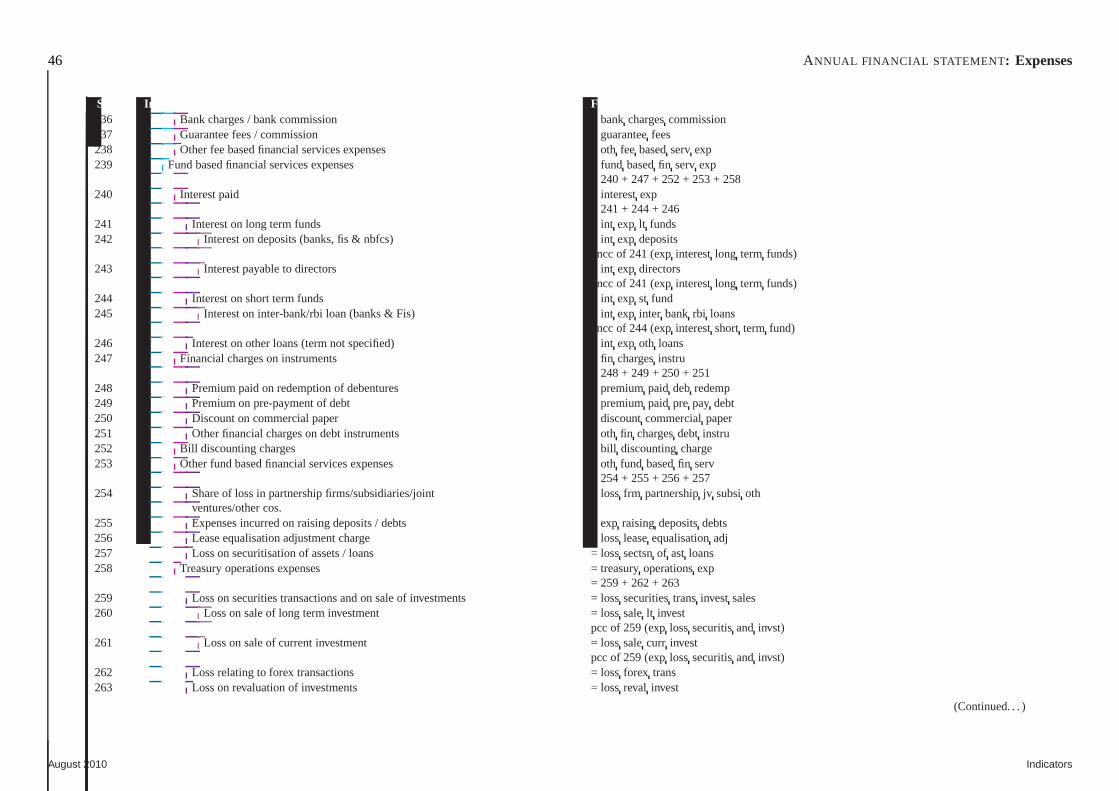
46 ANNUAL FINANCIAL STATEMENT : Expenses
Sr.No. Indicator Fields & formula236 Bank charges / bank commission = bankchargescommission237 Guarantee fees / commission = guaranteefees238 Other fee based financial services expenses = oth fee basedservexp239 Fund based financial services expenses = fund basedfin servexp
= 240 + 247 + 252 + 253 + 258240 Interest paid = interestexp
= 241 + 244 + 246241 Interest on long term funds = int exp lt funds242 Interest on deposits (banks, fis & nbfcs) = int exp deposits
pncc of 241 (expinterestlong term funds)243 Interest payable to directors = int exp directors
pncc of 241 (expinterestlong term funds)244 Interest on short term funds = int exp st fund245 Interest on inter-bank/rbi loan (banks & Fis) = intexp inter bank rbi loans
pncc of 244 (expinterestshort term fund)246 Interest on other loans (term not specified) = int exp oth loans247 Financial charges on instruments = fin chargesinstru
= 248 + 249 + 250 + 251248 Premium paid on redemption of debentures = premiumpaid deb redemp249 Premium on pre-payment of debt = premiumpaid pre pay debt250 Discount on commercial paper = discountcommercialpaper251 Other financial charges on debt instruments = othfin chargesdebt instru252 Bill discounting charges = bill discountingcharge253 Other fund based financial services expenses = oth fund basedfin serv
= 254 + 255 + 256 + 257254 Share of loss in partnership firms/subsidiaries/joint = loss frm partnershipjv subsioth
ventures/other cos.255 Expenses incurred on raising deposits / debts = expraisingdepositsdebts256 Lease equalisation adjustment charge = loss leaseequalisationadj257 Loss on securitisation of assets / loans = losssectsnof ast loans258 Treasury operations expenses = treasuryoperationsexp
= 259 + 262 + 263259 Loss on securities transactions and on sale of investments =losssecuritiestransinvest sales260 Loss on sale of long term investment = losssalelt invest
pcc of 259 (explosssecuritisand invst)261 Loss on sale of current investment = losssalecurr invest
pcc of 259 (explosssecuritisand invst)262 Loss relating to forex transactions = loss forex trans263 Loss on revaluation of investments = lossreval invest
(Continued. . . )
August 2010 Indicators
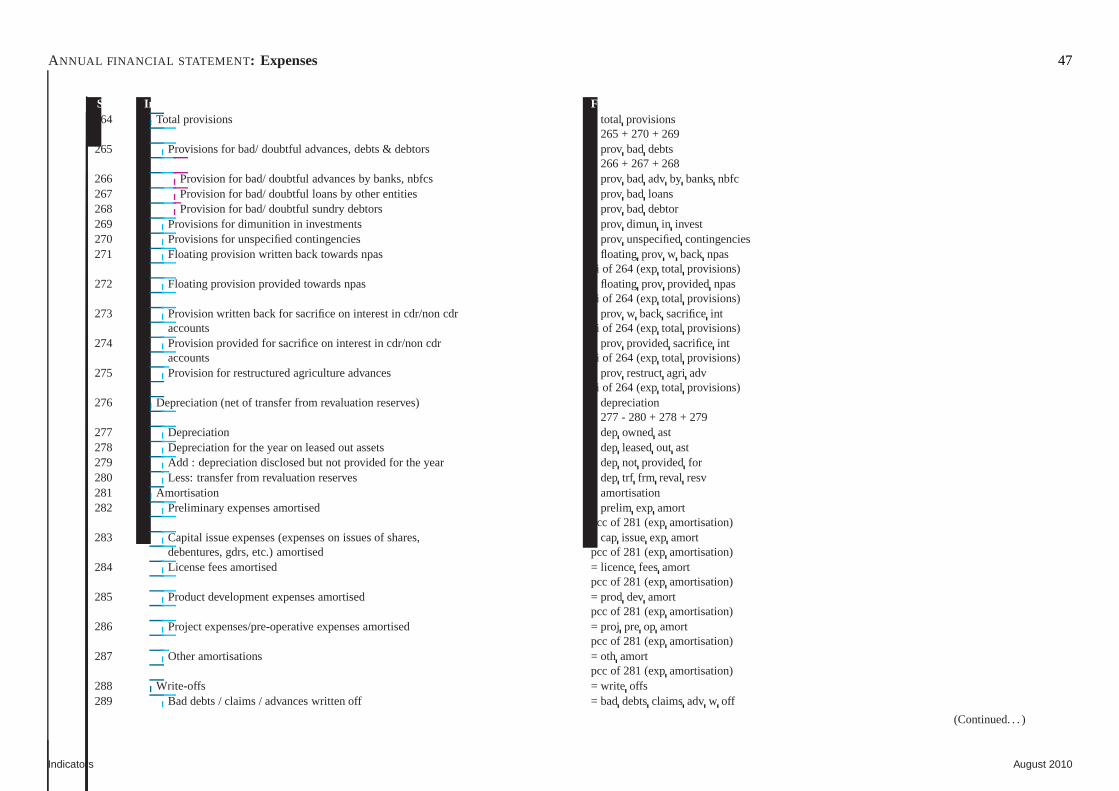
ANNUAL FINANCIAL STATEMENT : Expenses 47
Sr.No. Indicator Fields & formula264 Total provisions = total provisions
= 265 + 270 + 269265 Provisions for bad/ doubtful advances, debts & debtors = prov bad debts
= 266 + 267 + 268266 Provision for bad/ doubtful advances by banks, nbfcs = provbad adv by banksnbfc267 Provision for bad/ doubtful loans by other entities = provbad loans268 Provision for bad/ doubtful sundry debtors = prov bad debtor269 Provisions for dimunition in investments = prov dimun in invest270 Provisions for unspecified contingencies = prov unspecifiedcontingencies271 Floating provision written back towards npas = floating prov w back npas
ai of 264 (exptotal provisions)272 Floating provision provided towards npas = floating prov providednpas
ai of 264 (exptotal provisions)273 Provision written back for sacrifice on interest in cdr/non cdr = prov w back sacrificeint
accounts ai of 264 (exptotal provisions)274 Provision provided for sacrifice on interest in cdr/non cdr =prov providedsacrificeint
accounts ai of 264 (exptotal provisions)275 Provision for restructured agriculture advances = prov restructagri adv
ai of 264 (exptotal provisions)276 Depreciation (net of transfer from revaluation reserves) =depreciation
= 277 - 280 + 278 + 279277 Depreciation = depownedast278 Depreciation for the year on leased out assets = dep leasedout ast279 Add : depreciation disclosed but not provided for the year = dep not providedfor280 Less: transfer from revaluation reserves = dep trf frm reval resv281 Amortisation = amortisation282 Preliminary expenses amortised = prelim exp amort
pcc of 281 (expamortisation)283 Capital issue expenses (expenses on issues of shares, = capissueexp amort
debentures, gdrs, etc.) amortised pcc of 281 (expamortisation)284 License fees amortised = licencefeesamort
pcc of 281 (expamortisation)285 Product development expenses amortised = prod dev amort
pcc of 281 (expamortisation)286 Project expenses/pre-operative expenses amortised = projpre op amort
pcc of 281 (expamortisation)287 Other amortisations = oth amort
pcc of 281 (expamortisation)288 Write-offs = write offs289 Bad debts / claims / advances written off = baddebtsclaimsadv w off
(Continued. . . )
Indicators August 2010
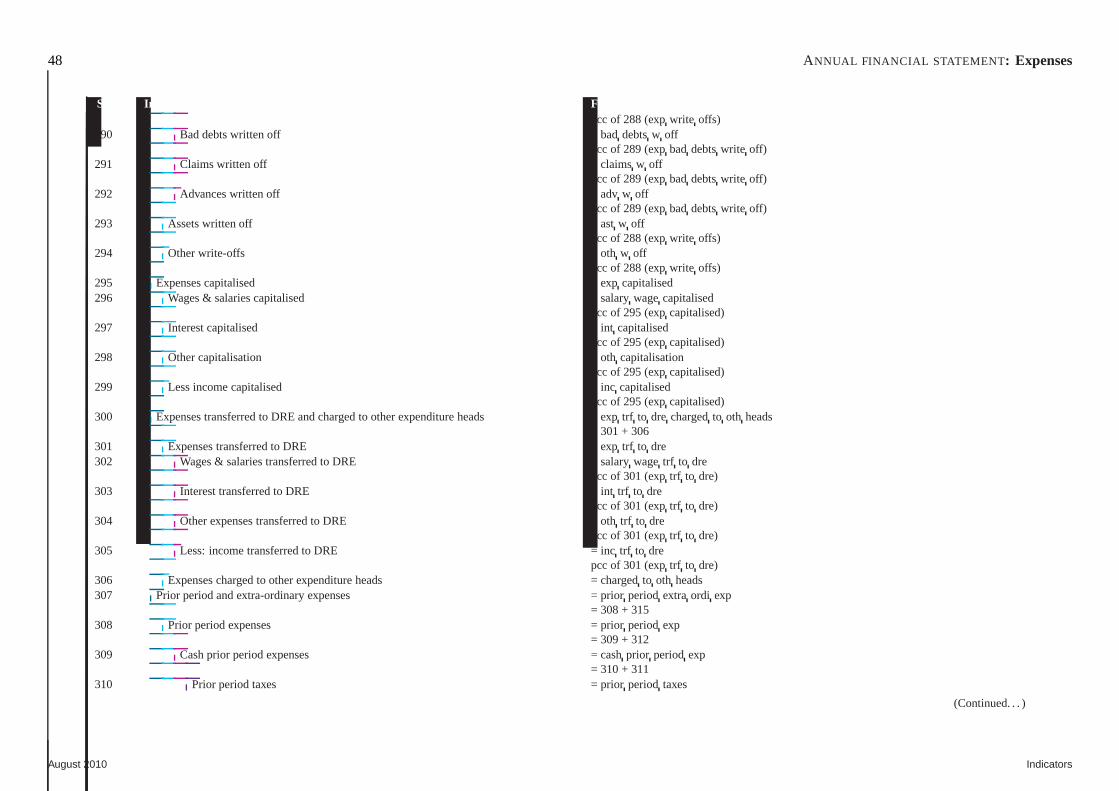
48 ANNUAL FINANCIAL STATEMENT : Expenses
Sr.No. Indicator Fields & formulapcc of 288 (expwrite offs)
290 Bad debts written off = baddebtsw offpcc of 289 (expbad debtswrite off)
291 Claims written off = claimsw offpcc of 289 (expbad debtswrite off)
292 Advances written off = adv w offpcc of 289 (expbad debtswrite off)
293 Assets written off = astw offpcc of 288 (expwrite offs)
294 Other write-offs = oth w offpcc of 288 (expwrite offs)
295 Expenses capitalised = exp capitalised296 Wages & salaries capitalised = salarywagecapitalised
pcc of 295 (expcapitalised)297 Interest capitalised = int capitalised
pcc of 295 (expcapitalised)298 Other capitalisation = oth capitalisation
pcc of 295 (expcapitalised)299 Less income capitalised = inc capitalised
pcc of 295 (expcapitalised)300 Expenses transferred to DRE and charged to other expenditure heads = exptrf to dre chargedto oth heads
= 301 + 306301 Expenses transferred to DRE = exp trf to dre302 Wages & salaries transferred to DRE = salarywagetrf to dre
pcc of 301 (exptrf to dre)303 Interest transferred to DRE = int trf to dre
pcc of 301 (exptrf to dre)304 Other expenses transferred to DRE = oth trf to dre
pcc of 301 (exptrf to dre)305 Less: income transferred to DRE = inc trf to dre
pcc of 301 (exptrf to dre)306 Expenses charged to other expenditure heads = chargedto oth heads307 Prior period and extra-ordinary expenses = prior period extraordi exp
= 308 + 315308 Prior period expenses = prior period exp
= 309 + 312309 Cash prior period expenses = cashprior period exp
= 310 + 311310 Prior period taxes = prior period taxes
(Continued. . . )
August 2010 Indicators
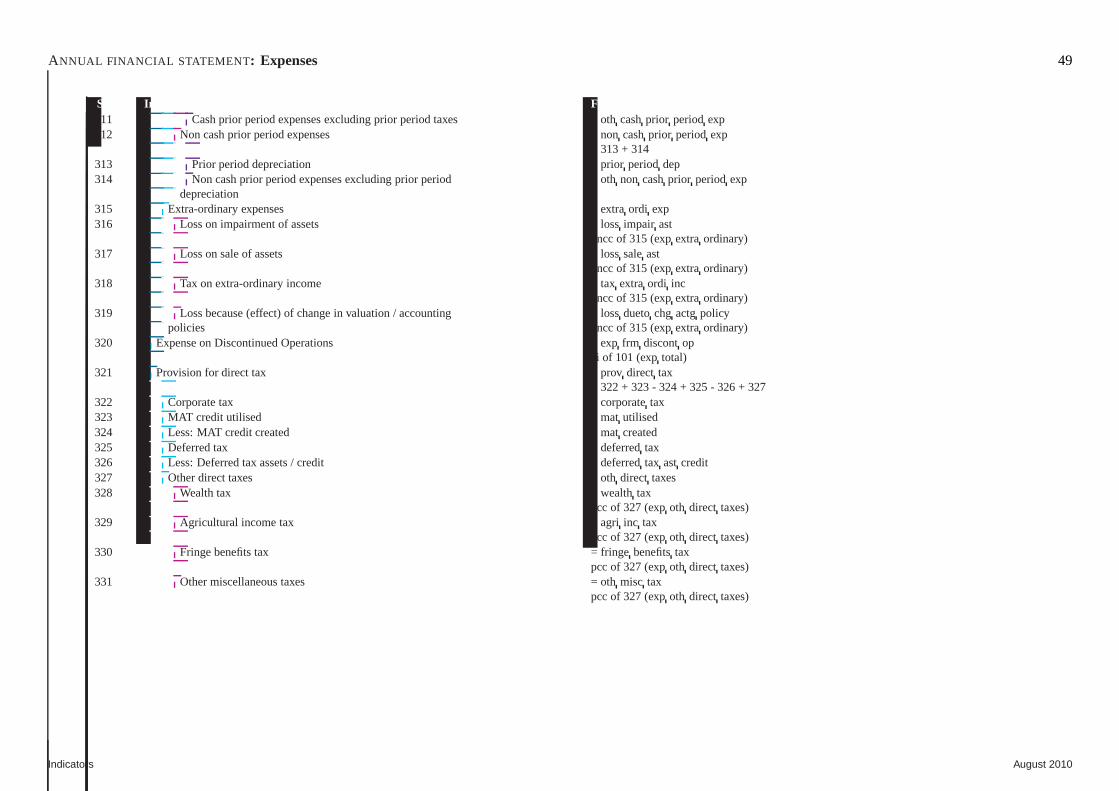
ANNUAL FINANCIAL STATEMENT : Expenses 49
Sr.No. Indicator Fields & formula311 Cash prior period expenses excluding prior period taxes = oth cashprior periodexp312 Non cash prior period expenses = non cashprior period exp
= 313 + 314313 Prior period depreciation = prior period dep314 Non cash prior period expenses excluding prior period = othnon cashprior periodexp
depreciation315 Extra-ordinary expenses = extraordi exp316 Loss on impairment of assets = loss impair ast
pncc of 315 (expextra ordinary)317 Loss on sale of assets = losssaleast
pncc of 315 (expextra ordinary)318 Tax on extra-ordinary income = tax extraordi inc
pncc of 315 (expextra ordinary)319 Loss because (effect) of change in valuation / accounting = lossduetochg actg policy
policies pncc of 315 (expextra ordinary)320 Expense on Discontinued Operations = exp frm discontop
ai of 101 (exptotal)321 Provision for direct tax = prov direct tax
= 322 + 323 - 324 + 325 - 326 + 327322 Corporate tax = corporatetax323 MAT credit utilised = mat utilised324 Less: MAT credit created = mat created325 Deferred tax = deferredtax326 Less: Deferred tax assets / credit = deferredtax ast credit327 Other direct taxes = oth direct taxes328 Wealth tax = wealth tax
pcc of 327 (expoth direct taxes)329 Agricultural income tax = agri inc tax
pcc of 327 (expoth direct taxes)330 Fringe benefits tax = fringe benefitstax
pcc of 327 (expoth direct taxes)331 Other miscellaneous taxes = oth misc tax
pcc of 327 (expoth direct taxes)
Indicators August 2010
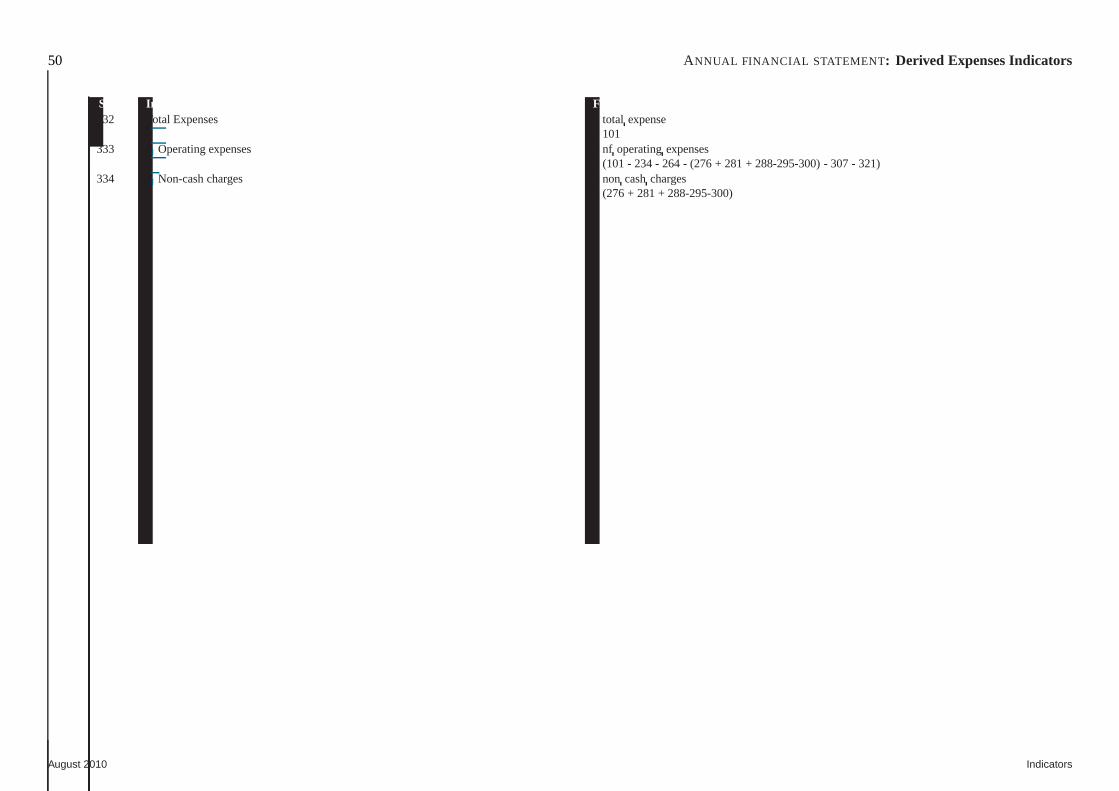
50 ANNUAL FINANCIAL STATEMENT : Derived Expenses Indicators
Sr.No. Indicator Fields & formula332 Total Expenses = total expense
= 101333 Operating expenses = nf operatingexpenses
= (101 - 234 - 264 - (276 + 281 + 288-295-300) - 307 - 321)334 Non-cash charges = non cashcharges
= (276 + 281 + 288-295-300)
August 2010 Indicators
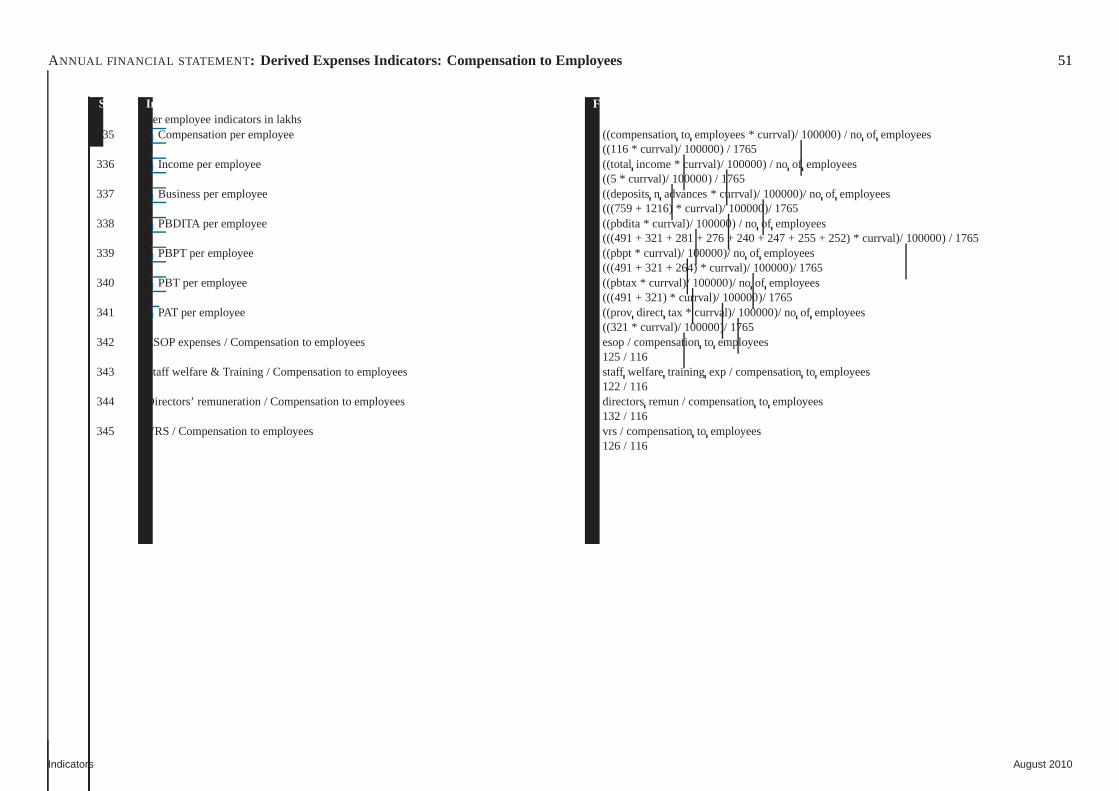
ANNUAL FINANCIAL STATEMENT : Derived Expenses Indicators: Compensation to Employees 51
Sr.No. Indicator Fields & formulaPer employee indicators in lakhs
335 Compensation per employee = ((compensationto employees * currval)/ 100000) / no of employees= ((116 * currval)/ 100000) / 1765
336 Income per employee = ((total income * currval)/ 100000) / no of employees= ((5 * currval)/ 100000) / 1765
337 Business per employee = ((depositsn advances * currval)/ 100000)/ no of employees= (((759 + 1216) * currval)/ 100000)/ 1765
338 PBDITA per employee = ((pbdita * currval)/ 100000) / no of employees= (((491 + 321 + 281 + 276 + 240 + 247 + 255 + 252) * currval)/ 100000) / 1765
339 PBPT per employee = ((pbpt * currval)/ 100000)/ no of employees= (((491 + 321 + 264) * currval)/ 100000)/ 1765
340 PBT per employee = ((pbtax * currval)/ 100000)/ no of employees= (((491 + 321) * currval)/ 100000)/ 1765
341 PAT per employee = ((prov direct tax * currval)/ 100000)/ no of employees= ((321 * currval)/ 100000)/ 1765
342 ESOP expenses / Compensation to employees = esop / compensationto employees= 125 / 116
343 Staff welfare & Training / Compensation to employees = staff welfare training exp / compensationto employees= 122 / 116
344 Directors’ remuneration / Compensation to employees = directorsremun / compensationto employees= 132 / 116
345 VRS / Compensation to employees = vrs / compensationto employees= 126 / 116
Indicators August 2010
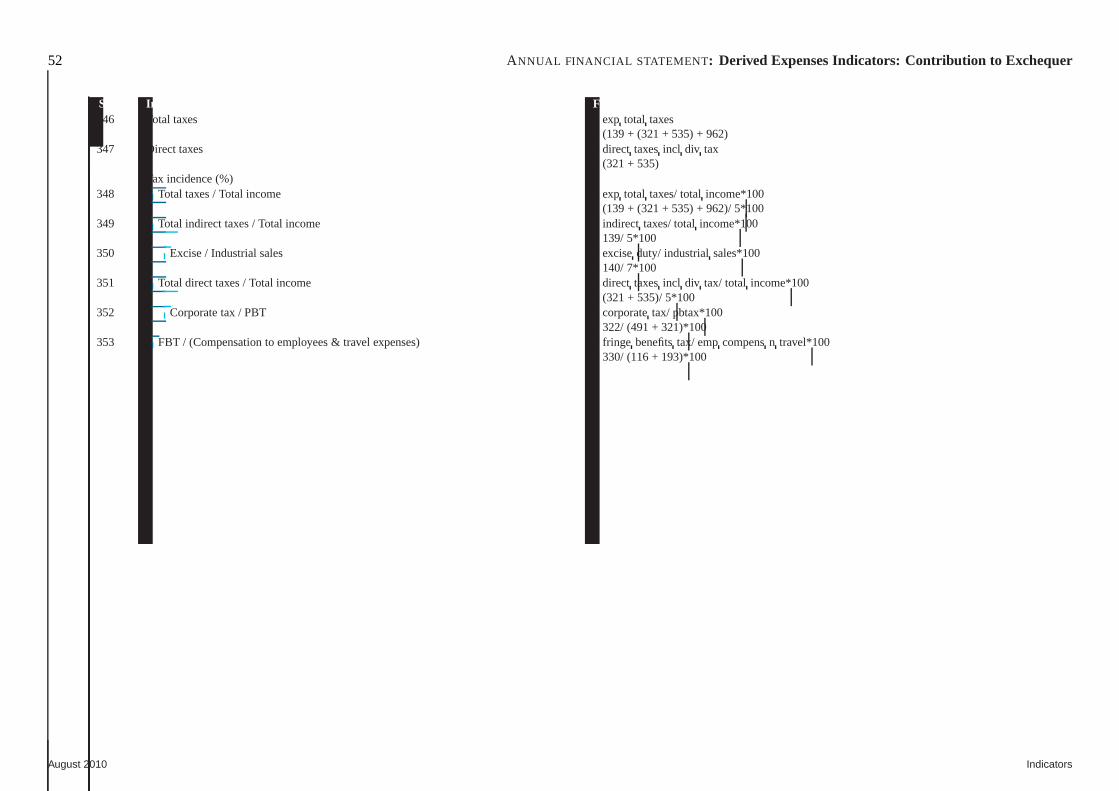
52 ANNUAL FINANCIAL STATEMENT : Derived Expenses Indicators: Contribution to Exchequer
Sr.No. Indicator Fields & formula346 Total taxes = exp total taxes
= (139 + (321 + 535) + 962)347 Direct taxes = direct taxesincl div tax
= (321 + 535)Tax incidence (%)
348 Total taxes / Total income = exp total taxes/ totalincome*100= (139 + (321 + 535) + 962)/ 5*100
349 Total indirect taxes / Total income = indirect taxes/ totalincome*100= 139/ 5*100
350 Excise / Industrial sales = exciseduty/ industrialsales*100= 140/ 7*100
351 Total direct taxes / Total income = direct taxesincl div tax/ total income*100= (321 + 535)/ 5*100
352 Corporate tax / PBT = corporatetax/ pbtax*100= 322/ (491 + 321)*100
353 FBT / (Compensation to employees & travel expenses) = fringebenefitstax/ empcompensn travel*100= 330/ (116 + 193)*100
August 2010 Indicators
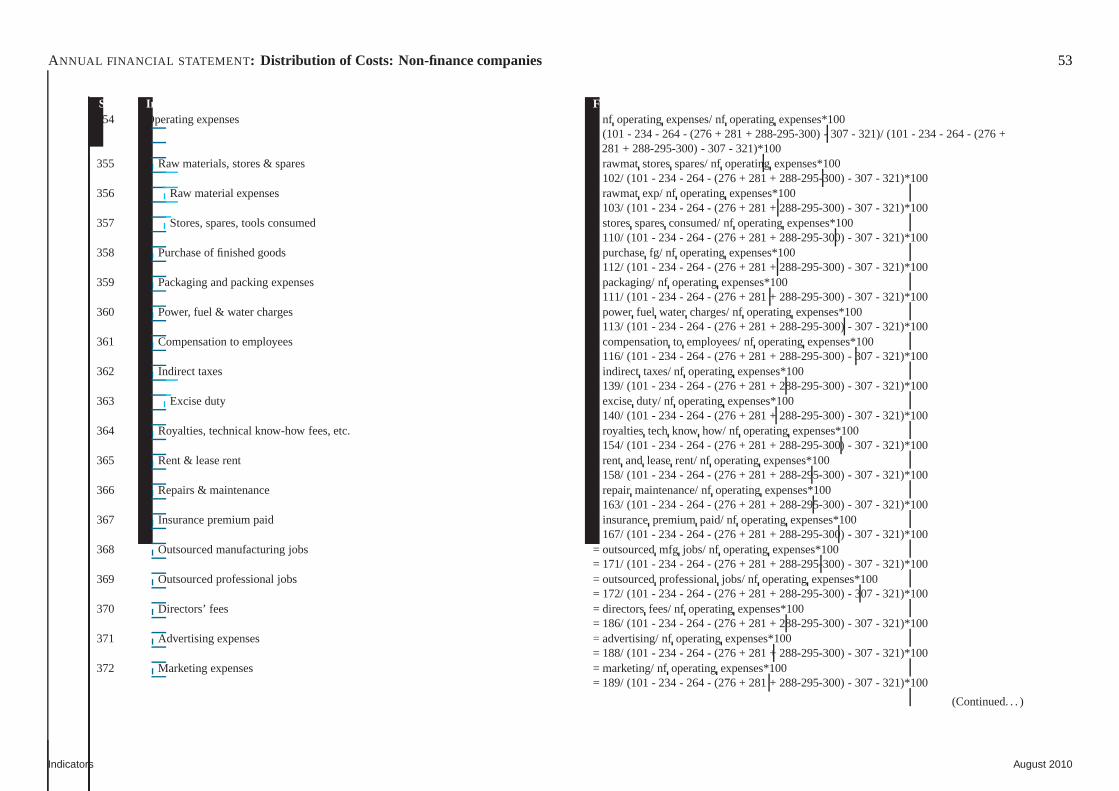
ANNUAL FINANCIAL STATEMENT : Distribution of Costs: Non-finance companies 53
Sr.No. Indicator Fields & formula354 Operating expenses = nf operatingexpenses/ nfoperatingexpenses*100
= (101 - 234 - 264 - (276 + 281 + 288-295-300) - 307 - 321)/ (101 - 234 - 264 - (276 +281 + 288-295-300) - 307 - 321)*100
355 Raw materials, stores & spares = rawmatstoresspares/ nfoperatingexpenses*100= 102/ (101 - 234 - 264 - (276 + 281 + 288-295-300) - 307 - 321)*100
356 Raw material expenses = rawmatexp/ nf operatingexpenses*100= 103/ (101 - 234 - 264 - (276 + 281 + 288-295-300) - 307 - 321)*100
357 Stores, spares, tools consumed = storessparesconsumed/ nfoperatingexpenses*100= 110/ (101 - 234 - 264 - (276 + 281 + 288-295-300) - 307 - 321)*100
358 Purchase of finished goods = purchasefg/ nf operatingexpenses*100= 112/ (101 - 234 - 264 - (276 + 281 + 288-295-300) - 307 - 321)*100
359 Packaging and packing expenses = packaging/ nfoperatingexpenses*100= 111/ (101 - 234 - 264 - (276 + 281 + 288-295-300) - 307 - 321)*100
360 Power, fuel & water charges = power fuel water charges/ nfoperatingexpenses*100= 113/ (101 - 234 - 264 - (276 + 281 + 288-295-300) - 307 - 321)*100
361 Compensation to employees = compensationto employees/ nfoperatingexpenses*100= 116/ (101 - 234 - 264 - (276 + 281 + 288-295-300) - 307 - 321)*100
362 Indirect taxes = indirect taxes/ nfoperatingexpenses*100= 139/ (101 - 234 - 264 - (276 + 281 + 288-295-300) - 307 - 321)*100
363 Excise duty = exciseduty/ nf operatingexpenses*100= 140/ (101 - 234 - 264 - (276 + 281 + 288-295-300) - 307 - 321)*100
364 Royalties, technical know-how fees, etc. = royaltiestechknow how/ nf operatingexpenses*100= 154/ (101 - 234 - 264 - (276 + 281 + 288-295-300) - 307 - 321)*100
365 Rent & lease rent = rent and leaserent/ nf operatingexpenses*100= 158/ (101 - 234 - 264 - (276 + 281 + 288-295-300) - 307 - 321)*100
366 Repairs & maintenance = repairmaintenance/ nfoperatingexpenses*100= 163/ (101 - 234 - 264 - (276 + 281 + 288-295-300) - 307 - 321)*100
367 Insurance premium paid = insurancepremiumpaid/ nf operatingexpenses*100= 167/ (101 - 234 - 264 - (276 + 281 + 288-295-300) - 307 - 321)*100
368 Outsourced manufacturing jobs = outsourcedmfg jobs/ nf operatingexpenses*100= 171/ (101 - 234 - 264 - (276 + 281 + 288-295-300) - 307 - 321)*100
369 Outsourced professional jobs = outsourcedprofessionaljobs/ nf operatingexpenses*100= 172/ (101 - 234 - 264 - (276 + 281 + 288-295-300) - 307 - 321)*100
370 Directors’ fees = directorsfees/ nfoperatingexpenses*100= 186/ (101 - 234 - 264 - (276 + 281 + 288-295-300) - 307 - 321)*100
371 Advertising expenses = advertising/ nfoperatingexpenses*100= 188/ (101 - 234 - 264 - (276 + 281 + 288-295-300) - 307 - 321)*100
372 Marketing expenses = marketing/ nfoperatingexpenses*100= 189/ (101 - 234 - 264 - (276 + 281 + 288-295-300) - 307 - 321)*100
(Continued. . . )
Indicators August 2010
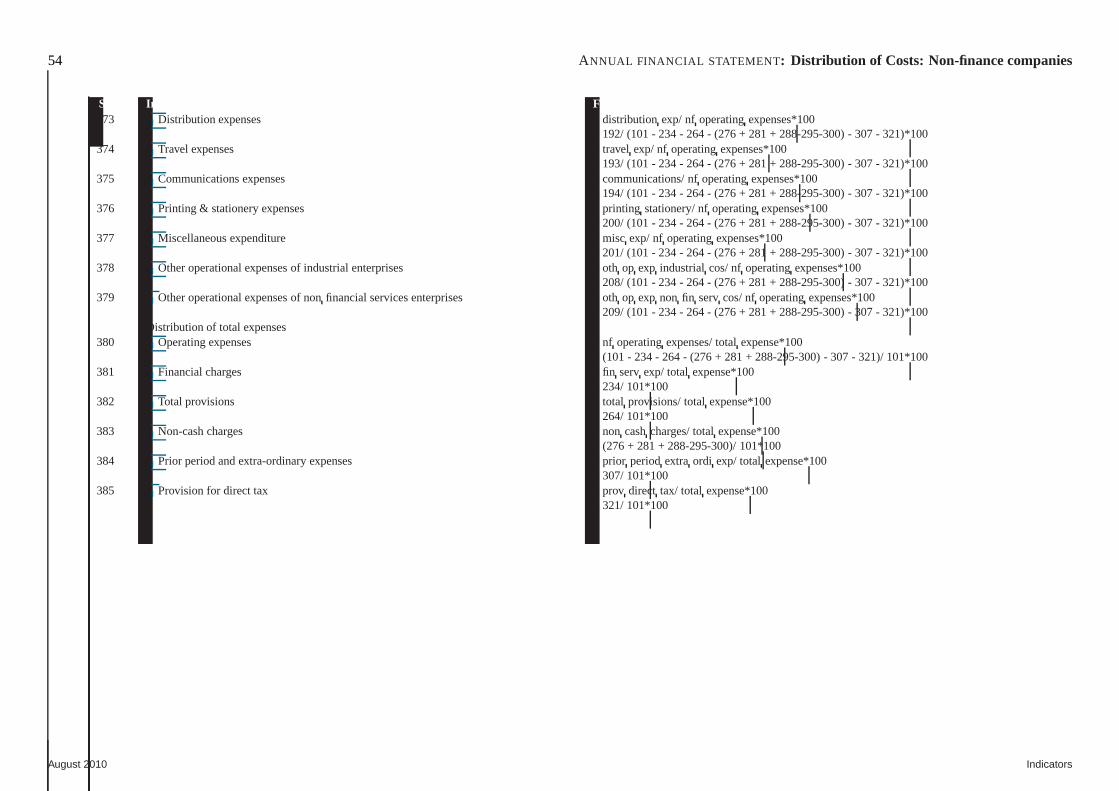
54 ANNUAL FINANCIAL STATEMENT : Distribution of Costs: Non-finance companies
Sr.No. Indicator Fields & formula373 Distribution expenses = distributionexp/ nf operatingexpenses*100
= 192/ (101 - 234 - 264 - (276 + 281 + 288-295-300) - 307 - 321)*100374 Travel expenses = travel exp/ nf operatingexpenses*100
= 193/ (101 - 234 - 264 - (276 + 281 + 288-295-300) - 307 - 321)*100375 Communications expenses = communications/ nfoperatingexpenses*100
= 194/ (101 - 234 - 264 - (276 + 281 + 288-295-300) - 307 - 321)*100376 Printing & stationery expenses = printing stationery/ nfoperatingexpenses*100
= 200/ (101 - 234 - 264 - (276 + 281 + 288-295-300) - 307 - 321)*100377 Miscellaneous expenditure = misc exp/ nf operatingexpenses*100
= 201/ (101 - 234 - 264 - (276 + 281 + 288-295-300) - 307 - 321)*100378 Other operational expenses of industrial enterprises = othop exp industrial cos/ nf operatingexpenses*100
= 208/ (101 - 234 - 264 - (276 + 281 + 288-295-300) - 307 - 321)*100379 Other operational expenses of nonfinancial services enterprises = othop exp non fin servcos/ nf operatingexpenses*100
= 209/ (101 - 234 - 264 - (276 + 281 + 288-295-300) - 307 - 321)*100Distribution of total expenses
380 Operating expenses = nf operatingexpenses/ totalexpense*100= (101 - 234 - 264 - (276 + 281 + 288-295-300) - 307 - 321)/ 101*100
381 Financial charges = fin serv exp/ totalexpense*100= 234/ 101*100
382 Total provisions = total provisions/ totalexpense*100= 264/ 101*100
383 Non-cash charges = non cashcharges/ totalexpense*100= (276 + 281 + 288-295-300)/ 101*100
384 Prior period and extra-ordinary expenses = prior periodextra ordi exp/ totalexpense*100= 307/ 101*100
385 Provision for direct tax = prov direct tax/ total expense*100= 321/ 101*100
August 2010 Indicators
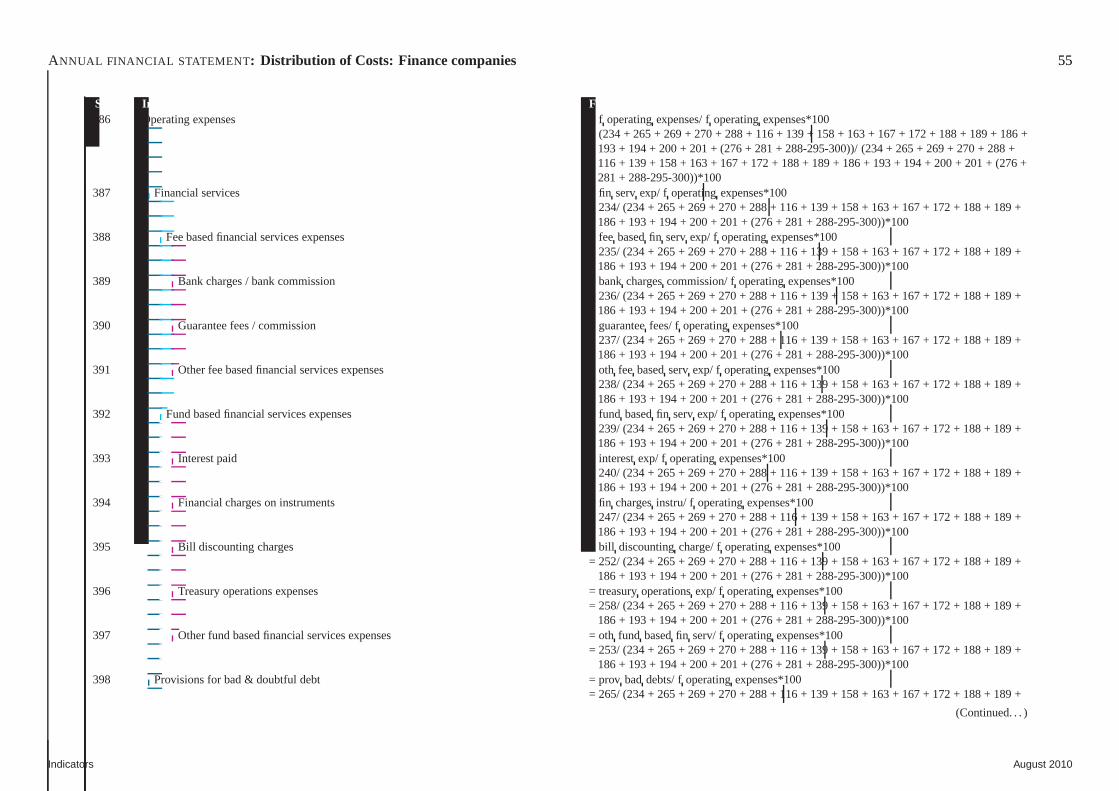
ANNUAL FINANCIAL STATEMENT : Distribution of Costs: Finance companies 55
Sr.No. Indicator Fields & formula386 Operating expenses = f operatingexpenses/ foperatingexpenses*100
= (234 + 265 + 269 + 270 + 288 + 116 + 139 + 158 + 163 + 167 + 172 + 188 + 189 + 186 +193 + 194 + 200 + 201 + (276 + 281 + 288-295-300))/ (234 + 265 + 269+ 270 + 288 +116 + 139 + 158 + 163 + 167 + 172 + 188 + 189 + 186 + 193 + 194 + 200 + 201+ (276 +281 + 288-295-300))*100
387 Financial services = fin servexp/ f operatingexpenses*100= 234/ (234 + 265 + 269 + 270 + 288 + 116 + 139 + 158 + 163 + 167 + 172 + 188 + 189 +
186 + 193 + 194 + 200 + 201 + (276 + 281 + 288-295-300))*100388 Fee based financial services expenses = fee basedfin servexp/ f operatingexpenses*100
= 235/ (234 + 265 + 269 + 270 + 288 + 116 + 139 + 158 + 163 + 167 + 172 + 188 + 189 +186 + 193 + 194 + 200 + 201 + (276 + 281 + 288-295-300))*100
389 Bank charges / bank commission = bankchargescommission/ foperatingexpenses*100= 236/ (234 + 265 + 269 + 270 + 288 + 116 + 139 + 158 + 163 + 167 + 172 + 188 + 189 +
186 + 193 + 194 + 200 + 201 + (276 + 281 + 288-295-300))*100390 Guarantee fees / commission = guaranteefees/ f operatingexpenses*100
= 237/ (234 + 265 + 269 + 270 + 288 + 116 + 139 + 158 + 163 + 167 + 172 + 188 + 189 +186 + 193 + 194 + 200 + 201 + (276 + 281 + 288-295-300))*100
391 Other fee based financial services expenses = oth fee basedserv exp/ f operatingexpenses*100= 238/ (234 + 265 + 269 + 270 + 288 + 116 + 139 + 158 + 163 + 167 + 172 + 188 + 189 +
186 + 193 + 194 + 200 + 201 + (276 + 281 + 288-295-300))*100392 Fund based financial services expenses = fund basedfin servexp/ f operatingexpenses*100
= 239/ (234 + 265 + 269 + 270 + 288 + 116 + 139 + 158 + 163 + 167 + 172 + 188 + 189 +186 + 193 + 194 + 200 + 201 + (276 + 281 + 288-295-300))*100
393 Interest paid = interestexp/ f operatingexpenses*100= 240/ (234 + 265 + 269 + 270 + 288 + 116 + 139 + 158 + 163 + 167 + 172 + 188 + 189 +
186 + 193 + 194 + 200 + 201 + (276 + 281 + 288-295-300))*100394 Financial charges on instruments = fin chargesinstru/ f operatingexpenses*100
= 247/ (234 + 265 + 269 + 270 + 288 + 116 + 139 + 158 + 163 + 167 + 172 + 188 + 189 +186 + 193 + 194 + 200 + 201 + (276 + 281 + 288-295-300))*100
395 Bill discounting charges = bill discountingcharge/ foperatingexpenses*100= 252/ (234 + 265 + 269 + 270 + 288 + 116 + 139 + 158 + 163 + 167 + 172 + 188 + 189 +
186 + 193 + 194 + 200 + 201 + (276 + 281 + 288-295-300))*100396 Treasury operations expenses = treasuryoperationsexp/ f operatingexpenses*100
= 258/ (234 + 265 + 269 + 270 + 288 + 116 + 139 + 158 + 163 + 167 + 172 + 188 + 189 +186 + 193 + 194 + 200 + 201 + (276 + 281 + 288-295-300))*100
397 Other fund based financial services expenses = oth fund basedfin serv/ f operatingexpenses*100= 253/ (234 + 265 + 269 + 270 + 288 + 116 + 139 + 158 + 163 + 167 + 172 + 188 + 189 +
186 + 193 + 194 + 200 + 201 + (276 + 281 + 288-295-300))*100398 Provisions for bad & doubtful debt = prov baddebts/ foperatingexpenses*100
= 265/ (234 + 265 + 269 + 270 + 288 + 116 + 139 + 158 + 163 + 167 + 172 + 188 + 189 +
(Continued. . . )
Indicators August 2010
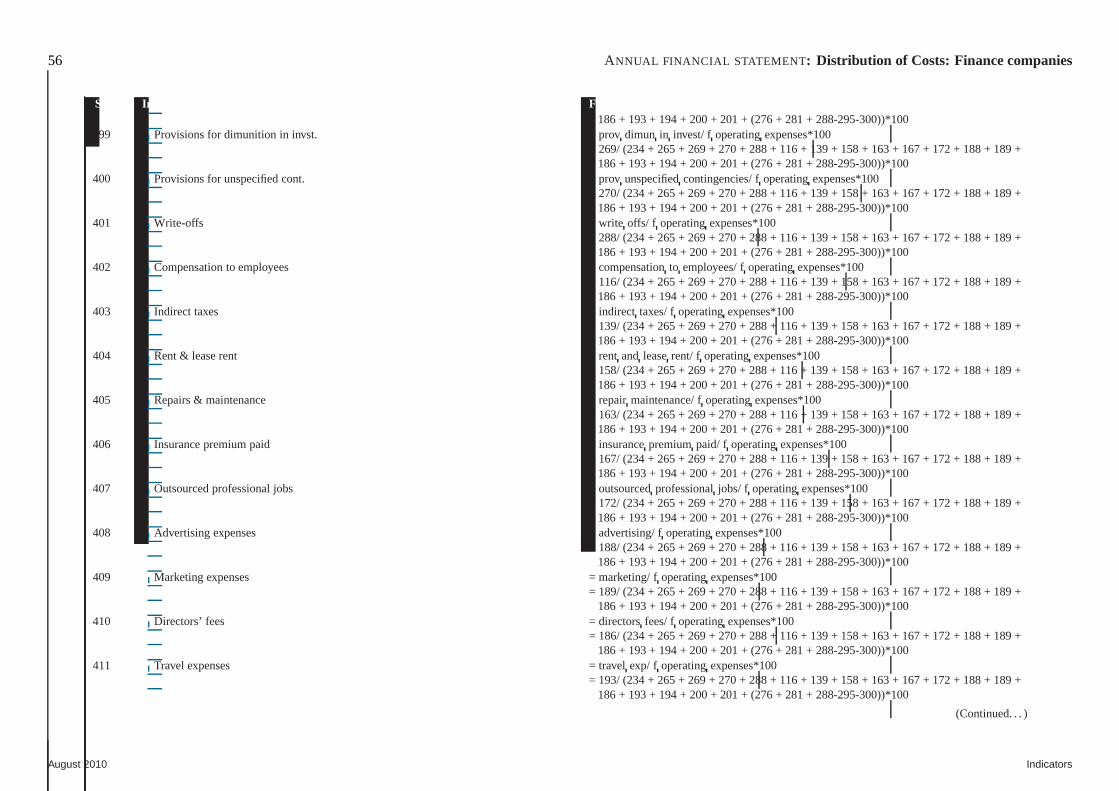
56 ANNUAL FINANCIAL STATEMENT : Distribution of Costs: Finance companies
Sr.No. Indicator Fields & formula186 + 193 + 194 + 200 + 201 + (276 + 281 + 288-295-300))*100
399 Provisions for dimunition in invst. = prov dimun in invest/ f operatingexpenses*100= 269/ (234 + 265 + 269 + 270 + 288 + 116 + 139 + 158 + 163 + 167 + 172 + 188 + 189 +
186 + 193 + 194 + 200 + 201 + (276 + 281 + 288-295-300))*100400 Provisions for unspecified cont. = prov unspecifiedcontingencies/ foperatingexpenses*100
= 270/ (234 + 265 + 269 + 270 + 288 + 116 + 139 + 158 + 163 + 167 + 172 + 188 + 189 +186 + 193 + 194 + 200 + 201 + (276 + 281 + 288-295-300))*100
401 Write-offs = write offs/ f operatingexpenses*100= 288/ (234 + 265 + 269 + 270 + 288 + 116 + 139 + 158 + 163 + 167 + 172 + 188 + 189 +
186 + 193 + 194 + 200 + 201 + (276 + 281 + 288-295-300))*100402 Compensation to employees = compensationto employees/ foperatingexpenses*100
= 116/ (234 + 265 + 269 + 270 + 288 + 116 + 139 + 158 + 163 + 167 + 172 + 188 + 189 +186 + 193 + 194 + 200 + 201 + (276 + 281 + 288-295-300))*100
403 Indirect taxes = indirect taxes/ foperatingexpenses*100= 139/ (234 + 265 + 269 + 270 + 288 + 116 + 139 + 158 + 163 + 167 + 172 + 188 + 189 +
186 + 193 + 194 + 200 + 201 + (276 + 281 + 288-295-300))*100404 Rent & lease rent = rent and leaserent/ f operatingexpenses*100
= 158/ (234 + 265 + 269 + 270 + 288 + 116 + 139 + 158 + 163 + 167 + 172 + 188 + 189 +186 + 193 + 194 + 200 + 201 + (276 + 281 + 288-295-300))*100
405 Repairs & maintenance = repairmaintenance/ foperatingexpenses*100= 163/ (234 + 265 + 269 + 270 + 288 + 116 + 139 + 158 + 163 + 167 + 172 + 188 + 189 +
186 + 193 + 194 + 200 + 201 + (276 + 281 + 288-295-300))*100406 Insurance premium paid = insurancepremiumpaid/ f operatingexpenses*100
= 167/ (234 + 265 + 269 + 270 + 288 + 116 + 139 + 158 + 163 + 167 + 172 + 188 + 189 +186 + 193 + 194 + 200 + 201 + (276 + 281 + 288-295-300))*100
407 Outsourced professional jobs = outsourcedprofessionaljobs/ f operatingexpenses*100= 172/ (234 + 265 + 269 + 270 + 288 + 116 + 139 + 158 + 163 + 167 + 172 + 188 + 189 +
186 + 193 + 194 + 200 + 201 + (276 + 281 + 288-295-300))*100408 Advertising expenses = advertising/ foperatingexpenses*100
= 188/ (234 + 265 + 269 + 270 + 288 + 116 + 139 + 158 + 163 + 167 + 172 + 188 + 189 +186 + 193 + 194 + 200 + 201 + (276 + 281 + 288-295-300))*100
409 Marketing expenses = marketing/ foperatingexpenses*100= 189/ (234 + 265 + 269 + 270 + 288 + 116 + 139 + 158 + 163 + 167 + 172 + 188 + 189 +
186 + 193 + 194 + 200 + 201 + (276 + 281 + 288-295-300))*100410 Directors’ fees = directorsfees/ f operatingexpenses*100
= 186/ (234 + 265 + 269 + 270 + 288 + 116 + 139 + 158 + 163 + 167 + 172 + 188 + 189 +186 + 193 + 194 + 200 + 201 + (276 + 281 + 288-295-300))*100
411 Travel expenses = travel exp/ f operatingexpenses*100= 193/ (234 + 265 + 269 + 270 + 288 + 116 + 139 + 158 + 163 + 167 + 172 + 188 + 189 +
186 + 193 + 194 + 200 + 201 + (276 + 281 + 288-295-300))*100
(Continued. . . )
August 2010 Indicators
ANNUAL FINANCIAL STATEMENT : Distribution of Costs: Finance companies 57
Sr.No. Indicator Fields & formula412 Communication expenses = communications/ foperatingexpenses*100
= 194/ (234 + 265 + 269 + 270 + 288 + 116 + 139 + 158 + 163 + 167 + 172 + 188 + 189 +186 + 193 + 194 + 200 + 201 + (276 + 281 + 288-295-300))*100
413 Printing & stationery expenses = printing stationery/ foperatingexpenses*100= 200/ (234 + 265 + 269 + 270 + 288 + 116 + 139 + 158 + 163 + 167 + 172 + 188 + 189 +
186 + 193 + 194 + 200 + 201 + (276 + 281 + 288-295-300))*100414 Miscellaneous expenditure = misc exp/ f operatingexpenses*100
= 201/ (234 + 265 + 269 + 270 + 288 + 116 + 139 + 158 + 163 + 167 + 172 + 188 + 189 +186 + 193 + 194 + 200 + 201 + (276 + 281 + 288-295-300))*100
415 Non-cash charges = non cashcharges/ noncashcharges*100= (276 + 281 + 288-295-300)/ (276 + 281 + 288-295-300)*100
416 Depreciation = depreciation/ noncashcharges*100= 276/ (276 + 281 + 288-295-300)*100
417 Amortisation = amortisation/ noncashcharges*100= 281/ (276 + 281 + 288-295-300)*100
418 Expenses capitalised = (exp capitalised/ noncashcharges*-100)= (295/ (276 + 281 + 288-295-300)*-100)
419 DRE & expenses charged to others = (exp trf to dre chargedto oth heads/ noncashcharges*-100)= (300/ (276 + 281 + 288-295-300)*-100)
Distribution of total expenses420 Operating expenses = f operatingexpenses/ totalexpense*100
= (234 + 265 + 269 + 270 + 288 + 116 + 139 + 158 + 163 + 167 + 172 + 188 + 189 + 186 +193 + 194 + 200 + 201 + (276 + 281 + 288-295-300))/ 101*100
421 Non-cash charges = non cashcharges/ totalexpense*100= (276 + 281 + 288-295-300)/ 101*100
422 Prior period and extra-ordinary expenses = prior period extraordi exp/ totalexpense*100= 307/ 101*100
423 Provision for direct tax = prov direct tax/ total expense*100= 321/ 101*100
Indicators August 2010
58 ANNUAL FINANCIAL STATEMENT : Operating Costs as per cent of Sales
Sr.No. Indicator Fields & formula424 Operating expenses = nf operatingexpenses/ salesn chg in stk*100
= (101 - 234 - 264 - (276 + 281 + 288-295-300) - 307 - 321)/ (6 + 80)*100425 Raw materials, stores & spares = rawmatstoresspares/ salesn chg in stk*100
= 102/ (6 + 80)*100426 Raw material expenses = rawmatexp/ salesn chg in stk*100
= 103/ (6 + 80)*100427 Stores, spares, tools consumed = storessparesconsumed/ salesn chg in stk*100
= 110/ (6 + 80)*100428 Purchase of finished goods = purchasefg/ salesn chg in stk*100
= 112/ (6 + 80)*100429 Packaging expenses = packaging/ salesn chg in stk*100
= 111/ (6 + 80)*100430 Power, fuel & water charges = power fuel water charges/ salesn chg in stk*100
= 113/ (6 + 80)*100431 Compensation to employees = compensationto employees/ salesn chg in stk*100
= 116/ (6 + 80)*100432 Salaries, wages, bonus, ex gratia pf & gratuties paid = salaries bonuspf/ salesn chg in stk*100
= 117/ (6 + 80)*100433 Staff welfare & training expenses = staff welfare training exp/ salesn chg in stk*100
= 122/ (6 + 80)*100434 Indirect taxes = indirect taxes/ salesn chg in stk*100
= 139/ (6 + 80)*100435 Excise duty = exciseduty/ salesn chg in stk*100
= 140/ (6 + 80)*100436 Royalties, technical know-how fees, etc. = royaltiestechknow how/ salesn chg in stk*100
= 154/ (6 + 80)*100437 Rent & lease rent = rent and leaserent/ salesn chg in stk*100
= 158/ (6 + 80)*100438 Repairs & maintenance = repairmaintenance/ salesn chg in stk*100
= 163/ (6 + 80)*100439 Insurance premium paid = insurancepremiumpaid/ salesn chg in stk*100
= 167/ (6 + 80)*100440 Outsourced manufacturing jobs = outsourcedmfg jobs/ salesn chg in stk*100
= 171/ (6 + 80)*100441 Outsourced professional jobs = outsourcedprofessionaljobs/ salesn chg in stk*100
= 172/ (6 + 80)*100442 Directors’ fees = directorsfees/ salesn chg in stk*100
= 186/ (6 + 80)*100443 Advertising expenses = advertising/ salesn chg in stk*100
(Continued. . . )
August 2010 Indicators
ANNUAL FINANCIAL STATEMENT : Operating Costs as per cent of Sales 59
Sr.No. Indicator Fields & formula= 188/ (6 + 80)*100
444 Marketing expenses = marketing/ salesn chg in stk*100= 189/ (6 + 80)*100
445 Distribution expenses = distributionexp/ salesn chg in stk*100= 192/ (6 + 80)*100
446 Travel expenses = travel exp/ salesn chg in stk*100= 193/ (6 + 80)*100
447 Communication expenses = communications/ salesn chg in stk*100= 194/ (6 + 80)*100
448 Printing & stationery expenses = printing stationery/ salesn chg in stk*100= 200/ (6 + 80)*100
449 Miscellaneous expenditure = misc exp/ salesn chg in stk*100= 201/ (6 + 80)*100
450 Other operational expenses of industrial enterprises = othop exp industrial cos/ salesn chg in stk*100= 208/ (6 + 80)*100
451 Operational expenses of non-fin. services enterprises = othop exp non fin servcos/ salesn chg in stk*100= 209/ (6 + 80)*100
Indicators August 2010
60 ANNUAL FINANCIAL STATEMENT : Operating Costs as per cent of Income
Sr.No. Indicator Fields & formula452 Fee based financial services expenses = fee basedfin serv exp/ incfin serv*100
= 235/ 25*100453 Bank charges / bank commission = bankchargescommission/ incfin serv*100
= 236/ 25*100454 Guarantee fees / commission = guaranteefees/ incfin serv*100
= 237/ 25*100455 Other fee based financial services expenses = oth fee basedservexp/ incfin serv*100
= 238/ 25*100456 Fund based financial services expenses = fund basedfin serv exp/ incfin serv*100
= 239/ 25*100457 Interest paid = interestexp/ incfin serv*100
= 240/ 25*100458 Financial charges on instruments = fin chargesinstru/ incfin serv*100
= 247/ 25*100459 Bill discounting charges = bill discountingcharge/ incfin serv*100
= 252/ 25*100460 Treasury operations expenses = treasuryoperationsexp/ inc fin serv*100
= 258/ 25*100461 Other fund based financial services expenses = oth fund basedfin serv/ incfin serv*100
= 253/ 25*100462 Compensation to employees = compensationto employees/ incfin serv*100
= 116/ 25*100463 Indirect taxes = indirect taxes/ incfin serv*100
= 139/ 25*100464 Rent & lease rent = rent and leaserent/ incfin serv*100
= 158/ 25*100465 Repairs & maintenance = repairmaintenance/ incfin serv*100
= 163/ 25*100466 Insurance premium paid = insurancepremiumpaid/ inc fin serv*100
= 167/ 25*100467 Outsourced professional jobs = outsourcedprofessionaljobs/ inc fin serv*100
= 172/ 25*100468 Advertising expenses = advertising/ incfin serv*100
= 188/ 25*100469 Marketing expenses = marketing/ incfin serv*100
= 189/ 25*100470 Directors’ fees = directorsfees/ incfin serv*100
= 186/ 25*100471 Travel expenses = travel exp/ incfin serv*100
(Continued. . . )
August 2010 Indicators
ANNUAL FINANCIAL STATEMENT : Operating Costs as per cent of Income 61
Sr.No. Indicator Fields & formula= 193/ 25*100
472 Communication expenses = communications/ incfin serv*100= 194/ 25*100
473 Printing & stationery expenses = printing stationery/ incfin serv*100= 200/ 25*100
474 Miscellaneous expenditure = misc exp/ incfin serv*100= 201/ 25*100
475 Provisions & contingencies = total provisions/ incfin serv*100= 264/ 25*100
476 Depreciation (net of transfer from reval. reserves) = depreciation/ incfin serv*100= 276/ 25*100
477 Amortisation = amortisation/ incfin serv*100= 281/ 25*100
478 Prior period and extra-ordinary expenses = prior periodextra ordi exp/ incfin serv*100= 307/ 25*100
479 Prior period expenses = prior periodexp/ incfin serv*100= 308/ 25*100
480 Extra-ordinary expenses = extraordi exp/ incfin serv*100= 315/ 25*100
481 Provision for direct tax = prov direct tax/ inc fin serv*100= 321/ 25*100
Indicators August 2010
62 ANNUAL FINANCIAL STATEMENT : Import Intensity of Raw Materials
Sr.No. Indicator Fields & formula482 Raw materials consumed = 100*(indigenousimportedrawmattotal/ indigenousimportedrawmattotal)
= 100*(1753/ 1753)483 Indigenous = 100*(indigenousrawmat/ indigenousimportedrawmattotal)
= 100*(1754/ 1753)484 Imported = 100*(imported rawmat/ indigenousimportedrawmattotal)
= 100*(1755/ 1753)485 Stores & spares(components) consumed = 100*(storessparesconsumed/ storessparesconsumed)
= 100*(110/ 110)486 Indigenous = 100*(indigenousstoresspares/ storessparesconsumed)
= 100*(1757/ 110)487 Imported = 100*(imported storesspares/ storessparesconsumed)
= 100*(1758/ 110)488 Others consumed = 100*(indigenousimportedoth consumptotal/
indigenousimportedoth consumptotal)= 100*(1759/ 1759)
489 Indigenous = 100*(indigenousconsumpoth/ indigenousimportedoth consumptotal)= 100*(1760/ 1759)
490 Imported = 100*(imported consumpoth/ indigenousimportedoth consumptotal)= 100*(1761/ 1759)
August 2010 Indicators
ANNUAL FINANCIAL STATEMENT : Profits & Its Appropriation 63
Sr.No. Indicator Fields & formula491 Profit after tax = pat
= 5 + 80 - 101492 Minority interest = minority int493 Share in profit/loss in associate/jv = sharein profit loss in assoc494 Profit after tax (as reported by the company) = reportedpat495 Difference between normalised pat and pat as reported bythe company = diffin pat
= 491 + 492 + 493 - 494Reconcilliation of Difference in pat (CHECK)
496 Difference due to prior period and extra-ordinary income = dp prior period extraordi inc= 497 + 508 + 512
497 Difference due to prior period income = dp prior period inc= 498 + 501
498 Difference due to cash prior period income = dp cashprior period inc= 499 + 500
499 Difference due to bad debts recovered = dp bad debtsrecovered500 Difference due to cash prior period income excluding bad = dpoth cashprior period inc
debts recovered501 Difference due to non-cash prior period income = dpnon cashprior period inc
= 502 + 507502 Difference due to provisions written back = dp prov w back
= 503 + 504 + 505 + 506503 Difference due to depreciation provision written back = dpdep prov w back504 Difference due to tax provisions written back = dptax prov w back505 Difference due to bad debts provision written back = dpbad debtsprov w back506 Difference due to other provisions / Credit balances = dpoth prov credit bal w back
written back507 Difference due to non-cash prior period income excluding = dp oth non cashprior period inc
provisions written back508 Difference due to extra-ordinary income = dp extraordi inc509 Difference due to profit on sale of fixed assets = dpgain saleof ast
pncc of 508 (dpextraordinary income)510 Difference due to insurance claims = dp insuranceclaims
pncc of 508 (dpextraordinary income)511 Difference due to contra entry for depreciation added by = dpcmie contraentry dep
pncc of 508 (dpextraordinary income)512 Difference due to gain on change in accounting policies = dpgain duetochg actgpolicy
pncc of 508 (dpextraordinary income)513 Difference due to transfer to reserves = dp trf to resv514 Difference due to other factors increasing normalised pat =dp oth factorsincr norm pat
(Continued. . . )
Indicators August 2010
64 ANNUAL FINANCIAL STATEMENT : Profits & Its Appropriation
Sr.No. Indicator Fields & formula515 Difference due to prior period and extra-ordinary expenses = dp prior period extraordi exp
= 516 + 523 + 527516 Difference due to prior period expenses = dp prior period exp
= 517 + 520517 Difference due to cash prior period expenses = dp cashprior period exp
= 518 + 519518 Difference due to prior period taxes = dp prior period taxes519 Difference due to cash prior period expenses excluding prior = dp oth cashprior period exp
period taxes520 Difference due to non cash prior period expenses = dpnon cashprior period exp
= 521 + 522521 Difference due to prior period depreciation = dp prior period dep522 Difference due to non cash prior period expenses excluding =dp oth non cashprior period exp
prior period depreciation523 Difference due to extra-ordinary expenses = dp extraordi exp524 Difference due to loss on impairment of assets = dploss impair ast
pncc of 523 (dpexp extraordinary)525 Difference due to loss on sale of assets = dp losssaleast
pncc of 523 (dpexp extraordinary)526 Difference due to tax on extra-ordinary income = dptax extraordi inc
pncc of 523 (dpexp extraordinary)527 Difference due to loss because (effect) of change in valuation = dp lossduetochg actgpolicy
/ accounting policies528 Difference due to transfer from reserves = dp trf frm resv529 Difference due to other factors decreasing normalised pat =dp oth factorsdecrnorm pat530 Dividend paid /proposed (provision = total div
= 531 + 534 + 535531 Equity dividend = equity div inc dist
= 532 + 533532 Interim dividend = equity div interim533 Final dividend (including special dividend) = equity div final534 Preference dividend = pref div535 Dividend tax = div tax536 Retained profits = retainedprofits
= 491 - 530537 Transfer from reserves = trf frm resv
= 538 + 539 + 540 + 541 + 542 + 543 + 544 + 545 + 546 + 547 + 548 + 549 + 550538 Transfer from Capital Reserve (incl. grants, subsidies etc.) = trf frm capital resv539 Transfer from Securities Premium Reserve = trf frm sharepremiumresv
(Continued. . . )
August 2010 Indicators
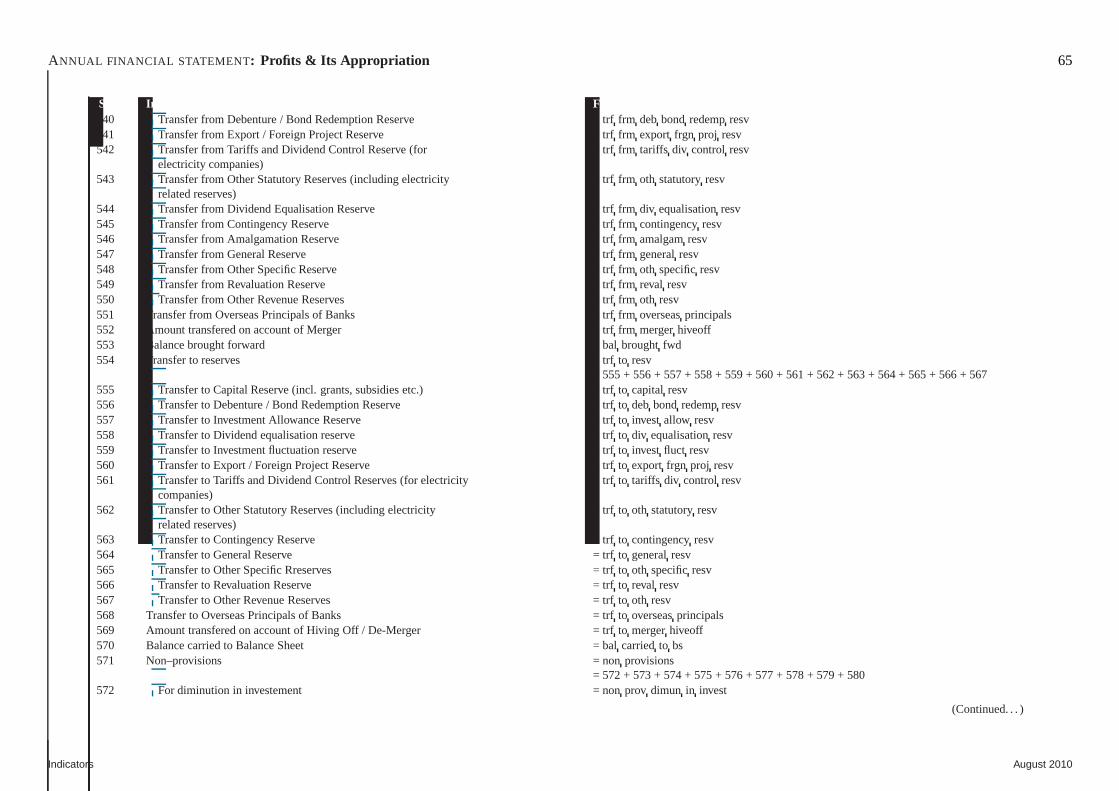
ANNUAL FINANCIAL STATEMENT : Profits & Its Appropriation 65
Sr.No. Indicator Fields & formula540 Transfer from Debenture / Bond Redemption Reserve = trffrm debbond redempresv541 Transfer from Export / Foreign Project Reserve = trf frm export frgn proj resv542 Transfer from Tariffs and Dividend Control Reserve (for = trf frm tariffs div control resv
electricity companies)543 Transfer from Other Statutory Reserves (including electricity = trf frm oth statutoryresv
related reserves)544 Transfer from Dividend Equalisation Reserve = trf frm div equalisationresv545 Transfer from Contingency Reserve = trf frm contingencyresv546 Transfer from Amalgamation Reserve = trf frm amalgamresv547 Transfer from General Reserve = trf frm generalresv548 Transfer from Other Specific Reserve = trf frm oth specificresv549 Transfer from Revaluation Reserve = trf frm reval resv550 Transfer from Other Revenue Reserves = trf frm oth resv551 Transfer from Overseas Principals of Banks = trf frm overseasprincipals552 Amount transfered on account of Merger = trf frm mergerhiveoff553 Balance brought forward = bal broughtfwd554 Transfer to reserves = trf to resv
= 555 + 556 + 557 + 558 + 559 + 560 + 561 + 562 + 563 + 564 + 565 + 566 + 567555 Transfer to Capital Reserve (incl. grants, subsidies etc.) = trf to capital resv556 Transfer to Debenture / Bond Redemption Reserve = trfto deb bond redempresv557 Transfer to Investment Allowance Reserve = trf to invest allow resv558 Transfer to Dividend equalisation reserve = trf to div equalisationresv559 Transfer to Investment fluctuation reserve = trf to invest fluct resv560 Transfer to Export / Foreign Project Reserve = trf to export frgn proj resv561 Transfer to Tariffs and Dividend Control Reserves (for electricity = trf to tariffs div control resv
companies)562 Transfer to Other Statutory Reserves (including electricity = trf to oth statutoryresv
related reserves)563 Transfer to Contingency Reserve = trf to contingencyresv564 Transfer to General Reserve = trf to generalresv565 Transfer to Other Specific Rreserves = trf to oth specificresv566 Transfer to Revaluation Reserve = trf to reval resv567 Transfer to Other Revenue Reserves = trf to oth resv568 Transfer to Overseas Principals of Banks = trf to overseasprincipals569 Amount transfered on account of Hiving Off / De-Merger = trf to mergerhiveoff570 Balance carried to Balance Sheet = bal carriedto bs571 Non–provisions = non provisions
= 572 + 573 + 574 + 575 + 576 + 577 + 578 + 579 + 580572 For diminution in investement = non prov dimun in invest
(Continued. . . )
Indicators August 2010
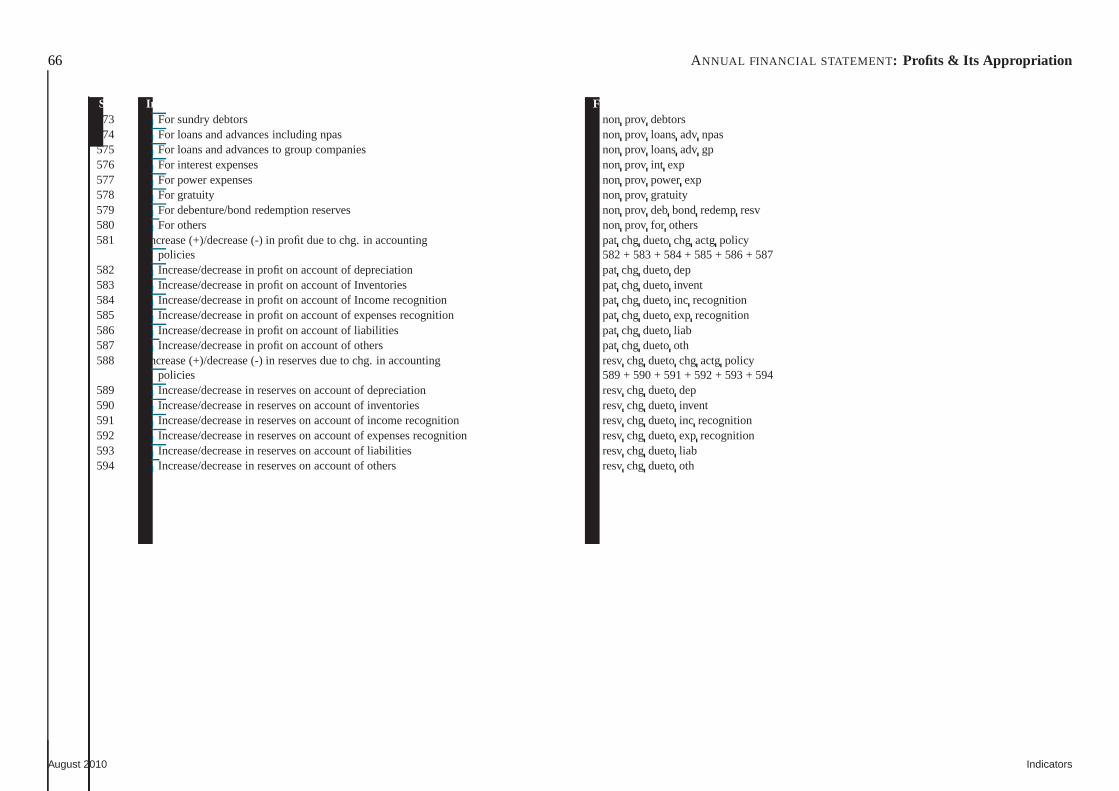
66 ANNUAL FINANCIAL STATEMENT : Profits & Its Appropriation
Sr.No. Indicator Fields & formula573 For sundry debtors = non prov debtors574 For loans and advances including npas = non prov loansadv npas575 For loans and advances to group companies = non prov loansadv gp576 For interest expenses = non prov int exp577 For power expenses = non prov power exp578 For gratuity = non prov gratuity579 For debenture/bond redemption reserves = non prov deb bond redempresv580 For others = non prov for others581 Increase (+)/decrease (-) in profit due to chg. in accounting = patchg duetochg actg policy
policies = 582 + 583 + 584 + 585 + 586 + 587582 Increase/decrease in profit on account of depreciation = patchg duetodep583 Increase/decrease in profit on account of Inventories = patchg duetoinvent584 Increase/decrease in profit on account of Income recognition = patchg duetoinc recognition585 Increase/decrease in profit on account of expenses recognition = patchg duetoexp recognition586 Increase/decrease in profit on account of liabilities = pat chg duetoliab587 Increase/decrease in profit on account of others = pat chg duetooth588 Increase (+)/decrease (-) in reserves due to chg. in accounting = resvchg duetochg actg policy
policies = 589 + 590 + 591 + 592 + 593 + 594589 Increase/decrease in reserves on account of depreciation =resv chg duetodep590 Increase/decrease in reserves on account of inventories = resv chg duetoinvent591 Increase/decrease in reserves on account of income recognition = resvchg duetoinc recognition592 Increase/decrease in reserves on account of expenses recognition = resvchg duetoexp recognition593 Increase/decrease in reserves on account of liabilities = resv chg duetoliab594 Increase/decrease in reserves on account of others = resvchg duetooth
August 2010 Indicators
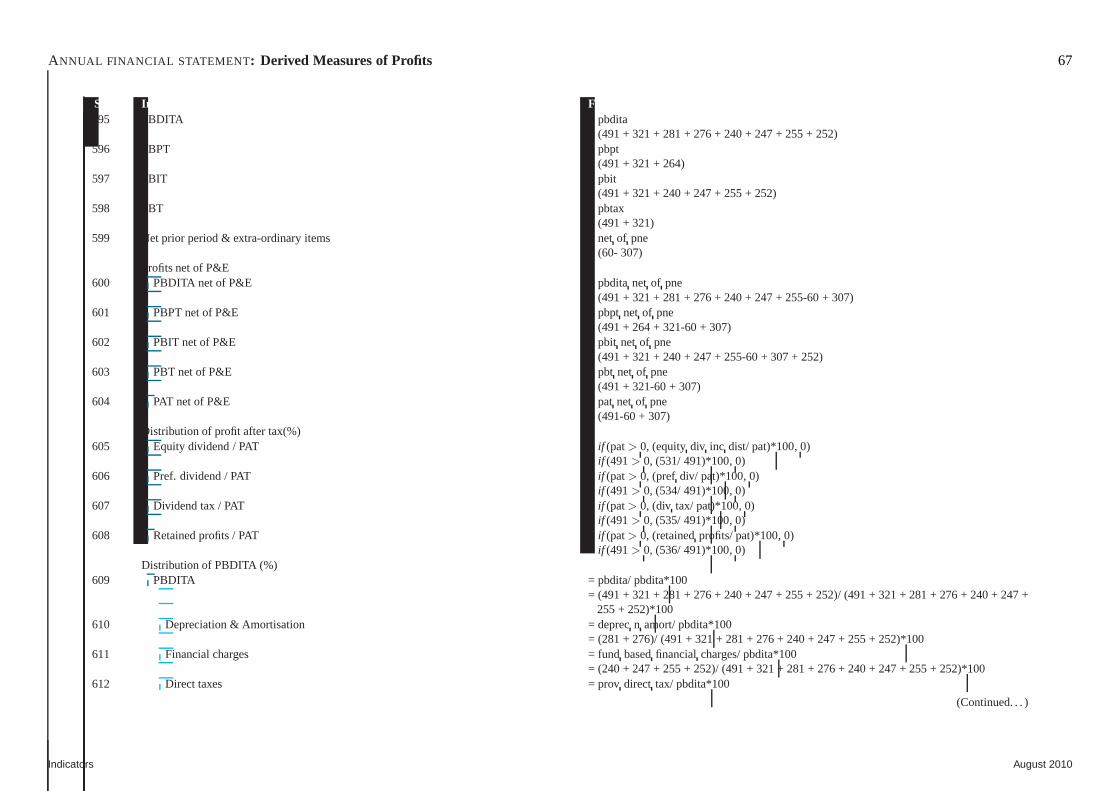
ANNUAL FINANCIAL STATEMENT : Derived Measures of Profits 67
Sr.No. Indicator Fields & formula595 PBDITA = pbdita
= (491 + 321 + 281 + 276 + 240 + 247 + 255 + 252)596 PBPT = pbpt
= (491 + 321 + 264)597 PBIT = pbit
= (491 + 321 + 240 + 247 + 255 + 252)598 PBT = pbtax
= (491 + 321)599 Net prior period & extra-ordinary items = net of pne
= (60- 307)Profits net of P&E
600 PBDITA net of P&E = pbditanet of pne= (491 + 321 + 281 + 276 + 240 + 247 + 255-60 + 307)
601 PBPT net of P&E = pbpt net of pne= (491 + 264 + 321-60 + 307)
602 PBIT net of P&E = pbit net of pne= (491 + 321 + 240 + 247 + 255-60 + 307 + 252)
603 PBT net of P&E = pbt net of pne= (491 + 321-60 + 307)
604 PAT net of P&E = pat net of pne= (491-60 + 307)
Distribution of profit after tax(%)605 Equity dividend / PAT = if (pat> 0, (equity div inc dist/ pat)*100, 0)
= if (491> 0, (531/ 491)*100, 0)606 Pref. dividend / PAT = if (pat> 0, (pref div/ pat)*100, 0)
= if (491> 0, (534/ 491)*100, 0)607 Dividend tax / PAT = if (pat> 0, (div tax/ pat)*100, 0)
= if (491> 0, (535/ 491)*100, 0)608 Retained profits / PAT = if (pat> 0, (retainedprofits/ pat)*100, 0)
= if (491> 0, (536/ 491)*100, 0)Distribution of PBDITA (%)
609 PBDITA = pbdita/ pbdita*100= (491 + 321 + 281 + 276 + 240 + 247 + 255 + 252)/ (491 + 321 + 281 + 276+ 240 + 247 +
255 + 252)*100610 Depreciation & Amortisation = deprecn amort/ pbdita*100
= (281 + 276)/ (491 + 321 + 281 + 276 + 240 + 247 + 255 + 252)*100611 Financial charges = fund basedfinancial charges/ pbdita*100
= (240 + 247 + 255 + 252)/ (491 + 321 + 281 + 276 + 240 + 247 + 255 + 252)*100612 Direct taxes = prov direct tax/ pbdita*100
(Continued. . . )
Indicators August 2010
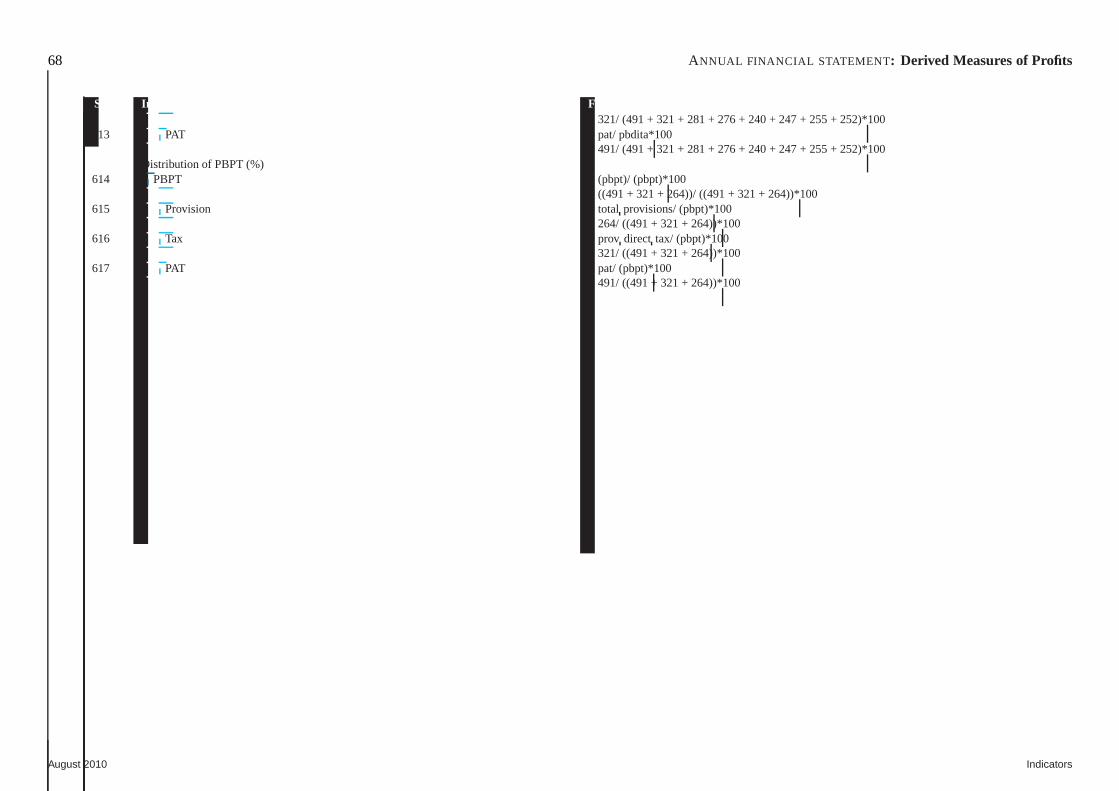
68 ANNUAL FINANCIAL STATEMENT : Derived Measures of Profits
Sr.No. Indicator Fields & formula= 321/ (491 + 321 + 281 + 276 + 240 + 247 + 255 + 252)*100
613 PAT = pat/ pbdita*100= 491/ (491 + 321 + 281 + 276 + 240 + 247 + 255 + 252)*100
Distribution of PBPT (%)614 PBPT = (pbpt)/ (pbpt)*100
= ((491 + 321 + 264))/ ((491 + 321 + 264))*100615 Provision = total provisions/ (pbpt)*100
= 264/ ((491 + 321 + 264))*100616 Tax = prov direct tax/ (pbpt)*100
= 321/ ((491 + 321 + 264))*100617 PAT = pat/ (pbpt)*100
= 491/ ((491 + 321 + 264))*100
August 2010 Indicators
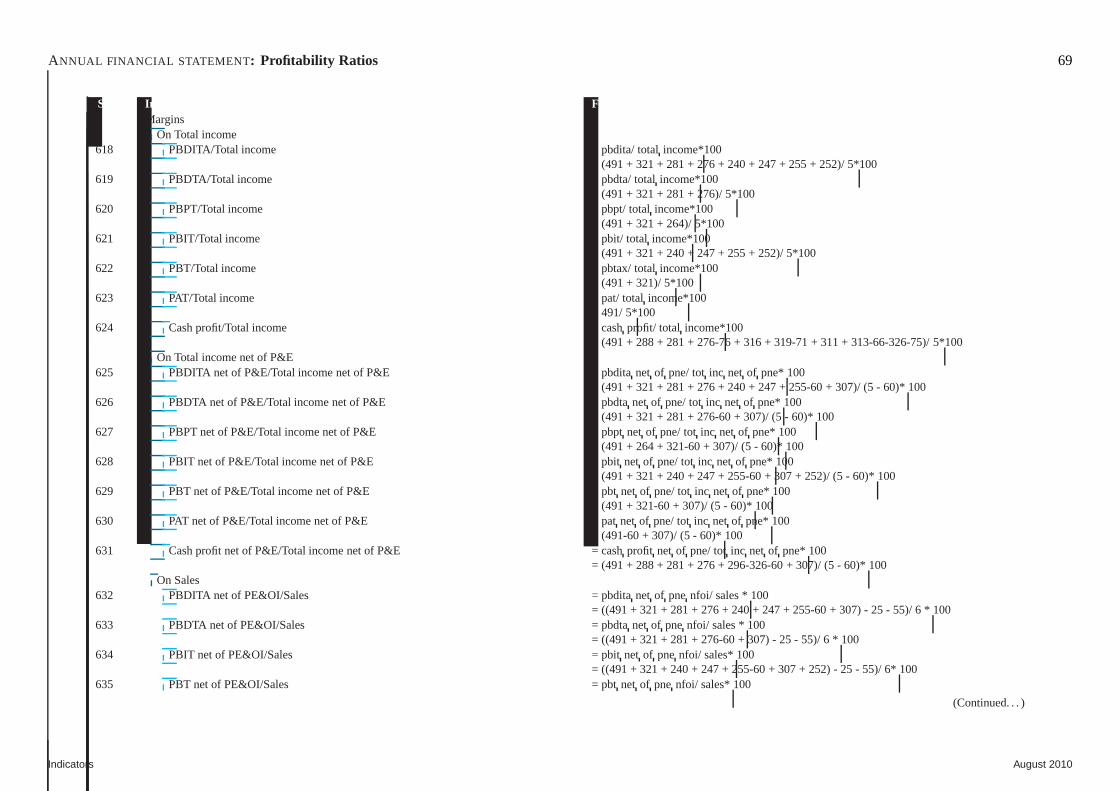
ANNUAL FINANCIAL STATEMENT : Profitability Ratios 69
Sr.No. Indicator Fields & formulaMargins
On Total income618 PBDITA/Total income = pbdita/ totalincome*100
= (491 + 321 + 281 + 276 + 240 + 247 + 255 + 252)/ 5*100619 PBDTA/Total income = pbdta/ totalincome*100
= (491 + 321 + 281 + 276)/ 5*100620 PBPT/Total income = pbpt/ totalincome*100
= (491 + 321 + 264)/ 5*100621 PBIT/Total income = pbit/ total income*100
= (491 + 321 + 240 + 247 + 255 + 252)/ 5*100622 PBT/Total income = pbtax/ totalincome*100
= (491 + 321)/ 5*100623 PAT/Total income = pat/ totalincome*100
= 491/ 5*100624 Cash profit/Total income = cashprofit/ total income*100
= (491 + 288 + 281 + 276-76 + 316 + 319-71 + 311 + 313-66-326-75)/5*100On Total income net of P&E
625 PBDITA net of P&E/Total income net of P&E = pbditanet of pne/ totinc net of pne* 100= (491 + 321 + 281 + 276 + 240 + 247 + 255-60 + 307)/ (5 - 60)* 100
626 PBDTA net of P&E/Total income net of P&E = pbdtanet of pne/ totinc net of pne* 100= (491 + 321 + 281 + 276-60 + 307)/ (5 - 60)* 100
627 PBPT net of P&E/Total income net of P&E = pbpt net of pne/ totinc net of pne* 100= (491 + 264 + 321-60 + 307)/ (5 - 60)* 100
628 PBIT net of P&E/Total income net of P&E = pbit net of pne/ totinc net of pne* 100= (491 + 321 + 240 + 247 + 255-60 + 307 + 252)/ (5 - 60)* 100
629 PBT net of P&E/Total income net of P&E = pbt net of pne/ totinc net of pne* 100= (491 + 321-60 + 307)/ (5 - 60)* 100
630 PAT net of P&E/Total income net of P&E = pat net of pne/ totinc net of pne* 100= (491-60 + 307)/ (5 - 60)* 100
631 Cash profit net of P&E/Total income net of P&E = cashprofit net of pne/ totinc net of pne* 100= (491 + 288 + 281 + 276 + 296-326-60 + 307)/ (5 - 60)* 100
On Sales632 PBDITA net of PE&OI/Sales = pbditanet of pne nfoi/ sales * 100
= ((491 + 321 + 281 + 276 + 240 + 247 + 255-60 + 307) - 25 - 55)/ 6 * 100633 PBDTA net of PE&OI/Sales = pbdtanet of pne nfoi/ sales * 100
= ((491 + 321 + 281 + 276-60 + 307) - 25 - 55)/ 6 * 100634 PBIT net of PE&OI/Sales = pbit net of pnenfoi/ sales* 100
= ((491 + 321 + 240 + 247 + 255-60 + 307 + 252) - 25 - 55)/ 6* 100635 PBT net of PE&OI/Sales = pbt net of pne nfoi/ sales* 100
(Continued. . . )
Indicators August 2010
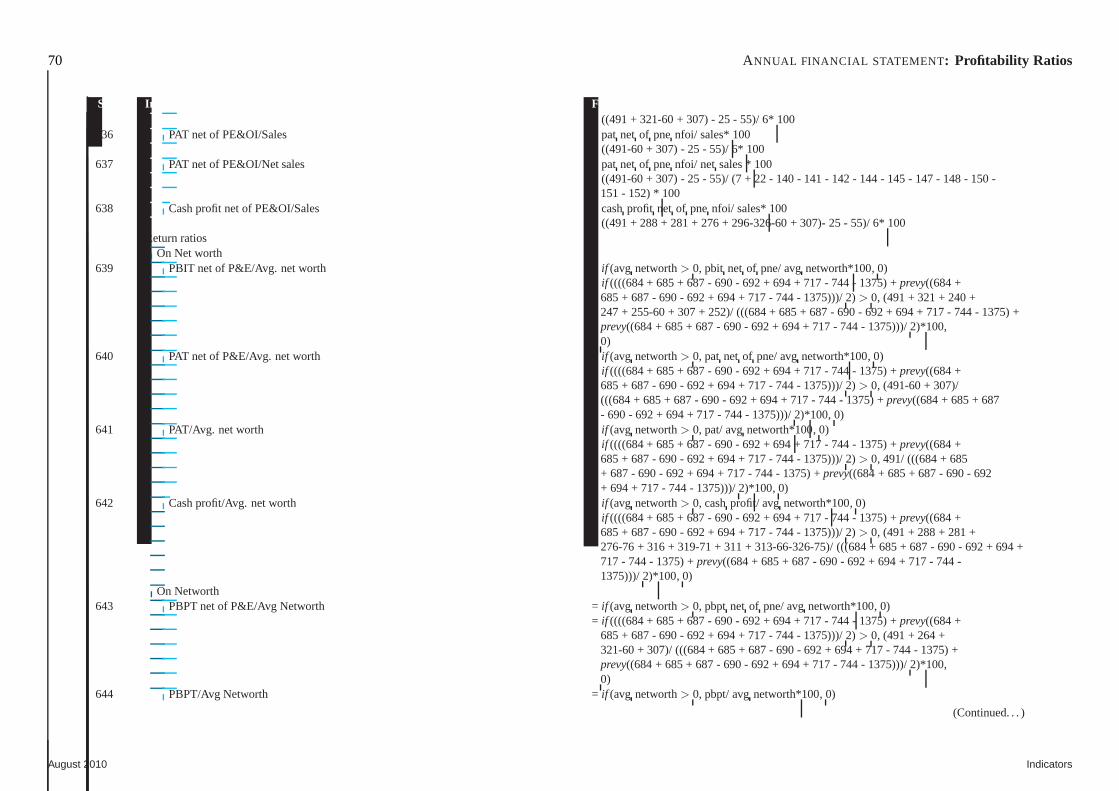
70 ANNUAL FINANCIAL STATEMENT : Profitability Ratios
Sr.No. Indicator Fields & formula= ((491 + 321-60 + 307) - 25 - 55)/ 6* 100
636 PAT net of PE&OI/Sales = pat net of pnenfoi/ sales* 100= ((491-60 + 307) - 25 - 55)/ 6* 100
637 PAT net of PE&OI/Net sales = pat net of pnenfoi/ net sales * 100= ((491-60 + 307) - 25 - 55)/ (7 + 22 - 140 - 141 - 142 - 144 - 145 - 147- 148 - 150 -
151 - 152) * 100638 Cash profit net of PE&OI/Sales = cashprofit net of pne nfoi/ sales* 100
= ((491 + 288 + 281 + 276 + 296-326-60 + 307)- 25 - 55)/ 6* 100Return ratios
On Net worth639 PBIT net of P&E/Avg. net worth = if (avg networth> 0, pbit net of pne/ avgnetworth*100, 0)
= if ((((684 + 685 + 687 - 690 - 692 + 694 + 717 - 744 - 1375) +prevy((684 +685 + 687 - 690 - 692 + 694 + 717 - 744 - 1375)))/ 2) > 0, (491 + 321 + 240 +247 + 255-60 + 307 + 252)/ (((684 + 685 + 687 - 690 - 692 + 694 + 717 -744 - 1375) +prevy((684 + 685 + 687 - 690 - 692 + 694 + 717 - 744 - 1375)))/ 2)*100,0)
640 PAT net of P&E/Avg. net worth = if (avg networth> 0, pat net of pne/ avgnetworth*100, 0)= if ((((684 + 685 + 687 - 690 - 692 + 694 + 717 - 744 - 1375) +prevy((684 +
685 + 687 - 690 - 692 + 694 + 717 - 744 - 1375)))/ 2) > 0, (491-60 + 307)/(((684 + 685 + 687 - 690 - 692 + 694 + 717 - 744 - 1375) +prevy((684 + 685 + 687- 690 - 692 + 694 + 717 - 744 - 1375)))/ 2)*100, 0)
641 PAT/Avg. net worth = if (avg networth> 0, pat/ avgnetworth*100, 0)= if ((((684 + 685 + 687 - 690 - 692 + 694 + 717 - 744 - 1375) +prevy((684 +
685 + 687 - 690 - 692 + 694 + 717 - 744 - 1375)))/ 2) > 0, 491/ (((684 + 685+ 687 - 690 - 692 + 694 + 717 - 744 - 1375) +prevy((684 + 685 + 687 - 690 - 692+ 694 + 717 - 744 - 1375)))/ 2)*100, 0)
642 Cash profit/Avg. net worth = if (avg networth> 0, cashprofit/ avg networth*100, 0)= if ((((684 + 685 + 687 - 690 - 692 + 694 + 717 - 744 - 1375) +prevy((684 +
685 + 687 - 690 - 692 + 694 + 717 - 744 - 1375)))/ 2) > 0, (491 + 288 + 281 +276-76 + 316 + 319-71 + 311 + 313-66-326-75)/ (((684 + 685 + 687- 690 - 692 + 694 +717 - 744 - 1375) +prevy((684 + 685 + 687 - 690 - 692 + 694 + 717 - 744 -1375)))/ 2)*100, 0)
On Networth643 PBPT net of P&E/Avg Networth = if (avg networth> 0, pbpt net of pne/ avgnetworth*100, 0)
= if ((((684 + 685 + 687 - 690 - 692 + 694 + 717 - 744 - 1375) +prevy((684 +685 + 687 - 690 - 692 + 694 + 717 - 744 - 1375)))/ 2) > 0, (491 + 264 +321-60 + 307)/ (((684 + 685 + 687 - 690 - 692 + 694 + 717 - 744 - 1375) +prevy((684 + 685 + 687 - 690 - 692 + 694 + 717 - 744 - 1375)))/ 2)*100,0)
644 PBPT/Avg Networth = if (avg networth> 0, pbpt/ avgnetworth*100, 0)
(Continued. . . )
August 2010 Indicators
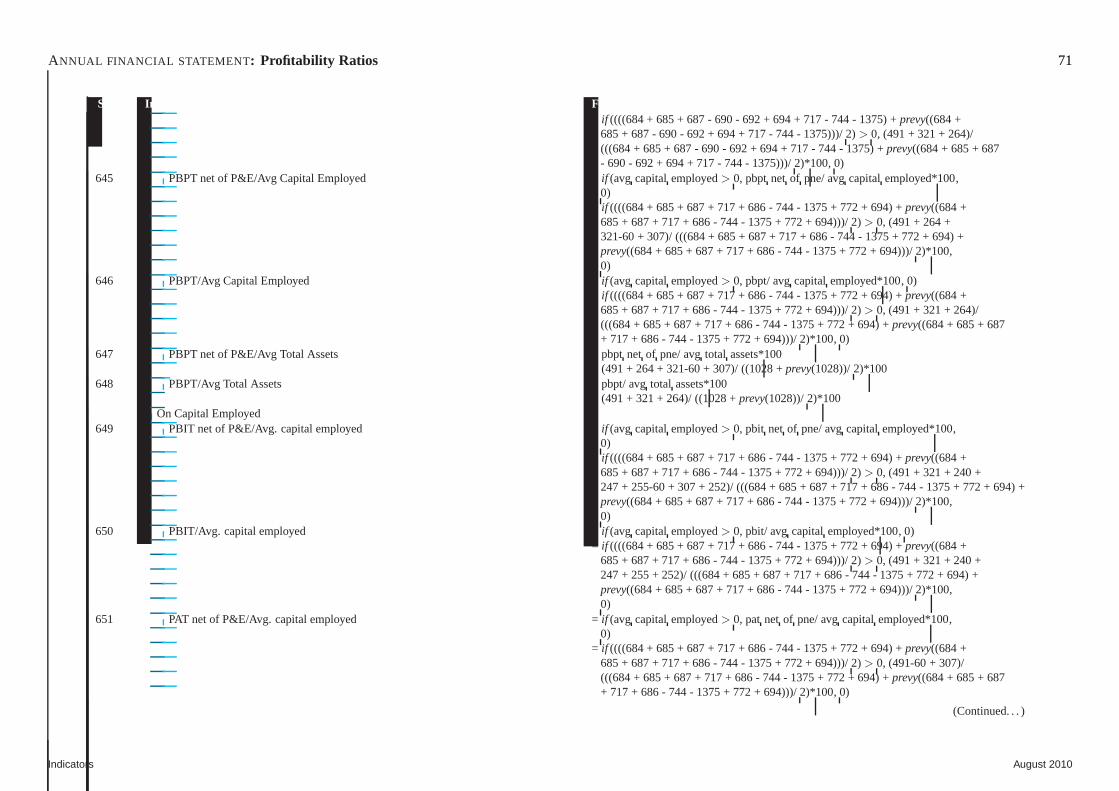
ANNUAL FINANCIAL STATEMENT : Profitability Ratios 71
Sr.No. Indicator Fields & formula= if ((((684 + 685 + 687 - 690 - 692 + 694 + 717 - 744 - 1375) +prevy((684 +
685 + 687 - 690 - 692 + 694 + 717 - 744 - 1375)))/ 2) > 0, (491 + 321 + 264)/(((684 + 685 + 687 - 690 - 692 + 694 + 717 - 744 - 1375) +prevy((684 + 685 + 687- 690 - 692 + 694 + 717 - 744 - 1375)))/ 2)*100, 0)
645 PBPT net of P&E/Avg Capital Employed = if (avg capital employed> 0, pbpt net of pne/ avgcapital employed*100,0)
= if ((((684 + 685 + 687 + 717 + 686 - 744 - 1375 + 772 + 694) +prevy((684 +685 + 687 + 717 + 686 - 744 - 1375 + 772 + 694)))/ 2) > 0, (491 + 264 +321-60 + 307)/ (((684 + 685 + 687 + 717 + 686 - 744 - 1375 + 772 + 694) +prevy((684 + 685 + 687 + 717 + 686 - 744 - 1375 + 772 + 694)))/ 2)*100,0)
646 PBPT/Avg Capital Employed = if (avg capital employed> 0, pbpt/ avgcapital employed*100, 0)= if ((((684 + 685 + 687 + 717 + 686 - 744 - 1375 + 772 + 694) +prevy((684 +
685 + 687 + 717 + 686 - 744 - 1375 + 772 + 694)))/ 2) > 0, (491 + 321 + 264)/(((684 + 685 + 687 + 717 + 686 - 744 - 1375 + 772 + 694) +prevy((684 + 685 + 687+ 717 + 686 - 744 - 1375 + 772 + 694)))/ 2)*100, 0)
647 PBPT net of P&E/Avg Total Assets = pbpt net of pne/ avgtotal assets*100= (491 + 264 + 321-60 + 307)/ ((1028 +prevy(1028))/ 2)*100
648 PBPT/Avg Total Assets = pbpt/ avgtotal assets*100= (491 + 321 + 264)/ ((1028 +prevy(1028))/ 2)*100
On Capital Employed649 PBIT net of P&E/Avg. capital employed = if (avg capital employed> 0, pbit net of pne/ avgcapital employed*100,
0)= if ((((684 + 685 + 687 + 717 + 686 - 744 - 1375 + 772 + 694) +prevy((684 +
685 + 687 + 717 + 686 - 744 - 1375 + 772 + 694)))/ 2) > 0, (491 + 321 + 240 +247 + 255-60 + 307 + 252)/ (((684 + 685 + 687 + 717 + 686 - 744 - 1375+ 772 + 694) +prevy((684 + 685 + 687 + 717 + 686 - 744 - 1375 + 772 + 694)))/ 2)*100,0)
650 PBIT/Avg. capital employed = if (avg capital employed> 0, pbit/ avgcapital employed*100, 0)= if ((((684 + 685 + 687 + 717 + 686 - 744 - 1375 + 772 + 694) +prevy((684 +
685 + 687 + 717 + 686 - 744 - 1375 + 772 + 694)))/ 2) > 0, (491 + 321 + 240 +247 + 255 + 252)/ (((684 + 685 + 687 + 717 + 686 - 744 - 1375 + 772 + 694) +prevy((684 + 685 + 687 + 717 + 686 - 744 - 1375 + 772 + 694)))/ 2)*100,0)
651 PAT net of P&E/Avg. capital employed = if (avg capital employed> 0, pat net of pne/ avgcapital employed*100,0)
= if ((((684 + 685 + 687 + 717 + 686 - 744 - 1375 + 772 + 694) +prevy((684 +685 + 687 + 717 + 686 - 744 - 1375 + 772 + 694)))/ 2) > 0, (491-60 + 307)/(((684 + 685 + 687 + 717 + 686 - 744 - 1375 + 772 + 694) +prevy((684 + 685 + 687+ 717 + 686 - 744 - 1375 + 772 + 694)))/ 2)*100, 0)
(Continued. . . )
Indicators August 2010
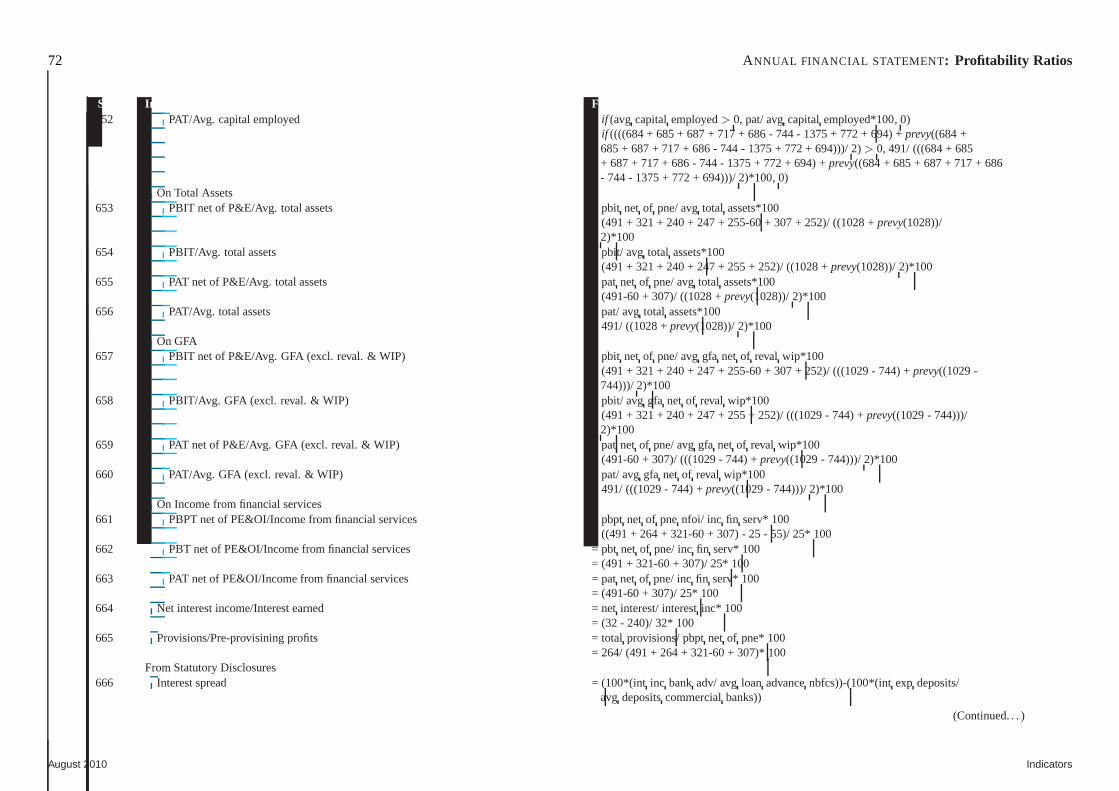
72 ANNUAL FINANCIAL STATEMENT : Profitability Ratios
Sr.No. Indicator Fields & formula652 PAT/Avg. capital employed = if (avg capital employed> 0, pat/ avgcapital employed*100, 0)
= if ((((684 + 685 + 687 + 717 + 686 - 744 - 1375 + 772 + 694) +prevy((684 +685 + 687 + 717 + 686 - 744 - 1375 + 772 + 694)))/ 2) > 0, 491/ (((684 + 685+ 687 + 717 + 686 - 744 - 1375 + 772 + 694) +prevy((684 + 685 + 687 + 717 + 686- 744 - 1375 + 772 + 694)))/ 2)*100, 0)
On Total Assets653 PBIT net of P&E/Avg. total assets = pbit net of pne/ avgtotal assets*100
= (491 + 321 + 240 + 247 + 255-60 + 307 + 252)/ ((1028 +prevy(1028))/2)*100
654 PBIT/Avg. total assets = pbit/ avgtotal assets*100= (491 + 321 + 240 + 247 + 255 + 252)/ ((1028 +prevy(1028))/ 2)*100
655 PAT net of P&E/Avg. total assets = pat net of pne/ avgtotal assets*100= (491-60 + 307)/ ((1028 +prevy(1028))/ 2)*100
656 PAT/Avg. total assets = pat/ avgtotal assets*100= 491/ ((1028 +prevy(1028))/ 2)*100
On GFA657 PBIT net of P&E/Avg. GFA (excl. reval. & WIP) = pbitnet of pne/ avggfa net of reval wip*100
= (491 + 321 + 240 + 247 + 255-60 + 307 + 252)/ (((1029 - 744) +prevy((1029 -744)))/ 2)*100
658 PBIT/Avg. GFA (excl. reval. & WIP) = pbit/ avggfa net of reval wip*100= (491 + 321 + 240 + 247 + 255 + 252)/ (((1029 - 744) +prevy((1029 - 744)))/
2)*100659 PAT net of P&E/Avg. GFA (excl. reval. & WIP) = patnet of pne/ avggfa net of reval wip*100
= (491-60 + 307)/ (((1029 - 744) +prevy((1029 - 744)))/ 2)*100660 PAT/Avg. GFA (excl. reval. & WIP) = pat/ avggfa net of reval wip*100
= 491/ (((1029 - 744) +prevy((1029 - 744)))/ 2)*100On Income from financial services
661 PBPT net of PE&OI/Income from financial services = pbptnet of pne nfoi/ inc fin serv* 100= ((491 + 264 + 321-60 + 307) - 25 - 55)/ 25* 100
662 PBT net of PE&OI/Income from financial services = pbtnet of pne/ incfin serv* 100= (491 + 321-60 + 307)/ 25* 100
663 PAT net of PE&OI/Income from financial services = patnet of pne/ incfin serv* 100= (491-60 + 307)/ 25* 100
664 Net interest income/Interest earned = net interest/ interestinc* 100= (32 - 240)/ 32* 100
665 Provisions/Pre-provisining profits = total provisions/ pbptnet of pne* 100= 264/ (491 + 264 + 321-60 + 307)* 100
From Statutory Disclosures666 Interest spread = (100*(int inc bank adv/ avgloan advancenbfcs))-(100*(int exp deposits/
avg depositscommercialbanks))
(Continued. . . )
August 2010 Indicators
ANNUAL FINANCIAL STATEMENT : Profitability Ratios 73
Sr.No. Indicator Fields & formula= (100*(33/ ((1216 +prevy(1216))/ 2)))-(100*(242/ ((759 +
prevy(759))/ 2)))
Indicators August 2010
74 ANNUAL FINANCIAL STATEMENT : Liabilities
Sr.No. Indicator Fields & formula667 Total liabilities = total liabilities
= 684 + 685 + 686 + 687 + 694 + 716 + 717 + 759 + 772 + 853 + 904668 Authorised equity shares = authorisedequity shares
ai of 667 (totalliabilities)669 Authorised preference shares = authorisedpref shares
ai of 667 (totalliabilities)670 Authorised unclassified shares = authorisedsharesunclassified
ai of 667 (totalliabilities)671 Authorised equity capital = authorisedequity capital
ai of 667 (totalliabilities)672 Authorised preference capital = authorisedpref capital
ai of 667 (totalliabilities)673 Authorised unclassified capital = authorisedcap unclassified
ai of 667 (totalliabilities)674 Issued equity shares = issuedequity shares
ai of 667 (totalliabilities)675 Issued preference shares = issuedpref shares
ai of 667 (totalliabilities)676 Issued equity capital = issuedequity cap
ai of 667 (totalliabilities)677 Issued preference capital = issuedpref cap
ai of 667 (totalliabilities)678 Subscribed equity shares (net) = subscribednet equity shares
ai of 667 (totalliabilities)679 Subscribed preference shares (net) = subscribednet pref shares
ai of 667 (totalliabilities)680 Subscribed equity capital (net) = subscribednet equity cap
ai of 667 (totalliabilities)681 Subscribed preference capital (net) = subscribednet pref cap
ai of 667 (totalliabilities)682 Paid up equity shares = paidupequity shares
ai of 667 (totalliabilities)683 Paid up preference shares = paiduppref shares
ai of 667 (totalliabilities)684 Paid up equity capital (net of forfeited equity capital.) = paidup equity cap685 Forfeited equity capital = paidupforfeited equity cap686 Paid up preference capital (net of forfeited preference capital) = paiduppref cap687 Capital contribution, suspense & application money = capcontrib suspappl money
= 688 + 689 + 690 + 691 + 692 + 693
(Continued. . . )
August 2010 Indicators
ANNUAL FINANCIAL STATEMENT : Liabilities 75
Sr.No. Indicator Fields & formula688 Capital contribuion / funds by govt., others = capcontrib by govt oth689 Share application money/advances – equity = shareappl moneyequity690 Share application money/advances – preference shares = share appl moneypref691 Equity Capital suspense & other account = equity cap suspand oth ac692 Preference capital suspense account = pref capsuspac693 Share capital deposit with rbi (for foreign banks) = sharecapdepositrbi694 Convertible warrants = convertiblewarrants695 Number of shares held by holding company = sharesnos holding co
ai of 682 (paidup equity shares)696 Number of shares held by holding company (%) = sharespct holding co
ai of 682 (paidup equity shares)697 Equity shares alloted without payment being received in cash = equityallot without payment
ai of 682 (paidup equity shares)698 Equity shares alloted pursuant to the scheme of mergers & = equity allot mna
acquisitions pcc of 697 (equitysharewithout cash)699 Equity shares alloted on conversion of loans/debt = equityallot loan debt conv
pcc of 697 (equitysharewithout cash)700 Equity shares alloted on conversion of convertible warrants = equityallot convertiblewarrants
pcc of 697 (equitysharewithout cash)701 Equity shares alloted on conversion of gdr/ecb, etc. = equity allot gdr ecb conv
pcc of 697 (equitysharewithout cash)702 Equity shares alloted in esops = equity allot esop
pcc of 697 (equitysharewithout cash)703 Equity share alloted on conversion of preference share = equity allot pref shareconv
pcc of 697 (equitysharewithout cash)704 Equity shares re-converted in adrs/ gdrs. = equity sharereconvadr gdr
ai of 682 (paidup equity shares)705 Call in arrears amount = call in arrears
= 706 + 707ai of 684 (paidup equity capital)
706 From directors = call in arrearsfrm directors707 From others = call in arrearsfrm oth708 Reduction in equity capital – amount = reductequity capamt
ai of 684 (paidup equity capital)709 Buy back of shares – amount = buybackamt
pcc of 708 (redneq capamt buyback)710 Reduction in equity capital (other thanbuy-back) – amount =oth reductequity cap amt
pcc of 708 (redneq capamt buyback)711 Reduction in equity capital – shares = reductequity capshares712 Buy back of shares – shares = buybackshares
(Continued. . . )
Indicators August 2010
76 ANNUAL FINANCIAL STATEMENT : Liabilities
Sr.No. Indicator Fields & formulapcc of 711 (redneq capsharebuyback)
713 Reduction in equity capital (other thanbuy-back) – shares =oth reductequity cap sharespcc of 711 (redneq capsharebuyback)
714 Total amount paid on buy-back including premium = buybackamt paid incl premiumai of 684 (paidup equity capital)
715 Bonus share capital = bonussharecapai of 684 (paidup equity capital)
716 Minority interest reserves = minority int resv717 Reserves /funds = resv
= 718 + 724 + 744 + 750 + 753 + 754 - 755718 Security premium reserves (net of deductions) = secpremiumresv719 Additions during the year = secpremiumresv addn
pncc of 718 (resshareprem)720 Less: utilised for issue of bonus shares = secpremiumresv utilised bonus
pncc of 718 (resshareprem)721 Issue expenses reduced and deducted = secpremiumresv utilised issueexp
pncc of 718 (resshareprem)722 Premium on redemption of deb./ pref. shares written off = secpremiumresv utilised redempw off
pncc of 718 (resshareprem)723 Security premium used for buy-back = secpremiumresv utilised buyback
pncc of 718 (resshareprem)724 Capital, debt, investment & other reserves = capdebt invest oth resv
= 725 + 726 + 728 + 729 + 730 + 731 + 732 + 733 + 734 + 735 + 736 + 737 + 738 + 741 +742 - 743
725 Capital redemption reserves = capredempresv726 Capital reserves (incl. grants/subsidies) = capresv727 Subsidies/grants = grantssubsidiesresv
pncc of 726 (rescapital)728 Debenture/bond redemption reserves = debbond redempresv729 Investment allowance reserves = investallow resv730 Dividend equalisation reserve = div equalisationresv731 Foreign project reserves = frgn proj resv732 Tariffs and dividend control reserves (for electricity = tariff div control resv
companies)733 Other statutory reserves = oth statutoryresv734 Investment fluctuation reserve = invest fluct resv735 Surplus /deficit on mergers & acquisitions = amalgammnaresv736 Forex fluctuation reserves = forex fluct resv737 Lease equalisation reserves = leaseequalisationresv
(Continued. . . )
August 2010 Indicators
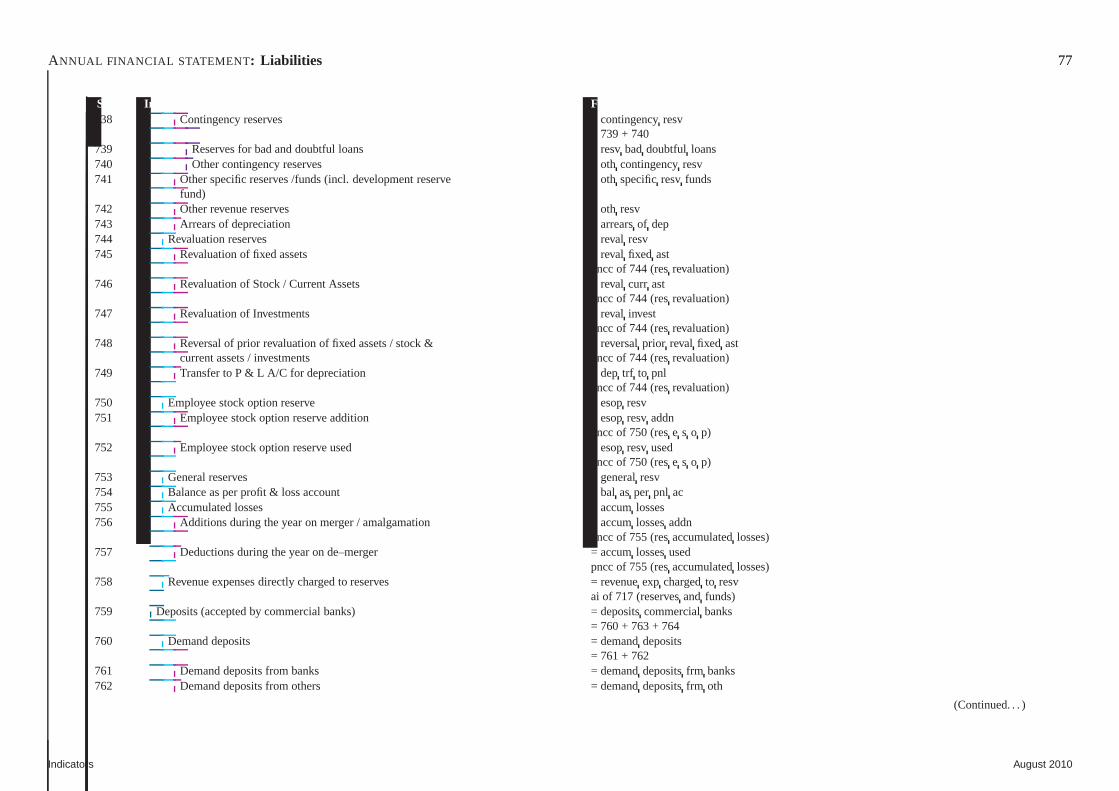
ANNUAL FINANCIAL STATEMENT : Liabilities 77
Sr.No. Indicator Fields & formula738 Contingency reserves = contingencyresv
= 739 + 740739 Reserves for bad and doubtful loans = resvbaddoubtful loans740 Other contingency reserves = oth contingencyresv741 Other specific reserves /funds (incl. development reserve =oth specificresv funds
fund)742 Other revenue reserves = oth resv743 Arrears of depreciation = arrearsof dep744 Revaluation reserves = reval resv745 Revaluation of fixed assets = reval fixed ast
pncc of 744 (resrevaluation)746 Revaluation of Stock / Current Assets = reval curr ast
pncc of 744 (resrevaluation)747 Revaluation of Investments = reval invest
pncc of 744 (resrevaluation)748 Reversal of prior revaluation of fixed assets / stock & = reversal prior reval fixed ast
current assets / investments pncc of 744 (resrevaluation)749 Transfer to P & L A/C for depreciation = dep trf to pnl
pncc of 744 (resrevaluation)750 Employee stock option reserve = esopresv751 Employee stock option reserve addition = esopresv addn
pncc of 750 (rese s o p)752 Employee stock option reserve used = esopresv used
pncc of 750 (rese s o p)753 General reserves = generalresv754 Balance as per profit & loss account = bal asper pnl ac755 Accumulated losses = accumlosses756 Additions during the year on merger / amalgamation = accumlossesaddn
pncc of 755 (resaccumulatedlosses)757 Deductions during the year on de–merger = accumlossesused
pncc of 755 (resaccumulatedlosses)758 Revenue expenses directly charged to reserves = revenueexp chargedto resv
ai of 717 (reservesand funds)759 Deposits (accepted by commercial banks) = depositscommercialbanks
= 760 + 763 + 764760 Demand deposits = demanddeposits
= 761 + 762761 Demand deposits from banks = demanddepositsfrm banks762 Demand deposits from others = demanddepositsfrm oth
(Continued. . . )
Indicators August 2010
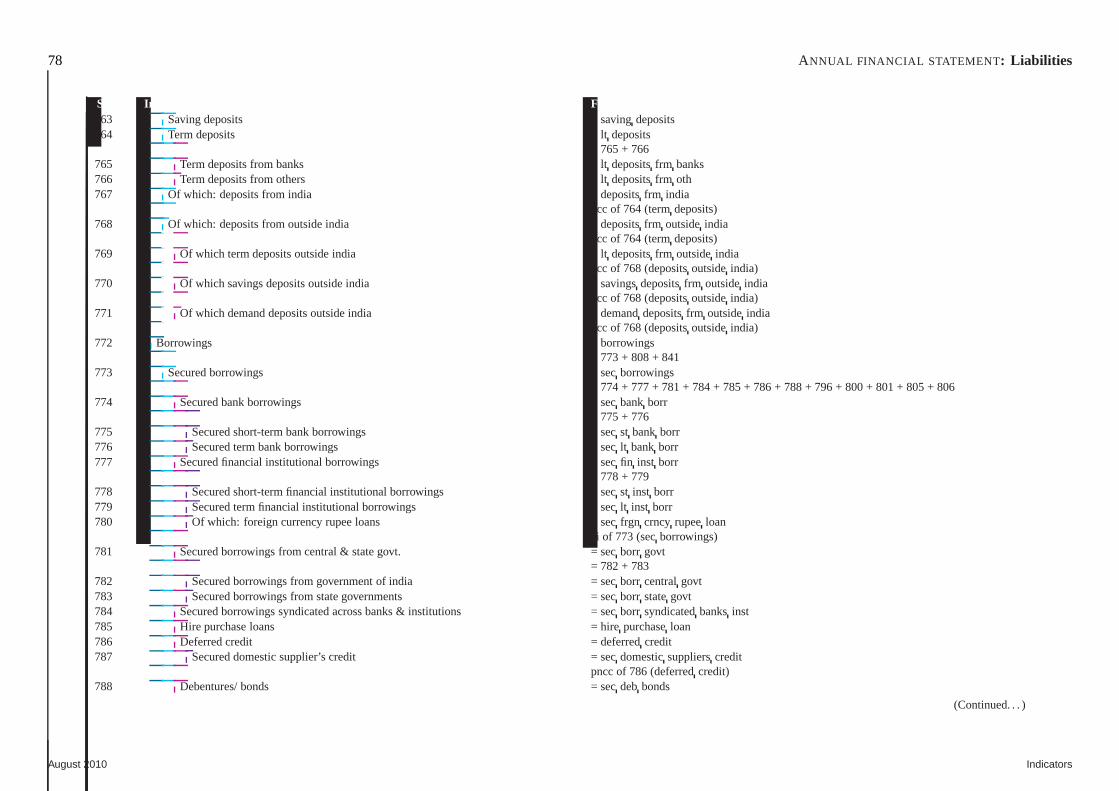
78 ANNUAL FINANCIAL STATEMENT : Liabilities
Sr.No. Indicator Fields & formula763 Saving deposits = savingdeposits764 Term deposits = lt deposits
= 765 + 766765 Term deposits from banks = lt depositsfrm banks766 Term deposits from others = lt depositsfrm oth767 Of which: deposits from india = depositsfrm india
pcc of 764 (termdeposits)768 Of which: deposits from outside india = depositsfrm outsideindia
pcc of 764 (termdeposits)769 Of which term deposits outside india = lt depositsfrm outsideindia
pcc of 768 (depositsoutsideindia)770 Of which savings deposits outside india = savingsdepositsfrm outsideindia
pcc of 768 (depositsoutsideindia)771 Of which demand deposits outside india = demanddepositsfrm outsideindia
pcc of 768 (depositsoutsideindia)772 Borrowings = borrowings
= 773 + 808 + 841773 Secured borrowings = secborrowings
= 774 + 777 + 781 + 784 + 785 + 786 + 788 + 796 + 800 + 801 + 805 + 806774 Secured bank borrowings = secbank borr
= 775 + 776775 Secured short-term bank borrowings = secst bank borr776 Secured term bank borrowings = seclt bank borr777 Secured financial institutional borrowings = secfin inst borr
= 778 + 779778 Secured short-term financial institutional borrowings = sec st inst borr779 Secured term financial institutional borrowings = seclt inst borr780 Of which: foreign currency rupee loans = secfrgn crncy rupeeloan
ai of 773 (secborrowings)781 Secured borrowings from central & state govt. = secborr govt
= 782 + 783782 Secured borrowings from government of india = secborr centralgovt783 Secured borrowings from state governments = secborr stategovt784 Secured borrowings syndicated across banks & institutions = secborr syndicatedbanksinst785 Hire purchase loans = hire purchaseloan786 Deferred credit = deferredcredit787 Secured domestic supplier’s credit = secdomesticsupplierscredit
pncc of 786 (deferredcredit)788 Debentures/ bonds = secdebbonds
(Continued. . . )
August 2010 Indicators
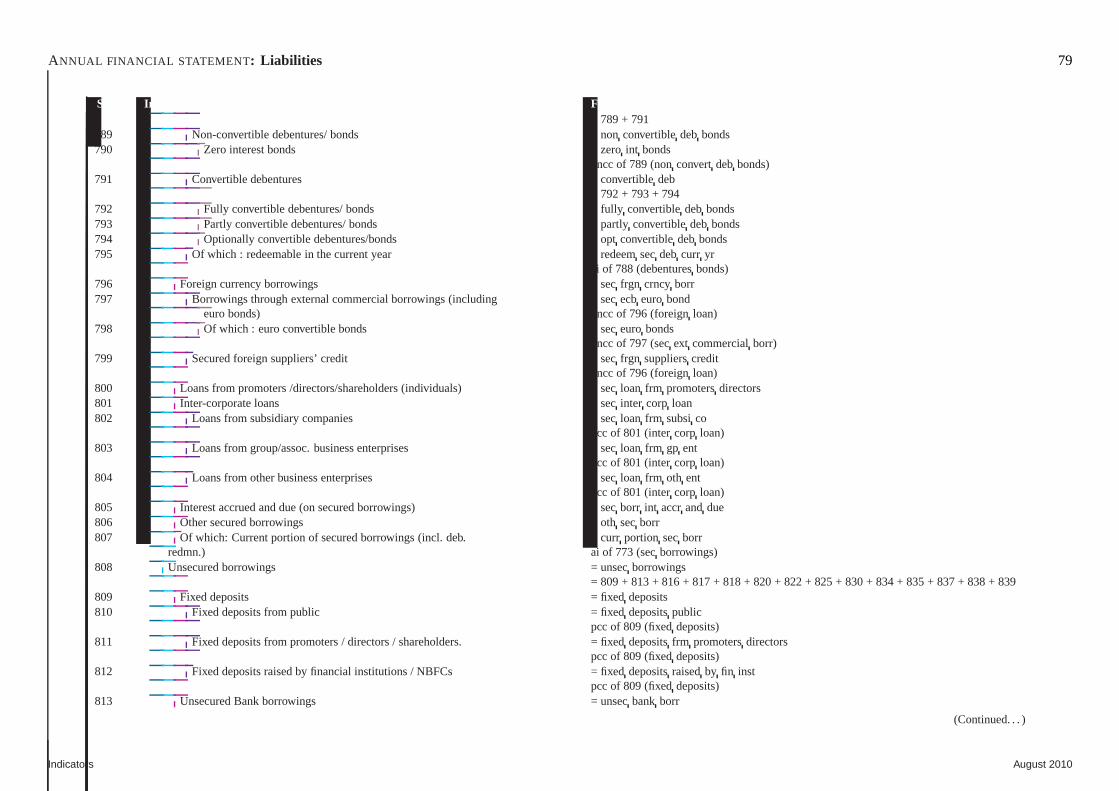
ANNUAL FINANCIAL STATEMENT : Liabilities 79
Sr.No. Indicator Fields & formula= 789 + 791
789 Non-convertible debentures/ bonds = non convertibledeb bonds790 Zero interest bonds = zero int bonds
pncc of 789 (nonconvertdebbonds)791 Convertible debentures = convertibledeb
= 792 + 793 + 794792 Fully convertible debentures/ bonds = fully convertibledeb bonds793 Partly convertible debentures/ bonds = partly convertibledeb bonds794 Optionally convertible debentures/bonds = optconvertibledebbonds795 Of which : redeemable in the current year = redeemsecdeb curr yr
ai of 788 (debenturesbonds)796 Foreign currency borrowings = secfrgn crncy borr797 Borrowings through external commercial borrowings (including = sececbeuro bond
euro bonds) pncc of 796 (foreignloan)798 Of which : euro convertible bonds = seceurobonds
pncc of 797 (secext commercialborr)799 Secured foreign suppliers’ credit = secfrgn supplierscredit
pncc of 796 (foreignloan)800 Loans from promoters /directors/shareholders (individuals) = secloan frm promotersdirectors801 Inter-corporate loans = secinter corp loan802 Loans from subsidiary companies = secloan frm subsico
pcc of 801 (intercorp loan)803 Loans from group/assoc. business enterprises = secloan frm gp ent
pcc of 801 (intercorp loan)804 Loans from other business enterprises = secloan frm oth ent
pcc of 801 (intercorp loan)805 Interest accrued and due (on secured borrowings) = secborr int accrand due806 Other secured borrowings = oth secborr807 Of which: Current portion of secured borrowings (incl. deb. = curr portion secborr
redmn.) ai of 773 (secborrowings)808 Unsecured borrowings = unsecborrowings
= 809 + 813 + 816 + 817 + 818 + 820 + 822 + 825 + 830 + 834 + 835 + 837 + 838 + 839809 Fixed deposits = fixed deposits810 Fixed deposits from public = fixed depositspublic
pcc of 809 (fixeddeposits)811 Fixed deposits from promoters / directors / shareholders. =fixed depositsfrm promotersdirectors
pcc of 809 (fixeddeposits)812 Fixed deposits raised by financial institutions / NBFCs = fixed depositsraisedby fin inst
pcc of 809 (fixeddeposits)813 Unsecured Bank borrowings = unsecbank borr
(Continued. . . )
Indicators August 2010
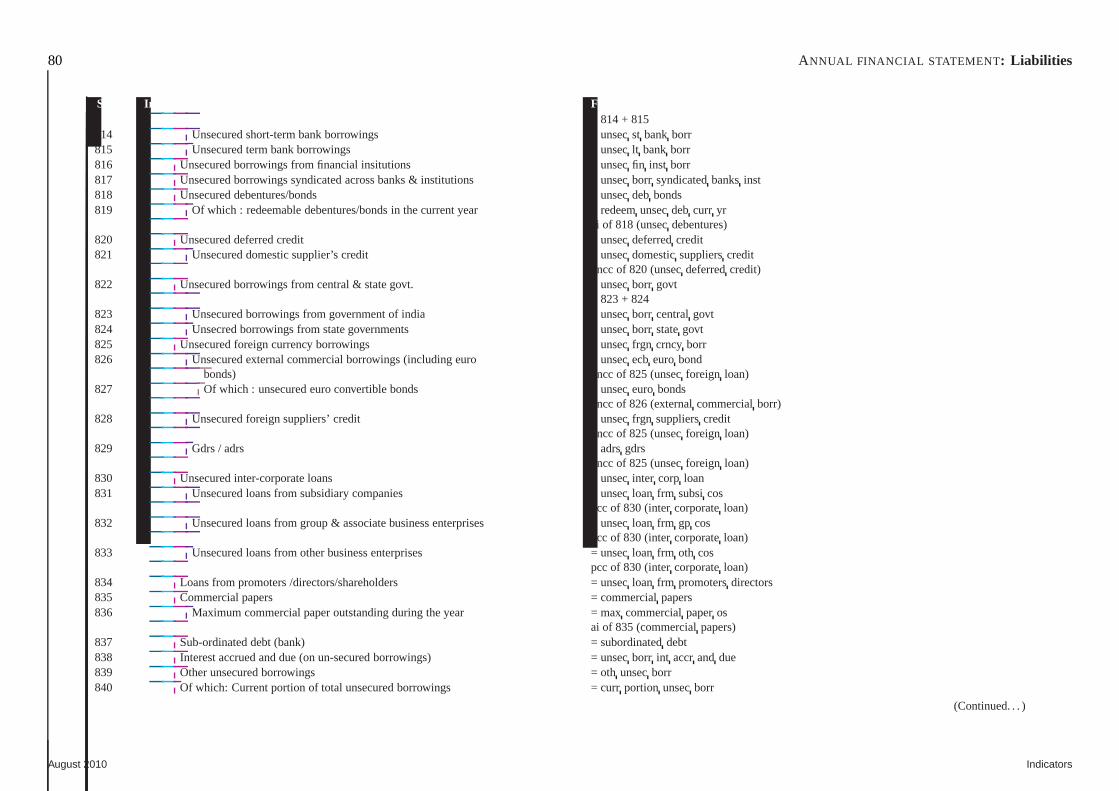
80 ANNUAL FINANCIAL STATEMENT : Liabilities
Sr.No. Indicator Fields & formula= 814 + 815
814 Unsecured short-term bank borrowings = unsecst bank borr815 Unsecured term bank borrowings = unseclt bank borr816 Unsecured borrowings from financial insitutions = unsecfin inst borr817 Unsecured borrowings syndicated across banks & institutions = unsecborr syndicatedbanksinst818 Unsecured debentures/bonds = unsecdeb bonds819 Of which : redeemable debentures/bonds in the current year =redeemunsecdeb curr yr
ai of 818 (unsecdebentures)820 Unsecured deferred credit = unsecdeferredcredit821 Unsecured domestic supplier’s credit = unsecdomesticsupplierscredit
pncc of 820 (unsecdeferredcredit)822 Unsecured borrowings from central & state govt. = unsecborr govt
= 823 + 824823 Unsecured borrowings from government of india = unsecborr centralgovt824 Unsecred borrowings from state governments = unsecborr stategovt825 Unsecured foreign currency borrowings = unsecfrgn crncy borr826 Unsecured external commercial borrowings (including euro = unsececb euro bond
bonds) pncc of 825 (unsecforeign loan)827 Of which : unsecured euro convertible bonds = unseceuro bonds
pncc of 826 (externalcommercialborr)828 Unsecured foreign suppliers’ credit = unsecfrgn supplierscredit
pncc of 825 (unsecforeign loan)829 Gdrs / adrs = adrsgdrs
pncc of 825 (unsecforeign loan)830 Unsecured inter-corporate loans = unsecinter corp loan831 Unsecured loans from subsidiary companies = unsecloan frm subsicos
pcc of 830 (intercorporateloan)832 Unsecured loans from group & associate business enterprises = unsecloan frm gp cos
pcc of 830 (intercorporateloan)833 Unsecured loans from other business enterprises = unsecloan frm oth cos
pcc of 830 (intercorporateloan)834 Loans from promoters /directors/shareholders = unsecloan frm promotersdirectors835 Commercial papers = commercialpapers836 Maximum commercial paper outstanding during the year = maxcommercialpaperos
ai of 835 (commercialpapers)837 Sub-ordinated debt (bank) = subordinateddebt838 Interest accrued and due (on un-secured borrowings) = unsecborr int accrand due839 Other unsecured borrowings = oth unsecborr840 Of which: Current portion of total unsecured borrowings = curr portion unsecborr
(Continued. . . )
August 2010 Indicators
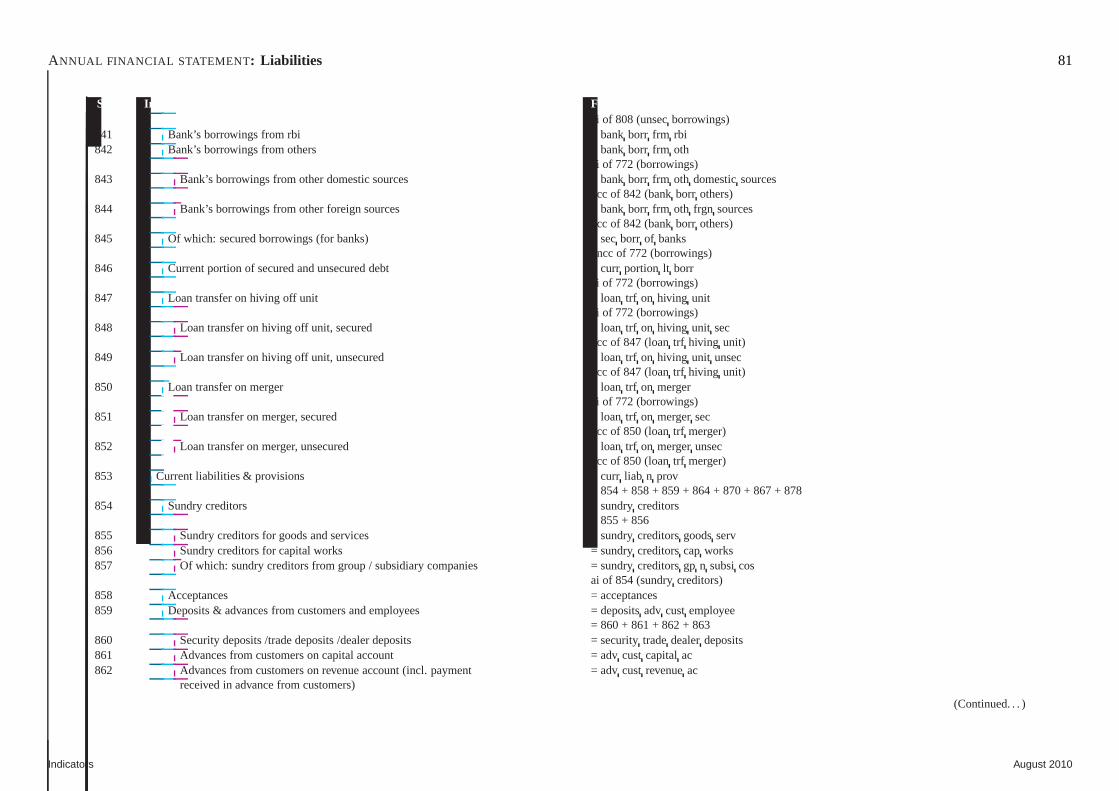
ANNUAL FINANCIAL STATEMENT : Liabilities 81
Sr.No. Indicator Fields & formulaai of 808 (unsecborrowings)
841 Bank’s borrowings from rbi = bankborr frm rbi842 Bank’s borrowings from others = bankborr frm oth
ai of 772 (borrowings)843 Bank’s borrowings from other domestic sources = bankborr frm oth domesticsources
pcc of 842 (bankborr others)844 Bank’s borrowings from other foreign sources = bankborr frm oth frgn sources
pcc of 842 (bankborr others)845 Of which: secured borrowings (for banks) = secborr of banks
pncc of 772 (borrowings)846 Current portion of secured and unsecured debt = curr portion lt borr
ai of 772 (borrowings)847 Loan transfer on hiving off unit = loan trf on hiving unit
ai of 772 (borrowings)848 Loan transfer on hiving off unit, secured = loan trf on hiving unit sec
pcc of 847 (loantrf hiving unit)849 Loan transfer on hiving off unit, unsecured = loan trf on hiving unit unsec
pcc of 847 (loantrf hiving unit)850 Loan transfer on merger = loan trf on merger
ai of 772 (borrowings)851 Loan transfer on merger, secured = loan trf on mergersec
pcc of 850 (loantrf merger)852 Loan transfer on merger, unsecured = loan trf on mergerunsec
pcc of 850 (loantrf merger)853 Current liabilities & provisions = curr liab n prov
= 854 + 858 + 859 + 864 + 870 + 867 + 878854 Sundry creditors = sundrycreditors
= 855 + 856855 Sundry creditors for goods and services = sundrycreditorsgoodsserv856 Sundry creditors for capital works = sundrycreditorscap works857 Of which: sundry creditors from group / subsidiary companies = sundrycreditorsgp n subsicos
ai of 854 (sundrycreditors)858 Acceptances = acceptances859 Deposits & advances from customers and employees = depositsadv cust employee
= 860 + 861 + 862 + 863860 Security deposits /trade deposits /dealer deposits = security tradedealerdeposits861 Advances from customers on capital account = adv cust capital ac862 Advances from customers on revenue account (incl. payment =adv cust revenueac
received in advance from customers)
(Continued. . . )
Indicators August 2010
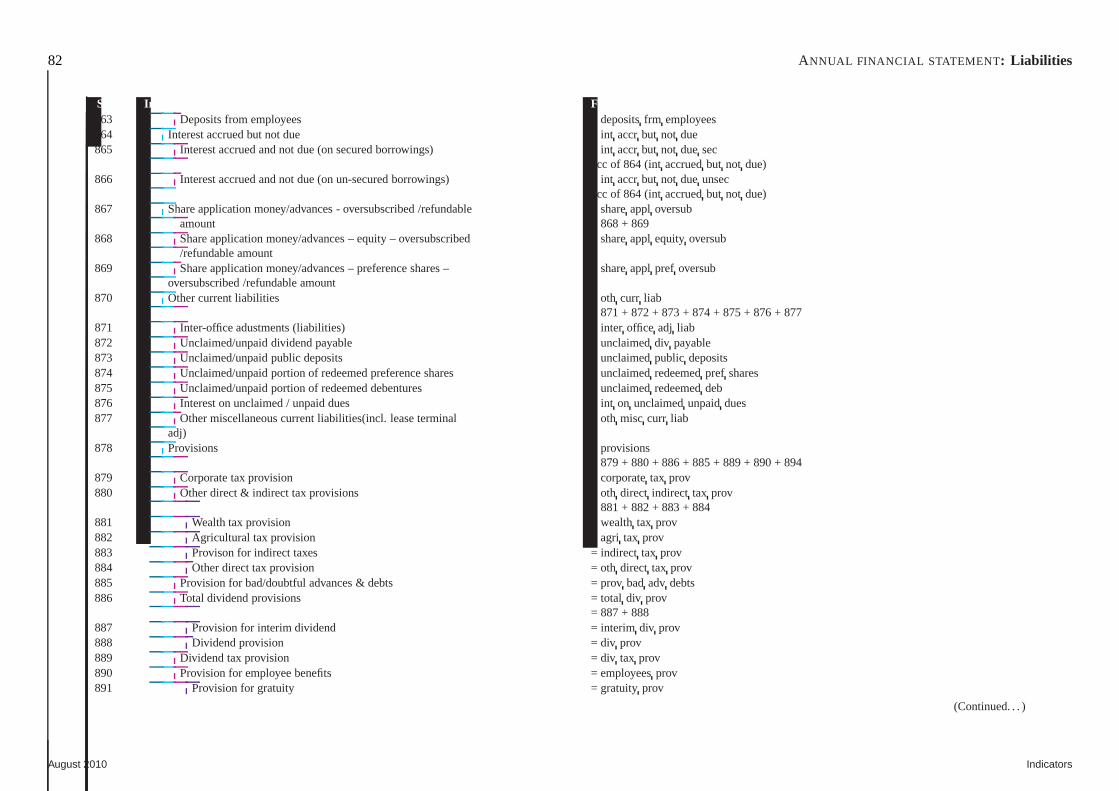
82 ANNUAL FINANCIAL STATEMENT : Liabilities
Sr.No. Indicator Fields & formula863 Deposits from employees = depositsfrm employees864 Interest accrued but not due = int accrbut not due865 Interest accrued and not due (on secured borrowings) = intaccrbut not due sec
pcc of 864 (intaccruedbut not due)866 Interest accrued and not due (on un-secured borrowings) = int accrbut not due unsec
pcc of 864 (intaccruedbut not due)867 Share application money/advances - oversubscribed /refundable = shareappl oversub
amount = 868 + 869868 Share application money/advances – equity – oversubscribed = shareappl equity oversub
/refundable amount869 Share application money/advances – preference shares – = share appl pref oversub
oversubscribed /refundable amount870 Other current liabilities = oth curr liab
= 871 + 872 + 873 + 874 + 875 + 876 + 877871 Inter-office adustments (liabilities) = inter office adj liab872 Unclaimed/unpaid dividend payable = unclaimeddiv payable873 Unclaimed/unpaid public deposits = unclaimedpublic deposits874 Unclaimed/unpaid portion of redeemed preference shares = unclaimedredeemedpref shares875 Unclaimed/unpaid portion of redeemed debentures = unclaimed redeemeddeb876 Interest on unclaimed / unpaid dues = int on unclaimedunpaiddues877 Other miscellaneous current liabilities(incl. lease terminal = oth misc curr liab
adj)878 Provisions = provisions
= 879 + 880 + 886 + 885 + 889 + 890 + 894879 Corporate tax provision = corporatetax prov880 Other direct & indirect tax provisions = oth direct indirect tax prov
= 881 + 882 + 883 + 884881 Wealth tax provision = wealth tax prov882 Agricultural tax provision = agri tax prov883 Provison for indirect taxes = indirect tax prov884 Other direct tax provision = oth direct tax prov885 Provision for bad/doubtful advances & debts = prov bad adv debts886 Total dividend provisions = total div prov
= 887 + 888887 Provision for interim dividend = interim div prov888 Dividend provision = div prov889 Dividend tax provision = div tax prov890 Provision for employee benefits = employeesprov891 Provision for gratuity = gratuity prov
(Continued. . . )
August 2010 Indicators
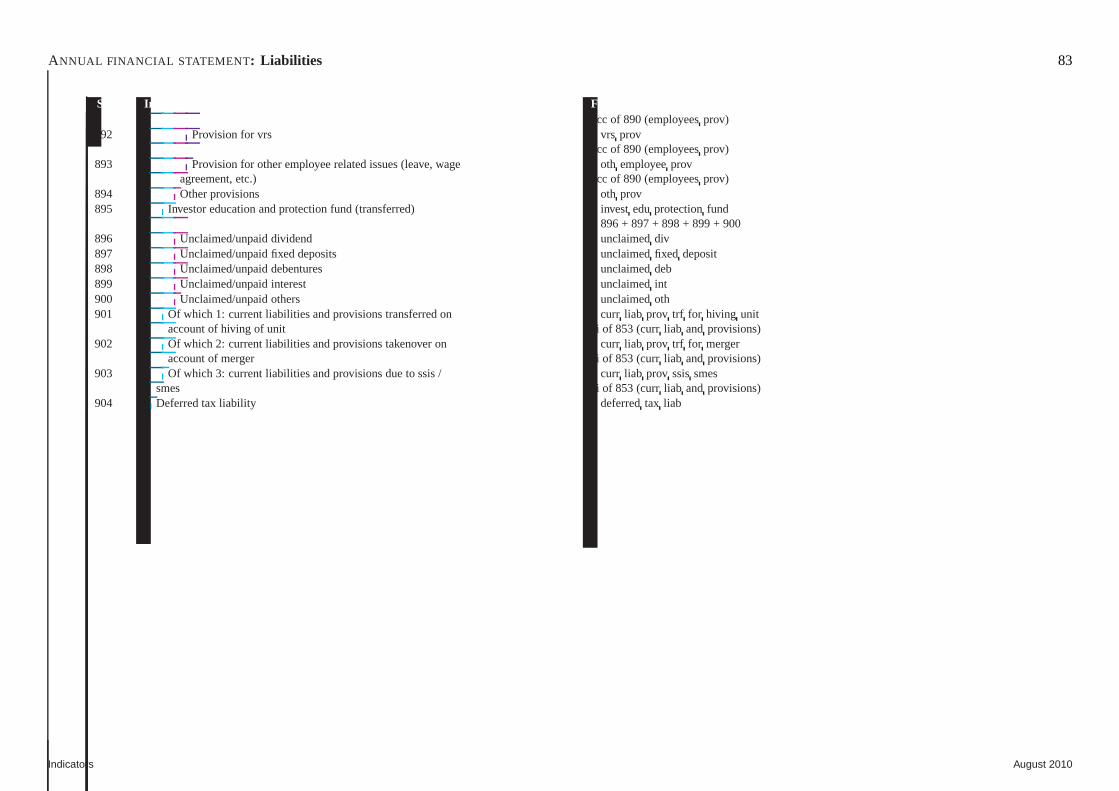
ANNUAL FINANCIAL STATEMENT : Liabilities 83
Sr.No. Indicator Fields & formulapcc of 890 (employeesprov)
892 Provision for vrs = vrs provpcc of 890 (employeesprov)
893 Provision for other employee related issues (leave, wage = oth employeeprovagreement, etc.) pcc of 890 (employeesprov)
894 Other provisions = oth prov895 Investor education and protection fund (transferred) = invest eduprotectionfund
= 896 + 897 + 898 + 899 + 900896 Unclaimed/unpaid dividend = unclaimeddiv897 Unclaimed/unpaid fixed deposits = unclaimedfixed deposit898 Unclaimed/unpaid debentures = unclaimeddeb899 Unclaimed/unpaid interest = unclaimedint900 Unclaimed/unpaid others = unclaimedoth901 Of which 1: current liabilities and provisions transferredon = curr liab prov trf for hiving unit
account of hiving of unit ai of 853 (currliab and provisions)902 Of which 2: current liabilities and provisions takenover on = curr liab prov trf for merger
account of merger ai of 853 (currliab and provisions)903 Of which 3: current liabilities and provisions due to ssis / =curr liab prov ssissmes
smes ai of 853 (currliab and provisions)904 Deferred tax liability = deferredtax liab
Indicators August 2010
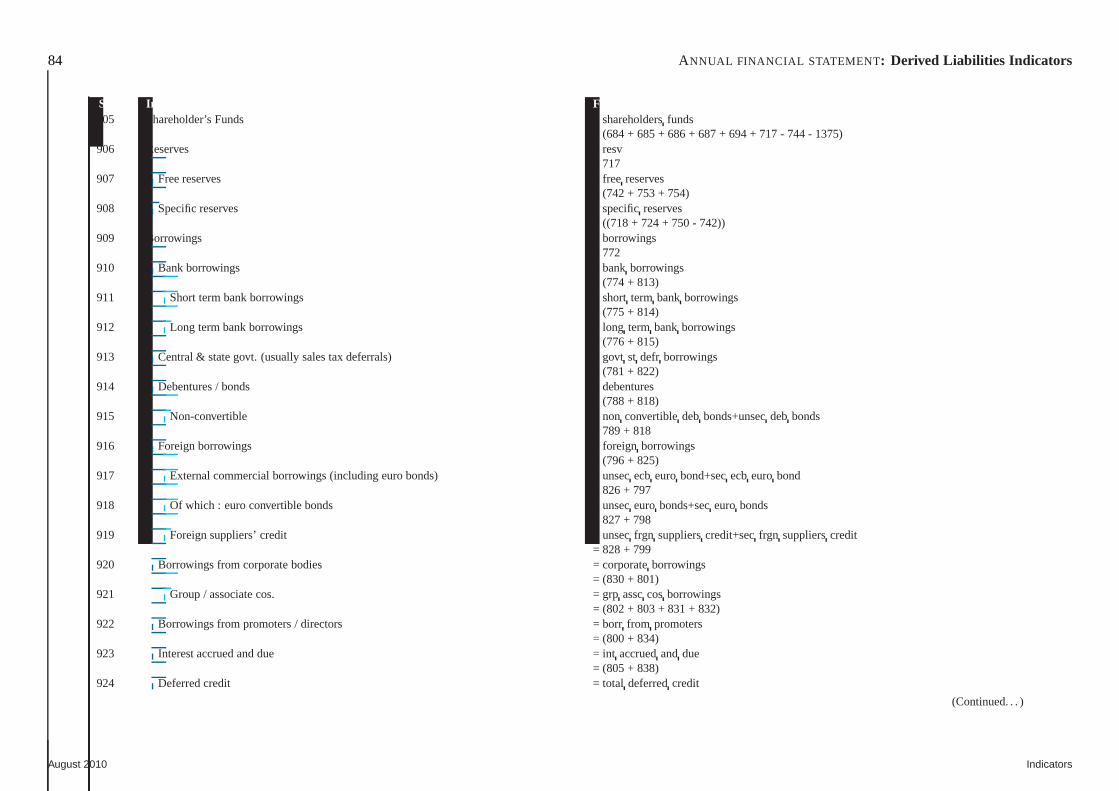
84 ANNUAL FINANCIAL STATEMENT : Derived Liabilities Indicators
Sr.No. Indicator Fields & formula905 Shareholder’s Funds = shareholdersfunds
= (684 + 685 + 686 + 687 + 694 + 717 - 744 - 1375)906 Reserves = resv
= 717907 Free reserves = free reserves
= (742 + 753 + 754)908 Specific reserves = specificreserves
= ((718 + 724 + 750 - 742))909 Borrowings = borrowings
= 772910 Bank borrowings = bankborrowings
= (774 + 813)911 Short term bank borrowings = short term bank borrowings
= (775 + 814)912 Long term bank borrowings = long term bank borrowings
= (776 + 815)913 Central & state govt. (usually sales tax deferrals) = govt st defr borrowings
= (781 + 822)914 Debentures / bonds = debentures
= (788 + 818)915 Non-convertible = non convertibledeb bonds+unsecdeb bonds
= 789 + 818916 Foreign borrowings = foreign borrowings
= (796 + 825)917 External commercial borrowings (including euro bonds) = unsececb euro bond+sececbeuro bond
= 826 + 797918 Of which : euro convertible bonds = unseceuro bonds+seceuro bonds
= 827 + 798919 Foreign suppliers’ credit = unsecfrgn supplierscredit+secfrgn supplierscredit
= 828 + 799920 Borrowings from corporate bodies = corporateborrowings
= (830 + 801)921 Group / associate cos. = grp assccos borrowings
= (802 + 803 + 831 + 832)922 Borrowings from promoters / directors = borr from promoters
= (800 + 834)923 Interest accrued and due = int accruedand due
= (805 + 838)924 Deferred credit = total deferredcredit
(Continued. . . )
August 2010 Indicators
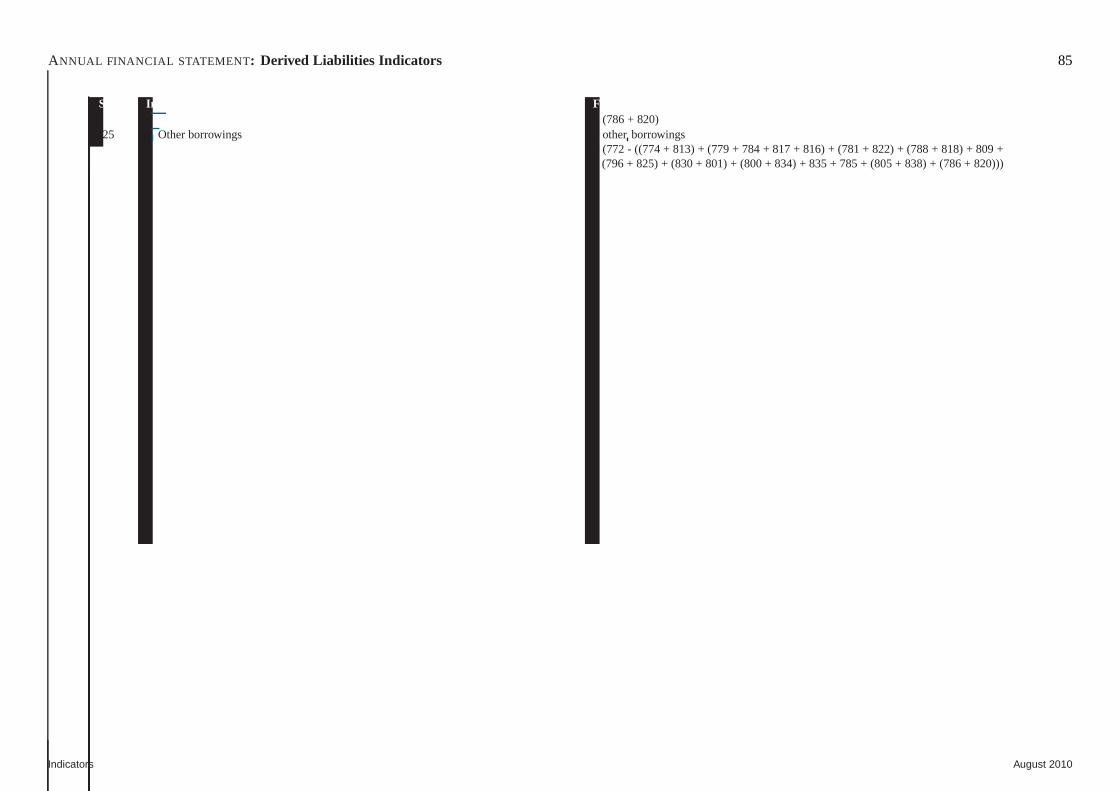
ANNUAL FINANCIAL STATEMENT : Derived Liabilities Indicators 85
Sr.No. Indicator Fields & formula= (786 + 820)
925 Other borrowings = otherborrowings= (772 - ((774 + 813) + (779 + 784 + 817 + 816) + (781 + 822) + (788 + 818) + 809 +
(796 + 825) + (830 + 801) + (800 + 834) + 835 + 785 + (805 + 838) + (786 + 820)))
Indicators August 2010
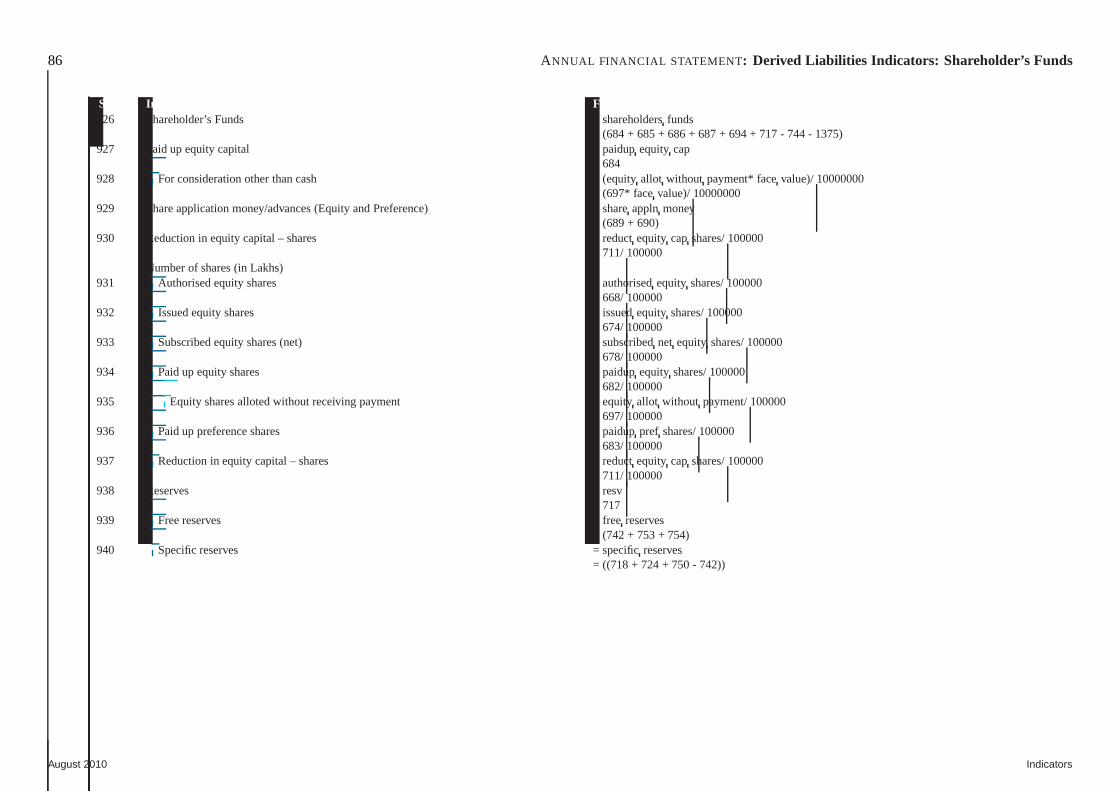
86 ANNUAL FINANCIAL STATEMENT : Derived Liabilities Indicators: Shareholder’s Funds
Sr.No. Indicator Fields & formula926 Shareholder’s Funds = shareholdersfunds
= (684 + 685 + 686 + 687 + 694 + 717 - 744 - 1375)927 Paid up equity capital = paidupequity cap
= 684928 For consideration other than cash = (equity allot without payment* facevalue)/ 10000000
= (697* facevalue)/ 10000000929 Share application money/advances (Equity and Preference) = shareappln money
= (689 + 690)930 Reduction in equity capital – shares = reductequity capshares/ 100000
= 711/ 100000Number of shares (in Lakhs)
931 Authorised equity shares = authorisedequity shares/ 100000= 668/ 100000
932 Issued equity shares = issuedequity shares/ 100000= 674/ 100000
933 Subscribed equity shares (net) = subscribednet equity shares/ 100000= 678/ 100000
934 Paid up equity shares = paidupequity shares/ 100000= 682/ 100000
935 Equity shares alloted without receiving payment = equityallot without payment/ 100000= 697/ 100000
936 Paid up preference shares = paiduppref shares/ 100000= 683/ 100000
937 Reduction in equity capital – shares = reductequity capshares/ 100000= 711/ 100000
938 Reserves = resv= 717
939 Free reserves = free reserves= (742 + 753 + 754)
940 Specific reserves = specificreserves= ((718 + 724 + 750 - 742))
August 2010 Indicators
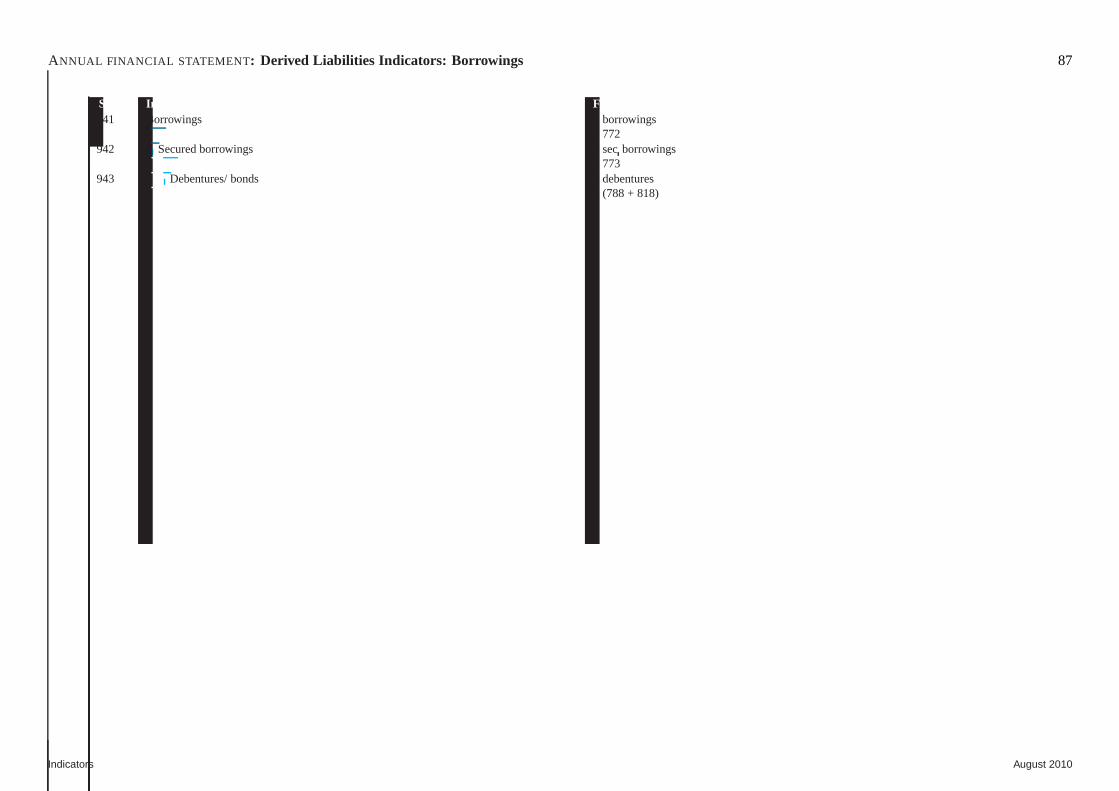
ANNUAL FINANCIAL STATEMENT : Derived Liabilities Indicators: Borrowings 87
Sr.No. Indicator Fields & formula941 Borrowings = borrowings
= 772942 Secured borrowings = secborrowings
= 773943 Debentures/ bonds = debentures
= (788 + 818)
Indicators August 2010

88 ANNUAL FINANCIAL STATEMENT : Derived Liabilities Indicators: Current Liabilities & Pr ovisions
Sr.No. Indicator Fields & formula944 Current liabilities & provisions = curr liab n prov
= 853945 Current liabilities = currentliabilities
= (854 + 858 + 859 + 864 + 867 + 870)
August 2010 Indicators
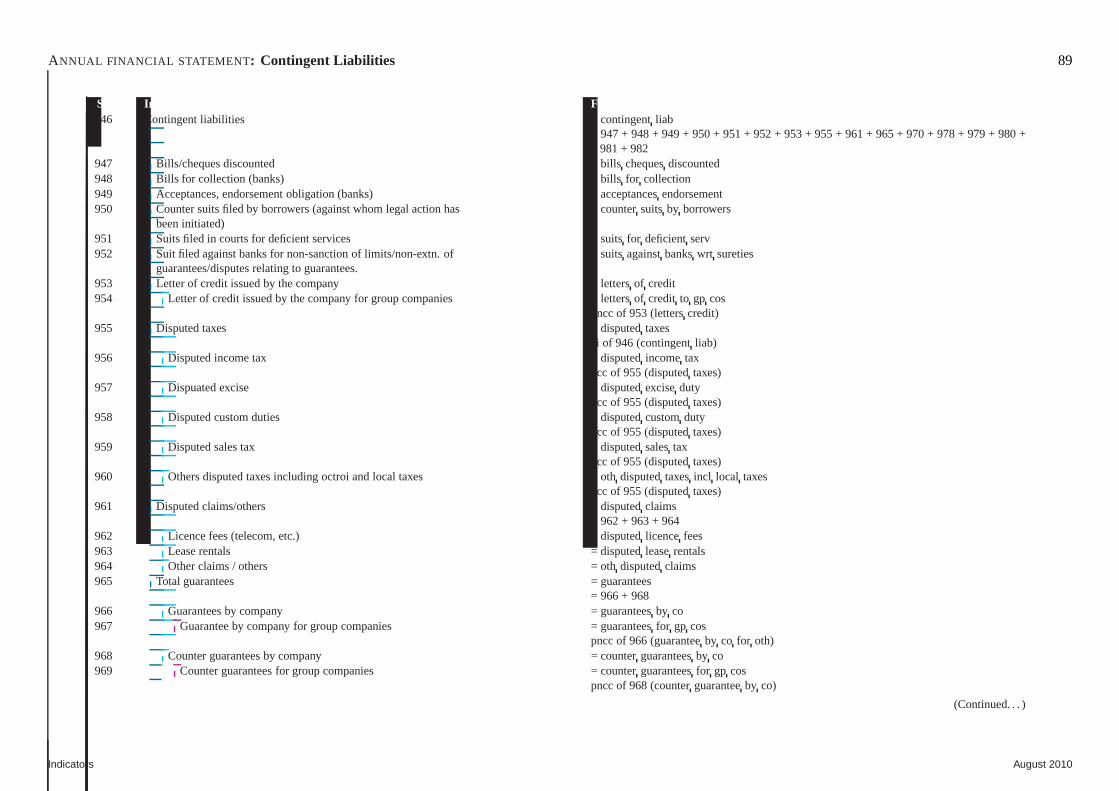
ANNUAL FINANCIAL STATEMENT : Contingent Liabilities 89
Sr.No. Indicator Fields & formula946 Contingent liabilities = contingentliab
= 947 + 948 + 949 + 950 + 951 + 952 + 953 + 955 + 961 + 965 + 970 + 978 + 979 + 980 +981 + 982
947 Bills/cheques discounted = bills chequesdiscounted948 Bills for collection (banks) = bills for collection949 Acceptances, endorsement obligation (banks) = acceptancesendorsement950 Counter suits filed by borrowers (against whom legal action has = countersuitsby borrowers
been initiated)951 Suits filed in courts for deficient services = suits for deficientserv952 Suit filed against banks for non-sanction of limits/non-extn. of = suitsagainstbankswrt sureties
guarantees/disputes relating to guarantees.953 Letter of credit issued by the company = lettersof credit954 Letter of credit issued by the company for group companies = lettersof credit to gp cos
pncc of 953 (letterscredit)955 Disputed taxes = disputedtaxes
ai of 946 (contingentliab)956 Disputed income tax = disputedincometax
pcc of 955 (disputedtaxes)957 Dispuated excise = disputedexciseduty
pcc of 955 (disputedtaxes)958 Disputed custom duties = disputedcustomduty
pcc of 955 (disputedtaxes)959 Disputed sales tax = disputedsalestax
pcc of 955 (disputedtaxes)960 Others disputed taxes including octroi and local taxes = othdisputedtaxesincl local taxes
pcc of 955 (disputedtaxes)961 Disputed claims/others = disputedclaims
= 962 + 963 + 964962 Licence fees (telecom, etc.) = disputedlicencefees963 Lease rentals = disputedleaserentals964 Other claims / others = oth disputedclaims965 Total guarantees = guarantees
= 966 + 968966 Guarantees by company = guaranteesby co967 Guarantee by company for group companies = guaranteesfor gp cos
pncc of 966 (guaranteeby co for oth)968 Counter guarantees by company = counterguaranteesby co969 Counter guarantees for group companies = counterguaranteesfor gp cos
pncc of 968 (counterguaranteeby co)
(Continued. . . )
Indicators August 2010
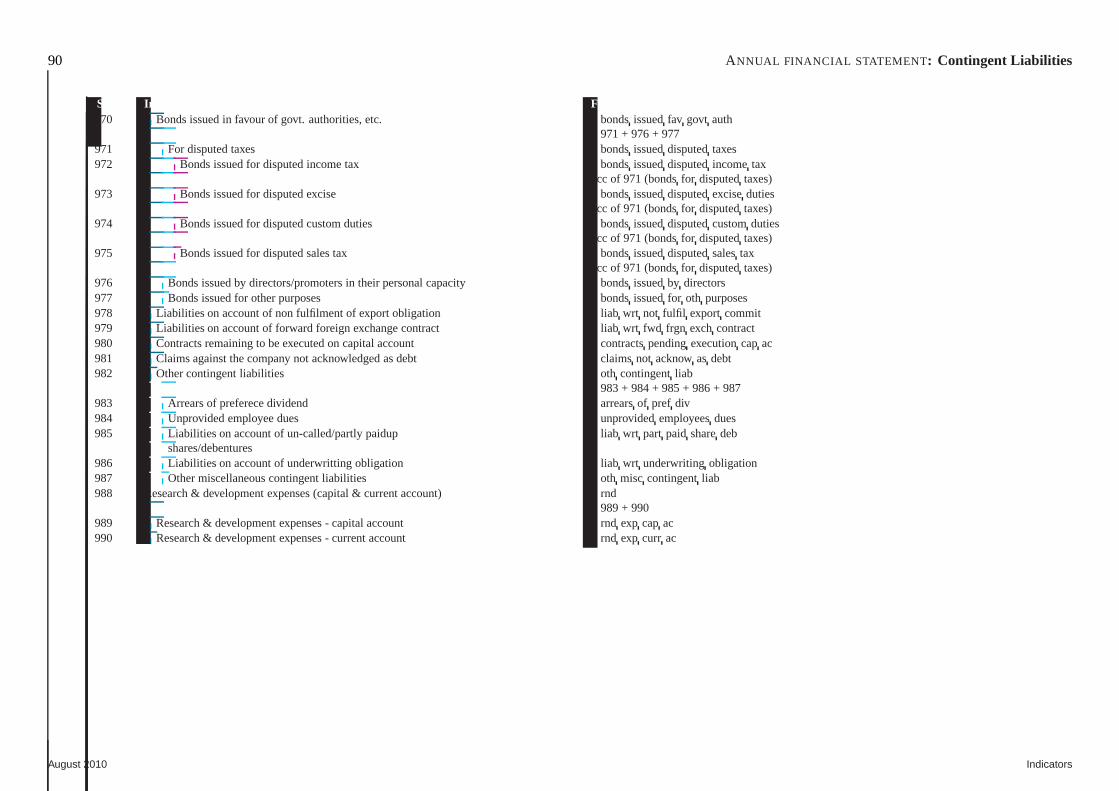
90 ANNUAL FINANCIAL STATEMENT : Contingent Liabilities
Sr.No. Indicator Fields & formula970 Bonds issued in favour of govt. authorities, etc. = bondsissuedfav govt auth
= 971 + 976 + 977971 For disputed taxes = bondsissueddisputedtaxes972 Bonds issued for disputed income tax = bondsissueddisputedincometax
pcc of 971 (bondsfor disputedtaxes)973 Bonds issued for disputed excise = bondsissueddisputedexciseduties
pcc of 971 (bondsfor disputedtaxes)974 Bonds issued for disputed custom duties = bondsissueddisputedcustomduties
pcc of 971 (bondsfor disputedtaxes)975 Bonds issued for disputed sales tax = bondsissueddisputedsalestax
pcc of 971 (bondsfor disputedtaxes)976 Bonds issued by directors/promoters in their personal capacity = bondsissuedby directors977 Bonds issued for other purposes = bondsissuedfor oth purposes978 Liabilities on account of non fulfilment of export obligation = liab wrt not fulfil export commit979 Liabilities on account of forward foreign exchange contract = liab wrt fwd frgn exch contract980 Contracts remaining to be executed on capital account = contractspendingexecutioncapac981 Claims against the company not acknowledged as debt = claimsnot acknowasdebt982 Other contingent liabilities = oth contingentliab
= 983 + 984 + 985 + 986 + 987983 Arrears of preferece dividend = arrearsof pref div984 Unprovided employee dues = unprovidedemployeesdues985 Liabilities on account of un-called/partly paidup = liabwrt part paid sharedeb
shares/debentures986 Liabilities on account of underwritting obligation = liabwrt underwritingobligation987 Other miscellaneous contingent liabilities = oth misc contingentliab988 Research & development expenses (capital & current account) = rnd
= 989 + 990989 Research & development expenses - capital account = rndexp cap ac990 Research & development expenses - current account = rndexp curr ac
August 2010 Indicators
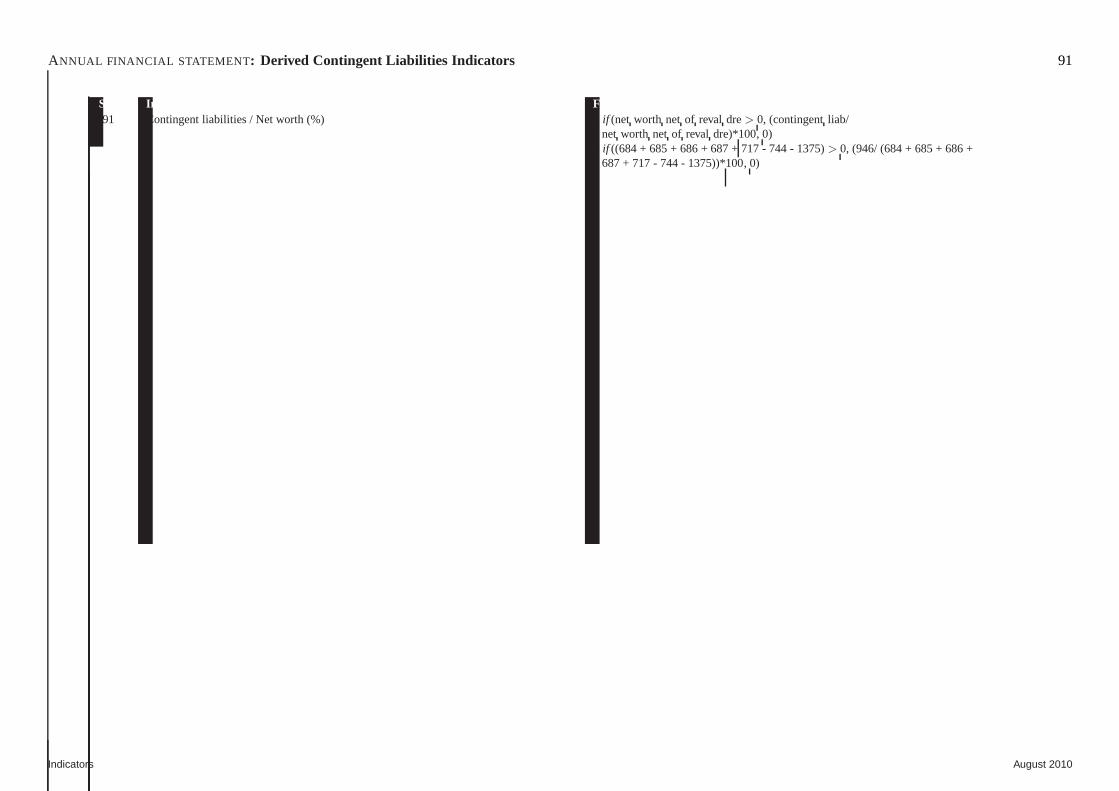
ANNUAL FINANCIAL STATEMENT : Derived Contingent Liabilities Indicators 91
Sr.No. Indicator Fields & formula991 Contingent liabilities / Net worth (%) = if (net worth net of reval dre> 0, (contingentliab/
net worth net of reval dre)*100, 0)= if ((684 + 685 + 686 + 687 + 717 - 744 - 1375)> 0, (946/ (684 + 685 + 686 +
687 + 717 - 744 - 1375))*100, 0)
Indicators August 2010
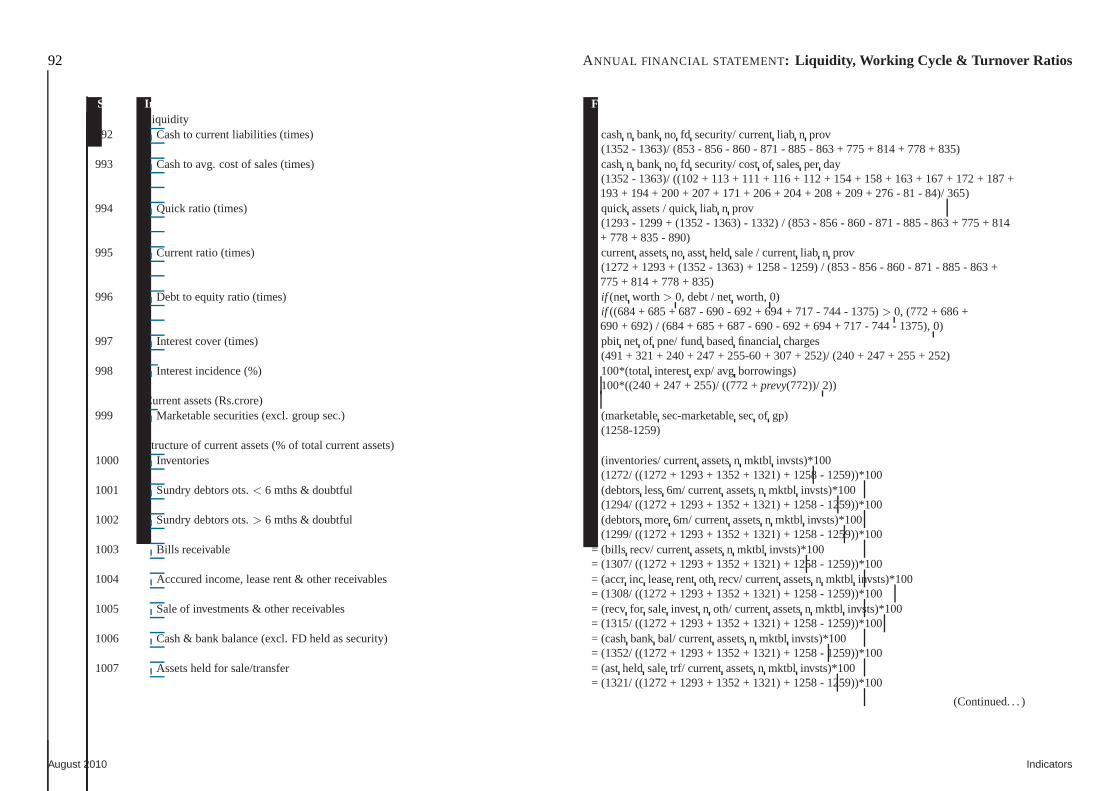
92 ANNUAL FINANCIAL STATEMENT : Liquidity, Working Cycle & Turnover Ratios
Sr.No. Indicator Fields & formulaLiquidity
992 Cash to current liabilities (times) = cashn bank no fd security/ currentliab n prov= (1352 - 1363)/ (853 - 856 - 860 - 871 - 885 - 863 + 775 + 814 + 778 + 835)
993 Cash to avg. cost of sales (times) = cashn bank no fd security/ costof salesper day= (1352 - 1363)/ ((102 + 113 + 111 + 116 + 112 + 154 + 158 + 163 + 167 +172 + 187 +
193 + 194 + 200 + 207 + 171 + 206 + 204 + 208 + 209 + 276 - 81 - 84)/ 365)994 Quick ratio (times) = quick assets / quickliab n prov
= (1293 - 1299 + (1352 - 1363) - 1332) / (853 - 856 - 860 - 871 - 885 -863 + 775 + 814+ 778 + 835 - 890)
995 Current ratio (times) = currentassetsno asstheld sale / currentliab n prov= (1272 + 1293 + (1352 - 1363) + 1258 - 1259) / (853 - 856 - 860 - 871- 885 - 863 +
775 + 814 + 778 + 835)996 Debt to equity ratio (times) = if (net worth> 0, debt / networth, 0)
= if ((684 + 685 + 687 - 690 - 692 + 694 + 717 - 744 - 1375)> 0, (772 + 686 +690 + 692) / (684 + 685 + 687 - 690 - 692 + 694 + 717 - 744 - 1375), 0)
997 Interest cover (times) = pbit net of pne/ fundbasedfinancial charges= (491 + 321 + 240 + 247 + 255-60 + 307 + 252)/ (240 + 247 + 255 + 252)
998 Interest incidence (%) = 100*(total interestexp/ avgborrowings)= 100*((240 + 247 + 255)/ ((772 +prevy(772))/ 2))
Current assets (Rs.crore)999 Marketable securities (excl. group sec.) = (marketablesec-marketablesecof gp)
= (1258-1259)Structure of current assets (% of total current assets)
1000 Inventories = (inventories/ currentassetsn mktbl invsts)*100= (1272/ ((1272 + 1293 + 1352 + 1321) + 1258 - 1259))*100
1001 Sundry debtors ots.< 6 mths & doubtful = (debtorsless6m/ currentassetsn mktbl invsts)*100= (1294/ ((1272 + 1293 + 1352 + 1321) + 1258 - 1259))*100
1002 Sundry debtors ots.> 6 mths & doubtful = (debtorsmore 6m/ currentassetsn mktbl invsts)*100= (1299/ ((1272 + 1293 + 1352 + 1321) + 1258 - 1259))*100
1003 Bills receivable = (bills recv/ currentassetsn mktbl invsts)*100= (1307/ ((1272 + 1293 + 1352 + 1321) + 1258 - 1259))*100
1004 Acccured income, lease rent & other receivables = (accr inc leaserent oth recv/ currentassetsn mktbl invsts)*100= (1308/ ((1272 + 1293 + 1352 + 1321) + 1258 - 1259))*100
1005 Sale of investments & other receivables = (recv for saleinvest n oth/ currentassetsn mktbl invsts)*100= (1315/ ((1272 + 1293 + 1352 + 1321) + 1258 - 1259))*100
1006 Cash & bank balance (excl. FD held as security) = (cashbank bal/ currentassetsn mktbl invsts)*100= (1352/ ((1272 + 1293 + 1352 + 1321) + 1258 - 1259))*100
1007 Assets held for sale/transfer = (astheld saletrf/ current assetsn mktbl invsts)*100= (1321/ ((1272 + 1293 + 1352 + 1321) + 1258 - 1259))*100
(Continued. . . )
August 2010 Indicators
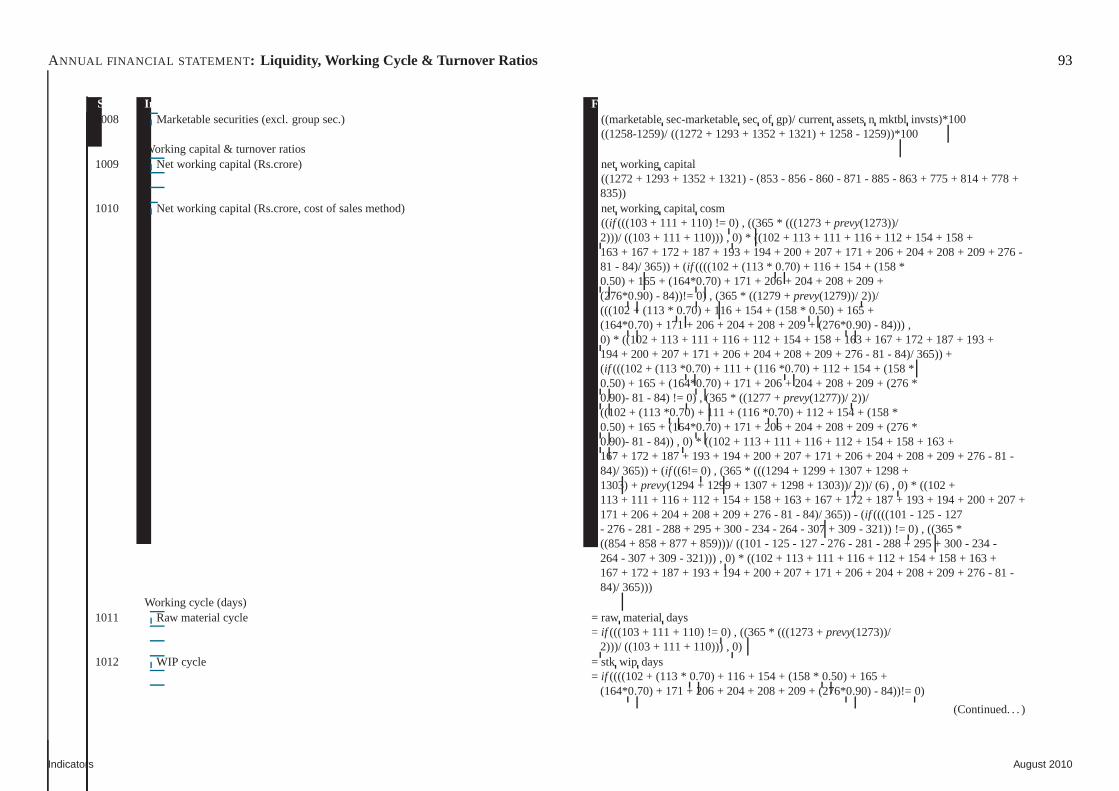
ANNUAL FINANCIAL STATEMENT : Liquidity, Working Cycle & Turnover Ratios 93
Sr.No. Indicator Fields & formula1008 Marketable securities (excl. group sec.) = ((marketablesec-marketablesecof gp)/ currentassetsn mktbl invsts)*100
= ((1258-1259)/ ((1272 + 1293 + 1352 + 1321) + 1258 - 1259))*100Working capital & turnover ratios
1009 Net working capital (Rs.crore) = net working capital= ((1272 + 1293 + 1352 + 1321) - (853 - 856 - 860 - 871 - 885 - 863 + 775 + 814 + 778 +
835))1010 Net working capital (Rs.crore, cost of sales method) = networking capital cosm
= ((if (((103 + 111 + 110) != 0) , ((365* (((1273 +prevy(1273))/2)))/ ((103 + 111 + 110))) , 0) * ((102 + 113 + 111 + 116 + 112 + 154 + 158 +163 + 167 + 172 + 187 + 193 + 194 + 200 + 207 + 171 + 206 + 204 + 208 + 209+ 276 -81 - 84)/ 365)) + (if ((((102 + (113 * 0.70) + 116 + 154 + (158 *0.50) + 165 + (164*0.70) + 171 + 206 + 204 + 208 + 209 +(276*0.90) - 84))!= 0) , (365* ((1279 +prevy(1279))/ 2))/(((102 + (113 * 0.70) + 116 + 154 + (158 * 0.50) + 165 +(164*0.70) + 171 + 206 + 204 + 208 + 209 + (276*0.90) - 84))) ,0) * ((102 + 113 + 111 + 116 + 112 + 154 + 158 + 163 + 167 + 172 + 187 + 193+194 + 200 + 207 + 171 + 206 + 204 + 208 + 209 + 276 - 81 - 84)/ 365)) +(if (((102 + (113 *0.70) + 111 + (116 *0.70) + 112 + 154 + (158 *0.50) + 165 + (164*0.70) + 171 + 206 + 204 + 208 + 209 + (276 *0.90)- 81 - 84) != 0) , (365* ((1277 +prevy(1277))/ 2))/((102 + (113 *0.70) + 111 + (116 *0.70) + 112 + 154 + (158 *0.50) + 165 + (164*0.70) + 171 + 206 + 204 + 208 + 209 + (276 *0.90)- 81 - 84)) , 0) * ((102 + 113 + 111 + 116 + 112 + 154 + 158 + 163 +167 + 172 + 187 + 193 + 194 + 200 + 207 + 171 + 206 + 204 + 208 + 209 + 276- 81 -84)/ 365)) + (if ((6!= 0) , (365* (((1294 + 1299 + 1307 + 1298 +1303) +prevy(1294 + 1299 + 1307 + 1298 + 1303))/ 2))/ (6) , 0) * ((102 +113 + 111 + 116 + 112 + 154 + 158 + 163 + 167 + 172 + 187 + 193 + 194 + 200+ 207 +171 + 206 + 204 + 208 + 209 + 276 - 81 - 84)/ 365)) - (if ((((101 - 125 - 127- 276 - 281 - 288 + 295 + 300 - 234 - 264 - 307 + 309 - 321)) != 0) , ((365*((854 + 858 + 877 + 859)))/ ((101 - 125 - 127 - 276 - 281 - 288 + 295 +300 - 234 -264 - 307 + 309 - 321))) , 0) * ((102 + 113 + 111 + 116 + 112 + 154 + 158 + 163 +167 + 172 + 187 + 193 + 194 + 200 + 207 + 171 + 206 + 204 + 208 + 209 + 276- 81 -84)/ 365)))
Working cycle (days)1011 Raw material cycle = raw materialdays
= if (((103 + 111 + 110) != 0) , ((365* (((1273 +prevy(1273))/2)))/ ((103 + 111 + 110))) , 0)
1012 WIP cycle = stk wip days= if ((((102 + (113 * 0.70) + 116 + 154 + (158 * 0.50) + 165 +
(164*0.70) + 171 + 206 + 204 + 208 + 209 + (276*0.90) - 84))!= 0)
(Continued. . . )
Indicators August 2010
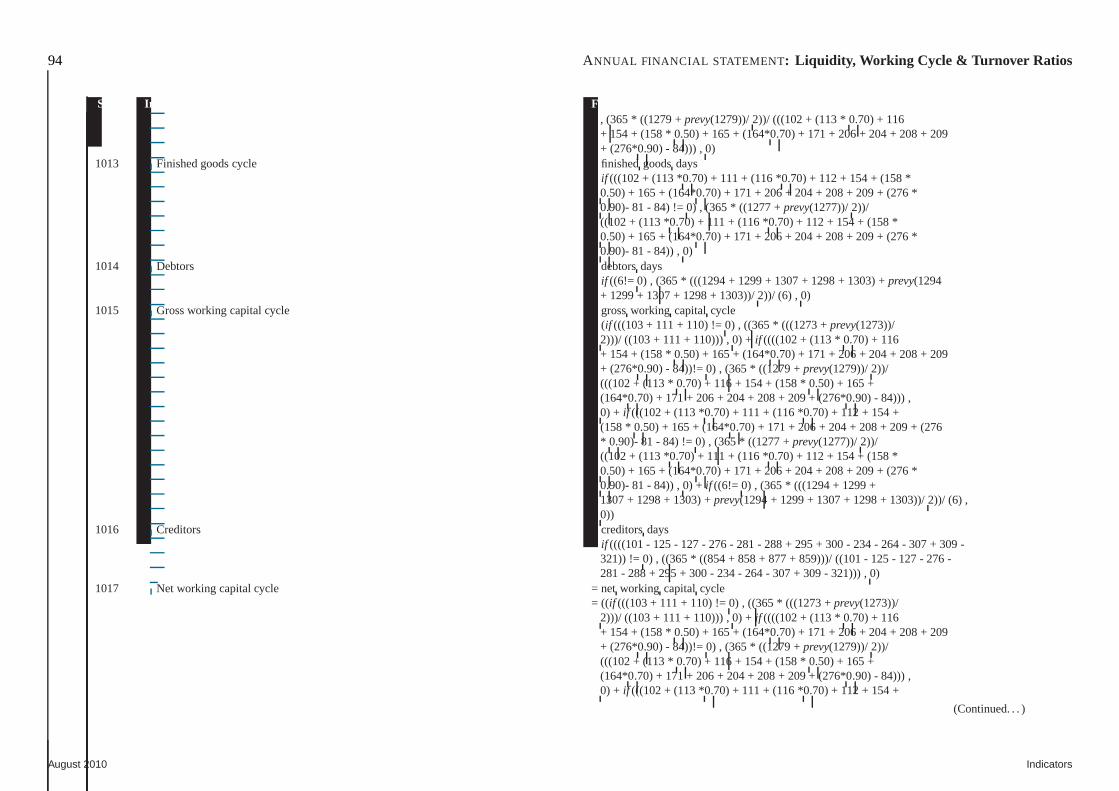
94 ANNUAL FINANCIAL STATEMENT : Liquidity, Working Cycle & Turnover Ratios
Sr.No. Indicator Fields & formula, (365* ((1279 +prevy(1279))/ 2))/ (((102 + (113 * 0.70) + 116+ 154 + (158 * 0.50) + 165 + (164*0.70) + 171 + 206 + 204 + 208 + 209+ (276*0.90) - 84))) , 0)
1013 Finished goods cycle = finishedgoodsdays= if (((102 + (113 *0.70) + 111 + (116 *0.70) + 112 + 154 + (158 *
0.50) + 165 + (164*0.70) + 171 + 206 + 204 + 208 + 209 + (276 *0.90)- 81 - 84) != 0) , (365* ((1277 +prevy(1277))/ 2))/((102 + (113 *0.70) + 111 + (116 *0.70) + 112 + 154 + (158 *0.50) + 165 + (164*0.70) + 171 + 206 + 204 + 208 + 209 + (276 *0.90)- 81 - 84)) , 0)
1014 Debtors = debtorsdays= if ((6!= 0) , (365* (((1294 + 1299 + 1307 + 1298 + 1303) +prevy(1294
+ 1299 + 1307 + 1298 + 1303))/ 2))/ (6) , 0)1015 Gross working capital cycle = grossworking capital cycle
= (if (((103 + 111 + 110) != 0) , ((365* (((1273 +prevy(1273))/2)))/ ((103 + 111 + 110))) , 0) + if ((((102 + (113 * 0.70) + 116+ 154 + (158 * 0.50) + 165 + (164*0.70) + 171 + 206 + 204 + 208 + 209+ (276*0.90) - 84))!= 0) , (365* ((1279 +prevy(1279))/ 2))/(((102 + (113 * 0.70) + 116 + 154 + (158 * 0.50) + 165 +(164*0.70) + 171 + 206 + 204 + 208 + 209 + (276*0.90) - 84))) ,0) + if (((102 + (113 *0.70) + 111 + (116 *0.70) + 112 + 154 +(158 * 0.50) + 165 + (164*0.70) + 171 + 206 + 204 + 208 + 209 + (276* 0.90)- 81 - 84) != 0) , (365* ((1277 +prevy(1277))/ 2))/((102 + (113 *0.70) + 111 + (116 *0.70) + 112 + 154 + (158 *0.50) + 165 + (164*0.70) + 171 + 206 + 204 + 208 + 209 + (276 *0.90)- 81 - 84)) , 0) + if ((6!= 0) , (365* (((1294 + 1299 +1307 + 1298 + 1303) +prevy(1294 + 1299 + 1307 + 1298 + 1303))/ 2))/ (6) ,0))
1016 Creditors = creditorsdays= if ((((101 - 125 - 127 - 276 - 281 - 288 + 295 + 300 - 234 - 264 - 307 + 309-
321)) != 0) , ((365* ((854 + 858 + 877 + 859)))/ ((101 - 125 - 127 - 276 -281 - 288 + 295 + 300 - 234 - 264 - 307 + 309 - 321))) , 0)
1017 Net working capital cycle = net working capital cycle= ((if (((103 + 111 + 110) != 0) , ((365* (((1273 +prevy(1273))/
2)))/ ((103 + 111 + 110))) , 0) + if ((((102 + (113 * 0.70) + 116+ 154 + (158 * 0.50) + 165 + (164*0.70) + 171 + 206 + 204 + 208 + 209+ (276*0.90) - 84))!= 0) , (365* ((1279 +prevy(1279))/ 2))/(((102 + (113 * 0.70) + 116 + 154 + (158 * 0.50) + 165 +(164*0.70) + 171 + 206 + 204 + 208 + 209 + (276*0.90) - 84))) ,0) + if (((102 + (113 *0.70) + 111 + (116 *0.70) + 112 + 154 +
(Continued. . . )
August 2010 Indicators
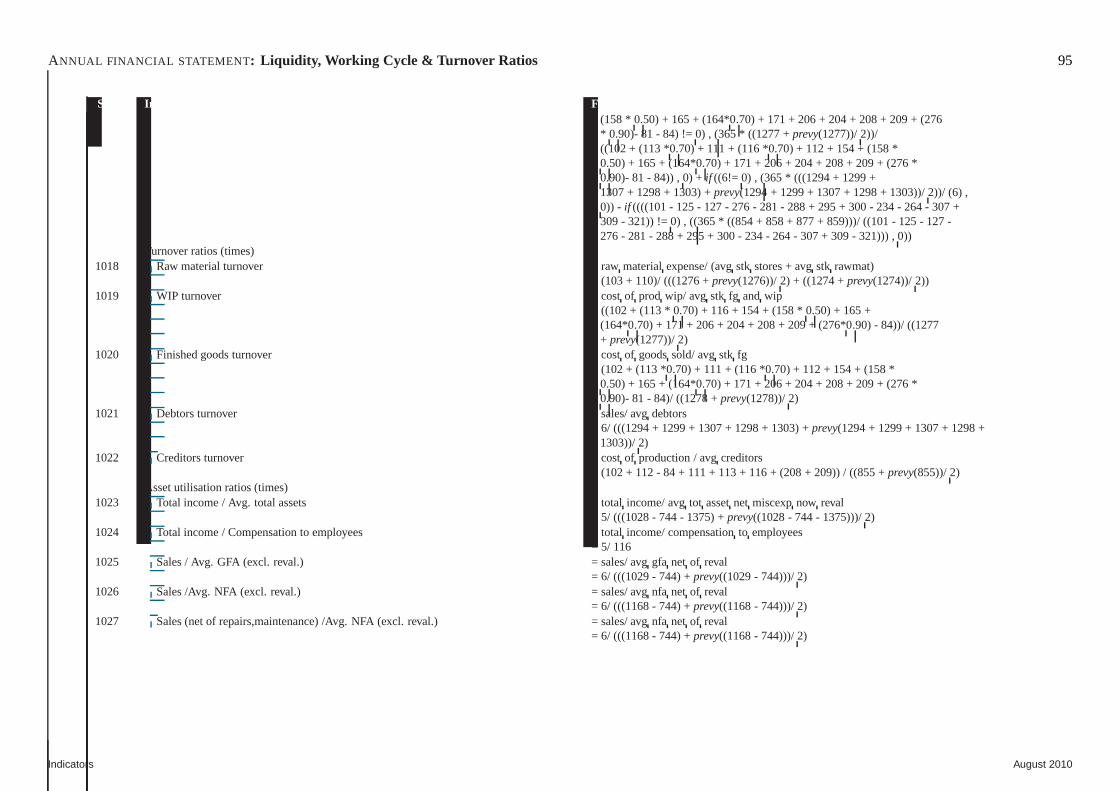
ANNUAL FINANCIAL STATEMENT : Liquidity, Working Cycle & Turnover Ratios 95
Sr.No. Indicator Fields & formula(158 * 0.50) + 165 + (164*0.70) + 171 + 206 + 204 + 208 + 209 + (276* 0.90)- 81 - 84) != 0) , (365* ((1277 +prevy(1277))/ 2))/((102 + (113 *0.70) + 111 + (116 *0.70) + 112 + 154 + (158 *0.50) + 165 + (164*0.70) + 171 + 206 + 204 + 208 + 209 + (276 *0.90)- 81 - 84)) , 0) + if ((6!= 0) , (365* (((1294 + 1299 +1307 + 1298 + 1303) +prevy(1294 + 1299 + 1307 + 1298 + 1303))/ 2))/ (6) ,0)) - if ((((101 - 125 - 127 - 276 - 281 - 288 + 295 + 300 - 234 - 264 - 307 +309 - 321)) != 0) , ((365* ((854 + 858 + 877 + 859)))/ ((101 - 125 - 127 -276 - 281 - 288 + 295 + 300 - 234 - 264 - 307 + 309 - 321))) , 0))
Turnover ratios (times)1018 Raw material turnover = raw materialexpense/ (avgstk stores + avgstk rawmat)
= (103 + 110)/ (((1276 +prevy(1276))/ 2) + ((1274 +prevy(1274))/ 2))1019 WIP turnover = costof prod wip/ avg stk fg and wip
= ((102 + (113 * 0.70) + 116 + 154 + (158 * 0.50) + 165 +(164*0.70) + 171 + 206 + 204 + 208 + 209 + (276*0.90) - 84))/ ((1277+ prevy(1277))/ 2)
1020 Finished goods turnover = costof goodssold/ avgstk fg= (102 + (113 *0.70) + 111 + (116 *0.70) + 112 + 154 + (158 *
0.50) + 165 + (164*0.70) + 171 + 206 + 204 + 208 + 209 + (276 *0.90)- 81 - 84)/ ((1278 +prevy(1278))/ 2)
1021 Debtors turnover = sales/ avgdebtors= 6/ (((1294 + 1299 + 1307 + 1298 + 1303) +prevy(1294 + 1299 + 1307 + 1298 +
1303))/ 2)1022 Creditors turnover = costof production / avgcreditors
= (102 + 112 - 84 + 111 + 113 + 116 + (208 + 209)) / ((855 +prevy(855))/ 2)Asset utilisation ratios (times)
1023 Total income / Avg. total assets = total income/ avgtot assetnet miscexpnow reval= 5/ (((1028 - 744 - 1375) +prevy((1028 - 744 - 1375)))/ 2)
1024 Total income / Compensation to employees = total income/ compensationto employees= 5/ 116
1025 Sales / Avg. GFA (excl. reval.) = sales/ avggfa net of reval= 6/ (((1029 - 744) +prevy((1029 - 744)))/ 2)
1026 Sales /Avg. NFA (excl. reval.) = sales/ avgnfa net of reval= 6/ (((1168 - 744) +prevy((1168 - 744)))/ 2)
1027 Sales (net of repairs,maintenance) /Avg. NFA (excl. reval.) = sales/ avgnfa net of reval= 6/ (((1168 - 744) +prevy((1168 - 744)))/ 2)
Indicators August 2010
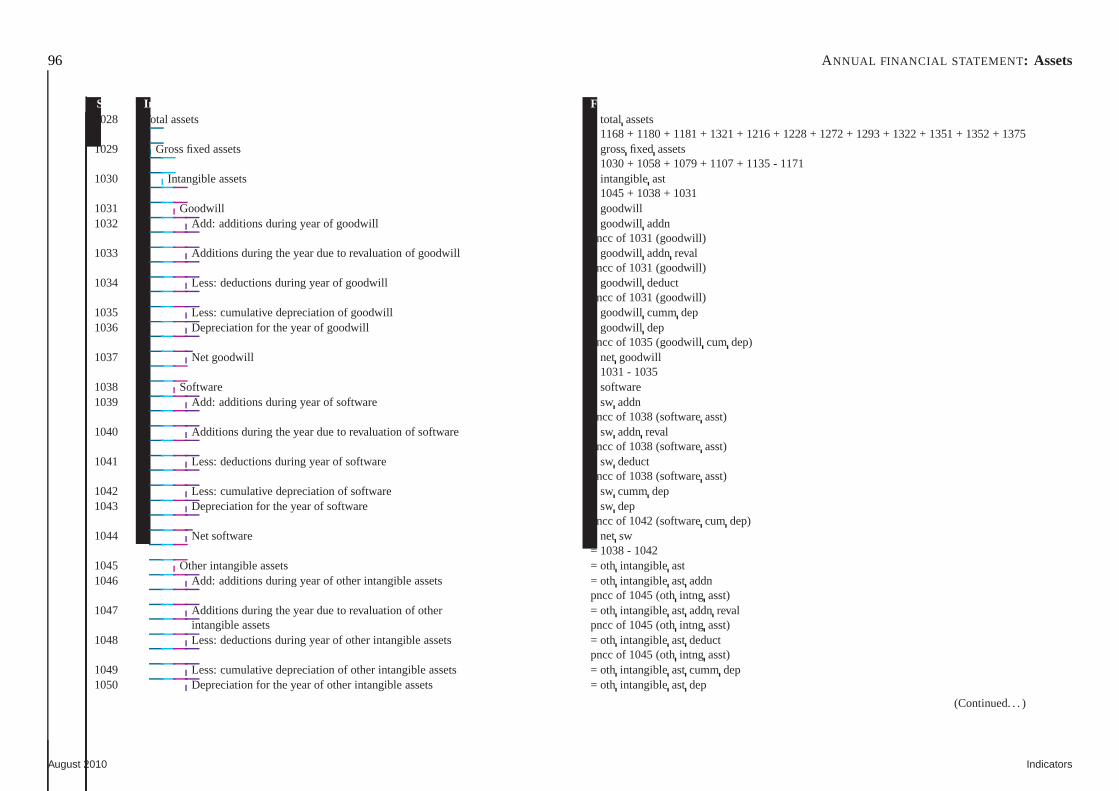
96 ANNUAL FINANCIAL STATEMENT : Assets
Sr.No. Indicator Fields & formula1028 Total assets = total assets
= 1168 + 1180 + 1181 + 1321 + 1216 + 1228 + 1272 + 1293 + 1322 + 1351 +1352 + 13751029 Gross fixed assets = grossfixed assets
= 1030 + 1058 + 1079 + 1107 + 1135 - 11711030 Intangible assets = intangibleast
= 1045 + 1038 + 10311031 Goodwill = goodwill1032 Add: additions during year of goodwill = goodwill addn
pncc of 1031 (goodwill)1033 Additions during the year due to revaluation of goodwill = goodwill addnreval
pncc of 1031 (goodwill)1034 Less: deductions during year of goodwill = goodwill deduct
pncc of 1031 (goodwill)1035 Less: cumulative depreciation of goodwill = goodwill cummdep1036 Depreciation for the year of goodwill = goodwill dep
pncc of 1035 (goodwillcum dep)1037 Net goodwill = net goodwill
= 1031 - 10351038 Software = software1039 Add: additions during year of software = sw addn
pncc of 1038 (softwareasst)1040 Additions during the year due to revaluation of software = swaddnreval
pncc of 1038 (softwareasst)1041 Less: deductions during year of software = sw deduct
pncc of 1038 (softwareasst)1042 Less: cumulative depreciation of software = sw cumm dep1043 Depreciation for the year of software = sw dep
pncc of 1042 (softwarecum dep)1044 Net software = net sw
= 1038 - 10421045 Other intangible assets = oth intangibleast1046 Add: additions during year of other intangible assets = othintangibleast addn
pncc of 1045 (othintng asst)1047 Additions during the year due to revaluation of other = othintangibleast addnreval
intangible assets pncc of 1045 (othintng asst)1048 Less: deductions during year of other intangible assets = oth intangibleast deduct
pncc of 1045 (othintng asst)1049 Less: cumulative depreciation of other intangible assets =oth intangibleast cumm dep1050 Depreciation for the year of other intangible assets = othintangibleast dep
(Continued. . . )
August 2010 Indicators
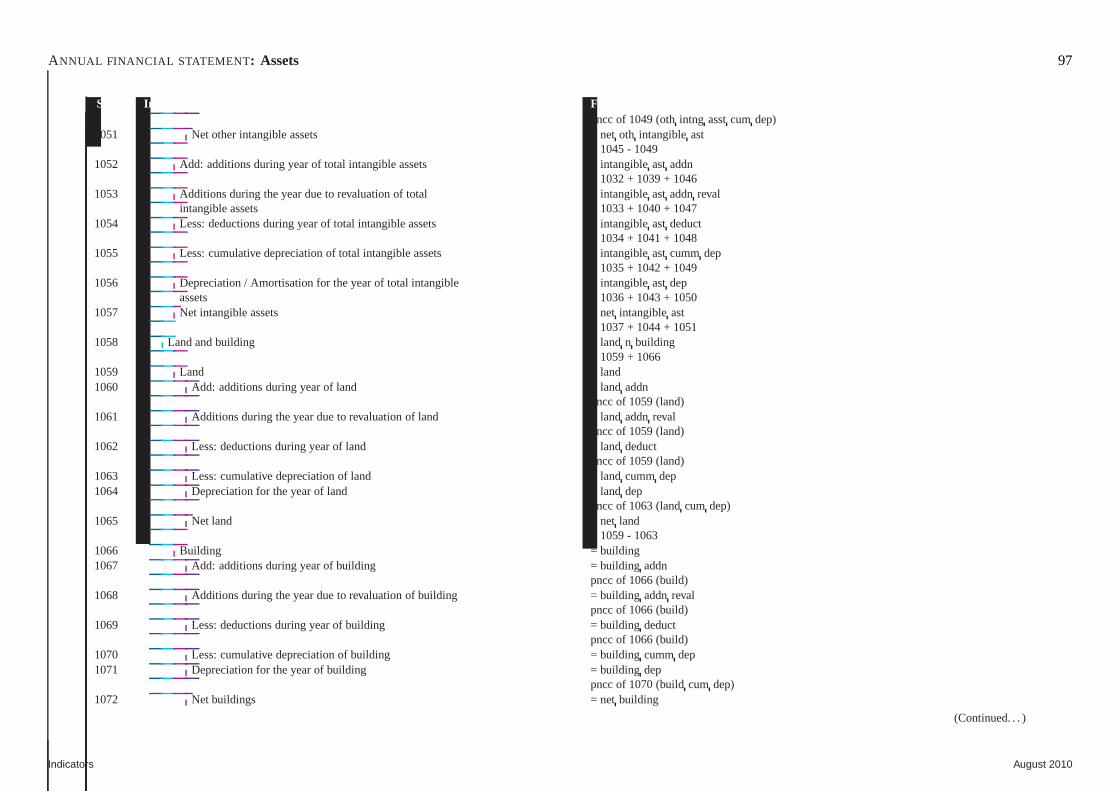
ANNUAL FINANCIAL STATEMENT : Assets 97
Sr.No. Indicator Fields & formulapncc of 1049 (othintng asstcum dep)
1051 Net other intangible assets = net oth intangibleast= 1045 - 1049
1052 Add: additions during year of total intangible assets = intangible ast addn= 1032 + 1039 + 1046
1053 Additions during the year due to revaluation of total = intangible ast addnrevalintangible assets = 1033 + 1040 + 1047
1054 Less: deductions during year of total intangible assets = intangibleast deduct= 1034 + 1041 + 1048
1055 Less: cumulative depreciation of total intangible assets =intangibleast cumm dep= 1035 + 1042 + 1049
1056 Depreciation / Amortisation for the year of total intangible = intangibleast depassets = 1036 + 1043 + 1050
1057 Net intangible assets = net intangibleast= 1037 + 1044 + 1051
1058 Land and building = land n building= 1059 + 1066
1059 Land = land1060 Add: additions during year of land = land addn
pncc of 1059 (land)1061 Additions during the year due to revaluation of land = landaddnreval
pncc of 1059 (land)1062 Less: deductions during year of land = land deduct
pncc of 1059 (land)1063 Less: cumulative depreciation of land = land cummdep1064 Depreciation for the year of land = land dep
pncc of 1063 (landcum dep)1065 Net land = net land
= 1059 - 10631066 Building = building1067 Add: additions during year of building = building addn
pncc of 1066 (build)1068 Additions during the year due to revaluation of building = building addnreval
pncc of 1066 (build)1069 Less: deductions during year of building = building deduct
pncc of 1066 (build)1070 Less: cumulative depreciation of building = building cummdep1071 Depreciation for the year of building = building dep
pncc of 1070 (buildcum dep)1072 Net buildings = net building
(Continued. . . )
Indicators August 2010
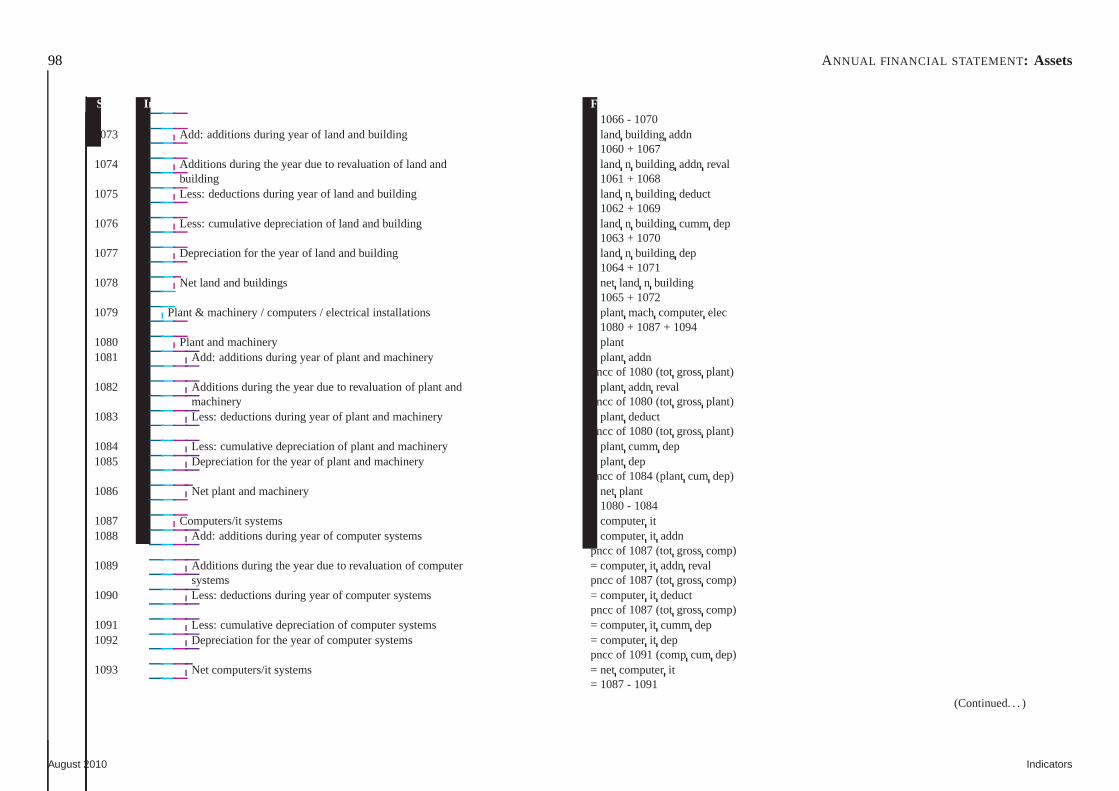
98 ANNUAL FINANCIAL STATEMENT : Assets
Sr.No. Indicator Fields & formula= 1066 - 1070
1073 Add: additions during year of land and building = landbuilding addn= 1060 + 1067
1074 Additions during the year due to revaluation of land and = land n building addnrevalbuilding = 1061 + 1068
1075 Less: deductions during year of land and building = landn building deduct= 1062 + 1069
1076 Less: cumulative depreciation of land and building = landn building cumm dep= 1063 + 1070
1077 Depreciation for the year of land and building = landn building dep= 1064 + 1071
1078 Net land and buildings = net land n building= 1065 + 1072
1079 Plant & machinery / computers / electrical installations = plant machcomputerelec= 1080 + 1087 + 1094
1080 Plant and machinery = plant1081 Add: additions during year of plant and machinery = plantaddn
pncc of 1080 (totgrossplant)1082 Additions during the year due to revaluation of plant and = plant addnreval
machinery pncc of 1080 (totgrossplant)1083 Less: deductions during year of plant and machinery = plantdeduct
pncc of 1080 (totgrossplant)1084 Less: cumulative depreciation of plant and machinery = plant cumm dep1085 Depreciation for the year of plant and machinery = plantdep
pncc of 1084 (plantcum dep)1086 Net plant and machinery = net plant
= 1080 - 10841087 Computers/it systems = computerit1088 Add: additions during year of computer systems = computerit addn
pncc of 1087 (totgrosscomp)1089 Additions during the year due to revaluation of computer = computer it addnreval
systems pncc of 1087 (totgrosscomp)1090 Less: deductions during year of computer systems = computerit deduct
pncc of 1087 (totgrosscomp)1091 Less: cumulative depreciation of computer systems = computer it cummdep1092 Depreciation for the year of computer systems = computerit dep
pncc of 1091 (compcum dep)1093 Net computers/it systems = net computerit
= 1087 - 1091
(Continued. . . )
August 2010 Indicators
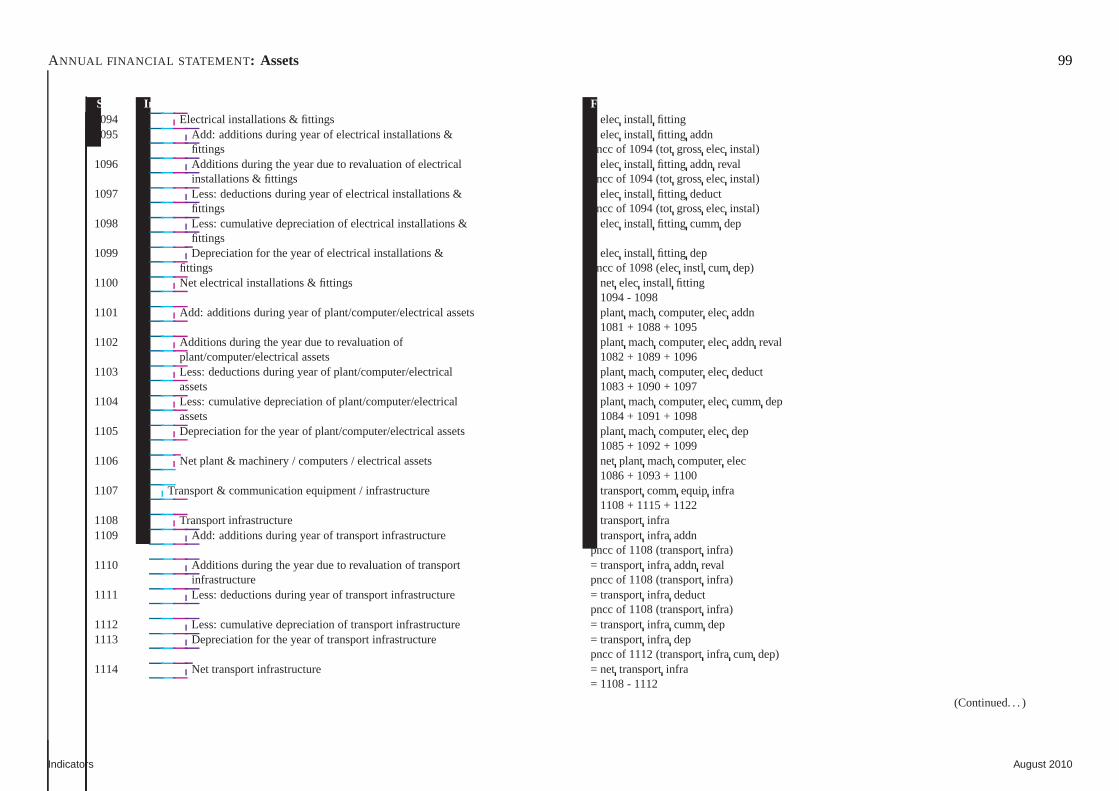
ANNUAL FINANCIAL STATEMENT : Assets 99
Sr.No. Indicator Fields & formula1094 Electrical installations & fittings = elec install fitting1095 Add: additions during year of electrical installations & = elec install fitting addn
fittings pncc of 1094 (totgrosselec instal)1096 Additions during the year due to revaluation of electrical =elec install fitting addnreval
installations & fittings pncc of 1094 (totgrosselec instal)1097 Less: deductions during year of electrical installations & = elec install fitting deduct
fittings pncc of 1094 (totgrosselec instal)1098 Less: cumulative depreciation of electrical installations & = elec install fitting cumm dep
fittings1099 Depreciation for the year of electrical installations & = elec install fitting dep
fittings pncc of 1098 (elecinstl cum dep)1100 Net electrical installations & fittings = net elec install fitting
= 1094 - 10981101 Add: additions during year of plant/computer/electrical assets = plantmachcomputerelec addn
= 1081 + 1088 + 10951102 Additions during the year due to revaluation of = plantmachcomputerelec addnreval
plant/computer/electrical assets = 1082 + 1089 + 10961103 Less: deductions during year of plant/computer/electrical = plant machcomputerelec deduct
assets = 1083 + 1090 + 10971104 Less: cumulative depreciation of plant/computer/electrical = plantmachcomputerelec cummdep
assets = 1084 + 1091 + 10981105 Depreciation for the year of plant/computer/electrical assets = plantmachcomputerelec dep
= 1085 + 1092 + 10991106 Net plant & machinery / computers / electrical assets = netplant machcomputerelec
= 1086 + 1093 + 11001107 Transport & communication equipment / infrastructure = transportcommequip infra
= 1108 + 1115 + 11221108 Transport infrastructure = transportinfra1109 Add: additions during year of transport infrastructure = transportinfra addn
pncc of 1108 (transportinfra)1110 Additions during the year due to revaluation of transport = transportinfra addnreval
infrastructure pncc of 1108 (transportinfra)1111 Less: deductions during year of transport infrastructure =transportinfra deduct
pncc of 1108 (transportinfra)1112 Less: cumulative depreciation of transport infrastructure = transportinfra cummdep1113 Depreciation for the year of transport infrastructure = transport infra dep
pncc of 1112 (transportinfra cum dep)1114 Net transport infrastructure = net transportinfra
= 1108 - 1112
(Continued. . . )
Indicators August 2010
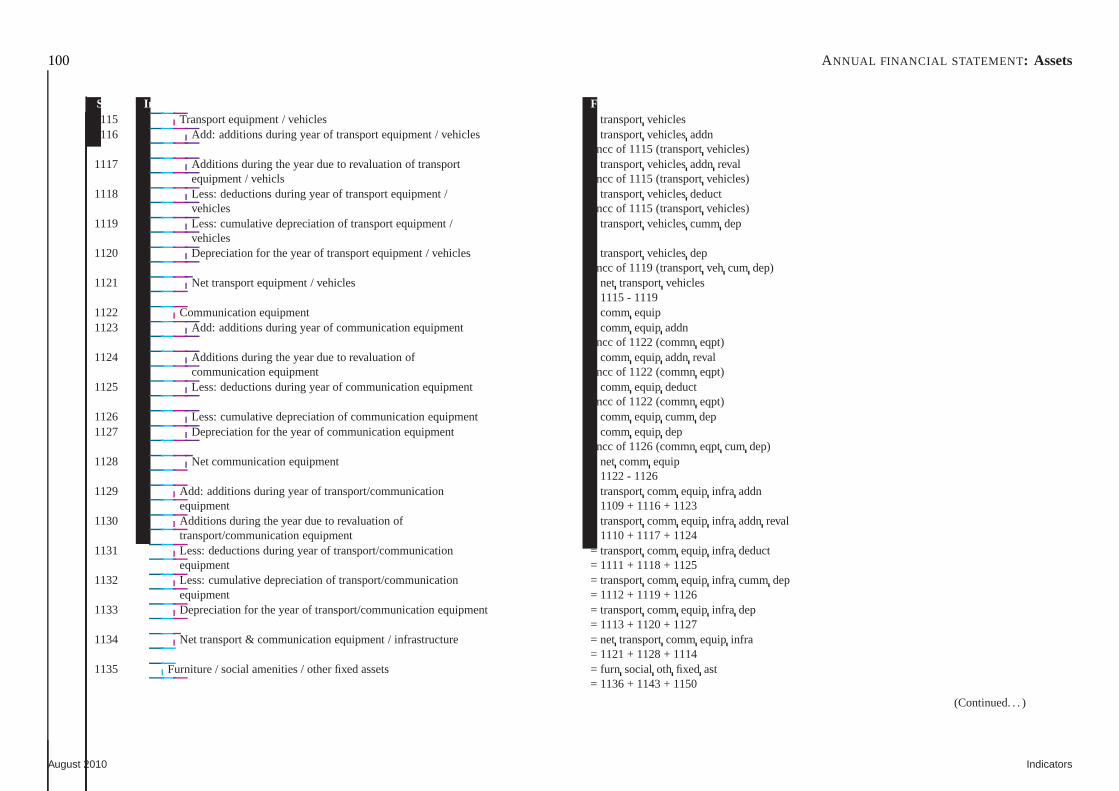
100 ANNUAL FINANCIAL STATEMENT : Assets
Sr.No. Indicator Fields & formula1115 Transport equipment / vehicles = transportvehicles1116 Add: additions during year of transport equipment / vehicles = transportvehiclesaddn
pncc of 1115 (transportvehicles)1117 Additions during the year due to revaluation of transport = transportvehiclesaddnreval
equipment / vehicls pncc of 1115 (transportvehicles)1118 Less: deductions during year of transport equipment / = transport vehiclesdeduct
vehicles pncc of 1115 (transportvehicles)1119 Less: cumulative depreciation of transport equipment / = transportvehiclescumm dep
vehicles1120 Depreciation for the year of transport equipment / vehicles = transportvehiclesdep
pncc of 1119 (transportveh cum dep)1121 Net transport equipment / vehicles = net transportvehicles
= 1115 - 11191122 Communication equipment = commequip1123 Add: additions during year of communication equipment = comm equip addn
pncc of 1122 (commneqpt)1124 Additions during the year due to revaluation of = commequip addnreval
communication equipment pncc of 1122 (commneqpt)1125 Less: deductions during year of communication equipment = comm equip deduct
pncc of 1122 (commneqpt)1126 Less: cumulative depreciation of communication equipment = commequip cummdep1127 Depreciation for the year of communication equipment = commequip dep
pncc of 1126 (commneqpt cum dep)1128 Net communication equipment = net comm equip
= 1122 - 11261129 Add: additions during year of transport/communication = transportcommequip infra addn
equipment = 1109 + 1116 + 11231130 Additions during the year due to revaluation of = transportcommequip infra addnreval
transport/communication equipment = 1110 + 1117 + 11241131 Less: deductions during year of transport/communication =transportcommequip infra deduct
equipment = 1111 + 1118 + 11251132 Less: cumulative depreciation of transport/communication = transportcommequip infra cumm dep
equipment = 1112 + 1119 + 11261133 Depreciation for the year of transport/communication equipment = transportcommequip infra dep
= 1113 + 1120 + 11271134 Net transport & communication equipment / infrastructure =net transportcomm equip infra
= 1121 + 1128 + 11141135 Furniture / social amenities / other fixed assets = furn social oth fixed ast
= 1136 + 1143 + 1150
(Continued. . . )
August 2010 Indicators
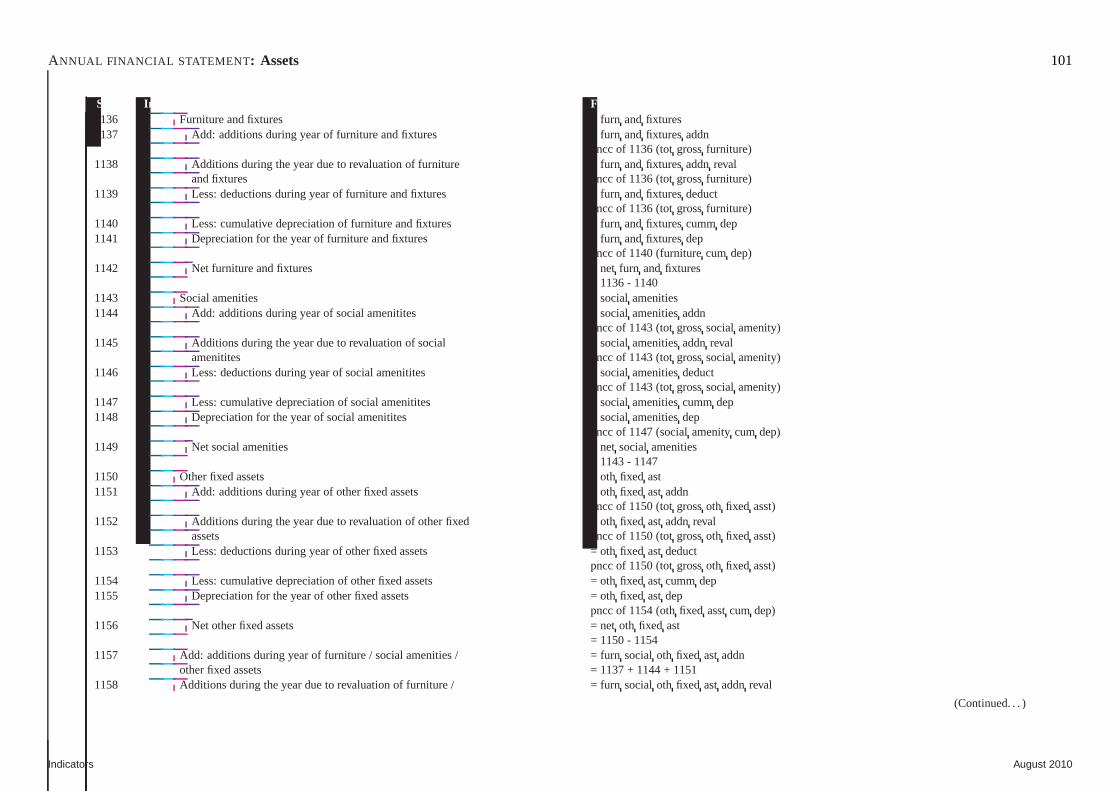
ANNUAL FINANCIAL STATEMENT : Assets 101
Sr.No. Indicator Fields & formula1136 Furniture and fixtures = furn andfixtures1137 Add: additions during year of furniture and fixtures = furnandfixturesaddn
pncc of 1136 (totgrossfurniture)1138 Additions during the year due to revaluation of furniture = furn andfixturesaddnreval
and fixtures pncc of 1136 (totgrossfurniture)1139 Less: deductions during year of furniture and fixtures = furnandfixturesdeduct
pncc of 1136 (totgrossfurniture)1140 Less: cumulative depreciation of furniture and fixtures = furn andfixturescumm dep1141 Depreciation for the year of furniture and fixtures = furnandfixturesdep
pncc of 1140 (furniturecum dep)1142 Net furniture and fixtures = net furn and fixtures
= 1136 - 11401143 Social amenities = socialamenities1144 Add: additions during year of social amenitites = socialamenitiesaddn
pncc of 1143 (totgrosssocial amenity)1145 Additions during the year due to revaluation of social = social amenitiesaddnreval
amenitites pncc of 1143 (totgrosssocial amenity)1146 Less: deductions during year of social amenitites = socialamenitiesdeduct
pncc of 1143 (totgrosssocial amenity)1147 Less: cumulative depreciation of social amenitites = social amenitiescummdep1148 Depreciation for the year of social amenitites = socialamenitiesdep
pncc of 1147 (socialamenitycum dep)1149 Net social amenities = net social amenities
= 1143 - 11471150 Other fixed assets = oth fixed ast1151 Add: additions during year of other fixed assets = othfixed ast addn
pncc of 1150 (totgrossoth fixed asst)1152 Additions during the year due to revaluation of other fixed = oth fixed ast addnreval
assets pncc of 1150 (totgrossoth fixed asst)1153 Less: deductions during year of other fixed assets = othfixed ast deduct
pncc of 1150 (totgrossoth fixed asst)1154 Less: cumulative depreciation of other fixed assets = othfixed ast cummdep1155 Depreciation for the year of other fixed assets = othfixed ast dep
pncc of 1154 (othfixed asstcum dep)1156 Net other fixed assets = net oth fixed ast
= 1150 - 11541157 Add: additions during year of furniture / social amenities / = furn social oth fixed ast addn
other fixed assets = 1137 + 1144 + 11511158 Additions during the year due to revaluation of furniture / =furn social oth fixed ast addnreval
(Continued. . . )
Indicators August 2010
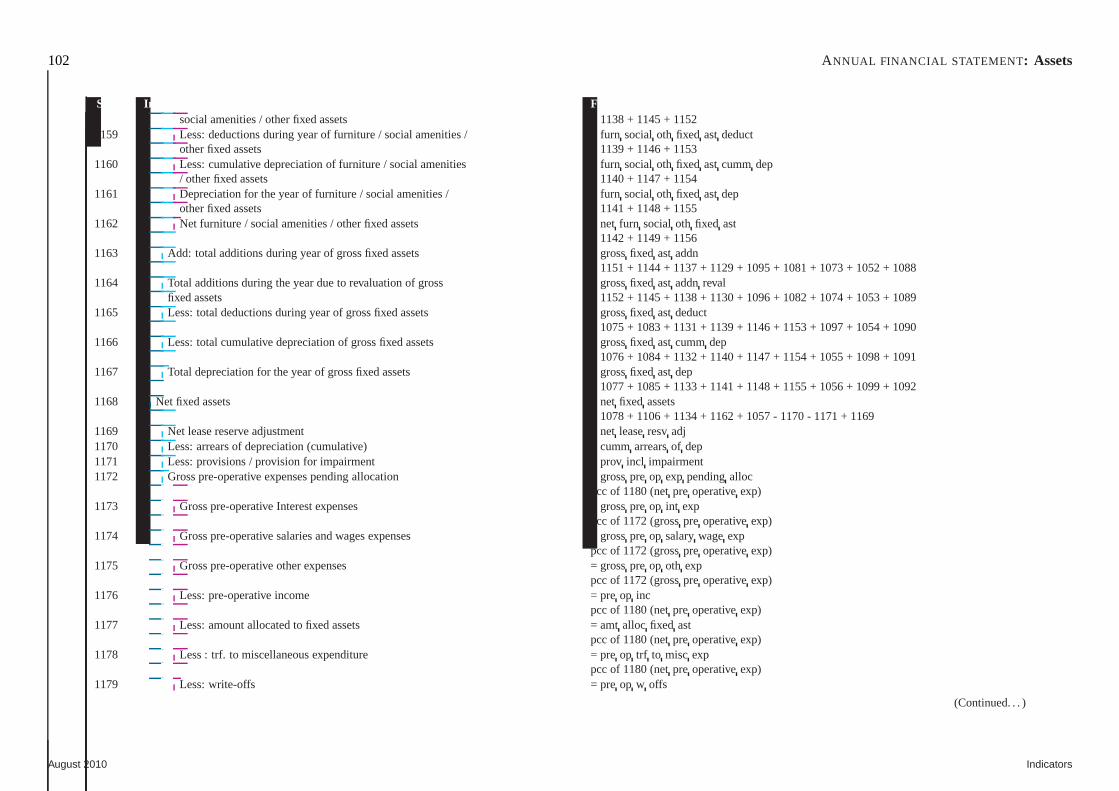
102 ANNUAL FINANCIAL STATEMENT : Assets
Sr.No. Indicator Fields & formulasocial amenities / other fixed assets = 1138 + 1145 + 1152
1159 Less: deductions during year of furniture / social amenities / = furn social oth fixed ast deductother fixed assets = 1139 + 1146 + 1153
1160 Less: cumulative depreciation of furniture / social amenities = furnsocial oth fixed ast cumm dep/ other fixed assets = 1140 + 1147 + 1154
1161 Depreciation for the year of furniture / social amenities / =furn social oth fixed ast depother fixed assets = 1141 + 1148 + 1155
1162 Net furniture / social amenities / other fixed assets = netfurn social oth fixed ast= 1142 + 1149 + 1156
1163 Add: total additions during year of gross fixed assets = grossfixed ast addn= 1151 + 1144 + 1137 + 1129 + 1095 + 1081 + 1073 + 1052 + 1088
1164 Total additions during the year due to revaluation of gross =grossfixed ast addnrevalfixed assets = 1152 + 1145 + 1138 + 1130 + 1096 + 1082 + 1074 + 1053 + 1089
1165 Less: total deductions during year of gross fixed assets = gross fixed ast deduct= 1075 + 1083 + 1131 + 1139 + 1146 + 1153 + 1097 + 1054 + 1090
1166 Less: total cumulative depreciation of gross fixed assets = grossfixed ast cumm dep= 1076 + 1084 + 1132 + 1140 + 1147 + 1154 + 1055 + 1098 + 1091
1167 Total depreciation for the year of gross fixed assets = grossfixed ast dep= 1077 + 1085 + 1133 + 1141 + 1148 + 1155 + 1056 + 1099 + 1092
1168 Net fixed assets = net fixed assets= 1078 + 1106 + 1134 + 1162 + 1057 - 1170 - 1171 + 1169
1169 Net lease reserve adjustment = net leaseresvadj1170 Less: arrears of depreciation (cumulative) = cummarrearsof dep1171 Less: provisions / provision for impairment = prov incl impairment1172 Gross pre-operative expenses pending allocation = grosspre op exp pendingalloc
pcc of 1180 (netpre operativeexp)1173 Gross pre-operative Interest expenses = grosspre op int exp
pcc of 1172 (grosspre operativeexp)1174 Gross pre-operative salaries and wages expenses = grosspre op salarywageexp
pcc of 1172 (grosspre operativeexp)1175 Gross pre-operative other expenses = grosspre op oth exp
pcc of 1172 (grosspre operativeexp)1176 Less: pre-operative income = pre op inc
pcc of 1180 (netpre operativeexp)1177 Less: amount allocated to fixed assets = amt alloc fixed ast
pcc of 1180 (netpre operativeexp)1178 Less : trf. to miscellaneous expenditure = pre op trf to misc exp
pcc of 1180 (netpre operativeexp)1179 Less: write-offs = pre op w offs
(Continued. . . )
August 2010 Indicators
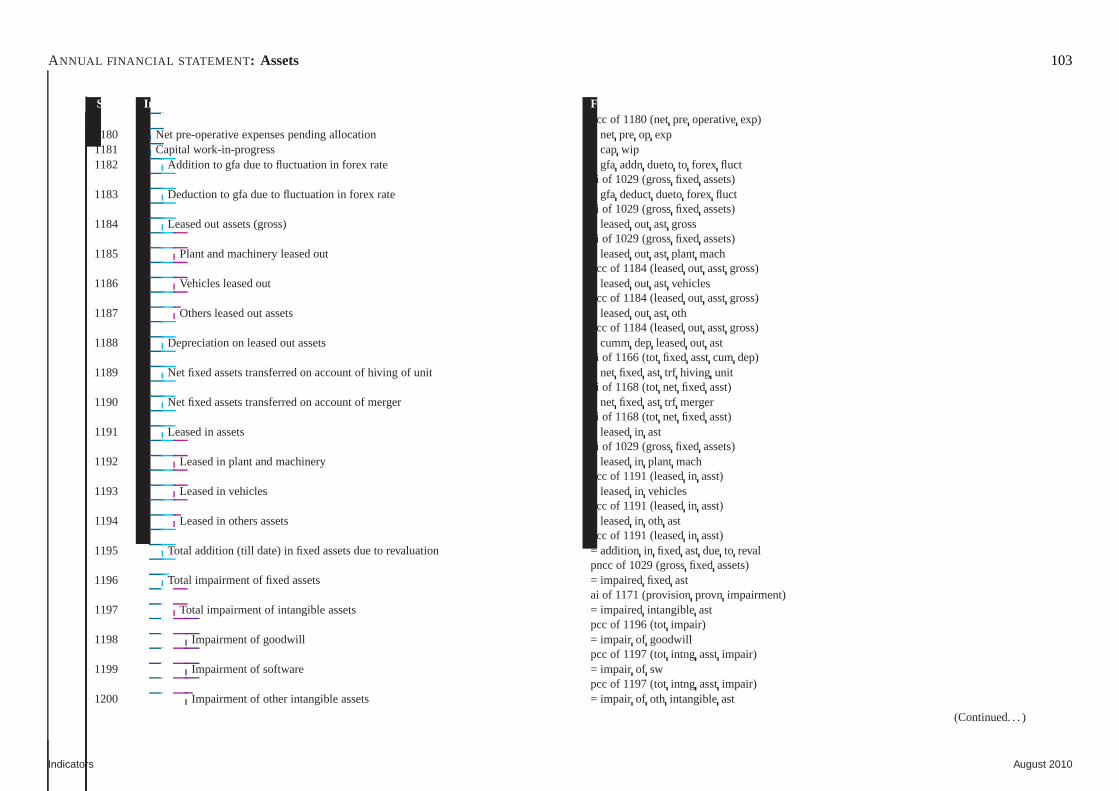
ANNUAL FINANCIAL STATEMENT : Assets 103
Sr.No. Indicator Fields & formulapcc of 1180 (netpre operativeexp)
1180 Net pre-operative expenses pending allocation = net pre op exp1181 Capital work-in-progress = capwip1182 Addition to gfa due to fluctuation in forex rate = gfa addnduetoto forex fluct
ai of 1029 (grossfixed assets)1183 Deduction to gfa due to fluctuation in forex rate = gfa deductduetoforex fluct
ai of 1029 (grossfixed assets)1184 Leased out assets (gross) = leasedout ast gross
ai of 1029 (grossfixed assets)1185 Plant and machinery leased out = leasedout ast plant mach
pcc of 1184 (leasedout asstgross)1186 Vehicles leased out = leasedout ast vehicles
pcc of 1184 (leasedout asstgross)1187 Others leased out assets = leasedout ast oth
pcc of 1184 (leasedout asstgross)1188 Depreciation on leased out assets = cummdep leasedout ast
ai of 1166 (totfixed asstcum dep)1189 Net fixed assets transferred on account of hiving of unit = netfixed ast trf hiving unit
ai of 1168 (totnet fixed asst)1190 Net fixed assets transferred on account of merger = netfixed ast trf merger
ai of 1168 (totnet fixed asst)1191 Leased in assets = leasedin ast
ai of 1029 (grossfixed assets)1192 Leased in plant and machinery = leasedin plant mach
pcc of 1191 (leasedin asst)1193 Leased in vehicles = leasedin vehicles
pcc of 1191 (leasedin asst)1194 Leased in others assets = leasedin oth ast
pcc of 1191 (leasedin asst)1195 Total addition (till date) in fixed assets due to revaluation = addition in fixed ast due to reval
pncc of 1029 (grossfixed assets)1196 Total impairment of fixed assets = impairedfixed ast
ai of 1171 (provisionprovn impairment)1197 Total impairment of intangible assets = impairedintangibleast
pcc of 1196 (totimpair)1198 Impairment of goodwill = impair of goodwill
pcc of 1197 (totintng asstimpair)1199 Impairment of software = impair of sw
pcc of 1197 (totintng asstimpair)1200 Impairment of other intangible assets = impair of oth intangibleast
(Continued. . . )
Indicators August 2010
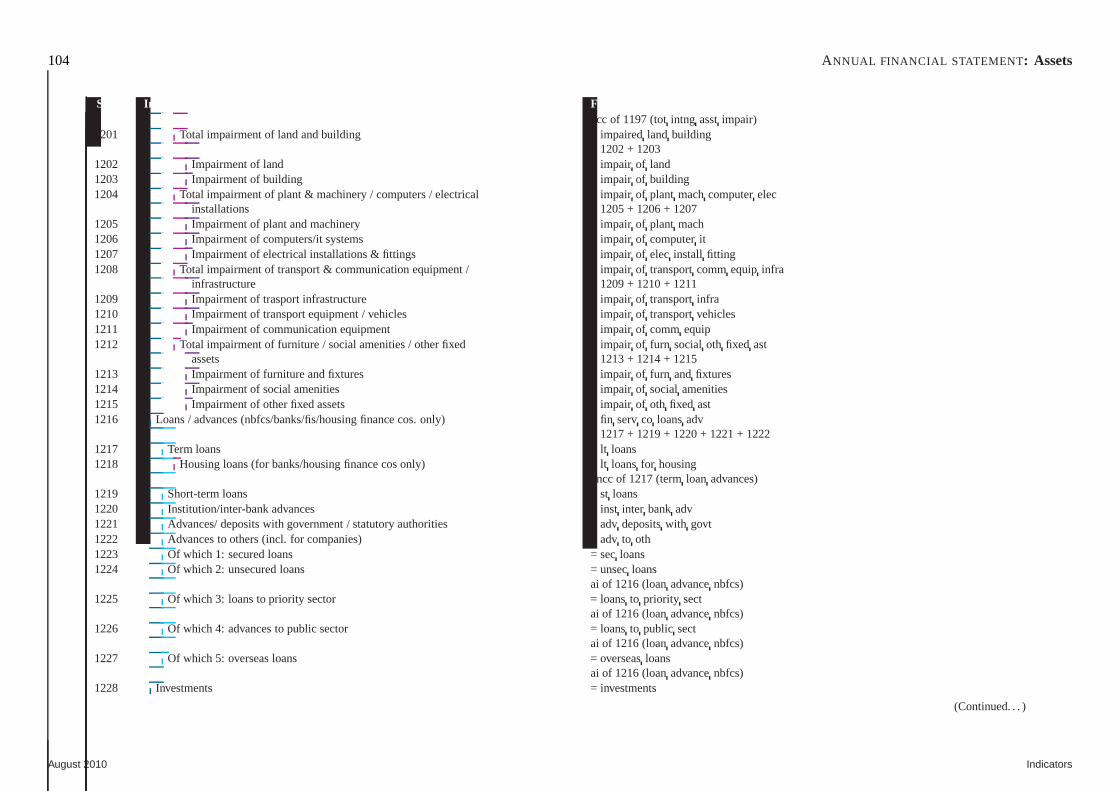
104 ANNUAL FINANCIAL STATEMENT : Assets
Sr.No. Indicator Fields & formulapcc of 1197 (totintng asstimpair)
1201 Total impairment of land and building = impairedland building= 1202 + 1203
1202 Impairment of land = impair of land1203 Impairment of building = impair of building1204 Total impairment of plant & machinery / computers / electrical = impair of plant machcomputerelec
installations = 1205 + 1206 + 12071205 Impairment of plant and machinery = impair of plant mach1206 Impairment of computers/it systems = impair of computerit1207 Impairment of electrical installations & fittings = impairof elec install fitting1208 Total impairment of transport & communication equipment / =impair of transportcommequip infra
infrastructure = 1209 + 1210 + 12111209 Impairment of trasport infrastructure = impair of transportinfra1210 Impairment of transport equipment / vehicles = impairof transportvehicles1211 Impairment of communication equipment = impair of comm equip1212 Total impairment of furniture / social amenities / other fixed = impair of furn social oth fixed ast
assets = 1213 + 1214 + 12151213 Impairment of furniture and fixtures = impair of furn andfixtures1214 Impairment of social amenities = impair of social amenities1215 Impairment of other fixed assets = impair of oth fixed ast1216 Loans / advances (nbfcs/banks/fis/housing finance cos. only) = fin servco loansadv
= 1217 + 1219 + 1220 + 1221 + 12221217 Term loans = lt loans1218 Housing loans (for banks/housing finance cos only) = ltloansfor housing
pncc of 1217 (termloan advances)1219 Short-term loans = st loans1220 Institution/inter-bank advances = inst inter bank adv1221 Advances/ deposits with government / statutory authorities = advdepositswith govt1222 Advances to others (incl. for companies) = adv to oth1223 Of which 1: secured loans = secloans1224 Of which 2: unsecured loans = unsecloans
ai of 1216 (loanadvancenbfcs)1225 Of which 3: loans to priority sector = loansto priority sect
ai of 1216 (loanadvancenbfcs)1226 Of which 4: advances to public sector = loansto public sect
ai of 1216 (loanadvancenbfcs)1227 Of which 5: overseas loans = overseasloans
ai of 1216 (loanadvancenbfcs)1228 Investments = investments
(Continued. . . )
August 2010 Indicators
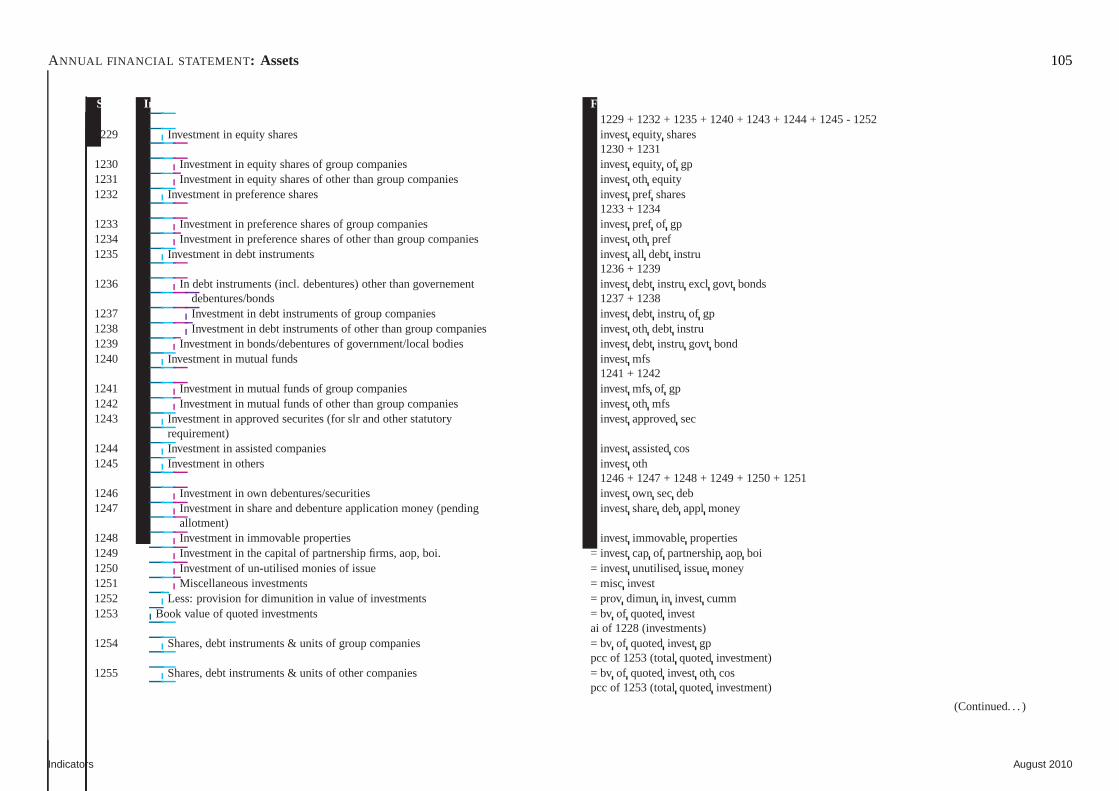
ANNUAL FINANCIAL STATEMENT : Assets 105
Sr.No. Indicator Fields & formula= 1229 + 1232 + 1235 + 1240 + 1243 + 1244 + 1245 - 1252
1229 Investment in equity shares = investequity shares= 1230 + 1231
1230 Investment in equity shares of group companies = investequity of gp1231 Investment in equity shares of other than group companies = investoth equity1232 Investment in preference shares = investpref shares
= 1233 + 12341233 Investment in preference shares of group companies = investpref of gp1234 Investment in preference shares of other than group companies = investoth pref1235 Investment in debt instruments = investall debt instru
= 1236 + 12391236 In debt instruments (incl. debentures) other than governement = investdebt instru excl govt bonds
debentures/bonds = 1237 + 12381237 Investment in debt instruments of group companies = investdebt instru of gp1238 Investment in debt instruments of other than group companies = investoth debt instru1239 Investment in bonds/debentures of government/local bodies = investdebt instru govt bond1240 Investment in mutual funds = investmfs
= 1241 + 12421241 Investment in mutual funds of group companies = investmfs of gp1242 Investment in mutual funds of other than group companies = invest oth mfs1243 Investment in approved securites (for slr and other statutory = investapprovedsec
requirement)1244 Investment in assisted companies = investassistedcos1245 Investment in others = investoth
= 1246 + 1247 + 1248 + 1249 + 1250 + 12511246 Investment in own debentures/securities = investown secdeb1247 Investment in share and debenture application money (pending = investsharedeb appl money
allotment)1248 Investment in immovable properties = invest immovableproperties1249 Investment in the capital of partnership firms, aop, boi. = invest cap of partnershipaop boi1250 Investment of un-utilised monies of issue = investunutilisedissuemoney1251 Miscellaneous investments = misc invest1252 Less: provision for dimunition in value of investments = prov dimun in invest cumm1253 Book value of quoted investments = bv of quotedinvest
ai of 1228 (investments)1254 Shares, debt instruments & units of group companies = bvof quotedinvest gp
pcc of 1253 (totalquotedinvestment)1255 Shares, debt instruments & units of other companies = bvof quotedinvest oth cos
pcc of 1253 (totalquotedinvestment)
(Continued. . . )
Indicators August 2010
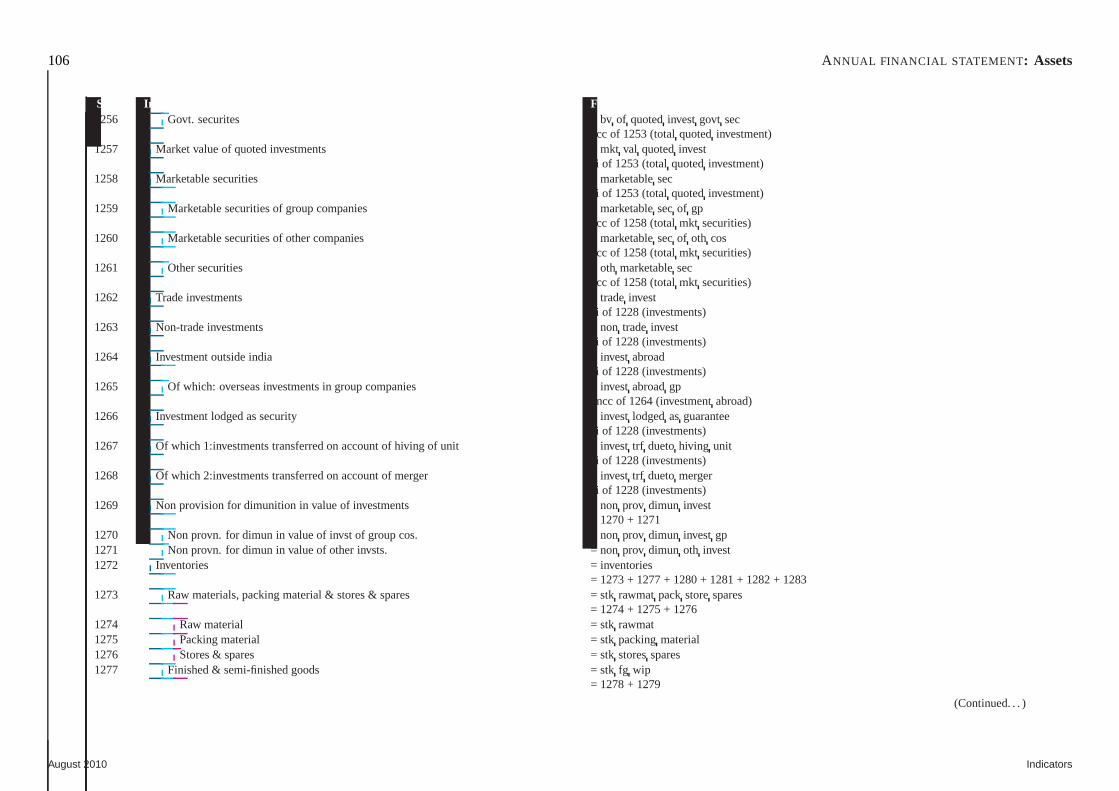
106 ANNUAL FINANCIAL STATEMENT : Assets
Sr.No. Indicator Fields & formula1256 Govt. securites = bv of quotedinvest govt sec
pcc of 1253 (totalquotedinvestment)1257 Market value of quoted investments = mkt val quotedinvest
ai of 1253 (totalquotedinvestment)1258 Marketable securities = marketablesec
ai of 1253 (totalquotedinvestment)1259 Marketable securities of group companies = marketablesecof gp
pcc of 1258 (totalmkt securities)1260 Marketable securities of other companies = marketablesecof oth cos
pcc of 1258 (totalmkt securities)1261 Other securities = oth marketablesec
pcc of 1258 (totalmkt securities)1262 Trade investments = tradeinvest
ai of 1228 (investments)1263 Non-trade investments = non tradeinvest
ai of 1228 (investments)1264 Investment outside india = investabroad
ai of 1228 (investments)1265 Of which: overseas investments in group companies = investabroadgp
pncc of 1264 (investmentabroad)1266 Investment lodged as security = invest lodgedasguarantee
ai of 1228 (investments)1267 Of which 1:investments transferred on account of hiving of unit = invest trf duetohiving unit
ai of 1228 (investments)1268 Of which 2:investments transferred on account of merger = invest trf duetomerger
ai of 1228 (investments)1269 Non provision for dimunition in value of investments = nonprov dimun invest
= 1270 + 12711270 Non provn. for dimun in value of invst of group cos. = nonprov dimun invest gp1271 Non provn. for dimun in value of other invsts. = non prov dimun oth invest1272 Inventories = inventories
= 1273 + 1277 + 1280 + 1281 + 1282 + 12831273 Raw materials, packing material & stores & spares = stkrawmatpack storespares
= 1274 + 1275 + 12761274 Raw material = stk rawmat1275 Packing material = stk packingmaterial1276 Stores & spares = stk storesspares1277 Finished & semi-finished goods = stk fg wip
= 1278 + 1279
(Continued. . . )
August 2010 Indicators
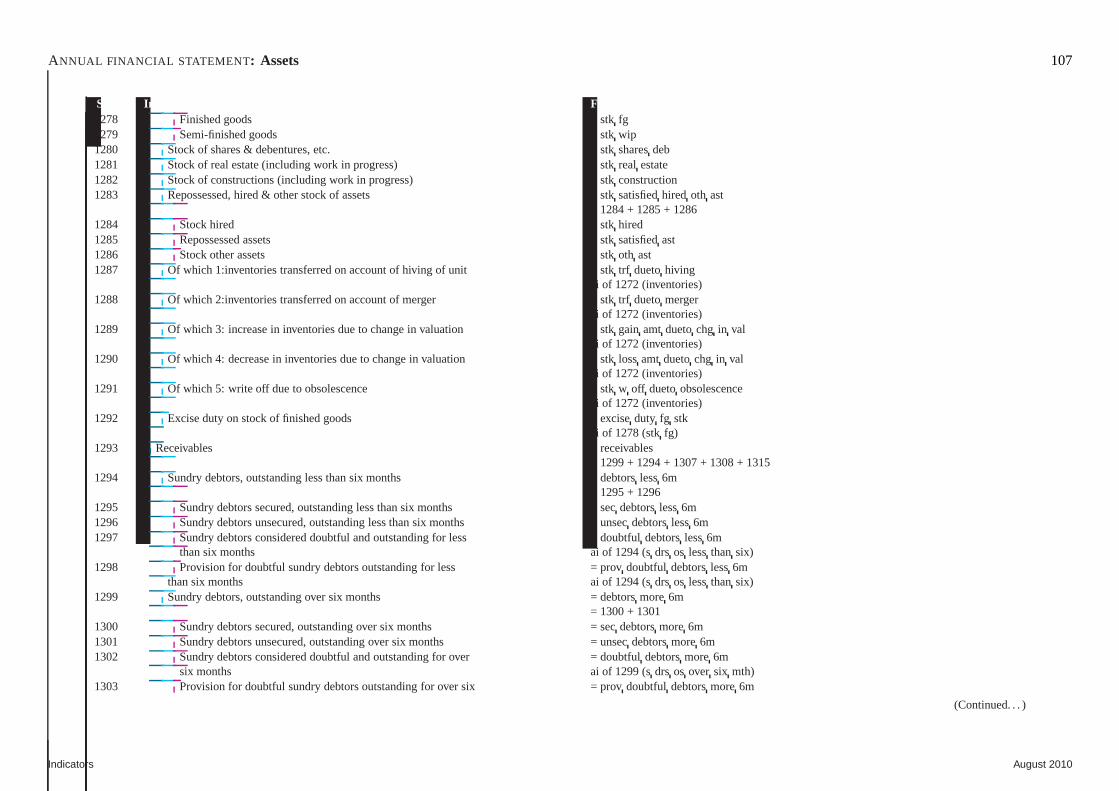
ANNUAL FINANCIAL STATEMENT : Assets 107
Sr.No. Indicator Fields & formula1278 Finished goods = stk fg1279 Semi-finished goods = stk wip1280 Stock of shares & debentures, etc. = stk sharesdeb1281 Stock of real estate (including work in progress) = stkreal estate1282 Stock of constructions (including work in progress) = stkconstruction1283 Repossessed, hired & other stock of assets = stk satisfiedhired oth ast
= 1284 + 1285 + 12861284 Stock hired = stk hired1285 Repossessed assets = stk satisfiedast1286 Stock other assets = stk oth ast1287 Of which 1:inventories transferred on account of hiving of unit = stk trf duetohiving
ai of 1272 (inventories)1288 Of which 2:inventories transferred on account of merger = stk trf duetomerger
ai of 1272 (inventories)1289 Of which 3: increase in inventories due to change in valuation = stk gain amt duetochg in val
ai of 1272 (inventories)1290 Of which 4: decrease in inventories due to change in valuation = stk lossamt duetochg in val
ai of 1272 (inventories)1291 Of which 5: write off due to obsolescence = stk w off duetoobsolescence
ai of 1272 (inventories)1292 Excise duty on stock of finished goods = exciseduty fg stk
ai of 1278 (stkfg)1293 Receivables = receivables
= 1299 + 1294 + 1307 + 1308 + 13151294 Sundry debtors, outstanding less than six months = debtorsless6m
= 1295 + 12961295 Sundry debtors secured, outstanding less than six months = sec debtorsless6m1296 Sundry debtors unsecured, outstanding less than six months = unsecdebtorsless6m1297 Sundry debtors considered doubtful and outstanding for less = doubtfuldebtorsless6m
than six months ai of 1294 (sdrs os lessthan six)1298 Provision for doubtful sundry debtors outstanding for less = prov doubtful debtorsless6m
than six months ai of 1294 (sdrs os lessthan six)1299 Sundry debtors, outstanding over six months = debtorsmore6m
= 1300 + 13011300 Sundry debtors secured, outstanding over six months = secdebtorsmore 6m1301 Sundry debtors unsecured, outstanding over six months = unsec debtorsmore6m1302 Sundry debtors considered doubtful and outstanding for over = doubtful debtorsmore 6m
six months ai of 1299 (sdrs os over six mth)1303 Provision for doubtful sundry debtors outstanding for oversix = prov doubtful debtorsmore6m
(Continued. . . )
Indicators August 2010
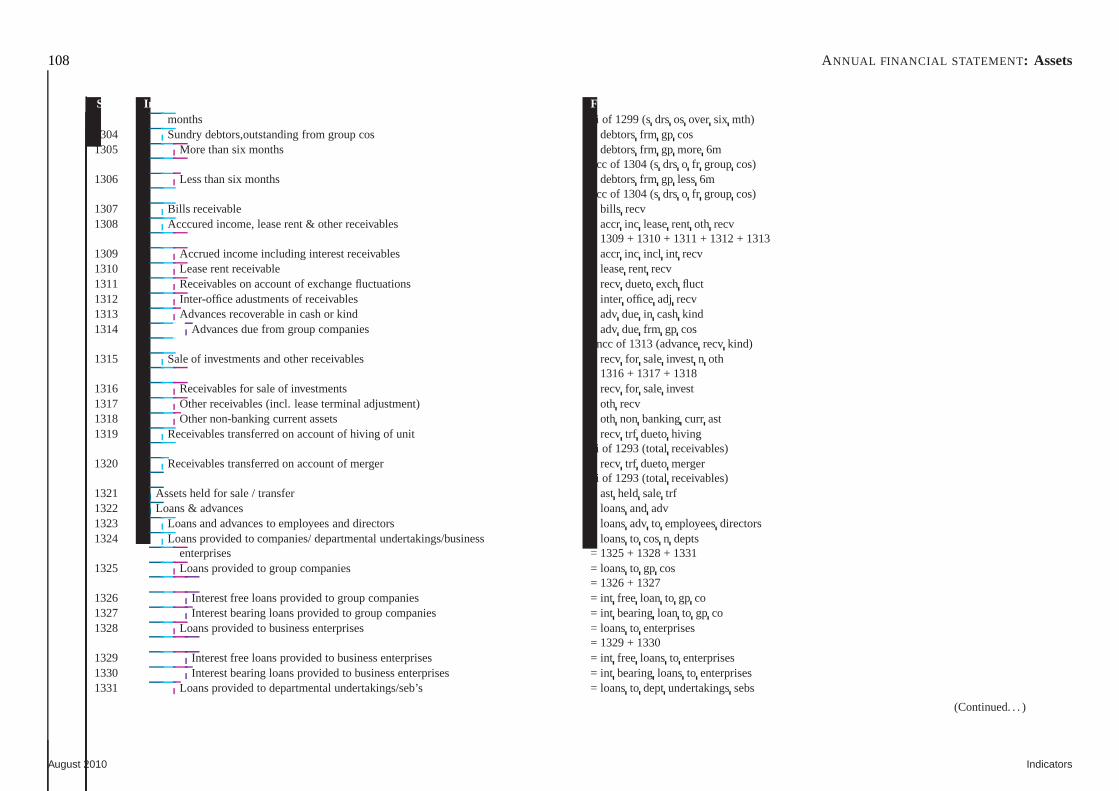
108 ANNUAL FINANCIAL STATEMENT : Assets
Sr.No. Indicator Fields & formulamonths ai of 1299 (sdrs os over six mth)
1304 Sundry debtors,outstanding from group cos = debtorsfrm gp cos1305 More than six months = debtorsfrm gp more 6m
pcc of 1304 (sdrs o fr group cos)1306 Less than six months = debtorsfrm gp less6m
pcc of 1304 (sdrs o fr group cos)1307 Bills receivable = bills recv1308 Acccured income, lease rent & other receivables = accrinc leaserent oth recv
= 1309 + 1310 + 1311 + 1312 + 13131309 Accrued income including interest receivables = accrinc incl int recv1310 Lease rent receivable = leaserent recv1311 Receivables on account of exchange fluctuations = recvduetoexchfluct1312 Inter-office adustments of receivables = inter office adj recv1313 Advances recoverable in cash or kind = adv due in cashkind1314 Advances due from group companies = adv due frm gp cos
pncc of 1313 (advancerecv kind)1315 Sale of investments and other receivables = recv for saleinvest n oth
= 1316 + 1317 + 13181316 Receivables for sale of investments = recv for saleinvest1317 Other receivables (incl. lease terminal adjustment) = othrecv1318 Other non-banking current assets = oth non bankingcurr ast1319 Receivables transferred on account of hiving of unit = recvtrf duetohiving
ai of 1293 (totalreceivables)1320 Receivables transferred on account of merger = recv trf duetomerger
ai of 1293 (totalreceivables)1321 Assets held for sale / transfer = astheld saletrf1322 Loans & advances = loansand adv1323 Loans and advances to employees and directors = loansadv to employeesdirectors1324 Loans provided to companies/ departmental undertakings/business = loansto cosn depts
enterprises = 1325 + 1328 + 13311325 Loans provided to group companies = loansto gp cos
= 1326 + 13271326 Interest free loans provided to group companies = intfree loan to gp co1327 Interest bearing loans provided to group companies = intbearingloan to gp co1328 Loans provided to business enterprises = loansto enterprises
= 1329 + 13301329 Interest free loans provided to business enterprises = intfree loansto enterprises1330 Interest bearing loans provided to business enterprises = int bearingloansto enterprises1331 Loans provided to departmental undertakings/seb’s = loansto dept undertakingssebs
(Continued. . . )
August 2010 Indicators
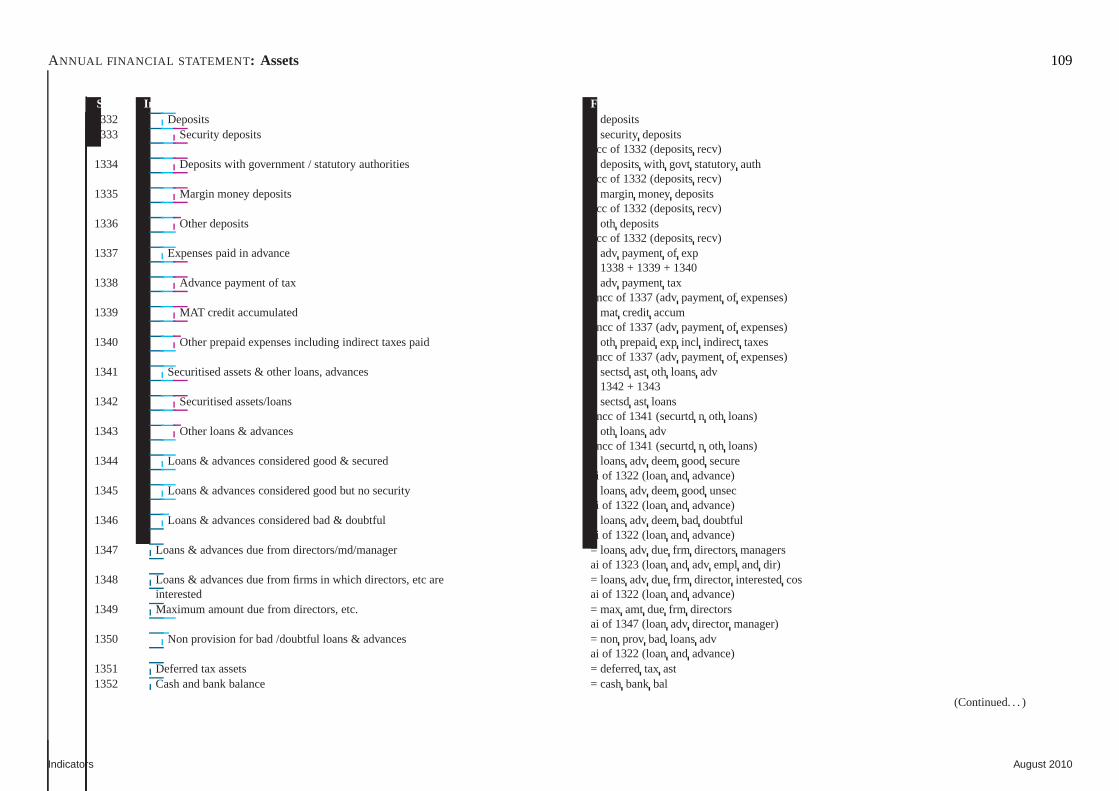
ANNUAL FINANCIAL STATEMENT : Assets 109
Sr.No. Indicator Fields & formula1332 Deposits = deposits1333 Security deposits = securitydeposits
pcc of 1332 (depositsrecv)1334 Deposits with government / statutory authorities = deposits with govt statutoryauth
pcc of 1332 (depositsrecv)1335 Margin money deposits = marginmoneydeposits
pcc of 1332 (depositsrecv)1336 Other deposits = oth deposits
pcc of 1332 (depositsrecv)1337 Expenses paid in advance = adv paymentof exp
= 1338 + 1339 + 13401338 Advance payment of tax = adv paymenttax
pncc of 1337 (advpaymentof expenses)1339 MAT credit accumulated = mat credit accum
pncc of 1337 (advpaymentof expenses)1340 Other prepaid expenses including indirect taxes paid = othprepaidexp incl indirect taxes
pncc of 1337 (advpaymentof expenses)1341 Securitised assets & other loans, advances = sectsdast oth loansadv
= 1342 + 13431342 Securitised assets/loans = sectsdast loans
pncc of 1341 (securtdn oth loans)1343 Other loans & advances = oth loansadv
pncc of 1341 (securtdn oth loans)1344 Loans & advances considered good & secured = loansadv deemgood secure
ai of 1322 (loanand advance)1345 Loans & advances considered good but no security = loansadv deemgood unsec
ai of 1322 (loanand advance)1346 Loans & advances considered bad & doubtful = loansadv deembad doubtful
ai of 1322 (loanand advance)1347 Loans & advances due from directors/md/manager = loansadv due frm directorsmanagers
ai of 1323 (loanand adv empl and dir)1348 Loans & advances due from firms in which directors, etc are = loansadv due frm director interestedcos
interested ai of 1322 (loanand advance)1349 Maximum amount due from directors, etc. = max amt due frm directors
ai of 1347 (loanadv director manager)1350 Non provision for bad /doubtful loans & advances = nonprov bad loansadv
ai of 1322 (loanand advance)1351 Deferred tax assets = deferredtax ast1352 Cash and bank balance = cashbank bal
(Continued. . . )
Indicators August 2010
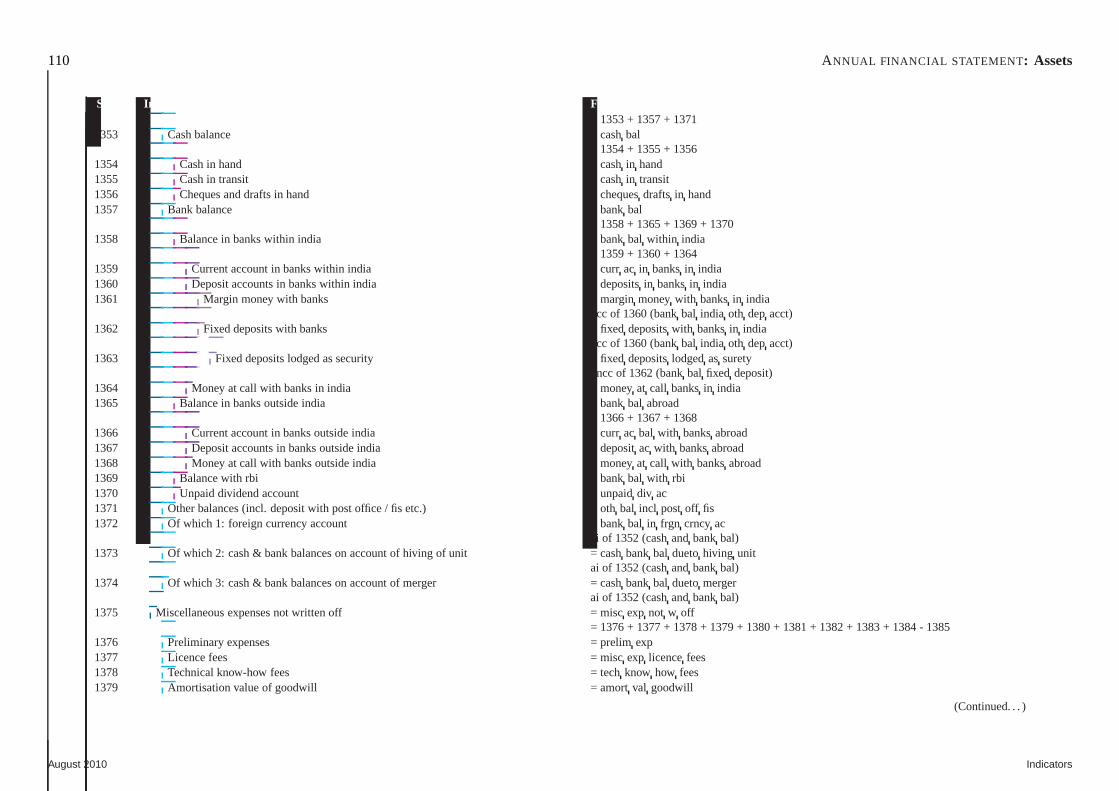
110 ANNUAL FINANCIAL STATEMENT : Assets
Sr.No. Indicator Fields & formula= 1353 + 1357 + 1371
1353 Cash balance = cashbal= 1354 + 1355 + 1356
1354 Cash in hand = cashin hand1355 Cash in transit = cashin transit1356 Cheques and drafts in hand = chequesdrafts in hand1357 Bank balance = bankbal
= 1358 + 1365 + 1369 + 13701358 Balance in banks within india = bankbal within india
= 1359 + 1360 + 13641359 Current account in banks within india = curr ac in banksin india1360 Deposit accounts in banks within india = depositsin banksin india1361 Margin money with banks = marginmoneywith banksin india
pcc of 1360 (bankbal india oth dep acct)1362 Fixed deposits with banks = fixed depositswith banksin india
pcc of 1360 (bankbal india oth dep acct)1363 Fixed deposits lodged as security = fixed depositslodgedas surety
pncc of 1362 (bankbal fixed deposit)1364 Money at call with banks in india = moneyat call banksin india1365 Balance in banks outside india = bankbal abroad
= 1366 + 1367 + 13681366 Current account in banks outside india = curr ac bal with banksabroad1367 Deposit accounts in banks outside india = depositac with banksabroad1368 Money at call with banks outside india = moneyat call with banksabroad1369 Balance with rbi = bankbal with rbi1370 Unpaid dividend account = unpaiddiv ac1371 Other balances (incl. deposit with post office / fis etc.) = othbal incl post off fis1372 Of which 1: foreign currency account = bankbal in frgn crncy ac
ai of 1352 (cashandbank bal)1373 Of which 2: cash & bank balances on account of hiving of unit = cashbank bal duetohiving unit
ai of 1352 (cashandbank bal)1374 Of which 3: cash & bank balances on account of merger = cashbank bal duetomerger
ai of 1352 (cashandbank bal)1375 Miscellaneous expenses not written off = misc exp not w off
= 1376 + 1377 + 1378 + 1379 + 1380 + 1381 + 1382 + 1383 + 1384 - 13851376 Preliminary expenses = prelim exp1377 Licence fees = misc exp licencefees1378 Technical know-how fees = techknow how fees1379 Amortisation value of goodwill = amortval goodwill
(Continued. . . )
August 2010 Indicators
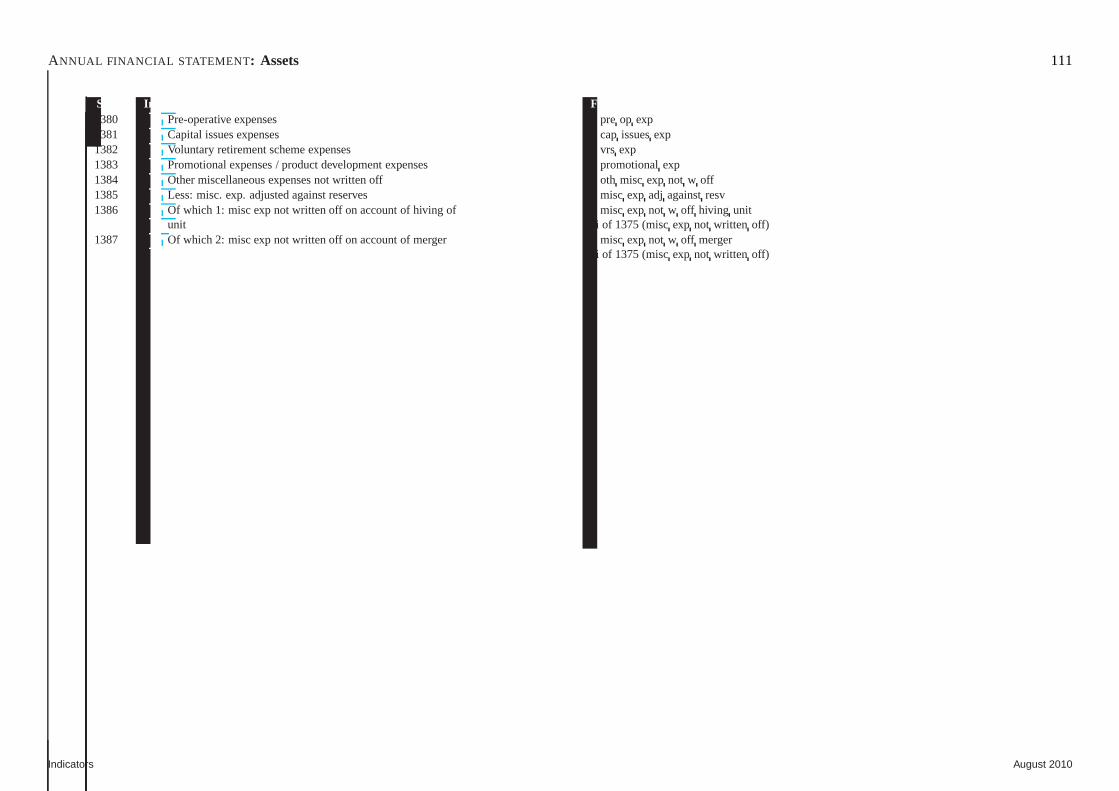
ANNUAL FINANCIAL STATEMENT : Assets 111
Sr.No. Indicator Fields & formula1380 Pre-operative expenses = pre op exp1381 Capital issues expenses = cap issuesexp1382 Voluntary retirement scheme expenses = vrs exp1383 Promotional expenses / product development expenses = promotional exp1384 Other miscellaneous expenses not written off = oth misc exp not w off1385 Less: misc. exp. adjusted against reserves = misc exp adj againstresv1386 Of which 1: misc exp not written off on account of hiving of = misc exp not w off hiving unit
unit ai of 1375 (miscexp not written off)1387 Of which 2: misc exp not written off on account of merger = miscexp not w off merger
ai of 1375 (miscexp not written off)
Indicators August 2010
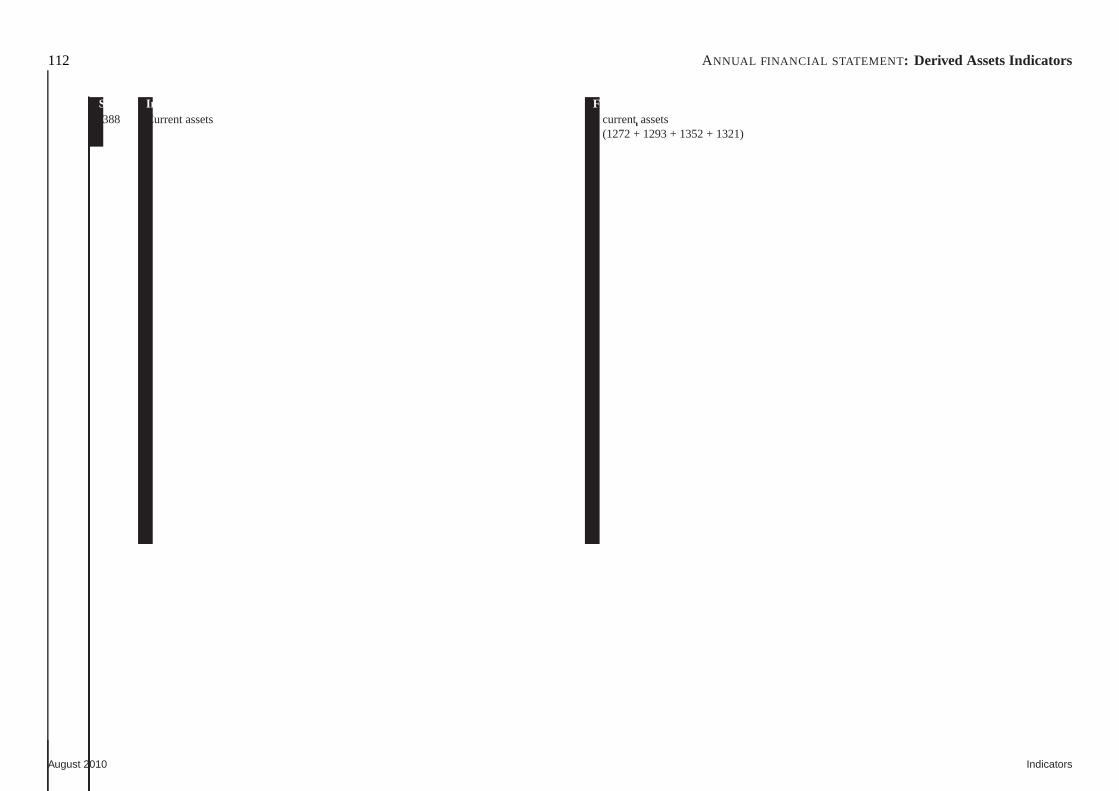
112 ANNUAL FINANCIAL STATEMENT : Derived Assets Indicators
Sr.No. Indicator Fields & formula1388 Current assets = currentassets
= (1272 + 1293 + 1352 + 1321)
August 2010 Indicators
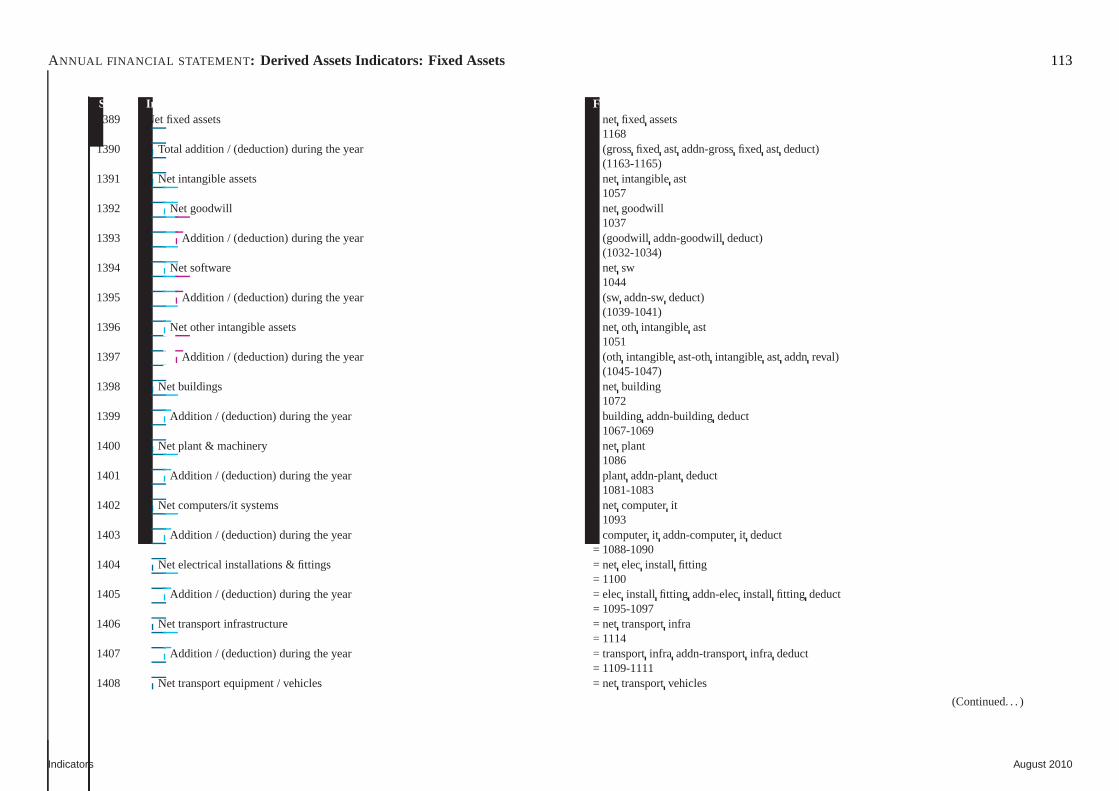
ANNUAL FINANCIAL STATEMENT : Derived Assets Indicators: Fixed Assets 113
Sr.No. Indicator Fields & formula1389 Net fixed assets = net fixed assets
= 11681390 Total addition / (deduction) during the year = (grossfixed ast addn-grossfixed ast deduct)
= (1163-1165)1391 Net intangible assets = net intangibleast
= 10571392 Net goodwill = net goodwill
= 10371393 Addition / (deduction) during the year = (goodwill addn-goodwilldeduct)
= (1032-1034)1394 Net software = net sw
= 10441395 Addition / (deduction) during the year = (sw addn-swdeduct)
= (1039-1041)1396 Net other intangible assets = net oth intangibleast
= 10511397 Addition / (deduction) during the year = (oth intangibleast-othintangibleastaddnreval)
= (1045-1047)1398 Net buildings = net building
= 10721399 Addition / (deduction) during the year = building addn-buildingdeduct
= 1067-10691400 Net plant & machinery = net plant
= 10861401 Addition / (deduction) during the year = plant addn-plantdeduct
= 1081-10831402 Net computers/it systems = net computerit
= 10931403 Addition / (deduction) during the year = computerit addn-computerit deduct
= 1088-10901404 Net electrical installations & fittings = net elec install fitting
= 11001405 Addition / (deduction) during the year = elec install fitting addn-elecinstall fitting deduct
= 1095-10971406 Net transport infrastructure = net transportinfra
= 11141407 Addition / (deduction) during the year = transportinfra addn-transportinfra deduct
= 1109-11111408 Net transport equipment / vehicles = net transportvehicles
(Continued. . . )
Indicators August 2010
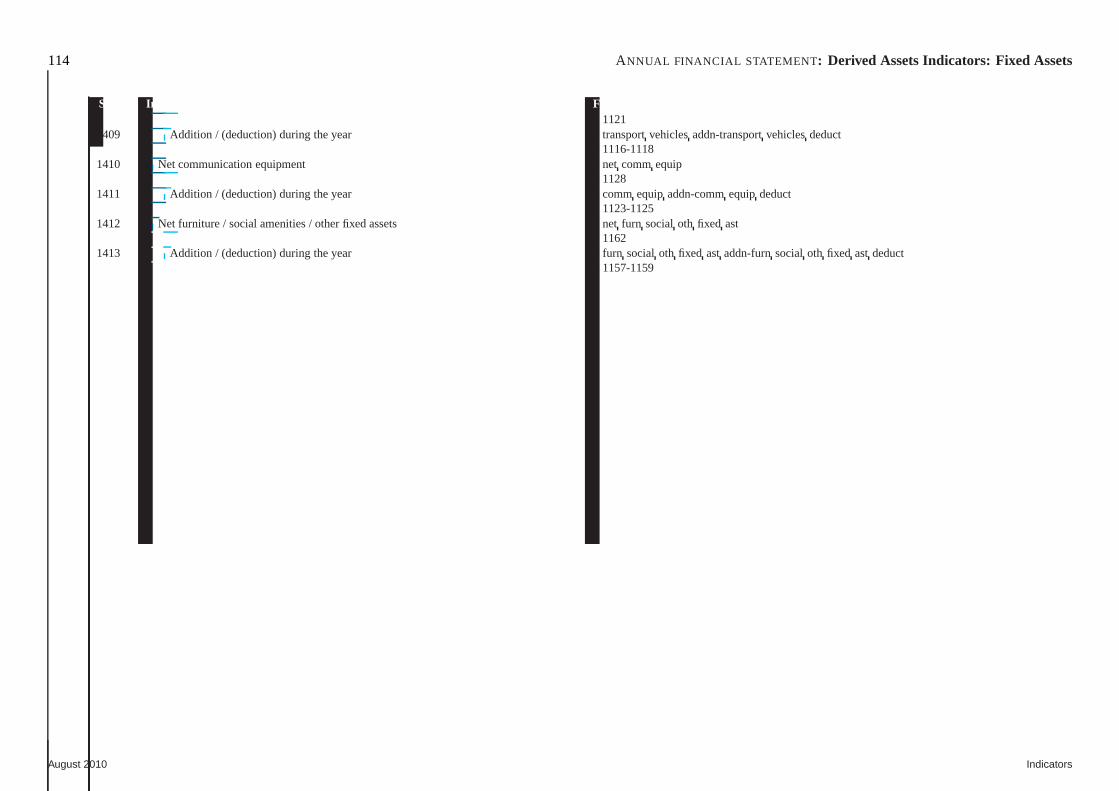
114 ANNUAL FINANCIAL STATEMENT : Derived Assets Indicators: Fixed Assets
Sr.No. Indicator Fields & formula= 1121
1409 Addition / (deduction) during the year = transportvehiclesaddn-transportvehiclesdeduct= 1116-1118
1410 Net communication equipment = net commequip= 1128
1411 Addition / (deduction) during the year = commequip addn-commequip deduct= 1123-1125
1412 Net furniture / social amenities / other fixed assets = net furn social oth fixed ast= 1162
1413 Addition / (deduction) during the year = furn social oth fixed ast addn-furnsocial oth fixed ast deduct= 1157-1159
August 2010 Indicators
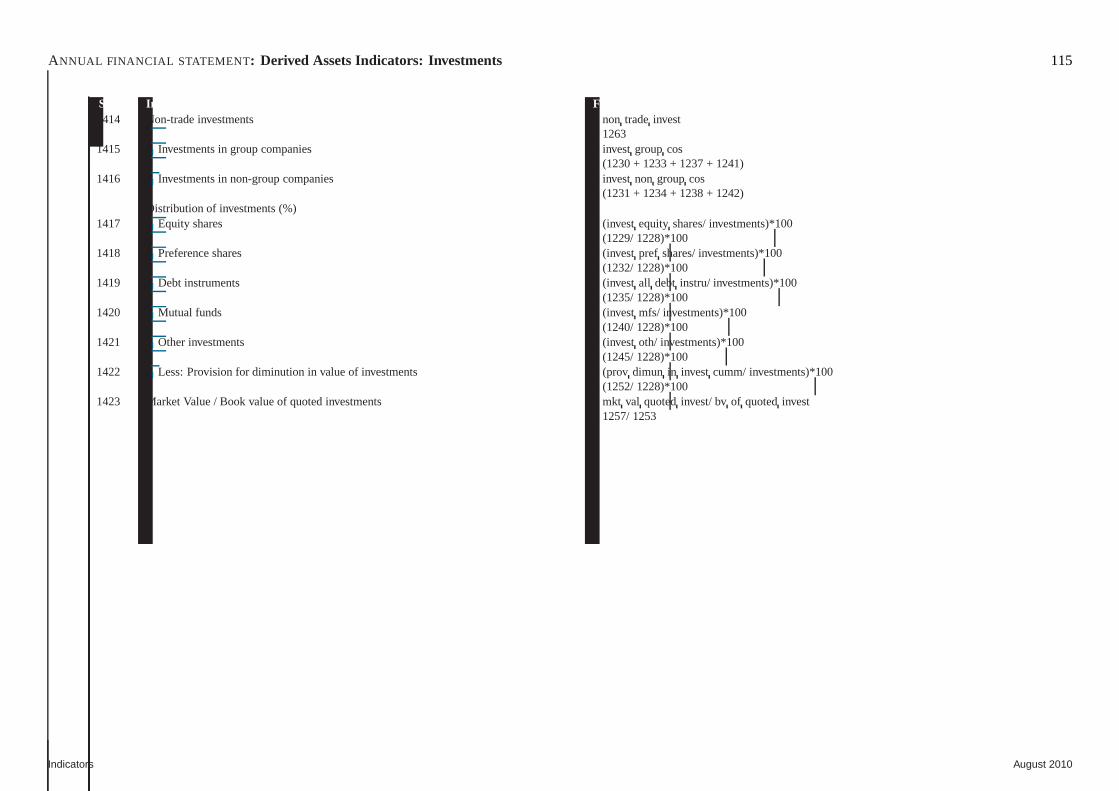
ANNUAL FINANCIAL STATEMENT : Derived Assets Indicators: Investments 115
Sr.No. Indicator Fields & formula1414 Non-trade investments = non tradeinvest
= 12631415 Investments in group companies = investgroup cos
= (1230 + 1233 + 1237 + 1241)1416 Investments in non-group companies = investnon group cos
= (1231 + 1234 + 1238 + 1242)Distribution of investments (%)
1417 Equity shares = (investequity shares/ investments)*100= (1229/ 1228)*100
1418 Preference shares = (investpref shares/ investments)*100= (1232/ 1228)*100
1419 Debt instruments = (investall debt instru/ investments)*100= (1235/ 1228)*100
1420 Mutual funds = (investmfs/ investments)*100= (1240/ 1228)*100
1421 Other investments = (investoth/ investments)*100= (1245/ 1228)*100
1422 Less: Provision for diminution in value of investments = (prov dimun in invest cumm/ investments)*100= (1252/ 1228)*100
1423 Market Value / Book value of quoted investments = mkt val quotedinvest/ bvof quotedinvest= 1257/ 1253
Indicators August 2010
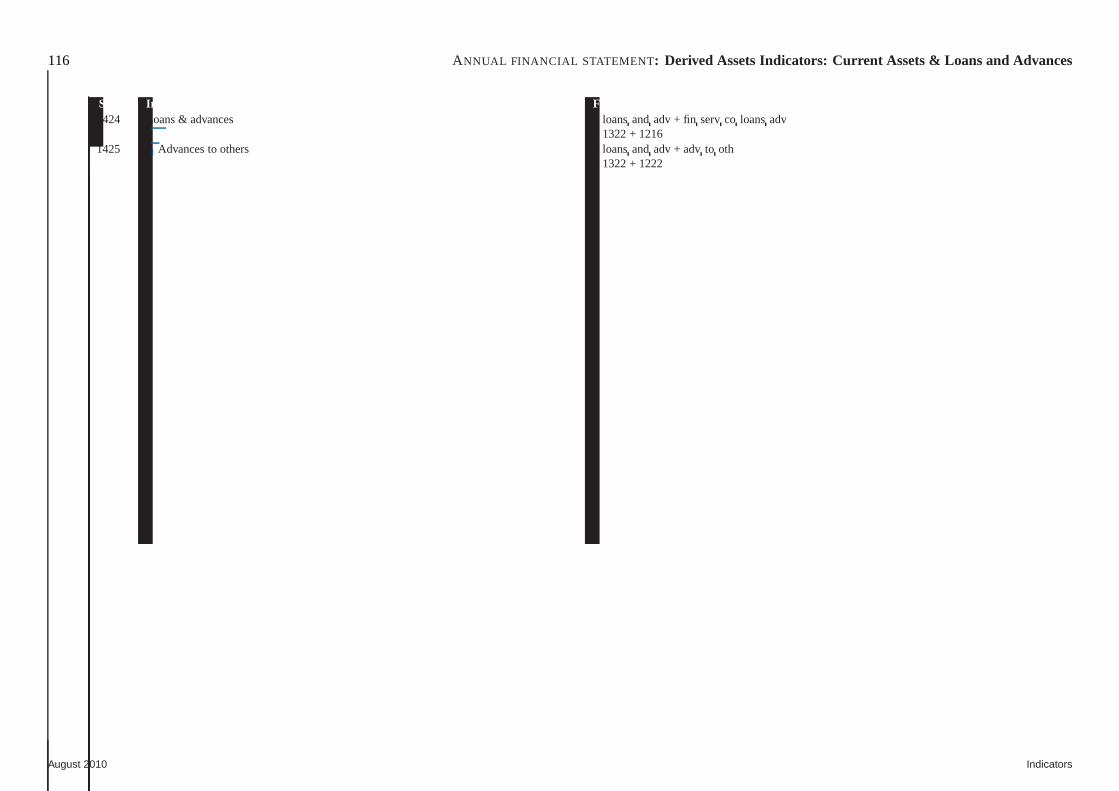
116 ANNUAL FINANCIAL STATEMENT : Derived Assets Indicators: Current Assets & Loans and Advances
Sr.No. Indicator Fields & formula1424 Loans & advances = loansand adv + fin servco loansadv
= 1322 + 12161425 Advances to others = loansand adv + advto oth
= 1322 + 1222
August 2010 Indicators
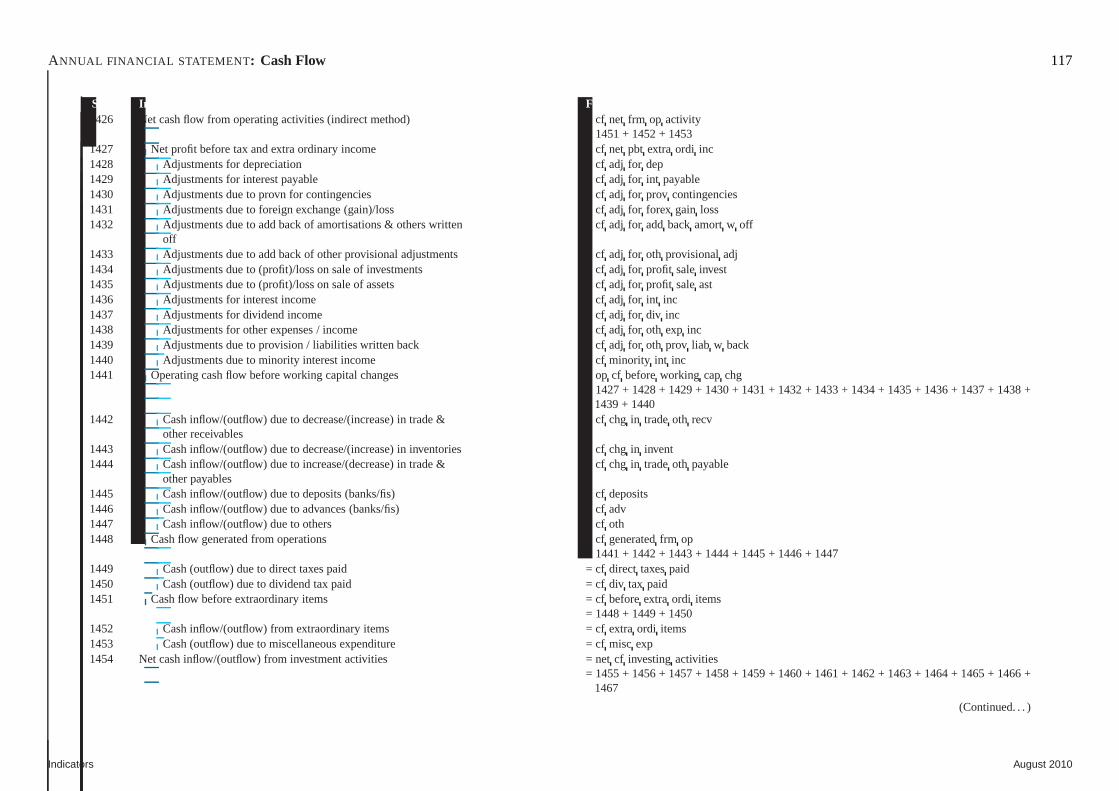
ANNUAL FINANCIAL STATEMENT : Cash Flow 117
Sr.No. Indicator Fields & formula1426 Net cash flow from operating activities (indirect method) = cf net frm op activity
= 1451 + 1452 + 14531427 Net profit before tax and extra ordinary income = cf net pbt extraordi inc1428 Adjustments for depreciation = cf adj for dep1429 Adjustments for interest payable = cf adj for int payable1430 Adjustments due to provn for contingencies = cf adj for prov contingencies1431 Adjustments due to foreign exchange (gain)/loss = cfadj for forex gain loss1432 Adjustments due to add back of amortisations & others written = cf adj for add back amort w off
off1433 Adjustments due to add back of other provisional adjustments = cf adj for oth provisionaladj1434 Adjustments due to (profit)/loss on sale of investments = cfadj for profit saleinvest1435 Adjustments due to (profit)/loss on sale of assets = cfadj for profit saleast1436 Adjustments for interest income = cf adj for int inc1437 Adjustments for dividend income = cf adj for div inc1438 Adjustments for other expenses / income = cf adj for oth exp inc1439 Adjustments due to provision / liabilities written back = cfadj for oth prov liab w back1440 Adjustments due to minority interest income = cf minority int inc1441 Operating cash flow before working capital changes = opcf beforeworking cap chg
= 1427 + 1428 + 1429 + 1430 + 1431 + 1432 + 1433 + 1434 + 1435 + 1436 +1437 + 1438 +1439 + 1440
1442 Cash inflow/(outflow) due to decrease/(increase) in trade & =cf chg in tradeoth recvother receivables
1443 Cash inflow/(outflow) due to decrease/(increase) in inventories = cf chg in invent1444 Cash inflow/(outflow) due to increase/(decrease) in trade & =cf chg in tradeoth payable
other payables1445 Cash inflow/(outflow) due to deposits (banks/fis) = cfdeposits1446 Cash inflow/(outflow) due to advances (banks/fis) = cfadv1447 Cash inflow/(outflow) due to others = cf oth1448 Cash flow generated from operations = cf generatedfrm op
= 1441 + 1442 + 1443 + 1444 + 1445 + 1446 + 14471449 Cash (outflow) due to direct taxes paid = cf direct taxespaid1450 Cash (outflow) due to dividend tax paid = cf div tax paid1451 Cash flow before extraordinary items = cf beforeextra ordi items
= 1448 + 1449 + 14501452 Cash inflow/(outflow) from extraordinary items = cf extraordi items1453 Cash (outflow) due to miscellaneous expenditure = cfmisc exp1454 Net cash inflow/(outflow) from investment activities = net cf investingactivities
= 1455 + 1456 + 1457 + 1458 + 1459 + 1460 + 1461 + 1462 + 1463 + 1464 +1465 + 1466 +1467
(Continued. . . )
Indicators August 2010
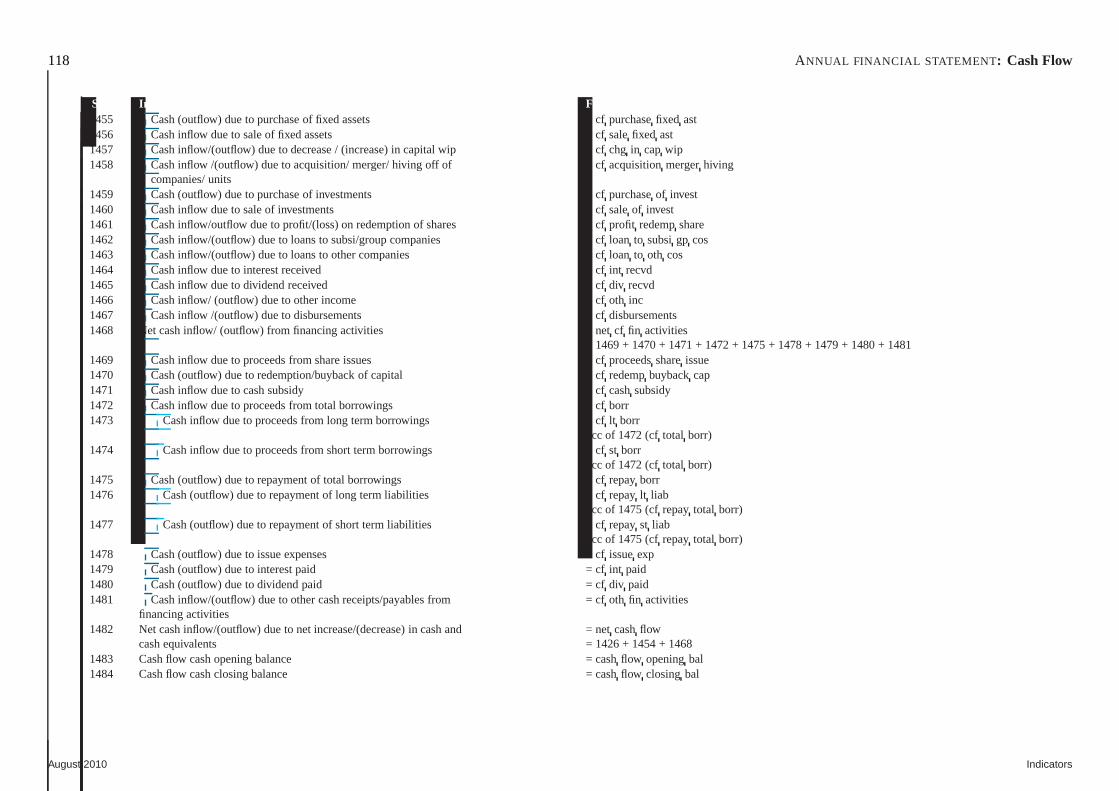
118 ANNUAL FINANCIAL STATEMENT : Cash Flow
Sr.No. Indicator Fields & formula1455 Cash (outflow) due to purchase of fixed assets = cf purchasefixed ast1456 Cash inflow due to sale of fixed assets = cf salefixed ast1457 Cash inflow/(outflow) due to decrease / (increase) in capitalwip = cf chg in capwip1458 Cash inflow /(outflow) due to acquisition/ merger/ hiving offof = cf acquisitionmergerhiving
companies/ units1459 Cash (outflow) due to purchase of investments = cf purchaseof invest1460 Cash inflow due to sale of investments = cf saleof invest1461 Cash inflow/outflow due to profit/(loss) on redemption of shares = cfprofit redempshare1462 Cash inflow/(outflow) due to loans to subsi/group companies =cf loan to subsigp cos1463 Cash inflow/(outflow) due to loans to other companies = cfloan to oth cos1464 Cash inflow due to interest received = cf int recvd1465 Cash inflow due to dividend received = cf div recvd1466 Cash inflow/ (outflow) due to other income = cf oth inc1467 Cash inflow /(outflow) due to disbursements = cf disbursements1468 Net cash inflow/ (outflow) from financing activities = net cf fin activities
= 1469 + 1470 + 1471 + 1472 + 1475 + 1478 + 1479 + 1480 + 14811469 Cash inflow due to proceeds from share issues = cf proceedsshareissue1470 Cash (outflow) due to redemption/buyback of capital = cfredempbuybackcap1471 Cash inflow due to cash subsidy = cf cashsubsidy1472 Cash inflow due to proceeds from total borrowings = cfborr1473 Cash inflow due to proceeds from long term borrowings = cflt borr
pcc of 1472 (cftotal borr)1474 Cash inflow due to proceeds from short term borrowings = cfst borr
pcc of 1472 (cftotal borr)1475 Cash (outflow) due to repayment of total borrowings = cfrepayborr1476 Cash (outflow) due to repayment of long term liabilities = cfrepaylt liab
pcc of 1475 (cfrepaytotal borr)1477 Cash (outflow) due to repayment of short term liabilities = cfrepayst liab
pcc of 1475 (cfrepaytotal borr)1478 Cash (outflow) due to issue expenses = cf issueexp1479 Cash (outflow) due to interest paid = cf int paid1480 Cash (outflow) due to dividend paid = cf div paid1481 Cash inflow/(outflow) due to other cash receipts/payables from = cf oth fin activities
financing activities1482 Net cash inflow/(outflow) due to net increase/(decrease) in cash and = netcashflow
cash equivalents = 1426 + 1454 + 14681483 Cash flow cash opening balance = cashflow openingbal1484 Cash flow cash closing balance = cashflow closing bal
August 2010 Indicators
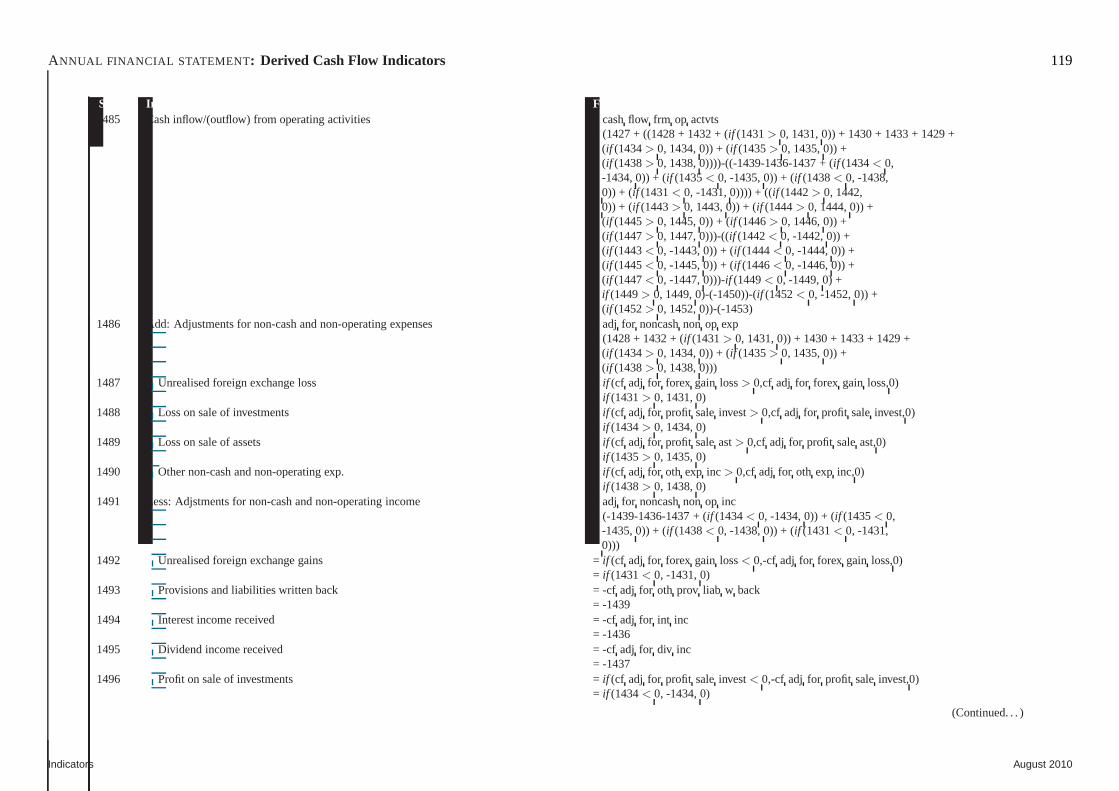
ANNUAL FINANCIAL STATEMENT : Derived Cash Flow Indicators 119
Sr.No. Indicator Fields & formula1485 Cash inflow/(outflow) from operating activities = cashflow frm op actvts
= (1427 + ((1428 + 1432 + (if (1431> 0, 1431, 0)) + 1430 + 1433 + 1429 +(if (1434> 0, 1434, 0)) + (if (1435> 0, 1435, 0)) +(if (1438> 0, 1438, 0))))-((-1439-1436-1437 + (if (1434< 0,-1434, 0)) + (if (1435< 0, -1435, 0)) + (if (1438< 0, -1438,0)) + (if (1431< 0, -1431, 0)))) + ((if (1442> 0, 1442,0)) + (if (1443> 0, 1443, 0)) + (if (1444> 0, 1444, 0)) +(if (1445> 0, 1445, 0)) + (if (1446> 0, 1446, 0)) +(if (1447> 0, 1447, 0)))-((if (1442< 0, -1442, 0)) +(if (1443< 0, -1443, 0)) + (if (1444< 0, -1444, 0)) +(if (1445< 0, -1445, 0)) + (if (1446< 0, -1446, 0)) +(if (1447< 0, -1447, 0)))-if (1449< 0, -1449, 0) +if (1449> 0, 1449, 0)-(-1450))-(if (1452< 0, -1452, 0)) +(if (1452> 0, 1452, 0))-(-1453)
1486 Add: Adjustments for non-cash and non-operating expenses = adjfor noncashnon op exp= (1428 + 1432 + (if (1431> 0, 1431, 0)) + 1430 + 1433 + 1429 +
(if (1434> 0, 1434, 0)) + (if (1435> 0, 1435, 0)) +(if (1438> 0, 1438, 0)))
1487 Unrealised foreign exchange loss = if (cf adj for forex gain loss> 0,cf adj for forex gain loss,0)= if (1431> 0, 1431, 0)
1488 Loss on sale of investments = if (cf adj for profit saleinvest> 0,cf adj for profit saleinvest,0)= if (1434> 0, 1434, 0)
1489 Loss on sale of assets = if (cf adj for profit saleast> 0,cf adj for profit saleast,0)= if (1435> 0, 1435, 0)
1490 Other non-cash and non-operating exp. = if (cf adj for oth exp inc > 0,cf adj for oth exp inc,0)= if (1438> 0, 1438, 0)
1491 Less: Adjstments for non-cash and non-operating income = adj for noncashnon op inc= (-1439-1436-1437 + (if (1434< 0, -1434, 0)) + (if (1435< 0,
-1435, 0)) + (if (1438< 0, -1438, 0)) + (if (1431< 0, -1431,0)))
1492 Unrealised foreign exchange gains = if (cf adj for forex gain loss< 0,-cf adj for forex gain loss,0)= if (1431< 0, -1431, 0)
1493 Provisions and liabilities written back = -cf adj for oth prov liab w back= -1439
1494 Interest income received = -cf adj for int inc= -1436
1495 Dividend income received = -cf adj for div inc= -1437
1496 Profit on sale of investments = if (cf adj for profit saleinvest< 0,-cf adj for profit saleinvest,0)= if (1434< 0, -1434, 0)
(Continued. . . )
Indicators August 2010
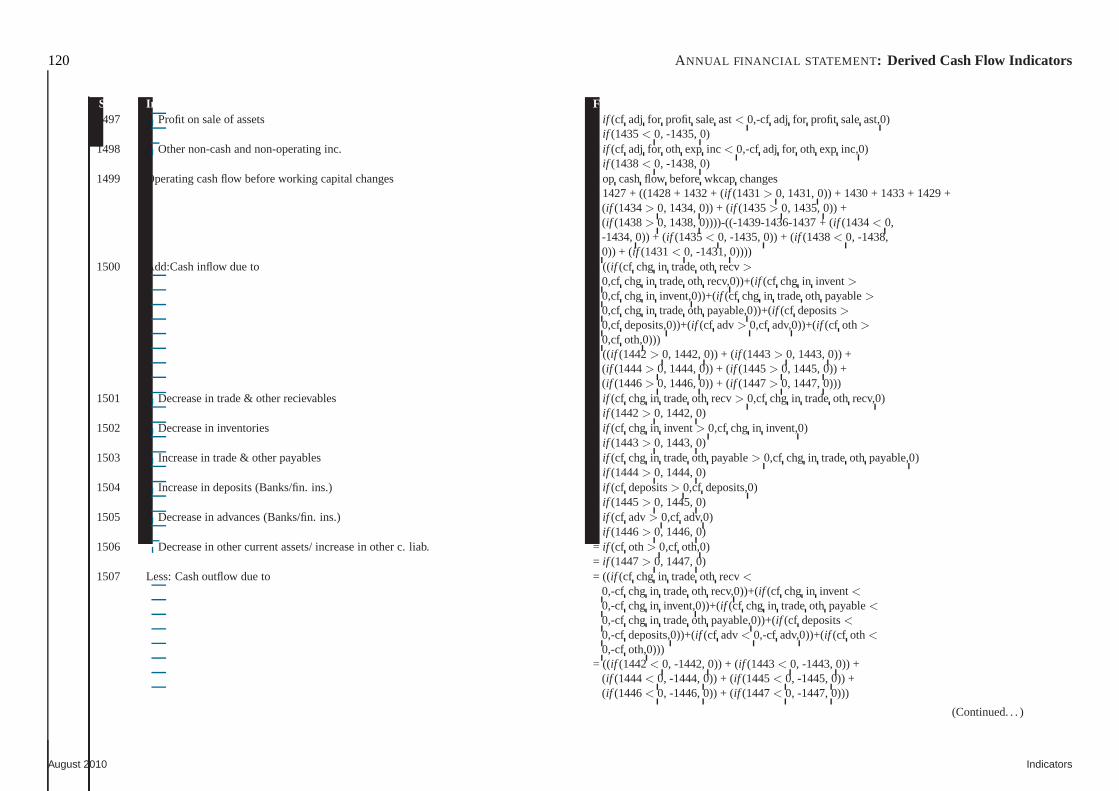
120 ANNUAL FINANCIAL STATEMENT : Derived Cash Flow Indicators
Sr.No. Indicator Fields & formula1497 Profit on sale of assets = if (cf adj for profit saleast< 0,-cf adj for profit saleast,0)
= if (1435< 0, -1435, 0)1498 Other non-cash and non-operating inc. = if (cf adj for oth exp inc < 0,-cf adj for oth exp inc,0)
= if (1438< 0, -1438, 0)1499 Operating cash flow before working capital changes = op cashflow beforewkcap changes
= 1427 + ((1428 + 1432 + (if (1431> 0, 1431, 0)) + 1430 + 1433 + 1429 +(if (1434> 0, 1434, 0)) + (if (1435> 0, 1435, 0)) +(if (1438> 0, 1438, 0))))-((-1439-1436-1437 + (if (1434< 0,-1434, 0)) + (if (1435< 0, -1435, 0)) + (if (1438< 0, -1438,0)) + (if (1431< 0, -1431, 0))))
1500 Add:Cash inflow due to = ((if (cf chg in tradeoth recv>
0,cf chg in tradeoth recv,0))+(if (cf chg in invent>0,cf chg in invent,0))+(if (cf chg in tradeoth payable>0,cf chg in tradeoth payable,0))+(if (cf deposits>0,cf deposits,0))+(if (cf adv> 0,cf adv,0))+(if (cf oth>
0,cf oth,0)))= ((if (1442> 0, 1442, 0)) + (if (1443> 0, 1443, 0)) +
(if (1444> 0, 1444, 0)) + (if (1445> 0, 1445, 0)) +(if (1446> 0, 1446, 0)) + (if (1447> 0, 1447, 0)))
1501 Decrease in trade & other recievables = if (cf chg in tradeoth recv> 0,cf chg in tradeoth recv,0)= if (1442> 0, 1442, 0)
1502 Decrease in inventories = if (cf chg in invent> 0,cf chg in invent,0)= if (1443> 0, 1443, 0)
1503 Increase in trade & other payables = if (cf chg in tradeoth payable> 0,cf chg in tradeoth payable,0)= if (1444> 0, 1444, 0)
1504 Increase in deposits (Banks/fin. ins.) = if (cf deposits> 0,cf deposits,0)= if (1445> 0, 1445, 0)
1505 Decrease in advances (Banks/fin. ins.) = if (cf adv> 0,cf adv,0)= if (1446> 0, 1446, 0)
1506 Decrease in other current assets/ increase in other c. liab. = if (cf oth> 0,cf oth,0)= if (1447> 0, 1447, 0)
1507 Less: Cash outflow due to = ((if (cf chg in tradeoth recv<
0,-cf chg in tradeoth recv,0))+(if (cf chg in invent<0,-cf chg in invent,0))+(if (cf chg in tradeoth payable<0,-cf chg in tradeoth payable,0))+(if (cf deposits<0,-cf deposits,0))+(if (cf adv< 0,-cf adv,0))+(if (cf oth<
0,-cf oth,0)))= ((if (1442< 0, -1442, 0)) + (if (1443< 0, -1443, 0)) +
(if (1444< 0, -1444, 0)) + (if (1445< 0, -1445, 0)) +(if (1446< 0, -1446, 0)) + (if (1447< 0, -1447, 0)))
(Continued. . . )
August 2010 Indicators
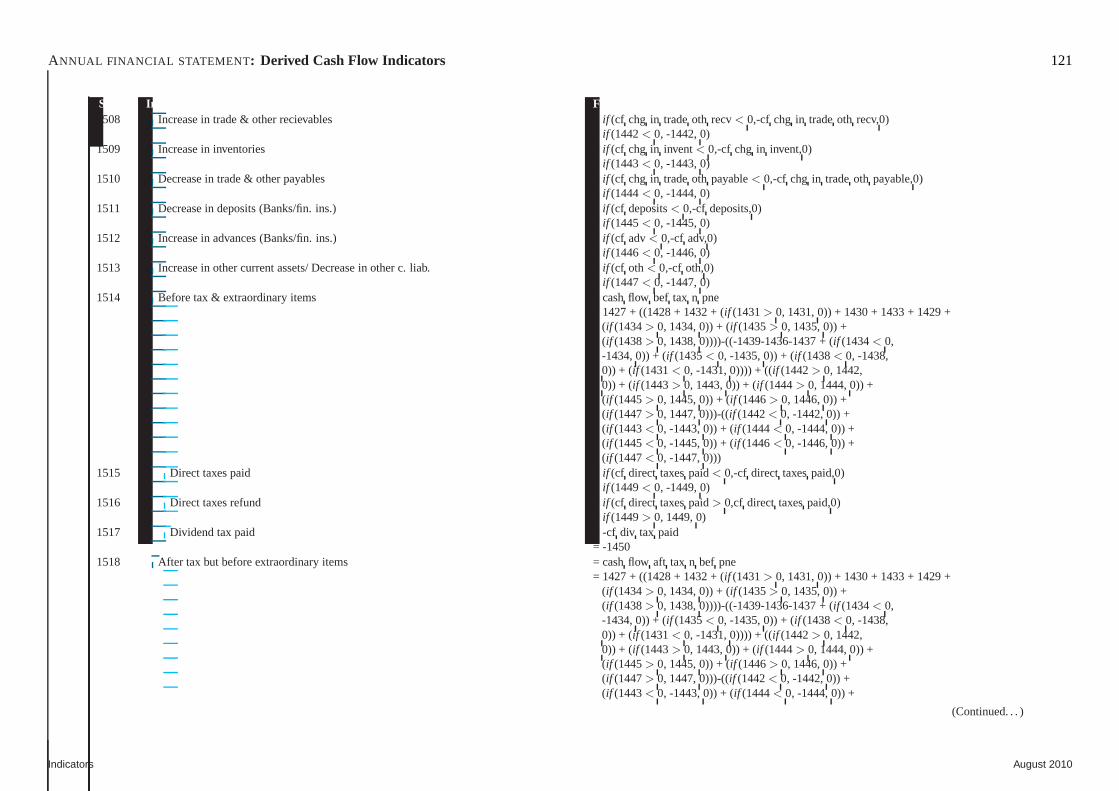
ANNUAL FINANCIAL STATEMENT : Derived Cash Flow Indicators 121
Sr.No. Indicator Fields & formula1508 Increase in trade & other recievables = if (cf chg in tradeoth recv< 0,-cf chg in tradeoth recv,0)
= if (1442< 0, -1442, 0)1509 Increase in inventories = if (cf chg in invent< 0,-cf chg in invent,0)
= if (1443< 0, -1443, 0)1510 Decrease in trade & other payables = if (cf chg in tradeoth payable< 0,-cf chg in tradeoth payable,0)
= if (1444< 0, -1444, 0)1511 Decrease in deposits (Banks/fin. ins.) = if (cf deposits< 0,-cf deposits,0)
= if (1445< 0, -1445, 0)1512 Increase in advances (Banks/fin. ins.) = if (cf adv< 0,-cf adv,0)
= if (1446< 0, -1446, 0)1513 Increase in other current assets/ Decrease in other c. liab. = if (cf oth< 0,-cf oth,0)
= if (1447< 0, -1447, 0)1514 Before tax & extraordinary items = cashflow bef tax n pne
= 1427 + ((1428 + 1432 + (if (1431> 0, 1431, 0)) + 1430 + 1433 + 1429 +(if (1434> 0, 1434, 0)) + (if (1435> 0, 1435, 0)) +(if (1438> 0, 1438, 0))))-((-1439-1436-1437 + (if (1434< 0,-1434, 0)) + (if (1435< 0, -1435, 0)) + (if (1438< 0, -1438,0)) + (if (1431< 0, -1431, 0)))) + ((if (1442> 0, 1442,0)) + (if (1443> 0, 1443, 0)) + (if (1444> 0, 1444, 0)) +(if (1445> 0, 1445, 0)) + (if (1446> 0, 1446, 0)) +(if (1447> 0, 1447, 0)))-((if (1442< 0, -1442, 0)) +(if (1443< 0, -1443, 0)) + (if (1444< 0, -1444, 0)) +(if (1445< 0, -1445, 0)) + (if (1446< 0, -1446, 0)) +(if (1447< 0, -1447, 0)))
1515 Direct taxes paid = if (cf direct taxespaid< 0,-cf direct taxespaid,0)= if (1449< 0, -1449, 0)
1516 Direct taxes refund = if (cf direct taxespaid> 0,cf direct taxespaid,0)= if (1449> 0, 1449, 0)
1517 Dividend tax paid = -cf div tax paid= -1450
1518 After tax but before extraordinary items = cashflow aft tax n bef pne= 1427 + ((1428 + 1432 + (if (1431> 0, 1431, 0)) + 1430 + 1433 + 1429 +
(if (1434> 0, 1434, 0)) + (if (1435> 0, 1435, 0)) +(if (1438> 0, 1438, 0))))-((-1439-1436-1437 + (if (1434< 0,-1434, 0)) + (if (1435< 0, -1435, 0)) + (if (1438< 0, -1438,0)) + (if (1431< 0, -1431, 0)))) + ((if (1442> 0, 1442,0)) + (if (1443> 0, 1443, 0)) + (if (1444> 0, 1444, 0)) +(if (1445> 0, 1445, 0)) + (if (1446> 0, 1446, 0)) +(if (1447> 0, 1447, 0)))-((if (1442< 0, -1442, 0)) +(if (1443< 0, -1443, 0)) + (if (1444< 0, -1444, 0)) +
(Continued. . . )
Indicators August 2010
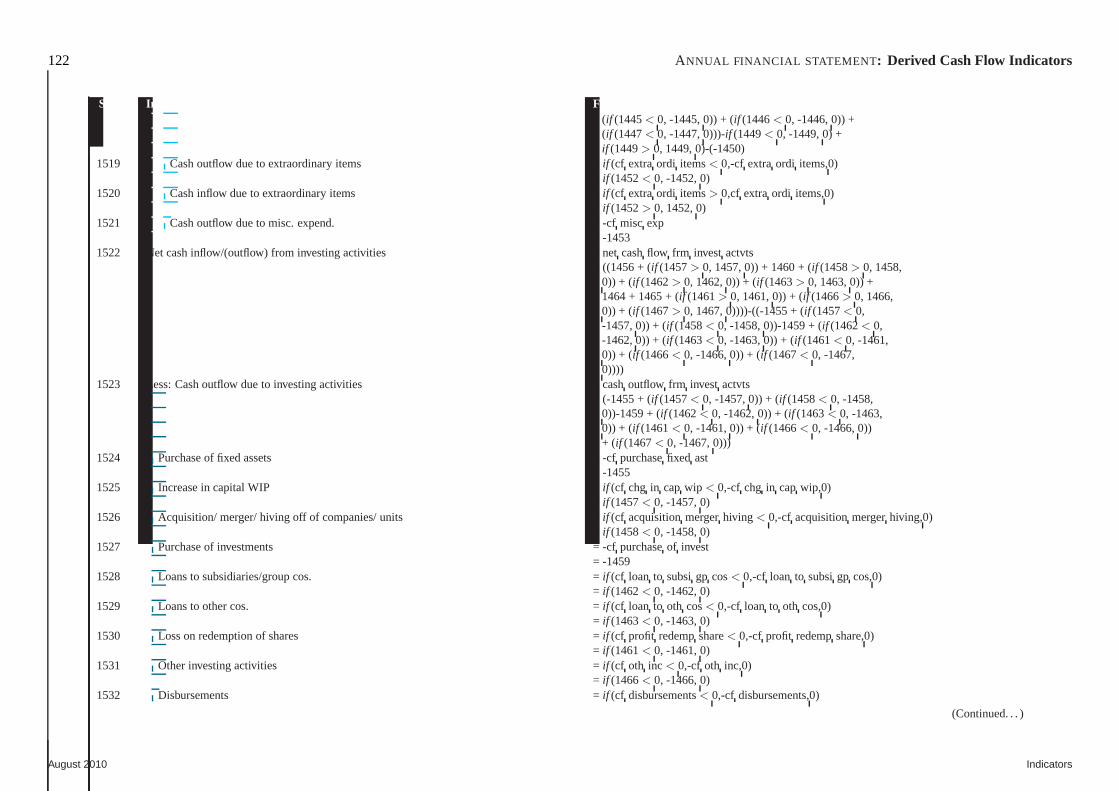
122 ANNUAL FINANCIAL STATEMENT : Derived Cash Flow Indicators
Sr.No. Indicator Fields & formula(if (1445< 0, -1445, 0)) + (if (1446< 0, -1446, 0)) +(if (1447< 0, -1447, 0)))-if (1449< 0, -1449, 0) +if (1449> 0, 1449, 0)-(-1450)
1519 Cash outflow due to extraordinary items = if (cf extraordi items< 0,-cf extraordi items,0)= if (1452< 0, -1452, 0)
1520 Cash inflow due to extraordinary items = if (cf extraordi items> 0,cf extraordi items,0)= if (1452> 0, 1452, 0)
1521 Cash outflow due to misc. expend. = -cf misc exp= -1453
1522 Net cash inflow/(outflow) from investing activities = net cashflow frm invest actvts= ((1456 + (if (1457> 0, 1457, 0)) + 1460 + (if (1458> 0, 1458,
0)) + (if (1462> 0, 1462, 0)) + (if (1463> 0, 1463, 0)) +1464 + 1465 + (if (1461> 0, 1461, 0)) + (if (1466> 0, 1466,0)) + (if (1467> 0, 1467, 0))))-((-1455 + (if (1457< 0,-1457, 0)) + (if (1458< 0, -1458, 0))-1459 + (if (1462< 0,-1462, 0)) + (if (1463< 0, -1463, 0)) + (if (1461< 0, -1461,0)) + (if (1466< 0, -1466, 0)) + (if (1467< 0, -1467,0))))
1523 Less: Cash outflow due to investing activities = cashoutflow frm invest actvts= (-1455 + (if (1457< 0, -1457, 0)) + (if (1458< 0, -1458,
0))-1459 + (if (1462< 0, -1462, 0)) + (if (1463< 0, -1463,0)) + (if (1461< 0, -1461, 0)) + (if (1466< 0, -1466, 0))+ (if (1467< 0, -1467, 0)))
1524 Purchase of fixed assets = -cf purchasefixed ast= -1455
1525 Increase in capital WIP = if (cf chg in capwip < 0,-cf chg in cap wip,0)= if (1457< 0, -1457, 0)
1526 Acquisition/ merger/ hiving off of companies/ units =if (cf acquisitionmergerhiving < 0,-cf acquisitionmergerhiving,0)= if (1458< 0, -1458, 0)
1527 Purchase of investments = -cf purchaseof invest= -1459
1528 Loans to subsidiaries/group cos. = if (cf loan to subsigp cos< 0,-cf loan to subsigp cos,0)= if (1462< 0, -1462, 0)
1529 Loans to other cos. = if (cf loan to oth cos< 0,-cf loan to oth cos,0)= if (1463< 0, -1463, 0)
1530 Loss on redemption of shares = if (cf profit redempshare< 0,-cf profit redempshare,0)= if (1461< 0, -1461, 0)
1531 Other investing activities = if (cf oth inc < 0,-cf oth inc,0)= if (1466< 0, -1466, 0)
1532 Disbursements = if (cf disbursements< 0,-cf disbursements,0)
(Continued. . . )
August 2010 Indicators
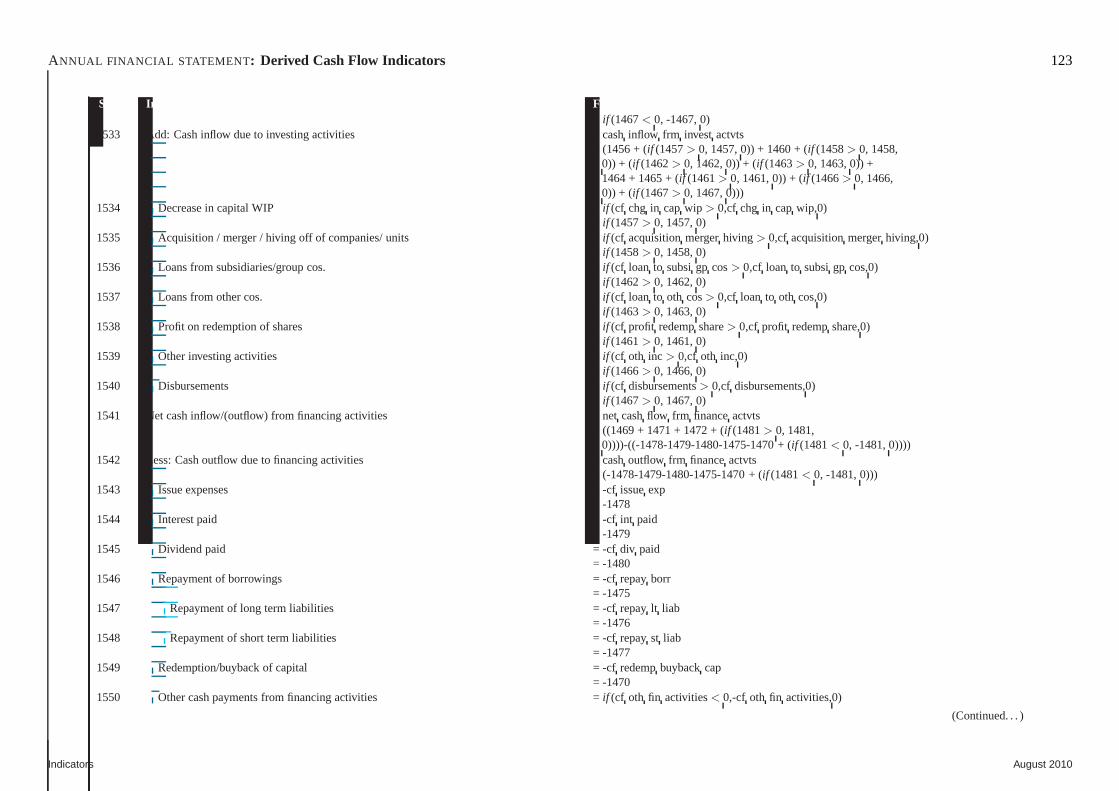
ANNUAL FINANCIAL STATEMENT : Derived Cash Flow Indicators 123
Sr.No. Indicator Fields & formula= if (1467< 0, -1467, 0)
1533 Add: Cash inflow due to investing activities = cashinflow frm invest actvts= (1456 + (if (1457> 0, 1457, 0)) + 1460 + (if (1458> 0, 1458,
0)) + (if (1462> 0, 1462, 0)) + (if (1463> 0, 1463, 0)) +1464 + 1465 + (if (1461> 0, 1461, 0)) + (if (1466> 0, 1466,0)) + (if (1467> 0, 1467, 0)))
1534 Decrease in capital WIP = if (cf chg in capwip > 0,cf chg in cap wip,0)= if (1457> 0, 1457, 0)
1535 Acquisition / merger / hiving off of companies/ units =if (cf acquisitionmergerhiving > 0,cf acquisitionmergerhiving,0)= if (1458> 0, 1458, 0)
1536 Loans from subsidiaries/group cos. = if (cf loan to subsigp cos> 0,cf loan to subsigp cos,0)= if (1462> 0, 1462, 0)
1537 Loans from other cos. = if (cf loan to oth cos> 0,cf loan to oth cos,0)= if (1463> 0, 1463, 0)
1538 Profit on redemption of shares = if (cf profit redempshare> 0,cf profit redempshare,0)= if (1461> 0, 1461, 0)
1539 Other investing activities = if (cf oth inc > 0,cf oth inc,0)= if (1466> 0, 1466, 0)
1540 Disbursements = if (cf disbursements> 0,cf disbursements,0)= if (1467> 0, 1467, 0)
1541 Net cash inflow/(outflow) from financing activities = net cashflow frm financeactvts= ((1469 + 1471 + 1472 + (if (1481> 0, 1481,
0))))-((-1478-1479-1480-1475-1470 + (if (1481< 0, -1481, 0))))1542 Less: Cash outflow due to financing activities = cashoutflow frm financeactvts
= (-1478-1479-1480-1475-1470 + (if (1481< 0, -1481, 0)))1543 Issue expenses = -cf issueexp
= -14781544 Interest paid = -cf int paid
= -14791545 Dividend paid = -cf div paid
= -14801546 Repayment of borrowings = -cf repayborr
= -14751547 Repayment of long term liabilities = -cf repaylt liab
= -14761548 Repayment of short term liabilities = -cf repayst liab
= -14771549 Redemption/buyback of capital = -cf redempbuybackcap
= -14701550 Other cash payments from financing activities = if (cf oth fin activities< 0,-cf oth fin activities,0)
(Continued. . . )
Indicators August 2010
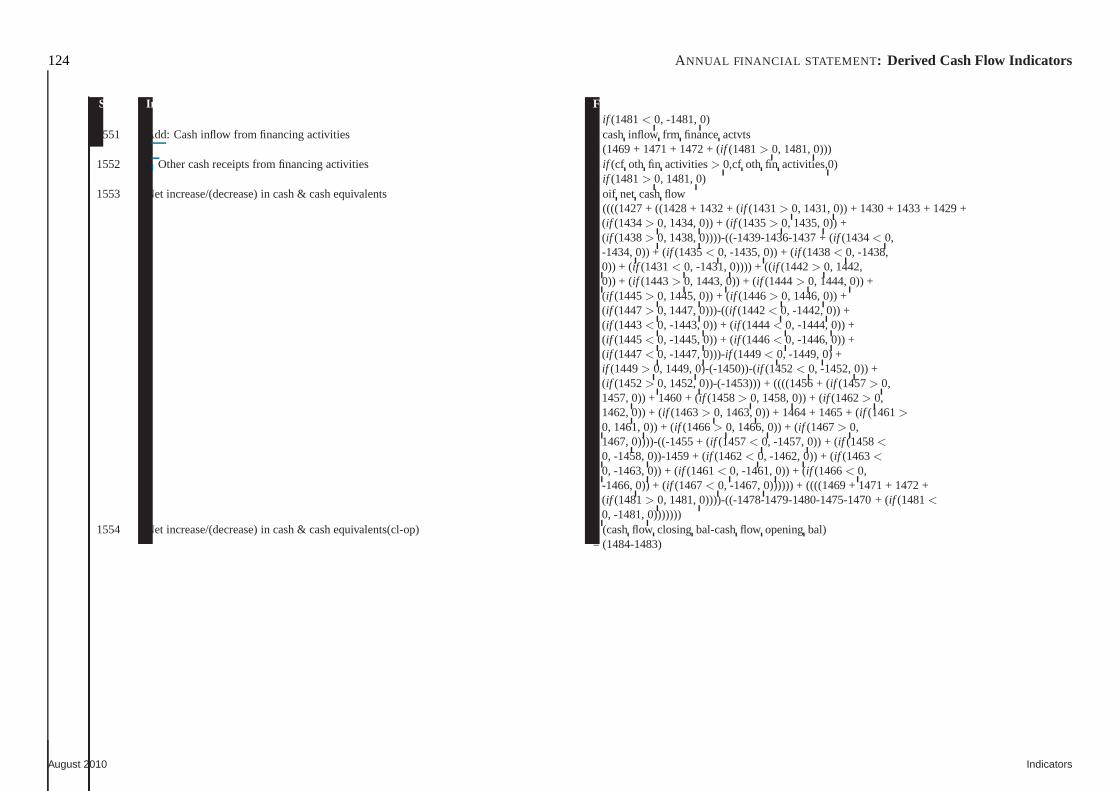
124 ANNUAL FINANCIAL STATEMENT : Derived Cash Flow Indicators
Sr.No. Indicator Fields & formula= if (1481< 0, -1481, 0)
1551 Add: Cash inflow from financing activities = cashinflow frm financeactvts= (1469 + 1471 + 1472 + (if (1481> 0, 1481, 0)))
1552 Other cash receipts from financing activities = if (cf oth fin activities> 0,cf oth fin activities,0)= if (1481> 0, 1481, 0)
1553 Net increase/(decrease) in cash & cash equivalents = oif net cashflow= ((((1427 + ((1428 + 1432 + (if (1431> 0, 1431, 0)) + 1430 + 1433 + 1429 +
(if (1434> 0, 1434, 0)) + (if (1435> 0, 1435, 0)) +(if (1438> 0, 1438, 0))))-((-1439-1436-1437 + (if (1434< 0,-1434, 0)) + (if (1435< 0, -1435, 0)) + (if (1438< 0, -1438,0)) + (if (1431< 0, -1431, 0)))) + ((if (1442> 0, 1442,0)) + (if (1443> 0, 1443, 0)) + (if (1444> 0, 1444, 0)) +(if (1445> 0, 1445, 0)) + (if (1446> 0, 1446, 0)) +(if (1447> 0, 1447, 0)))-((if (1442< 0, -1442, 0)) +(if (1443< 0, -1443, 0)) + (if (1444< 0, -1444, 0)) +(if (1445< 0, -1445, 0)) + (if (1446< 0, -1446, 0)) +(if (1447< 0, -1447, 0)))-if (1449< 0, -1449, 0) +if (1449> 0, 1449, 0)-(-1450))-(if (1452< 0, -1452, 0)) +(if (1452> 0, 1452, 0))-(-1453))) + ((((1456 + (if (1457> 0,1457, 0)) + 1460 + (if (1458> 0, 1458, 0)) + (if (1462> 0,1462, 0)) + (if (1463> 0, 1463, 0)) + 1464 + 1465 + (if (1461>
0, 1461, 0)) + (if (1466> 0, 1466, 0)) + (if (1467> 0,1467, 0))))-((-1455 + (if (1457< 0, -1457, 0)) + (if (1458<
0, -1458, 0))-1459 + (if (1462< 0, -1462, 0)) + (if (1463<
0, -1463, 0)) + (if (1461< 0, -1461, 0)) + (if (1466< 0,-1466, 0)) + (if (1467< 0, -1467, 0)))))) + ((((1469 + 1471 + 1472 +(if (1481> 0, 1481, 0))))-((-1478-1479-1480-1475-1470 + (if (1481<
0, -1481, 0)))))))1554 Net increase/(decrease) in cash & cash equivalents(cl-op) = (cashflow closing bal-cashflow openingbal)
= (1484-1483)
August 2010 Indicators
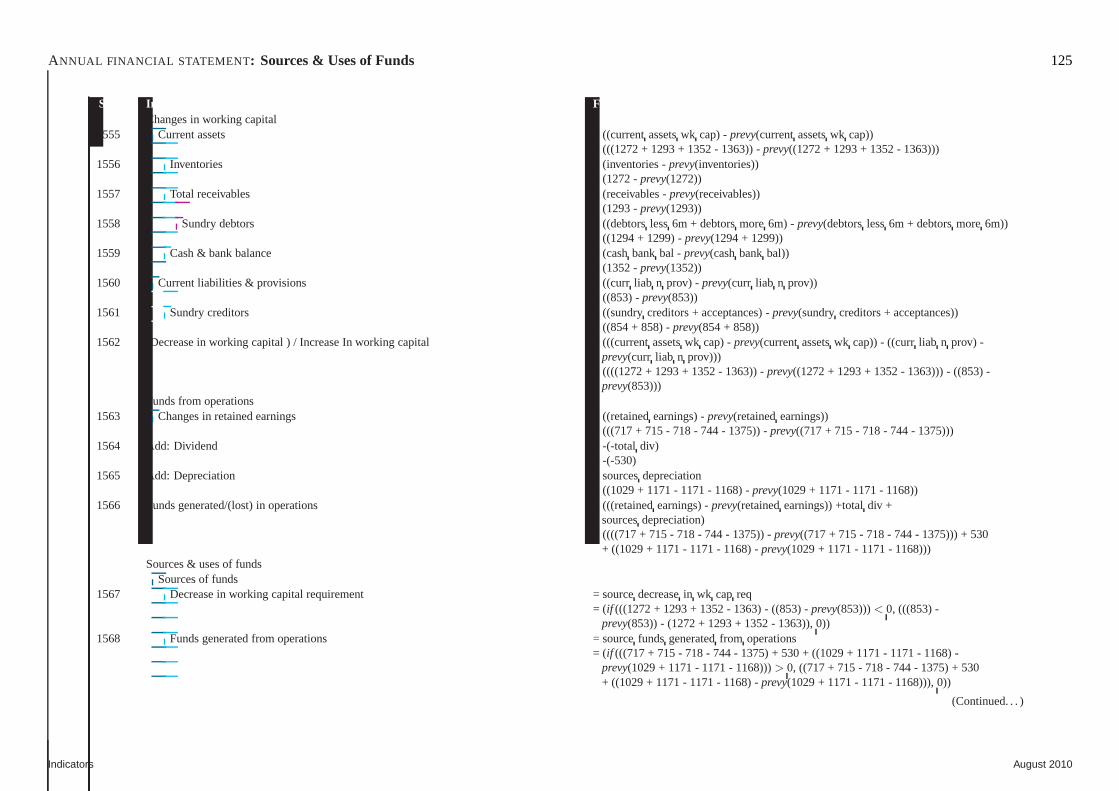
ANNUAL FINANCIAL STATEMENT : Sources & Uses of Funds 125
Sr.No. Indicator Fields & formulaChanges in working capital
1555 Current assets = ((currentassetswk cap) -prevy(currentassetswk cap))= (((1272 + 1293 + 1352 - 1363)) -prevy((1272 + 1293 + 1352 - 1363)))
1556 Inventories = (inventories -prevy(inventories))= (1272 -prevy(1272))
1557 Total receivables = (receivables -prevy(receivables))= (1293 -prevy(1293))
1558 Sundry debtors = ((debtorsless6m + debtorsmore6m) - prevy(debtorsless6m + debtorsmore6m))= ((1294 + 1299) -prevy(1294 + 1299))
1559 Cash & bank balance = (cashbank bal - prevy(cashbank bal))= (1352 -prevy(1352))
1560 Current liabilities & provisions = ((curr liab n prov) - prevy(curr liab n prov))= ((853) -prevy(853))
1561 Sundry creditors = ((sundrycreditors + acceptances) -prevy(sundrycreditors + acceptances))= ((854 + 858) -prevy(854 + 858))
1562 (Decrease in working capital ) / Increase In working capital = (((currentassetswk cap) -prevy(currentassetswk cap)) - ((currliab n prov) -prevy(curr liab n prov)))
= ((((1272 + 1293 + 1352 - 1363)) -prevy((1272 + 1293 + 1352 - 1363))) - ((853) -prevy(853)))
Funds from operations1563 Changes in retained earnings = ((retainedearnings) -prevy(retainedearnings))
= (((717 + 715 - 718 - 744 - 1375)) -prevy((717 + 715 - 718 - 744 - 1375)))1564 Add: Dividend = -(-total div)
= -(-530)1565 Add: Depreciation = sourcesdepreciation
= ((1029 + 1171 - 1171 - 1168) -prevy(1029 + 1171 - 1171 - 1168))1566 Funds generated/(lost) in operations = (((retainedearnings) -prevy(retainedearnings)) +totaldiv +
sourcesdepreciation)= ((((717 + 715 - 718 - 744 - 1375)) -prevy((717 + 715 - 718 - 744 - 1375))) + 530
+ ((1029 + 1171 - 1171 - 1168) -prevy(1029 + 1171 - 1171 - 1168)))Sources & uses of funds
Sources of funds1567 Decrease in working capital requirement = sourcedecreasein wk cap req
= (if (((1272 + 1293 + 1352 - 1363) - ((853) -prevy(853)))< 0, (((853) -prevy(853)) - (1272 + 1293 + 1352 - 1363)), 0))
1568 Funds generated from operations = sourcefunds generatedfrom operations= (if (((717 + 715 - 718 - 744 - 1375) + 530 + ((1029 + 1171 - 1171 - 1168)-
prevy(1029 + 1171 - 1171 - 1168)))> 0, ((717 + 715 - 718 - 744 - 1375) + 530+ ((1029 + 1171 - 1171 - 1168) -prevy(1029 + 1171 - 1171 - 1168))), 0))
(Continued. . . )
Indicators August 2010
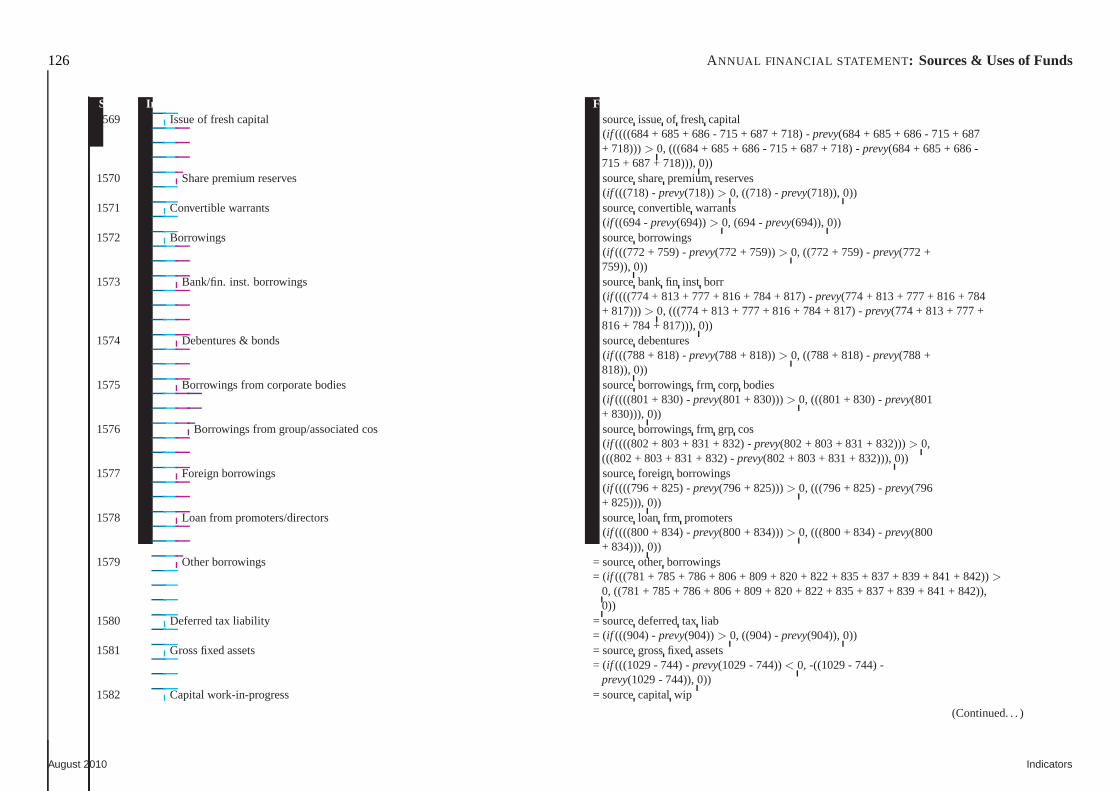
126 ANNUAL FINANCIAL STATEMENT : Sources & Uses of Funds
Sr.No. Indicator Fields & formula1569 Issue of fresh capital = sourceissueof freshcapital
= (if ((((684 + 685 + 686 - 715 + 687 + 718) -prevy(684 + 685 + 686 - 715 + 687+ 718)))> 0, (((684 + 685 + 686 - 715 + 687 + 718) -prevy(684 + 685 + 686 -715 + 687 + 718))), 0))
1570 Share premium reserves = sourcesharepremiumreserves= (if (((718) -prevy(718))> 0, ((718) -prevy(718)), 0))
1571 Convertible warrants = sourceconvertiblewarrants= (if ((694 -prevy(694))> 0, (694 -prevy(694)), 0))
1572 Borrowings = sourceborrowings= (if (((772 + 759) -prevy(772 + 759))> 0, ((772 + 759) -prevy(772 +
759)), 0))1573 Bank/fin. inst. borrowings = sourcebank fin inst borr
= (if ((((774 + 813 + 777 + 816 + 784 + 817) -prevy(774 + 813 + 777 + 816 + 784+ 817)))> 0, (((774 + 813 + 777 + 816 + 784 + 817) -prevy(774 + 813 + 777 +816 + 784 + 817))), 0))
1574 Debentures & bonds = sourcedebentures= (if (((788 + 818) -prevy(788 + 818))> 0, ((788 + 818) -prevy(788 +
818)), 0))1575 Borrowings from corporate bodies = sourceborrowingsfrm corp bodies
= (if ((((801 + 830) -prevy(801 + 830)))> 0, (((801 + 830) -prevy(801+ 830))), 0))
1576 Borrowings from group/associated cos = sourceborrowingsfrm grp cos= (if ((((802 + 803 + 831 + 832) -prevy(802 + 803 + 831 + 832)))> 0,
(((802 + 803 + 831 + 832) -prevy(802 + 803 + 831 + 832))), 0))1577 Foreign borrowings = sourceforeign borrowings
= (if ((((796 + 825) -prevy(796 + 825)))> 0, (((796 + 825) -prevy(796+ 825))), 0))
1578 Loan from promoters/directors = sourceloan frm promoters= (if ((((800 + 834) -prevy(800 + 834)))> 0, (((800 + 834) -prevy(800
+ 834))), 0))1579 Other borrowings = sourceother borrowings
= (if (((781 + 785 + 786 + 806 + 809 + 820 + 822 + 835 + 837 + 839 + 841 + 842)) >
0, ((781 + 785 + 786 + 806 + 809 + 820 + 822 + 835 + 837 + 839 + 841 + 842)),0))
1580 Deferred tax liability = sourcedeferredtax liab= (if (((904) -prevy(904))> 0, ((904) -prevy(904)), 0))
1581 Gross fixed assets = sourcegrossfixed assets= (if (((1029 - 744) -prevy(1029 - 744))< 0, -((1029 - 744) -
prevy(1029 - 744)), 0))1582 Capital work-in-progress = sourcecapital wip
(Continued. . . )
August 2010 Indicators
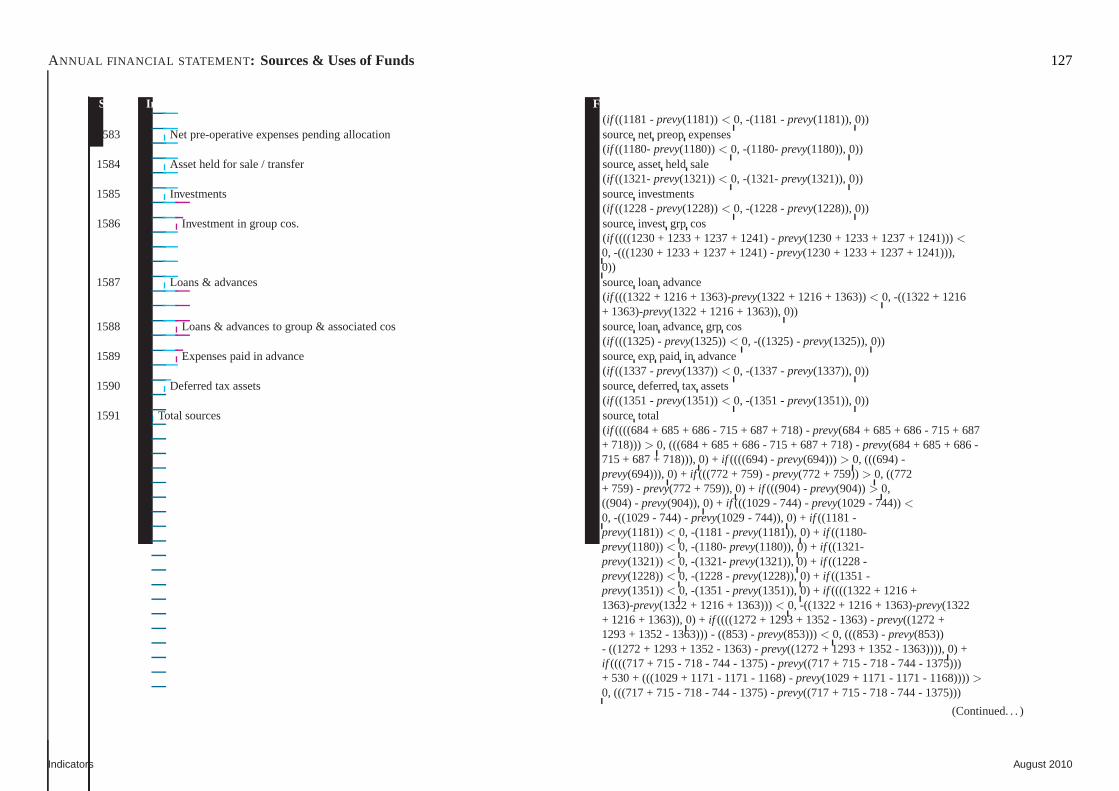
ANNUAL FINANCIAL STATEMENT : Sources & Uses of Funds 127
Sr.No. Indicator Fields & formula= (if ((1181 -prevy(1181))< 0, -(1181 -prevy(1181)), 0))
1583 Net pre-operative expenses pending allocation = sourcenet preopexpenses= (if ((1180-prevy(1180))< 0, -(1180-prevy(1180)), 0))
1584 Asset held for sale / transfer = sourceassetheld sale= (if ((1321-prevy(1321))< 0, -(1321-prevy(1321)), 0))
1585 Investments = sourceinvestments= (if ((1228 -prevy(1228))< 0, -(1228 -prevy(1228)), 0))
1586 Investment in group cos. = sourceinvest grp cos= (if ((((1230 + 1233 + 1237 + 1241) -prevy(1230 + 1233 + 1237 + 1241)))<
0, -(((1230 + 1233 + 1237 + 1241) -prevy(1230 + 1233 + 1237 + 1241))),0))
1587 Loans & advances = sourceloan advance= (if (((1322 + 1216 + 1363)-prevy(1322 + 1216 + 1363))< 0, -((1322 + 1216
+ 1363)-prevy(1322 + 1216 + 1363)), 0))1588 Loans & advances to group & associated cos = sourceloan advancegrp cos
= (if (((1325) -prevy(1325))< 0, -((1325) -prevy(1325)), 0))1589 Expenses paid in advance = sourceexp paid in advance
= (if ((1337 -prevy(1337))< 0, -(1337 -prevy(1337)), 0))1590 Deferred tax assets = sourcedeferredtax assets
= (if ((1351 -prevy(1351))< 0, -(1351 -prevy(1351)), 0))1591 Total sources = sourcetotal
= (if ((((684 + 685 + 686 - 715 + 687 + 718) -prevy(684 + 685 + 686 - 715 + 687+ 718)))> 0, (((684 + 685 + 686 - 715 + 687 + 718) -prevy(684 + 685 + 686 -715 + 687 + 718))), 0) + if ((((694) -prevy(694)))> 0, (((694) -prevy(694))), 0) + if (((772 + 759) -prevy(772 + 759))> 0, ((772+ 759) -prevy(772 + 759)), 0) + if (((904) -prevy(904))> 0,((904) -prevy(904)), 0) + if (((1029 - 744) -prevy(1029 - 744))<0, -((1029 - 744) -prevy(1029 - 744)), 0) + if ((1181 -prevy(1181))< 0, -(1181 -prevy(1181)), 0) + if ((1180-prevy(1180))< 0, -(1180-prevy(1180)), 0) + if ((1321-prevy(1321))< 0, -(1321-prevy(1321)), 0) + if ((1228 -prevy(1228))< 0, -(1228 -prevy(1228)), 0) + if ((1351 -prevy(1351))< 0, -(1351 -prevy(1351)), 0) + if ((((1322 + 1216 +1363)-prevy(1322 + 1216 + 1363)))< 0, -((1322 + 1216 + 1363)-prevy(1322+ 1216 + 1363)), 0) + if ((((1272 + 1293 + 1352 - 1363) -prevy((1272 +1293 + 1352 - 1363))) - ((853) -prevy(853)))< 0, (((853) -prevy(853))- ((1272 + 1293 + 1352 - 1363) -prevy((1272 + 1293 + 1352 - 1363)))), 0) +if ((((717 + 715 - 718 - 744 - 1375) -prevy((717 + 715 - 718 - 744 - 1375)))+ 530 + (((1029 + 1171 - 1171 - 1168) -prevy(1029 + 1171 - 1171 - 1168))))>0, (((717 + 715 - 718 - 744 - 1375) -prevy((717 + 715 - 718 - 744 - 1375)))
(Continued. . . )
Indicators August 2010
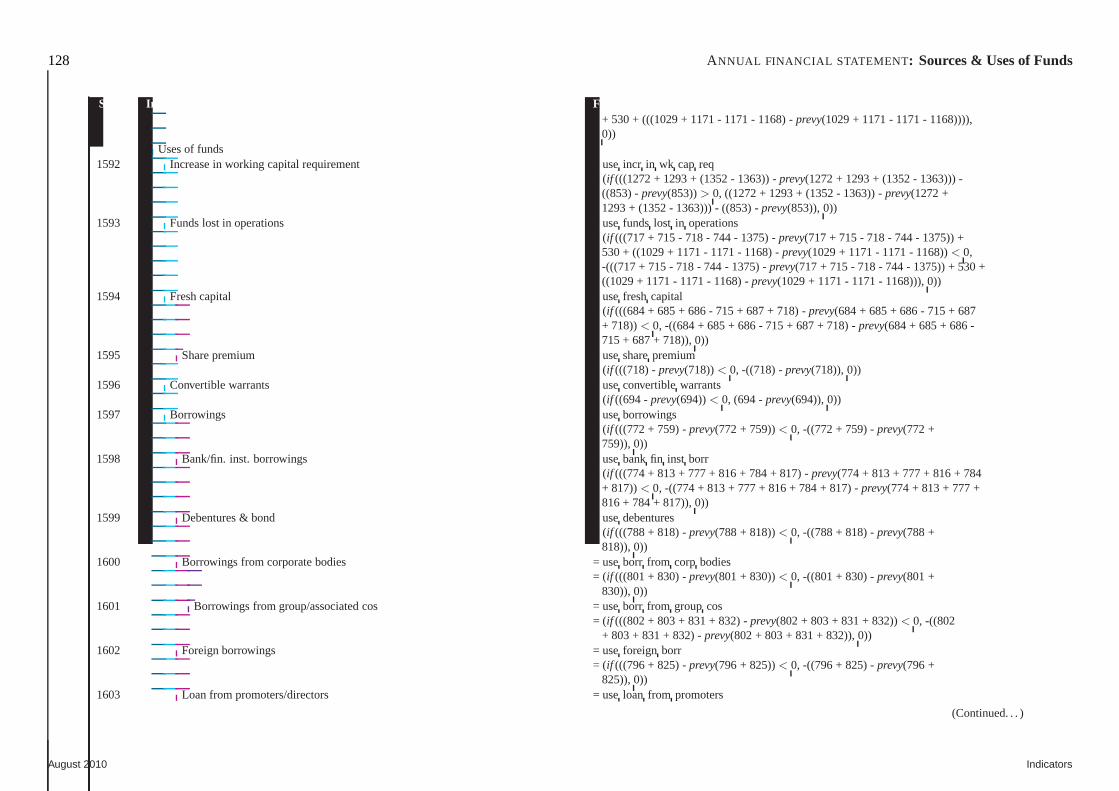
128 ANNUAL FINANCIAL STATEMENT : Sources & Uses of Funds
Sr.No. Indicator Fields & formula+ 530 + (((1029 + 1171 - 1171 - 1168) -prevy(1029 + 1171 - 1171 - 1168)))),0))
Uses of funds1592 Increase in working capital requirement = useincr in wk cap req
= (if (((1272 + 1293 + (1352 - 1363)) -prevy(1272 + 1293 + (1352 - 1363))) -((853) -prevy(853))> 0, ((1272 + 1293 + (1352 - 1363)) -prevy(1272 +1293 + (1352 - 1363))) - ((853) -prevy(853)), 0))
1593 Funds lost in operations = usefunds lost in operations= (if (((717 + 715 - 718 - 744 - 1375) -prevy(717 + 715 - 718 - 744 - 1375)) +
530 + ((1029 + 1171 - 1171 - 1168) -prevy(1029 + 1171 - 1171 - 1168))< 0,-(((717 + 715 - 718 - 744 - 1375) -prevy(717 + 715 - 718 - 744 - 1375)) + 530 +((1029 + 1171 - 1171 - 1168) -prevy(1029 + 1171 - 1171 - 1168))), 0))
1594 Fresh capital = usefreshcapital= (if (((684 + 685 + 686 - 715 + 687 + 718) -prevy(684 + 685 + 686 - 715 + 687
+ 718))< 0, -((684 + 685 + 686 - 715 + 687 + 718) -prevy(684 + 685 + 686 -715 + 687 + 718)), 0))
1595 Share premium = usesharepremium= (if (((718) -prevy(718))< 0, -((718) -prevy(718)), 0))
1596 Convertible warrants = useconvertiblewarrants= (if ((694 -prevy(694))< 0, (694 -prevy(694)), 0))
1597 Borrowings = useborrowings= (if (((772 + 759) -prevy(772 + 759))< 0, -((772 + 759) -prevy(772 +
759)), 0))1598 Bank/fin. inst. borrowings = usebank fin inst borr
= (if (((774 + 813 + 777 + 816 + 784 + 817) -prevy(774 + 813 + 777 + 816 + 784+ 817))< 0, -((774 + 813 + 777 + 816 + 784 + 817) -prevy(774 + 813 + 777 +816 + 784 + 817)), 0))
1599 Debentures & bond = usedebentures= (if (((788 + 818) -prevy(788 + 818))< 0, -((788 + 818) -prevy(788 +
818)), 0))1600 Borrowings from corporate bodies = useborr from corp bodies
= (if (((801 + 830) -prevy(801 + 830))< 0, -((801 + 830) -prevy(801 +830)), 0))
1601 Borrowings from group/associated cos = useborr from group cos= (if (((802 + 803 + 831 + 832) -prevy(802 + 803 + 831 + 832))< 0, -((802
+ 803 + 831 + 832) -prevy(802 + 803 + 831 + 832)), 0))1602 Foreign borrowings = useforeign borr
= (if (((796 + 825) -prevy(796 + 825))< 0, -((796 + 825) -prevy(796 +825)), 0))
1603 Loan from promoters/directors = useloan from promoters
(Continued. . . )
August 2010 Indicators
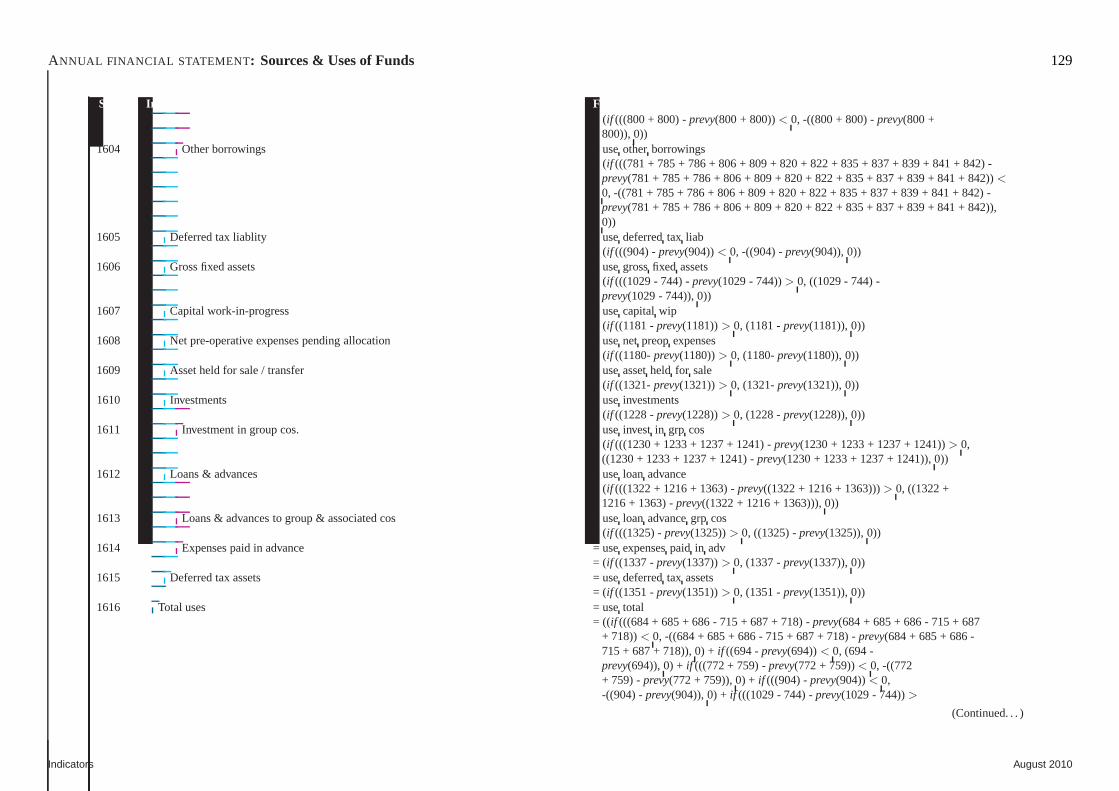
ANNUAL FINANCIAL STATEMENT : Sources & Uses of Funds 129
Sr.No. Indicator Fields & formula= (if (((800 + 800) -prevy(800 + 800))< 0, -((800 + 800) -prevy(800 +
800)), 0))1604 Other borrowings = useotherborrowings
= (if (((781 + 785 + 786 + 806 + 809 + 820 + 822 + 835 + 837 + 839 + 841 + 842)-prevy(781 + 785 + 786 + 806 + 809 + 820 + 822 + 835 + 837 + 839 + 841 + 842))<
0, -((781 + 785 + 786 + 806 + 809 + 820 + 822 + 835 + 837 + 839 + 841 + 842) -prevy(781 + 785 + 786 + 806 + 809 + 820 + 822 + 835 + 837 + 839 + 841 + 842)),0))
1605 Deferred tax liablity = usedeferredtax liab= (if (((904) -prevy(904))< 0, -((904) -prevy(904)), 0))
1606 Gross fixed assets = usegrossfixed assets= (if (((1029 - 744) -prevy(1029 - 744))> 0, ((1029 - 744) -
prevy(1029 - 744)), 0))1607 Capital work-in-progress = usecapital wip
= (if ((1181 -prevy(1181))> 0, (1181 -prevy(1181)), 0))1608 Net pre-operative expenses pending allocation = usenet preopexpenses
= (if ((1180-prevy(1180))> 0, (1180-prevy(1180)), 0))1609 Asset held for sale / transfer = useassetheld for sale
= (if ((1321-prevy(1321))> 0, (1321-prevy(1321)), 0))1610 Investments = useinvestments
= (if ((1228 -prevy(1228))> 0, (1228 -prevy(1228)), 0))1611 Investment in group cos. = useinvest in grp cos
= (if (((1230 + 1233 + 1237 + 1241) -prevy(1230 + 1233 + 1237 + 1241))> 0,((1230 + 1233 + 1237 + 1241) -prevy(1230 + 1233 + 1237 + 1241)), 0))
1612 Loans & advances = useloan advance= (if (((1322 + 1216 + 1363) -prevy((1322 + 1216 + 1363)))> 0, ((1322 +
1216 + 1363) -prevy((1322 + 1216 + 1363))), 0))1613 Loans & advances to group & associated cos = useloan advancegrp cos
= (if (((1325) -prevy(1325))> 0, ((1325) -prevy(1325)), 0))1614 Expenses paid in advance = useexpensespaid in adv
= (if ((1337 -prevy(1337))> 0, (1337 -prevy(1337)), 0))1615 Deferred tax assets = usedeferredtax assets
= (if ((1351 -prevy(1351))> 0, (1351 -prevy(1351)), 0))1616 Total uses = usetotal
= ((if (((684 + 685 + 686 - 715 + 687 + 718) -prevy(684 + 685 + 686 - 715 + 687+ 718))< 0, -((684 + 685 + 686 - 715 + 687 + 718) -prevy(684 + 685 + 686 -715 + 687 + 718)), 0) + if ((694 -prevy(694))< 0, (694 -prevy(694)), 0) + if (((772 + 759) -prevy(772 + 759))< 0, -((772+ 759) -prevy(772 + 759)), 0) + if (((904) -prevy(904))< 0,-((904) -prevy(904)), 0) + if (((1029 - 744) -prevy(1029 - 744))>
(Continued. . . )
Indicators August 2010
130 ANNUAL FINANCIAL STATEMENT : Sources & Uses of Funds
Sr.No. Indicator Fields & formula0, ((1029 - 744) -prevy(1029 - 744)), 0) + if ((1181 -prevy(1181))> 0, (1181 -prevy(1181)), 0) + if ((1180-prevy(1180))> 0, (1180-prevy(1180)), 0) + if ((1321-prevy(1321))> 0, (1321-prevy(1321)), 0) + if ((1228 -prevy(1228))> 0, (1228 -prevy(1228)), 0) + if ((1351 -prevy(1351))> 0, (1351 -prevy(1351)), 0) + 530 +if (((1322 +1216 + 1363) -prevy((1322 + 1216 + 1363)))> 0, ((1322 + 1216 + 1363) -prevy((1322 + 1216 + 1363))), 0) + if (((1272 + 1293 + (1352 - 1363)) -prevy(1272 + 1293 + (1352 - 1363))) - ((853) -prevy(853))> 0, ((1272 +1293 + (1352 - 1363)) -prevy(1272 + 1293 + (1352 - 1363))) - ((853) -prevy(853)), 0) + if (((717 + 715 - 718 - 744 - 1375) -prevy(717 +715 - 718 - 744 - 1375)) + 530 + ((1029 + 1171 - 1171 - 1168) -prevy(1029 + 1171- 1171 - 1168))< 0, -(((717 + 715 - 718 - 744 - 1375) -prevy(717 + 715 -718 - 744 - 1375)) + 530 + ((1029 + 1171 - 1171 - 1168) -prevy(1029 + 1171 -1171 - 1168))), 0)))
August 2010 Indicators
ANNUAL FINANCIAL STATEMENT : Structure of Funds Used 131
Sr.No. Indicator Fields & formulaSources of funds
1617 Decrease in working capital requirement = sourcedecreasein wk cap req/ sourcetotal *100= (if (((1272 + 1293 + 1352 - 1363) - ((853) -prevy(853)))< 0, (((853) -
prevy(853)) - (1272 + 1293 + 1352 - 1363)), 0))/ (if ((((684 + 685 + 686 -715 + 687 + 718) -prevy(684 + 685 + 686 - 715 + 687 + 718)))> 0, (((684 +685 + 686 - 715 + 687 + 718) -prevy(684 + 685 + 686 - 715 + 687 + 718))), 0)+ if ((((694) -prevy(694)))> 0, (((694) -prevy(694))), 0) +if (((772 + 759) -prevy(772 + 759))> 0, ((772 + 759) -prevy(772 +759)), 0) + if (((904) -prevy(904))> 0, ((904) -prevy(904)),0) + if (((1029 - 744) -prevy(1029 - 744))< 0, -((1029 - 744) -prevy(1029 - 744)), 0) + if ((1181 -prevy(1181))< 0, -(1181 -prevy(1181)), 0) + if ((1180-prevy(1180))< 0, -(1180-prevy(1180)), 0) + if ((1321-prevy(1321))< 0, -(1321-prevy(1321)), 0) + if ((1228 -prevy(1228))< 0, -(1228 -prevy(1228)), 0) + if ((1351 -prevy(1351))< 0, -(1351 -prevy(1351)), 0) + if ((((1322 + 1216 + 1363)-prevy(1322 + 1216 +1363)))< 0, -((1322 + 1216 + 1363)-prevy(1322 + 1216 + 1363)), 0) +if ((((1272 + 1293 + 1352 - 1363) -prevy((1272 + 1293 + 1352 - 1363))) -((853) -prevy(853)))< 0, (((853) -prevy(853)) - ((1272 + 1293 + 1352 -1363) -prevy((1272 + 1293 + 1352 - 1363)))), 0) + if ((((717 + 715 - 718- 744 - 1375) -prevy((717 + 715 - 718 - 744 - 1375))) + 530 + (((1029 + 1171 -1171 - 1168) -prevy(1029 + 1171 - 1171 - 1168))))> 0, (((717 + 715 - 718 -744 - 1375) -prevy((717 + 715 - 718 - 744 - 1375))) + 530 + (((1029 + 1171 -1171 - 1168) -prevy(1029 + 1171 - 1171 - 1168)))), 0)) *100
1618 Funds generated from operations = sourcefunds generatedfrom operations/ sourcetotal *100= (if (((717 + 715 - 718 - 744 - 1375) + 530 + ((1029 + 1171 - 1171 - 1168)-
prevy(1029 + 1171 - 1171 - 1168)))> 0, ((717 + 715 - 718 - 744 - 1375) + 530+ ((1029 + 1171 - 1171 - 1168) -prevy(1029 + 1171 - 1171 - 1168))), 0))/(if ((((684 + 685 + 686 - 715 + 687 + 718) -prevy(684 + 685 + 686 - 715 + 687+ 718)))> 0, (((684 + 685 + 686 - 715 + 687 + 718) -prevy(684 + 685 + 686 -715 + 687 + 718))), 0) + if ((((694) -prevy(694)))> 0, (((694) -prevy(694))), 0) + if (((772 + 759) -prevy(772 + 759))> 0, ((772+ 759) -prevy(772 + 759)), 0) + if (((904) -prevy(904))> 0,((904) -prevy(904)), 0) + if (((1029 - 744) -prevy(1029 - 744))<0, -((1029 - 744) -prevy(1029 - 744)), 0) + if ((1181 -prevy(1181))< 0, -(1181 -prevy(1181)), 0) + if ((1180-prevy(1180))< 0, -(1180-prevy(1180)), 0) + if ((1321-prevy(1321))< 0, -(1321-prevy(1321)), 0) + if ((1228 -prevy(1228))< 0, -(1228 -prevy(1228)), 0) + if ((1351 -prevy(1351))< 0, -(1351 -prevy(1351)), 0) + if ((((1322 + 1216 +
(Continued. . . )
Indicators August 2010
132 ANNUAL FINANCIAL STATEMENT : Structure of Funds Used
Sr.No. Indicator Fields & formula1363)-prevy(1322 + 1216 + 1363)))< 0, -((1322 + 1216 + 1363)-prevy(1322+ 1216 + 1363)), 0) + if ((((1272 + 1293 + 1352 - 1363) -prevy((1272 +1293 + 1352 - 1363))) - ((853) -prevy(853)))< 0, (((853) -prevy(853))- ((1272 + 1293 + 1352 - 1363) -prevy((1272 + 1293 + 1352 - 1363)))), 0) +if ((((717 + 715 - 718 - 744 - 1375) -prevy((717 + 715 - 718 - 744 - 1375)))+ 530 + (((1029 + 1171 - 1171 - 1168) -prevy(1029 + 1171 - 1171 - 1168))))>0, (((717 + 715 - 718 - 744 - 1375) -prevy((717 + 715 - 718 - 744 - 1375)))+ 530 + (((1029 + 1171 - 1171 - 1168) -prevy(1029 + 1171 - 1171 - 1168)))),0)) *100
1619 Issue of fresh capital = sourceissueof freshcapital/ sourcetotal *100= (if ((((684 + 685 + 686 - 715 + 687 + 718) -prevy(684 + 685 + 686 - 715 + 687
+ 718)))> 0, (((684 + 685 + 686 - 715 + 687 + 718) -prevy(684 + 685 + 686 -715 + 687 + 718))), 0))/ (if ((((684 + 685 + 686 - 715 + 687 + 718) -prevy(684 + 685 + 686 - 715 + 687 + 718)))> 0, (((684 + 685 + 686 - 715 +687 + 718) -prevy(684 + 685 + 686 - 715 + 687 + 718))), 0) + if ((((694)- prevy(694)))> 0, (((694) -prevy(694))), 0) + if (((772 + 759)- prevy(772 + 759))> 0, ((772 + 759) -prevy(772 + 759)), 0) +if (((904) -prevy(904))> 0, ((904) -prevy(904)), 0) +if (((1029 - 744) -prevy(1029 - 744))< 0, -((1029 - 744) -prevy(1029 - 744)), 0) + if ((1181 -prevy(1181))< 0, -(1181 -prevy(1181)), 0) + if ((1180-prevy(1180))< 0, -(1180-prevy(1180)), 0) + if ((1321-prevy(1321))< 0, -(1321-prevy(1321)), 0) + if ((1228 -prevy(1228))< 0, -(1228 -prevy(1228)), 0) + if ((1351 -prevy(1351))< 0, -(1351 -prevy(1351)), 0) + if ((((1322 + 1216 + 1363)-prevy(1322 + 1216 +1363)))< 0, -((1322 + 1216 + 1363)-prevy(1322 + 1216 + 1363)), 0) +if ((((1272 + 1293 + 1352 - 1363) -prevy((1272 + 1293 + 1352 - 1363))) -((853) -prevy(853)))< 0, (((853) -prevy(853)) - ((1272 + 1293 + 1352 -1363) -prevy((1272 + 1293 + 1352 - 1363)))), 0) + if ((((717 + 715 - 718- 744 - 1375) -prevy((717 + 715 - 718 - 744 - 1375))) + 530 + (((1029 + 1171 -1171 - 1168) -prevy(1029 + 1171 - 1171 - 1168))))> 0, (((717 + 715 - 718 -744 - 1375) -prevy((717 + 715 - 718 - 744 - 1375))) + 530 + (((1029 + 1171 -1171 - 1168) -prevy(1029 + 1171 - 1171 - 1168)))), 0)) *100
1620 Share premium reserves = sourcesharepremiumreserves/ sourcetotal *100= (if (((718) -prevy(718))> 0, ((718) -prevy(718)), 0))/
(if ((((684 + 685 + 686 - 715 + 687 + 718) -prevy(684 + 685 + 686 - 715 + 687+ 718)))> 0, (((684 + 685 + 686 - 715 + 687 + 718) -prevy(684 + 685 + 686 -715 + 687 + 718))), 0) + if ((((694) -prevy(694)))> 0, (((694) -prevy(694))), 0) + if (((772 + 759) -prevy(772 + 759))> 0, ((772+ 759) -prevy(772 + 759)), 0) + if (((904) -prevy(904))> 0,
(Continued. . . )
August 2010 Indicators
ANNUAL FINANCIAL STATEMENT : Structure of Funds Used 133
Sr.No. Indicator Fields & formula((904) -prevy(904)), 0) + if (((1029 - 744) -prevy(1029 - 744))<0, -((1029 - 744) -prevy(1029 - 744)), 0) + if ((1181 -prevy(1181))< 0, -(1181 -prevy(1181)), 0) + if ((1180-prevy(1180))< 0, -(1180-prevy(1180)), 0) + if ((1321-prevy(1321))< 0, -(1321-prevy(1321)), 0) + if ((1228 -prevy(1228))< 0, -(1228 -prevy(1228)), 0) + if ((1351 -prevy(1351))< 0, -(1351 -prevy(1351)), 0) + if ((((1322 + 1216 +1363)-prevy(1322 + 1216 + 1363)))< 0, -((1322 + 1216 + 1363)-prevy(1322+ 1216 + 1363)), 0) + if ((((1272 + 1293 + 1352 - 1363) -prevy((1272 +1293 + 1352 - 1363))) - ((853) -prevy(853)))< 0, (((853) -prevy(853))- ((1272 + 1293 + 1352 - 1363) -prevy((1272 + 1293 + 1352 - 1363)))), 0) +if ((((717 + 715 - 718 - 744 - 1375) -prevy((717 + 715 - 718 - 744 - 1375)))+ 530 + (((1029 + 1171 - 1171 - 1168) -prevy(1029 + 1171 - 1171 - 1168))))>0, (((717 + 715 - 718 - 744 - 1375) -prevy((717 + 715 - 718 - 744 - 1375)))+ 530 + (((1029 + 1171 - 1171 - 1168) -prevy(1029 + 1171 - 1171 - 1168)))),0)) *100
1621 Convertible warrants = sourceconvertiblewarrants/ sourcetotal *100= (if ((694 -prevy(694))> 0, (694 -prevy(694)), 0))/
(if ((((684 + 685 + 686 - 715 + 687 + 718) -prevy(684 + 685 + 686 - 715 + 687+ 718)))> 0, (((684 + 685 + 686 - 715 + 687 + 718) -prevy(684 + 685 + 686 -715 + 687 + 718))), 0) + if ((((694) -prevy(694)))> 0, (((694) -prevy(694))), 0) + if (((772 + 759) -prevy(772 + 759))> 0, ((772+ 759) -prevy(772 + 759)), 0) + if (((904) -prevy(904))> 0,((904) -prevy(904)), 0) + if (((1029 - 744) -prevy(1029 - 744))<0, -((1029 - 744) -prevy(1029 - 744)), 0) + if ((1181 -prevy(1181))< 0, -(1181 -prevy(1181)), 0) + if ((1180-prevy(1180))< 0, -(1180-prevy(1180)), 0) + if ((1321-prevy(1321))< 0, -(1321-prevy(1321)), 0) + if ((1228 -prevy(1228))< 0, -(1228 -prevy(1228)), 0) + if ((1351 -prevy(1351))< 0, -(1351 -prevy(1351)), 0) + if ((((1322 + 1216 +1363)-prevy(1322 + 1216 + 1363)))< 0, -((1322 + 1216 + 1363)-prevy(1322+ 1216 + 1363)), 0) + if ((((1272 + 1293 + 1352 - 1363) -prevy((1272 +1293 + 1352 - 1363))) - ((853) -prevy(853)))< 0, (((853) -prevy(853))- ((1272 + 1293 + 1352 - 1363) -prevy((1272 + 1293 + 1352 - 1363)))), 0) +if ((((717 + 715 - 718 - 744 - 1375) -prevy((717 + 715 - 718 - 744 - 1375)))+ 530 + (((1029 + 1171 - 1171 - 1168) -prevy(1029 + 1171 - 1171 - 1168))))>0, (((717 + 715 - 718 - 744 - 1375) -prevy((717 + 715 - 718 - 744 - 1375)))+ 530 + (((1029 + 1171 - 1171 - 1168) -prevy(1029 + 1171 - 1171 - 1168)))),0)) *100
1622 Borrowings = sourceborrowings/ sourcetotal *100
(Continued. . . )
Indicators August 2010
134 ANNUAL FINANCIAL STATEMENT : Structure of Funds Used
Sr.No. Indicator Fields & formula= (if (((772 + 759) -prevy(772 + 759))> 0, ((772 + 759) -prevy(772 +
759)), 0))/ (if ((((684 + 685 + 686 - 715 + 687 + 718) -prevy(684 + 685 +686 - 715 + 687 + 718)))> 0, (((684 + 685 + 686 - 715 + 687 + 718) -prevy(684 + 685 + 686 - 715 + 687 + 718))), 0) + if ((((694) -prevy(694)))> 0, (((694) -prevy(694))), 0) + if (((772 + 759) -prevy(772 + 759))> 0, ((772 + 759) -prevy(772 + 759)), 0) +if (((904) -prevy(904))> 0, ((904) -prevy(904)), 0) +if (((1029 - 744) -prevy(1029 - 744))< 0, -((1029 - 744) -prevy(1029 - 744)), 0) + if ((1181 -prevy(1181))< 0, -(1181 -prevy(1181)), 0) + if ((1180-prevy(1180))< 0, -(1180-prevy(1180)), 0) + if ((1321-prevy(1321))< 0, -(1321-prevy(1321)), 0) + if ((1228 -prevy(1228))< 0, -(1228 -prevy(1228)), 0) + if ((1351 -prevy(1351))< 0, -(1351 -prevy(1351)), 0) + if ((((1322 + 1216 + 1363)-prevy(1322 + 1216 +1363)))< 0, -((1322 + 1216 + 1363)-prevy(1322 + 1216 + 1363)), 0) +if ((((1272 + 1293 + 1352 - 1363) -prevy((1272 + 1293 + 1352 - 1363))) -((853) -prevy(853)))< 0, (((853) -prevy(853)) - ((1272 + 1293 + 1352 -1363) -prevy((1272 + 1293 + 1352 - 1363)))), 0) + if ((((717 + 715 - 718- 744 - 1375) -prevy((717 + 715 - 718 - 744 - 1375))) + 530 + (((1029 + 1171 -1171 - 1168) -prevy(1029 + 1171 - 1171 - 1168))))> 0, (((717 + 715 - 718 -744 - 1375) -prevy((717 + 715 - 718 - 744 - 1375))) + 530 + (((1029 + 1171 -1171 - 1168) -prevy(1029 + 1171 - 1171 - 1168)))), 0)) *100
1623 Bank/fin. inst. borrowings = sourcebank fin inst borr/ sourcetotal *100= (if ((((774 + 813 + 777 + 816 + 784 + 817) -prevy(774 + 813 + 777 + 816 + 784
+ 817)))> 0, (((774 + 813 + 777 + 816 + 784 + 817) -prevy(774 + 813 + 777 +816 + 784 + 817))), 0))/ (if ((((684 + 685 + 686 - 715 + 687 + 718) -prevy(684 + 685 + 686 - 715 + 687 + 718)))> 0, (((684 + 685 + 686 - 715 +687 + 718) -prevy(684 + 685 + 686 - 715 + 687 + 718))), 0) + if ((((694)- prevy(694)))> 0, (((694) -prevy(694))), 0) + if (((772 + 759)- prevy(772 + 759))> 0, ((772 + 759) -prevy(772 + 759)), 0) +if (((904) -prevy(904))> 0, ((904) -prevy(904)), 0) +if (((1029 - 744) -prevy(1029 - 744))< 0, -((1029 - 744) -prevy(1029 - 744)), 0) + if ((1181 -prevy(1181))< 0, -(1181 -prevy(1181)), 0) + if ((1180-prevy(1180))< 0, -(1180-prevy(1180)), 0) + if ((1321-prevy(1321))< 0, -(1321-prevy(1321)), 0) + if ((1228 -prevy(1228))< 0, -(1228 -prevy(1228)), 0) + if ((1351 -prevy(1351))< 0, -(1351 -prevy(1351)), 0) + if ((((1322 + 1216 + 1363)-prevy(1322 + 1216 +1363)))< 0, -((1322 + 1216 + 1363)-prevy(1322 + 1216 + 1363)), 0) +if ((((1272 + 1293 + 1352 - 1363) -prevy((1272 + 1293 + 1352 - 1363))) -
(Continued. . . )
August 2010 Indicators
ANNUAL FINANCIAL STATEMENT : Structure of Funds Used 135
Sr.No. Indicator Fields & formula((853) -prevy(853)))< 0, (((853) -prevy(853)) - ((1272 + 1293 + 1352 -1363) -prevy((1272 + 1293 + 1352 - 1363)))), 0) + if ((((717 + 715 - 718- 744 - 1375) -prevy((717 + 715 - 718 - 744 - 1375))) + 530 + (((1029 + 1171 -1171 - 1168) -prevy(1029 + 1171 - 1171 - 1168))))> 0, (((717 + 715 - 718 -744 - 1375) -prevy((717 + 715 - 718 - 744 - 1375))) + 530 + (((1029 + 1171 -1171 - 1168) -prevy(1029 + 1171 - 1171 - 1168)))), 0)) *100
1624 Debentures & bonds = sourcedebentures/ sourcetotal *100= (if (((788 + 818) -prevy(788 + 818))> 0, ((788 + 818) -prevy(788 +
818)), 0))/ (if ((((684 + 685 + 686 - 715 + 687 + 718) -prevy(684 + 685 +686 - 715 + 687 + 718)))> 0, (((684 + 685 + 686 - 715 + 687 + 718) -prevy(684 + 685 + 686 - 715 + 687 + 718))), 0) + if ((((694) -prevy(694)))> 0, (((694) -prevy(694))), 0) + if (((772 + 759) -prevy(772 + 759))> 0, ((772 + 759) -prevy(772 + 759)), 0) +if (((904) -prevy(904))> 0, ((904) -prevy(904)), 0) +if (((1029 - 744) -prevy(1029 - 744))< 0, -((1029 - 744) -prevy(1029 - 744)), 0) + if ((1181 -prevy(1181))< 0, -(1181 -prevy(1181)), 0) + if ((1180-prevy(1180))< 0, -(1180-prevy(1180)), 0) + if ((1321-prevy(1321))< 0, -(1321-prevy(1321)), 0) + if ((1228 -prevy(1228))< 0, -(1228 -prevy(1228)), 0) + if ((1351 -prevy(1351))< 0, -(1351 -prevy(1351)), 0) + if ((((1322 + 1216 + 1363)-prevy(1322 + 1216 +1363)))< 0, -((1322 + 1216 + 1363)-prevy(1322 + 1216 + 1363)), 0) +if ((((1272 + 1293 + 1352 - 1363) -prevy((1272 + 1293 + 1352 - 1363))) -((853) -prevy(853)))< 0, (((853) -prevy(853)) - ((1272 + 1293 + 1352 -1363) -prevy((1272 + 1293 + 1352 - 1363)))), 0) + if ((((717 + 715 - 718- 744 - 1375) -prevy((717 + 715 - 718 - 744 - 1375))) + 530 + (((1029 + 1171 -1171 - 1168) -prevy(1029 + 1171 - 1171 - 1168))))> 0, (((717 + 715 - 718 -744 - 1375) -prevy((717 + 715 - 718 - 744 - 1375))) + 530 + (((1029 + 1171 -1171 - 1168) -prevy(1029 + 1171 - 1171 - 1168)))), 0)) *100
1625 Borrowings from corporate bodies = sourceborrowingsfrm corp bodies/ sourcetotal *100= (if ((((801 + 830) -prevy(801 + 830)))> 0, (((801 + 830) -prevy(801
+ 830))), 0))/ (if ((((684 + 685 + 686 - 715 + 687 + 718) -prevy(684 +685 + 686 - 715 + 687 + 718)))> 0, (((684 + 685 + 686 - 715 + 687 + 718) -prevy(684 + 685 + 686 - 715 + 687 + 718))), 0) + if ((((694) -prevy(694)))> 0, (((694) -prevy(694))), 0) + if (((772 + 759) -prevy(772 + 759))> 0, ((772 + 759) -prevy(772 + 759)), 0) +if (((904) -prevy(904))> 0, ((904) -prevy(904)), 0) +if (((1029 - 744) -prevy(1029 - 744))< 0, -((1029 - 744) -prevy(1029 - 744)), 0) + if ((1181 -prevy(1181))< 0, -(1181 -prevy(1181)), 0) + if ((1180-prevy(1180))< 0, -(1180-
(Continued. . . )
Indicators August 2010
136 ANNUAL FINANCIAL STATEMENT : Structure of Funds Used
Sr.No. Indicator Fields & formulaprevy(1180)), 0) + if ((1321-prevy(1321))< 0, -(1321-prevy(1321)), 0) + if ((1228 -prevy(1228))< 0, -(1228 -prevy(1228)), 0) + if ((1351 -prevy(1351))< 0, -(1351 -prevy(1351)), 0) + if ((((1322 + 1216 + 1363)-prevy(1322 + 1216 +1363)))< 0, -((1322 + 1216 + 1363)-prevy(1322 + 1216 + 1363)), 0) +if ((((1272 + 1293 + 1352 - 1363) -prevy((1272 + 1293 + 1352 - 1363))) -((853) -prevy(853)))< 0, (((853) -prevy(853)) - ((1272 + 1293 + 1352 -1363) -prevy((1272 + 1293 + 1352 - 1363)))), 0) + if ((((717 + 715 - 718- 744 - 1375) -prevy((717 + 715 - 718 - 744 - 1375))) + 530 + (((1029 + 1171 -1171 - 1168) -prevy(1029 + 1171 - 1171 - 1168))))> 0, (((717 + 715 - 718 -744 - 1375) -prevy((717 + 715 - 718 - 744 - 1375))) + 530 + (((1029 + 1171 -1171 - 1168) -prevy(1029 + 1171 - 1171 - 1168)))), 0)) *100
1626 Borrowings from group/associated cos = sourceborrowingsfrm grp cos/ sourcetotal *100= (if ((((802 + 803 + 831 + 832) -prevy(802 + 803 + 831 + 832)))> 0,
(((802 + 803 + 831 + 832) -prevy(802 + 803 + 831 + 832))), 0))/(if ((((684 + 685 + 686 - 715 + 687 + 718) -prevy(684 + 685 + 686 - 715 + 687+ 718)))> 0, (((684 + 685 + 686 - 715 + 687 + 718) -prevy(684 + 685 + 686 -715 + 687 + 718))), 0) + if ((((694) -prevy(694)))> 0, (((694) -prevy(694))), 0) + if (((772 + 759) -prevy(772 + 759))> 0, ((772+ 759) -prevy(772 + 759)), 0) + if (((904) -prevy(904))> 0,((904) -prevy(904)), 0) + if (((1029 - 744) -prevy(1029 - 744))<0, -((1029 - 744) -prevy(1029 - 744)), 0) + if ((1181 -prevy(1181))< 0, -(1181 -prevy(1181)), 0) + if ((1180-prevy(1180))< 0, -(1180-prevy(1180)), 0) + if ((1321-prevy(1321))< 0, -(1321-prevy(1321)), 0) + if ((1228 -prevy(1228))< 0, -(1228 -prevy(1228)), 0) + if ((1351 -prevy(1351))< 0, -(1351 -prevy(1351)), 0) + if ((((1322 + 1216 +1363)-prevy(1322 + 1216 + 1363)))< 0, -((1322 + 1216 + 1363)-prevy(1322+ 1216 + 1363)), 0) + if ((((1272 + 1293 + 1352 - 1363) -prevy((1272 +1293 + 1352 - 1363))) - ((853) -prevy(853)))< 0, (((853) -prevy(853))- ((1272 + 1293 + 1352 - 1363) -prevy((1272 + 1293 + 1352 - 1363)))), 0) +if ((((717 + 715 - 718 - 744 - 1375) -prevy((717 + 715 - 718 - 744 - 1375)))+ 530 + (((1029 + 1171 - 1171 - 1168) -prevy(1029 + 1171 - 1171 - 1168))))>0, (((717 + 715 - 718 - 744 - 1375) -prevy((717 + 715 - 718 - 744 - 1375)))+ 530 + (((1029 + 1171 - 1171 - 1168) -prevy(1029 + 1171 - 1171 - 1168)))),0)) *100
1627 Foreign borrowings = sourceforeign borrowings/ sourcetotal *100= (if ((((796 + 825) -prevy(796 + 825)))> 0, (((796 + 825) -prevy(796
+ 825))), 0))/ (if ((((684 + 685 + 686 - 715 + 687 + 718) -prevy(684 +685 + 686 - 715 + 687 + 718)))> 0, (((684 + 685 + 686 - 715 + 687 + 718) -
(Continued. . . )
August 2010 Indicators
ANNUAL FINANCIAL STATEMENT : Structure of Funds Used 137
Sr.No. Indicator Fields & formulaprevy(684 + 685 + 686 - 715 + 687 + 718))), 0) + if ((((694) -prevy(694)))> 0, (((694) -prevy(694))), 0) + if (((772 + 759) -prevy(772 + 759))> 0, ((772 + 759) -prevy(772 + 759)), 0) +if (((904) -prevy(904))> 0, ((904) -prevy(904)), 0) +if (((1029 - 744) -prevy(1029 - 744))< 0, -((1029 - 744) -prevy(1029 - 744)), 0) + if ((1181 -prevy(1181))< 0, -(1181 -prevy(1181)), 0) + if ((1180-prevy(1180))< 0, -(1180-prevy(1180)), 0) + if ((1321-prevy(1321))< 0, -(1321-prevy(1321)), 0) + if ((1228 -prevy(1228))< 0, -(1228 -prevy(1228)), 0) + if ((1351 -prevy(1351))< 0, -(1351 -prevy(1351)), 0) + if ((((1322 + 1216 + 1363)-prevy(1322 + 1216 +1363)))< 0, -((1322 + 1216 + 1363)-prevy(1322 + 1216 + 1363)), 0) +if ((((1272 + 1293 + 1352 - 1363) -prevy((1272 + 1293 + 1352 - 1363))) -((853) -prevy(853)))< 0, (((853) -prevy(853)) - ((1272 + 1293 + 1352 -1363) -prevy((1272 + 1293 + 1352 - 1363)))), 0) + if ((((717 + 715 - 718- 744 - 1375) -prevy((717 + 715 - 718 - 744 - 1375))) + 530 + (((1029 + 1171 -1171 - 1168) -prevy(1029 + 1171 - 1171 - 1168))))> 0, (((717 + 715 - 718 -744 - 1375) -prevy((717 + 715 - 718 - 744 - 1375))) + 530 + (((1029 + 1171 -1171 - 1168) -prevy(1029 + 1171 - 1171 - 1168)))), 0)) *100
1628 Loan from promoters/directors = sourceloan frm promoters/ sourcetotal *100= (if ((((800 + 834) -prevy(800 + 834)))> 0, (((800 + 834) -prevy(800
+ 834))), 0))/ (if ((((684 + 685 + 686 - 715 + 687 + 718) -prevy(684 +685 + 686 - 715 + 687 + 718)))> 0, (((684 + 685 + 686 - 715 + 687 + 718) -prevy(684 + 685 + 686 - 715 + 687 + 718))), 0) + if ((((694) -prevy(694)))> 0, (((694) -prevy(694))), 0) + if (((772 + 759) -prevy(772 + 759))> 0, ((772 + 759) -prevy(772 + 759)), 0) +if (((904) -prevy(904))> 0, ((904) -prevy(904)), 0) +if (((1029 - 744) -prevy(1029 - 744))< 0, -((1029 - 744) -prevy(1029 - 744)), 0) + if ((1181 -prevy(1181))< 0, -(1181 -prevy(1181)), 0) + if ((1180-prevy(1180))< 0, -(1180-prevy(1180)), 0) + if ((1321-prevy(1321))< 0, -(1321-prevy(1321)), 0) + if ((1228 -prevy(1228))< 0, -(1228 -prevy(1228)), 0) + if ((1351 -prevy(1351))< 0, -(1351 -prevy(1351)), 0) + if ((((1322 + 1216 + 1363)-prevy(1322 + 1216 +1363)))< 0, -((1322 + 1216 + 1363)-prevy(1322 + 1216 + 1363)), 0) +if ((((1272 + 1293 + 1352 - 1363) -prevy((1272 + 1293 + 1352 - 1363))) -((853) -prevy(853)))< 0, (((853) -prevy(853)) - ((1272 + 1293 + 1352 -1363) -prevy((1272 + 1293 + 1352 - 1363)))), 0) + if ((((717 + 715 - 718- 744 - 1375) -prevy((717 + 715 - 718 - 744 - 1375))) + 530 + (((1029 + 1171 -1171 - 1168) -prevy(1029 + 1171 - 1171 - 1168))))> 0, (((717 + 715 - 718 -
(Continued. . . )
Indicators August 2010
138 ANNUAL FINANCIAL STATEMENT : Structure of Funds Used
Sr.No. Indicator Fields & formula744 - 1375) -prevy((717 + 715 - 718 - 744 - 1375))) + 530 + (((1029 + 1171 -1171 - 1168) -prevy(1029 + 1171 - 1171 - 1168)))), 0)) *100
1629 Other borrowings = sourceother borrowings/ sourcetotal *100= (if (((781 + 785 + 786 + 806 + 809 + 820 + 822 + 835 + 837 + 839 + 841 + 842)) >
0, ((781 + 785 + 786 + 806 + 809 + 820 + 822 + 835 + 837 + 839 + 841 + 842)),0))/ (if ((((684 + 685 + 686 - 715 + 687 + 718) -prevy(684 + 685 + 686 -715 + 687 + 718)))> 0, (((684 + 685 + 686 - 715 + 687 + 718) -prevy(684 +685 + 686 - 715 + 687 + 718))), 0) + if ((((694) -prevy(694)))> 0,(((694) -prevy(694))), 0) + if (((772 + 759) -prevy(772 + 759))>0, ((772 + 759) -prevy(772 + 759)), 0) + if (((904) -prevy(904))> 0, ((904) -prevy(904)), 0) + if (((1029 - 744) -prevy(1029 -744))< 0, -((1029 - 744) -prevy(1029 - 744)), 0) + if ((1181 -prevy(1181))< 0, -(1181 -prevy(1181)), 0) + if ((1180-prevy(1180))< 0, -(1180-prevy(1180)), 0) + if ((1321-prevy(1321))< 0, -(1321-prevy(1321)), 0) + if ((1228 -prevy(1228))< 0, -(1228 -prevy(1228)), 0) + if ((1351 -prevy(1351))< 0, -(1351 -prevy(1351)), 0) + if ((((1322 + 1216 +1363)-prevy(1322 + 1216 + 1363)))< 0, -((1322 + 1216 + 1363)-prevy(1322+ 1216 + 1363)), 0) + if ((((1272 + 1293 + 1352 - 1363) -prevy((1272 +1293 + 1352 - 1363))) - ((853) -prevy(853)))< 0, (((853) -prevy(853))- ((1272 + 1293 + 1352 - 1363) -prevy((1272 + 1293 + 1352 - 1363)))), 0) +if ((((717 + 715 - 718 - 744 - 1375) -prevy((717 + 715 - 718 - 744 - 1375)))+ 530 + (((1029 + 1171 - 1171 - 1168) -prevy(1029 + 1171 - 1171 - 1168))))>0, (((717 + 715 - 718 - 744 - 1375) -prevy((717 + 715 - 718 - 744 - 1375)))+ 530 + (((1029 + 1171 - 1171 - 1168) -prevy(1029 + 1171 - 1171 - 1168)))),0)) *100
1630 Deferred tax liability = sourcedeferredtax liab/ sourcetotal *100= (if (((904) -prevy(904))> 0, ((904) -prevy(904)), 0))/
(if ((((684 + 685 + 686 - 715 + 687 + 718) -prevy(684 + 685 + 686 - 715 + 687+ 718)))> 0, (((684 + 685 + 686 - 715 + 687 + 718) -prevy(684 + 685 + 686 -715 + 687 + 718))), 0) + if ((((694) -prevy(694)))> 0, (((694) -prevy(694))), 0) + if (((772 + 759) -prevy(772 + 759))> 0, ((772+ 759) -prevy(772 + 759)), 0) + if (((904) -prevy(904))> 0,((904) -prevy(904)), 0) + if (((1029 - 744) -prevy(1029 - 744))<0, -((1029 - 744) -prevy(1029 - 744)), 0) + if ((1181 -prevy(1181))< 0, -(1181 -prevy(1181)), 0) + if ((1180-prevy(1180))< 0, -(1180-prevy(1180)), 0) + if ((1321-prevy(1321))< 0, -(1321-prevy(1321)), 0) + if ((1228 -prevy(1228))< 0, -(1228 -prevy(1228)), 0) + if ((1351 -prevy(1351))< 0, -(1351 -prevy(1351)), 0) + if ((((1322 + 1216 +
(Continued. . . )
August 2010 Indicators
ANNUAL FINANCIAL STATEMENT : Structure of Funds Used 139
Sr.No. Indicator Fields & formula1363)-prevy(1322 + 1216 + 1363)))< 0, -((1322 + 1216 + 1363)-prevy(1322+ 1216 + 1363)), 0) + if ((((1272 + 1293 + 1352 - 1363) -prevy((1272 +1293 + 1352 - 1363))) - ((853) -prevy(853)))< 0, (((853) -prevy(853))- ((1272 + 1293 + 1352 - 1363) -prevy((1272 + 1293 + 1352 - 1363)))), 0) +if ((((717 + 715 - 718 - 744 - 1375) -prevy((717 + 715 - 718 - 744 - 1375)))+ 530 + (((1029 + 1171 - 1171 - 1168) -prevy(1029 + 1171 - 1171 - 1168))))>0, (((717 + 715 - 718 - 744 - 1375) -prevy((717 + 715 - 718 - 744 - 1375)))+ 530 + (((1029 + 1171 - 1171 - 1168) -prevy(1029 + 1171 - 1171 - 1168)))),0)) *100
1631 Gross fixed assets = sourcegrossfixed assets/ sourcetotal *100= (if (((1029 - 744) -prevy(1029 - 744))< 0, -((1029 - 744) -
prevy(1029 - 744)), 0))/ (if ((((684 + 685 + 686 - 715 + 687 + 718) -prevy(684 + 685 + 686 - 715 + 687 + 718)))> 0, (((684 + 685 + 686 - 715 +687 + 718) -prevy(684 + 685 + 686 - 715 + 687 + 718))), 0) + if ((((694)- prevy(694)))> 0, (((694) -prevy(694))), 0) + if (((772 + 759)- prevy(772 + 759))> 0, ((772 + 759) -prevy(772 + 759)), 0) +if (((904) -prevy(904))> 0, ((904) -prevy(904)), 0) +if (((1029 - 744) -prevy(1029 - 744))< 0, -((1029 - 744) -prevy(1029 - 744)), 0) + if ((1181 -prevy(1181))< 0, -(1181 -prevy(1181)), 0) + if ((1180-prevy(1180))< 0, -(1180-prevy(1180)), 0) + if ((1321-prevy(1321))< 0, -(1321-prevy(1321)), 0) + if ((1228 -prevy(1228))< 0, -(1228 -prevy(1228)), 0) + if ((1351 -prevy(1351))< 0, -(1351 -prevy(1351)), 0) + if ((((1322 + 1216 + 1363)-prevy(1322 + 1216 +1363)))< 0, -((1322 + 1216 + 1363)-prevy(1322 + 1216 + 1363)), 0) +if ((((1272 + 1293 + 1352 - 1363) -prevy((1272 + 1293 + 1352 - 1363))) -((853) -prevy(853)))< 0, (((853) -prevy(853)) - ((1272 + 1293 + 1352 -1363) -prevy((1272 + 1293 + 1352 - 1363)))), 0) + if ((((717 + 715 - 718- 744 - 1375) -prevy((717 + 715 - 718 - 744 - 1375))) + 530 + (((1029 + 1171 -1171 - 1168) -prevy(1029 + 1171 - 1171 - 1168))))> 0, (((717 + 715 - 718 -744 - 1375) -prevy((717 + 715 - 718 - 744 - 1375))) + 530 + (((1029 + 1171 -1171 - 1168) -prevy(1029 + 1171 - 1171 - 1168)))), 0)) *100
1632 Capital work-in-progress = sourcecapital wip/ sourcetotal *100= (if ((1181 -prevy(1181))< 0, -(1181 -prevy(1181)), 0))/
(if ((((684 + 685 + 686 - 715 + 687 + 718) -prevy(684 + 685 + 686 - 715 + 687+ 718)))> 0, (((684 + 685 + 686 - 715 + 687 + 718) -prevy(684 + 685 + 686 -715 + 687 + 718))), 0) + if ((((694) -prevy(694)))> 0, (((694) -prevy(694))), 0) + if (((772 + 759) -prevy(772 + 759))> 0, ((772+ 759) -prevy(772 + 759)), 0) + if (((904) -prevy(904))> 0,((904) -prevy(904)), 0) + if (((1029 - 744) -prevy(1029 - 744))<
(Continued. . . )
Indicators August 2010
140 ANNUAL FINANCIAL STATEMENT : Structure of Funds Used
Sr.No. Indicator Fields & formula0, -((1029 - 744) -prevy(1029 - 744)), 0) + if ((1181 -prevy(1181))< 0, -(1181 -prevy(1181)), 0) + if ((1180-prevy(1180))< 0, -(1180-prevy(1180)), 0) + if ((1321-prevy(1321))< 0, -(1321-prevy(1321)), 0) + if ((1228 -prevy(1228))< 0, -(1228 -prevy(1228)), 0) + if ((1351 -prevy(1351))< 0, -(1351 -prevy(1351)), 0) + if ((((1322 + 1216 +1363)-prevy(1322 + 1216 + 1363)))< 0, -((1322 + 1216 + 1363)-prevy(1322+ 1216 + 1363)), 0) + if ((((1272 + 1293 + 1352 - 1363) -prevy((1272 +1293 + 1352 - 1363))) - ((853) -prevy(853)))< 0, (((853) -prevy(853))- ((1272 + 1293 + 1352 - 1363) -prevy((1272 + 1293 + 1352 - 1363)))), 0) +if ((((717 + 715 - 718 - 744 - 1375) -prevy((717 + 715 - 718 - 744 - 1375)))+ 530 + (((1029 + 1171 - 1171 - 1168) -prevy(1029 + 1171 - 1171 - 1168))))>0, (((717 + 715 - 718 - 744 - 1375) -prevy((717 + 715 - 718 - 744 - 1375)))+ 530 + (((1029 + 1171 - 1171 - 1168) -prevy(1029 + 1171 - 1171 - 1168)))),0)) *100
1633 Net pre-operative expenses pending allocation = sourcenet preopexpenses/ sourcetotal *100= (if ((1180-prevy(1180))< 0, -(1180-prevy(1180)), 0))/
(if ((((684 + 685 + 686 - 715 + 687 + 718) -prevy(684 + 685 + 686 - 715 + 687+ 718)))> 0, (((684 + 685 + 686 - 715 + 687 + 718) -prevy(684 + 685 + 686 -715 + 687 + 718))), 0) + if ((((694) -prevy(694)))> 0, (((694) -prevy(694))), 0) + if (((772 + 759) -prevy(772 + 759))> 0, ((772+ 759) -prevy(772 + 759)), 0) + if (((904) -prevy(904))> 0,((904) -prevy(904)), 0) + if (((1029 - 744) -prevy(1029 - 744))<0, -((1029 - 744) -prevy(1029 - 744)), 0) + if ((1181 -prevy(1181))< 0, -(1181 -prevy(1181)), 0) + if ((1180-prevy(1180))< 0, -(1180-prevy(1180)), 0) + if ((1321-prevy(1321))< 0, -(1321-prevy(1321)), 0) + if ((1228 -prevy(1228))< 0, -(1228 -prevy(1228)), 0) + if ((1351 -prevy(1351))< 0, -(1351 -prevy(1351)), 0) + if ((((1322 + 1216 +1363)-prevy(1322 + 1216 + 1363)))< 0, -((1322 + 1216 + 1363)-prevy(1322+ 1216 + 1363)), 0) + if ((((1272 + 1293 + 1352 - 1363) -prevy((1272 +1293 + 1352 - 1363))) - ((853) -prevy(853)))< 0, (((853) -prevy(853))- ((1272 + 1293 + 1352 - 1363) -prevy((1272 + 1293 + 1352 - 1363)))), 0) +if ((((717 + 715 - 718 - 744 - 1375) -prevy((717 + 715 - 718 - 744 - 1375)))+ 530 + (((1029 + 1171 - 1171 - 1168) -prevy(1029 + 1171 - 1171 - 1168))))>0, (((717 + 715 - 718 - 744 - 1375) -prevy((717 + 715 - 718 - 744 - 1375)))+ 530 + (((1029 + 1171 - 1171 - 1168) -prevy(1029 + 1171 - 1171 - 1168)))),0)) *100
1634 Asset held for sale / transfer = sourceassetheld sale/ sourcetotal *100= (if ((1321-prevy(1321))< 0, -(1321-prevy(1321)), 0))/
(Continued. . . )
August 2010 Indicators
ANNUAL FINANCIAL STATEMENT : Structure of Funds Used 141
Sr.No. Indicator Fields & formula(if ((((684 + 685 + 686 - 715 + 687 + 718) -prevy(684 + 685 + 686 - 715 + 687+ 718)))> 0, (((684 + 685 + 686 - 715 + 687 + 718) -prevy(684 + 685 + 686 -715 + 687 + 718))), 0) + if ((((694) -prevy(694)))> 0, (((694) -prevy(694))), 0) + if (((772 + 759) -prevy(772 + 759))> 0, ((772+ 759) -prevy(772 + 759)), 0) + if (((904) -prevy(904))> 0,((904) -prevy(904)), 0) + if (((1029 - 744) -prevy(1029 - 744))<0, -((1029 - 744) -prevy(1029 - 744)), 0) + if ((1181 -prevy(1181))< 0, -(1181 -prevy(1181)), 0) + if ((1180-prevy(1180))< 0, -(1180-prevy(1180)), 0) + if ((1321-prevy(1321))< 0, -(1321-prevy(1321)), 0) + if ((1228 -prevy(1228))< 0, -(1228 -prevy(1228)), 0) + if ((1351 -prevy(1351))< 0, -(1351 -prevy(1351)), 0) + if ((((1322 + 1216 +1363)-prevy(1322 + 1216 + 1363)))< 0, -((1322 + 1216 + 1363)-prevy(1322+ 1216 + 1363)), 0) + if ((((1272 + 1293 + 1352 - 1363) -prevy((1272 +1293 + 1352 - 1363))) - ((853) -prevy(853)))< 0, (((853) -prevy(853))- ((1272 + 1293 + 1352 - 1363) -prevy((1272 + 1293 + 1352 - 1363)))), 0) +if ((((717 + 715 - 718 - 744 - 1375) -prevy((717 + 715 - 718 - 744 - 1375)))+ 530 + (((1029 + 1171 - 1171 - 1168) -prevy(1029 + 1171 - 1171 - 1168))))>0, (((717 + 715 - 718 - 744 - 1375) -prevy((717 + 715 - 718 - 744 - 1375)))+ 530 + (((1029 + 1171 - 1171 - 1168) -prevy(1029 + 1171 - 1171 - 1168)))),0)) *100
1635 Investments = sourceinvestments/ sourcetotal *100= (if ((1228 -prevy(1228))< 0, -(1228 -prevy(1228)), 0))/
(if ((((684 + 685 + 686 - 715 + 687 + 718) -prevy(684 + 685 + 686 - 715 + 687+ 718)))> 0, (((684 + 685 + 686 - 715 + 687 + 718) -prevy(684 + 685 + 686 -715 + 687 + 718))), 0) + if ((((694) -prevy(694)))> 0, (((694) -prevy(694))), 0) + if (((772 + 759) -prevy(772 + 759))> 0, ((772+ 759) -prevy(772 + 759)), 0) + if (((904) -prevy(904))> 0,((904) -prevy(904)), 0) + if (((1029 - 744) -prevy(1029 - 744))<0, -((1029 - 744) -prevy(1029 - 744)), 0) + if ((1181 -prevy(1181))< 0, -(1181 -prevy(1181)), 0) + if ((1180-prevy(1180))< 0, -(1180-prevy(1180)), 0) + if ((1321-prevy(1321))< 0, -(1321-prevy(1321)), 0) + if ((1228 -prevy(1228))< 0, -(1228 -prevy(1228)), 0) + if ((1351 -prevy(1351))< 0, -(1351 -prevy(1351)), 0) + if ((((1322 + 1216 +1363)-prevy(1322 + 1216 + 1363)))< 0, -((1322 + 1216 + 1363)-prevy(1322+ 1216 + 1363)), 0) + if ((((1272 + 1293 + 1352 - 1363) -prevy((1272 +1293 + 1352 - 1363))) - ((853) -prevy(853)))< 0, (((853) -prevy(853))- ((1272 + 1293 + 1352 - 1363) -prevy((1272 + 1293 + 1352 - 1363)))), 0) +if ((((717 + 715 - 718 - 744 - 1375) -prevy((717 + 715 - 718 - 744 - 1375)))
(Continued. . . )
Indicators August 2010
142 ANNUAL FINANCIAL STATEMENT : Structure of Funds Used
Sr.No. Indicator Fields & formula+ 530 + (((1029 + 1171 - 1171 - 1168) -prevy(1029 + 1171 - 1171 - 1168))))>0, (((717 + 715 - 718 - 744 - 1375) -prevy((717 + 715 - 718 - 744 - 1375)))+ 530 + (((1029 + 1171 - 1171 - 1168) -prevy(1029 + 1171 - 1171 - 1168)))),0)) *100
1636 Investment in group cos. = sourceinvest grp cos/ sourcetotal *100= (if ((((1230 + 1233 + 1237 + 1241) -prevy(1230 + 1233 + 1237 + 1241)))<
0, -(((1230 + 1233 + 1237 + 1241) -prevy(1230 + 1233 + 1237 + 1241))),0))/ (if ((((684 + 685 + 686 - 715 + 687 + 718) -prevy(684 + 685 + 686 -715 + 687 + 718)))> 0, (((684 + 685 + 686 - 715 + 687 + 718) -prevy(684 +685 + 686 - 715 + 687 + 718))), 0) + if ((((694) -prevy(694)))> 0,(((694) -prevy(694))), 0) + if (((772 + 759) -prevy(772 + 759))>0, ((772 + 759) -prevy(772 + 759)), 0) + if (((904) -prevy(904))> 0, ((904) -prevy(904)), 0) + if (((1029 - 744) -prevy(1029 -744))< 0, -((1029 - 744) -prevy(1029 - 744)), 0) + if ((1181 -prevy(1181))< 0, -(1181 -prevy(1181)), 0) + if ((1180-prevy(1180))< 0, -(1180-prevy(1180)), 0) + if ((1321-prevy(1321))< 0, -(1321-prevy(1321)), 0) + if ((1228 -prevy(1228))< 0, -(1228 -prevy(1228)), 0) + if ((1351 -prevy(1351))< 0, -(1351 -prevy(1351)), 0) + if ((((1322 + 1216 +1363)-prevy(1322 + 1216 + 1363)))< 0, -((1322 + 1216 + 1363)-prevy(1322+ 1216 + 1363)), 0) + if ((((1272 + 1293 + 1352 - 1363) -prevy((1272 +1293 + 1352 - 1363))) - ((853) -prevy(853)))< 0, (((853) -prevy(853))- ((1272 + 1293 + 1352 - 1363) -prevy((1272 + 1293 + 1352 - 1363)))), 0) +if ((((717 + 715 - 718 - 744 - 1375) -prevy((717 + 715 - 718 - 744 - 1375)))+ 530 + (((1029 + 1171 - 1171 - 1168) -prevy(1029 + 1171 - 1171 - 1168))))>0, (((717 + 715 - 718 - 744 - 1375) -prevy((717 + 715 - 718 - 744 - 1375)))+ 530 + (((1029 + 1171 - 1171 - 1168) -prevy(1029 + 1171 - 1171 - 1168)))),0)) *100
1637 Loans & advances = sourceloan advance/ sourcetotal *100= (if (((1322 + 1216 + 1363)-prevy(1322 + 1216 + 1363))< 0, -((1322 + 1216
+ 1363)-prevy(1322 + 1216 + 1363)), 0))/ (if ((((684 + 685 + 686 - 715 +687 + 718) -prevy(684 + 685 + 686 - 715 + 687 + 718)))> 0, (((684 + 685 +686 - 715 + 687 + 718) -prevy(684 + 685 + 686 - 715 + 687 + 718))), 0) +if ((((694) -prevy(694)))> 0, (((694) -prevy(694))), 0) +if (((772 + 759) -prevy(772 + 759))> 0, ((772 + 759) -prevy(772 +759)), 0) + if (((904) -prevy(904))> 0, ((904) -prevy(904)),0) + if (((1029 - 744) -prevy(1029 - 744))< 0, -((1029 - 744) -prevy(1029 - 744)), 0) + if ((1181 -prevy(1181))< 0, -(1181 -prevy(1181)), 0) + if ((1180-prevy(1180))< 0, -(1180-prevy(1180)), 0) + if ((1321-prevy(1321))< 0, -(1321-
(Continued. . . )
August 2010 Indicators
ANNUAL FINANCIAL STATEMENT : Structure of Funds Used 143
Sr.No. Indicator Fields & formulaprevy(1321)), 0) + if ((1228 -prevy(1228))< 0, -(1228 -prevy(1228)), 0) + if ((1351 -prevy(1351))< 0, -(1351 -prevy(1351)), 0) + if ((((1322 + 1216 + 1363)-prevy(1322 + 1216 +1363)))< 0, -((1322 + 1216 + 1363)-prevy(1322 + 1216 + 1363)), 0) +if ((((1272 + 1293 + 1352 - 1363) -prevy((1272 + 1293 + 1352 - 1363))) -((853) -prevy(853)))< 0, (((853) -prevy(853)) - ((1272 + 1293 + 1352 -1363) -prevy((1272 + 1293 + 1352 - 1363)))), 0) + if ((((717 + 715 - 718- 744 - 1375) -prevy((717 + 715 - 718 - 744 - 1375))) + 530 + (((1029 + 1171 -1171 - 1168) -prevy(1029 + 1171 - 1171 - 1168))))> 0, (((717 + 715 - 718 -744 - 1375) -prevy((717 + 715 - 718 - 744 - 1375))) + 530 + (((1029 + 1171 -1171 - 1168) -prevy(1029 + 1171 - 1171 - 1168)))), 0)) *100
1638 Loans & advances to group & associated cos = sourceloan advancegrp cos/ sourcetotal *100= (if (((1325) -prevy(1325))< 0, -((1325) -prevy(1325)), 0))/
(if ((((684 + 685 + 686 - 715 + 687 + 718) -prevy(684 + 685 + 686 - 715 + 687+ 718)))> 0, (((684 + 685 + 686 - 715 + 687 + 718) -prevy(684 + 685 + 686 -715 + 687 + 718))), 0) + if ((((694) -prevy(694)))> 0, (((694) -prevy(694))), 0) + if (((772 + 759) -prevy(772 + 759))> 0, ((772+ 759) -prevy(772 + 759)), 0) + if (((904) -prevy(904))> 0,((904) -prevy(904)), 0) + if (((1029 - 744) -prevy(1029 - 744))<0, -((1029 - 744) -prevy(1029 - 744)), 0) + if ((1181 -prevy(1181))< 0, -(1181 -prevy(1181)), 0) + if ((1180-prevy(1180))< 0, -(1180-prevy(1180)), 0) + if ((1321-prevy(1321))< 0, -(1321-prevy(1321)), 0) + if ((1228 -prevy(1228))< 0, -(1228 -prevy(1228)), 0) + if ((1351 -prevy(1351))< 0, -(1351 -prevy(1351)), 0) + if ((((1322 + 1216 +1363)-prevy(1322 + 1216 + 1363)))< 0, -((1322 + 1216 + 1363)-prevy(1322+ 1216 + 1363)), 0) + if ((((1272 + 1293 + 1352 - 1363) -prevy((1272 +1293 + 1352 - 1363))) - ((853) -prevy(853)))< 0, (((853) -prevy(853))- ((1272 + 1293 + 1352 - 1363) -prevy((1272 + 1293 + 1352 - 1363)))), 0) +if ((((717 + 715 - 718 - 744 - 1375) -prevy((717 + 715 - 718 - 744 - 1375)))+ 530 + (((1029 + 1171 - 1171 - 1168) -prevy(1029 + 1171 - 1171 - 1168))))>0, (((717 + 715 - 718 - 744 - 1375) -prevy((717 + 715 - 718 - 744 - 1375)))+ 530 + (((1029 + 1171 - 1171 - 1168) -prevy(1029 + 1171 - 1171 - 1168)))),0)) *100
1639 Expenses paid in advance = sourceexp paid in advance/ sourcetotal *100= (if ((1337 -prevy(1337))< 0, -(1337 -prevy(1337)), 0))/
(if ((((684 + 685 + 686 - 715 + 687 + 718) -prevy(684 + 685 + 686 - 715 + 687+ 718)))> 0, (((684 + 685 + 686 - 715 + 687 + 718) -prevy(684 + 685 + 686 -715 + 687 + 718))), 0) + if ((((694) -prevy(694)))> 0, (((694) -prevy(694))), 0) + if (((772 + 759) -prevy(772 + 759))> 0, ((772
(Continued. . . )
Indicators August 2010
144 ANNUAL FINANCIAL STATEMENT : Structure of Funds Used
Sr.No. Indicator Fields & formula+ 759) -prevy(772 + 759)), 0) + if (((904) -prevy(904))> 0,((904) -prevy(904)), 0) + if (((1029 - 744) -prevy(1029 - 744))<0, -((1029 - 744) -prevy(1029 - 744)), 0) + if ((1181 -prevy(1181))< 0, -(1181 -prevy(1181)), 0) + if ((1180-prevy(1180))< 0, -(1180-prevy(1180)), 0) + if ((1321-prevy(1321))< 0, -(1321-prevy(1321)), 0) + if ((1228 -prevy(1228))< 0, -(1228 -prevy(1228)), 0) + if ((1351 -prevy(1351))< 0, -(1351 -prevy(1351)), 0) + if ((((1322 + 1216 +1363)-prevy(1322 + 1216 + 1363)))< 0, -((1322 + 1216 + 1363)-prevy(1322+ 1216 + 1363)), 0) + if ((((1272 + 1293 + 1352 - 1363) -prevy((1272 +1293 + 1352 - 1363))) - ((853) -prevy(853)))< 0, (((853) -prevy(853))- ((1272 + 1293 + 1352 - 1363) -prevy((1272 + 1293 + 1352 - 1363)))), 0) +if ((((717 + 715 - 718 - 744 - 1375) -prevy((717 + 715 - 718 - 744 - 1375)))+ 530 + (((1029 + 1171 - 1171 - 1168) -prevy(1029 + 1171 - 1171 - 1168))))>0, (((717 + 715 - 718 - 744 - 1375) -prevy((717 + 715 - 718 - 744 - 1375)))+ 530 + (((1029 + 1171 - 1171 - 1168) -prevy(1029 + 1171 - 1171 - 1168)))),0)) *100
1640 Deferred tax assets = sourcedeferredtax assets/ sourcetotal *100= (if ((1351 -prevy(1351))< 0, -(1351 -prevy(1351)), 0))/
(if ((((684 + 685 + 686 - 715 + 687 + 718) -prevy(684 + 685 + 686 - 715 + 687+ 718)))> 0, (((684 + 685 + 686 - 715 + 687 + 718) -prevy(684 + 685 + 686 -715 + 687 + 718))), 0) + if ((((694) -prevy(694)))> 0, (((694) -prevy(694))), 0) + if (((772 + 759) -prevy(772 + 759))> 0, ((772+ 759) -prevy(772 + 759)), 0) + if (((904) -prevy(904))> 0,((904) -prevy(904)), 0) + if (((1029 - 744) -prevy(1029 - 744))<0, -((1029 - 744) -prevy(1029 - 744)), 0) + if ((1181 -prevy(1181))< 0, -(1181 -prevy(1181)), 0) + if ((1180-prevy(1180))< 0, -(1180-prevy(1180)), 0) + if ((1321-prevy(1321))< 0, -(1321-prevy(1321)), 0) + if ((1228 -prevy(1228))< 0, -(1228 -prevy(1228)), 0) + if ((1351 -prevy(1351))< 0, -(1351 -prevy(1351)), 0) + if ((((1322 + 1216 +1363)-prevy(1322 + 1216 + 1363)))< 0, -((1322 + 1216 + 1363)-prevy(1322+ 1216 + 1363)), 0) + if ((((1272 + 1293 + 1352 - 1363) -prevy((1272 +1293 + 1352 - 1363))) - ((853) -prevy(853)))< 0, (((853) -prevy(853))- ((1272 + 1293 + 1352 - 1363) -prevy((1272 + 1293 + 1352 - 1363)))), 0) +if ((((717 + 715 - 718 - 744 - 1375) -prevy((717 + 715 - 718 - 744 - 1375)))+ 530 + (((1029 + 1171 - 1171 - 1168) -prevy(1029 + 1171 - 1171 - 1168))))>0, (((717 + 715 - 718 - 744 - 1375) -prevy((717 + 715 - 718 - 744 - 1375)))+ 530 + (((1029 + 1171 - 1171 - 1168) -prevy(1029 + 1171 - 1171 - 1168)))),0)) *100
(Continued. . . )
August 2010 Indicators
ANNUAL FINANCIAL STATEMENT : Structure of Funds Used 145
Sr.No. Indicator Fields & formula1641 Total sources = sourcetotal/ sourcetotal *100
= (if ((((684 + 685 + 686 - 715 + 687 + 718) -prevy(684 + 685 + 686 - 715 + 687+ 718)))> 0, (((684 + 685 + 686 - 715 + 687 + 718) -prevy(684 + 685 + 686 -715 + 687 + 718))), 0) + if ((((694) -prevy(694)))> 0, (((694) -prevy(694))), 0) + if (((772 + 759) -prevy(772 + 759))> 0, ((772+ 759) -prevy(772 + 759)), 0) + if (((904) -prevy(904))> 0,((904) -prevy(904)), 0) + if (((1029 - 744) -prevy(1029 - 744))<0, -((1029 - 744) -prevy(1029 - 744)), 0) + if ((1181 -prevy(1181))< 0, -(1181 -prevy(1181)), 0) + if ((1180-prevy(1180))< 0, -(1180-prevy(1180)), 0) + if ((1321-prevy(1321))< 0, -(1321-prevy(1321)), 0) + if ((1228 -prevy(1228))< 0, -(1228 -prevy(1228)), 0) + if ((1351 -prevy(1351))< 0, -(1351 -prevy(1351)), 0) + if ((((1322 + 1216 +1363)-prevy(1322 + 1216 + 1363)))< 0, -((1322 + 1216 + 1363)-prevy(1322+ 1216 + 1363)), 0) + if ((((1272 + 1293 + 1352 - 1363) -prevy((1272 +1293 + 1352 - 1363))) - ((853) -prevy(853)))< 0, (((853) -prevy(853))- ((1272 + 1293 + 1352 - 1363) -prevy((1272 + 1293 + 1352 - 1363)))), 0) +if ((((717 + 715 - 718 - 744 - 1375) -prevy((717 + 715 - 718 - 744 - 1375)))+ 530 + (((1029 + 1171 - 1171 - 1168) -prevy(1029 + 1171 - 1171 - 1168))))>0, (((717 + 715 - 718 - 744 - 1375) -prevy((717 + 715 - 718 - 744 - 1375)))+ 530 + (((1029 + 1171 - 1171 - 1168) -prevy(1029 + 1171 - 1171 - 1168)))),0))/ (if ((((684 + 685 + 686 - 715 + 687 + 718) -prevy(684 + 685 + 686 -715 + 687 + 718)))> 0, (((684 + 685 + 686 - 715 + 687 + 718) -prevy(684 +685 + 686 - 715 + 687 + 718))), 0) + if ((((694) -prevy(694)))> 0,(((694) -prevy(694))), 0) + if (((772 + 759) -prevy(772 + 759))>0, ((772 + 759) -prevy(772 + 759)), 0) + if (((904) -prevy(904))> 0, ((904) -prevy(904)), 0) + if (((1029 - 744) -prevy(1029 -744))< 0, -((1029 - 744) -prevy(1029 - 744)), 0) + if ((1181 -prevy(1181))< 0, -(1181 -prevy(1181)), 0) + if ((1180-prevy(1180))< 0, -(1180-prevy(1180)), 0) + if ((1321-prevy(1321))< 0, -(1321-prevy(1321)), 0) + if ((1228 -prevy(1228))< 0, -(1228 -prevy(1228)), 0) + if ((1351 -prevy(1351))< 0, -(1351 -prevy(1351)), 0) + if ((((1322 + 1216 +1363)-prevy(1322 + 1216 + 1363)))< 0, -((1322 + 1216 + 1363)-prevy(1322+ 1216 + 1363)), 0) + if ((((1272 + 1293 + 1352 - 1363) -prevy((1272 +1293 + 1352 - 1363))) - ((853) -prevy(853)))< 0, (((853) -prevy(853))- ((1272 + 1293 + 1352 - 1363) -prevy((1272 + 1293 + 1352 - 1363)))), 0) +if ((((717 + 715 - 718 - 744 - 1375) -prevy((717 + 715 - 718 - 744 - 1375)))+ 530 + (((1029 + 1171 - 1171 - 1168) -prevy(1029 + 1171 - 1171 - 1168))))>0, (((717 + 715 - 718 - 744 - 1375) -prevy((717 + 715 - 718 - 744 - 1375)))
(Continued. . . )
Indicators August 2010
146 ANNUAL FINANCIAL STATEMENT : Structure of Funds Used
Sr.No. Indicator Fields & formula+ 530 + (((1029 + 1171 - 1171 - 1168) -prevy(1029 + 1171 - 1171 - 1168)))),0)) *100
Uses of funds1642 Increase in working capital requirement = useincr in wk cap req/ sourcetotal *100
= (if (((1272 + 1293 + (1352 - 1363)) -prevy(1272 + 1293 + (1352 - 1363))) -((853) -prevy(853))> 0, ((1272 + 1293 + (1352 - 1363)) -prevy(1272 +1293 + (1352 - 1363))) - ((853) -prevy(853)), 0))/ (if ((((684 + 685 +686 - 715 + 687 + 718) -prevy(684 + 685 + 686 - 715 + 687 + 718)))> 0,(((684 + 685 + 686 - 715 + 687 + 718) -prevy(684 + 685 + 686 - 715 + 687 +718))), 0) + if ((((694) -prevy(694)))> 0, (((694) -prevy(694))), 0) + if (((772 + 759) -prevy(772 + 759))> 0, ((772+ 759) -prevy(772 + 759)), 0) + if (((904) -prevy(904))> 0,((904) -prevy(904)), 0) + if (((1029 - 744) -prevy(1029 - 744))<0, -((1029 - 744) -prevy(1029 - 744)), 0) + if ((1181 -prevy(1181))< 0, -(1181 -prevy(1181)), 0) + if ((1180-prevy(1180))< 0, -(1180-prevy(1180)), 0) + if ((1321-prevy(1321))< 0, -(1321-prevy(1321)), 0) + if ((1228 -prevy(1228))< 0, -(1228 -prevy(1228)), 0) + if ((1351 -prevy(1351))< 0, -(1351 -prevy(1351)), 0) + if ((((1322 + 1216 +1363)-prevy(1322 + 1216 + 1363)))< 0, -((1322 + 1216 + 1363)-prevy(1322+ 1216 + 1363)), 0) + if ((((1272 + 1293 + 1352 - 1363) -prevy((1272 +1293 + 1352 - 1363))) - ((853) -prevy(853)))< 0, (((853) -prevy(853))- ((1272 + 1293 + 1352 - 1363) -prevy((1272 + 1293 + 1352 - 1363)))), 0) +if ((((717 + 715 - 718 - 744 - 1375) -prevy((717 + 715 - 718 - 744 - 1375)))+ 530 + (((1029 + 1171 - 1171 - 1168) -prevy(1029 + 1171 - 1171 - 1168))))>0, (((717 + 715 - 718 - 744 - 1375) -prevy((717 + 715 - 718 - 744 - 1375)))+ 530 + (((1029 + 1171 - 1171 - 1168) -prevy(1029 + 1171 - 1171 - 1168)))),0)) *100
1643 Funds lost in operations = usefunds lost in operations/ sourcetotal *100= (if (((717 + 715 - 718 - 744 - 1375) -prevy(717 + 715 - 718 - 744 - 1375)) +
530 + ((1029 + 1171 - 1171 - 1168) -prevy(1029 + 1171 - 1171 - 1168))< 0,-(((717 + 715 - 718 - 744 - 1375) -prevy(717 + 715 - 718 - 744 - 1375)) + 530 +((1029 + 1171 - 1171 - 1168) -prevy(1029 + 1171 - 1171 - 1168))), 0))/(if ((((684 + 685 + 686 - 715 + 687 + 718) -prevy(684 + 685 + 686 - 715 + 687+ 718)))> 0, (((684 + 685 + 686 - 715 + 687 + 718) -prevy(684 + 685 + 686 -715 + 687 + 718))), 0) + if ((((694) -prevy(694)))> 0, (((694) -prevy(694))), 0) + if (((772 + 759) -prevy(772 + 759))> 0, ((772+ 759) -prevy(772 + 759)), 0) + if (((904) -prevy(904))> 0,((904) -prevy(904)), 0) + if (((1029 - 744) -prevy(1029 - 744))<0, -((1029 - 744) -prevy(1029 - 744)), 0) + if ((1181 -
(Continued. . . )
August 2010 Indicators
ANNUAL FINANCIAL STATEMENT : Structure of Funds Used 147
Sr.No. Indicator Fields & formulaprevy(1181))< 0, -(1181 -prevy(1181)), 0) + if ((1180-prevy(1180))< 0, -(1180-prevy(1180)), 0) + if ((1321-prevy(1321))< 0, -(1321-prevy(1321)), 0) + if ((1228 -prevy(1228))< 0, -(1228 -prevy(1228)), 0) + if ((1351 -prevy(1351))< 0, -(1351 -prevy(1351)), 0) + if ((((1322 + 1216 +1363)-prevy(1322 + 1216 + 1363)))< 0, -((1322 + 1216 + 1363)-prevy(1322+ 1216 + 1363)), 0) + if ((((1272 + 1293 + 1352 - 1363) -prevy((1272 +1293 + 1352 - 1363))) - ((853) -prevy(853)))< 0, (((853) -prevy(853))- ((1272 + 1293 + 1352 - 1363) -prevy((1272 + 1293 + 1352 - 1363)))), 0) +if ((((717 + 715 - 718 - 744 - 1375) -prevy((717 + 715 - 718 - 744 - 1375)))+ 530 + (((1029 + 1171 - 1171 - 1168) -prevy(1029 + 1171 - 1171 - 1168))))>0, (((717 + 715 - 718 - 744 - 1375) -prevy((717 + 715 - 718 - 744 - 1375)))+ 530 + (((1029 + 1171 - 1171 - 1168) -prevy(1029 + 1171 - 1171 - 1168)))),0)) *100
1644 Dividend = total div/ sourcetotal *100= 530/ (if ((((684 + 685 + 686 - 715 + 687 + 718) -prevy(684 + 685 + 686 - 715
+ 687 + 718)))> 0, (((684 + 685 + 686 - 715 + 687 + 718) -prevy(684 + 685 +686 - 715 + 687 + 718))), 0) + if ((((694) -prevy(694)))> 0, (((694)- prevy(694))), 0) + if (((772 + 759) -prevy(772 + 759))> 0,((772 + 759) -prevy(772 + 759)), 0) + if (((904) -prevy(904))>0, ((904) -prevy(904)), 0) + if (((1029 - 744) -prevy(1029 -744))< 0, -((1029 - 744) -prevy(1029 - 744)), 0) + if ((1181 -prevy(1181))< 0, -(1181 -prevy(1181)), 0) + if ((1180-prevy(1180))< 0, -(1180-prevy(1180)), 0) + if ((1321-prevy(1321))< 0, -(1321-prevy(1321)), 0) + if ((1228 -prevy(1228))< 0, -(1228 -prevy(1228)), 0) + if ((1351 -prevy(1351))< 0, -(1351 -prevy(1351)), 0) + if ((((1322 + 1216 +1363)-prevy(1322 + 1216 + 1363)))< 0, -((1322 + 1216 + 1363)-prevy(1322+ 1216 + 1363)), 0) + if ((((1272 + 1293 + 1352 - 1363) -prevy((1272 +1293 + 1352 - 1363))) - ((853) -prevy(853)))< 0, (((853) -prevy(853))- ((1272 + 1293 + 1352 - 1363) -prevy((1272 + 1293 + 1352 - 1363)))), 0) +if ((((717 + 715 - 718 - 744 - 1375) -prevy((717 + 715 - 718 - 744 - 1375)))+ 530 + (((1029 + 1171 - 1171 - 1168) -prevy(1029 + 1171 - 1171 - 1168))))>0, (((717 + 715 - 718 - 744 - 1375) -prevy((717 + 715 - 718 - 744 - 1375)))+ 530 + (((1029 + 1171 - 1171 - 1168) -prevy(1029 + 1171 - 1171 - 1168)))),0)) *100
1645 Fresh capital = usefreshcapital/ sourcetotal *100= (if (((684 + 685 + 686 - 715 + 687 + 718) -prevy(684 + 685 + 686 - 715 + 687
+ 718))< 0, -((684 + 685 + 686 - 715 + 687 + 718) -prevy(684 + 685 + 686 -715 + 687 + 718)), 0))/ (if ((((684 + 685 + 686 - 715 + 687 + 718) -
(Continued. . . )
Indicators August 2010
148 ANNUAL FINANCIAL STATEMENT : Structure of Funds Used
Sr.No. Indicator Fields & formulaprevy(684 + 685 + 686 - 715 + 687 + 718)))> 0, (((684 + 685 + 686 - 715 +687 + 718) -prevy(684 + 685 + 686 - 715 + 687 + 718))), 0) + if ((((694)- prevy(694)))> 0, (((694) -prevy(694))), 0) + if (((772 + 759)- prevy(772 + 759))> 0, ((772 + 759) -prevy(772 + 759)), 0) +if (((904) -prevy(904))> 0, ((904) -prevy(904)), 0) +if (((1029 - 744) -prevy(1029 - 744))< 0, -((1029 - 744) -prevy(1029 - 744)), 0) + if ((1181 -prevy(1181))< 0, -(1181 -prevy(1181)), 0) + if ((1180-prevy(1180))< 0, -(1180-prevy(1180)), 0) + if ((1321-prevy(1321))< 0, -(1321-prevy(1321)), 0) + if ((1228 -prevy(1228))< 0, -(1228 -prevy(1228)), 0) + if ((1351 -prevy(1351))< 0, -(1351 -prevy(1351)), 0) + if ((((1322 + 1216 + 1363)-prevy(1322 + 1216 +1363)))< 0, -((1322 + 1216 + 1363)-prevy(1322 + 1216 + 1363)), 0) +if ((((1272 + 1293 + 1352 - 1363) -prevy((1272 + 1293 + 1352 - 1363))) -((853) -prevy(853)))< 0, (((853) -prevy(853)) - ((1272 + 1293 + 1352 -1363) -prevy((1272 + 1293 + 1352 - 1363)))), 0) + if ((((717 + 715 - 718- 744 - 1375) -prevy((717 + 715 - 718 - 744 - 1375))) + 530 + (((1029 + 1171 -1171 - 1168) -prevy(1029 + 1171 - 1171 - 1168))))> 0, (((717 + 715 - 718 -744 - 1375) -prevy((717 + 715 - 718 - 744 - 1375))) + 530 + (((1029 + 1171 -1171 - 1168) -prevy(1029 + 1171 - 1171 - 1168)))), 0)) *100
1646 Share premium = usesharepremium/ sourcetotal *100= (if (((718) -prevy(718))< 0, -((718) -prevy(718)), 0))/
(if ((((684 + 685 + 686 - 715 + 687 + 718) -prevy(684 + 685 + 686 - 715 + 687+ 718)))> 0, (((684 + 685 + 686 - 715 + 687 + 718) -prevy(684 + 685 + 686 -715 + 687 + 718))), 0) + if ((((694) -prevy(694)))> 0, (((694) -prevy(694))), 0) + if (((772 + 759) -prevy(772 + 759))> 0, ((772+ 759) -prevy(772 + 759)), 0) + if (((904) -prevy(904))> 0,((904) -prevy(904)), 0) + if (((1029 - 744) -prevy(1029 - 744))<0, -((1029 - 744) -prevy(1029 - 744)), 0) + if ((1181 -prevy(1181))< 0, -(1181 -prevy(1181)), 0) + if ((1180-prevy(1180))< 0, -(1180-prevy(1180)), 0) + if ((1321-prevy(1321))< 0, -(1321-prevy(1321)), 0) + if ((1228 -prevy(1228))< 0, -(1228 -prevy(1228)), 0) + if ((1351 -prevy(1351))< 0, -(1351 -prevy(1351)), 0) + if ((((1322 + 1216 +1363)-prevy(1322 + 1216 + 1363)))< 0, -((1322 + 1216 + 1363)-prevy(1322+ 1216 + 1363)), 0) + if ((((1272 + 1293 + 1352 - 1363) -prevy((1272 +1293 + 1352 - 1363))) - ((853) -prevy(853)))< 0, (((853) -prevy(853))- ((1272 + 1293 + 1352 - 1363) -prevy((1272 + 1293 + 1352 - 1363)))), 0) +if ((((717 + 715 - 718 - 744 - 1375) -prevy((717 + 715 - 718 - 744 - 1375)))+ 530 + (((1029 + 1171 - 1171 - 1168) -prevy(1029 + 1171 - 1171 - 1168))))>
(Continued. . . )
August 2010 Indicators
ANNUAL FINANCIAL STATEMENT : Structure of Funds Used 149
Sr.No. Indicator Fields & formula0, (((717 + 715 - 718 - 744 - 1375) -prevy((717 + 715 - 718 - 744 - 1375)))+ 530 + (((1029 + 1171 - 1171 - 1168) -prevy(1029 + 1171 - 1171 - 1168)))),0)) *100
1647 Convertible warrants = useconvertiblewarrants/ sourcetotal *100= (if ((694 -prevy(694))< 0, (694 -prevy(694)), 0))/
(if ((((684 + 685 + 686 - 715 + 687 + 718) -prevy(684 + 685 + 686 - 715 + 687+ 718)))> 0, (((684 + 685 + 686 - 715 + 687 + 718) -prevy(684 + 685 + 686 -715 + 687 + 718))), 0) + if ((((694) -prevy(694)))> 0, (((694) -prevy(694))), 0) + if (((772 + 759) -prevy(772 + 759))> 0, ((772+ 759) -prevy(772 + 759)), 0) + if (((904) -prevy(904))> 0,((904) -prevy(904)), 0) + if (((1029 - 744) -prevy(1029 - 744))<0, -((1029 - 744) -prevy(1029 - 744)), 0) + if ((1181 -prevy(1181))< 0, -(1181 -prevy(1181)), 0) + if ((1180-prevy(1180))< 0, -(1180-prevy(1180)), 0) + if ((1321-prevy(1321))< 0, -(1321-prevy(1321)), 0) + if ((1228 -prevy(1228))< 0, -(1228 -prevy(1228)), 0) + if ((1351 -prevy(1351))< 0, -(1351 -prevy(1351)), 0) + if ((((1322 + 1216 +1363)-prevy(1322 + 1216 + 1363)))< 0, -((1322 + 1216 + 1363)-prevy(1322+ 1216 + 1363)), 0) + if ((((1272 + 1293 + 1352 - 1363) -prevy((1272 +1293 + 1352 - 1363))) - ((853) -prevy(853)))< 0, (((853) -prevy(853))- ((1272 + 1293 + 1352 - 1363) -prevy((1272 + 1293 + 1352 - 1363)))), 0) +if ((((717 + 715 - 718 - 744 - 1375) -prevy((717 + 715 - 718 - 744 - 1375)))+ 530 + (((1029 + 1171 - 1171 - 1168) -prevy(1029 + 1171 - 1171 - 1168))))>0, (((717 + 715 - 718 - 744 - 1375) -prevy((717 + 715 - 718 - 744 - 1375)))+ 530 + (((1029 + 1171 - 1171 - 1168) -prevy(1029 + 1171 - 1171 - 1168)))),0)) *100
1648 Borrowings = useborrowings/ sourcetotal *100= (if (((772 + 759) -prevy(772 + 759))< 0, -((772 + 759) -prevy(772 +
759)), 0))/ (if ((((684 + 685 + 686 - 715 + 687 + 718) -prevy(684 + 685 +686 - 715 + 687 + 718)))> 0, (((684 + 685 + 686 - 715 + 687 + 718) -prevy(684 + 685 + 686 - 715 + 687 + 718))), 0) + if ((((694) -prevy(694)))> 0, (((694) -prevy(694))), 0) + if (((772 + 759) -prevy(772 + 759))> 0, ((772 + 759) -prevy(772 + 759)), 0) +if (((904) -prevy(904))> 0, ((904) -prevy(904)), 0) +if (((1029 - 744) -prevy(1029 - 744))< 0, -((1029 - 744) -prevy(1029 - 744)), 0) + if ((1181 -prevy(1181))< 0, -(1181 -prevy(1181)), 0) + if ((1180-prevy(1180))< 0, -(1180-prevy(1180)), 0) + if ((1321-prevy(1321))< 0, -(1321-prevy(1321)), 0) + if ((1228 -prevy(1228))< 0, -(1228 -prevy(1228)), 0) + if ((1351 -prevy(1351))< 0, -(1351 -
(Continued. . . )
Indicators August 2010
150 ANNUAL FINANCIAL STATEMENT : Structure of Funds Used
Sr.No. Indicator Fields & formulaprevy(1351)), 0) + if ((((1322 + 1216 + 1363)-prevy(1322 + 1216 +1363)))< 0, -((1322 + 1216 + 1363)-prevy(1322 + 1216 + 1363)), 0) +if ((((1272 + 1293 + 1352 - 1363) -prevy((1272 + 1293 + 1352 - 1363))) -((853) -prevy(853)))< 0, (((853) -prevy(853)) - ((1272 + 1293 + 1352 -1363) -prevy((1272 + 1293 + 1352 - 1363)))), 0) + if ((((717 + 715 - 718- 744 - 1375) -prevy((717 + 715 - 718 - 744 - 1375))) + 530 + (((1029 + 1171 -1171 - 1168) -prevy(1029 + 1171 - 1171 - 1168))))> 0, (((717 + 715 - 718 -744 - 1375) -prevy((717 + 715 - 718 - 744 - 1375))) + 530 + (((1029 + 1171 -1171 - 1168) -prevy(1029 + 1171 - 1171 - 1168)))), 0)) *100
1649 Bank/fin. inst. borrowings = usebank fin inst borr/ sourcetotal *100= (if (((774 + 813 + 777 + 816 + 784 + 817) -prevy(774 + 813 + 777 + 816 + 784
+ 817))< 0, -((774 + 813 + 777 + 816 + 784 + 817) -prevy(774 + 813 + 777 +816 + 784 + 817)), 0))/ (if ((((684 + 685 + 686 - 715 + 687 + 718) -prevy(684 + 685 + 686 - 715 + 687 + 718)))> 0, (((684 + 685 + 686 - 715 +687 + 718) -prevy(684 + 685 + 686 - 715 + 687 + 718))), 0) + if ((((694)- prevy(694)))> 0, (((694) -prevy(694))), 0) + if (((772 + 759)- prevy(772 + 759))> 0, ((772 + 759) -prevy(772 + 759)), 0) +if (((904) -prevy(904))> 0, ((904) -prevy(904)), 0) +if (((1029 - 744) -prevy(1029 - 744))< 0, -((1029 - 744) -prevy(1029 - 744)), 0) + if ((1181 -prevy(1181))< 0, -(1181 -prevy(1181)), 0) + if ((1180-prevy(1180))< 0, -(1180-prevy(1180)), 0) + if ((1321-prevy(1321))< 0, -(1321-prevy(1321)), 0) + if ((1228 -prevy(1228))< 0, -(1228 -prevy(1228)), 0) + if ((1351 -prevy(1351))< 0, -(1351 -prevy(1351)), 0) + if ((((1322 + 1216 + 1363)-prevy(1322 + 1216 +1363)))< 0, -((1322 + 1216 + 1363)-prevy(1322 + 1216 + 1363)), 0) +if ((((1272 + 1293 + 1352 - 1363) -prevy((1272 + 1293 + 1352 - 1363))) -((853) -prevy(853)))< 0, (((853) -prevy(853)) - ((1272 + 1293 + 1352 -1363) -prevy((1272 + 1293 + 1352 - 1363)))), 0) + if ((((717 + 715 - 718- 744 - 1375) -prevy((717 + 715 - 718 - 744 - 1375))) + 530 + (((1029 + 1171 -1171 - 1168) -prevy(1029 + 1171 - 1171 - 1168))))> 0, (((717 + 715 - 718 -744 - 1375) -prevy((717 + 715 - 718 - 744 - 1375))) + 530 + (((1029 + 1171 -1171 - 1168) -prevy(1029 + 1171 - 1171 - 1168)))), 0)) *100
1650 Debentures & bond = usedebentures/ sourcetotal *100= (if (((788 + 818) -prevy(788 + 818))< 0, -((788 + 818) -prevy(788 +
818)), 0))/ (if ((((684 + 685 + 686 - 715 + 687 + 718) -prevy(684 + 685 +686 - 715 + 687 + 718)))> 0, (((684 + 685 + 686 - 715 + 687 + 718) -prevy(684 + 685 + 686 - 715 + 687 + 718))), 0) + if ((((694) -prevy(694)))> 0, (((694) -prevy(694))), 0) + if (((772 + 759) -prevy(772 + 759))> 0, ((772 + 759) -prevy(772 + 759)), 0) +
(Continued. . . )
August 2010 Indicators
ANNUAL FINANCIAL STATEMENT : Structure of Funds Used 151
Sr.No. Indicator Fields & formulaif (((904) -prevy(904))> 0, ((904) -prevy(904)), 0) +if (((1029 - 744) -prevy(1029 - 744))< 0, -((1029 - 744) -prevy(1029 - 744)), 0) + if ((1181 -prevy(1181))< 0, -(1181 -prevy(1181)), 0) + if ((1180-prevy(1180))< 0, -(1180-prevy(1180)), 0) + if ((1321-prevy(1321))< 0, -(1321-prevy(1321)), 0) + if ((1228 -prevy(1228))< 0, -(1228 -prevy(1228)), 0) + if ((1351 -prevy(1351))< 0, -(1351 -prevy(1351)), 0) + if ((((1322 + 1216 + 1363)-prevy(1322 + 1216 +1363)))< 0, -((1322 + 1216 + 1363)-prevy(1322 + 1216 + 1363)), 0) +if ((((1272 + 1293 + 1352 - 1363) -prevy((1272 + 1293 + 1352 - 1363))) -((853) -prevy(853)))< 0, (((853) -prevy(853)) - ((1272 + 1293 + 1352 -1363) -prevy((1272 + 1293 + 1352 - 1363)))), 0) + if ((((717 + 715 - 718- 744 - 1375) -prevy((717 + 715 - 718 - 744 - 1375))) + 530 + (((1029 + 1171 -1171 - 1168) -prevy(1029 + 1171 - 1171 - 1168))))> 0, (((717 + 715 - 718 -744 - 1375) -prevy((717 + 715 - 718 - 744 - 1375))) + 530 + (((1029 + 1171 -1171 - 1168) -prevy(1029 + 1171 - 1171 - 1168)))), 0)) *100
1651 Borrowings from corporate bodies = useborr from corp bodies/ sourcetotal *100= (if (((801 + 830) -prevy(801 + 830))< 0, -((801 + 830) -prevy(801 +
830)), 0))/ (if ((((684 + 685 + 686 - 715 + 687 + 718) -prevy(684 + 685 +686 - 715 + 687 + 718)))> 0, (((684 + 685 + 686 - 715 + 687 + 718) -prevy(684 + 685 + 686 - 715 + 687 + 718))), 0) + if ((((694) -prevy(694)))> 0, (((694) -prevy(694))), 0) + if (((772 + 759) -prevy(772 + 759))> 0, ((772 + 759) -prevy(772 + 759)), 0) +if (((904) -prevy(904))> 0, ((904) -prevy(904)), 0) +if (((1029 - 744) -prevy(1029 - 744))< 0, -((1029 - 744) -prevy(1029 - 744)), 0) + if ((1181 -prevy(1181))< 0, -(1181 -prevy(1181)), 0) + if ((1180-prevy(1180))< 0, -(1180-prevy(1180)), 0) + if ((1321-prevy(1321))< 0, -(1321-prevy(1321)), 0) + if ((1228 -prevy(1228))< 0, -(1228 -prevy(1228)), 0) + if ((1351 -prevy(1351))< 0, -(1351 -prevy(1351)), 0) + if ((((1322 + 1216 + 1363)-prevy(1322 + 1216 +1363)))< 0, -((1322 + 1216 + 1363)-prevy(1322 + 1216 + 1363)), 0) +if ((((1272 + 1293 + 1352 - 1363) -prevy((1272 + 1293 + 1352 - 1363))) -((853) -prevy(853)))< 0, (((853) -prevy(853)) - ((1272 + 1293 + 1352 -1363) -prevy((1272 + 1293 + 1352 - 1363)))), 0) + if ((((717 + 715 - 718- 744 - 1375) -prevy((717 + 715 - 718 - 744 - 1375))) + 530 + (((1029 + 1171 -1171 - 1168) -prevy(1029 + 1171 - 1171 - 1168))))> 0, (((717 + 715 - 718 -744 - 1375) -prevy((717 + 715 - 718 - 744 - 1375))) + 530 + (((1029 + 1171 -1171 - 1168) -prevy(1029 + 1171 - 1171 - 1168)))), 0)) *100
1652 Borrowings from group/associated cos = useborr from group cos/ sourcetotal *100
(Continued. . . )
Indicators August 2010
152 ANNUAL FINANCIAL STATEMENT : Structure of Funds Used
Sr.No. Indicator Fields & formula= (if (((802 + 803 + 831 + 832) -prevy(802 + 803 + 831 + 832))< 0, -((802
+ 803 + 831 + 832) -prevy(802 + 803 + 831 + 832)), 0))/ (if ((((684 + 685+ 686 - 715 + 687 + 718) -prevy(684 + 685 + 686 - 715 + 687 + 718)))> 0,(((684 + 685 + 686 - 715 + 687 + 718) -prevy(684 + 685 + 686 - 715 + 687 +718))), 0) + if ((((694) -prevy(694)))> 0, (((694) -prevy(694))), 0) + if (((772 + 759) -prevy(772 + 759))> 0, ((772+ 759) -prevy(772 + 759)), 0) + if (((904) -prevy(904))> 0,((904) -prevy(904)), 0) + if (((1029 - 744) -prevy(1029 - 744))<0, -((1029 - 744) -prevy(1029 - 744)), 0) + if ((1181 -prevy(1181))< 0, -(1181 -prevy(1181)), 0) + if ((1180-prevy(1180))< 0, -(1180-prevy(1180)), 0) + if ((1321-prevy(1321))< 0, -(1321-prevy(1321)), 0) + if ((1228 -prevy(1228))< 0, -(1228 -prevy(1228)), 0) + if ((1351 -prevy(1351))< 0, -(1351 -prevy(1351)), 0) + if ((((1322 + 1216 +1363)-prevy(1322 + 1216 + 1363)))< 0, -((1322 + 1216 + 1363)-prevy(1322+ 1216 + 1363)), 0) + if ((((1272 + 1293 + 1352 - 1363) -prevy((1272 +1293 + 1352 - 1363))) - ((853) -prevy(853)))< 0, (((853) -prevy(853))- ((1272 + 1293 + 1352 - 1363) -prevy((1272 + 1293 + 1352 - 1363)))), 0) +if ((((717 + 715 - 718 - 744 - 1375) -prevy((717 + 715 - 718 - 744 - 1375)))+ 530 + (((1029 + 1171 - 1171 - 1168) -prevy(1029 + 1171 - 1171 - 1168))))>0, (((717 + 715 - 718 - 744 - 1375) -prevy((717 + 715 - 718 - 744 - 1375)))+ 530 + (((1029 + 1171 - 1171 - 1168) -prevy(1029 + 1171 - 1171 - 1168)))),0)) *100
1653 Foreign borrowings = useforeign borr/ sourcetotal *100= (if (((796 + 825) -prevy(796 + 825))< 0, -((796 + 825) -prevy(796 +
825)), 0))/ (if ((((684 + 685 + 686 - 715 + 687 + 718) -prevy(684 + 685 +686 - 715 + 687 + 718)))> 0, (((684 + 685 + 686 - 715 + 687 + 718) -prevy(684 + 685 + 686 - 715 + 687 + 718))), 0) + if ((((694) -prevy(694)))> 0, (((694) -prevy(694))), 0) + if (((772 + 759) -prevy(772 + 759))> 0, ((772 + 759) -prevy(772 + 759)), 0) +if (((904) -prevy(904))> 0, ((904) -prevy(904)), 0) +if (((1029 - 744) -prevy(1029 - 744))< 0, -((1029 - 744) -prevy(1029 - 744)), 0) + if ((1181 -prevy(1181))< 0, -(1181 -prevy(1181)), 0) + if ((1180-prevy(1180))< 0, -(1180-prevy(1180)), 0) + if ((1321-prevy(1321))< 0, -(1321-prevy(1321)), 0) + if ((1228 -prevy(1228))< 0, -(1228 -prevy(1228)), 0) + if ((1351 -prevy(1351))< 0, -(1351 -prevy(1351)), 0) + if ((((1322 + 1216 + 1363)-prevy(1322 + 1216 +1363)))< 0, -((1322 + 1216 + 1363)-prevy(1322 + 1216 + 1363)), 0) +if ((((1272 + 1293 + 1352 - 1363) -prevy((1272 + 1293 + 1352 - 1363))) -
(Continued. . . )
August 2010 Indicators
ANNUAL FINANCIAL STATEMENT : Structure of Funds Used 153
Sr.No. Indicator Fields & formula((853) -prevy(853)))< 0, (((853) -prevy(853)) - ((1272 + 1293 + 1352 -1363) -prevy((1272 + 1293 + 1352 - 1363)))), 0) + if ((((717 + 715 - 718- 744 - 1375) -prevy((717 + 715 - 718 - 744 - 1375))) + 530 + (((1029 + 1171 -1171 - 1168) -prevy(1029 + 1171 - 1171 - 1168))))> 0, (((717 + 715 - 718 -744 - 1375) -prevy((717 + 715 - 718 - 744 - 1375))) + 530 + (((1029 + 1171 -1171 - 1168) -prevy(1029 + 1171 - 1171 - 1168)))), 0)) *100
1654 Loan from promoters/directors = useloan from promoters/ sourcetotal *100= (if (((800 + 800) -prevy(800 + 800))< 0, -((800 + 800) -prevy(800 +
800)), 0))/ (if ((((684 + 685 + 686 - 715 + 687 + 718) -prevy(684 + 685 +686 - 715 + 687 + 718)))> 0, (((684 + 685 + 686 - 715 + 687 + 718) -prevy(684 + 685 + 686 - 715 + 687 + 718))), 0) + if ((((694) -prevy(694)))> 0, (((694) -prevy(694))), 0) + if (((772 + 759) -prevy(772 + 759))> 0, ((772 + 759) -prevy(772 + 759)), 0) +if (((904) -prevy(904))> 0, ((904) -prevy(904)), 0) +if (((1029 - 744) -prevy(1029 - 744))< 0, -((1029 - 744) -prevy(1029 - 744)), 0) + if ((1181 -prevy(1181))< 0, -(1181 -prevy(1181)), 0) + if ((1180-prevy(1180))< 0, -(1180-prevy(1180)), 0) + if ((1321-prevy(1321))< 0, -(1321-prevy(1321)), 0) + if ((1228 -prevy(1228))< 0, -(1228 -prevy(1228)), 0) + if ((1351 -prevy(1351))< 0, -(1351 -prevy(1351)), 0) + if ((((1322 + 1216 + 1363)-prevy(1322 + 1216 +1363)))< 0, -((1322 + 1216 + 1363)-prevy(1322 + 1216 + 1363)), 0) +if ((((1272 + 1293 + 1352 - 1363) -prevy((1272 + 1293 + 1352 - 1363))) -((853) -prevy(853)))< 0, (((853) -prevy(853)) - ((1272 + 1293 + 1352 -1363) -prevy((1272 + 1293 + 1352 - 1363)))), 0) + if ((((717 + 715 - 718- 744 - 1375) -prevy((717 + 715 - 718 - 744 - 1375))) + 530 + (((1029 + 1171 -1171 - 1168) -prevy(1029 + 1171 - 1171 - 1168))))> 0, (((717 + 715 - 718 -744 - 1375) -prevy((717 + 715 - 718 - 744 - 1375))) + 530 + (((1029 + 1171 -1171 - 1168) -prevy(1029 + 1171 - 1171 - 1168)))), 0)) *100
1655 Other borrowings = useotherborrowings/ sourcetotal *100= (if (((781 + 785 + 786 + 806 + 809 + 820 + 822 + 835 + 837 + 839 + 841 + 842)-
prevy(781 + 785 + 786 + 806 + 809 + 820 + 822 + 835 + 837 + 839 + 841 + 842))<
0, -((781 + 785 + 786 + 806 + 809 + 820 + 822 + 835 + 837 + 839 + 841 + 842) -prevy(781 + 785 + 786 + 806 + 809 + 820 + 822 + 835 + 837 + 839 + 841 + 842)),0))/ (if ((((684 + 685 + 686 - 715 + 687 + 718) -prevy(684 + 685 + 686 -715 + 687 + 718)))> 0, (((684 + 685 + 686 - 715 + 687 + 718) -prevy(684 +685 + 686 - 715 + 687 + 718))), 0) + if ((((694) -prevy(694)))> 0,(((694) -prevy(694))), 0) + if (((772 + 759) -prevy(772 + 759))>0, ((772 + 759) -prevy(772 + 759)), 0) + if (((904) -prevy(904))> 0, ((904) -prevy(904)), 0) + if (((1029 - 744) -prevy(1029 -
(Continued. . . )
Indicators August 2010
154 ANNUAL FINANCIAL STATEMENT : Structure of Funds Used
Sr.No. Indicator Fields & formula744))< 0, -((1029 - 744) -prevy(1029 - 744)), 0) + if ((1181 -prevy(1181))< 0, -(1181 -prevy(1181)), 0) + if ((1180-prevy(1180))< 0, -(1180-prevy(1180)), 0) + if ((1321-prevy(1321))< 0, -(1321-prevy(1321)), 0) + if ((1228 -prevy(1228))< 0, -(1228 -prevy(1228)), 0) + if ((1351 -prevy(1351))< 0, -(1351 -prevy(1351)), 0) + if ((((1322 + 1216 +1363)-prevy(1322 + 1216 + 1363)))< 0, -((1322 + 1216 + 1363)-prevy(1322+ 1216 + 1363)), 0) + if ((((1272 + 1293 + 1352 - 1363) -prevy((1272 +1293 + 1352 - 1363))) - ((853) -prevy(853)))< 0, (((853) -prevy(853))- ((1272 + 1293 + 1352 - 1363) -prevy((1272 + 1293 + 1352 - 1363)))), 0) +if ((((717 + 715 - 718 - 744 - 1375) -prevy((717 + 715 - 718 - 744 - 1375)))+ 530 + (((1029 + 1171 - 1171 - 1168) -prevy(1029 + 1171 - 1171 - 1168))))>0, (((717 + 715 - 718 - 744 - 1375) -prevy((717 + 715 - 718 - 744 - 1375)))+ 530 + (((1029 + 1171 - 1171 - 1168) -prevy(1029 + 1171 - 1171 - 1168)))),0)) *100
1656 Deferred tax liablity = usedeferredtax liab/ sourcetotal *100= (if (((904) -prevy(904))< 0, -((904) -prevy(904)), 0))/
(if ((((684 + 685 + 686 - 715 + 687 + 718) -prevy(684 + 685 + 686 - 715 + 687+ 718)))> 0, (((684 + 685 + 686 - 715 + 687 + 718) -prevy(684 + 685 + 686 -715 + 687 + 718))), 0) + if ((((694) -prevy(694)))> 0, (((694) -prevy(694))), 0) + if (((772 + 759) -prevy(772 + 759))> 0, ((772+ 759) -prevy(772 + 759)), 0) + if (((904) -prevy(904))> 0,((904) -prevy(904)), 0) + if (((1029 - 744) -prevy(1029 - 744))<0, -((1029 - 744) -prevy(1029 - 744)), 0) + if ((1181 -prevy(1181))< 0, -(1181 -prevy(1181)), 0) + if ((1180-prevy(1180))< 0, -(1180-prevy(1180)), 0) + if ((1321-prevy(1321))< 0, -(1321-prevy(1321)), 0) + if ((1228 -prevy(1228))< 0, -(1228 -prevy(1228)), 0) + if ((1351 -prevy(1351))< 0, -(1351 -prevy(1351)), 0) + if ((((1322 + 1216 +1363)-prevy(1322 + 1216 + 1363)))< 0, -((1322 + 1216 + 1363)-prevy(1322+ 1216 + 1363)), 0) + if ((((1272 + 1293 + 1352 - 1363) -prevy((1272 +1293 + 1352 - 1363))) - ((853) -prevy(853)))< 0, (((853) -prevy(853))- ((1272 + 1293 + 1352 - 1363) -prevy((1272 + 1293 + 1352 - 1363)))), 0) +if ((((717 + 715 - 718 - 744 - 1375) -prevy((717 + 715 - 718 - 744 - 1375)))+ 530 + (((1029 + 1171 - 1171 - 1168) -prevy(1029 + 1171 - 1171 - 1168))))>0, (((717 + 715 - 718 - 744 - 1375) -prevy((717 + 715 - 718 - 744 - 1375)))+ 530 + (((1029 + 1171 - 1171 - 1168) -prevy(1029 + 1171 - 1171 - 1168)))),0)) *100
1657 Gross fixed assets = usegrossfixed assets/ sourcetotal *100= (if (((1029 - 744) -prevy(1029 - 744))> 0, ((1029 - 744) -
(Continued. . . )
August 2010 Indicators
ANNUAL FINANCIAL STATEMENT : Structure of Funds Used 155
Sr.No. Indicator Fields & formulaprevy(1029 - 744)), 0))/ (if ((((684 + 685 + 686 - 715 + 687 + 718) -prevy(684 + 685 + 686 - 715 + 687 + 718)))> 0, (((684 + 685 + 686 - 715 +687 + 718) -prevy(684 + 685 + 686 - 715 + 687 + 718))), 0) + if ((((694)- prevy(694)))> 0, (((694) -prevy(694))), 0) + if (((772 + 759)- prevy(772 + 759))> 0, ((772 + 759) -prevy(772 + 759)), 0) +if (((904) -prevy(904))> 0, ((904) -prevy(904)), 0) +if (((1029 - 744) -prevy(1029 - 744))< 0, -((1029 - 744) -prevy(1029 - 744)), 0) + if ((1181 -prevy(1181))< 0, -(1181 -prevy(1181)), 0) + if ((1180-prevy(1180))< 0, -(1180-prevy(1180)), 0) + if ((1321-prevy(1321))< 0, -(1321-prevy(1321)), 0) + if ((1228 -prevy(1228))< 0, -(1228 -prevy(1228)), 0) + if ((1351 -prevy(1351))< 0, -(1351 -prevy(1351)), 0) + if ((((1322 + 1216 + 1363)-prevy(1322 + 1216 +1363)))< 0, -((1322 + 1216 + 1363)-prevy(1322 + 1216 + 1363)), 0) +if ((((1272 + 1293 + 1352 - 1363) -prevy((1272 + 1293 + 1352 - 1363))) -((853) -prevy(853)))< 0, (((853) -prevy(853)) - ((1272 + 1293 + 1352 -1363) -prevy((1272 + 1293 + 1352 - 1363)))), 0) + if ((((717 + 715 - 718- 744 - 1375) -prevy((717 + 715 - 718 - 744 - 1375))) + 530 + (((1029 + 1171 -1171 - 1168) -prevy(1029 + 1171 - 1171 - 1168))))> 0, (((717 + 715 - 718 -744 - 1375) -prevy((717 + 715 - 718 - 744 - 1375))) + 530 + (((1029 + 1171 -1171 - 1168) -prevy(1029 + 1171 - 1171 - 1168)))), 0)) *100
1658 Capital work-in-progress = usecapital wip/ sourcetotal *100= (if ((1181 -prevy(1181))> 0, (1181 -prevy(1181)), 0))/
(if ((((684 + 685 + 686 - 715 + 687 + 718) -prevy(684 + 685 + 686 - 715 + 687+ 718)))> 0, (((684 + 685 + 686 - 715 + 687 + 718) -prevy(684 + 685 + 686 -715 + 687 + 718))), 0) + if ((((694) -prevy(694)))> 0, (((694) -prevy(694))), 0) + if (((772 + 759) -prevy(772 + 759))> 0, ((772+ 759) -prevy(772 + 759)), 0) + if (((904) -prevy(904))> 0,((904) -prevy(904)), 0) + if (((1029 - 744) -prevy(1029 - 744))<0, -((1029 - 744) -prevy(1029 - 744)), 0) + if ((1181 -prevy(1181))< 0, -(1181 -prevy(1181)), 0) + if ((1180-prevy(1180))< 0, -(1180-prevy(1180)), 0) + if ((1321-prevy(1321))< 0, -(1321-prevy(1321)), 0) + if ((1228 -prevy(1228))< 0, -(1228 -prevy(1228)), 0) + if ((1351 -prevy(1351))< 0, -(1351 -prevy(1351)), 0) + if ((((1322 + 1216 +1363)-prevy(1322 + 1216 + 1363)))< 0, -((1322 + 1216 + 1363)-prevy(1322+ 1216 + 1363)), 0) + if ((((1272 + 1293 + 1352 - 1363) -prevy((1272 +1293 + 1352 - 1363))) - ((853) -prevy(853)))< 0, (((853) -prevy(853))- ((1272 + 1293 + 1352 - 1363) -prevy((1272 + 1293 + 1352 - 1363)))), 0) +if ((((717 + 715 - 718 - 744 - 1375) -prevy((717 + 715 - 718 - 744 - 1375)))
(Continued. . . )
Indicators August 2010
156 ANNUAL FINANCIAL STATEMENT : Structure of Funds Used
Sr.No. Indicator Fields & formula+ 530 + (((1029 + 1171 - 1171 - 1168) -prevy(1029 + 1171 - 1171 - 1168))))>0, (((717 + 715 - 718 - 744 - 1375) -prevy((717 + 715 - 718 - 744 - 1375)))+ 530 + (((1029 + 1171 - 1171 - 1168) -prevy(1029 + 1171 - 1171 - 1168)))),0)) *100
1659 Net pre-operative expenses pending allocation = usenet preopexpenses/ sourcetotal *100= (if ((1180-prevy(1180))> 0, (1180-prevy(1180)), 0))/
(if ((((684 + 685 + 686 - 715 + 687 + 718) -prevy(684 + 685 + 686 - 715 + 687+ 718)))> 0, (((684 + 685 + 686 - 715 + 687 + 718) -prevy(684 + 685 + 686 -715 + 687 + 718))), 0) + if ((((694) -prevy(694)))> 0, (((694) -prevy(694))), 0) + if (((772 + 759) -prevy(772 + 759))> 0, ((772+ 759) -prevy(772 + 759)), 0) + if (((904) -prevy(904))> 0,((904) -prevy(904)), 0) + if (((1029 - 744) -prevy(1029 - 744))<0, -((1029 - 744) -prevy(1029 - 744)), 0) + if ((1181 -prevy(1181))< 0, -(1181 -prevy(1181)), 0) + if ((1180-prevy(1180))< 0, -(1180-prevy(1180)), 0) + if ((1321-prevy(1321))< 0, -(1321-prevy(1321)), 0) + if ((1228 -prevy(1228))< 0, -(1228 -prevy(1228)), 0) + if ((1351 -prevy(1351))< 0, -(1351 -prevy(1351)), 0) + if ((((1322 + 1216 +1363)-prevy(1322 + 1216 + 1363)))< 0, -((1322 + 1216 + 1363)-prevy(1322+ 1216 + 1363)), 0) + if ((((1272 + 1293 + 1352 - 1363) -prevy((1272 +1293 + 1352 - 1363))) - ((853) -prevy(853)))< 0, (((853) -prevy(853))- ((1272 + 1293 + 1352 - 1363) -prevy((1272 + 1293 + 1352 - 1363)))), 0) +if ((((717 + 715 - 718 - 744 - 1375) -prevy((717 + 715 - 718 - 744 - 1375)))+ 530 + (((1029 + 1171 - 1171 - 1168) -prevy(1029 + 1171 - 1171 - 1168))))>0, (((717 + 715 - 718 - 744 - 1375) -prevy((717 + 715 - 718 - 744 - 1375)))+ 530 + (((1029 + 1171 - 1171 - 1168) -prevy(1029 + 1171 - 1171 - 1168)))),0)) *100
1660 Asset held for sale / transfer = useassetheld for sale/ sourcetotal *100= (if ((1321-prevy(1321))> 0, (1321-prevy(1321)), 0))/
(if ((((684 + 685 + 686 - 715 + 687 + 718) -prevy(684 + 685 + 686 - 715 + 687+ 718)))> 0, (((684 + 685 + 686 - 715 + 687 + 718) -prevy(684 + 685 + 686 -715 + 687 + 718))), 0) + if ((((694) -prevy(694)))> 0, (((694) -prevy(694))), 0) + if (((772 + 759) -prevy(772 + 759))> 0, ((772+ 759) -prevy(772 + 759)), 0) + if (((904) -prevy(904))> 0,((904) -prevy(904)), 0) + if (((1029 - 744) -prevy(1029 - 744))<0, -((1029 - 744) -prevy(1029 - 744)), 0) + if ((1181 -prevy(1181))< 0, -(1181 -prevy(1181)), 0) + if ((1180-prevy(1180))< 0, -(1180-prevy(1180)), 0) + if ((1321-prevy(1321))< 0, -(1321-prevy(1321)), 0) + if ((1228 -prevy(1228))< 0, -(1228 -prevy(1228)), 0) + if ((1351 -
(Continued. . . )
August 2010 Indicators
ANNUAL FINANCIAL STATEMENT : Structure of Funds Used 157
Sr.No. Indicator Fields & formulaprevy(1351))< 0, -(1351 -prevy(1351)), 0) + if ((((1322 + 1216 +1363)-prevy(1322 + 1216 + 1363)))< 0, -((1322 + 1216 + 1363)-prevy(1322+ 1216 + 1363)), 0) + if ((((1272 + 1293 + 1352 - 1363) -prevy((1272 +1293 + 1352 - 1363))) - ((853) -prevy(853)))< 0, (((853) -prevy(853))- ((1272 + 1293 + 1352 - 1363) -prevy((1272 + 1293 + 1352 - 1363)))), 0) +if ((((717 + 715 - 718 - 744 - 1375) -prevy((717 + 715 - 718 - 744 - 1375)))+ 530 + (((1029 + 1171 - 1171 - 1168) -prevy(1029 + 1171 - 1171 - 1168))))>0, (((717 + 715 - 718 - 744 - 1375) -prevy((717 + 715 - 718 - 744 - 1375)))+ 530 + (((1029 + 1171 - 1171 - 1168) -prevy(1029 + 1171 - 1171 - 1168)))),0)) *100
1661 Investments = useinvestments/ sourcetotal *100= (if ((1228 -prevy(1228))> 0, (1228 -prevy(1228)), 0))/
(if ((((684 + 685 + 686 - 715 + 687 + 718) -prevy(684 + 685 + 686 - 715 + 687+ 718)))> 0, (((684 + 685 + 686 - 715 + 687 + 718) -prevy(684 + 685 + 686 -715 + 687 + 718))), 0) + if ((((694) -prevy(694)))> 0, (((694) -prevy(694))), 0) + if (((772 + 759) -prevy(772 + 759))> 0, ((772+ 759) -prevy(772 + 759)), 0) + if (((904) -prevy(904))> 0,((904) -prevy(904)), 0) + if (((1029 - 744) -prevy(1029 - 744))<0, -((1029 - 744) -prevy(1029 - 744)), 0) + if ((1181 -prevy(1181))< 0, -(1181 -prevy(1181)), 0) + if ((1180-prevy(1180))< 0, -(1180-prevy(1180)), 0) + if ((1321-prevy(1321))< 0, -(1321-prevy(1321)), 0) + if ((1228 -prevy(1228))< 0, -(1228 -prevy(1228)), 0) + if ((1351 -prevy(1351))< 0, -(1351 -prevy(1351)), 0) + if ((((1322 + 1216 +1363)-prevy(1322 + 1216 + 1363)))< 0, -((1322 + 1216 + 1363)-prevy(1322+ 1216 + 1363)), 0) + if ((((1272 + 1293 + 1352 - 1363) -prevy((1272 +1293 + 1352 - 1363))) - ((853) -prevy(853)))< 0, (((853) -prevy(853))- ((1272 + 1293 + 1352 - 1363) -prevy((1272 + 1293 + 1352 - 1363)))), 0) +if ((((717 + 715 - 718 - 744 - 1375) -prevy((717 + 715 - 718 - 744 - 1375)))+ 530 + (((1029 + 1171 - 1171 - 1168) -prevy(1029 + 1171 - 1171 - 1168))))>0, (((717 + 715 - 718 - 744 - 1375) -prevy((717 + 715 - 718 - 744 - 1375)))+ 530 + (((1029 + 1171 - 1171 - 1168) -prevy(1029 + 1171 - 1171 - 1168)))),0)) *100
1662 Investment in group cos. = useinvest in grp cos/ sourcetotal *100= (if (((1230 + 1233 + 1237 + 1241) -prevy(1230 + 1233 + 1237 + 1241))> 0,
((1230 + 1233 + 1237 + 1241) -prevy(1230 + 1233 + 1237 + 1241)), 0))/(if ((((684 + 685 + 686 - 715 + 687 + 718) -prevy(684 + 685 + 686 - 715 + 687+ 718)))> 0, (((684 + 685 + 686 - 715 + 687 + 718) -prevy(684 + 685 + 686 -715 + 687 + 718))), 0) + if ((((694) -prevy(694)))> 0, (((694) -prevy(694))), 0) + if (((772 + 759) -prevy(772 + 759))> 0, ((772
(Continued. . . )
Indicators August 2010
158 ANNUAL FINANCIAL STATEMENT : Structure of Funds Used
Sr.No. Indicator Fields & formula+ 759) -prevy(772 + 759)), 0) + if (((904) -prevy(904))> 0,((904) -prevy(904)), 0) + if (((1029 - 744) -prevy(1029 - 744))<0, -((1029 - 744) -prevy(1029 - 744)), 0) + if ((1181 -prevy(1181))< 0, -(1181 -prevy(1181)), 0) + if ((1180-prevy(1180))< 0, -(1180-prevy(1180)), 0) + if ((1321-prevy(1321))< 0, -(1321-prevy(1321)), 0) + if ((1228 -prevy(1228))< 0, -(1228 -prevy(1228)), 0) + if ((1351 -prevy(1351))< 0, -(1351 -prevy(1351)), 0) + if ((((1322 + 1216 +1363)-prevy(1322 + 1216 + 1363)))< 0, -((1322 + 1216 + 1363)-prevy(1322+ 1216 + 1363)), 0) + if ((((1272 + 1293 + 1352 - 1363) -prevy((1272 +1293 + 1352 - 1363))) - ((853) -prevy(853)))< 0, (((853) -prevy(853))- ((1272 + 1293 + 1352 - 1363) -prevy((1272 + 1293 + 1352 - 1363)))), 0) +if ((((717 + 715 - 718 - 744 - 1375) -prevy((717 + 715 - 718 - 744 - 1375)))+ 530 + (((1029 + 1171 - 1171 - 1168) -prevy(1029 + 1171 - 1171 - 1168))))>0, (((717 + 715 - 718 - 744 - 1375) -prevy((717 + 715 - 718 - 744 - 1375)))+ 530 + (((1029 + 1171 - 1171 - 1168) -prevy(1029 + 1171 - 1171 - 1168)))),0)) *100
1663 Loans & advances = useloan advance/ sourcetotal *100= (if (((1322 + 1216 + 1363) -prevy((1322 + 1216 + 1363)))> 0, ((1322 +
1216 + 1363) -prevy((1322 + 1216 + 1363))), 0))/ (if ((((684 + 685 + 686- 715 + 687 + 718) -prevy(684 + 685 + 686 - 715 + 687 + 718)))> 0, (((684 +685 + 686 - 715 + 687 + 718) -prevy(684 + 685 + 686 - 715 + 687 + 718))), 0)+ if ((((694) -prevy(694)))> 0, (((694) -prevy(694))), 0) +if (((772 + 759) -prevy(772 + 759))> 0, ((772 + 759) -prevy(772 +759)), 0) + if (((904) -prevy(904))> 0, ((904) -prevy(904)),0) + if (((1029 - 744) -prevy(1029 - 744))< 0, -((1029 - 744) -prevy(1029 - 744)), 0) + if ((1181 -prevy(1181))< 0, -(1181 -prevy(1181)), 0) + if ((1180-prevy(1180))< 0, -(1180-prevy(1180)), 0) + if ((1321-prevy(1321))< 0, -(1321-prevy(1321)), 0) + if ((1228 -prevy(1228))< 0, -(1228 -prevy(1228)), 0) + if ((1351 -prevy(1351))< 0, -(1351 -prevy(1351)), 0) + if ((((1322 + 1216 + 1363)-prevy(1322 + 1216 +1363)))< 0, -((1322 + 1216 + 1363)-prevy(1322 + 1216 + 1363)), 0) +if ((((1272 + 1293 + 1352 - 1363) -prevy((1272 + 1293 + 1352 - 1363))) -((853) -prevy(853)))< 0, (((853) -prevy(853)) - ((1272 + 1293 + 1352 -1363) -prevy((1272 + 1293 + 1352 - 1363)))), 0) + if ((((717 + 715 - 718- 744 - 1375) -prevy((717 + 715 - 718 - 744 - 1375))) + 530 + (((1029 + 1171 -1171 - 1168) -prevy(1029 + 1171 - 1171 - 1168))))> 0, (((717 + 715 - 718 -744 - 1375) -prevy((717 + 715 - 718 - 744 - 1375))) + 530 + (((1029 + 1171 -1171 - 1168) -prevy(1029 + 1171 - 1171 - 1168)))), 0)) *100
(Continued. . . )
August 2010 Indicators
ANNUAL FINANCIAL STATEMENT : Structure of Funds Used 159
Sr.No. Indicator Fields & formula1664 Loans & advances to group & associated cos = useloan advancegrp cos/ sourcetotal *100
= (if (((1325) -prevy(1325))> 0, ((1325) -prevy(1325)), 0))/(if ((((684 + 685 + 686 - 715 + 687 + 718) -prevy(684 + 685 + 686 - 715 + 687+ 718)))> 0, (((684 + 685 + 686 - 715 + 687 + 718) -prevy(684 + 685 + 686 -715 + 687 + 718))), 0) + if ((((694) -prevy(694)))> 0, (((694) -prevy(694))), 0) + if (((772 + 759) -prevy(772 + 759))> 0, ((772+ 759) -prevy(772 + 759)), 0) + if (((904) -prevy(904))> 0,((904) -prevy(904)), 0) + if (((1029 - 744) -prevy(1029 - 744))<0, -((1029 - 744) -prevy(1029 - 744)), 0) + if ((1181 -prevy(1181))< 0, -(1181 -prevy(1181)), 0) + if ((1180-prevy(1180))< 0, -(1180-prevy(1180)), 0) + if ((1321-prevy(1321))< 0, -(1321-prevy(1321)), 0) + if ((1228 -prevy(1228))< 0, -(1228 -prevy(1228)), 0) + if ((1351 -prevy(1351))< 0, -(1351 -prevy(1351)), 0) + if ((((1322 + 1216 +1363)-prevy(1322 + 1216 + 1363)))< 0, -((1322 + 1216 + 1363)-prevy(1322+ 1216 + 1363)), 0) + if ((((1272 + 1293 + 1352 - 1363) -prevy((1272 +1293 + 1352 - 1363))) - ((853) -prevy(853)))< 0, (((853) -prevy(853))- ((1272 + 1293 + 1352 - 1363) -prevy((1272 + 1293 + 1352 - 1363)))), 0) +if ((((717 + 715 - 718 - 744 - 1375) -prevy((717 + 715 - 718 - 744 - 1375)))+ 530 + (((1029 + 1171 - 1171 - 1168) -prevy(1029 + 1171 - 1171 - 1168))))>0, (((717 + 715 - 718 - 744 - 1375) -prevy((717 + 715 - 718 - 744 - 1375)))+ 530 + (((1029 + 1171 - 1171 - 1168) -prevy(1029 + 1171 - 1171 - 1168)))),0)) *100
1665 Expenses paid in advance = useexpensespaid in adv/ sourcetotal *100= (if ((1337 -prevy(1337))> 0, (1337 -prevy(1337)), 0))/
(if ((((684 + 685 + 686 - 715 + 687 + 718) -prevy(684 + 685 + 686 - 715 + 687+ 718)))> 0, (((684 + 685 + 686 - 715 + 687 + 718) -prevy(684 + 685 + 686 -715 + 687 + 718))), 0) + if ((((694) -prevy(694)))> 0, (((694) -prevy(694))), 0) + if (((772 + 759) -prevy(772 + 759))> 0, ((772+ 759) -prevy(772 + 759)), 0) + if (((904) -prevy(904))> 0,((904) -prevy(904)), 0) + if (((1029 - 744) -prevy(1029 - 744))<0, -((1029 - 744) -prevy(1029 - 744)), 0) + if ((1181 -prevy(1181))< 0, -(1181 -prevy(1181)), 0) + if ((1180-prevy(1180))< 0, -(1180-prevy(1180)), 0) + if ((1321-prevy(1321))< 0, -(1321-prevy(1321)), 0) + if ((1228 -prevy(1228))< 0, -(1228 -prevy(1228)), 0) + if ((1351 -prevy(1351))< 0, -(1351 -prevy(1351)), 0) + if ((((1322 + 1216 +1363)-prevy(1322 + 1216 + 1363)))< 0, -((1322 + 1216 + 1363)-prevy(1322+ 1216 + 1363)), 0) + if ((((1272 + 1293 + 1352 - 1363) -prevy((1272 +1293 + 1352 - 1363))) - ((853) -prevy(853)))< 0, (((853) -prevy(853))
(Continued. . . )
Indicators August 2010
160 ANNUAL FINANCIAL STATEMENT : Structure of Funds Used
Sr.No. Indicator Fields & formula- ((1272 + 1293 + 1352 - 1363) -prevy((1272 + 1293 + 1352 - 1363)))), 0) +if ((((717 + 715 - 718 - 744 - 1375) -prevy((717 + 715 - 718 - 744 - 1375)))+ 530 + (((1029 + 1171 - 1171 - 1168) -prevy(1029 + 1171 - 1171 - 1168))))>0, (((717 + 715 - 718 - 744 - 1375) -prevy((717 + 715 - 718 - 744 - 1375)))+ 530 + (((1029 + 1171 - 1171 - 1168) -prevy(1029 + 1171 - 1171 - 1168)))),0)) *100
1666 Deferred tax assets = usedeferredtax assets/ sourcetotal *100= (if ((1351 -prevy(1351))> 0, (1351 -prevy(1351)), 0))/
(if ((((684 + 685 + 686 - 715 + 687 + 718) -prevy(684 + 685 + 686 - 715 + 687+ 718)))> 0, (((684 + 685 + 686 - 715 + 687 + 718) -prevy(684 + 685 + 686 -715 + 687 + 718))), 0) + if ((((694) -prevy(694)))> 0, (((694) -prevy(694))), 0) + if (((772 + 759) -prevy(772 + 759))> 0, ((772+ 759) -prevy(772 + 759)), 0) + if (((904) -prevy(904))> 0,((904) -prevy(904)), 0) + if (((1029 - 744) -prevy(1029 - 744))<0, -((1029 - 744) -prevy(1029 - 744)), 0) + if ((1181 -prevy(1181))< 0, -(1181 -prevy(1181)), 0) + if ((1180-prevy(1180))< 0, -(1180-prevy(1180)), 0) + if ((1321-prevy(1321))< 0, -(1321-prevy(1321)), 0) + if ((1228 -prevy(1228))< 0, -(1228 -prevy(1228)), 0) + if ((1351 -prevy(1351))< 0, -(1351 -prevy(1351)), 0) + if ((((1322 + 1216 +1363)-prevy(1322 + 1216 + 1363)))< 0, -((1322 + 1216 + 1363)-prevy(1322+ 1216 + 1363)), 0) + if ((((1272 + 1293 + 1352 - 1363) -prevy((1272 +1293 + 1352 - 1363))) - ((853) -prevy(853)))< 0, (((853) -prevy(853))- ((1272 + 1293 + 1352 - 1363) -prevy((1272 + 1293 + 1352 - 1363)))), 0) +if ((((717 + 715 - 718 - 744 - 1375) -prevy((717 + 715 - 718 - 744 - 1375)))+ 530 + (((1029 + 1171 - 1171 - 1168) -prevy(1029 + 1171 - 1171 - 1168))))>0, (((717 + 715 - 718 - 744 - 1375) -prevy((717 + 715 - 718 - 744 - 1375)))+ 530 + (((1029 + 1171 - 1171 - 1168) -prevy(1029 + 1171 - 1171 - 1168)))),0)) *100
1667 Total uses = usetotal/ sourcetotal *100= ((if (((684 + 685 + 686 - 715 + 687 + 718) -prevy(684 + 685 + 686 - 715 + 687
+ 718))< 0, -((684 + 685 + 686 - 715 + 687 + 718) -prevy(684 + 685 + 686 -715 + 687 + 718)), 0) + if ((694 -prevy(694))< 0, (694 -prevy(694)), 0) + if (((772 + 759) -prevy(772 + 759))< 0, -((772+ 759) -prevy(772 + 759)), 0) + if (((904) -prevy(904))< 0,-((904) -prevy(904)), 0) + if (((1029 - 744) -prevy(1029 - 744))>0, ((1029 - 744) -prevy(1029 - 744)), 0) + if ((1181 -prevy(1181))> 0, (1181 -prevy(1181)), 0) + if ((1180-prevy(1180))> 0, (1180-prevy(1180)), 0) + if ((1321-prevy(1321))> 0, (1321-prevy(1321)), 0) + if ((1228 -
(Continued. . . )
August 2010 Indicators
ANNUAL FINANCIAL STATEMENT : Structure of Funds Used 161
Sr.No. Indicator Fields & formulaprevy(1228))> 0, (1228 -prevy(1228)), 0) + if ((1351 -prevy(1351))> 0, (1351 -prevy(1351)), 0) + 530 +if (((1322 +1216 + 1363) -prevy((1322 + 1216 + 1363)))> 0, ((1322 + 1216 + 1363) -prevy((1322 + 1216 + 1363))), 0) + if (((1272 + 1293 + (1352 - 1363)) -prevy(1272 + 1293 + (1352 - 1363))) - ((853) -prevy(853))> 0, ((1272 +1293 + (1352 - 1363)) -prevy(1272 + 1293 + (1352 - 1363))) - ((853) -prevy(853)), 0) + if (((717 + 715 - 718 - 744 - 1375) -prevy(717 +715 - 718 - 744 - 1375)) + 530 + ((1029 + 1171 - 1171 - 1168) -prevy(1029 + 1171- 1171 - 1168))< 0, -(((717 + 715 - 718 - 744 - 1375) -prevy(717 + 715 -718 - 744 - 1375)) + 530 + ((1029 + 1171 - 1171 - 1168) -prevy(1029 + 1171 -1171 - 1168))), 0)))/ (if ((((684 + 685 + 686 - 715 + 687 + 718) -prevy(684 + 685 + 686 - 715 + 687 + 718)))> 0, (((684 + 685 + 686 - 715 +687 + 718) -prevy(684 + 685 + 686 - 715 + 687 + 718))), 0) + if ((((694)- prevy(694)))> 0, (((694) -prevy(694))), 0) + if (((772 + 759)- prevy(772 + 759))> 0, ((772 + 759) -prevy(772 + 759)), 0) +if (((904) -prevy(904))> 0, ((904) -prevy(904)), 0) +if (((1029 - 744) -prevy(1029 - 744))< 0, -((1029 - 744) -prevy(1029 - 744)), 0) + if ((1181 -prevy(1181))< 0, -(1181 -prevy(1181)), 0) + if ((1180-prevy(1180))< 0, -(1180-prevy(1180)), 0) + if ((1321-prevy(1321))< 0, -(1321-prevy(1321)), 0) + if ((1228 -prevy(1228))< 0, -(1228 -prevy(1228)), 0) + if ((1351 -prevy(1351))< 0, -(1351 -prevy(1351)), 0) + if ((((1322 + 1216 + 1363)-prevy(1322 + 1216 +1363)))< 0, -((1322 + 1216 + 1363)-prevy(1322 + 1216 + 1363)), 0) +if ((((1272 + 1293 + 1352 - 1363) -prevy((1272 + 1293 + 1352 - 1363))) -((853) -prevy(853)))< 0, (((853) -prevy(853)) - ((1272 + 1293 + 1352 -1363) -prevy((1272 + 1293 + 1352 - 1363)))), 0) + if ((((717 + 715 - 718- 744 - 1375) -prevy((717 + 715 - 718 - 744 - 1375))) + 530 + (((1029 + 1171 -1171 - 1168) -prevy(1029 + 1171 - 1171 - 1168))))> 0, (((717 + 715 - 718 -744 - 1375) -prevy((717 + 715 - 718 - 744 - 1375))) + 530 + (((1029 + 1171 -1171 - 1168) -prevy(1029 + 1171 - 1171 - 1168)))), 0)) *100
Indicators August 2010
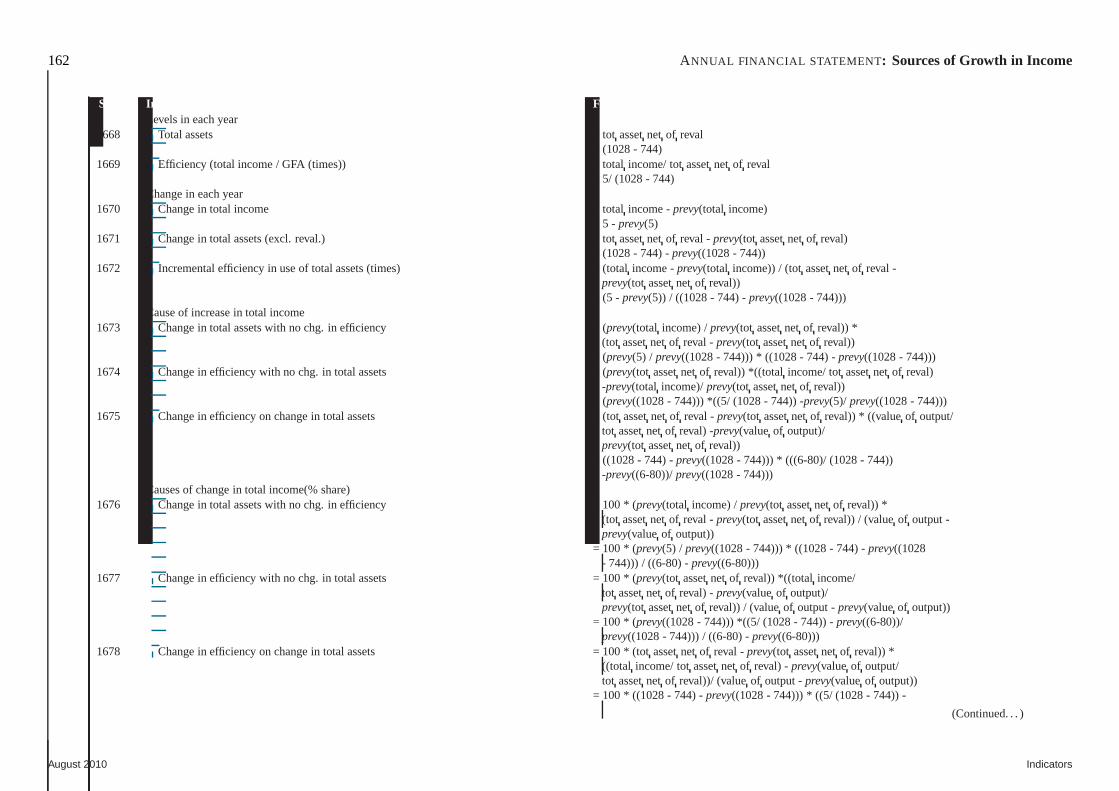
162 ANNUAL FINANCIAL STATEMENT : Sources of Growth in Income
Sr.No. Indicator Fields & formulaLevels in each year
1668 Total assets = tot assetnet of reval= (1028 - 744)
1669 Efficiency (total income / GFA (times)) = total income/ totassetnet of reval= 5/ (1028 - 744)
Change in each year1670 Change in total income = total income -prevy(total income)
= 5 - prevy(5)1671 Change in total assets (excl. reval.) = tot assetnet of reval -prevy(tot assetnet of reval)
= (1028 - 744) -prevy((1028 - 744))1672 Incremental efficiency in use of total assets (times) = (total income -prevy(total income)) / (totassetnet of reval -
prevy(tot assetnet of reval))= (5 - prevy(5)) / ((1028 - 744) -prevy((1028 - 744)))
Cause of increase in total income1673 Change in total assets with no chg. in efficiency = (prevy(total income) /prevy(tot assetnet of reval)) *
(tot assetnet of reval -prevy(tot assetnet of reval))= (prevy(5) / prevy((1028 - 744))) * ((1028 - 744) -prevy((1028 - 744)))
1674 Change in efficiency with no chg. in total assets = (prevy(tot assetnet of reval)) *((total income/ totassetnet of reval)-prevy(total income)/prevy(tot assetnet of reval))
= (prevy((1028 - 744))) *((5/ (1028 - 744)) -prevy(5)/ prevy((1028 - 744)))1675 Change in efficiency on change in total assets = (tot assetnet of reval -prevy(tot assetnet of reval)) * ((valueof output/
tot assetnet of reval) -prevy(value of output)/prevy(tot assetnet of reval))
= ((1028 - 744) -prevy((1028 - 744))) * (((6-80)/ (1028 - 744))-prevy((6-80))/prevy((1028 - 744)))
Causes of change in total income(% share)1676 Change in total assets with no chg. in efficiency = 100* (prevy(total income) /prevy(tot assetnet of reval)) *
(tot assetnet of reval -prevy(tot assetnet of reval)) / (valueof output -prevy(value of output))
= 100* (prevy(5) / prevy((1028 - 744))) * ((1028 - 744) -prevy((1028- 744))) / ((6-80) -prevy((6-80)))
1677 Change in efficiency with no chg. in total assets = 100* (prevy(tot assetnet of reval)) *((total income/tot assetnet of reval) -prevy(value of output)/prevy(tot assetnet of reval)) / (valueof output -prevy(value of output))
= 100* (prevy((1028 - 744))) *((5/ (1028 - 744)) -prevy((6-80))/prevy((1028 - 744))) / ((6-80) -prevy((6-80)))
1678 Change in efficiency on change in total assets = 100* (tot assetnet of reval -prevy(tot assetnet of reval)) *((total income/ totassetnet of reval) -prevy(value of output/tot assetnet of reval))/ (valueof output -prevy(value of output))
= 100* ((1028 - 744) -prevy((1028 - 744))) * ((5/ (1028 - 744)) -
(Continued. . . )
August 2010 Indicators
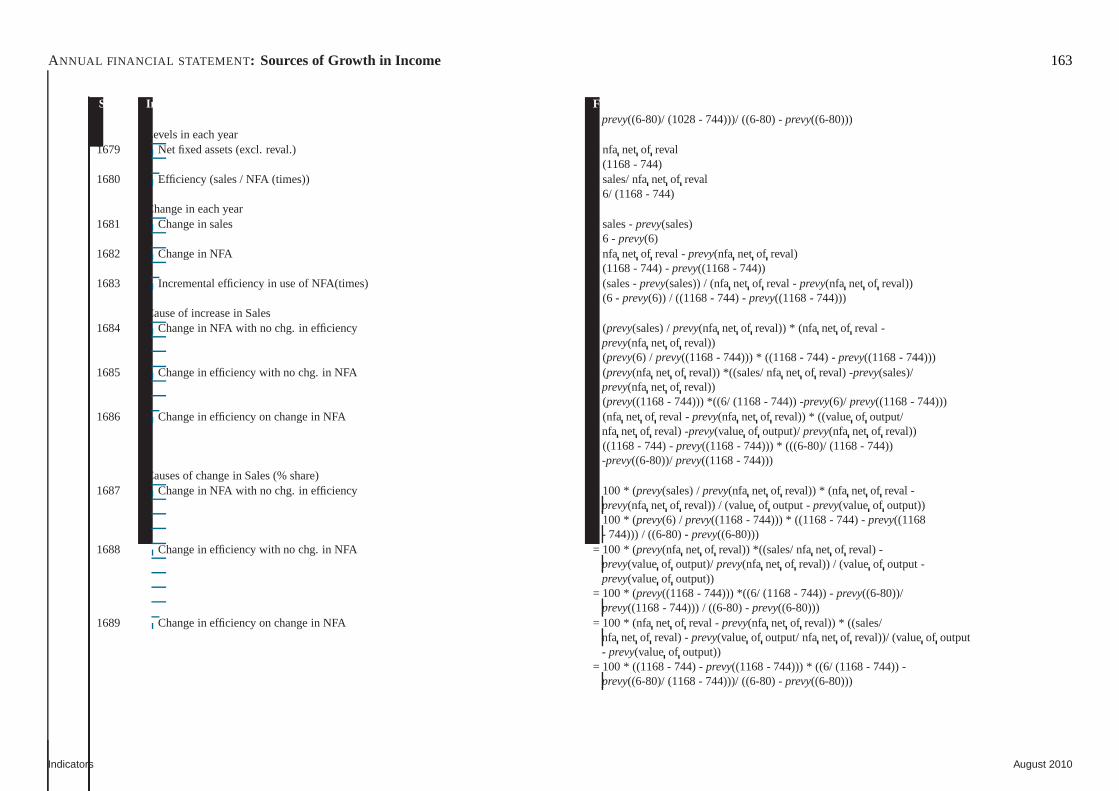
ANNUAL FINANCIAL STATEMENT : Sources of Growth in Income 163
Sr.No. Indicator Fields & formulaprevy((6-80)/ (1028 - 744)))/ ((6-80) -prevy((6-80)))
Levels in each year1679 Net fixed assets (excl. reval.) = nfa net of reval
= (1168 - 744)1680 Efficiency (sales / NFA (times)) = sales/ nfanet of reval
= 6/ (1168 - 744)Change in each year
1681 Change in sales = sales -prevy(sales)= 6 - prevy(6)
1682 Change in NFA = nfa net of reval -prevy(nfa net of reval)= (1168 - 744) -prevy((1168 - 744))
1683 Incremental efficiency in use of NFA(times) = (sales -prevy(sales)) / (nfanet of reval -prevy(nfa net of reval))= (6 - prevy(6)) / ((1168 - 744) -prevy((1168 - 744)))
Cause of increase in Sales1684 Change in NFA with no chg. in efficiency = (prevy(sales) /prevy(nfa net of reval)) * (nfa net of reval -
prevy(nfa net of reval))= (prevy(6) / prevy((1168 - 744))) * ((1168 - 744) -prevy((1168 - 744)))
1685 Change in efficiency with no chg. in NFA = (prevy(nfa net of reval)) *((sales/ nfanet of reval) -prevy(sales)/prevy(nfa net of reval))
= (prevy((1168 - 744))) *((6/ (1168 - 744)) -prevy(6)/ prevy((1168 - 744)))1686 Change in efficiency on change in NFA = (nfa net of reval -prevy(nfa net of reval)) * ((valueof output/
nfa net of reval) -prevy(value of output)/prevy(nfa net of reval))= ((1168 - 744) -prevy((1168 - 744))) * (((6-80)/ (1168 - 744))
-prevy((6-80))/prevy((1168 - 744)))Causes of change in Sales (% share)
1687 Change in NFA with no chg. in efficiency = 100* (prevy(sales) /prevy(nfa net of reval)) * (nfa net of reval -prevy(nfa net of reval)) / (valueof output -prevy(value of output))
= 100* (prevy(6) / prevy((1168 - 744))) * ((1168 - 744) -prevy((1168- 744))) / ((6-80) -prevy((6-80)))
1688 Change in efficiency with no chg. in NFA = 100* (prevy(nfa net of reval)) *((sales/ nfanet of reval) -prevy(value of output)/prevy(nfa net of reval)) / (valueof output -prevy(value of output))
= 100* (prevy((1168 - 744))) *((6/ (1168 - 744)) -prevy((6-80))/prevy((1168 - 744))) / ((6-80) -prevy((6-80)))
1689 Change in efficiency on change in NFA = 100* (nfa net of reval -prevy(nfa net of reval)) * ((sales/nfa net of reval) -prevy(value of output/ nfanet of reval))/ (valueof output- prevy(value of output))
= 100* ((1168 - 744) -prevy((1168 - 744))) * ((6/ (1168 - 744)) -prevy((6-80)/ (1168 - 744)))/ ((6-80) -prevy((6-80)))
Indicators August 2010
164 ANNUAL FINANCIAL STATEMENT : Sources of Growth in Income
August 2010 Indicators
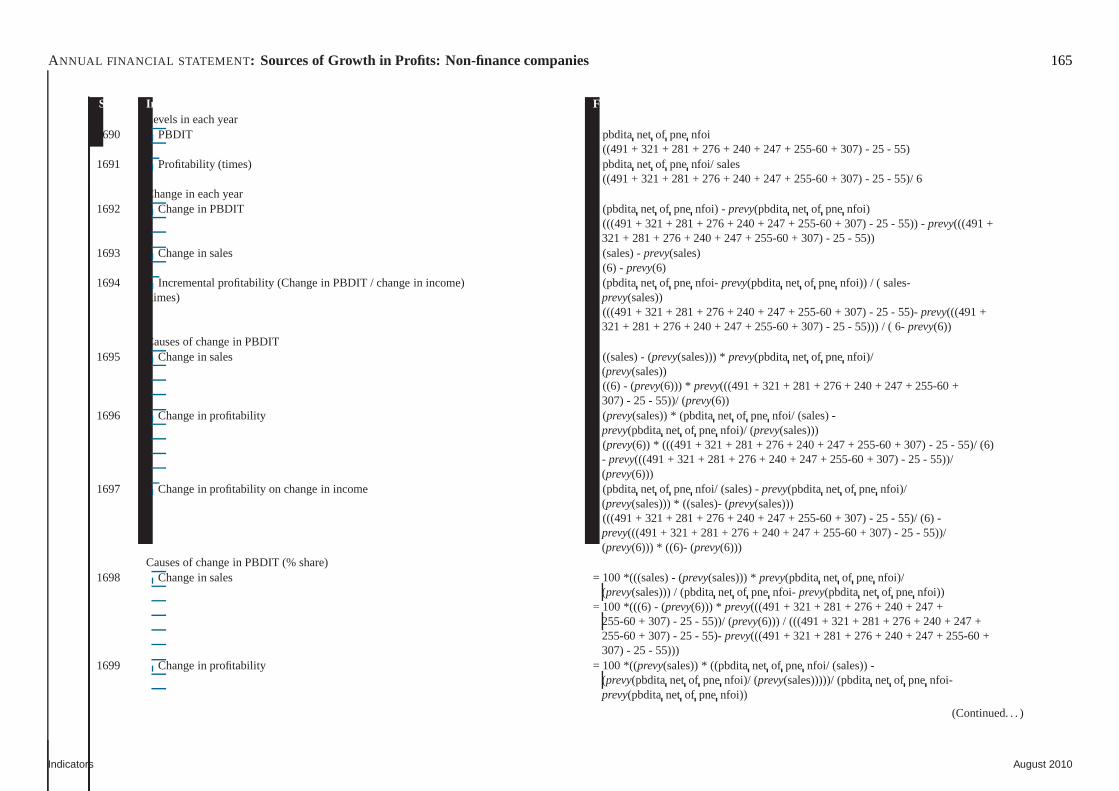
ANNUAL FINANCIAL STATEMENT : Sources of Growth in Profits: Non-finance companies 165
Sr.No. Indicator Fields & formulaLevels in each year
1690 PBDIT = pbditanet of pne nfoi= ((491 + 321 + 281 + 276 + 240 + 247 + 255-60 + 307) - 25 - 55)
1691 Profitability (times) = pbditanet of pne nfoi/ sales= ((491 + 321 + 281 + 276 + 240 + 247 + 255-60 + 307) - 25 - 55)/ 6
Change in each year1692 Change in PBDIT = (pbditanet of pne nfoi) - prevy(pbdita net of pnenfoi)
= (((491 + 321 + 281 + 276 + 240 + 247 + 255-60 + 307) - 25 - 55)) -prevy(((491 +321 + 281 + 276 + 240 + 247 + 255-60 + 307) - 25 - 55))
1693 Change in sales = (sales) -prevy(sales)= (6) - prevy(6)
1694 Incremental profitability (Change in PBDIT / change in income) = (pbditanet of pne nfoi- prevy(pbdita net of pne nfoi)) / ( sales-(times) prevy(sales))
= (((491 + 321 + 281 + 276 + 240 + 247 + 255-60 + 307) - 25 - 55)-prevy(((491 +321 + 281 + 276 + 240 + 247 + 255-60 + 307) - 25 - 55))) / ( 6-prevy(6))
Causes of change in PBDIT1695 Change in sales = ((sales) - (prevy(sales))) *prevy(pbdita net of pne nfoi)/
(prevy(sales))= ((6) - (prevy(6))) * prevy(((491 + 321 + 281 + 276 + 240 + 247 + 255-60 +
307) - 25 - 55))/ (prevy(6))1696 Change in profitability = (prevy(sales)) * (pbditanet of pne nfoi/ (sales) -
prevy(pbdita net of pnenfoi)/ (prevy(sales)))= (prevy(6)) * (((491 + 321 + 281 + 276 + 240 + 247 + 255-60 + 307) - 25 - 55)/(6)
- prevy(((491 + 321 + 281 + 276 + 240 + 247 + 255-60 + 307) - 25 - 55))/(prevy(6)))
1697 Change in profitability on change in income = (pbditanet of pne nfoi/ (sales) -prevy(pbdita net of pne nfoi)/(prevy(sales))) * ((sales)- (prevy(sales)))
= (((491 + 321 + 281 + 276 + 240 + 247 + 255-60 + 307) - 25 - 55)/ (6) -prevy(((491 + 321 + 281 + 276 + 240 + 247 + 255-60 + 307) - 25 - 55))/(prevy(6))) * ((6)- (prevy(6)))
Causes of change in PBDIT (% share)1698 Change in sales = 100*(((sales) - (prevy(sales))) *prevy(pbdita net of pne nfoi)/
(prevy(sales))) / (pbditanet of pne nfoi- prevy(pbdita net of pne nfoi))= 100*(((6) - (prevy(6))) * prevy(((491 + 321 + 281 + 276 + 240 + 247 +
255-60 + 307) - 25 - 55))/ (prevy(6))) / (((491 + 321 + 281 + 276 + 240 + 247 +255-60 + 307) - 25 - 55)-prevy(((491 + 321 + 281 + 276 + 240 + 247 + 255-60 +307) - 25 - 55)))
1699 Change in profitability = 100*((prevy(sales)) * ((pbditanet of pne nfoi/ (sales)) -(prevy(pbdita net of pnenfoi)/ (prevy(sales)))))/ (pbditanet of pne nfoi-prevy(pbdita net of pnenfoi))
(Continued. . . )
Indicators August 2010
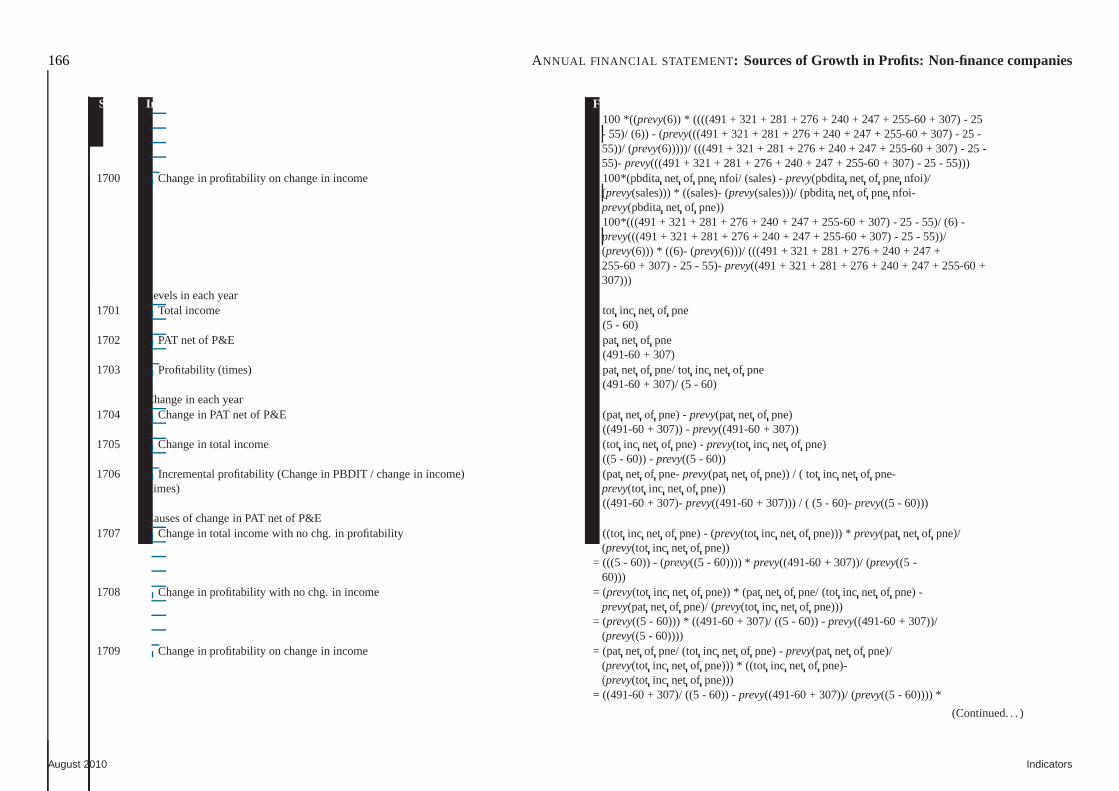
166 ANNUAL FINANCIAL STATEMENT : Sources of Growth in Profits: Non-finance companies
Sr.No. Indicator Fields & formula= 100*((prevy(6)) * ((((491 + 321 + 281 + 276 + 240 + 247 + 255-60 + 307) - 25
- 55)/ (6)) - (prevy(((491 + 321 + 281 + 276 + 240 + 247 + 255-60 + 307) - 25 -55))/ (prevy(6)))))/ (((491 + 321 + 281 + 276 + 240 + 247 + 255-60 + 307) - 25 -55)- prevy(((491 + 321 + 281 + 276 + 240 + 247 + 255-60 + 307) - 25 - 55)))
1700 Change in profitability on change in income = 100*(pbdita net of pne nfoi/ (sales) -prevy(pbdita net of pnenfoi)/(prevy(sales))) * ((sales)- (prevy(sales)))/ (pbditanet of pnenfoi-prevy(pbdita net of pne))
= 100*(((491 + 321 + 281 + 276 + 240 + 247 + 255-60 + 307) - 25 - 55)/ (6) -prevy(((491 + 321 + 281 + 276 + 240 + 247 + 255-60 + 307) - 25 - 55))/(prevy(6))) * ((6)- (prevy(6)))/ (((491 + 321 + 281 + 276 + 240 + 247 +255-60 + 307) - 25 - 55)-prevy((491 + 321 + 281 + 276 + 240 + 247 + 255-60 +307)))
Levels in each year1701 Total income = tot inc net of pne
= (5 - 60)1702 PAT net of P&E = pat net of pne
= (491-60 + 307)1703 Profitability (times) = pat net of pne/ totinc net of pne
= (491-60 + 307)/ (5 - 60)Change in each year
1704 Change in PAT net of P&E = (pat net of pne) -prevy(pat net of pne)= ((491-60 + 307)) -prevy((491-60 + 307))
1705 Change in total income = (tot inc net of pne) -prevy(tot inc net of pne)= ((5 - 60)) -prevy((5 - 60))
1706 Incremental profitability (Change in PBDIT / change in income) = (patnet of pne-prevy(pat net of pne)) / ( totinc net of pne-(times) prevy(tot inc net of pne))
= ((491-60 + 307)-prevy((491-60 + 307))) / ( (5 - 60)-prevy((5 - 60)))Causes of change in PAT net of P&E
1707 Change in total income with no chg. in profitability = ((totinc net of pne) - (prevy(tot inc net of pne))) * prevy(pat net of pne)/(prevy(tot inc net of pne))
= (((5 - 60)) - (prevy((5 - 60)))) * prevy((491-60 + 307))/ (prevy((5 -60)))
1708 Change in profitability with no chg. in income = (prevy(tot inc net of pne)) * (patnet of pne/ (totinc net of pne) -prevy(pat net of pne)/ (prevy(tot inc net of pne)))
= (prevy((5 - 60))) * ((491-60 + 307)/ ((5 - 60)) -prevy((491-60 + 307))/(prevy((5 - 60))))
1709 Change in profitability on change in income = (pat net of pne/ (totinc net of pne) -prevy(pat net of pne)/(prevy(tot inc net of pne))) * ((tot inc net of pne)-(prevy(tot inc net of pne)))
= ((491-60 + 307)/ ((5 - 60)) -prevy((491-60 + 307))/ (prevy((5 - 60)))) *
(Continued. . . )
August 2010 Indicators
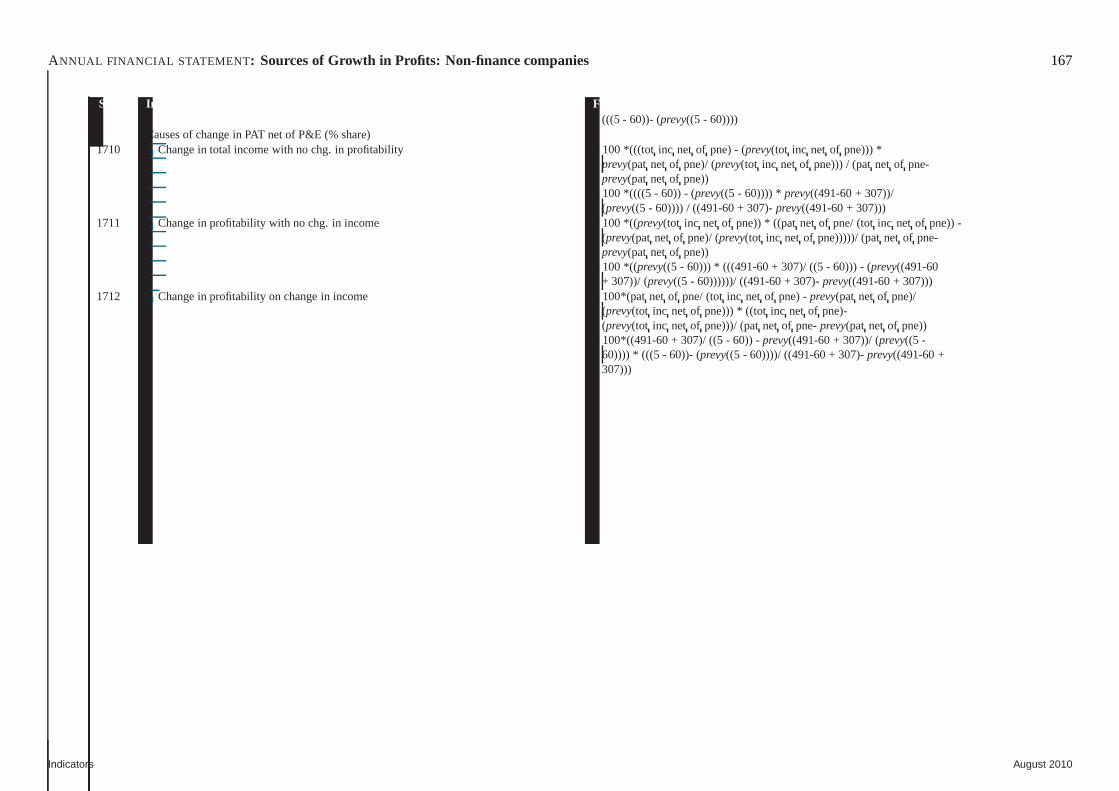
ANNUAL FINANCIAL STATEMENT : Sources of Growth in Profits: Non-finance companies 167
Sr.No. Indicator Fields & formula(((5 - 60))- (prevy((5 - 60))))
Causes of change in PAT net of P&E (% share)1710 Change in total income with no chg. in profitability = 100*(((tot inc net of pne) - (prevy(tot inc net of pne))) *
prevy(pat net of pne)/ (prevy(tot inc net of pne))) / (patnet of pne-prevy(pat net of pne))
= 100*((((5 - 60)) - (prevy((5 - 60)))) * prevy((491-60 + 307))/(prevy((5 - 60)))) / ((491-60 + 307)-prevy((491-60 + 307)))
1711 Change in profitability with no chg. in income = 100*((prevy(tot inc net of pne)) * ((patnet of pne/ (totinc net of pne)) -(prevy(pat net of pne)/ (prevy(tot inc net of pne)))))/ (patnet of pne-prevy(pat net of pne))
= 100*((prevy((5 - 60))) * (((491-60 + 307)/ ((5 - 60))) - (prevy((491-60+ 307))/ (prevy((5 - 60))))))/ ((491-60 + 307)-prevy((491-60 + 307)))
1712 Change in profitability on change in income = 100*(pat net of pne/ (totinc net of pne) -prevy(pat net of pne)/(prevy(tot inc net of pne))) * ((tot inc net of pne)-(prevy(tot inc net of pne)))/ (patnet of pne-prevy(pat net of pne))
= 100*((491-60 + 307)/ ((5 - 60)) -prevy((491-60 + 307))/ (prevy((5 -60)))) * (((5 - 60))- (prevy((5 - 60))))/ ((491-60 + 307)-prevy((491-60 +307)))
Indicators August 2010
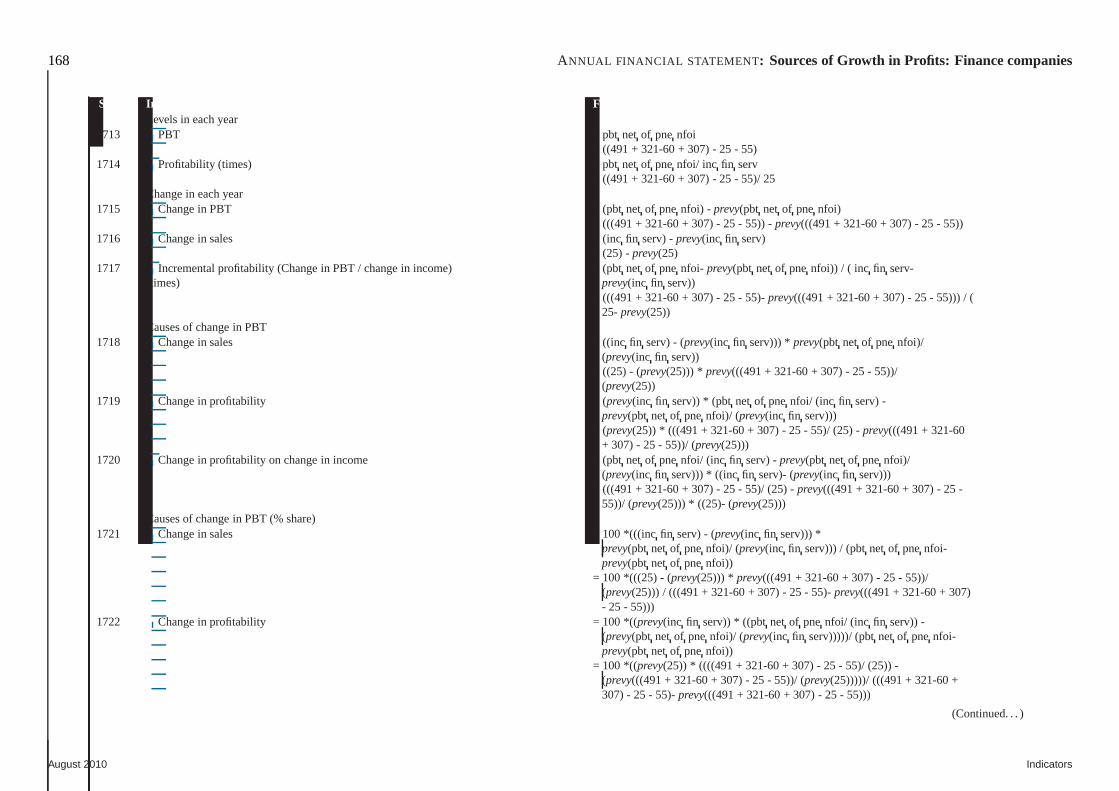
168 ANNUAL FINANCIAL STATEMENT : Sources of Growth in Profits: Finance companies
Sr.No. Indicator Fields & formulaLevels in each year
1713 PBT = pbt net of pne nfoi= ((491 + 321-60 + 307) - 25 - 55)
1714 Profitability (times) = pbt net of pne nfoi/ inc fin serv= ((491 + 321-60 + 307) - 25 - 55)/ 25
Change in each year1715 Change in PBT = (pbt net of pne nfoi) - prevy(pbt net of pne nfoi)
= (((491 + 321-60 + 307) - 25 - 55)) -prevy(((491 + 321-60 + 307) - 25 - 55))1716 Change in sales = (inc fin serv) -prevy(inc fin serv)
= (25) -prevy(25)1717 Incremental profitability (Change in PBT / change in income) = (pbt net of pne nfoi- prevy(pbt net of pne nfoi)) / ( inc fin serv-
(times) prevy(inc fin serv))= (((491 + 321-60 + 307) - 25 - 55)-prevy(((491 + 321-60 + 307) - 25 - 55))) / (
25- prevy(25))Causes of change in PBT
1718 Change in sales = ((inc fin serv) - (prevy(inc fin serv))) * prevy(pbt net of pne nfoi)/(prevy(inc fin serv))
= ((25) - (prevy(25))) * prevy(((491 + 321-60 + 307) - 25 - 55))/(prevy(25))
1719 Change in profitability = (prevy(inc fin serv)) * (pbt net of pne nfoi/ (inc fin serv) -prevy(pbt net of pne nfoi)/ (prevy(inc fin serv)))
= (prevy(25)) * (((491 + 321-60 + 307) - 25 - 55)/ (25) -prevy(((491 + 321-60+ 307) - 25 - 55))/ (prevy(25)))
1720 Change in profitability on change in income = (pbt net of pne nfoi/ (inc fin serv) -prevy(pbt net of pne nfoi)/(prevy(inc fin serv))) * ((inc fin serv)- (prevy(inc fin serv)))
= (((491 + 321-60 + 307) - 25 - 55)/ (25) -prevy(((491 + 321-60 + 307) - 25 -55))/ (prevy(25))) * ((25)- (prevy(25)))
Causes of change in PBT (% share)1721 Change in sales = 100*(((inc fin serv) - (prevy(inc fin serv))) *
prevy(pbt net of pne nfoi)/ (prevy(inc fin serv))) / (pbtnet of pnenfoi-prevy(pbt net of pne nfoi))
= 100*(((25) - (prevy(25))) * prevy(((491 + 321-60 + 307) - 25 - 55))/(prevy(25))) / (((491 + 321-60 + 307) - 25 - 55)-prevy(((491 + 321-60 + 307)- 25 - 55)))
1722 Change in profitability = 100*((prevy(inc fin serv)) * ((pbt net of pne nfoi/ (inc fin serv)) -(prevy(pbt net of pne nfoi)/ (prevy(inc fin serv)))))/ (pbtnet of pnenfoi-prevy(pbt net of pne nfoi))
= 100*((prevy(25)) * ((((491 + 321-60 + 307) - 25 - 55)/ (25)) -(prevy(((491 + 321-60 + 307) - 25 - 55))/ (prevy(25)))))/ (((491 + 321-60 +307) - 25 - 55)-prevy(((491 + 321-60 + 307) - 25 - 55)))
(Continued. . . )
August 2010 Indicators
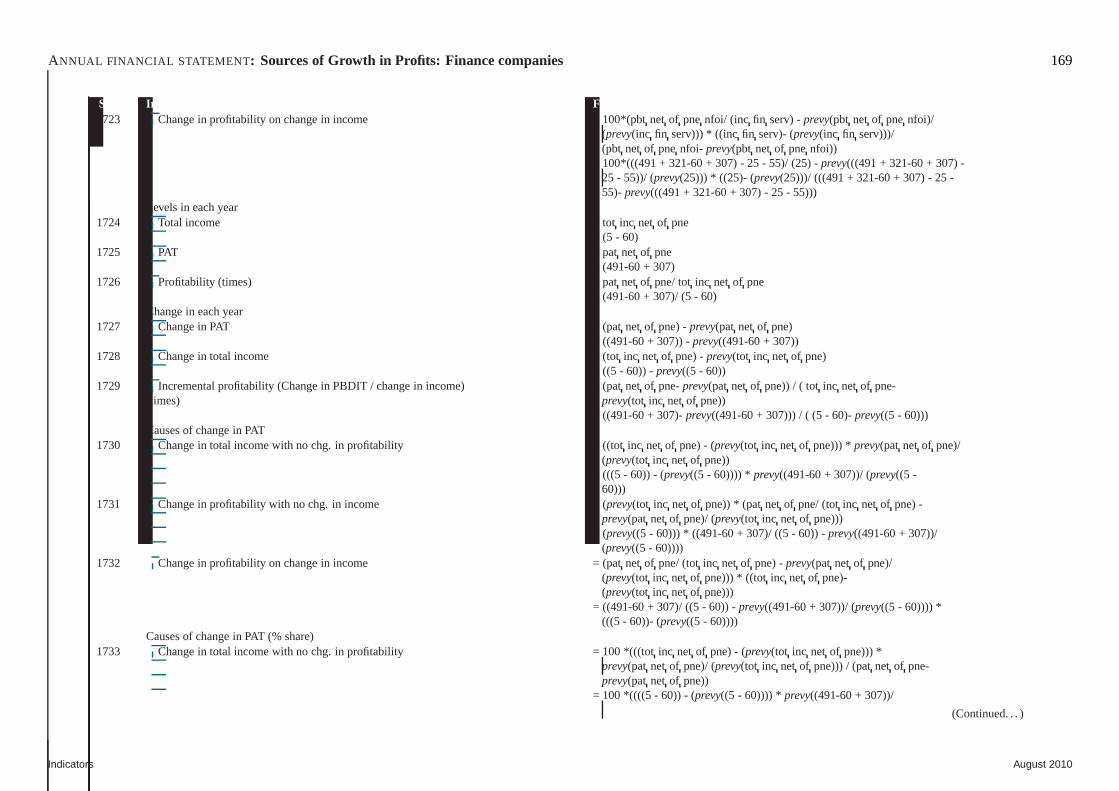
ANNUAL FINANCIAL STATEMENT : Sources of Growth in Profits: Finance companies 169
Sr.No. Indicator Fields & formula1723 Change in profitability on change in income = 100*(pbt net of pnenfoi/ (inc fin serv) -prevy(pbt net of pne nfoi)/
(prevy(inc fin serv))) * ((inc fin serv)- (prevy(inc fin serv)))/(pbt net of pne nfoi- prevy(pbt net of pnenfoi))
= 100*(((491 + 321-60 + 307) - 25 - 55)/ (25) -prevy(((491 + 321-60 + 307) -25 - 55))/ (prevy(25))) * ((25)- (prevy(25)))/ (((491 + 321-60 + 307) - 25 -55)- prevy(((491 + 321-60 + 307) - 25 - 55)))
Levels in each year1724 Total income = tot inc net of pne
= (5 - 60)1725 PAT = pat net of pne
= (491-60 + 307)1726 Profitability (times) = pat net of pne/ totinc net of pne
= (491-60 + 307)/ (5 - 60)Change in each year
1727 Change in PAT = (pat net of pne) -prevy(pat net of pne)= ((491-60 + 307)) -prevy((491-60 + 307))
1728 Change in total income = (tot inc net of pne) -prevy(tot inc net of pne)= ((5 - 60)) -prevy((5 - 60))
1729 Incremental profitability (Change in PBDIT / change in income) = (patnet of pne-prevy(pat net of pne)) / ( totinc net of pne-(times) prevy(tot inc net of pne))
= ((491-60 + 307)-prevy((491-60 + 307))) / ( (5 - 60)-prevy((5 - 60)))Causes of change in PAT
1730 Change in total income with no chg. in profitability = ((totinc net of pne) - (prevy(tot inc net of pne))) * prevy(pat net of pne)/(prevy(tot inc net of pne))
= (((5 - 60)) - (prevy((5 - 60)))) * prevy((491-60 + 307))/ (prevy((5 -60)))
1731 Change in profitability with no chg. in income = (prevy(tot inc net of pne)) * (patnet of pne/ (totinc net of pne) -prevy(pat net of pne)/ (prevy(tot inc net of pne)))
= (prevy((5 - 60))) * ((491-60 + 307)/ ((5 - 60)) -prevy((491-60 + 307))/(prevy((5 - 60))))
1732 Change in profitability on change in income = (pat net of pne/ (totinc net of pne) -prevy(pat net of pne)/(prevy(tot inc net of pne))) * ((tot inc net of pne)-(prevy(tot inc net of pne)))
= ((491-60 + 307)/ ((5 - 60)) -prevy((491-60 + 307))/ (prevy((5 - 60)))) *(((5 - 60))- (prevy((5 - 60))))
Causes of change in PAT (% share)1733 Change in total income with no chg. in profitability = 100*(((tot inc net of pne) - (prevy(tot inc net of pne))) *
prevy(pat net of pne)/ (prevy(tot inc net of pne))) / (patnet of pne-prevy(pat net of pne))
= 100*((((5 - 60)) - (prevy((5 - 60)))) * prevy((491-60 + 307))/
(Continued. . . )
Indicators August 2010
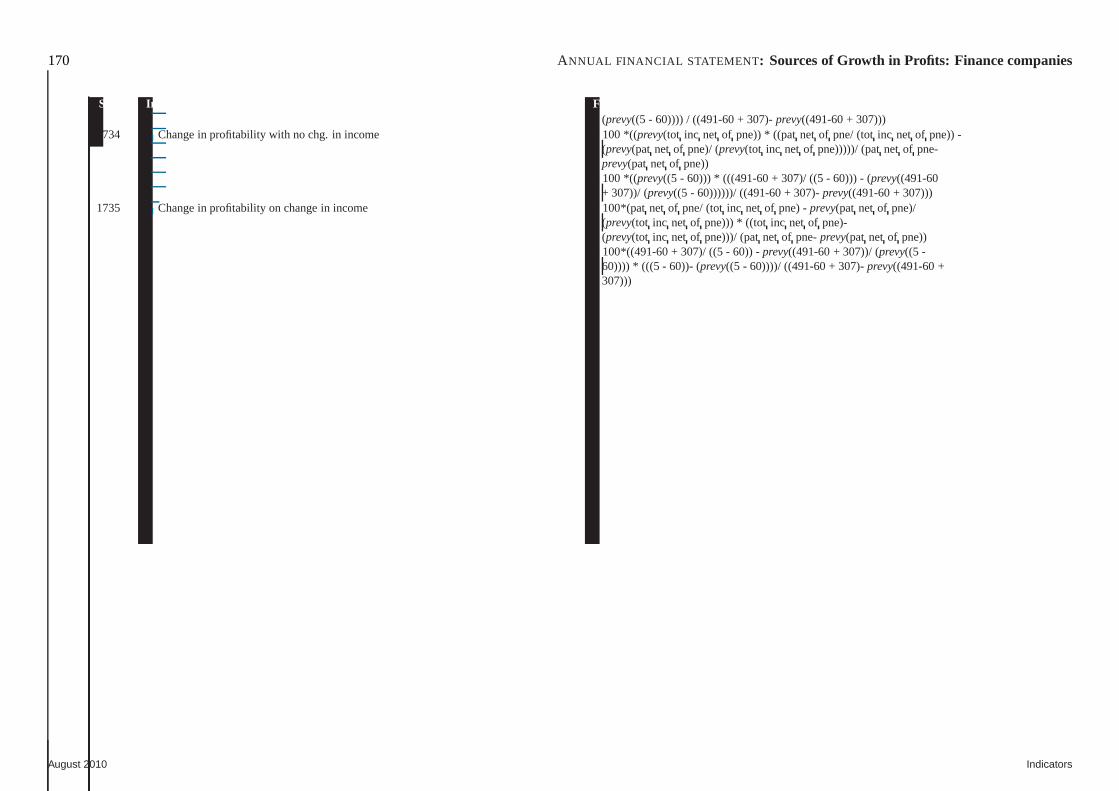
170 ANNUAL FINANCIAL STATEMENT : Sources of Growth in Profits: Finance companies
Sr.No. Indicator Fields & formula(prevy((5 - 60)))) / ((491-60 + 307)-prevy((491-60 + 307)))
1734 Change in profitability with no chg. in income = 100*((prevy(tot inc net of pne)) * ((patnet of pne/ (totinc net of pne)) -(prevy(pat net of pne)/ (prevy(tot inc net of pne)))))/ (patnet of pne-prevy(pat net of pne))
= 100*((prevy((5 - 60))) * (((491-60 + 307)/ ((5 - 60))) - (prevy((491-60+ 307))/ (prevy((5 - 60))))))/ ((491-60 + 307)-prevy((491-60 + 307)))
1735 Change in profitability on change in income = 100*(pat net of pne/ (totinc net of pne) -prevy(pat net of pne)/(prevy(tot inc net of pne))) * ((tot inc net of pne)-(prevy(tot inc net of pne)))/ (patnet of pne-prevy(pat net of pne))
= 100*((491-60 + 307)/ ((5 - 60)) -prevy((491-60 + 307))/ (prevy((5 -60)))) * (((5 - 60))- (prevy((5 - 60))))/ ((491-60 + 307)-prevy((491-60 +307)))
August 2010 Indicators
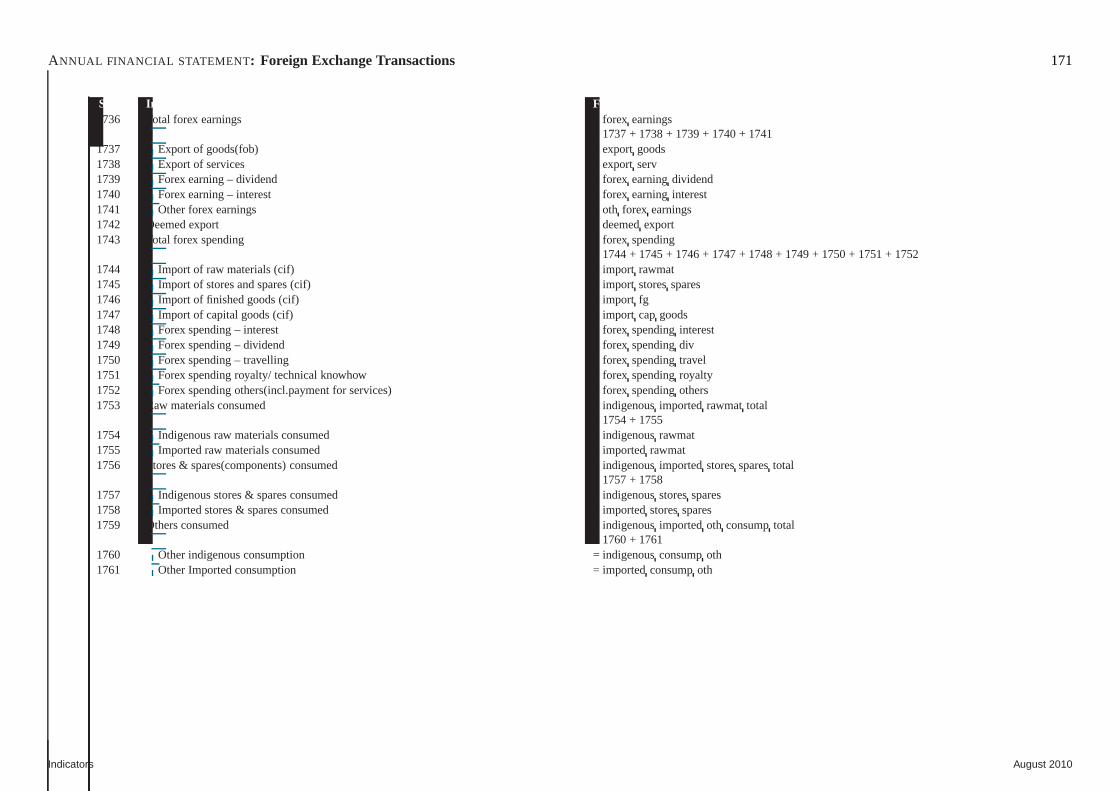
ANNUAL FINANCIAL STATEMENT : Foreign Exchange Transactions 171
Sr.No. Indicator Fields & formula1736 Total forex earnings = forex earnings
= 1737 + 1738 + 1739 + 1740 + 17411737 Export of goods(fob) = exportgoods1738 Export of services = export serv1739 Forex earning – dividend = forex earningdividend1740 Forex earning – interest = forex earninginterest1741 Other forex earnings = oth forex earnings1742 Deemed export = deemedexport1743 Total forex spending = forex spending
= 1744 + 1745 + 1746 + 1747 + 1748 + 1749 + 1750 + 1751 + 17521744 Import of raw materials (cif) = import rawmat1745 Import of stores and spares (cif) = import storesspares1746 Import of finished goods (cif) = import fg1747 Import of capital goods (cif) = import capgoods1748 Forex spending – interest = forex spendinginterest1749 Forex spending – dividend = forex spendingdiv1750 Forex spending – travelling = forex spendingtravel1751 Forex spending royalty/ technical knowhow = forex spendingroyalty1752 Forex spending others(incl.payment for services) = forex spendingothers1753 Raw materials consumed = indigenousimportedrawmattotal
= 1754 + 17551754 Indigenous raw materials consumed = indigenousrawmat1755 Imported raw materials consumed = importedrawmat1756 Stores & spares(components) consumed = indigenousimportedstoressparestotal
= 1757 + 17581757 Indigenous stores & spares consumed = indigenousstoresspares1758 Imported stores & spares consumed = importedstoresspares1759 Others consumed = indigenousimportedoth consumptotal
= 1760 + 17611760 Other indigenous consumption = indigenousconsumpoth1761 Other Imported consumption = importedconsumpoth
Indicators August 2010
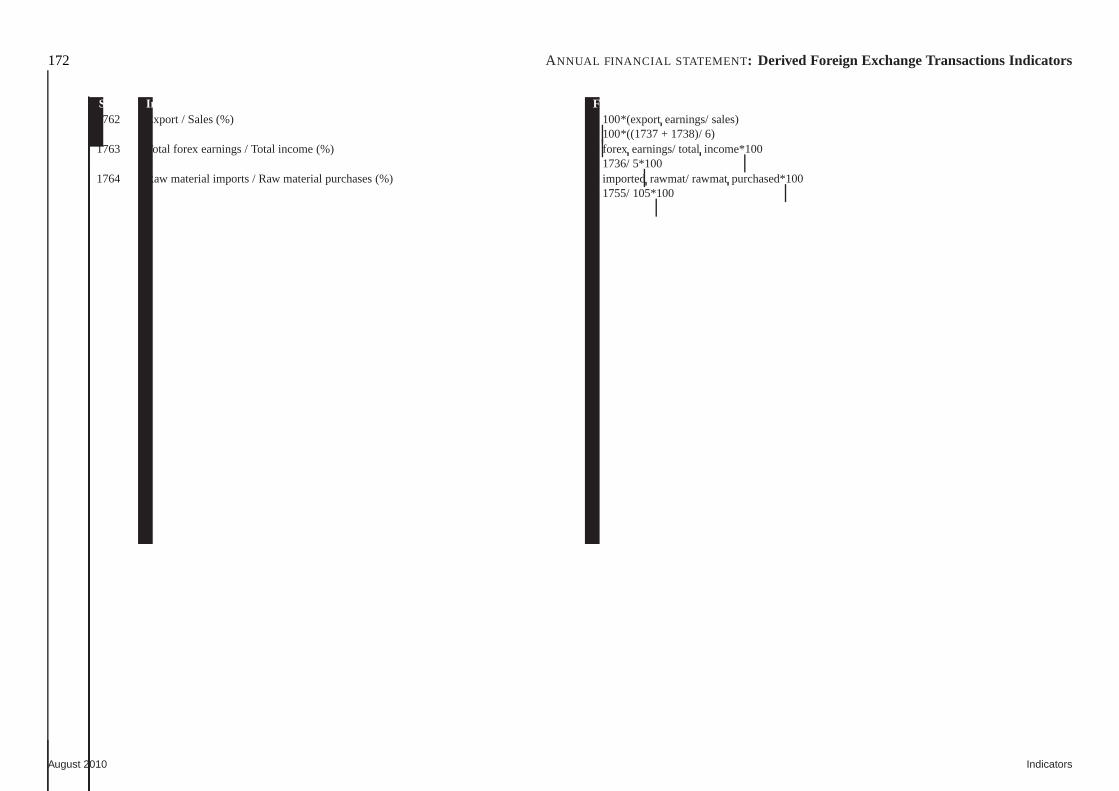
172 ANNUAL FINANCIAL STATEMENT : Derived Foreign Exchange Transactions Indicators
Sr.No. Indicator Fields & formula1762 Export / Sales (%) = 100*(export earnings/ sales)
= 100*((1737 + 1738)/ 6)1763 Total forex earnings / Total income (%) = forex earnings/ totalincome*100
= 1736/ 5*1001764 Raw material imports / Raw material purchases (%) = importedrawmat/ rawmatpurchased*100
= 1755/ 105*100
August 2010 Indicators
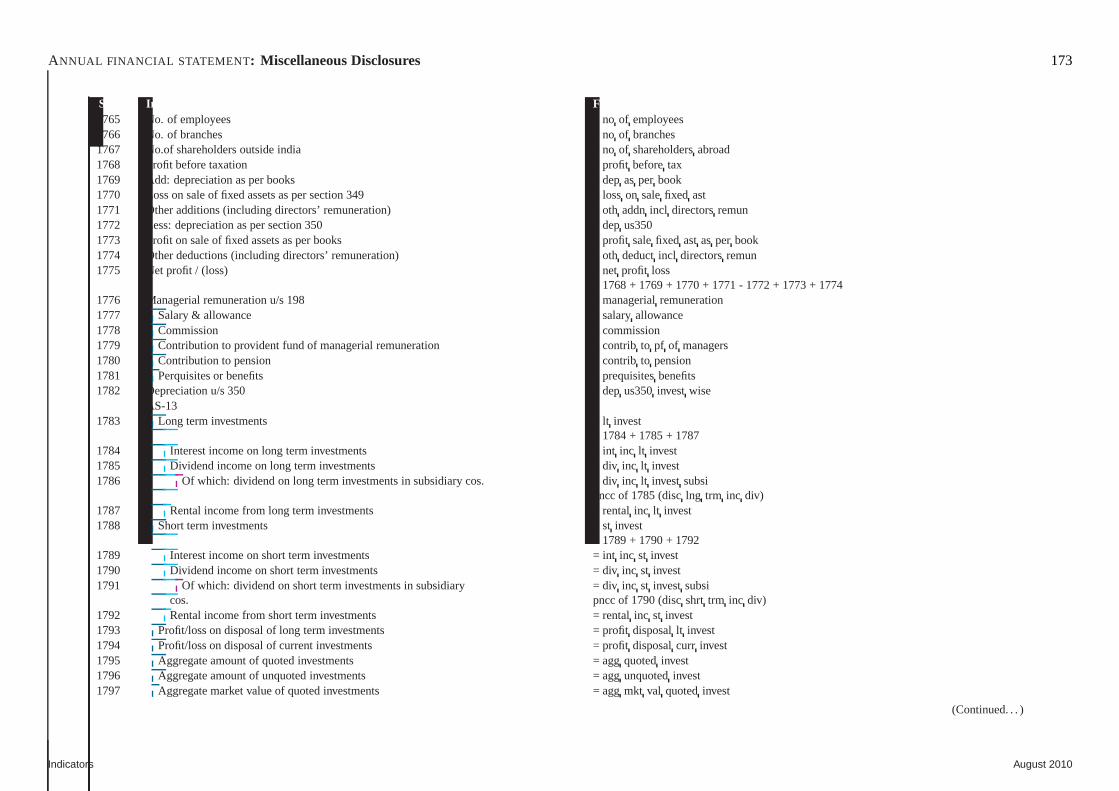
ANNUAL FINANCIAL STATEMENT : Miscellaneous Disclosures 173
Sr.No. Indicator Fields & formula1765 No. of employees = no of employees1766 No. of branches = no of branches1767 No.of shareholders outside india = no of shareholdersabroad1768 Profit before taxation = profit beforetax1769 Add: depreciation as per books = depasper book1770 Loss on sale of fixed assets as per section 349 = losson salefixed ast1771 Other additions (including directors’ remuneration) = oth addnincl directorsremun1772 Less: depreciation as per section 350 = depus3501773 Profit on sale of fixed assets as per books = profit salefixed astas per book1774 Other deductions (including directors’ remuneration) = oth deductincl directorsremun1775 Net profit / (loss) = net profit loss
= 1768 + 1769 + 1770 + 1771 - 1772 + 1773 + 17741776 Managerial remuneration u/s 198 = managerialremuneration1777 Salary & allowance = salaryallowance1778 Commission = commission1779 Contribution to provident fund of managerial remuneration = contrib to pf of managers1780 Contribution to pension = contrib to pension1781 Perquisites or benefits = prequisitesbenefits1782 Depreciation u/s 350 = depus350invest wise
AS-131783 Long term investments = lt invest
= 1784 + 1785 + 17871784 Interest income on long term investments = int inc lt invest1785 Dividend income on long term investments = div inc lt invest1786 Of which: dividend on long term investments in subsidiary cos. = div inc lt invest subsi
pncc of 1785 (disclng trm inc div)1787 Rental income from long term investments = rental inc lt invest1788 Short term investments = st invest
= 1789 + 1790 + 17921789 Interest income on short term investments = int inc st invest1790 Dividend income on short term investments = div inc st invest1791 Of which: dividend on short term investments in subsidiary =div inc st invest subsi
cos. pncc of 1790 (discshrt trm inc div)1792 Rental income from short term investments = rental inc st invest1793 Profit/loss on disposal of long term investments = profit disposallt invest1794 Profit/loss on disposal of current investments = profit disposalcurr invest1795 Aggregate amount of quoted investments = aggquotedinvest1796 Aggregate amount of unquoted investments = aggunquotedinvest1797 Aggregate market value of quoted investments = aggmkt val quotedinvest
(Continued. . . )
Indicators August 2010
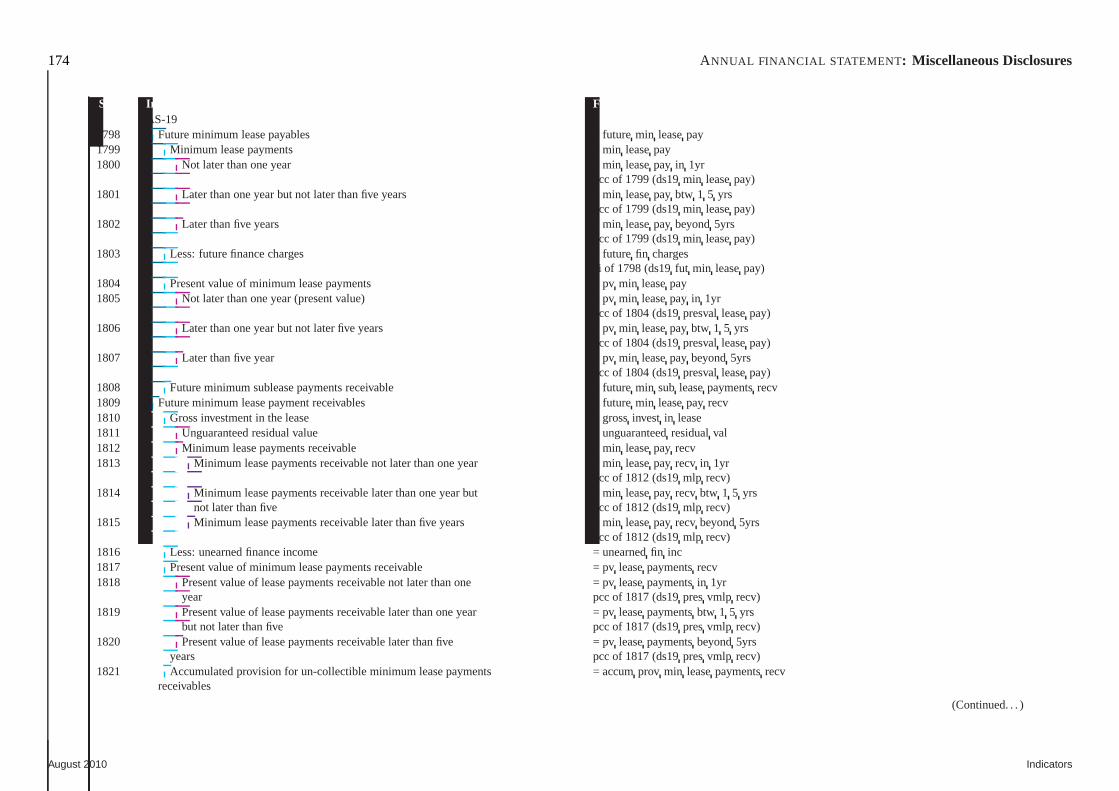
174 ANNUAL FINANCIAL STATEMENT : Miscellaneous Disclosures
Sr.No. Indicator Fields & formulaAS-19
1798 Future minimum lease payables = future min leasepay1799 Minimum lease payments = min leasepay1800 Not later than one year = min leasepay in 1yr
pcc of 1799 (ds19min leasepay)1801 Later than one year but not later than five years = minleasepay btw 1 5 yrs
pcc of 1799 (ds19min leasepay)1802 Later than five years = min leasepay beyond5yrs
pcc of 1799 (ds19min leasepay)1803 Less: future finance charges = future fin charges
ai of 1798 (ds19fut min leasepay)1804 Present value of minimum lease payments = pv min leasepay1805 Not later than one year (present value) = pv min leasepay in 1yr
pcc of 1804 (ds19presvalleasepay)1806 Later than one year but not later five years = pv min leasepay btw 1 5 yrs
pcc of 1804 (ds19presvalleasepay)1807 Later than five year = pv min leasepay beyond5yrs
pcc of 1804 (ds19presvalleasepay)1808 Future minimum sublease payments receivable = future min sub leasepaymentsrecv1809 Future minimum lease payment receivables = future min leasepay recv1810 Gross investment in the lease = grossinvest in lease1811 Unguaranteed residual value = unguaranteedresidualval1812 Minimum lease payments receivable = min leasepay recv1813 Minimum lease payments receivable not later than one year = min leasepay recv in 1yr
pcc of 1812 (ds19mlp recv)1814 Minimum lease payments receivable later than one year but = min leasepay recv btw 1 5 yrs
not later than five pcc of 1812 (ds19mlp recv)1815 Minimum lease payments receivable later than five years = minleasepay recv beyond5yrs
pcc of 1812 (ds19mlp recv)1816 Less: unearned finance income = unearnedfin inc1817 Present value of minimum lease payments receivable = pvleasepaymentsrecv1818 Present value of lease payments receivable not later than one = pv leasepaymentsin 1yr
year pcc of 1817 (ds19presvmlp recv)1819 Present value of lease payments receivable later than one year = pv leasepaymentsbtw 1 5 yrs
but not later than five pcc of 1817 (ds19presvmlp recv)1820 Present value of lease payments receivable later than five = pv leasepaymentsbeyond5yrs
years pcc of 1817 (ds19presvmlp recv)1821 Accumulated provision for un-collectible minimum lease payments = accumprov min leasepaymentsrecv
receivables
(Continued. . . )
August 2010 Indicators
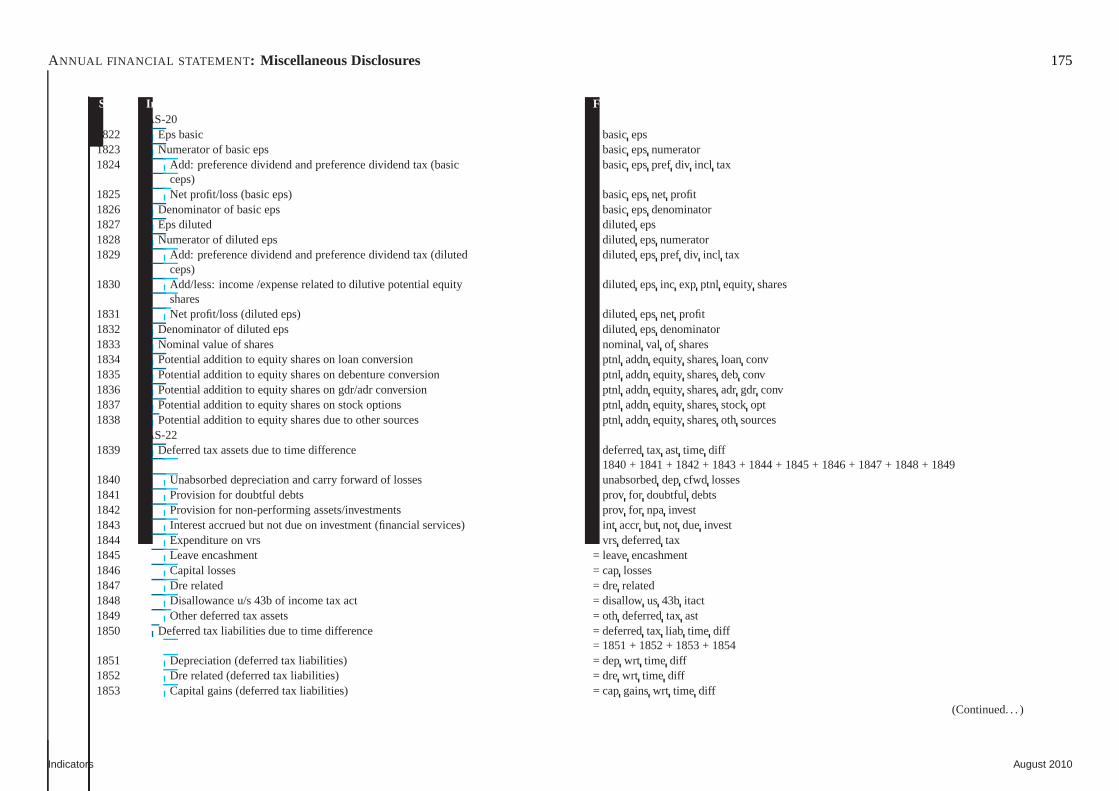
ANNUAL FINANCIAL STATEMENT : Miscellaneous Disclosures 175
Sr.No. Indicator Fields & formulaAS-20
1822 Eps basic = basiceps1823 Numerator of basic eps = basicepsnumerator1824 Add: preference dividend and preference dividend tax (basic = basicepspref div incl tax
ceps)1825 Net profit/loss (basic eps) = basicepsnet profit1826 Denominator of basic eps = basicepsdenominator1827 Eps diluted = diluted eps1828 Numerator of diluted eps = diluted epsnumerator1829 Add: preference dividend and preference dividend tax (diluted = dilutedepspref div incl tax
ceps)1830 Add/less: income /expense related to dilutive potential equity = diluted epsinc exp ptnl equity shares
shares1831 Net profit/loss (diluted eps) = diluted epsnet profit1832 Denominator of diluted eps = diluted epsdenominator1833 Nominal value of shares = nominal val of shares1834 Potential addition to equity shares on loan conversion = ptnl addnequity sharesloan conv1835 Potential addition to equity shares on debenture conversion = ptnl addnequity sharesdeb conv1836 Potential addition to equity shares on gdr/adr conversion =ptnl addnequity sharesadr gdr conv1837 Potential addition to equity shares on stock options = ptnladdnequity sharesstock opt1838 Potential addition to equity shares due to other sources = ptnl addnequity sharesoth sources
AS-221839 Deferred tax assets due to time difference = deferredtax ast time diff
= 1840 + 1841 + 1842 + 1843 + 1844 + 1845 + 1846 + 1847 + 1848 + 18491840 Unabsorbed depreciation and carry forward of losses = unabsorbeddep cfwd losses1841 Provision for doubtful debts = prov for doubtful debts1842 Provision for non-performing assets/investments = provfor npa invest1843 Interest accrued but not due on investment (financial services) = intaccr but not due invest1844 Expenditure on vrs = vrs deferredtax1845 Leave encashment = leaveencashment1846 Capital losses = cap losses1847 Dre related = dre related1848 Disallowance u/s 43b of income tax act = disallow us 43b itact1849 Other deferred tax assets = oth deferredtax ast1850 Deferred tax liabilities due to time difference = deferredtax liab time diff
= 1851 + 1852 + 1853 + 18541851 Depreciation (deferred tax liabilities) = depwrt time diff1852 Dre related (deferred tax liabilities) = dre wrt time diff1853 Capital gains (deferred tax liabilities) = capgainswrt time diff
(Continued. . . )
Indicators August 2010
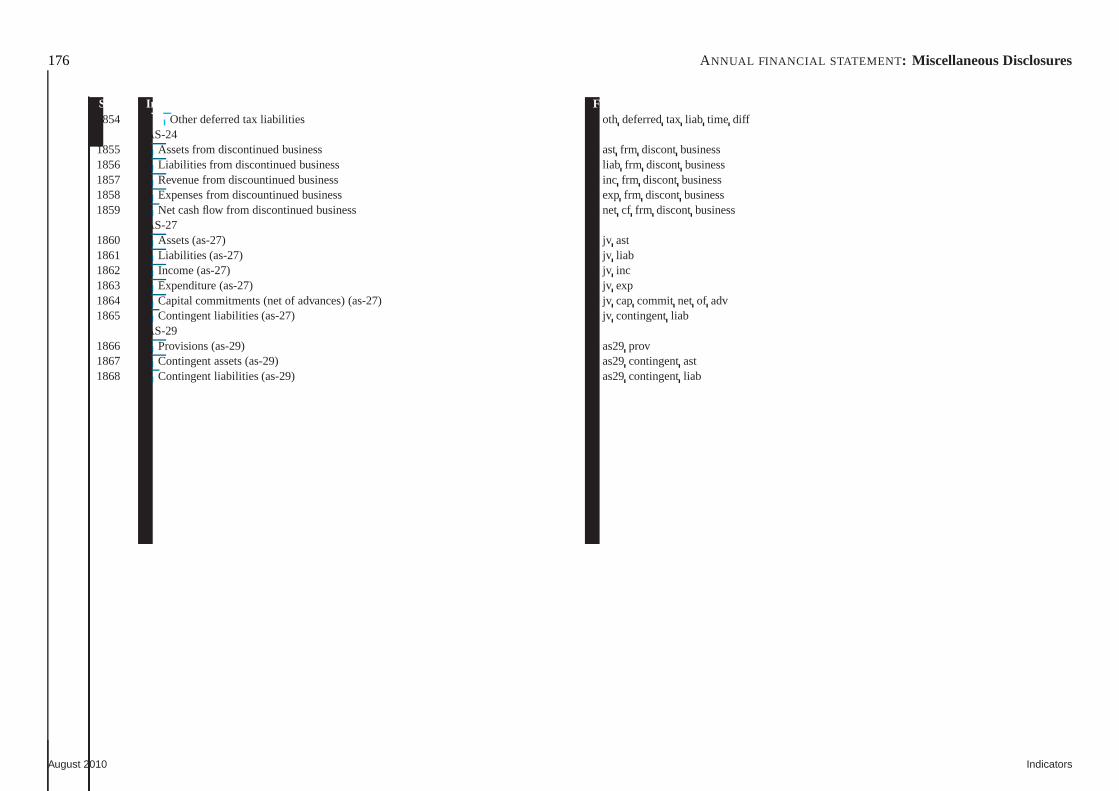
176 ANNUAL FINANCIAL STATEMENT : Miscellaneous Disclosures
Sr.No. Indicator Fields & formula1854 Other deferred tax liabilities = oth deferredtax liab time diff
AS-241855 Assets from discontinued business = ast frm discontbusiness1856 Liabilities from discontinued business = liab frm discontbusiness1857 Revenue from discountinued business = inc frm discontbusiness1858 Expenses from discountinued business = exp frm discontbusiness1859 Net cash flow from discontinued business = net cf frm discontbusiness
AS-271860 Assets (as-27) = jv ast1861 Liabilities (as-27) = jv liab1862 Income (as-27) = jv inc1863 Expenditure (as-27) = jv exp1864 Capital commitments (net of advances) (as-27) = jv cap commit net of adv1865 Contingent liabilities (as-27) = jv contingentliab
AS-291866 Provisions (as-29) = as29prov1867 Contingent assets (as-29) = as29contingentast1868 Contingent liabilities (as-29) = as29contingentliab
August 2010 Indicators
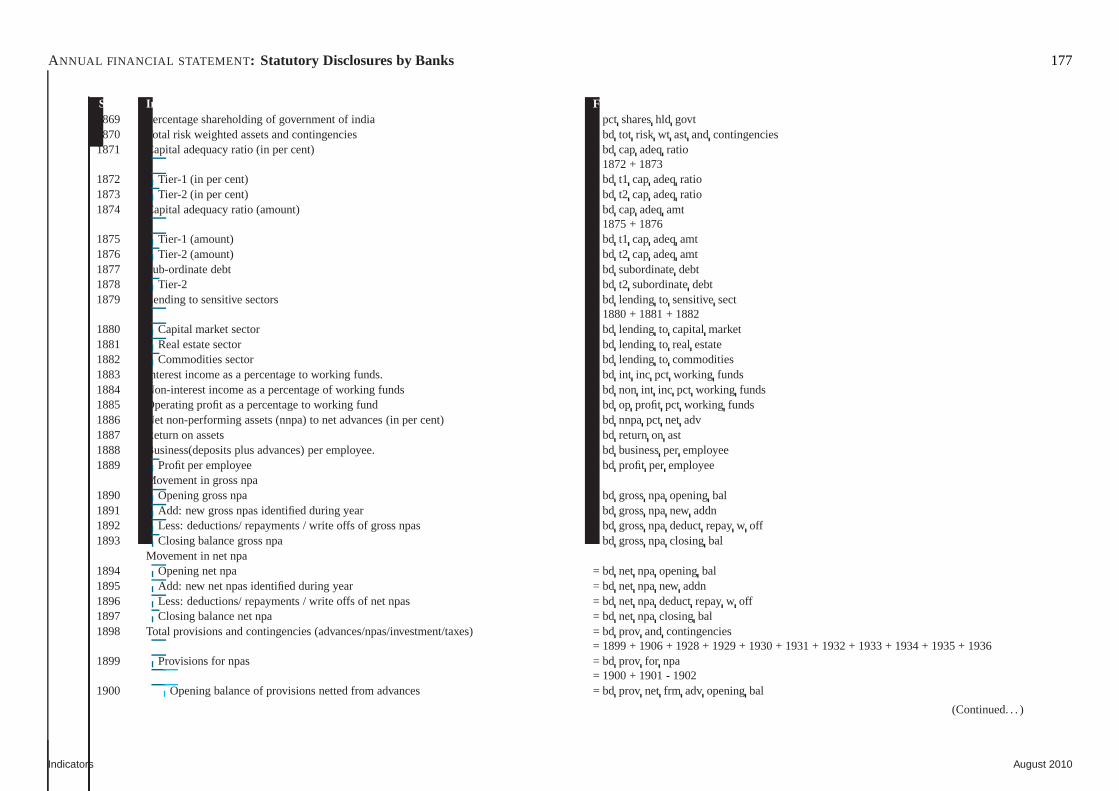
ANNUAL FINANCIAL STATEMENT : Statutory Disclosures by Banks 177
Sr.No. Indicator Fields & formula1869 Percentage shareholding of government of india = pct shareshld govt1870 Total risk weighted assets and contingencies = bd tot risk wt ast and contingencies1871 Capital adequacy ratio (in per cent) = bd cap adeqratio
= 1872 + 18731872 Tier-1 (in per cent) = bd t1 cap adeqratio1873 Tier-2 (in per cent) = bd t2 cap adeqratio1874 Capital adequacy ratio (amount) = bd cap adeqamt
= 1875 + 18761875 Tier-1 (amount) = bd t1 cap adeqamt1876 Tier-2 (amount) = bd t2 cap adeqamt1877 Sub-ordinate debt = bd subordinatedebt1878 Tier-2 = bd t2 subordinatedebt1879 Lending to sensitive sectors = bd lending to sensitivesect
= 1880 + 1881 + 18821880 Capital market sector = bd lending to capital market1881 Real estate sector = bd lending to real estate1882 Commodities sector = bd lending to commodities1883 Interest income as a percentage to working funds. = bd int inc pct working funds1884 Non-interest income as a percentage of working funds = bd non int inc pct working funds1885 Operating profit as a percentage to working fund = bd op profit pct working funds1886 Net non-performing assets (nnpa) to net advances (in per cent) = bdnnpapct net adv1887 Return on assets = bd returnon ast1888 Business(deposits plus advances) per employee. = bd businessper employee1889 Profit per employee = bd profit per employee
Movement in gross npa1890 Opening gross npa = bd grossnpaopeningbal1891 Add: new gross npas identified during year = bd grossnpanew addn1892 Less: deductions/ repayments / write offs of gross npas = bdgrossnpadeductrepayw off1893 Closing balance gross npa = bd grossnpaclosing bal
Movement in net npa1894 Opening net npa = bd net npa openingbal1895 Add: new net npas identified during year = bd net npa new addn1896 Less: deductions/ repayments / write offs of net npas = bdnet npa deductrepayw off1897 Closing balance net npa = bd net npa closing bal1898 Total provisions and contingencies (advances/npas/investment/taxes) = bdprov and contingencies
= 1899 + 1906 + 1928 + 1929 + 1930 + 1931 + 1932 + 1933 + 1934 + 1935 +19361899 Provisions for npas = bd prov for npa
= 1900 + 1901 - 19021900 Opening balance of provisions netted from advances = bdprov net frm adv openingbal
(Continued. . . )
Indicators August 2010
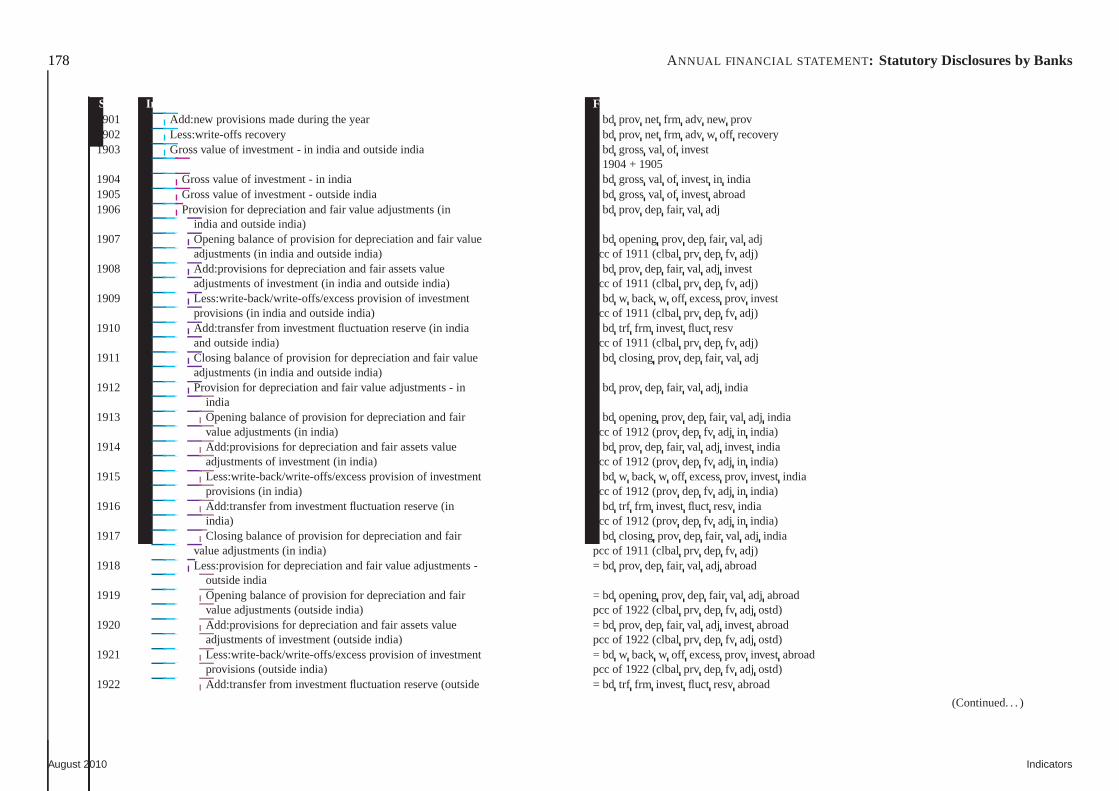
178 ANNUAL FINANCIAL STATEMENT : Statutory Disclosures by Banks
Sr.No. Indicator Fields & formula1901 Add:new provisions made during the year = bd prov net frm adv new prov1902 Less:write-offs recovery = bd prov net frm adv w off recovery1903 Gross value of investment - in india and outside india = bdgrossval of invest
= 1904 + 19051904 Gross value of investment - in india = bd grossval of invest in india1905 Gross value of investment - outside india = bd grossval of invest abroad1906 Provision for depreciation and fair value adjustments (in =bd prov dep fair val adj
india and outside india)1907 Opening balance of provision for depreciation and fair value = bdopeningprov dep fair val adj
adjustments (in india and outside india) pcc of 1911 (clbalprv dep fv adj)1908 Add:provisions for depreciation and fair assets value = bdprov dep fair val adj invest
adjustments of investment (in india and outside india) pcc of 1911 (clbalprv dep fv adj)1909 Less:write-back/write-offs/excess provision of investment = bdw back w off excessprov invest
provisions (in india and outside india) pcc of 1911 (clbalprv dep fv adj)1910 Add:transfer from investment fluctuation reserve (in india = bd trf frm invest fluct resv
and outside india) pcc of 1911 (clbalprv dep fv adj)1911 Closing balance of provision for depreciation and fair value = bdclosing prov dep fair val adj
adjustments (in india and outside india)1912 Provision for depreciation and fair value adjustments - in =bd prov dep fair val adj india
india1913 Opening balance of provision for depreciation and fair = bdopeningprov dep fair val adj india
value adjustments (in india) pcc of 1912 (provdep fv adj in india)1914 Add:provisions for depreciation and fair assets value = bdprov dep fair val adj invest india
adjustments of investment (in india) pcc of 1912 (provdep fv adj in india)1915 Less:write-back/write-offs/excess provision of investment = bdw back w off excessprov invest india
provisions (in india) pcc of 1912 (provdep fv adj in india)1916 Add:transfer from investment fluctuation reserve (in = bdtrf frm invest fluct resv india
india) pcc of 1912 (provdep fv adj in india)1917 Closing balance of provision for depreciation and fair = bdclosing prov dep fair val adj india
value adjustments (in india) pcc of 1911 (clbalprv dep fv adj)1918 Less:provision for depreciation and fair value adjustments - = bdprov dep fair val adj abroad
outside india1919 Opening balance of provision for depreciation and fair = bdopeningprov dep fair val adj abroad
value adjustments (outside india) pcc of 1922 (clbalprv dep fv adj ostd)1920 Add:provisions for depreciation and fair assets value = bdprov dep fair val adj invest abroad
adjustments of investment (outside india) pcc of 1922 (clbal prv dep fv adj ostd)1921 Less:write-back/write-offs/excess provision of investment = bdw back w off excessprov invest abroad
provisions (outside india) pcc of 1922 (clbalprv dep fv adj ostd)1922 Add:transfer from investment fluctuation reserve (outside = bd trf frm invest fluct resv abroad
(Continued. . . )
August 2010 Indicators
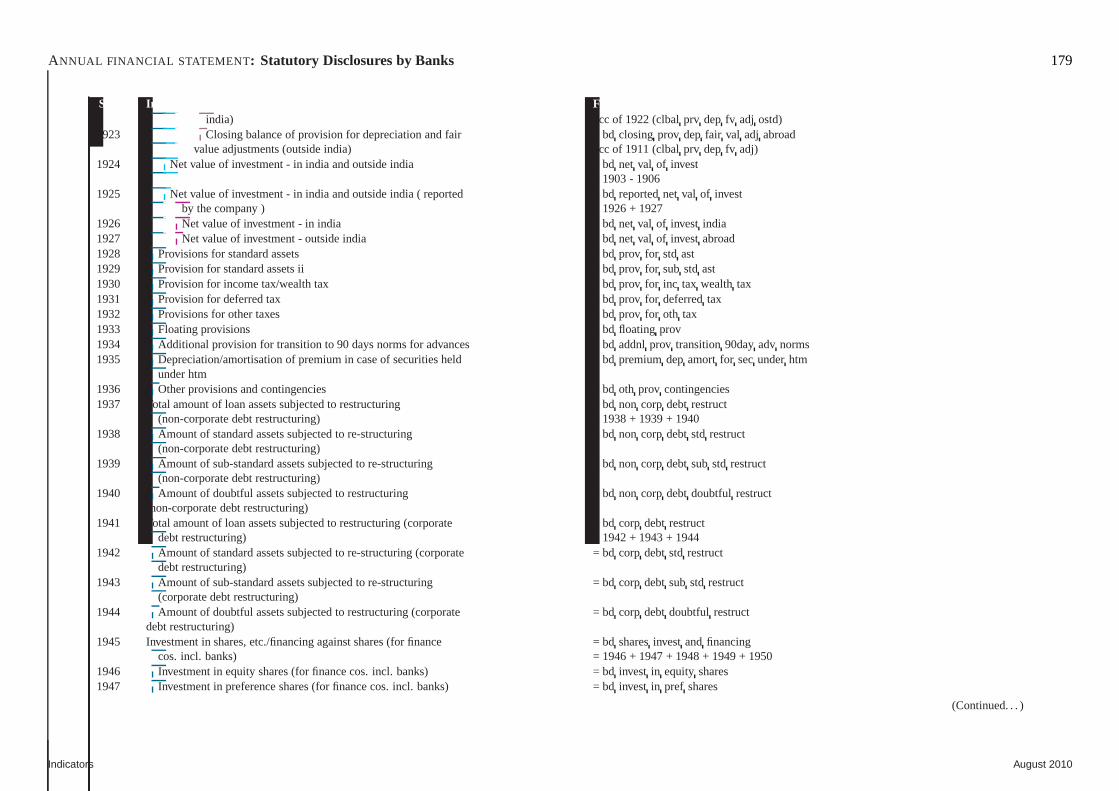
ANNUAL FINANCIAL STATEMENT : Statutory Disclosures by Banks 179
Sr.No. Indicator Fields & formulaindia) pcc of 1922 (clbalprv dep fv adj ostd)
1923 Closing balance of provision for depreciation and fair = bdclosing prov dep fair val adj abroadvalue adjustments (outside india) pcc of 1911 (clbalprv dep fv adj)
1924 Net value of investment - in india and outside india = bdnet val of invest= 1903 - 1906
1925 Net value of investment - in india and outside india ( reported = bd reportednet val of investby the company ) = 1926 + 1927
1926 Net value of investment - in india = bd net val of invest india1927 Net value of investment - outside india = bd net val of invest abroad1928 Provisions for standard assets = bd prov for std ast1929 Provision for standard assets ii = bd prov for sub std ast1930 Provision for income tax/wealth tax = bd prov for inc tax wealth tax1931 Provision for deferred tax = bd prov for deferredtax1932 Provisions for other taxes = bd prov for oth tax1933 Floating provisions = bd floating prov1934 Additional provision for transition to 90 days norms for advances = bdaddnl prov transition90dayadv norms1935 Depreciation/amortisation of premium in case of securities held = bdpremiumdep amort for secunderhtm
under htm1936 Other provisions and contingencies = bd oth prov contingencies1937 Total amount of loan assets subjected to restructuring = bd non corp debt restruct
(non-corporate debt restructuring) = 1938 + 1939 + 19401938 Amount of standard assets subjected to re-structuring = bdnon corp debt std restruct
(non-corporate debt restructuring)1939 Amount of sub-standard assets subjected to re-structuring = bd non corp debt sub std restruct
(non-corporate debt restructuring)1940 Amount of doubtful assets subjected to restructuring = bdnon corp debt doubtful restruct
(non-corporate debt restructuring)1941 Total amount of loan assets subjected to restructuring(corporate = bdcorp debt restruct
debt restructuring) = 1942 + 1943 + 19441942 Amount of standard assets subjected to re-structuring (corporate = bdcorp debt std restruct
debt restructuring)1943 Amount of sub-standard assets subjected to re-structuring = bd corp debt sub std restruct
(corporate debt restructuring)1944 Amount of doubtful assets subjected to restructuring (corporate = bdcorp debt doubtful restruct
debt restructuring)1945 Investment in shares, etc./financing against shares (for finance = bdsharesinvest and financing
cos. incl. banks) = 1946 + 1947 + 1948 + 1949 + 19501946 Investment in equity shares (for finance cos. incl. banks) = bd invest in equity shares1947 Investment in preference shares (for finance cos. incl. banks) = bd invest in pref shares
(Continued. . . )
Indicators August 2010
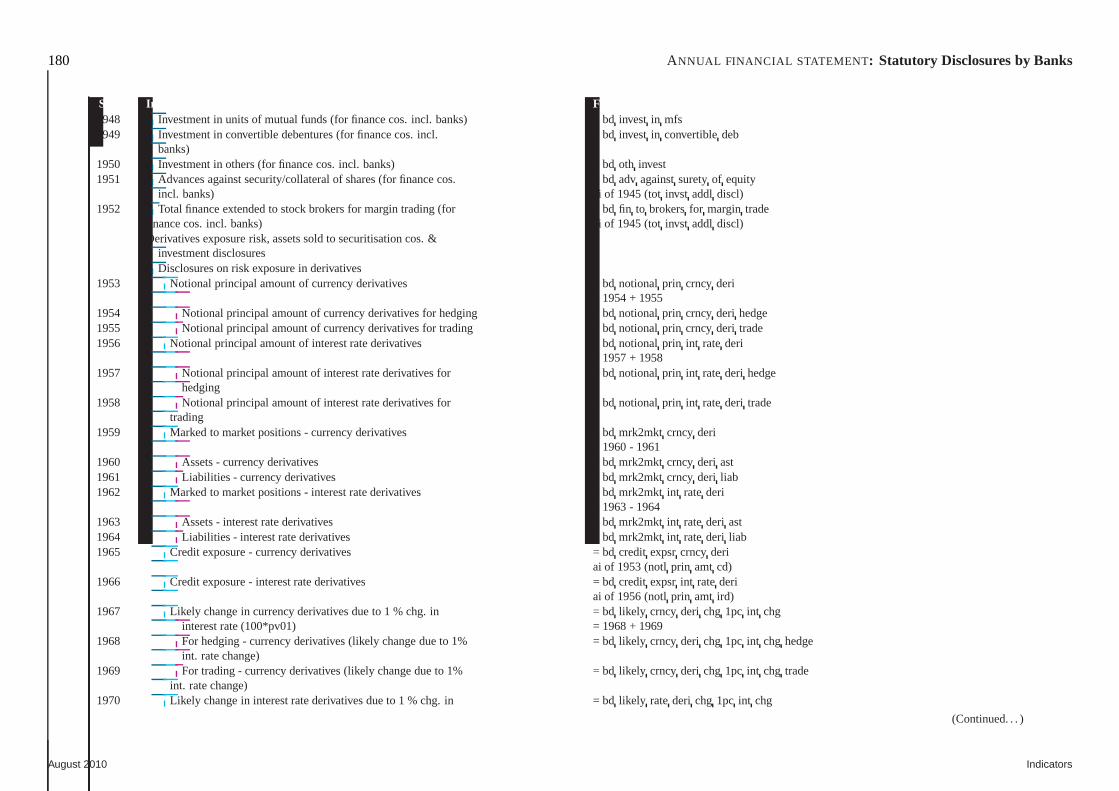
180 ANNUAL FINANCIAL STATEMENT : Statutory Disclosures by Banks
Sr.No. Indicator Fields & formula1948 Investment in units of mutual funds (for finance cos. incl. banks) = bdinvest in mfs1949 Investment in convertible debentures (for finance cos. incl. = bd invest in convertibledeb
banks)1950 Investment in others (for finance cos. incl. banks) = bd oth invest1951 Advances against security/collateral of shares (for finance cos. = bdadv againstsuretyof equity
incl. banks) ai of 1945 (totinvst addl discl)1952 Total finance extended to stock brokers for margin trading (for = bd fin to brokersfor margin trade
finance cos. incl. banks) ai of 1945 (totinvst addl discl)Derivatives exposure risk, assets sold to securitisation cos. &
investment disclosuresDisclosures on risk exposure in derivatives
1953 Notional principal amount of currency derivatives = bdnotional prin crncy deri= 1954 + 1955
1954 Notional principal amount of currency derivatives for hedging = bd notional prin crncy deri hedge1955 Notional principal amount of currency derivatives for trading = bd notional prin crncy deri trade1956 Notional principal amount of interest rate derivatives = bdnotional prin int ratederi
= 1957 + 19581957 Notional principal amount of interest rate derivatives for = bd notional prin int ratederi hedge
hedging1958 Notional principal amount of interest rate derivatives for = bd notional prin int ratederi trade
trading1959 Marked to market positions - currency derivatives = bdmrk2mkt crncy deri
= 1960 - 19611960 Assets - currency derivatives = bd mrk2mkt crncy deri ast1961 Liabilities - currency derivatives = bd mrk2mkt crncy deri liab1962 Marked to market positions - interest rate derivatives = bdmrk2mkt int ratederi
= 1963 - 19641963 Assets - interest rate derivatives = bd mrk2mkt int ratederi ast1964 Liabilities - interest rate derivatives = bd mrk2mkt int ratederi liab1965 Credit exposure - currency derivatives = bd credit expsrcrncy deri
ai of 1953 (notlprin amt cd)1966 Credit exposure - interest rate derivatives = bd credit expsr int ratederi
ai of 1956 (notlprin amt ird)1967 Likely change in currency derivatives due to 1 % chg. in = bdlikely crncy deri chg 1pc int chg
interest rate (100*pv01) = 1968 + 19691968 For hedging - currency derivatives (likely change due to 1% =bd likely crncy deri chg 1pc int chg hedge
int. rate change)1969 For trading - currency derivatives (likely change due to 1% =bd likely crncy deri chg 1pc int chg trade
int. rate change)1970 Likely change in interest rate derivatives due to 1 % chg. in =bd likely ratederi chg 1pc int chg
(Continued. . . )
August 2010 Indicators
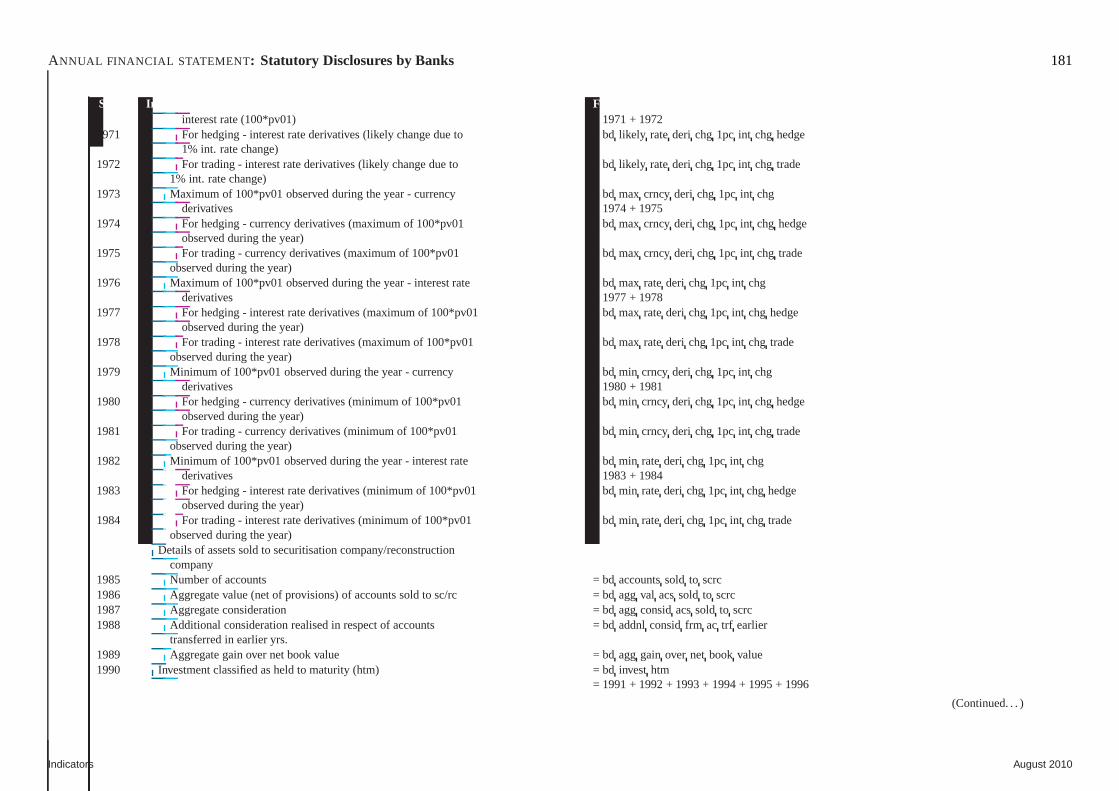
ANNUAL FINANCIAL STATEMENT : Statutory Disclosures by Banks 181
Sr.No. Indicator Fields & formulainterest rate (100*pv01) = 1971 + 1972
1971 For hedging - interest rate derivatives (likely change due to = bd likely ratederi chg 1pc int chg hedge1% int. rate change)
1972 For trading - interest rate derivatives (likely change due to = bd likely ratederi chg 1pc int chg trade1% int. rate change)
1973 Maximum of 100*pv01 observed during the year - currency = bdmax crncy deri chg 1pc int chgderivatives = 1974 + 1975
1974 For hedging - currency derivatives (maximum of 100*pv01 = bdmax crncy deri chg 1pc int chg hedgeobserved during the year)
1975 For trading - currency derivatives (maximum of 100*pv01 = bdmax crncy deri chg 1pc int chg tradeobserved during the year)
1976 Maximum of 100*pv01 observed during the year - interest rate = bd max ratederi chg 1pc int chgderivatives = 1977 + 1978
1977 For hedging - interest rate derivatives (maximum of 100*pv01 = bd max ratederi chg 1pc int chg hedgeobserved during the year)
1978 For trading - interest rate derivatives (maximum of 100*pv01 = bd max ratederi chg 1pc int chg tradeobserved during the year)
1979 Minimum of 100*pv01 observed during the year - currency = bdmin crncy deri chg 1pc int chgderivatives = 1980 + 1981
1980 For hedging - currency derivatives (minimum of 100*pv01 = bdmin crncy deri chg 1pc int chg hedgeobserved during the year)
1981 For trading - currency derivatives (minimum of 100*pv01 = bdmin crncy deri chg 1pc int chg tradeobserved during the year)
1982 Minimum of 100*pv01 observed during the year - interest rate = bd min ratederi chg 1pc int chgderivatives = 1983 + 1984
1983 For hedging - interest rate derivatives (minimum of 100*pv01 = bd min ratederi chg 1pc int chg hedgeobserved during the year)
1984 For trading - interest rate derivatives (minimum of 100*pv01 = bd min ratederi chg 1pc int chg tradeobserved during the year)
Details of assets sold to securitisation company/reconstructioncompany
1985 Number of accounts = bd accountssold to scrc1986 Aggregate value (net of provisions) of accounts sold to sc/rc = bd agg val acssold to scrc1987 Aggregate consideration = bd agg considacssold to scrc1988 Additional consideration realised in respect of accounts =bd addnl considfrm ac trf earlier
transferred in earlier yrs.1989 Aggregate gain over net book value = bd agg gain over net book value1990 Investment classified as held to maturity (htm) = bd invest htm
= 1991 + 1992 + 1993 + 1994 + 1995 + 1996
(Continued. . . )
Indicators August 2010
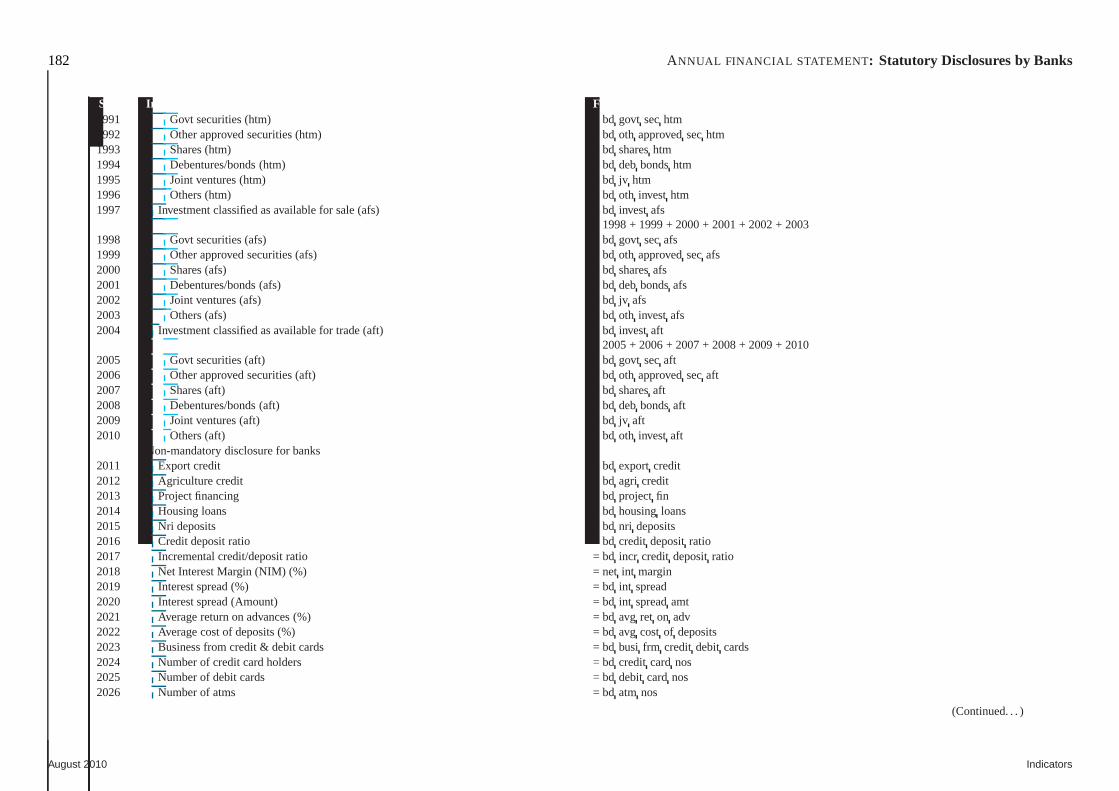
182 ANNUAL FINANCIAL STATEMENT : Statutory Disclosures by Banks
Sr.No. Indicator Fields & formula1991 Govt securities (htm) = bd govt sechtm1992 Other approved securities (htm) = bd oth approvedsechtm1993 Shares (htm) = bd shareshtm1994 Debentures/bonds (htm) = bd deb bondshtm1995 Joint ventures (htm) = bd jv htm1996 Others (htm) = bd oth invest htm1997 Investment classified as available for sale (afs) = bd invest afs
= 1998 + 1999 + 2000 + 2001 + 2002 + 20031998 Govt securities (afs) = bd govt secafs1999 Other approved securities (afs) = bd oth approvedsecafs2000 Shares (afs) = bd sharesafs2001 Debentures/bonds (afs) = bd deb bondsafs2002 Joint ventures (afs) = bd jv afs2003 Others (afs) = bd oth invest afs2004 Investment classified as available for trade (aft) = bd invest aft
= 2005 + 2006 + 2007 + 2008 + 2009 + 20102005 Govt securities (aft) = bd govt secaft2006 Other approved securities (aft) = bd oth approvedsecaft2007 Shares (aft) = bd sharesaft2008 Debentures/bonds (aft) = bd deb bondsaft2009 Joint ventures (aft) = bd jv aft2010 Others (aft) = bd oth invest aft
Non-mandatory disclosure for banks2011 Export credit = bd export credit2012 Agriculture credit = bd agri credit2013 Project financing = bd project fin2014 Housing loans = bd housingloans2015 Nri deposits = bd nri deposits2016 Credit deposit ratio = bd credit depositratio2017 Incremental credit/deposit ratio = bd incr credit depositratio2018 Net Interest Margin (NIM) (%) = net int margin2019 Interest spread (%) = bd int spread2020 Interest spread (Amount) = bd int spreadamt2021 Average return on advances (%) = bd avg ret on adv2022 Average cost of deposits (%) = bd avg cost of deposits2023 Business from credit & debit cards = bd busi frm credit debit cards2024 Number of credit card holders = bd credit card nos2025 Number of debit cards = bd debit card nos2026 Number of atms = bd atm nos
(Continued. . . )
August 2010 Indicators

ANNUAL FINANCIAL STATEMENT : Statutory Disclosures by Banks 183
Sr.No. Indicator Fields & formula2027 Working funds = bd working funds
Indicators August 2010
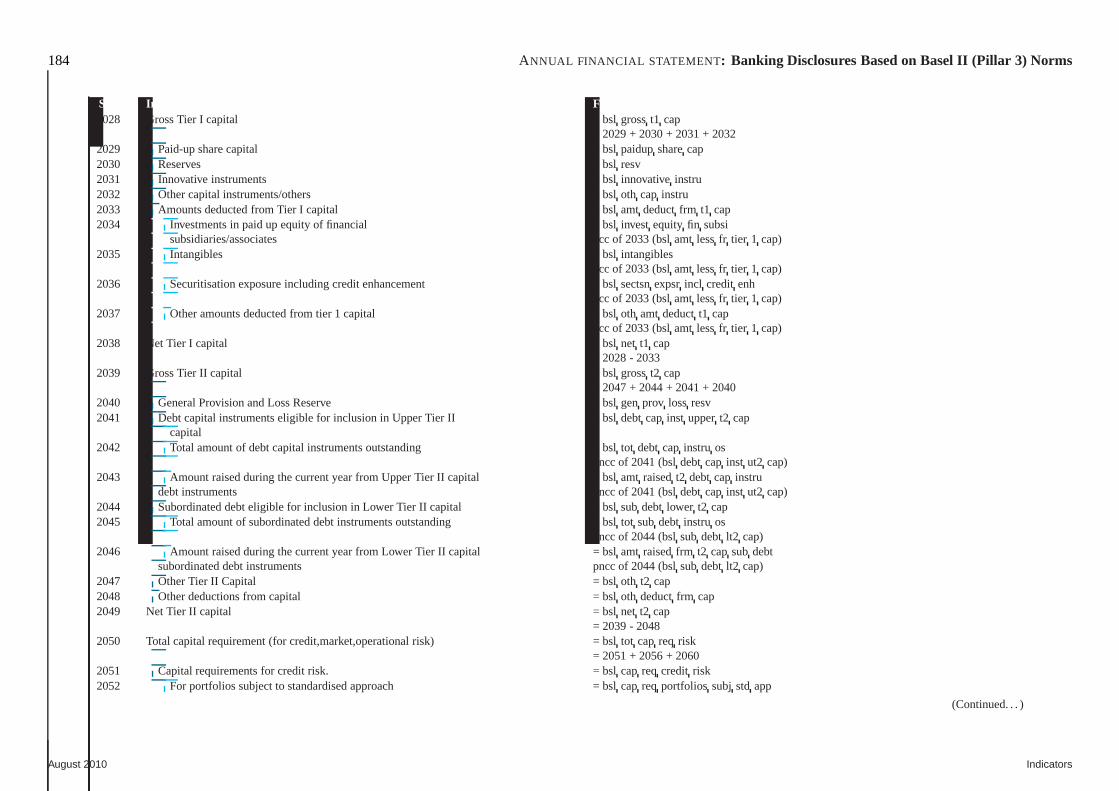
184 ANNUAL FINANCIAL STATEMENT : Banking Disclosures Based on Basel II (Pillar 3) Norms
Sr.No. Indicator Fields & formula2028 Gross Tier I capital = bsl grosst1 cap
= 2029 + 2030 + 2031 + 20322029 Paid-up share capital = bsl paidupsharecap2030 Reserves = bsl resv2031 Innovative instruments = bsl innovativeinstru2032 Other capital instruments/others = bsl oth cap instru2033 Amounts deducted from Tier I capital = bsl amt deductfrm t1 cap2034 Investments in paid up equity of financial = bsl invest equity fin subsi
subsidiaries/associates pcc of 2033 (bslamt lessfr tier 1 cap)2035 Intangibles = bsl intangibles
pcc of 2033 (bslamt lessfr tier 1 cap)2036 Securitisation exposure including credit enhancement = bsl sectsnexpsrincl credit enh
pcc of 2033 (bslamt lessfr tier 1 cap)2037 Other amounts deducted from tier 1 capital = bsl oth amt deductt1 cap
pcc of 2033 (bslamt lessfr tier 1 cap)2038 Net Tier I capital = bsl net t1 cap
= 2028 - 20332039 Gross Tier II capital = bsl grosst2 cap
= 2047 + 2044 + 2041 + 20402040 General Provision and Loss Reserve = bsl genprov loss resv2041 Debt capital instruments eligible for inclusion in Upper Tier II = bsl debt cap inst uppert2 cap
capital2042 Total amount of debt capital instruments outstanding = bsltot debt cap instru os
pncc of 2041 (bsldebt cap inst ut2 cap)2043 Amount raised during the current year from Upper Tier II capital = bsl amt raisedt2 debt cap instru
debt instruments pncc of 2041 (bsldebt cap inst ut2 cap)2044 Subordinated debt eligible for inclusion in Lower Tier II capital = bsl subdebt lower t2 cap2045 Total amount of subordinated debt instruments outstanding = bsl tot sub debt instru os
pncc of 2044 (bslsub debt lt2 cap)2046 Amount raised during the current year from Lower Tier II capital = bsl amt raisedfrm t2 capsub debt
subordinated debt instruments pncc of 2044 (bslsub debt lt2 cap)2047 Other Tier II Capital = bsl oth t2 cap2048 Other deductions from capital = bsl oth deductfrm cap2049 Net Tier II capital = bsl net t2 cap
= 2039 - 20482050 Total capital requirement (for credit,market,operational risk) = bsltot cap req risk
= 2051 + 2056 + 20602051 Capital requirements for credit risk. = bsl cap req credit risk2052 For portfolios subject to standardised approach = bsl cap req portfolios subj std app
(Continued. . . )
August 2010 Indicators
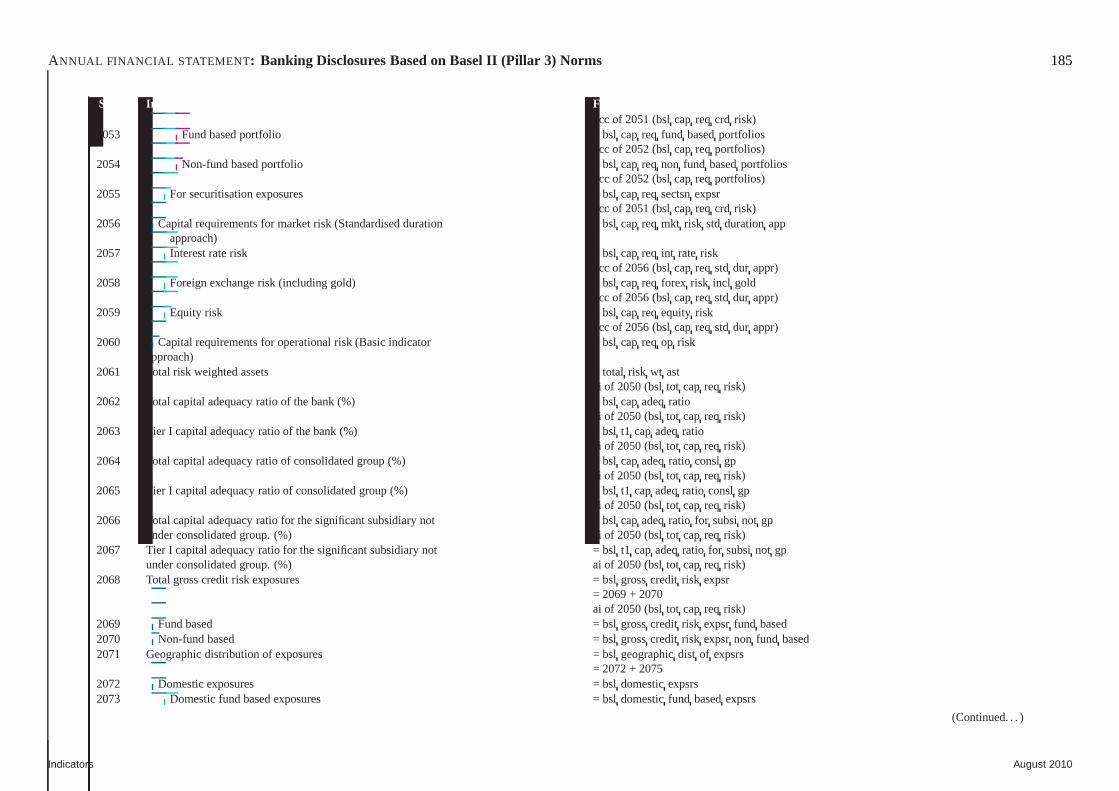
ANNUAL FINANCIAL STATEMENT : Banking Disclosures Based on Basel II (Pillar 3) Norms 185
Sr.No. Indicator Fields & formulapcc of 2051 (bslcap req crd risk)
2053 Fund based portfolio = bsl cap req fund basedportfoliospcc of 2052 (bslcap req portfolios)
2054 Non-fund based portfolio = bsl cap req non fund basedportfoliospcc of 2052 (bslcap req portfolios)
2055 For securitisation exposures = bsl cap req sectsnexpsrpcc of 2051 (bslcap req crd risk)
2056 Capital requirements for market risk (Standardised duration = bsl cap req mkt risk std durationappapproach)
2057 Interest rate risk = bsl cap req int rate riskpcc of 2056 (bslcap req std dur appr)
2058 Foreign exchange risk (including gold) = bsl cap req forex risk incl goldpcc of 2056 (bslcap req std dur appr)
2059 Equity risk = bsl cap req equity riskpcc of 2056 (bslcap req std dur appr)
2060 Capital requirements for operational risk (Basic indicator = bsl cap req op riskapproach)
2061 Total risk weighted assets = total risk wt astai of 2050 (bsltot cap req risk)
2062 Total capital adequacy ratio of the bank (%) = bsl capadeqratioai of 2050 (bsltot cap req risk)
2063 Tier I capital adequacy ratio of the bank (%) = bsl t1 capadeqratioai of 2050 (bsltot cap req risk)
2064 Total capital adequacy ratio of consolidated group (%) = bsl capadeqratio consl gpai of 2050 (bsltot cap req risk)
2065 Tier I capital adequacy ratio of consolidated group (%) = bsl t1 capadeqratio consl gpai of 2050 (bsltot cap req risk)
2066 Total capital adequacy ratio for the significant subsidiary not = bslcapadeqratio for subsinot gpunder consolidated group. (%) ai of 2050 (bsltot cap req risk)
2067 Tier I capital adequacy ratio for the significant subsidiary not = bslt1 capadeqratio for subsinot gpunder consolidated group. (%) ai of 2050 (bsltot cap req risk)
2068 Total gross credit risk exposures = bsl grosscredit risk expsr= 2069 + 2070ai of 2050 (bsltot cap req risk)
2069 Fund based = bsl grosscredit risk expsrfund based2070 Non-fund based = bsl grosscredit risk expsrnon fund based2071 Geographic distribution of exposures = bsl geographicdist of expsrs
= 2072 + 20752072 Domestic exposures = bsl domesticexpsrs2073 Domestic fund based exposures = bsl domesticfund basedexpsrs
(Continued. . . )
Indicators August 2010
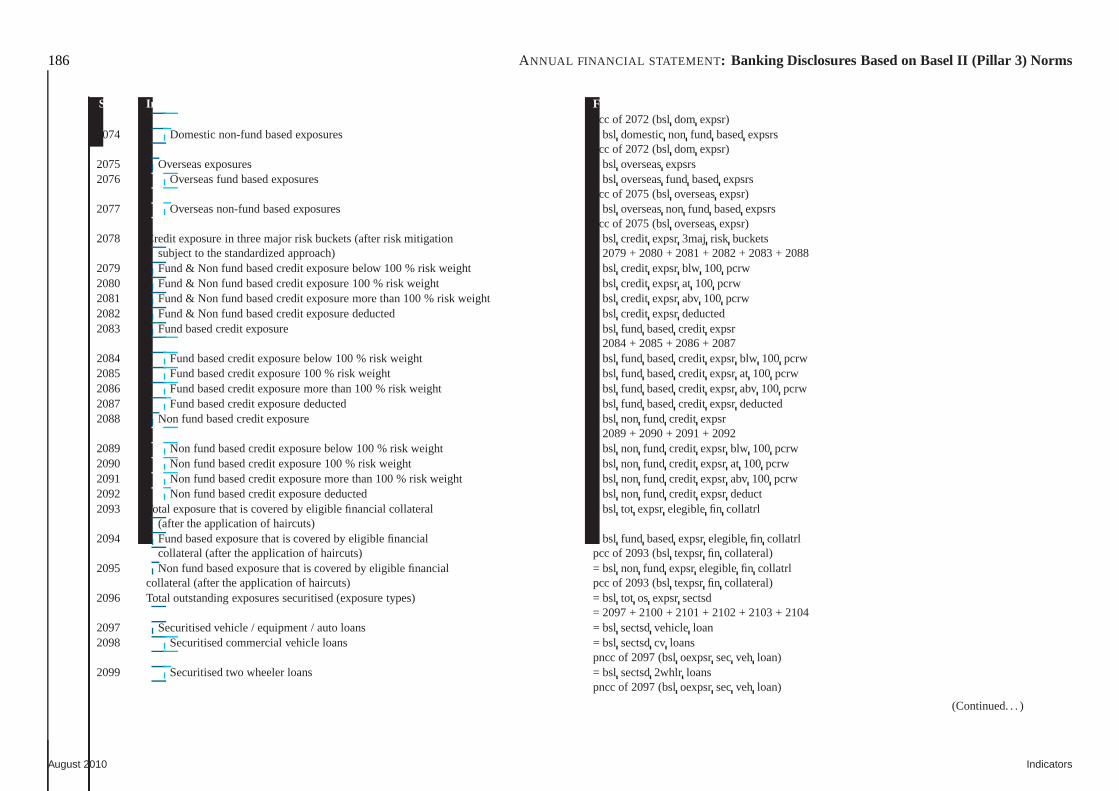
186 ANNUAL FINANCIAL STATEMENT : Banking Disclosures Based on Basel II (Pillar 3) Norms
Sr.No. Indicator Fields & formulapcc of 2072 (bsldom expsr)
2074 Domestic non-fund based exposures = bsl domesticnon fund basedexpsrspcc of 2072 (bsldom expsr)
2075 Overseas exposures = bsl overseasexpsrs2076 Overseas fund based exposures = bsl overseasfund basedexpsrs
pcc of 2075 (bsloverseasexpsr)2077 Overseas non-fund based exposures = bsl overseasnon fund basedexpsrs
pcc of 2075 (bsloverseasexpsr)2078 Credit exposure in three major risk buckets (after riskmitigation = bslcredit expsr3maj risk buckets
subject to the standardized approach) = 2079 + 2080 + 2081 + 2082 + 2083 + 20882079 Fund & Non fund based credit exposure below 100 % risk weight =bsl credit expsrblw 100 pcrw2080 Fund & Non fund based credit exposure 100 % risk weight = bslcredit expsrat 100 pcrw2081 Fund & Non fund based credit exposure more than 100 % risk weight = bsl credit expsrabv 100 pcrw2082 Fund & Non fund based credit exposure deducted = bsl credit expsrdeducted2083 Fund based credit exposure = bsl fund basedcredit expsr
= 2084 + 2085 + 2086 + 20872084 Fund based credit exposure below 100 % risk weight = bslfund basedcredit expsrblw 100 pcrw2085 Fund based credit exposure 100 % risk weight = bsl fund basedcredit expsrat 100 pcrw2086 Fund based credit exposure more than 100 % risk weight = bslfund basedcredit expsrabv 100 pcrw2087 Fund based credit exposure deducted = bsl fund basedcredit expsrdeducted2088 Non fund based credit exposure = bsl non fund credit expsr
= 2089 + 2090 + 2091 + 20922089 Non fund based credit exposure below 100 % risk weight = bslnon fund credit expsrblw 100 pcrw2090 Non fund based credit exposure 100 % risk weight = bslnon fund credit expsrat 100 pcrw2091 Non fund based credit exposure more than 100 % risk weight = bsl non fund credit expsrabv 100 pcrw2092 Non fund based credit exposure deducted = bsl non fund credit expsrdeduct2093 Total exposure that is covered by eligible financial collateral = bsltot expsrelegiblefin collatrl
(after the application of haircuts)2094 Fund based exposure that is covered by eligible financial = bsl fund basedexpsrelegiblefin collatrl
collateral (after the application of haircuts) pcc of 2093 (bsltexpsrfin collateral)2095 Non fund based exposure that is covered by eligible financial = bsl non fund expsrelegiblefin collatrl
collateral (after the application of haircuts) pcc of 2093 (bsltexpsrfin collateral)2096 Total outstanding exposures securitised (exposure types) = bsltot os expsrsectsd
= 2097 + 2100 + 2101 + 2102 + 2103 + 21042097 Securitised vehicle / equipment / auto loans = bsl sectsdvehicle loan2098 Securitised commercial vehicle loans = bsl sectsdcv loans
pncc of 2097 (bsloexpsrsecveh loan)2099 Securitised two wheeler loans = bsl sectsd2whlr loans
pncc of 2097 (bsloexpsrsecveh loan)
(Continued. . . )
August 2010 Indicators
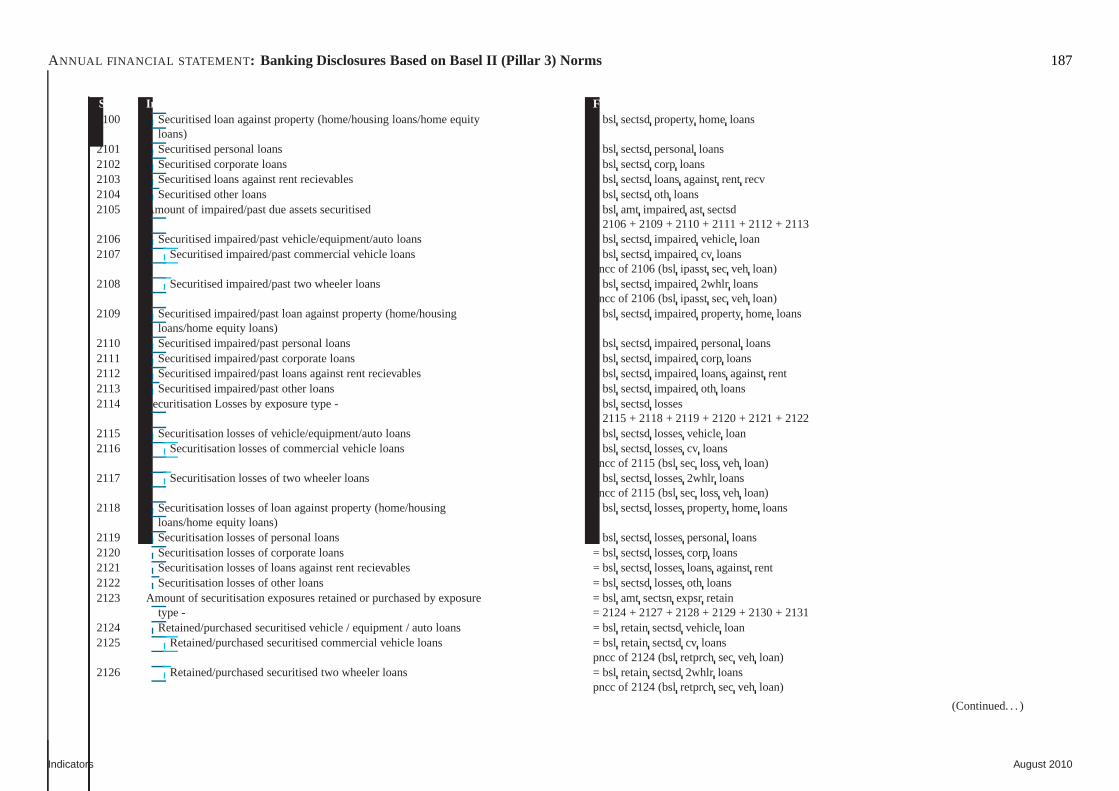
ANNUAL FINANCIAL STATEMENT : Banking Disclosures Based on Basel II (Pillar 3) Norms 187
Sr.No. Indicator Fields & formula2100 Securitised loan against property (home/housing loans/home equity = bslsectsdpropertyhomeloans
loans)2101 Securitised personal loans = bsl sectsdpersonalloans2102 Securitised corporate loans = bsl sectsdcorp loans2103 Securitised loans against rent recievables = bsl sectsdloansagainstrent recv2104 Securitised other loans = bsl sectsdoth loans2105 Amount of impaired/past due assets securitised = bsl amt impairedast sectsd
= 2106 + 2109 + 2110 + 2111 + 2112 + 21132106 Securitised impaired/past vehicle/equipment/auto loans = bsl sectsdimpairedvehicle loan2107 Securitised impaired/past commercial vehicle loans = bslsectsdimpairedcv loans
pncc of 2106 (bslipasstsecveh loan)2108 Securitised impaired/past two wheeler loans = bsl sectsdimpaired2whlr loans
pncc of 2106 (bslipasstsecveh loan)2109 Securitised impaired/past loan against property (home/housing = bslsectsdimpairedpropertyhomeloans
loans/home equity loans)2110 Securitised impaired/past personal loans = bsl sectsdimpairedpersonalloans2111 Securitised impaired/past corporate loans = bsl sectsdimpairedcorp loans2112 Securitised impaired/past loans against rent recievables = bsl sectsdimpairedloansagainstrent2113 Securitised impaired/past other loans = bsl sectsdimpairedoth loans2114 Securitisation Losses by exposure type - = bsl sectsdlosses
= 2115 + 2118 + 2119 + 2120 + 2121 + 21222115 Securitisation losses of vehicle/equipment/auto loans = bsl sectsdlossesvehicle loan2116 Securitisation losses of commercial vehicle loans = bslsectsdlossescv loans
pncc of 2115 (bslseclossveh loan)2117 Securitisation losses of two wheeler loans = bsl sectsdlosses2whlr loans
pncc of 2115 (bslseclossveh loan)2118 Securitisation losses of loan against property (home/housing = bsl sectsdlossespropertyhomeloans
loans/home equity loans)2119 Securitisation losses of personal loans = bsl sectsdlossespersonalloans2120 Securitisation losses of corporate loans = bsl sectsdlossescorp loans2121 Securitisation losses of loans against rent recievables = bsl sectsdlossesloansagainstrent2122 Securitisation losses of other loans = bsl sectsdlossesoth loans2123 Amount of securitisation exposures retained or purchased by exposure = bslamt sectsnexpsrretain
type - = 2124 + 2127 + 2128 + 2129 + 2130 + 21312124 Retained/purchased securitised vehicle / equipment / autoloans = bslretainsectsdvehicle loan2125 Retained/purchased securitised commercial vehicle loans = bsl retainsectsdcv loans
pncc of 2124 (bslretprchsecveh loan)2126 Retained/purchased securitised two wheeler loans = bslretainsectsd2whlr loans
pncc of 2124 (bslretprchsecveh loan)
(Continued. . . )
Indicators August 2010
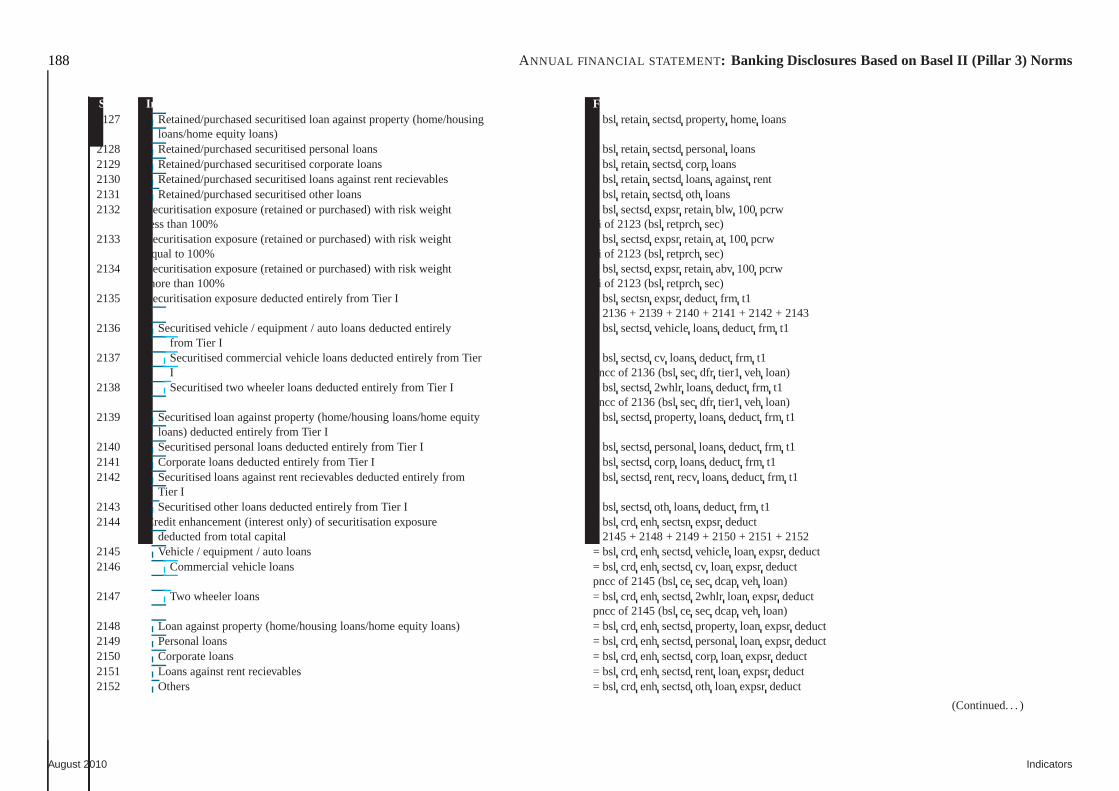
188 ANNUAL FINANCIAL STATEMENT : Banking Disclosures Based on Basel II (Pillar 3) Norms
Sr.No. Indicator Fields & formula2127 Retained/purchased securitised loan against property (home/housing = bslretainsectsdpropertyhomeloans
loans/home equity loans)2128 Retained/purchased securitised personal loans = bsl retainsectsdpersonalloans2129 Retained/purchased securitised corporate loans = bsl retainsectsdcorp loans2130 Retained/purchased securitised loans against rent recievables = bslretainsectsdloansagainstrent2131 Retained/purchased securitised other loans = bsl retainsectsdoth loans2132 Securitisation exposure (retained or purchased) withrisk weight = bslsectsdexpsrretainblw 100 pcrw
less than 100% ai of 2123 (bslretprchsec)2133 Securitisation exposure (retained or purchased) withrisk weight = bslsectsdexpsrretainat 100 pcrw
equal to 100% ai of 2123 (bslretprchsec)2134 Securitisation exposure (retained or purchased) withrisk weight = bslsectsdexpsrretainabv 100 pcrw
more than 100% ai of 2123 (bslretprchsec)2135 Securitisation exposure deducted entirely from Tier I = bsl sectsnexpsrdeductfrm t1
= 2136 + 2139 + 2140 + 2141 + 2142 + 21432136 Securitised vehicle / equipment / auto loans deducted entirely = bsl sectsdvehicle loansdeductfrm t1
from Tier I2137 Securitised commercial vehicle loans deducted entirely from Tier = bslsectsdcv loansdeductfrm t1
I pncc of 2136 (bslsecdfr tier1 veh loan)2138 Securitised two wheeler loans deducted entirely from Tier I = bsl sectsd2whlr loansdeductfrm t1
pncc of 2136 (bslsecdfr tier1 veh loan)2139 Securitised loan against property (home/housing loans/home equity = bslsectsdpropertyloansdeductfrm t1
loans) deducted entirely from Tier I2140 Securitised personal loans deducted entirely from Tier I = bsl sectsdpersonalloansdeductfrm t12141 Corporate loans deducted entirely from Tier I = bsl sectsdcorp loansdeductfrm t12142 Securitised loans against rent recievables deducted entirely from = bsl sectsdrent recv loansdeductfrm t1
Tier I2143 Securitised other loans deducted entirely from Tier I = bslsectsdoth loansdeductfrm t12144 Credit enhancement (interest only) of securitisationexposure = bslcrd enh sectsnexpsrdeduct
deducted from total capital = 2145 + 2148 + 2149 + 2150 + 2151 + 21522145 Vehicle / equipment / auto loans = bsl crd enh sectsdvehicle loan expsrdeduct2146 Commercial vehicle loans = bsl crd enh sectsdcv loan expsrdeduct
pncc of 2145 (bslce secdcapveh loan)2147 Two wheeler loans = bsl crd enh sectsd2whlr loan expsrdeduct
pncc of 2145 (bslce secdcapveh loan)2148 Loan against property (home/housing loans/home equity loans) = bslcrd enh sectsdpropertyloan expsrdeduct2149 Personal loans = bsl crd enh sectsdpersonalloan expsrdeduct2150 Corporate loans = bsl crd enh sectsdcorp loan expsrdeduct2151 Loans against rent recievables = bsl crd enh sectsdrent loan expsrdeduct2152 Others = bsl crd enh sectsdoth loan expsrdeduct
(Continued. . . )
August 2010 Indicators
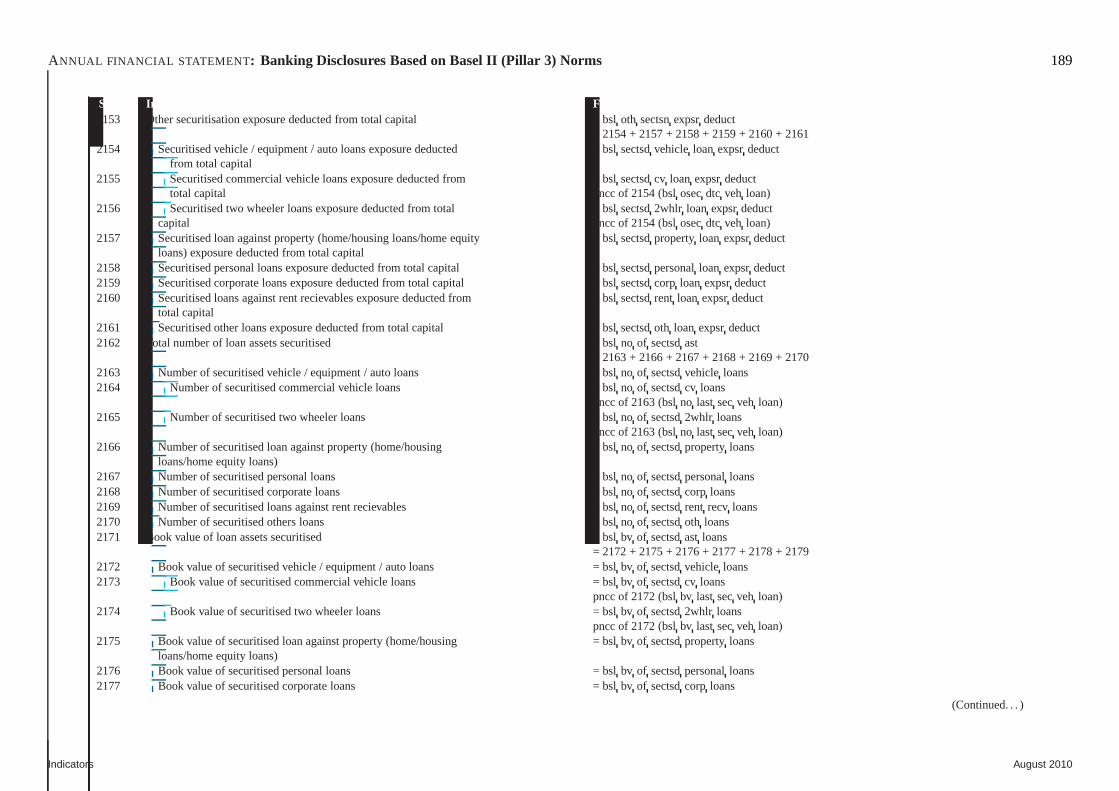
ANNUAL FINANCIAL STATEMENT : Banking Disclosures Based on Basel II (Pillar 3) Norms 189
Sr.No. Indicator Fields & formula2153 Other securitisation exposure deducted from total capital = bsl oth sectsnexpsrdeduct
= 2154 + 2157 + 2158 + 2159 + 2160 + 21612154 Securitised vehicle / equipment / auto loans exposure deducted = bslsectsdvehicle loan expsrdeduct
from total capital2155 Securitised commercial vehicle loans exposure deducted from = bsl sectsdcv loan expsrdeduct
total capital pncc of 2154 (bslosecdtc veh loan)2156 Securitised two wheeler loans exposure deducted from total = bsl sectsd2whlr loan expsrdeduct
capital pncc of 2154 (bslosecdtc veh loan)2157 Securitised loan against property (home/housing loans/home equity = bslsectsdpropertyloan expsrdeduct
loans) exposure deducted from total capital2158 Securitised personal loans exposure deducted from total capital = bsl sectsdpersonalloan expsrdeduct2159 Securitised corporate loans exposure deducted from total capital = bslsectsdcorp loan expsrdeduct2160 Securitised loans against rent recievables exposure deducted from = bslsectsdrent loan expsrdeduct
total capital2161 Securitised other loans exposure deducted from total capital = bsl sectsdoth loan expsrdeduct2162 Total number of loan assets securitised = bsl no of sectsdast
= 2163 + 2166 + 2167 + 2168 + 2169 + 21702163 Number of securitised vehicle / equipment / auto loans = bslno of sectsdvehicle loans2164 Number of securitised commercial vehicle loans = bslno of sectsdcv loans
pncc of 2163 (bslno last secveh loan)2165 Number of securitised two wheeler loans = bsl no of sectsd2whlr loans
pncc of 2163 (bslno last secveh loan)2166 Number of securitised loan against property (home/housing = bsl no of sectsdpropertyloans
loans/home equity loans)2167 Number of securitised personal loans = bsl no of sectsdpersonalloans2168 Number of securitised corporate loans = bsl no of sectsdcorp loans2169 Number of securitised loans against rent recievables = bslno of sectsdrent recv loans2170 Number of securitised others loans = bsl no of sectsdoth loans2171 Book value of loan assets securitised = bsl bv of sectsdast loans
= 2172 + 2175 + 2176 + 2177 + 2178 + 21792172 Book value of securitised vehicle / equipment / auto loans = bsl bv of sectsdvehicle loans2173 Book value of securitised commercial vehicle loans = bslbv of sectsdcv loans
pncc of 2172 (bslbv last secveh loan)2174 Book value of securitised two wheeler loans = bsl bv of sectsd2whlr loans
pncc of 2172 (bslbv last secveh loan)2175 Book value of securitised loan against property (home/housing = bsl bv of sectsdpropertyloans
loans/home equity loans)2176 Book value of securitised personal loans = bsl bv of sectsdpersonalloans2177 Book value of securitised corporate loans = bsl bv of sectsdcorp loans
(Continued. . . )
Indicators August 2010
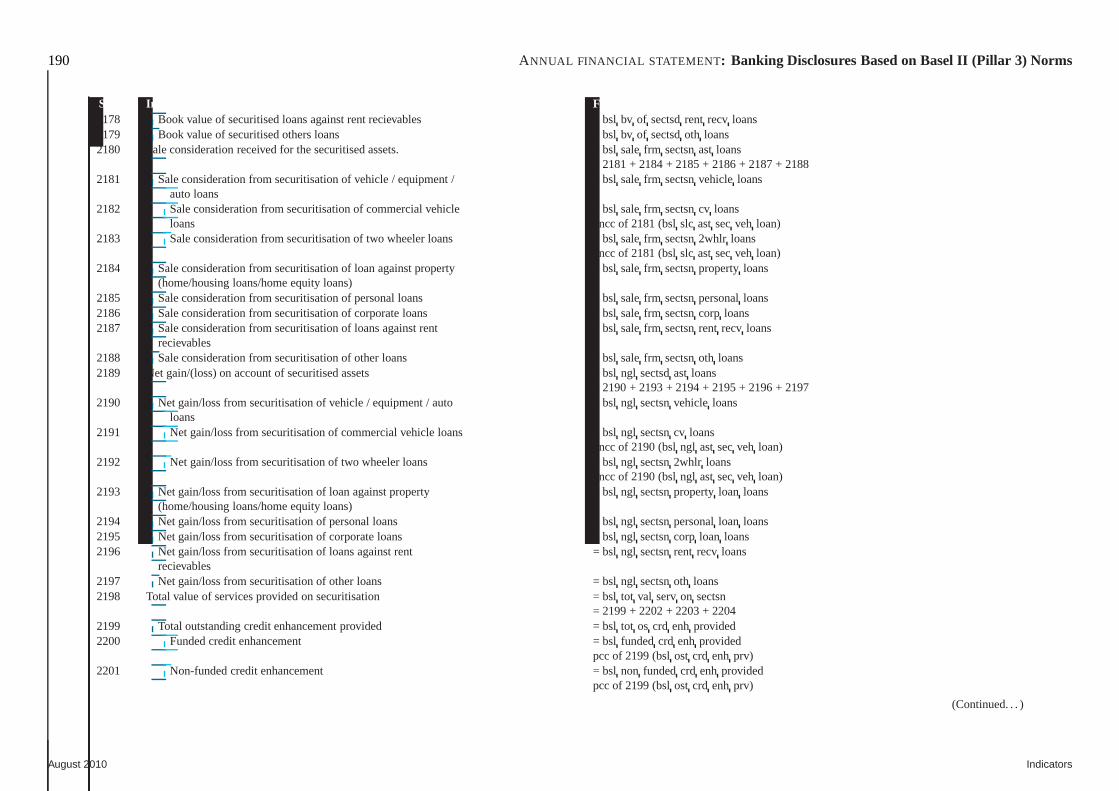
190 ANNUAL FINANCIAL STATEMENT : Banking Disclosures Based on Basel II (Pillar 3) Norms
Sr.No. Indicator Fields & formula2178 Book value of securitised loans against rent recievables = bsl bv of sectsdrent recv loans2179 Book value of securitised others loans = bsl bv of sectsdoth loans2180 Sale consideration received for the securitised assets. = bslsalefrm sectsnast loans
= 2181 + 2184 + 2185 + 2186 + 2187 + 21882181 Sale consideration from securitisation of vehicle / equipment / = bslsalefrm sectsnvehicle loans
auto loans2182 Sale consideration from securitisation of commercial vehicle = bsl salefrm sectsncv loans
loans pncc of 2181 (bslslc ast secveh loan)2183 Sale consideration from securitisation of two wheeler loans = bsl salefrm sectsn2whlr loans
pncc of 2181 (bslslc ast secveh loan)2184 Sale consideration from securitisation of loan against property = bslsalefrm sectsnpropertyloans
(home/housing loans/home equity loans)2185 Sale consideration from securitisation of personal loans =bsl salefrm sectsnpersonalloans2186 Sale consideration from securitisation of corporate loans = bsl salefrm sectsncorp loans2187 Sale consideration from securitisation of loans against rent = bsl salefrm sectsnrent recv loans
recievables2188 Sale consideration from securitisation of other loans = bslsalefrm sectsnoth loans2189 Net gain/(loss) on account of securitised assets = bsl ngl sectsdast loans
= 2190 + 2193 + 2194 + 2195 + 2196 + 21972190 Net gain/loss from securitisation of vehicle / equipment / auto = bslngl sectsnvehicle loans
loans2191 Net gain/loss from securitisation of commercial vehicle loans = bslngl sectsncv loans
pncc of 2190 (bslngl ast secveh loan)2192 Net gain/loss from securitisation of two wheeler loans = bslngl sectsn2whlr loans
pncc of 2190 (bslngl ast secveh loan)2193 Net gain/loss from securitisation of loan against property = bsl ngl sectsnpropertyloan loans
(home/housing loans/home equity loans)2194 Net gain/loss from securitisation of personal loans = bsl ngl sectsnpersonalloan loans2195 Net gain/loss from securitisation of corporate loans = bslngl sectsncorp loan loans2196 Net gain/loss from securitisation of loans against rent = bsl ngl sectsnrent recv loans
recievables2197 Net gain/loss from securitisation of other loans = bsl ngl sectsnoth loans2198 Total value of services provided on securitisation = bsl tot val servon sectsn
= 2199 + 2202 + 2203 + 22042199 Total outstanding credit enhancement provided = bsl tot os crd enh provided2200 Funded credit enhancement = bsl fundedcrd enh provided
pcc of 2199 (bslost crd enh prv)2201 Non-funded credit enhancement = bsl non fundedcrd enh provided
pcc of 2199 (bslost crd enh prv)
(Continued. . . )
August 2010 Indicators
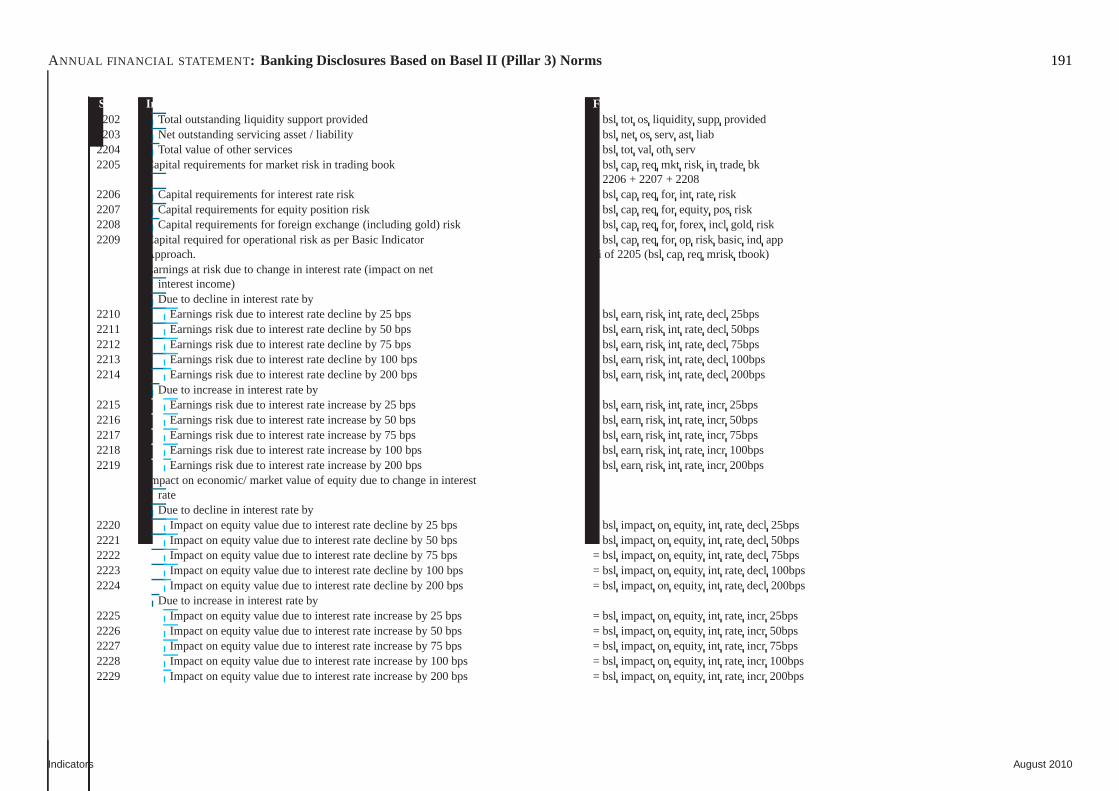
ANNUAL FINANCIAL STATEMENT : Banking Disclosures Based on Basel II (Pillar 3) Norms 191
Sr.No. Indicator Fields & formula2202 Total outstanding liquidity support provided = bsl tot os liquidity suppprovided2203 Net outstanding servicing asset / liability = bsl net os servast liab2204 Total value of other services = bsl tot val oth serv2205 Capital requirements for market risk in trading book = bsl cap req mkt risk in tradebk
= 2206 + 2207 + 22082206 Capital requirements for interest rate risk = bsl cap req for int rate risk2207 Capital requirements for equity position risk = bsl cap req for equity pos risk2208 Capital requirements for foreign exchange (including gold) risk = bsl cap req for forex incl gold risk2209 Capital required for operational risk as per Basic Indicator = bslcap req for op risk basicind app
Approach. ai of 2205 (bslcap req mrisk tbook)Earnings at risk due to change in interest rate (impact on net
interest income)Due to decline in interest rate by
2210 Earnings risk due to interest rate decline by 25 bps = bslearnrisk int ratedecl 25bps2211 Earnings risk due to interest rate decline by 50 bps = bslearnrisk int ratedecl 50bps2212 Earnings risk due to interest rate decline by 75 bps = bslearnrisk int ratedecl 75bps2213 Earnings risk due to interest rate decline by 100 bps = bslearnrisk int ratedecl 100bps2214 Earnings risk due to interest rate decline by 200 bps = bslearnrisk int ratedecl 200bps
Due to increase in interest rate by2215 Earnings risk due to interest rate increase by 25 bps = bslearnrisk int rate incr 25bps2216 Earnings risk due to interest rate increase by 50 bps = bslearnrisk int rate incr 50bps2217 Earnings risk due to interest rate increase by 75 bps = bslearnrisk int rate incr 75bps2218 Earnings risk due to interest rate increase by 100 bps = bslearnrisk int rate incr 100bps2219 Earnings risk due to interest rate increase by 200 bps = bslearnrisk int rate incr 200bps
Impact on economic/ market value of equity due to change in interestrateDue to decline in interest rate by
2220 Impact on equity value due to interest rate decline by 25 bps =bsl impact on equity int ratedecl 25bps2221 Impact on equity value due to interest rate decline by 50 bps =bsl impact on equity int ratedecl 50bps2222 Impact on equity value due to interest rate decline by 75 bps =bsl impact on equity int ratedecl 75bps2223 Impact on equity value due to interest rate decline by 100 bps = bsl impact on equity int ratedecl 100bps2224 Impact on equity value due to interest rate decline by 200 bps = bsl impact on equity int ratedecl 200bps
Due to increase in interest rate by2225 Impact on equity value due to interest rate increase by 25 bps = bsl impact on equity int rate incr 25bps2226 Impact on equity value due to interest rate increase by 50 bps = bsl impact on equity int rate incr 50bps2227 Impact on equity value due to interest rate increase by 75 bps = bsl impact on equity int rate incr 75bps2228 Impact on equity value due to interest rate increase by 100 bps = bsl impact on equity int rate incr 100bps2229 Impact on equity value due to interest rate increase by 200 bps = bsl impact on equity int rate incr 200bps
Indicators August 2010
192 ANNUAL FINANCIAL STATEMENT : Banking Disclosures Based on Basel II (Pillar 3) Norms
August 2010 Indicators

ANNUAL FINANCIAL STATEMENT : Capital Requirement for Risk Areas 193
Sr.No. Indicator Fields & formula2230 Total Capital required = (bsl cap req credit risk + bsl cap req mkt risk std durationapp +
bsl cap req op risk)= (2051 + 2056 + 2060)
Indicators August 2010
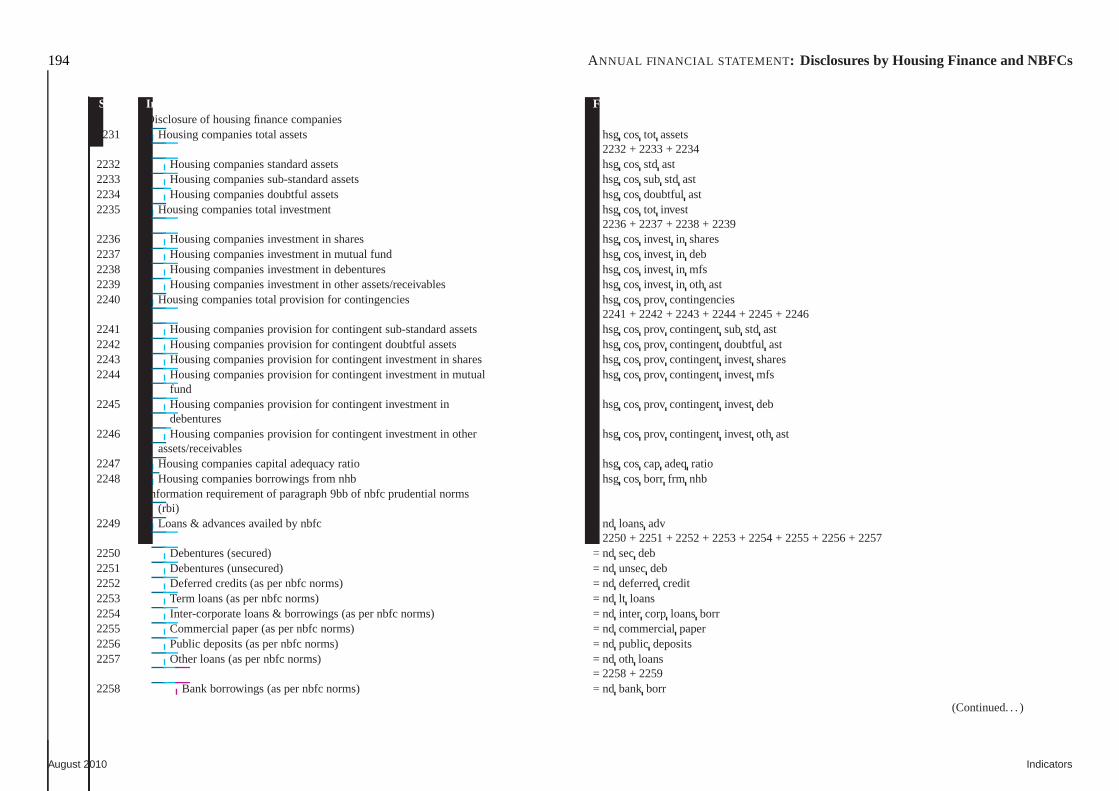
194 ANNUAL FINANCIAL STATEMENT : Disclosures by Housing Finance and NBFCs
Sr.No. Indicator Fields & formulaDisclosure of housing finance companies
2231 Housing companies total assets = hsgcos tot assets= 2232 + 2233 + 2234
2232 Housing companies standard assets = hsgcos std ast2233 Housing companies sub-standard assets = hsgcos substd ast2234 Housing companies doubtful assets = hsgcos doubtful ast2235 Housing companies total investment = hsgcos tot invest
= 2236 + 2237 + 2238 + 22392236 Housing companies investment in shares = hsgcos invest in shares2237 Housing companies investment in mutual fund = hsgcos invest in deb2238 Housing companies investment in debentures = hsgcos invest in mfs2239 Housing companies investment in other assets/receivables = hsgcos invest in oth ast2240 Housing companies total provision for contingencies = hsgcos prov contingencies
= 2241 + 2242 + 2243 + 2244 + 2245 + 22462241 Housing companies provision for contingent sub-standard assets = hsgcos prov contingentsubstd ast2242 Housing companies provision for contingent doubtful assets = hsgcos prov contingentdoubtful ast2243 Housing companies provision for contingent investment in shares = hsgcos prov contingentinvest shares2244 Housing companies provision for contingent investment in mutual = hsgcos prov contingentinvest mfs
fund2245 Housing companies provision for contingent investment in =hsg cos prov contingentinvest deb
debentures2246 Housing companies provision for contingent investment in other = hsgcos prov contingentinvest oth ast
assets/receivables2247 Housing companies capital adequacy ratio = hsgcos capadeqratio2248 Housing companies borrowings from nhb = hsgcos borr frm nhb
Information requirement of paragraph 9bb of nbfc prudential norms(rbi)
2249 Loans & advances availed by nbfc = nd loansadv= 2250 + 2251 + 2252 + 2253 + 2254 + 2255 + 2256 + 2257
2250 Debentures (secured) = nd secdeb2251 Debentures (unsecured) = nd unsecdeb2252 Deferred credits (as per nbfc norms) = nd deferredcredit2253 Term loans (as per nbfc norms) = nd lt loans2254 Inter-corporate loans & borrowings (as per nbfc norms) = ndinter corp loansborr2255 Commercial paper (as per nbfc norms) = nd commercialpaper2256 Public deposits (as per nbfc norms) = nd public deposits2257 Other loans (as per nbfc norms) = nd oth loans
= 2258 + 22592258 Bank borrowings (as per nbfc norms) = nd bank borr
(Continued. . . )
August 2010 Indicators
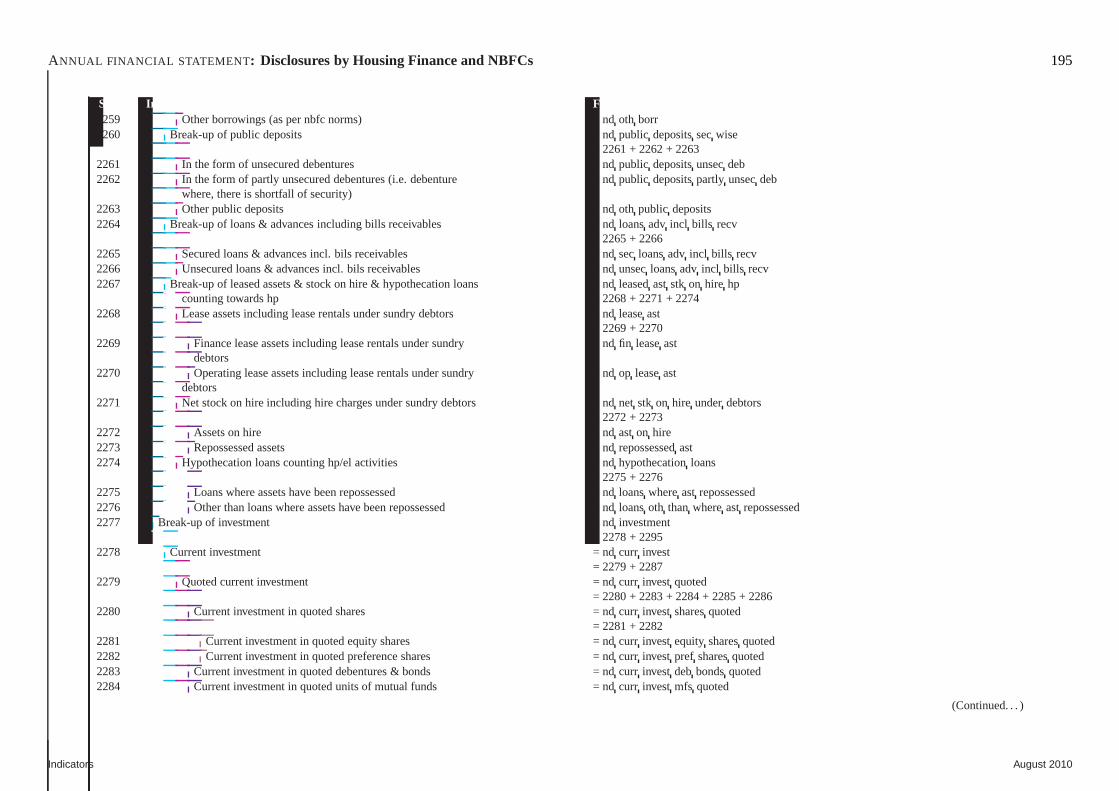
ANNUAL FINANCIAL STATEMENT : Disclosures by Housing Finance and NBFCs 195
Sr.No. Indicator Fields & formula2259 Other borrowings (as per nbfc norms) = nd oth borr2260 Break-up of public deposits = nd public depositssecwise
= 2261 + 2262 + 22632261 In the form of unsecured debentures = nd public depositsunsecdeb2262 In the form of partly unsecured debentures (i.e. debenture =nd public depositspartly unsecdeb
where, there is shortfall of security)2263 Other public deposits = nd oth public deposits2264 Break-up of loans & advances including bills receivables = nd loansadv incl bills recv
= 2265 + 22662265 Secured loans & advances incl. bils receivables = ndsecloansadv incl bills recv2266 Unsecured loans & advances incl. bils receivables = ndunsecloansadv incl bills recv2267 Break-up of leased assets & stock on hire & hypothecation loans = ndleasedast stk on hire hp
counting towards hp = 2268 + 2271 + 22742268 Lease assets including lease rentals under sundry debtors =nd leaseast
= 2269 + 22702269 Finance lease assets including lease rentals under sundry =nd fin leaseast
debtors2270 Operating lease assets including lease rentals under sundry = nd op leaseast
debtors2271 Net stock on hire including hire charges under sundry debtors = ndnet stk on hire underdebtors
= 2272 + 22732272 Assets on hire = nd ast on hire2273 Repossessed assets = nd repossessedast2274 Hypothecation loans counting hp/el activities = nd hypothecationloans
= 2275 + 22762275 Loans where assets have been repossessed = nd loanswhereast repossessed2276 Other than loans where assets have been repossessed = ndloansoth than whereast repossessed2277 Break-up of investment = nd investment
= 2278 + 22952278 Current investment = nd curr invest
= 2279 + 22872279 Quoted current investment = nd curr invest quoted
= 2280 + 2283 + 2284 + 2285 + 22862280 Current investment in quoted shares = nd curr invest sharesquoted
= 2281 + 22822281 Current investment in quoted equity shares = ndcurr invest equity sharesquoted2282 Current investment in quoted preference shares = ndcurr invest pref sharesquoted2283 Current investment in quoted debentures & bonds = ndcurr invest debbondsquoted2284 Current investment in quoted units of mutual funds = ndcurr invest mfs quoted
(Continued. . . )
Indicators August 2010
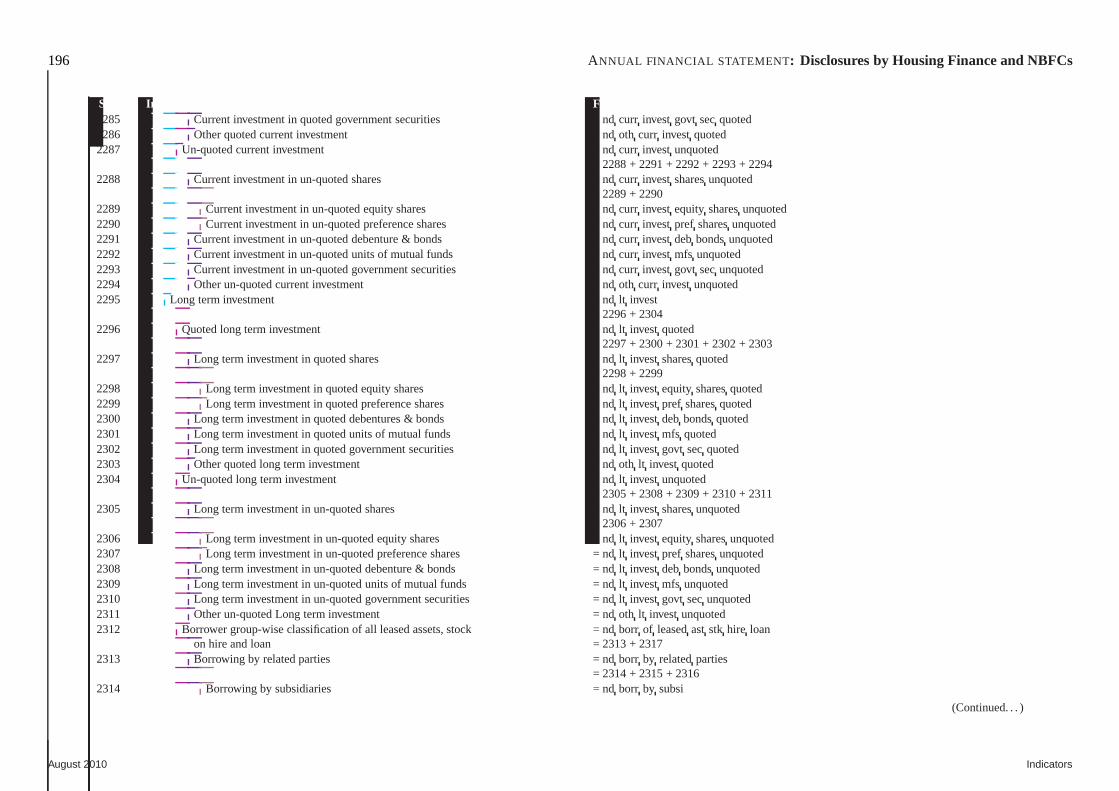
196 ANNUAL FINANCIAL STATEMENT : Disclosures by Housing Finance and NBFCs
Sr.No. Indicator Fields & formula2285 Current investment in quoted government securities = ndcurr invest govt secquoted2286 Other quoted current investment = nd oth curr invest quoted2287 Un-quoted current investment = nd curr invest unquoted
= 2288 + 2291 + 2292 + 2293 + 22942288 Current investment in un-quoted shares = nd curr invest sharesunquoted
= 2289 + 22902289 Current investment in un-quoted equity shares = ndcurr invest equity sharesunquoted2290 Current investment in un-quoted preference shares = ndcurr invest pref sharesunquoted2291 Current investment in un-quoted debenture & bonds = ndcurr invest debbondsunquoted2292 Current investment in un-quoted units of mutual funds = ndcurr invest mfs unquoted2293 Current investment in un-quoted government securities = ndcurr invest govt secunquoted2294 Other un-quoted current investment = nd oth curr invest unquoted2295 Long term investment = nd lt invest
= 2296 + 23042296 Quoted long term investment = nd lt invest quoted
= 2297 + 2300 + 2301 + 2302 + 23032297 Long term investment in quoted shares = nd lt invest sharesquoted
= 2298 + 22992298 Long term investment in quoted equity shares = ndlt invest equity sharesquoted2299 Long term investment in quoted preference shares = ndlt invest pref sharesquoted2300 Long term investment in quoted debentures & bonds = ndlt invest deb bondsquoted2301 Long term investment in quoted units of mutual funds = ndlt invest mfs quoted2302 Long term investment in quoted government securities = ndlt invest govt secquoted2303 Other quoted long term investment = nd oth lt invest quoted2304 Un-quoted long term investment = nd lt invest unquoted
= 2305 + 2308 + 2309 + 2310 + 23112305 Long term investment in un-quoted shares = nd lt invest sharesunquoted
= 2306 + 23072306 Long term investment in un-quoted equity shares = ndlt invest equity sharesunquoted2307 Long term investment in un-quoted preference shares = ndlt invest pref sharesunquoted2308 Long term investment in un-quoted debenture & bonds = ndlt invest deb bondsunquoted2309 Long term investment in un-quoted units of mutual funds = ndlt invest mfs unquoted2310 Long term investment in un-quoted government securities = nd lt invest govt secunquoted2311 Other un-quoted Long term investment = nd oth lt invest unquoted2312 Borrower group-wise classification of all leased assets, stock = ndborr of leasedast stk hire loan
on hire and loan = 2313 + 23172313 Borrowing by related parties = nd borr by relatedparties
= 2314 + 2315 + 23162314 Borrowing by subsidiaries = nd borr by subsi
(Continued. . . )
August 2010 Indicators
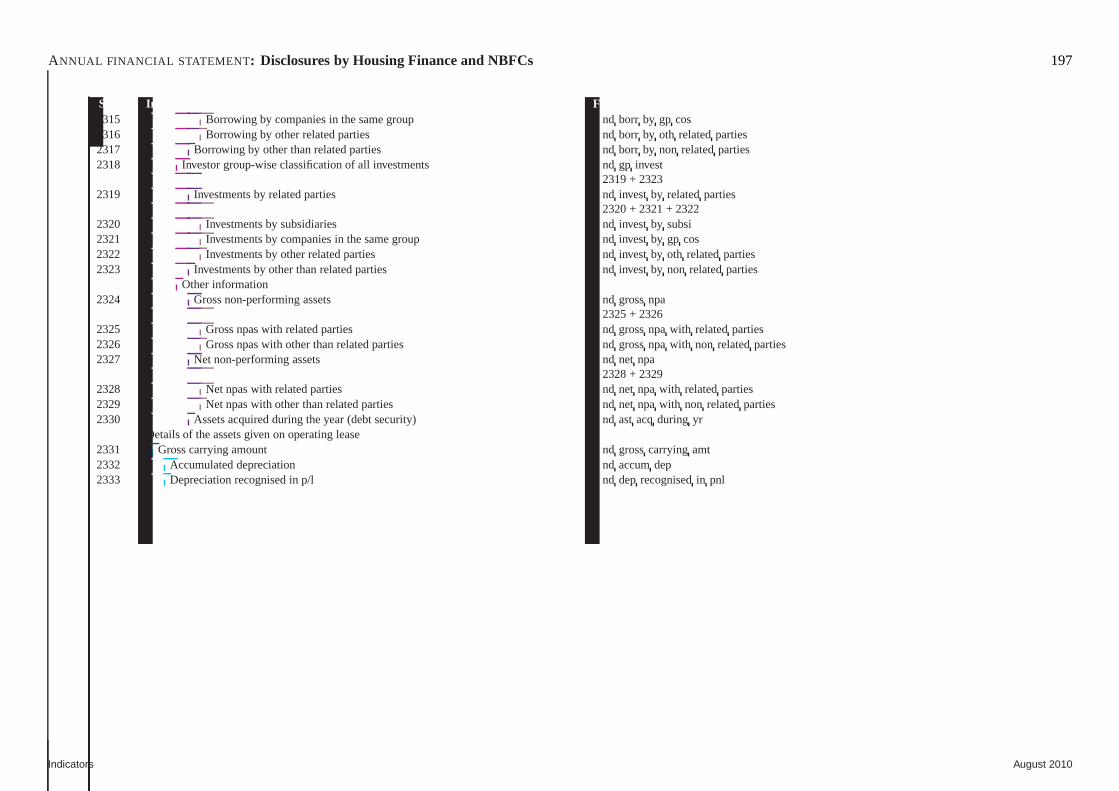
ANNUAL FINANCIAL STATEMENT : Disclosures by Housing Finance and NBFCs 197
Sr.No. Indicator Fields & formula2315 Borrowing by companies in the same group = ndborr by gp cos2316 Borrowing by other related parties = nd borr by oth relatedparties2317 Borrowing by other than related parties = nd borr by non relatedparties2318 Investor group-wise classification of all investments = ndgp invest
= 2319 + 23232319 Investments by related parties = nd invest by relatedparties
= 2320 + 2321 + 23222320 Investments by subsidiaries = nd invest by subsi2321 Investments by companies in the same group = ndinvest by gp cos2322 Investments by other related parties = nd invest by oth relatedparties2323 Investments by other than related parties = nd invest by non relatedparties
Other information2324 Gross non-performing assets = nd grossnpa
= 2325 + 23262325 Gross npas with related parties = nd grossnpawith relatedparties2326 Gross npas with other than related parties = ndgrossnpawith non relatedparties2327 Net non-performing assets = nd net npa
= 2328 + 23292328 Net npas with related parties = nd net npa with relatedparties2329 Net npas with other than related parties = nd net npa with non relatedparties2330 Assets acquired during the year (debt security) = ndast acq during yr
Details of the assets given on operating lease2331 Gross carrying amount = nd grosscarrying amt2332 Accumulated depreciation = nd accumdep2333 Depreciation recognised in p/l = nd dep recognisedin pnl
Indicators August 2010
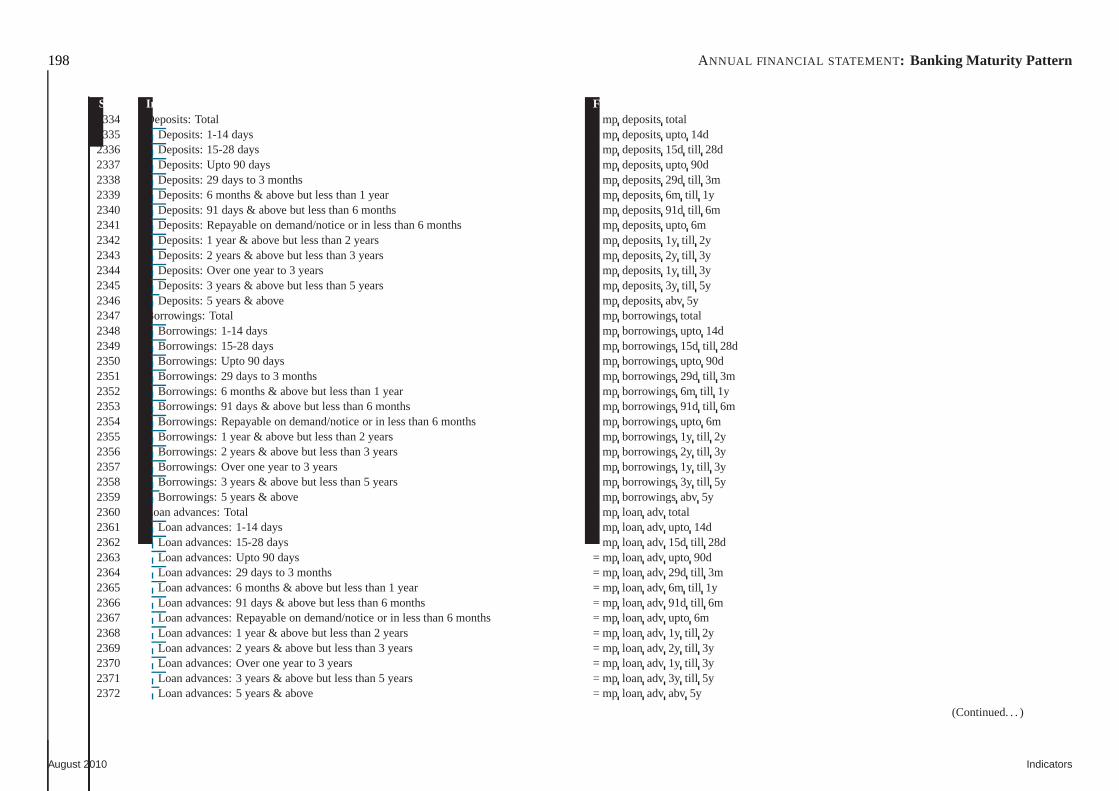
198 ANNUAL FINANCIAL STATEMENT : Banking Maturity Pattern
Sr.No. Indicator Fields & formula2334 Deposits: Total = mp depositstotal2335 Deposits: 1-14 days = mp depositsupto 14d2336 Deposits: 15-28 days = mp deposits15d till 28d2337 Deposits: Upto 90 days = mp depositsupto 90d2338 Deposits: 29 days to 3 months = mp deposits29d till 3m2339 Deposits: 6 months & above but less than 1 year = mp deposits6m till 1y2340 Deposits: 91 days & above but less than 6 months = mp deposits91d till 6m2341 Deposits: Repayable on demand/notice or in less than 6 months = mpdepositsupto 6m2342 Deposits: 1 year & above but less than 2 years = mp deposits1y till 2y2343 Deposits: 2 years & above but less than 3 years = mp deposits2y till 3y2344 Deposits: Over one year to 3 years = mp deposits1y till 3y2345 Deposits: 3 years & above but less than 5 years = mp deposits3y till 5y2346 Deposits: 5 years & above = mp depositsabv 5y2347 Borrowings: Total = mp borrowingstotal2348 Borrowings: 1-14 days = mp borrowingsupto 14d2349 Borrowings: 15-28 days = mp borrowings15d till 28d2350 Borrowings: Upto 90 days = mp borrowingsupto 90d2351 Borrowings: 29 days to 3 months = mp borrowings29d till 3m2352 Borrowings: 6 months & above but less than 1 year = mpborrowings6m till 1y2353 Borrowings: 91 days & above but less than 6 months = mpborrowings91d till 6m2354 Borrowings: Repayable on demand/notice or in less than 6 months = mpborrowingsupto 6m2355 Borrowings: 1 year & above but less than 2 years = mp borrowings1y till 2y2356 Borrowings: 2 years & above but less than 3 years = mp borrowings2y till 3y2357 Borrowings: Over one year to 3 years = mp borrowings1y till 3y2358 Borrowings: 3 years & above but less than 5 years = mp borrowings3y till 5y2359 Borrowings: 5 years & above = mp borrowingsabv 5y2360 Loan advances: Total = mp loan adv total2361 Loan advances: 1-14 days = mp loan adv upto 14d2362 Loan advances: 15-28 days = mp loan adv 15d till 28d2363 Loan advances: Upto 90 days = mp loan adv upto 90d2364 Loan advances: 29 days to 3 months = mp loan adv 29d till 3m2365 Loan advances: 6 months & above but less than 1 year = mploan adv 6m till 1y2366 Loan advances: 91 days & above but less than 6 months = mploan adv 91d till 6m2367 Loan advances: Repayable on demand/notice or in less than 6 months = mploan adv upto 6m2368 Loan advances: 1 year & above but less than 2 years = mploan adv 1y till 2y2369 Loan advances: 2 years & above but less than 3 years = mploan adv 2y till 3y2370 Loan advances: Over one year to 3 years = mp loan adv 1y till 3y2371 Loan advances: 3 years & above but less than 5 years = mploan adv 3y till 5y2372 Loan advances: 5 years & above = mp loan adv abv 5y
(Continued. . . )
August 2010 Indicators
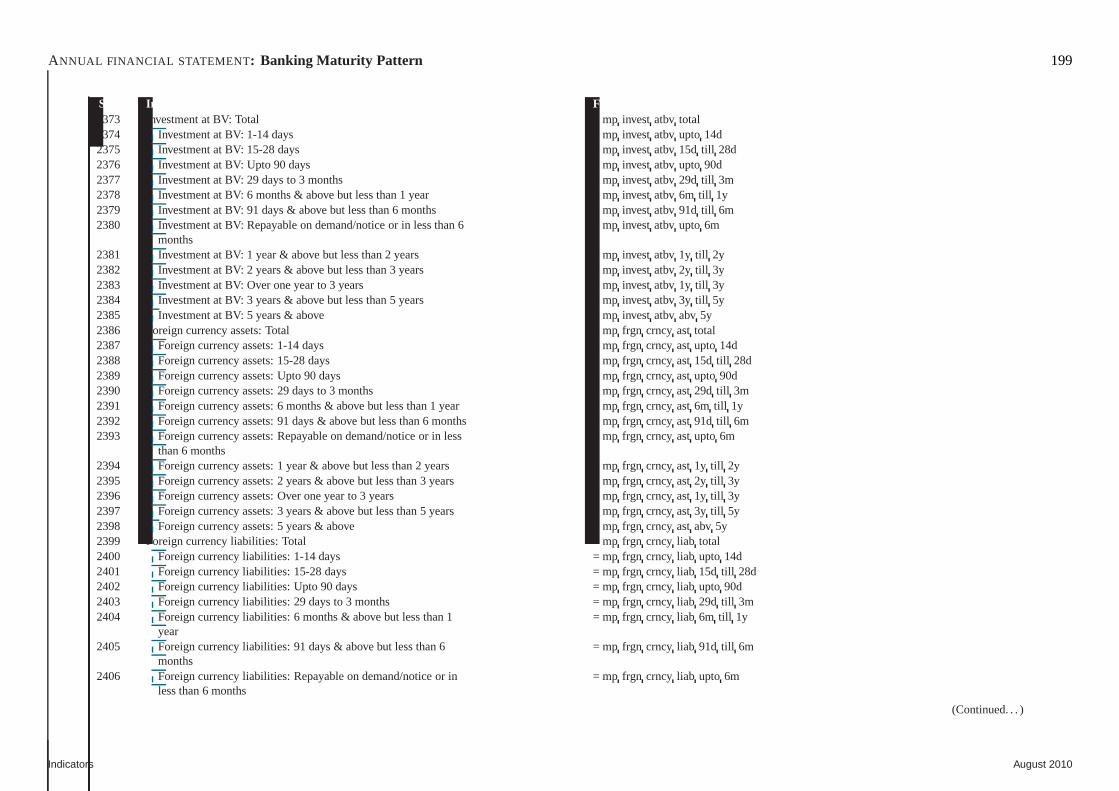
ANNUAL FINANCIAL STATEMENT : Banking Maturity Pattern 199
Sr.No. Indicator Fields & formula2373 Investment at BV: Total = mp invest atbv total2374 Investment at BV: 1-14 days = mp invest atbv upto 14d2375 Investment at BV: 15-28 days = mp invest atbv 15d till 28d2376 Investment at BV: Upto 90 days = mp invest atbv upto 90d2377 Investment at BV: 29 days to 3 months = mp invest atbv 29d till 3m2378 Investment at BV: 6 months & above but less than 1 year = mpinvest atbv 6m till 1y2379 Investment at BV: 91 days & above but less than 6 months = mpinvest atbv 91d till 6m2380 Investment at BV: Repayable on demand/notice or in less than6 = mp invest atbv upto 6m
months2381 Investment at BV: 1 year & above but less than 2 years = mpinvest atbv 1y till 2y2382 Investment at BV: 2 years & above but less than 3 years = mpinvest atbv 2y till 3y2383 Investment at BV: Over one year to 3 years = mp invest atbv 1y till 3y2384 Investment at BV: 3 years & above but less than 5 years = mpinvest atbv 3y till 5y2385 Investment at BV: 5 years & above = mp invest atbv abv 5y2386 Foreign currency assets: Total = mp frgn crncy ast total2387 Foreign currency assets: 1-14 days = mp frgn crncy ast upto 14d2388 Foreign currency assets: 15-28 days = mp frgn crncy ast 15d till 28d2389 Foreign currency assets: Upto 90 days = mp frgn crncy ast upto 90d2390 Foreign currency assets: 29 days to 3 months = mp frgn crncy ast 29d till 3m2391 Foreign currency assets: 6 months & above but less than 1 year = mp frgn crncy ast 6m till 1y2392 Foreign currency assets: 91 days & above but less than 6 months = mpfrgn crncy ast 91d till 6m2393 Foreign currency assets: Repayable on demand/notice or in less = mpfrgn crncy ast upto 6m
than 6 months2394 Foreign currency assets: 1 year & above but less than 2 years =mp frgn crncy ast 1y till 2y2395 Foreign currency assets: 2 years & above but less than 3 years = mp frgn crncy ast 2y till 3y2396 Foreign currency assets: Over one year to 3 years = mp frgn crncy ast 1y till 3y2397 Foreign currency assets: 3 years & above but less than 5 years = mp frgn crncy ast 3y till 5y2398 Foreign currency assets: 5 years & above = mp frgn crncy ast abv 5y2399 Foreign currency liabilities: Total = mp frgn crncy liab total2400 Foreign currency liabilities: 1-14 days = mp frgn crncy liab upto 14d2401 Foreign currency liabilities: 15-28 days = mp frgn crncy liab 15d till 28d2402 Foreign currency liabilities: Upto 90 days = mp frgn crncy liab upto 90d2403 Foreign currency liabilities: 29 days to 3 months = mp frgn crncy liab 29d till 3m2404 Foreign currency liabilities: 6 months & above but less than1 = mp frgn crncy liab 6m till 1y
year2405 Foreign currency liabilities: 91 days & above but less than 6 = mp frgn crncy liab 91d till 6m
months2406 Foreign currency liabilities: Repayable on demand/noticeor in = mp frgn crncy liab upto 6m
less than 6 months
(Continued. . . )
Indicators August 2010
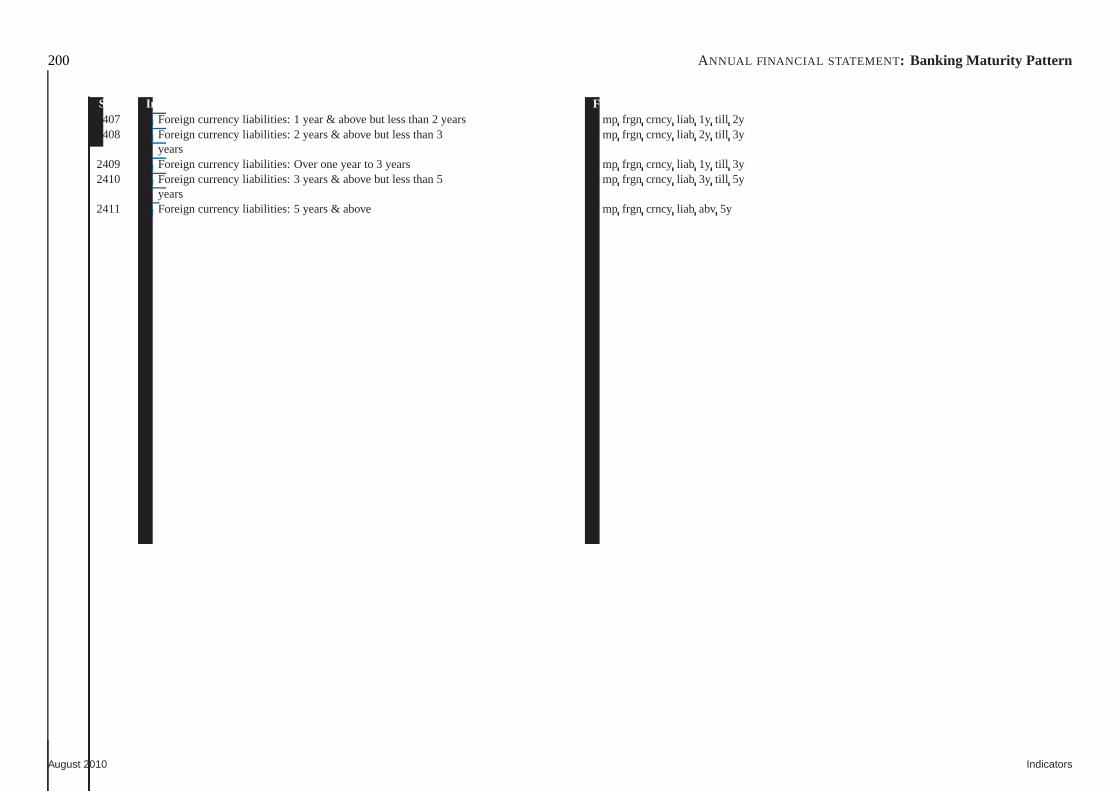
200 ANNUAL FINANCIAL STATEMENT : Banking Maturity Pattern
Sr.No. Indicator Fields & formula2407 Foreign currency liabilities: 1 year & above but less than 2 years = mpfrgn crncy liab 1y till 2y2408 Foreign currency liabilities: 2 years & above but less than 3 = mp frgn crncy liab 2y till 3y
years2409 Foreign currency liabilities: Over one year to 3 years = mpfrgn crncy liab 1y till 3y2410 Foreign currency liabilities: 3 years & above but less than 5 = mp frgn crncy liab 3y till 5y
years2411 Foreign currency liabilities: 5 years & above = mp frgn crncy liab abv 5y
August 2010 Indicators

ANNUAL FINANCIAL STATEMENT : Share Prices Ratios & Misc. Indicators 201
Sr.No. Indicator Fields & formula2412 AR signed date = ar signeddate2413 Equity Dividend rate = equity div rate2414 Owner code = fin owner code2415 Industry code = financeindustry code2416 BSE date = fin bsedate2417 BSE closing price = fin bseclosing2418 BSE adjustment factor = fin bsefactor2419 NSE date = fin nsedate2420 NSE closing price = fin nseclosing2421 NSE adjustment factor = fin nsefactor2422 Shares = fin shares2423 TTM pat npe = fin ttm pat npe
Indicators August 2010
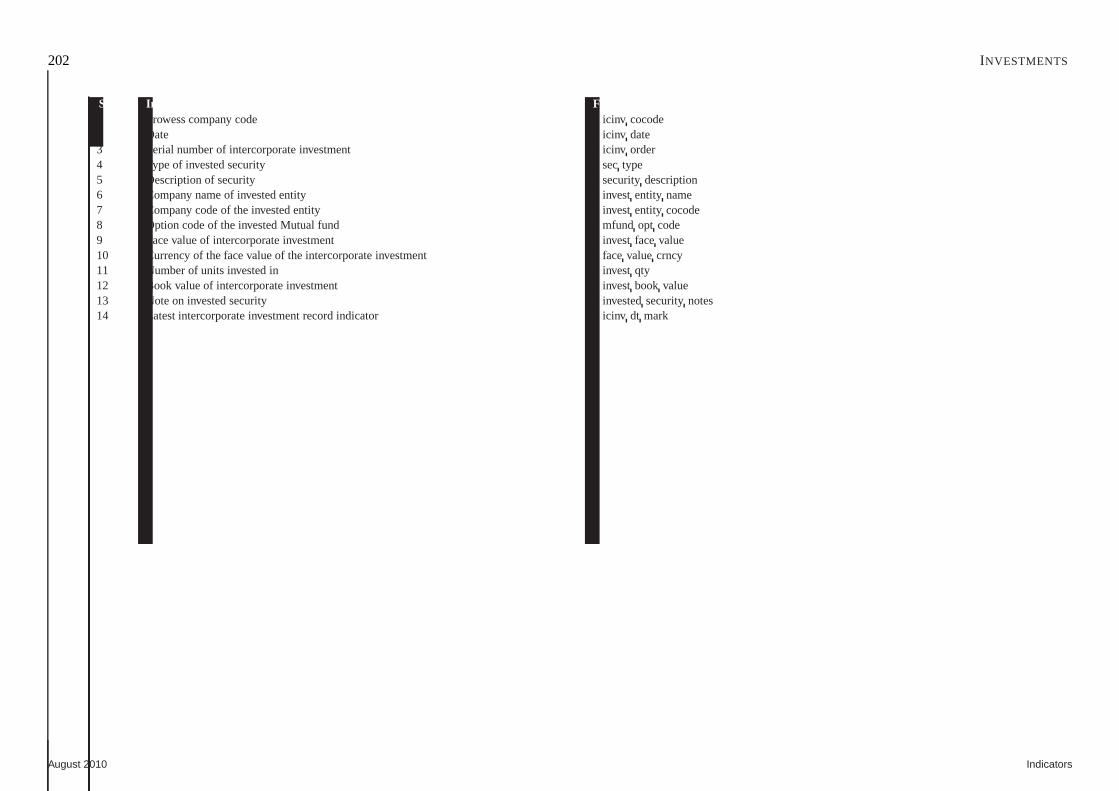
202 INVESTMENTS
Sr.No. Indicator Fields & formula1 Prowess company code = icinv cocode2 Date = icinv date3 Serial number of intercorporate investment = icinv order4 Type of invested security = sectype5 Description of security = securitydescription6 Company name of invested entity = investentity name7 Company code of the invested entity = investentity cocode8 Option code of the invested Mutual fund = mfund opt code9 Face value of intercorporate investment = invest facevalue10 Currency of the face value of the intercorporate investment = facevalue crncy11 Number of units invested in = investqty12 Book value of intercorporate investment = investbook value13 Note on invested security = investedsecuritynotes14 Latest intercorporate investment record indicator = icinv dt mark
August 2010 Indicators
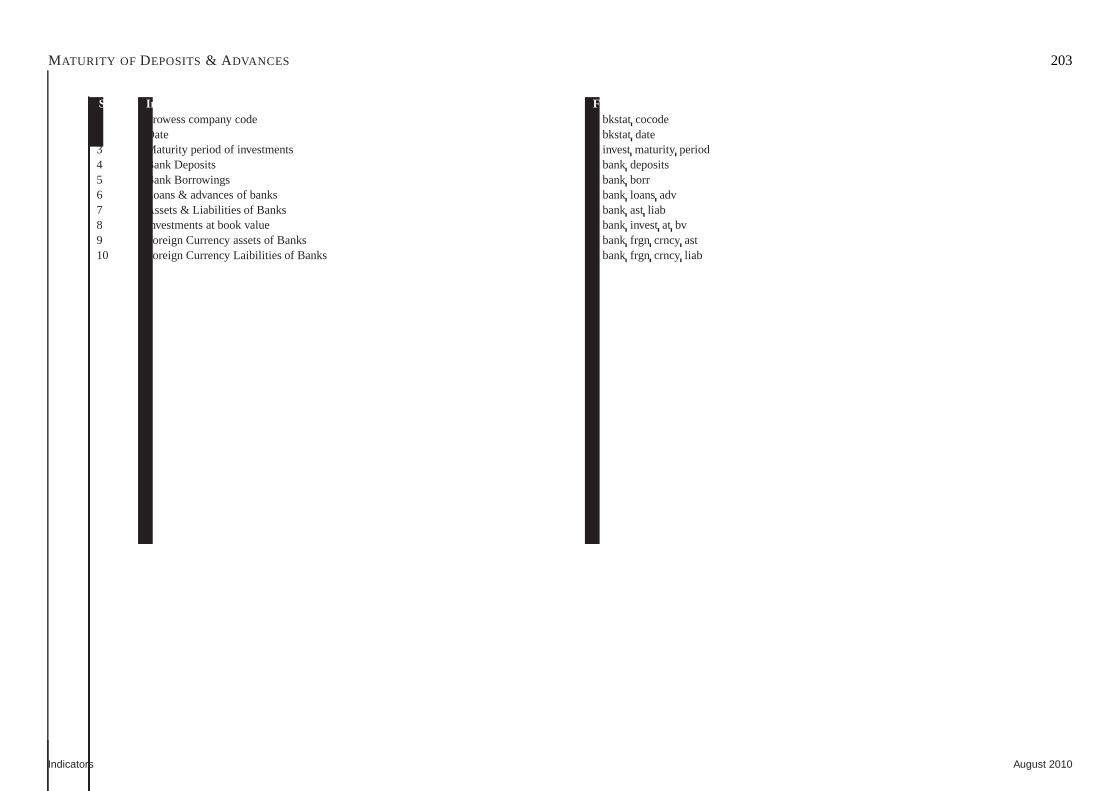
MATURITY OF DEPOSITS& A DVANCES 203
Sr.No. Indicator Fields & formula1 Prowess company code = bkstatcocode2 Date = bkstatdate3 Maturity period of investments = investmaturity period4 Bank Deposits = bankdeposits5 Bank Borrowings = bankborr6 Loans & advances of banks = bank loansadv7 Assets & Liabilities of Banks = bankast liab8 Investments at book value = bank invest at bv9 Foreign Currency assets of Banks = bank frgn crncy ast10 Foreign Currency Laibilities of Banks = bank frgn crncy liab
Indicators August 2010
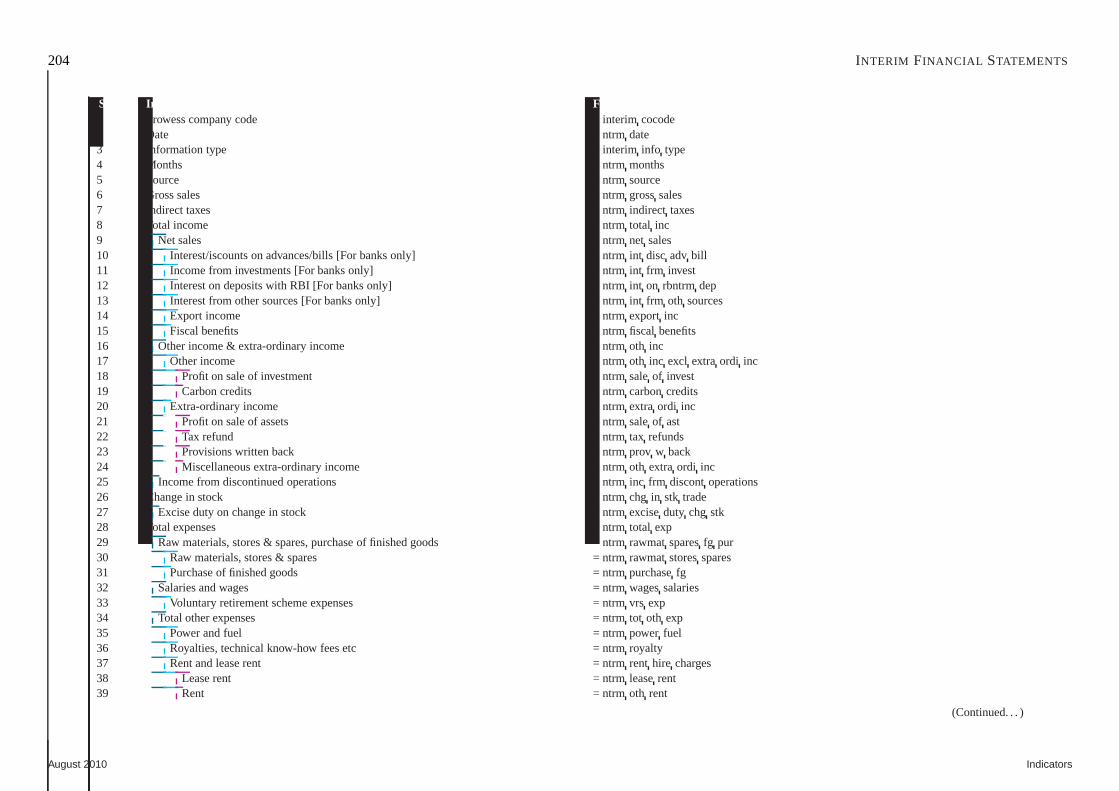
204 INTERIM FINANCIAL STATEMENTS
Sr.No. Indicator Fields & formula1 Prowess company code = interim cocode2 Date = ntrm date3 Information type = interim info type4 Months = ntrm months5 Source = ntrm source6 Gross sales = ntrm grosssales7 Indirect taxes = ntrm indirect taxes8 Total income = ntrm total inc9 Net sales = ntrm net sales10 Interest/iscounts on advances/bills [For banks only] = ntrm int disc adv bill11 Income from investments [For banks only] = ntrm int frm invest12 Interest on deposits with RBI [For banks only] = ntrm int on rbntrm dep13 Interest from other sources [For banks only] = ntrm int frm oth sources14 Export income = ntrm export inc15 Fiscal benefits = ntrm fiscal benefits16 Other income & extra-ordinary income = ntrm oth inc17 Other income = ntrm oth inc excl extraordi inc18 Profit on sale of investment = ntrm saleof invest19 Carbon credits = ntrm carboncredits20 Extra-ordinary income = ntrm extra ordi inc21 Profit on sale of assets = ntrm saleof ast22 Tax refund = ntrm tax refunds23 Provisions written back = ntrm prov w back24 Miscellaneous extra-ordinary income = ntrm oth extraordi inc25 Income from discontinued operations = ntrm inc frm discontoperations26 Change in stock = ntrm chg in stk trade27 Excise duty on change in stock = ntrm exciseduty chg stk28 Total expenses = ntrm total exp29 Raw materials, stores & spares, purchase of finished goods = ntrm rawmatsparesfg pur30 Raw materials, stores & spares = ntrm rawmatstoresspares31 Purchase of finished goods = ntrm purchasefg32 Salaries and wages = ntrm wagessalaries33 Voluntary retirement scheme expenses = ntrm vrs exp34 Total other expenses = ntrm tot oth exp35 Power and fuel = ntrm power fuel36 Royalties, technical know-how fees etc = ntrm royalty37 Rent and lease rent = ntrm rent hire charges38 Lease rent = ntrm leaserent39 Rent = ntrm oth rent
(Continued. . . )
August 2010 Indicators
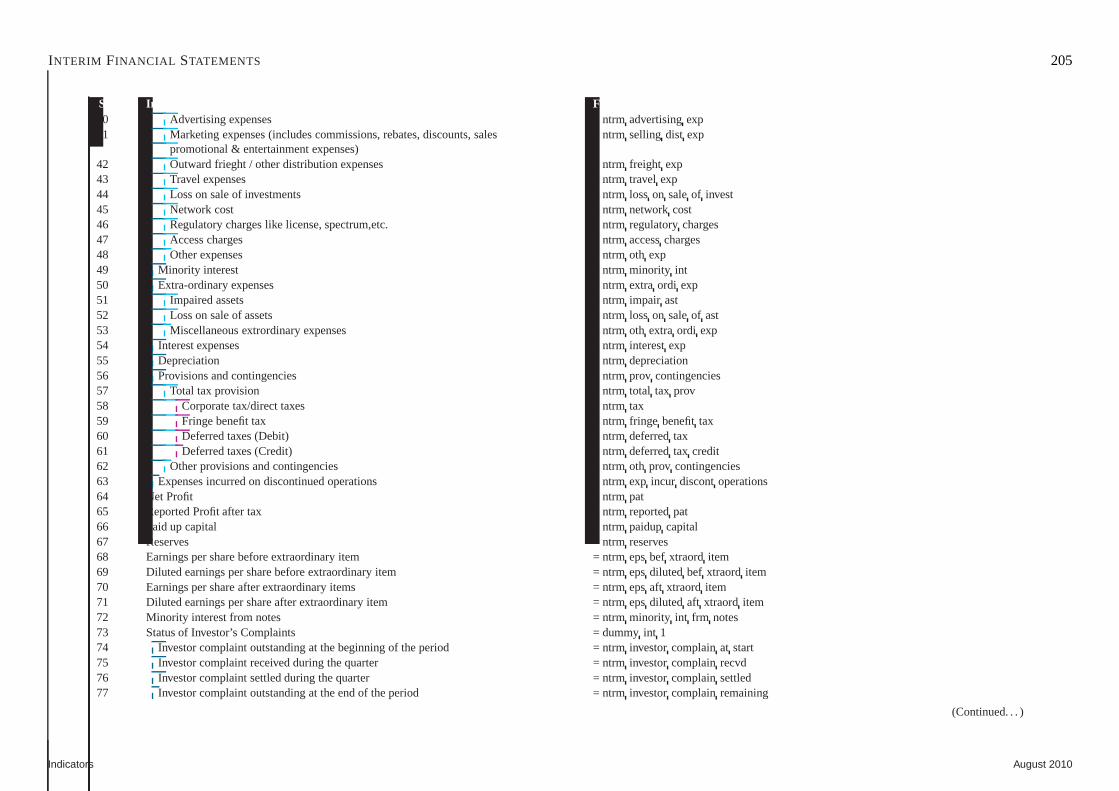
INTERIM FINANCIAL STATEMENTS 205
Sr.No. Indicator Fields & formula40 Advertising expenses = ntrm advertisingexp41 Marketing expenses (includes commissions, rebates, discounts, sales = ntrmselling dist exp
promotional & entertainment expenses)42 Outward frieght / other distribution expenses = ntrm freight exp43 Travel expenses = ntrm travel exp44 Loss on sale of investments = ntrm loss on saleof invest45 Network cost = ntrm network cost46 Regulatory charges like license, spectrum,etc. = ntrm regulatorycharges47 Access charges = ntrm accesscharges48 Other expenses = ntrm oth exp49 Minority interest = ntrm minority int50 Extra-ordinary expenses = ntrm extra ordi exp51 Impaired assets = ntrm impair ast52 Loss on sale of assets = ntrm loss on saleof ast53 Miscellaneous extrordinary expenses = ntrm oth extraordi exp54 Interest expenses = ntrm interestexp55 Depreciation = ntrm depreciation56 Provisions and contingencies = ntrm prov contingencies57 Total tax provision = ntrm total tax prov58 Corporate tax/direct taxes = ntrm tax59 Fringe benefit tax = ntrm fringe benefittax60 Deferred taxes (Debit) = ntrm deferredtax61 Deferred taxes (Credit) = ntrm deferredtax credit62 Other provisions and contingencies = ntrm oth prov contingencies63 Expenses incurred on discontinued operations = ntrm exp incur discontoperations64 Net Profit = ntrm pat65 Reported Profit after tax = ntrm reportedpat66 Paid up capital = ntrm paidupcapital67 Reserves = ntrm reserves68 Earnings per share before extraordinary item = ntrm epsbef xtraord item69 Diluted earnings per share before extraordinary item = ntrm epsdiluted bef xtraord item70 Earnings per share after extraordinary items = ntrm epsaft xtraord item71 Diluted earnings per share after extraordinary item = ntrm epsdiluted aft xtraord item72 Minority interest from notes = ntrm minority int frm notes73 Status of Investor’s Complaints = dummy int 174 Investor complaint outstanding at the beginning of the period = ntrminvestorcomplainat start75 Investor complaint received during the quarter = ntrm investorcomplainrecvd76 Investor complaint settled during the quarter = ntrm investorcomplainsettled77 Investor complaint outstanding at the end of the period = ntrm investorcomplainremaining
(Continued. . . )
Indicators August 2010
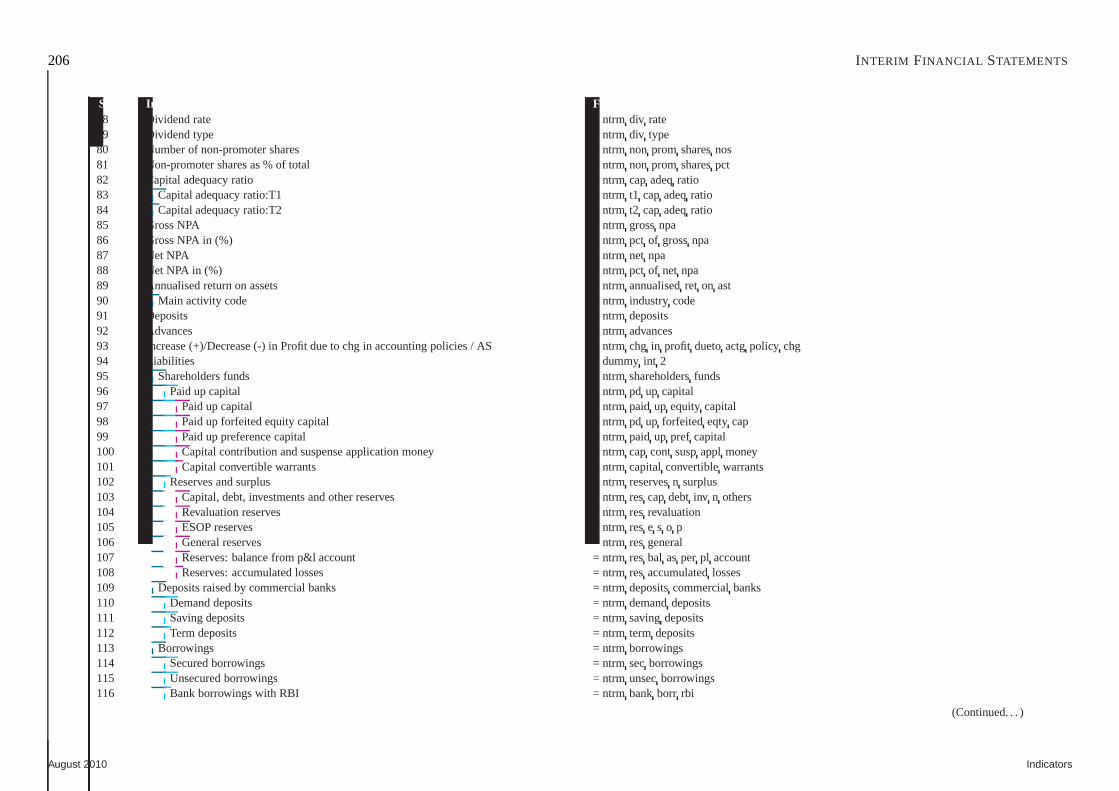
206 INTERIM FINANCIAL STATEMENTS
Sr.No. Indicator Fields & formula78 Dividend rate = ntrm div rate79 Dividend type = ntrm div type80 Number of non-promoter shares = ntrm non prom sharesnos81 Non-promoter shares as % of total = ntrm non prom sharespct82 Capital adequacy ratio = ntrm cap adeqratio83 Capital adequacy ratio:T1 = ntrm t1 capadeqratio84 Capital adequacy ratio:T2 = ntrm t2 capadeqratio85 Gross NPA = ntrm grossnpa86 Gross NPA in (%) = ntrm pct of grossnpa87 Net NPA = ntrm net npa88 Net NPA in (%) = ntrm pct of net npa89 Annualised return on assets = ntrm annualisedret on ast90 Main activity code = ntrm industry code91 Deposits = ntrm deposits92 Advances = ntrm advances93 Increase (+)/Decrease (-) in Profit due to chg in accounting policies / AS = ntrmchg in profit duetoactgpolicy chg94 Liabilities = dummy int 295 Shareholders funds = ntrm shareholdersfunds96 Paid up capital = ntrm pd up capital97 Paid up capital = ntrm paid up equity capital98 Paid up forfeited equity capital = ntrm pd up forfeited eqty cap99 Paid up preference capital = ntrm paid up pref capital100 Capital contribution and suspense application money = ntrmcap cont suspappl money101 Capital convertible warrants = ntrm capital convertiblewarrants102 Reserves and surplus = ntrm reservesn surplus103 Capital, debt, investments and other reserves = ntrm res capdebt inv n others104 Revaluation reserves = ntrm res revaluation105 ESOP reserves = ntrm res e s o p106 General reserves = ntrm res general107 Reserves: balance from p&l account = ntrm res bal asper pl account108 Reserves: accumulated losses = ntrm res accumulatedlosses109 Deposits raised by commercial banks = ntrm depositscommercialbanks110 Demand deposits = ntrm demanddeposits111 Saving deposits = ntrm savingdeposits112 Term deposits = ntrm term deposits113 Borrowings = ntrm borrowings114 Secured borrowings = ntrm secborrowings115 Unsecured borrowings = ntrm unsecborrowings116 Bank borrowings with RBI = ntrm bank borr rbi
(Continued. . . )
August 2010 Indicators
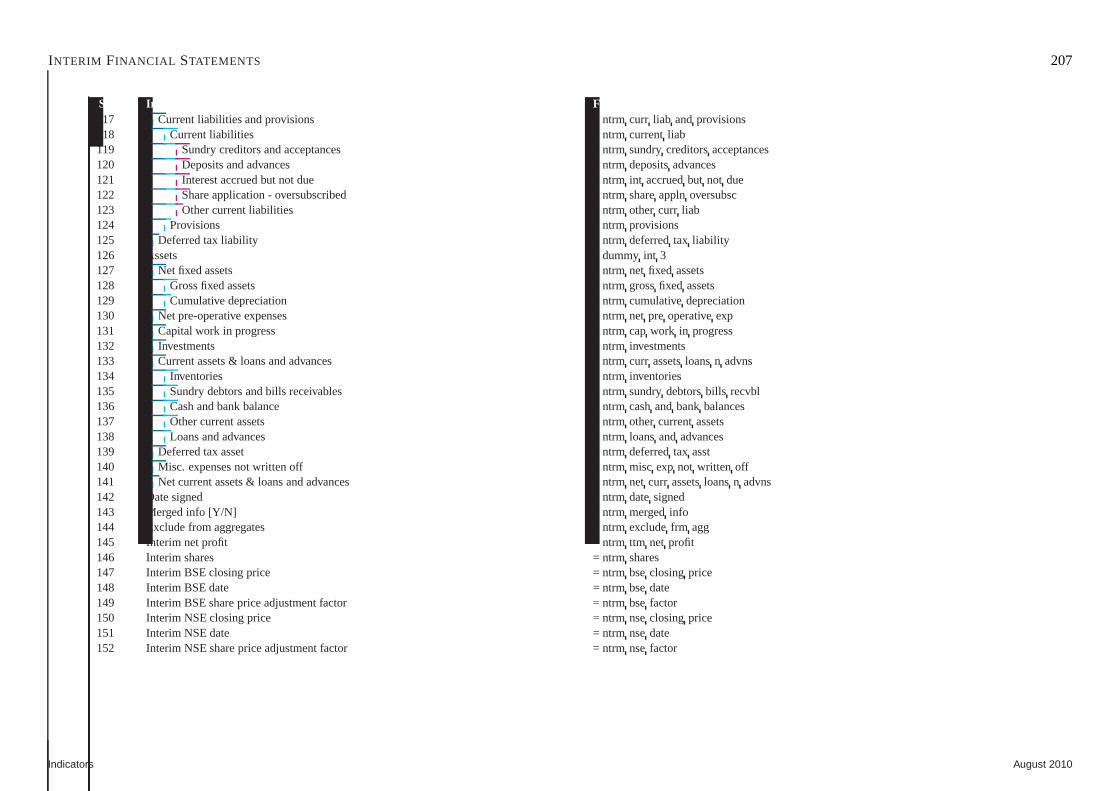
INTERIM FINANCIAL STATEMENTS 207
Sr.No. Indicator Fields & formula117 Current liabilities and provisions = ntrm curr liab andprovisions118 Current liabilities = ntrm current liab119 Sundry creditors and acceptances = ntrm sundrycreditorsacceptances120 Deposits and advances = ntrm depositsadvances121 Interest accrued but not due = ntrm int accruedbut not due122 Share application - oversubscribed = ntrm shareappln oversubsc123 Other current liabilities = ntrm other curr liab124 Provisions = ntrm provisions125 Deferred tax liability = ntrm deferredtax liability126 Assets = dummy int 3127 Net fixed assets = ntrm net fixed assets128 Gross fixed assets = ntrm grossfixed assets129 Cumulative depreciation = ntrm cumulativedepreciation130 Net pre-operative expenses = ntrm net pre operativeexp131 Capital work in progress = ntrm cap work in progress132 Investments = ntrm investments133 Current assets & loans and advances = ntrm curr assetsloansn advns134 Inventories = ntrm inventories135 Sundry debtors and bills receivables = ntrm sundrydebtorsbills recvbl136 Cash and bank balance = ntrm cashand bank balances137 Other current assets = ntrm other currentassets138 Loans and advances = ntrm loansand advances139 Deferred tax asset = ntrm deferredtax asst140 Misc. expenses not written off = ntrm misc exp not written off141 Net current assets & loans and advances = ntrm net curr assetsloansn advns142 Date signed = ntrm datesigned143 Merged info [Y/N] = ntrm mergedinfo144 Exclude from aggregates = ntrm excludefrm agg145 Interim net profit = ntrm ttm net profit146 Interim shares = ntrm shares147 Interim BSE closing price = ntrm bseclosing price148 Interim BSE date = ntrm bsedate149 Interim BSE share price adjustment factor = ntrm bsefactor150 Interim NSE closing price = ntrm nseclosing price151 Interim NSE date = ntrm nsedate152 Interim NSE share price adjustment factor = ntrm nsefactor
Indicators August 2010

208 NOTES TOACCOUNTS OFINTERIM FINANCIAL STATEMENTS
Sr.No. Indicator Fields & formula1 Prowess company code = itxt cocode2 Date = itxt year3 Frequency = itxt info type4 Number of months = itxt months5 Notes to interim financials = ntrm text
August 2010 Indicators
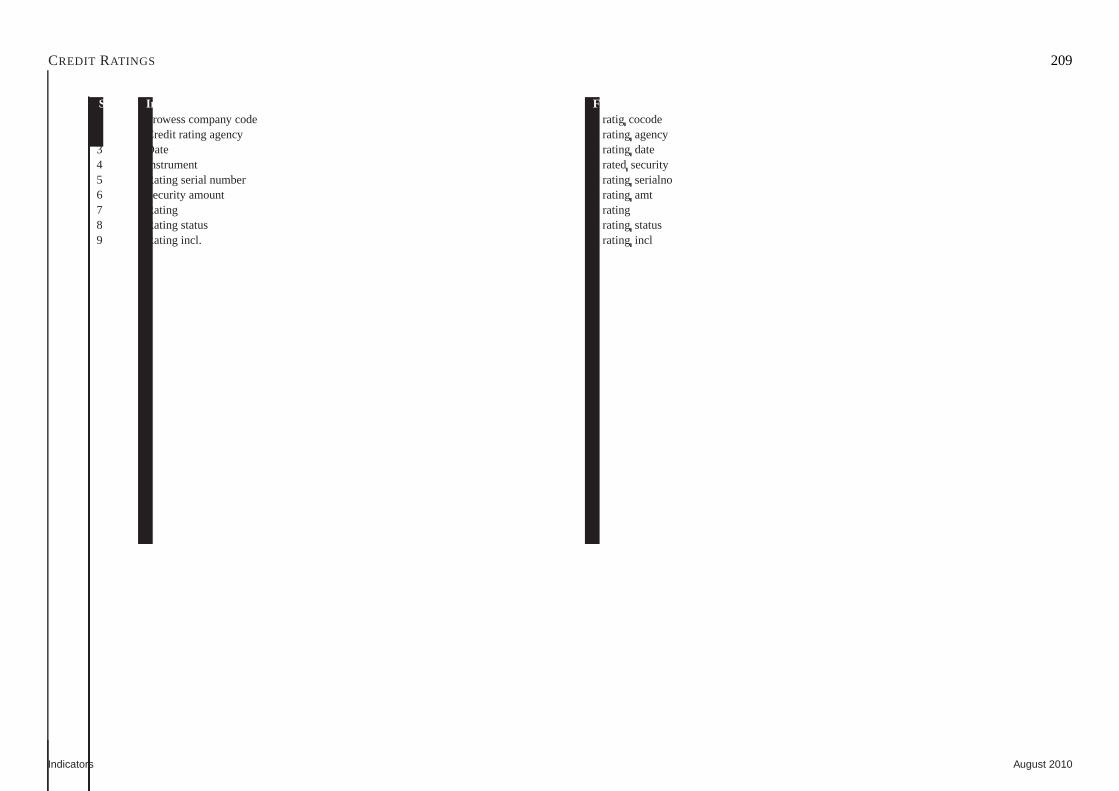
CREDIT RATINGS 209
Sr.No. Indicator Fields & formula1 Prowess company code = ratig cocode2 Credit rating agency = rating agency3 Date = rating date4 Instrument = ratedsecurity5 Rating serial number = rating serialno6 Security amount = rating amt7 Rating = rating8 Rating status = rating status9 Rating incl. = rating incl
Indicators August 2010
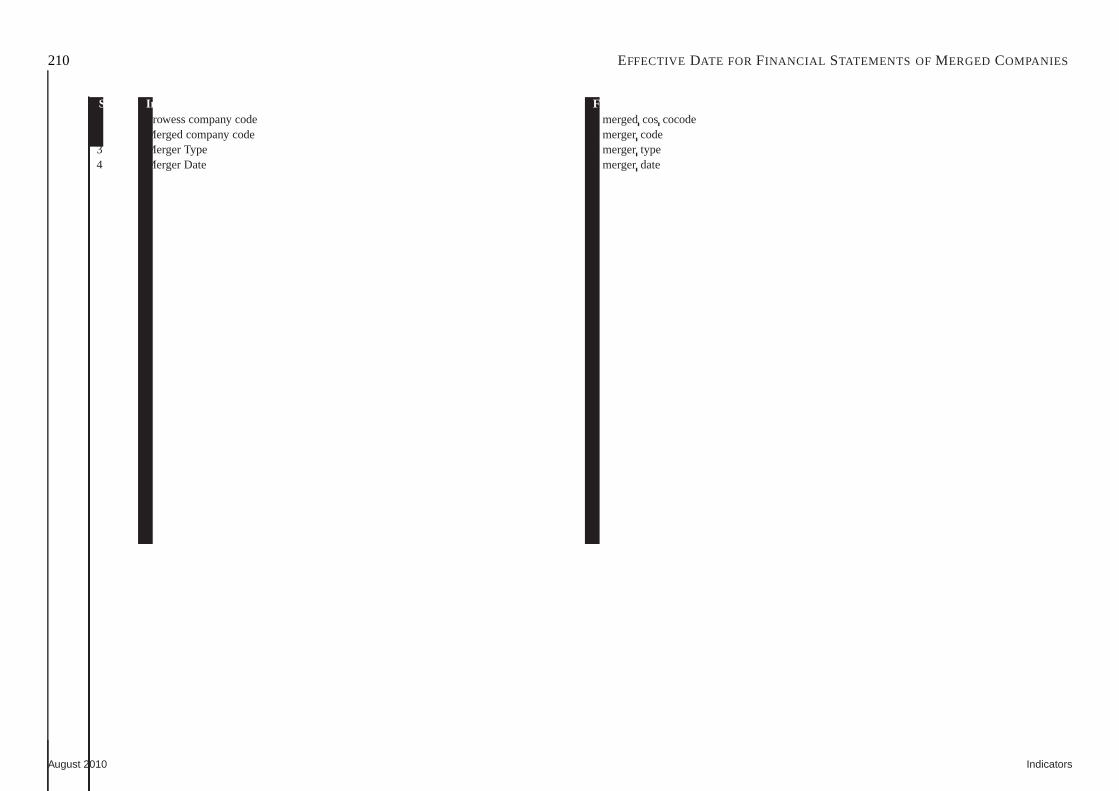
210 EFFECTIVE DATE FOR FINANCIAL STATEMENTS OFMERGED COMPANIES
Sr.No. Indicator Fields & formula1 Prowess company code = mergedcos cocode2 Merged company code = mergercode3 Merger Type = mergertype4 Merger Date = mergerdate
August 2010 Indicators

211
Chapter 4
Share Prices & Capital History
ContentsIntroducing the Share Prices & Capital History database . . . . . . . . . . . . . . . . . . . . . . . . . . . . . . . . . . . . . . . . . . . . . . . . . . . . . .. . . . . 213
BSE Stocks Trading Data . . . . . . . . . . . . . . . . . . . . . . . . . . . . . . .. . . . . . . . . . . . . . . . . . . . . . . . . . . . . . . . . . . . . . . . . . . . . . 214
NSE Stocks Trading Data . . . . . . . . . . . . . . . . . . . . . . . . . . . . . . .. . . . . . . . . . . . . . . . . . . . . . . . . . . . . . . . . . . . . . . . . . . . . . 215
Share Prices Adjustment Factors . . . . . . . . . . . . . . . . . . . . . . .. . . . . . . . . . . . . . . . . . . . . . . . . . . . . . . . . . . . . . . . . . . . . . . . . . 216
Outstanding Shares . . . . . . . . . . . . . . . . . . . . . . . . . . . . . . . . . .. . . . . . . . . . . . . . . . . . . . . . . . . . . . . . . . . . . . . . . . . . . . . . 217
EPS . . . . . . . . . . . . . . . . . . . . . . . . . . . . . . . . . . . . . . . . . . . . . . . .. . . . . . . . . . . . . . . . . . . . . . . . . . . . . . . . . . . . . . . . . 218
Book Value . . . . . . . . . . . . . . . . . . . . . . . . . . . . . . . . . . . . . . . . . .. . . . . . . . . . . . . . . . . . . . . . . . . . . . . . . . . . . . . . . . . . . 219
Dividend Declarations . . . . . . . . . . . . . . . . . . . . . . . . . . . . . . .. . . . . . . . . . . . . . . . . . . . . . . . . . . . . . . . . . . . . . . . . . . . . . . . 220
BSE Options Trading Data . . . . . . . . . . . . . . . . . . . . . . . . . . . . . .. . . . . . . . . . . . . . . . . . . . . . . . . . . . . . . . . . . . . . . . . . . . . . 221
NSE Options Trading Data . . . . . . . . . . . . . . . . . . . . . . . . . . . . . .. . . . . . . . . . . . . . . . . . . . . . . . . . . . . . . . . . . . . . . . . . . . . . 222
BSE Futures Trading Data . . . . . . . . . . . . . . . . . . . . . . . . . . . . . .. . . . . . . . . . . . . . . . . . . . . . . . . . . . . . . . . . . . . . . . . . . . . . 223
NSE Futures Trading Data . . . . . . . . . . . . . . . . . . . . . . . . . . . . . .. . . . . . . . . . . . . . . . . . . . . . . . . . . . . . . . . . . . . . . . . . . . . . 224
NSE Debt Trading Data . . . . . . . . . . . . . . . . . . . . . . . . . . . . . . . . .. . . . . . . . . . . . . . . . . . . . . . . . . . . . . . . . . . . . . . . . . . . . . 225
Announcements Made to Stock Exchanges and News By CMIE . . . . .. . . . . . . . . . . . . . . . . . . . . . . . . . . . . . . . . . . . . . . . . . . . . . . . . . .226
Forthcoming Capital Issues . . . . . . . . . . . . . . . . . . . . . . . . . . .. . . . . . . . . . . . . . . . . . . . . . . . . . . . . . . . . . . . . . . . . . . . . . . . . 227
ECB Approvals By RBI . . . . . . . . . . . . . . . . . . . . . . . . . . . . . . . . . .. . . . . . . . . . . . . . . . . . . . . . . . . . . . . . . . . . . . . . . . . . . . 228
Changes In Outstanding Equity Capital . . . . . . . . . . . . . . . . . .. . . . . . . . . . . . . . . . . . . . . . . . . . . . . . . . . . . . . . . . . . . . . . . . . . .229
Indicators August 2010
212
Conversion Stages of Securities Issued . . . . . . . . . . . . . . . . .. . . . . . . . . . . . . . . . . . . . . . . . . . . . . . . . . . . . . . . . . . . . . . . . . . .. . 230
Investors In Capital Issues . . . . . . . . . . . . . . . . . . . . . . . . . . .. . . . . . . . . . . . . . . . . . . . . . . . . . . . . . . . . . . . . . . . . . . . . . . . . 231
Identity Information on Indices . . . . . . . . . . . . . . . . . . . . . . .. . . . . . . . . . . . . . . . . . . . . . . . . . . . . . . . . . . . . . . . . . . . . . . . . . .232
Index Constituents . . . . . . . . . . . . . . . . . . . . . . . . . . . . . . . . . .. . . . . . . . . . . . . . . . . . . . . . . . . . . . . . . . . . . . . . . . . . . . . . . 233
Changes In Index Constituents . . . . . . . . . . . . . . . . . . . . . . . . .. . . . . . . . . . . . . . . . . . . . . . . . . . . . . . . . . . . . . . . . . . . . . . . . . 234
Index Numbers . . . . . . . . . . . . . . . . . . . . . . . . . . . . . . . . . . . . . . .. . . . . . . . . . . . . . . . . . . . . . . . . . . . . . . . . . . . . . . . . . . . 235
Company’s Listing on Stock Exchanges . . . . . . . . . . . . . . . . . . .. . . . . . . . . . . . . . . . . . . . . . . . . . . . . . . . . . . . . . . . . . . . . . . . . . 236
Index Mapping for Companies . . . . . . . . . . . . . . . . . . . . . . . . . . .. . . . . . . . . . . . . . . . . . . . . . . . . . . . . . . . . . . . . . . . . . . . . . . 237
BSE & NSE Trading Dates . . . . . . . . . . . . . . . . . . . . . . . . . . . . . . . .. . . . . . . . . . . . . . . . . . . . . . . . . . . . . . . . . . . . . . . . . . . . 238
August 2010 Indicators
213
Introducing the Share Prices & Capital History database
Share prices and changes in the outstanding capital of a company are closely linked.If the number of shares outstanding of a company increases, and if everything else isunchanged, the price of its shares decreases. This is so because if everything else (in-cluding perceptions regarding the future) is unchanged, a mere increase in the numberof shares do not increase the value of a company. An increase in the number of sharesonly means that the number of claimants on the profits has increased. And so, pricesshould decline.
Share prices are available from the Exchanges but changes inoutstanding shares areavailable through a careful monitoring of the announcements made by the company.Prowess provides share prices sourced from the two major Exchanges – NSE and BSE.It also provides the associated data that are released by theExchanges, such as vol-umes, deliveries, etc. Prowess also provides the announcements made on the Exchanges.These are valuable disclosures made by listed companies.
Prowess also includes options and futures trading data.
Changes in outstanding shares happen when the company issues new equity capital(through a public issue, a rights issue, a private placementor an ESOP), or when it buys
back some of its issued shares or when debt instruments or warrants convert to equity.Outstanding share can also change when there is a merger or anacquisition. Each ofthese is an entry in the Table: Changes in Outstanding EquityCapital. If there are mul-tiple stages of coversion of a debt instrument into equity, then these are captured in theTable: Conversion Stages of Securities Issued.
Outstanding shares is an input to another important indicator, the Earnings per Share(EPS). Listed companies disclose their EPS as of the end of a quarter. But, the EPScan change between two consecutive quarters if the outstanding shares change. Prowesstherefore has a separate Table: EPS to ensure that the most updated EPS is alwaysavailable.
The Table: Changes in Outstanding Equity Capital also has entries for issuance of debtinstruments. But, this is not comprehensive.
This section also contains all the data pertaining to equityindices. It includes data onindex constituents and index numbers.
Indicators August 2010
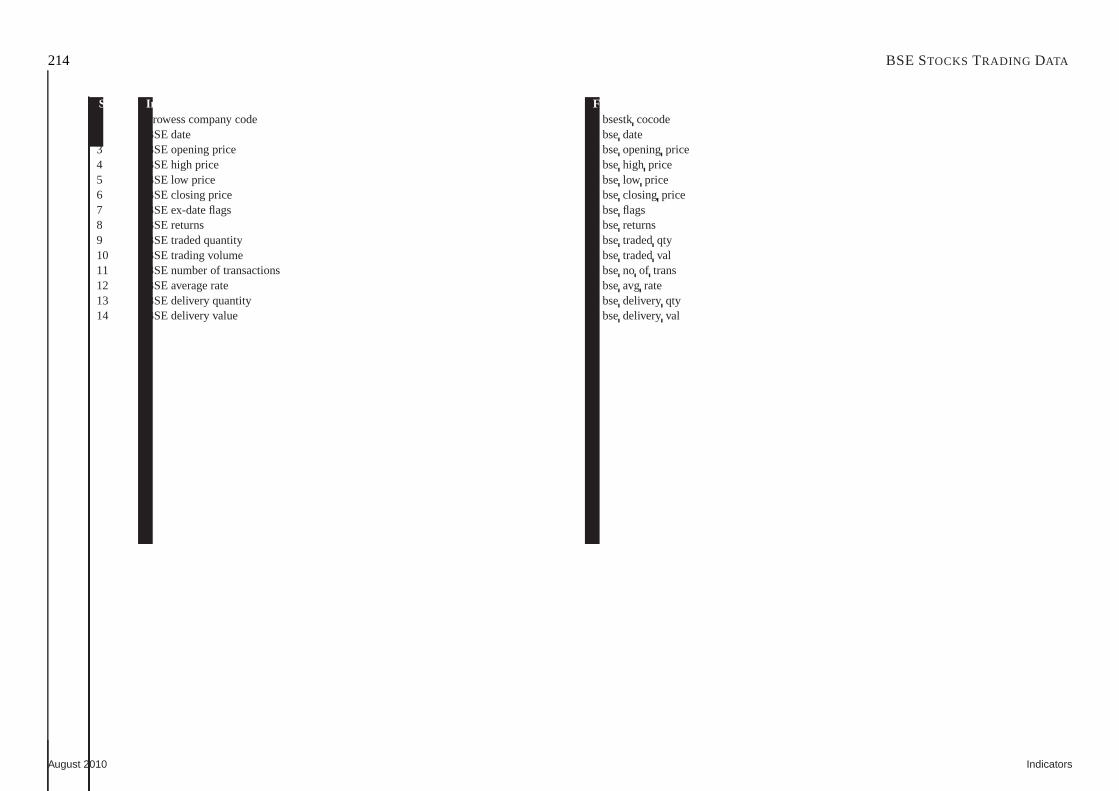
214 BSE STOCKS TRADING DATA
Sr.No. Indicator Fields & formula1 Prowess company code = bsestkcocode2 BSE date = bsedate3 BSE opening price = bseopeningprice4 BSE high price = bsehigh price5 BSE low price = bselow price6 BSE closing price = bseclosing price7 BSE ex-date flags = bseflags8 BSE returns = bsereturns9 BSE traded quantity = bsetradedqty10 BSE trading volume = bsetradedval11 BSE number of transactions = bseno of trans12 BSE average rate = bseavg rate13 BSE delivery quantity = bsedelivery qty14 BSE delivery value = bsedelivery val
August 2010 Indicators

NSE STOCKS TRADING DATA 215
Sr.No. Indicator Fields & formula1 Prowess company code = nsestkcocode2 NSE trading date = nsedate3 NSE opening price = nseopeningprice4 NSE high price = nsehigh price5 NSE low price = nselow price6 NSE closing price = nseclosing price7 NSE ex-date flags = nseflags8 NSE returns = nsereturns9 NSE traded quantity = nsetradedqty10 NSE traded volume = nsetradedval11 NSE number of transactions = nseno of trans12 NSE average rate = nseavg rate13 NSE delivery quantity = nsedelivery qty14 NSE delivery value = nsedelivery val
Indicators August 2010

216 SHARE PRICES ADJUSTMENT FACTORS
Sr.No. Indicator Fields & formula1 Prowess company code = adjfact cocode2 Date of change = adjfactdate3 BSE / NSE = adj exch4 Adjustment factor = adj factor5 Adjusted ex-bonus factor = adj exbonusfactor6 Flags for different adjustments = adj type
August 2010 Indicators

OUTSTANDING SHARES 217
Sr.No. Indicator Fields & formula1 Prowess company code = equity cocode2 Exchange = equity exch name3 Date = exchdate4 Face value = equity face value5 Outstanding shares = sharesoutstanding6 Book value = book value
Indicators August 2010

218 EPS
Sr.No. Indicator Fields & formula1 Prowess company code = epscocode2 Date = epsdate3 Event information = epsevent info4 Shares = epsno of shares5 PAT (net of P & E) = epsttm pat npe6 Depreciation = epsdep7 Factor = epsfactor
August 2010 Indicators
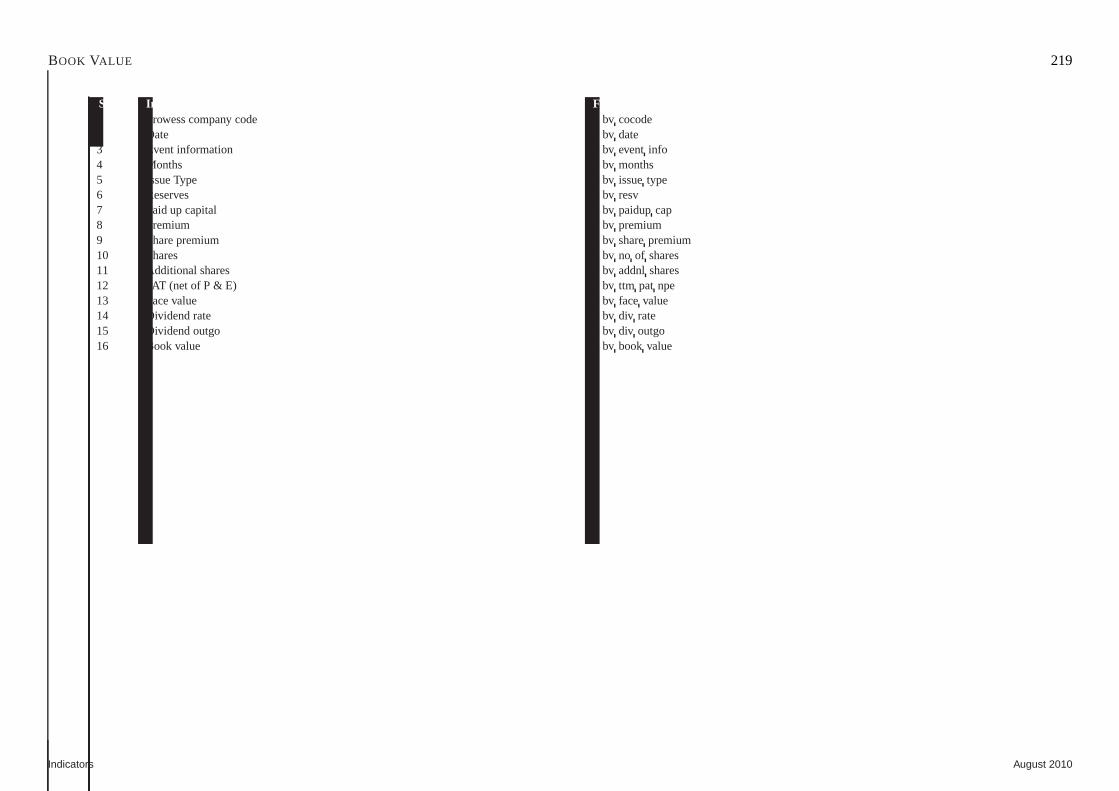
BOOK VALUE 219
Sr.No. Indicator Fields & formula1 Prowess company code = bv cocode2 Date = bv date3 Event information = bv event info4 Months = bv months5 Issue Type = bv issuetype6 Reserves = bv resv7 Paid up capital = bv paidupcap8 Premium = bv premium9 Share premium = bv sharepremium10 Shares = bv no of shares11 Additional shares = bv addnl shares12 PAT (net of P & E) = bv ttm pat npe13 Face value = bv face value14 Dividend rate = bv div rate15 Dividend outgo = bv div outgo16 Book value = bv book value
Indicators August 2010

220 DIVIDEND DECLARATIONS
Sr.No. Indicator Fields & formula1 Prowess company code = dividendcocode2 Date = div announcementdate3 Dividend type = div type4 Dividend rate = div rate5 Dividend record date = div recorddate6 BSE ex-dividend date = bseexdiv date7 NSE ex-dividend date = nseexdiv date
August 2010 Indicators
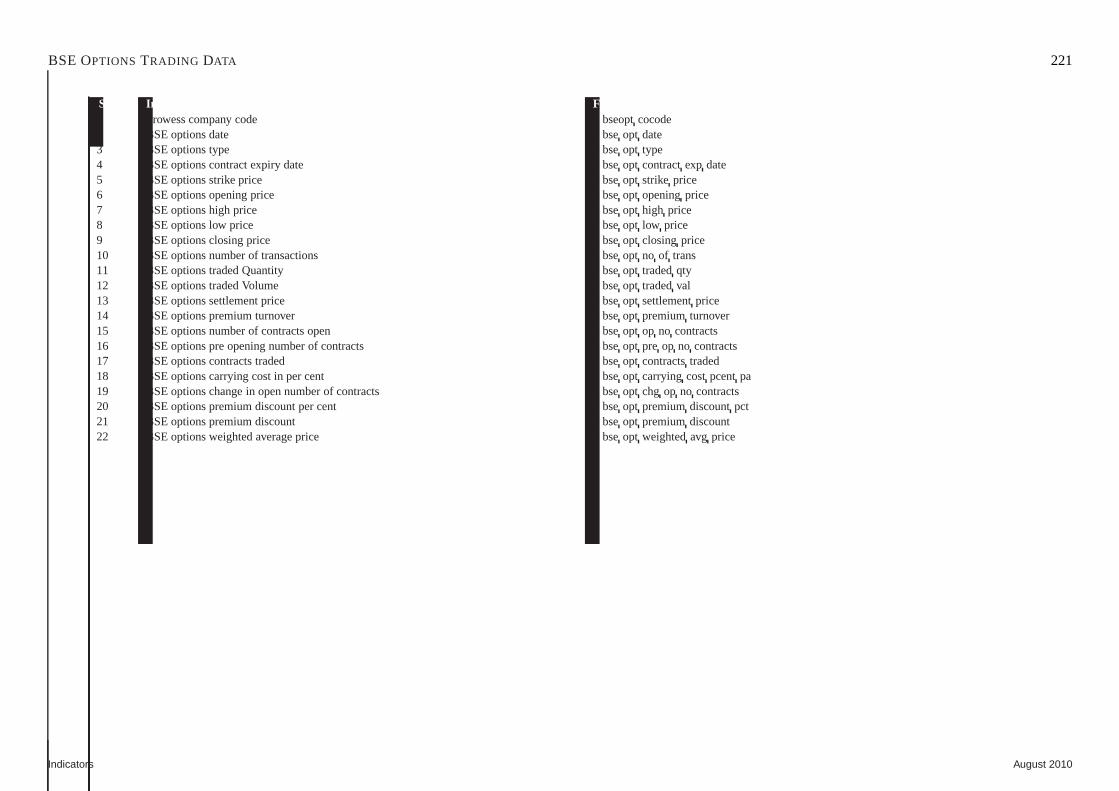
BSE OPTIONS TRADING DATA 221
Sr.No. Indicator Fields & formula1 Prowess company code = bseoptcocode2 BSE options date = bseopt date3 BSE options type = bseopt type4 BSE options contract expiry date = bseopt contractexp date5 BSE options strike price = bseopt strike price6 BSE options opening price = bseopt openingprice7 BSE options high price = bseopt high price8 BSE options low price = bseopt low price9 BSE options closing price = bseopt closing price10 BSE options number of transactions = bseopt no of trans11 BSE options traded Quantity = bseopt tradedqty12 BSE options traded Volume = bseopt tradedval13 BSE options settlement price = bseopt settlementprice14 BSE options premium turnover = bseopt premiumturnover15 BSE options number of contracts open = bseopt op no contracts16 BSE options pre opening number of contracts = bseopt pre op no contracts17 BSE options contracts traded = bseopt contractstraded18 BSE options carrying cost in per cent = bseopt carrying cost pcentpa19 BSE options change in open number of contracts = bseopt chg op no contracts20 BSE options premium discount per cent = bseopt premiumdiscountpct21 BSE options premium discount = bseopt premiumdiscount22 BSE options weighted average price = bseopt weightedavg price
Indicators August 2010
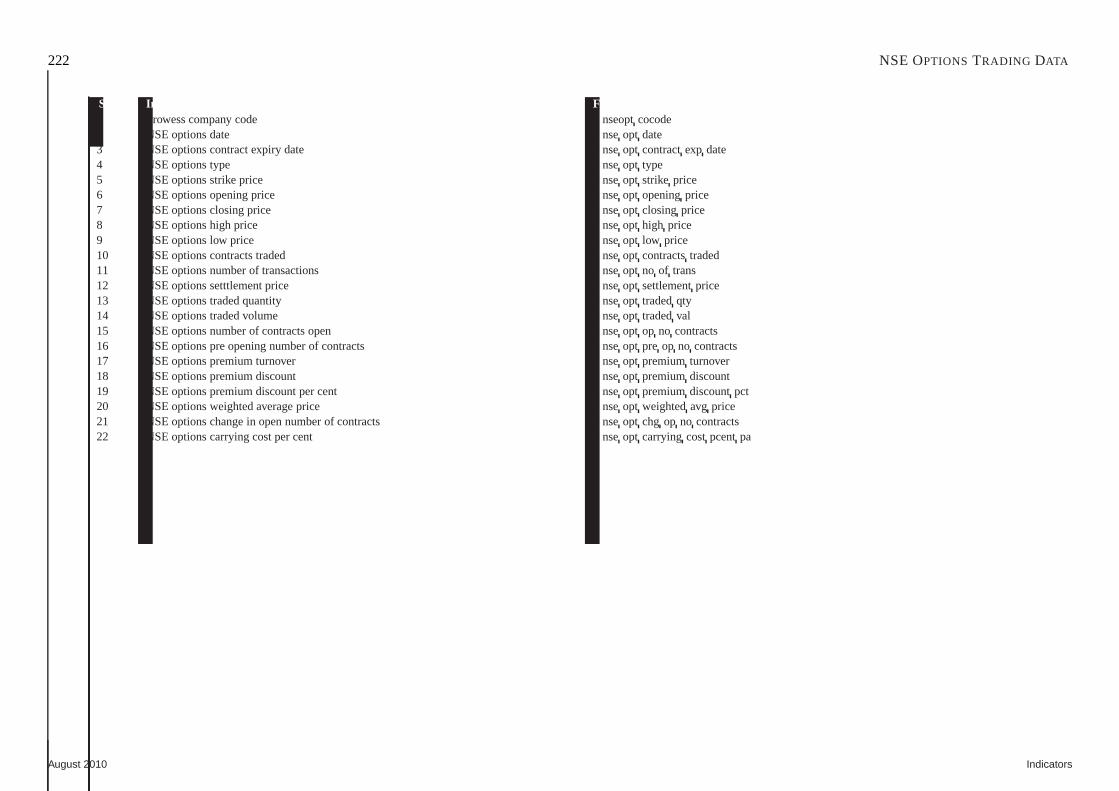
222 NSE OPTIONS TRADING DATA
Sr.No. Indicator Fields & formula1 Prowess company code = nseoptcocode2 NSE options date = nseopt date3 NSE options contract expiry date = nseopt contractexp date4 NSE options type = nseopt type5 NSE options strike price = nseopt strike price6 NSE options opening price = nseopt openingprice7 NSE options closing price = nseopt closing price8 NSE options high price = nseopt high price9 NSE options low price = nseopt low price10 NSE options contracts traded = nseopt contractstraded11 NSE options number of transactions = nseopt no of trans12 NSE options setttlement price = nseopt settlementprice13 NSE options traded quantity = nseopt tradedqty14 NSE options traded volume = nseopt tradedval15 NSE options number of contracts open = nseopt op no contracts16 NSE options pre opening number of contracts = nseopt pre op no contracts17 NSE options premium turnover = nseopt premiumturnover18 NSE options premium discount = nseopt premiumdiscount19 NSE options premium discount per cent = nseopt premiumdiscountpct20 NSE options weighted average price = nseopt weightedavg price21 NSE options change in open number of contracts = nseopt chg op no contracts22 NSE options carrying cost per cent = nseopt carrying cost pcentpa
August 2010 Indicators
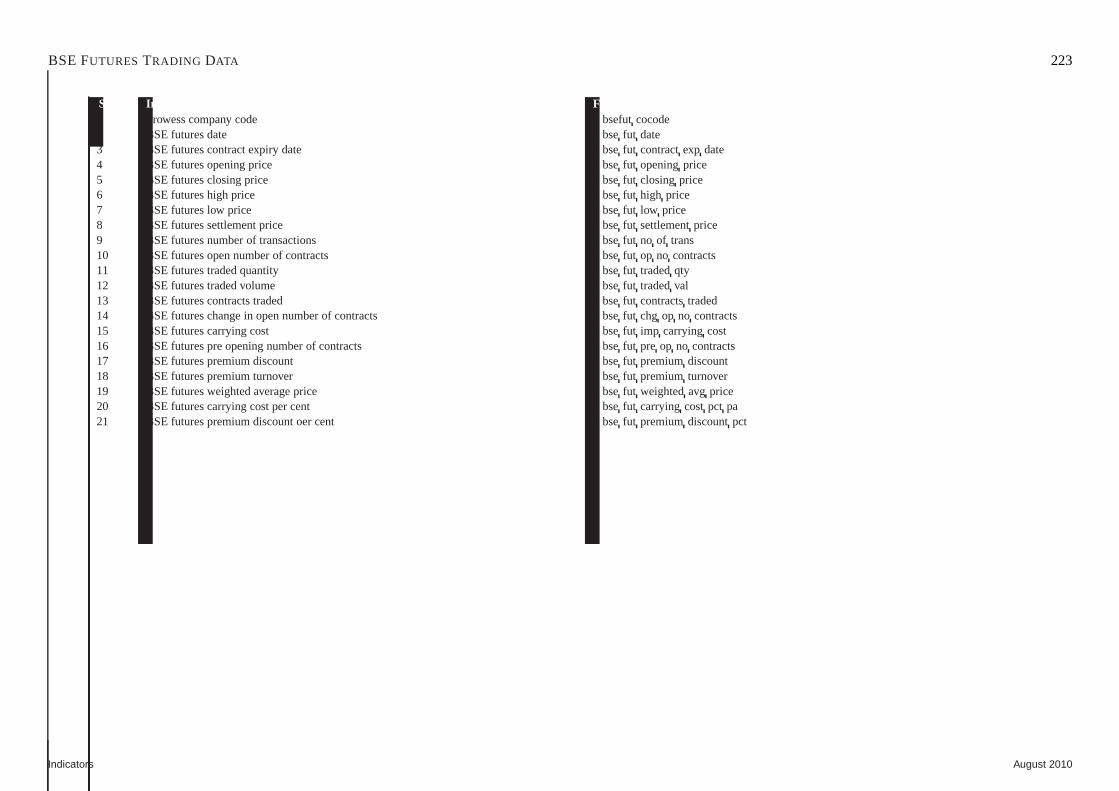
BSE FUTURES TRADING DATA 223
Sr.No. Indicator Fields & formula1 Prowess company code = bsefutcocode2 BSE futures date = bsefut date3 BSE futures contract expiry date = bsefut contractexp date4 BSE futures opening price = bsefut openingprice5 BSE futures closing price = bsefut closing price6 BSE futures high price = bsefut high price7 BSE futures low price = bsefut low price8 BSE futures settlement price = bsefut settlementprice9 BSE futures number of transactions = bsefut no of trans10 BSE futures open number of contracts = bsefut op no contracts11 BSE futures traded quantity = bsefut tradedqty12 BSE futures traded volume = bsefut tradedval13 BSE futures contracts traded = bsefut contractstraded14 BSE futures change in open number of contracts = bsefut chg op no contracts15 BSE futures carrying cost = bsefut imp carrying cost16 BSE futures pre opening number of contracts = bsefut pre op no contracts17 BSE futures premium discount = bsefut premiumdiscount18 BSE futures premium turnover = bsefut premiumturnover19 BSE futures weighted average price = bsefut weightedavg price20 BSE futures carrying cost per cent = bsefut carrying cost pct pa21 BSE futures premium discount oer cent = bsefut premiumdiscountpct
Indicators August 2010
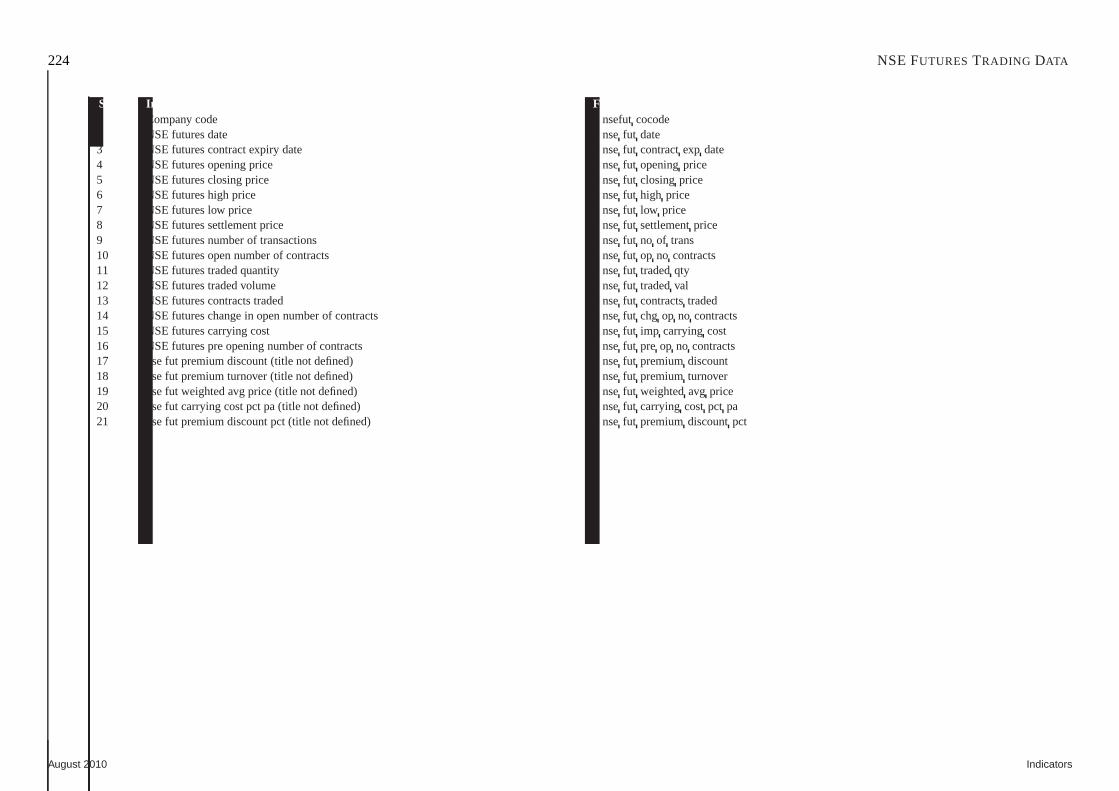
224 NSE FUTURES TRADING DATA
Sr.No. Indicator Fields & formula1 Company code = nsefutcocode2 NSE futures date = nsefut date3 NSE futures contract expiry date = nsefut contractexp date4 NSE futures opening price = nsefut openingprice5 NSE futures closing price = nsefut closing price6 NSE futures high price = nsefut high price7 NSE futures low price = nsefut low price8 NSE futures settlement price = nsefut settlementprice9 NSE futures number of transactions = nsefut no of trans10 NSE futures open number of contracts = nsefut op no contracts11 NSE futures traded quantity = nsefut tradedqty12 NSE futures traded volume = nsefut tradedval13 NSE futures contracts traded = nsefut contractstraded14 NSE futures change in open number of contracts = nsefut chg op no contracts15 NSE futures carrying cost = nsefut imp carrying cost16 NSE futures pre opening number of contracts = nsefut pre op no contracts17 nse fut premium discount (title not defined) = nsefut premiumdiscount18 nse fut premium turnover (title not defined) = nsefut premiumturnover19 nse fut weighted avg price (title not defined) = nsefut weightedavg price20 nse fut carrying cost pct pa (title not defined) = nsefut carrying cost pct pa21 nse fut premium discount pct (title not defined) = nsefut premiumdiscountpct
August 2010 Indicators
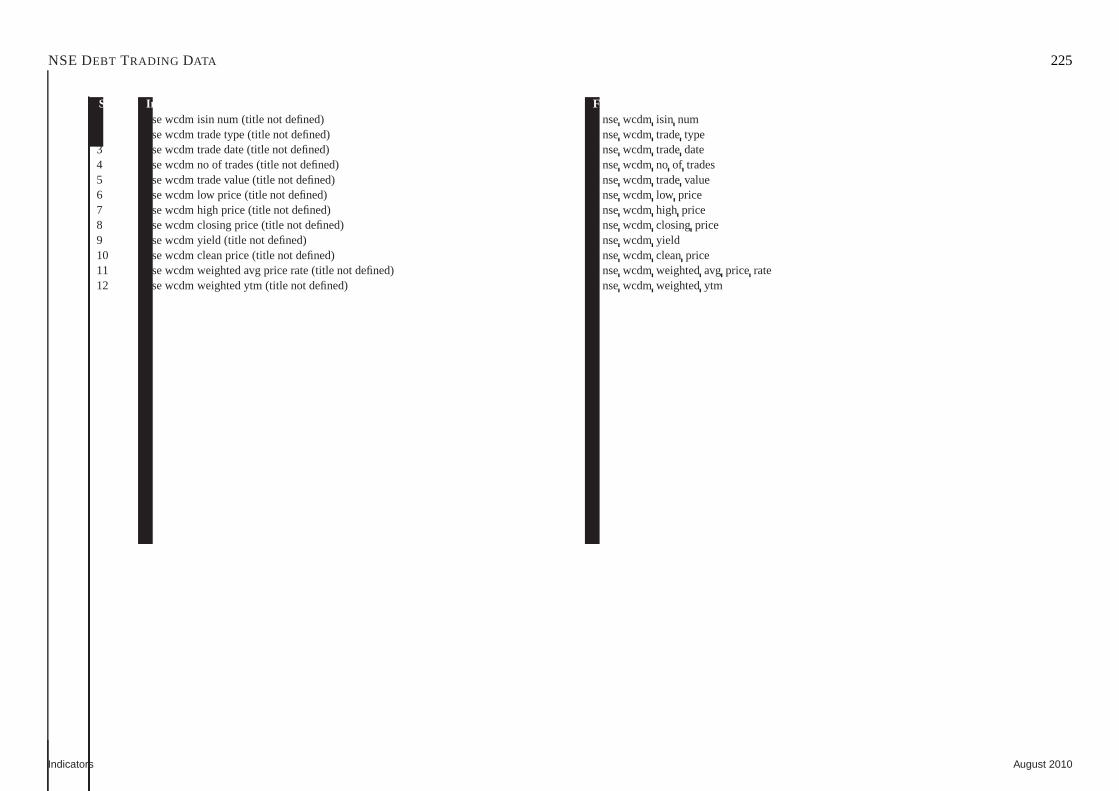
NSE DEBT TRADING DATA 225
Sr.No. Indicator Fields & formula1 nse wcdm isin num (title not defined) = nsewcdm isin num2 nse wcdm trade type (title not defined) = nsewcdm tradetype3 nse wcdm trade date (title not defined) = nsewcdm tradedate4 nse wcdm no of trades (title not defined) = nsewcdm no of trades5 nse wcdm trade value (title not defined) = nsewcdm tradevalue6 nse wcdm low price (title not defined) = nsewcdm low price7 nse wcdm high price (title not defined) = nsewcdm high price8 nse wcdm closing price (title not defined) = nsewcdm closing price9 nse wcdm yield (title not defined) = nsewcdm yield10 nse wcdm clean price (title not defined) = nsewcdm cleanprice11 nse wcdm weighted avg price rate (title not defined) = nsewcdm weightedavg price rate12 nse wcdm weighted ytm (title not defined) = nsewcdm weightedytm
Indicators August 2010
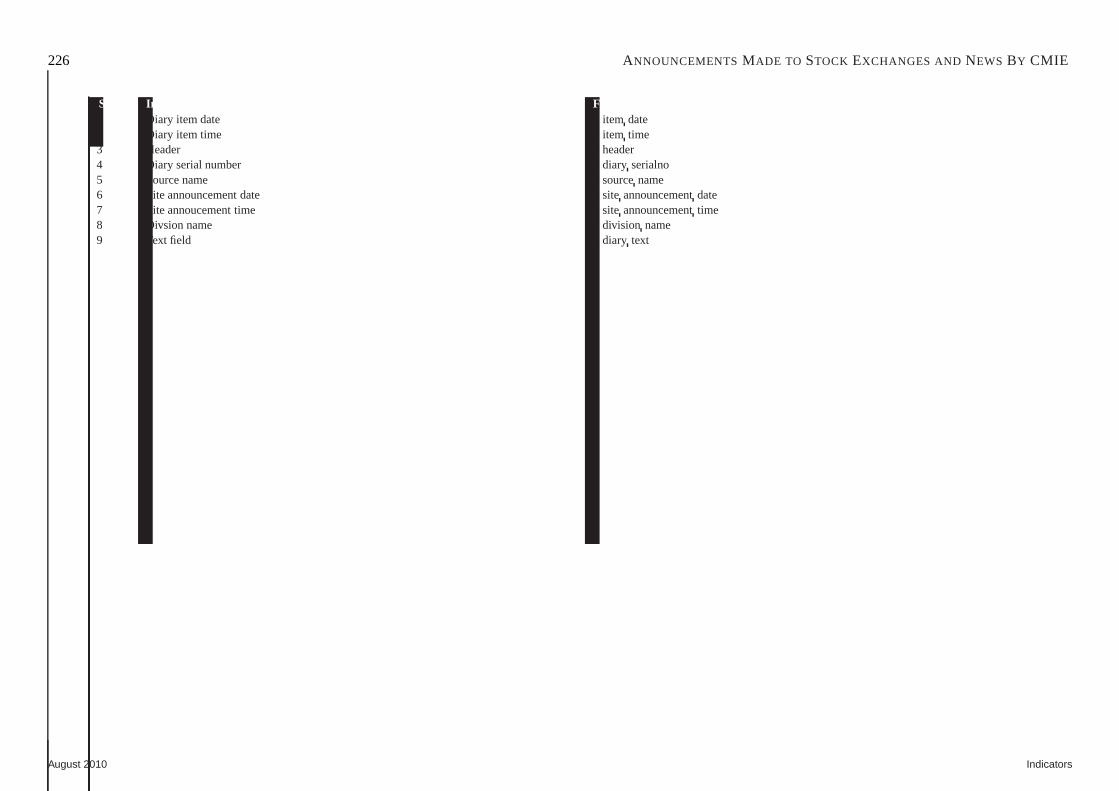
226 ANNOUNCEMENTSMADE TO STOCK EXCHANGES AND NEWS BY CMIE
Sr.No. Indicator Fields & formula1 Diary item date = item date2 Diary item time = item time3 Header = header4 Diary serial number = diary serialno5 Source name = sourcename6 Site announcement date = site announcementdate7 Site annoucement time = site announcementtime8 Divsion name = division name9 Text field = diary text
August 2010 Indicators
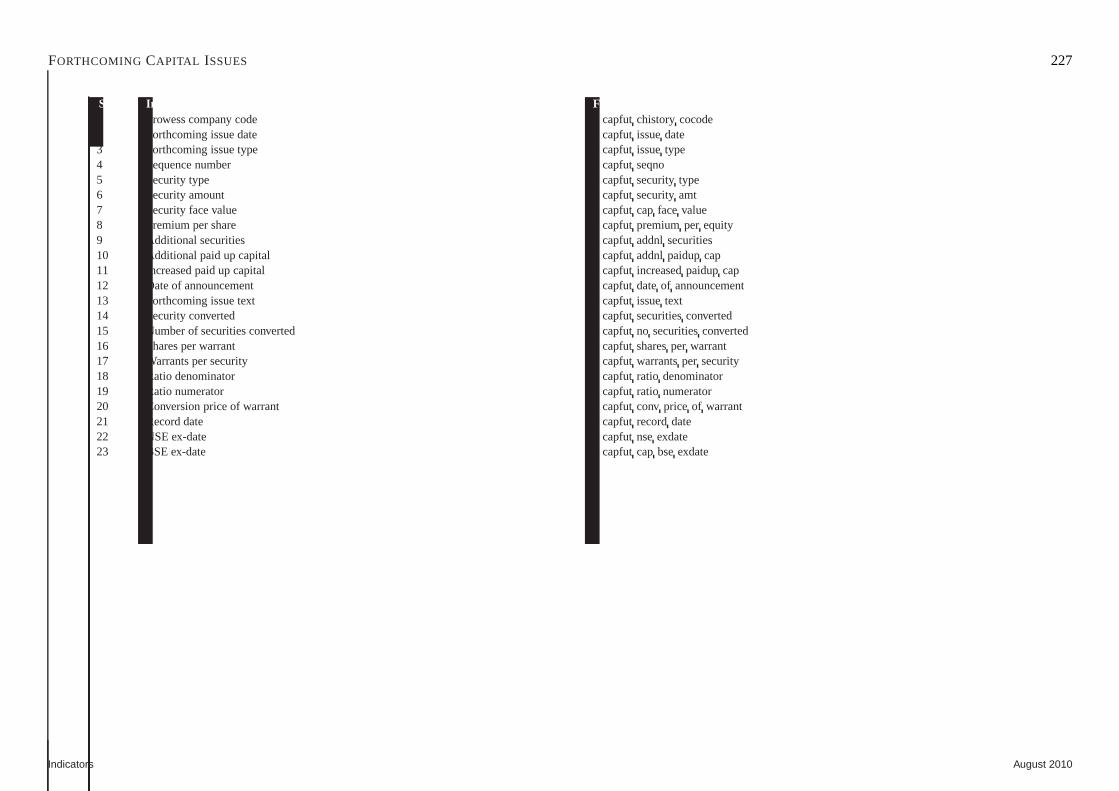
FORTHCOMING CAPITAL ISSUES 227
Sr.No. Indicator Fields & formula1 Prowess company code = capfut chistory cocode2 Forthcoming issue date = capfut issuedate3 Forthcoming issue type = capfut issuetype4 Sequence number = capfut seqno5 Security type = capfut securitytype6 Security amount = capfut securityamt7 Security face value = capfut cap facevalue8 Premium per share = capfutpremiumper equity9 Additional securities = capfutaddnl securities10 Additional paid up capital = capfutaddnl paidupcap11 Increased paid up capital = capfut increasedpaidupcap12 Date of announcement = capfutdateof announcement13 Forthcoming issue text = capfut issuetext14 Security converted = capfut securitiesconverted15 Number of securities converted = capfutno securitiesconverted16 Shares per warrant = capfut sharesper warrant17 Warrants per security = capfutwarrantsper security18 Ratio denominator = capfut ratio denominator19 Ratio numerator = capfut ratio numerator20 Conversion price of warrant = capfut conv price of warrant21 Record date = capfut recorddate22 NSE ex-date = capfutnseexdate23 BSE ex-date = capfut cap bseexdate
Indicators August 2010
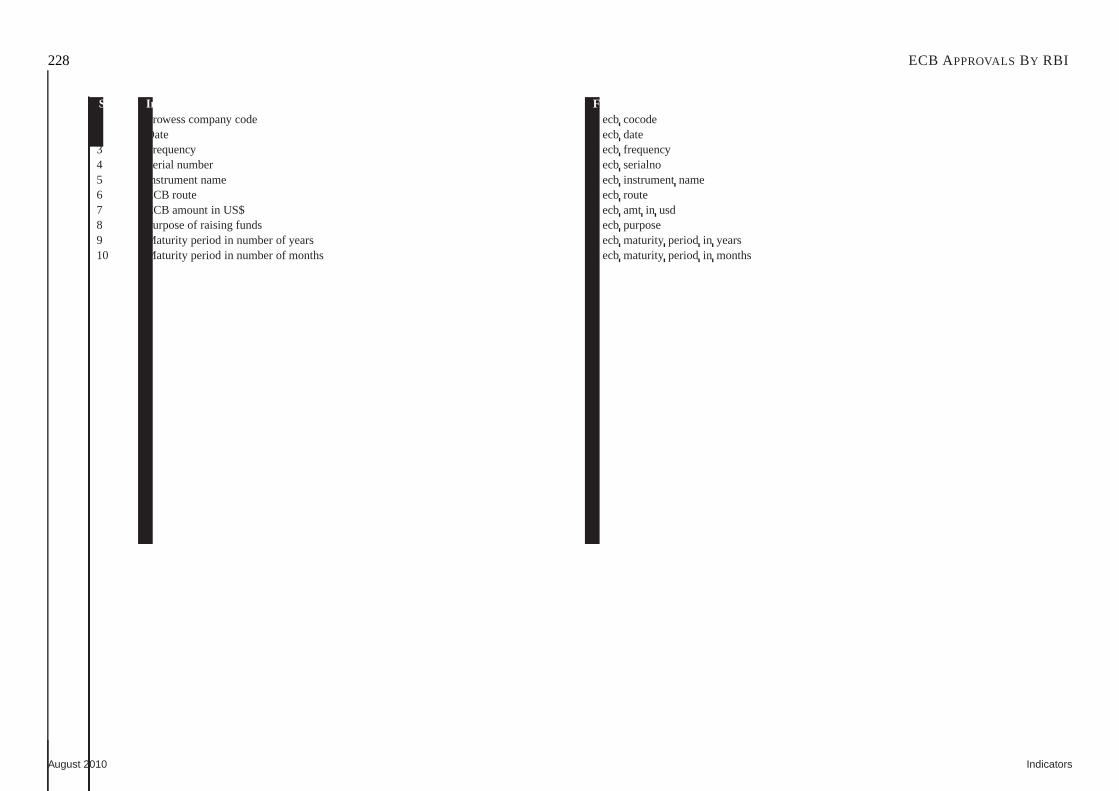
228 ECB APPROVALSBY RBI
Sr.No. Indicator Fields & formula1 Prowess company code = ecbcocode2 Date = ecbdate3 Frequency = ecb frequency4 Serial number = ecbserialno5 Instrument name = ecb instrumentname6 ECB route = ecbroute7 ECB amount in US$ = ecbamt in usd8 Purpose of raising funds = ecbpurpose9 Maturity period in number of years = ecbmaturity period in years10 Maturity period in number of months = ecbmaturity period in months
August 2010 Indicators
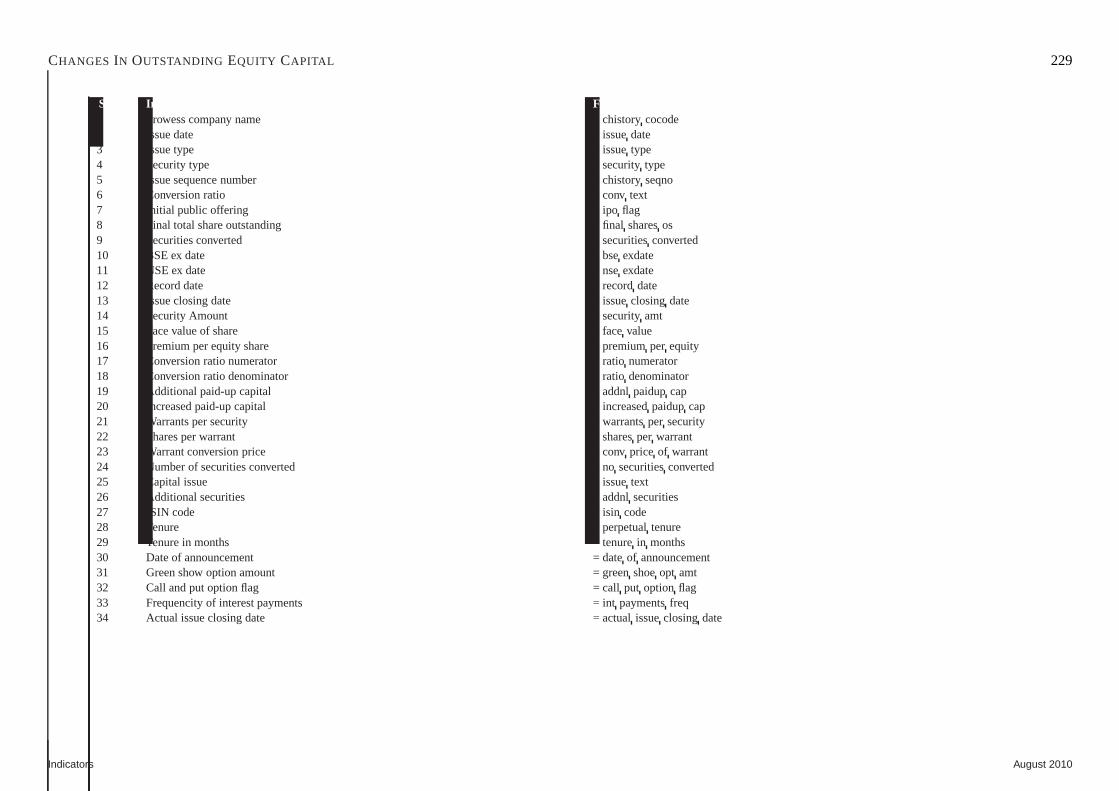
CHANGES IN OUTSTANDING EQUITY CAPITAL 229
Sr.No. Indicator Fields & formula1 Prowess company name = chistorycocode2 Issue date = issuedate3 Issue type = issuetype4 Security type = securitytype5 Issue sequence number = chistoryseqno6 Conversion ratio = conv text7 Initial public offering = ipo flag8 Final total share outstanding = final sharesos9 Securities converted = securitiesconverted10 BSE ex date = bseexdate11 NSE ex date = nseexdate12 Record date = recorddate13 Issue closing date = issueclosing date14 Security Amount = securityamt15 Face value of share = facevalue16 Premium per equity share = premiumper equity17 Conversion ratio numerator = ratio numerator18 Conversion ratio denominator = ratio denominator19 Additional paid-up capital = addnlpaidupcap20 Increased paid-up capital = increasedpaidupcap21 Warrants per security = warrantsper security22 Shares per warrant = sharesper warrant23 Warrant conversion price = conv price of warrant24 Number of securities converted = no securitiesconverted25 Capital issue = issuetext26 Additional securities = addnlsecurities27 ISIN code = isin code28 Tenure = perpetualtenure29 Tenure in months = tenurein months30 Date of announcement = dateof announcement31 Green show option amount = greenshoeopt amt32 Call and put option flag = call put option flag33 Frequencity of interest payments = int paymentsfreq34 Actual issue closing date = actualissueclosing date
Indicators August 2010
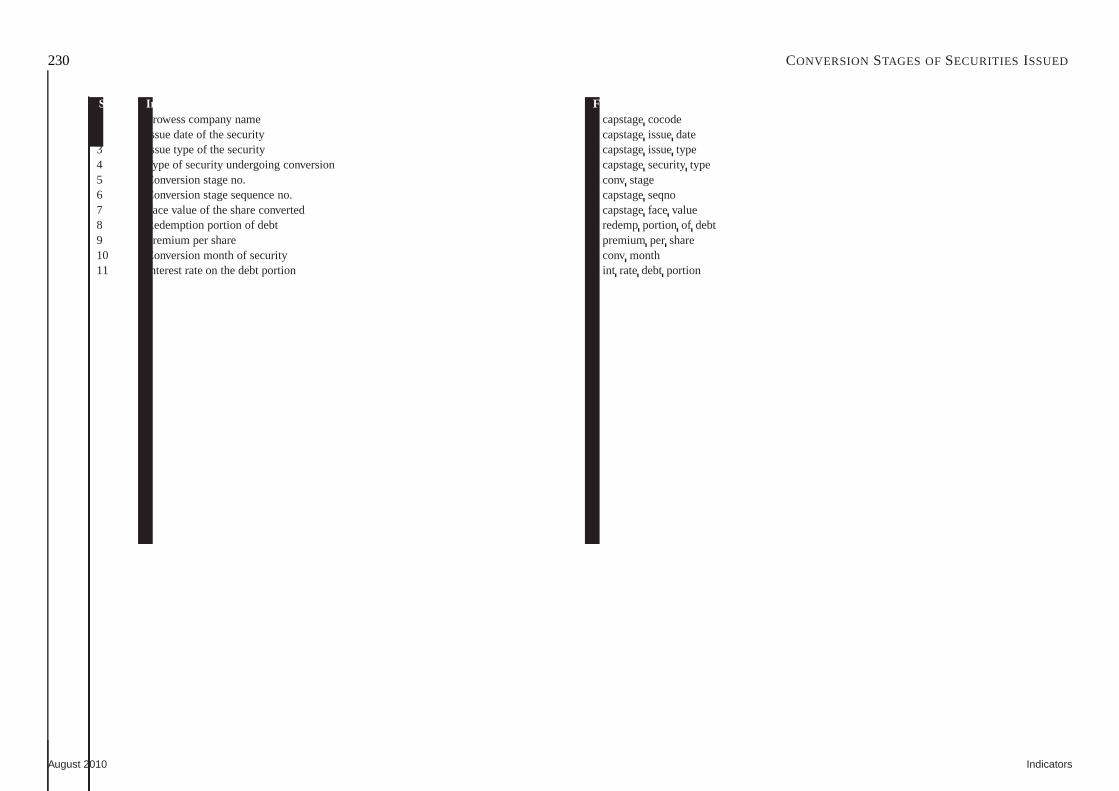
230 CONVERSION STAGES OFSECURITIES ISSUED
Sr.No. Indicator Fields & formula1 Prowess company name = capstagecocode2 Issue date of the security = capstageissuedate3 Issue type of the security = capstageissuetype4 Type of security undergoing conversion = capstagesecuritytype5 Conversion stage no. = conv stage6 Conversion stage sequence no. = capstageseqno7 Face value of the share converted = capstagefacevalue8 Redemption portion of debt = redempportion of debt9 Premium per share = premiumper share10 Conversion month of security = conv month11 Interest rate on the debt portion = int ratedebt portion
August 2010 Indicators
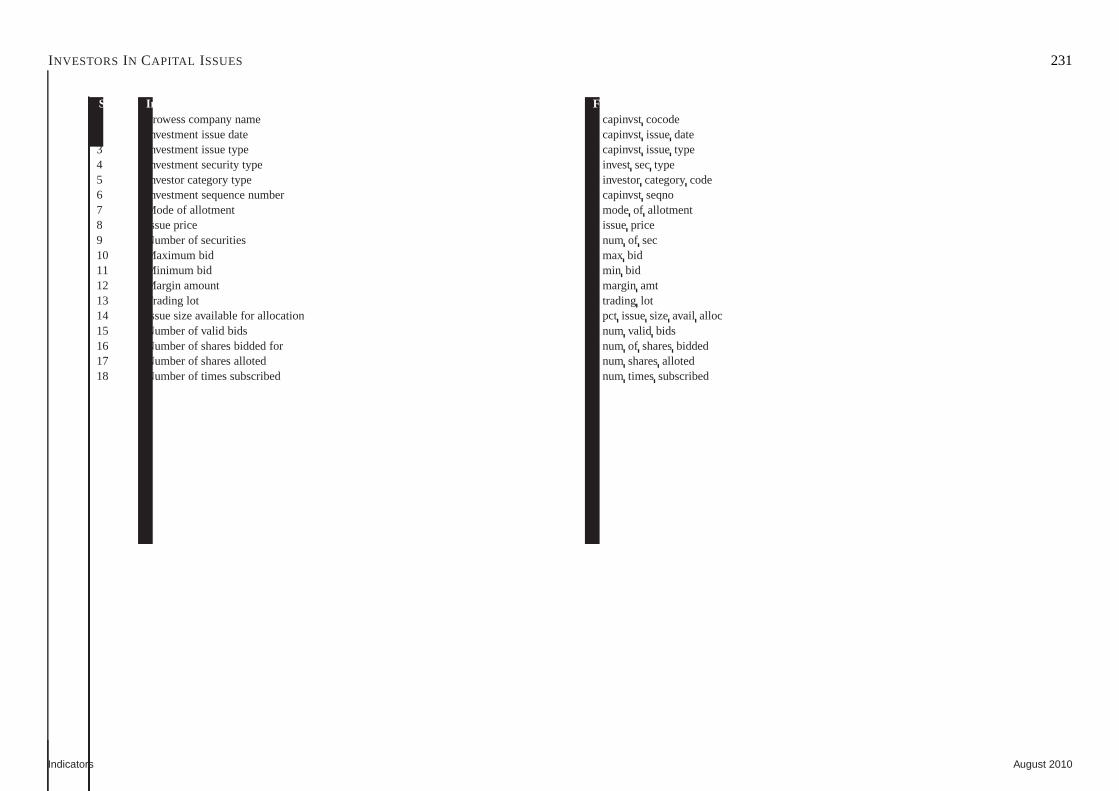
INVESTORSIN CAPITAL ISSUES 231
Sr.No. Indicator Fields & formula1 Prowess company name = capinvstcocode2 Investment issue date = capinvstissuedate3 Investment issue type = capinvstissuetype4 Investment security type = invest sectype5 Investor category type = investorcategorycode6 Investment sequence number = capinvstseqno7 Mode of allotment = modeof allotment8 Issue price = issueprice9 Number of securities = num of sec10 Maximum bid = max bid11 Minimum bid = min bid12 Margin amount = marginamt13 Trading lot = trading lot14 Issue size available for allocation = pct issuesizeavail alloc15 Number of valid bids = num valid bids16 Number of shares bidded for = num of sharesbidded17 Number of shares alloted = num sharesalloted18 Number of times subscribed = num timessubscribed
Indicators August 2010

232 IDENTITY INFORMATION ON INDICES
Sr.No. Indicator Fields & formula1 Index name = index name2 Index code = index code3 Index beta = index beta4 Index alpha = index alpha5 Index rsquare = index rsquare
August 2010 Indicators

INDEX CONSTITUENTS 233
Sr.No. Indicator Fields & formula1 Prowess company code = iconsdatacocode2 Date of index computation = iconsdatadate3 Share code = iconsdataindexcode4 Adjustment factor = iconsadj factor5 Paid up share capital = iconspaidupshares6 Total market capitalisation = iconsmktcap7 Free-float market capitalisation = icons freefloatmktcap8 company weightage = iconsweightage9 Investmnet factor = icons invest factor
Indicators August 2010
234 CHANGES IN INDEX CONSTITUENTS
Sr.No. Indicator Fields & formula1 Prowess company code = iconshistcocode2 Prowess index code = iconshistindexcode3 Effective date of change in index composition = index effective chg date4 Company included in index on = co incl on
August 2010 Indicators

INDEX NUMBERS 235
Sr.No. Indicator Fields & formula1 Index Stock Code = indxstk code2 Index Returns = index returns3 Index Traded Date = index date4 Index Open Price = index opening5 Index Closing Price = index closing6 Index High Price = index high7 Index Low Price = index low8 Index P/E = index pe9 Index Trading Volumes = index tradedval10 Index Market Cap = index mktcap11 Index Yield = index yield12 Index P/B = index pb13 Free Float Market cap = index free float mktcap14 Number of companies in index = index count
Indicators August 2010
236 COMPANY’ S L ISTING ON STOCK EXCHANGES
Sr.No. Indicator Fields & formula1 Prowess company code = listedoncocode2 Stock exchange short name = exchshort name3 Stock exchange name = exchname
August 2010 Indicators

INDEX MAPPING FORCOMPANIES 237
Sr.No. Indicator Fields & formula1 Prowess company code = comindexcocode2 Index code = comindexindexcode
Indicators August 2010

238 BSE & NSE TRADING DATES
Sr.No. Indicator Fields & formula1 Listed On Exchange = listed exch2 Trading date = tradeddate
August 2010 Indicators
239
Chapter 5
Business Segments & Products
ContentsTables of Business Segments and Products database . . . . . . . .. . . . . . . . . . . . . . . . . . . . . . . . . . . . . . . . . . . . . . . . . . . . . . . . . . .. . . 240
Location of Plants . . . . . . . . . . . . . . . . . . . . . . . . . . . . . . . . . . .. . . . . . . . . . . . . . . . . . . . . . . . . . . . . . . . . . . . . . . . . . . . . . 241
Business Segment-wise Information . . . . . . . . . . . . . . . . . . . .. . . . . . . . . . . . . . . . . . . . . . . . . . . . . . . . . . . . . . . . . . . . . . . . . . .242
Products Produced / Traded . . . . . . . . . . . . . . . . . . . . . . . . . . . .. . . . . . . . . . . . . . . . . . . . . . . . . . . . . . . . . . . . . . . . . . . . . . . 243
Raw Materials Consumed . . . . . . . . . . . . . . . . . . . . . . . . . . . . . . .. . . . . . . . . . . . . . . . . . . . . . . . . . . . . . . . . . . . . . . . . . . . . . 244
Energy Consumption . . . . . . . . . . . . . . . . . . . . . . . . . . . . . . . . . .. . . . . . . . . . . . . . . . . . . . . . . . . . . . . . . . . . . . . . . . . . . . . 245
Product-wise Energy Consumption . . . . . . . . . . . . . . . . . . . . . .. . . . . . . . . . . . . . . . . . . . . . . . . . . . . . . . . . . . . . . . . . . . . . . . . . 246
Indicators August 2010
240
Tables of Business Segments and Products database
Listed companies are required to publish, along with their interim financial statements,brief data on the performance of their individual business segments. The Table “Busi-ness Segment-wise Information” captures such data. Each record in this Table providesdata on one segment of one company in one period. The total of all segments is also onerecord in the same Table.
Segment names are as provided by the companies. These are quite heterogeneous andmostly cannot be compared to segment names of similar businesses provided by othercompanies.
The “Products Produced / Traded” Table contains data on capacity, production, pur-chases, stocks and sales of individual products produced orservices rendered by thecompany during an accounting period. This information is sourced from the AnnualReport. It is most relevant in the case of manufactured products. Therefore, data is alsomostly available for manufactured products. However, we have tried to add data forutilities and services as well.
Each record in this Table pertains to a product or a service. The database presents data,usually, as spelt by the company. Modifications in the spellings are made mostly to
ensure inter-year comparability. However, comparabilityis maintained essentially bythe mapping of every product / service to a unique product/services classification code.This is the “Prowess product code”.
The Table “Location of Plants” provides data on plant locations and some details re-garding products produced at these plants. However, there are no “plants” for severalservices sector companies. There is no standard source for this information. It is createdfrom web-sites, press releases, Annual Reports, etc.
Like the products produced and services rendered information, Prowess also containsinformation on raw materials consumed. Each record in the Table: “Raw Materials Con-sumed” provides quantity and value data on one raw material consumed by the companyin one accounting period.
Annual Reports of select industries provided detailed dataon the consumption of var-ious forms energy and the consumption of these in the case of each product category.Two Tables capture this information: “Energy Consumption”and “Product-wise EnergyConsumption”.
August 2010 Indicators
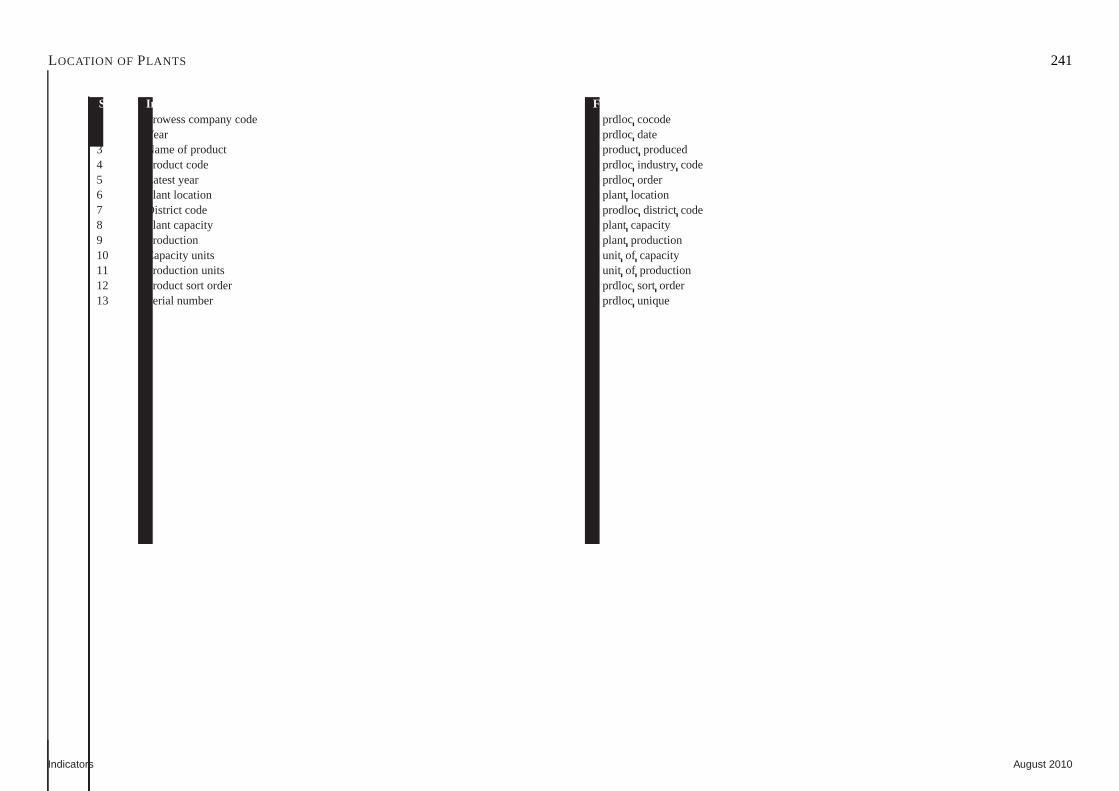
LOCATION OF PLANTS 241
Sr.No. Indicator Fields & formula1 Prowess company code = prdloc cocode2 Year = prdloc date3 Name of product = productproduced4 Product code = prdloc industry code5 Latest year = prdloc order6 Plant location = plant location7 District code = prodloc district code8 Plant capacity = plant capacity9 Production = plant production10 Capacity units = unit of capacity11 Production units = unit of production12 Product sort order = prdloc sort order13 Serial number = prdloc unique
Indicators August 2010
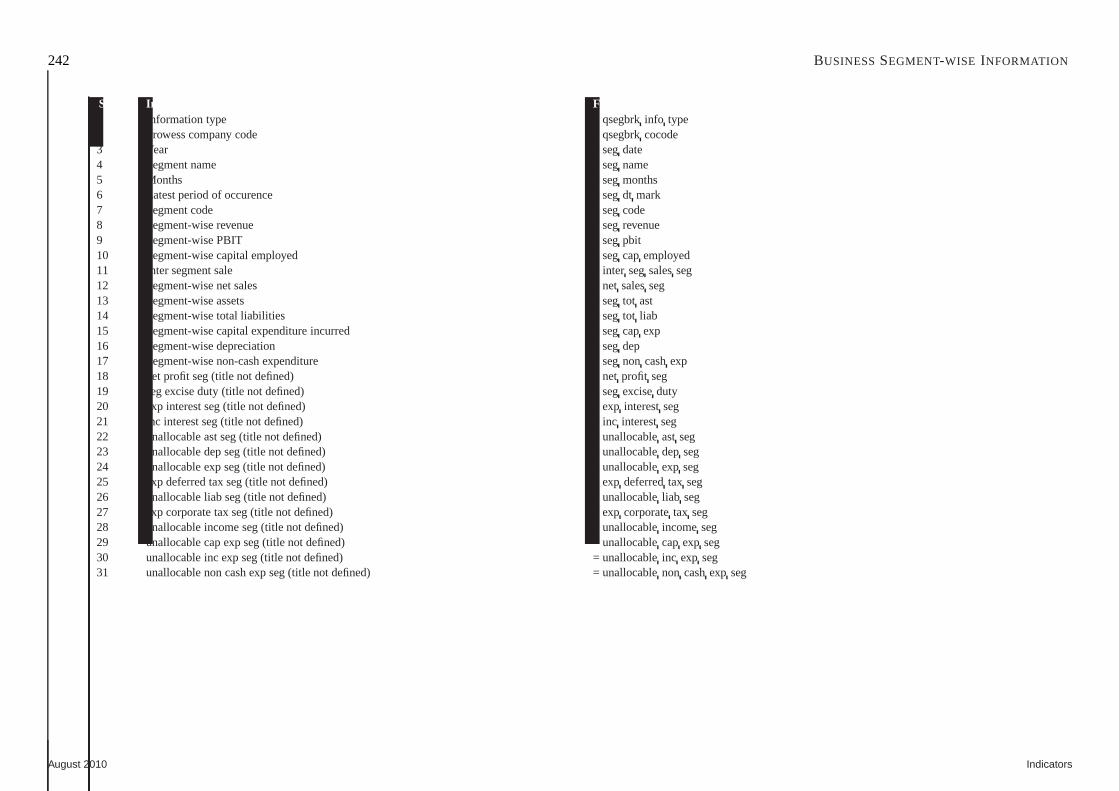
242 BUSINESSSEGMENT-WISE INFORMATION
Sr.No. Indicator Fields & formula1 Information type = qsegbrkinfo type2 Prowess company code = qsegbrkcocode3 Year = segdate4 Segment name = segname5 Months = segmonths6 Latest period of occurence = segdt mark7 Segment code = segcode8 Segment-wise revenue = segrevenue9 Segment-wise PBIT = segpbit10 Segment-wise capital employed = segcapemployed11 Inter segment sale = inter segsalesseg12 Segment-wise net sales = net salesseg13 Segment-wise assets = segtot ast14 Segment-wise total liabilities = segtot liab15 Segment-wise capital expenditure incurred = segcapexp16 Segment-wise depreciation = segdep17 Segment-wise non-cash expenditure = segnon cashexp18 net profit seg (title not defined) = net profit seg19 seg excise duty (title not defined) = segexciseduty20 exp interest seg (title not defined) = exp interestseg21 inc interest seg (title not defined) = inc interestseg22 unallocable ast seg (title not defined) = unallocableast seg23 unallocable dep seg (title not defined) = unallocabledep seg24 unallocable exp seg (title not defined) = unallocableexp seg25 exp deferred tax seg (title not defined) = exp deferredtax seg26 unallocable liab seg (title not defined) = unallocableliab seg27 exp corporate tax seg (title not defined) = exp corporatetax seg28 unallocable income seg (title not defined) = unallocableincomeseg29 unallocable cap exp seg (title not defined) = unallocablecapexp seg30 unallocable inc exp seg (title not defined) = unallocableinc exp seg31 unallocable non cash exp seg (title not defined) = unallocablenon cashexp seg
August 2010 Indicators
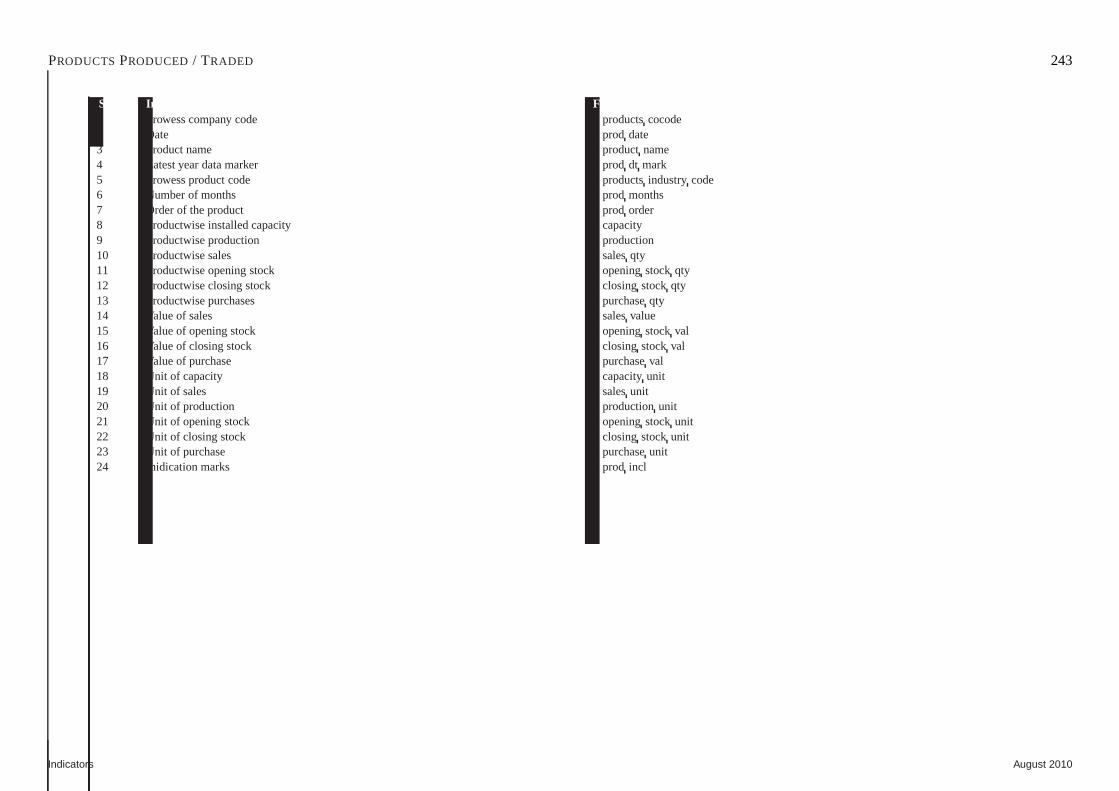
PRODUCTSPRODUCED / TRADED 243
Sr.No. Indicator Fields & formula1 Prowess company code = productscocode2 Date = prod date3 Product name = productname4 Latest year data marker = prod dt mark5 Prowess product code = productsindustry code6 Number of months = prod months7 Order of the product = prod order8 Productwise installed capacity = capacity9 Productwise production = production10 Productwise sales = salesqty11 Productwise opening stock = openingstock qty12 Productwise closing stock = closingstock qty13 Productwise purchases = purchaseqty14 Value of sales = salesvalue15 Value of opening stock = openingstock val16 Value of closing stock = closingstock val17 Value of purchase = purchaseval18 Unit of capacity = capacityunit19 Unit of sales = salesunit20 Unit of production = productionunit21 Unit of opening stock = openingstock unit22 Unit of closing stock = closingstock unit23 Unit of purchase = purchaseunit24 Inidication marks = prod incl
Indicators August 2010
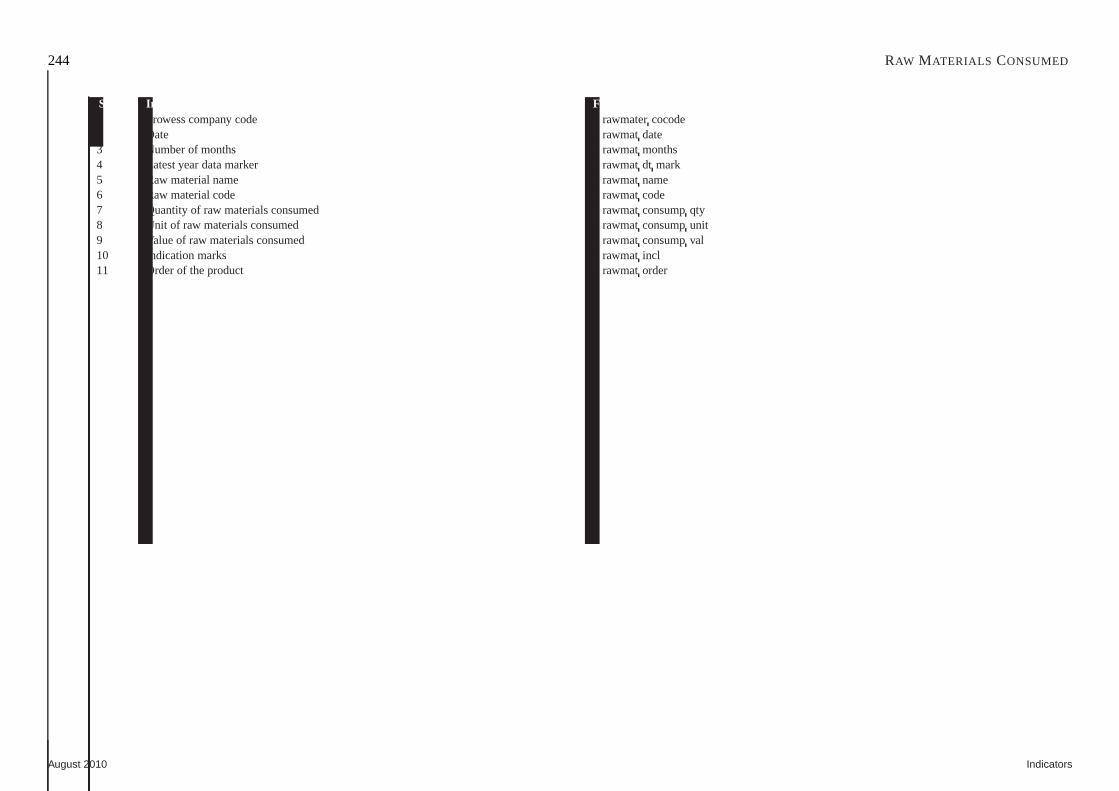
244 RAW MATERIALS CONSUMED
Sr.No. Indicator Fields & formula1 Prowess company code = rawmatercocode2 Date = rawmatdate3 Number of months = rawmatmonths4 Latest year data marker = rawmatdt mark5 Raw material name = rawmatname6 Raw material code = rawmatcode7 Quantity of raw materials consumed = rawmatconsumpqty8 Unit of raw materials consumed = rawmatconsumpunit9 Value of raw materials consumed = rawmatconsumpval10 Indication marks = rawmatincl11 Order of the product = rawmatorder
August 2010 Indicators
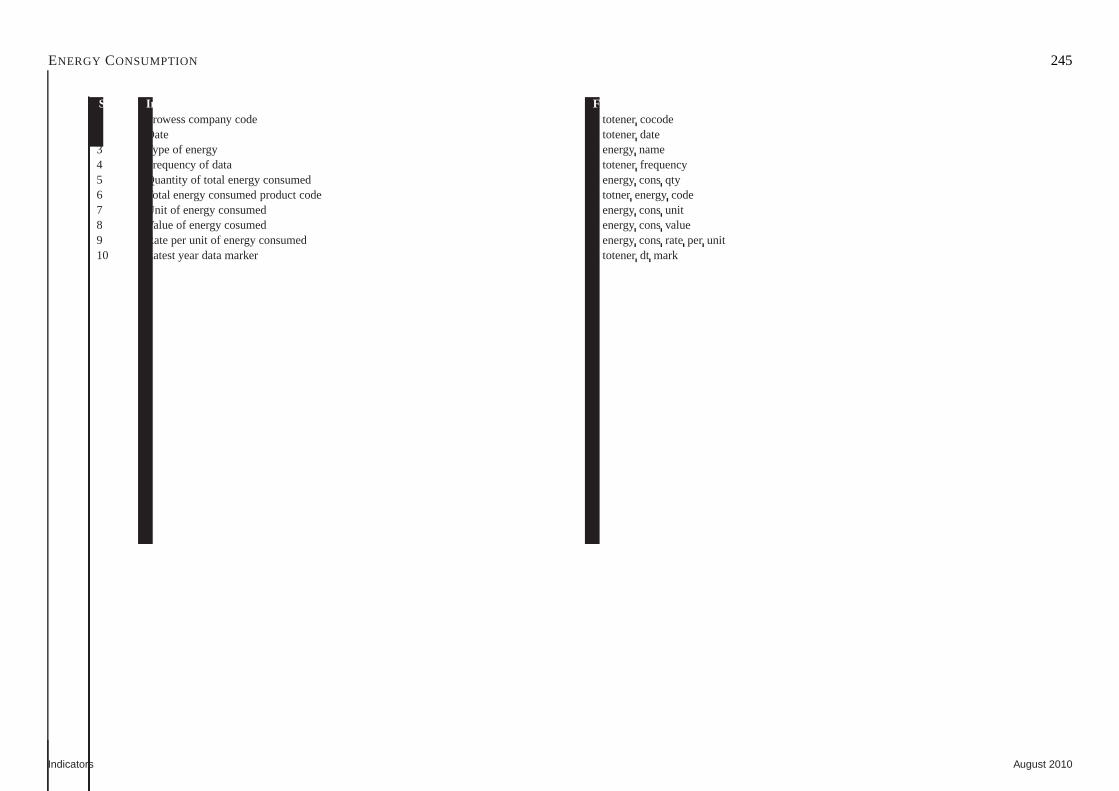
ENERGY CONSUMPTION 245
Sr.No. Indicator Fields & formula1 Prowess company code = totenercocode2 Date = totenerdate3 Type of energy = energyname4 Frequency of data = totenerfrequency5 Quantity of total energy consumed = energyconsqty6 Total energy consumed product code = totnerenergycode7 Unit of energy consumed = energyconsunit8 Value of energy cosumed = energyconsvalue9 Rate per unit of energy consumed = energyconsrateper unit10 Latest year data marker = totenerdt mark
Indicators August 2010
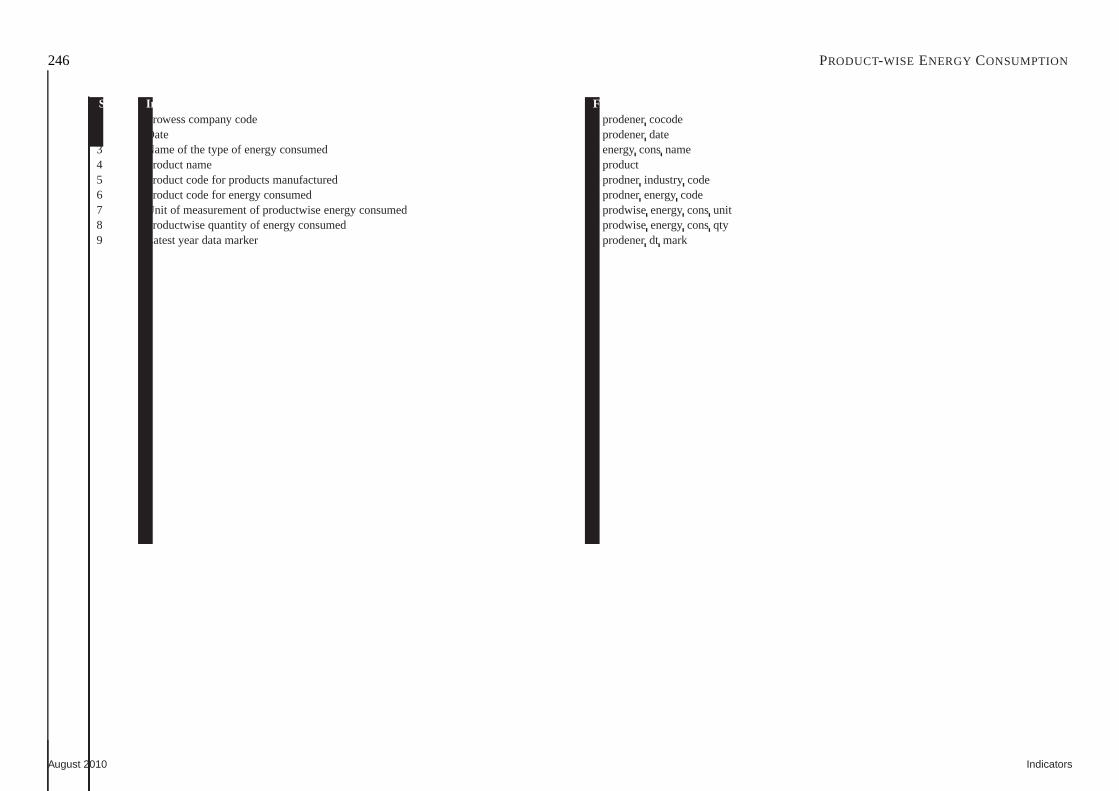
246 PRODUCT-WISE ENERGY CONSUMPTION
Sr.No. Indicator Fields & formula1 Prowess company code = prodenercocode2 Date = prodenerdate3 Name of the type of energy consumed = energyconsname4 Product name = product5 Product code for products manufactured = prodnerindustry code6 Product code for energy consumed = prodnerenergycode7 Unit of measurement of productwise energy consumed = prodwise energyconsunit8 Productwise quantity of energy consumed = prodwiseenergyconsqty9 Latest year data marker = prodenerdt mark
August 2010 Indicators
247
Chapter 6
Capex / M & A
ContentsThe CapEx and M&A Tables in the database . . . . . . . . . . . . . . . . . .. . . . . . . . . . . . . . . . . . . . . . . . . . . . . . . . . . . . . . . . . . . . . . . . 248
Capital Expenditure Projects . . . . . . . . . . . . . . . . . . . . . . . . .. . . . . . . . . . . . . . . . . . . . . . . . . . . . . . . . . . . . . . . . . . . . . . . . . . 249
Project Locations . . . . . . . . . . . . . . . . . . . . . . . . . . . . . . . . . . .. . . . . . . . . . . . . . . . . . . . . . . . . . . . . . . . . . . . . . . . . . . . . . 250
Project Products . . . . . . . . . . . . . . . . . . . . . . . . . . . . . . . . . . . .. . . . . . . . . . . . . . . . . . . . . . . . . . . . . . . . . . . . . . . . . . . . . . 251
Merger and Acquisition . . . . . . . . . . . . . . . . . . . . . . . . . . . . . . .. . . . . . . . . . . . . . . . . . . . . . . . . . . . . . . . . . . . . . . . . . . . . . . 252
Events of Merger and Acquisitions . . . . . . . . . . . . . . . . . . . . . .. . . . . . . . . . . . . . . . . . . . . . . . . . . . . . . . . . . . . . . . . . . . . . . . . . 254
Indicators August 2010
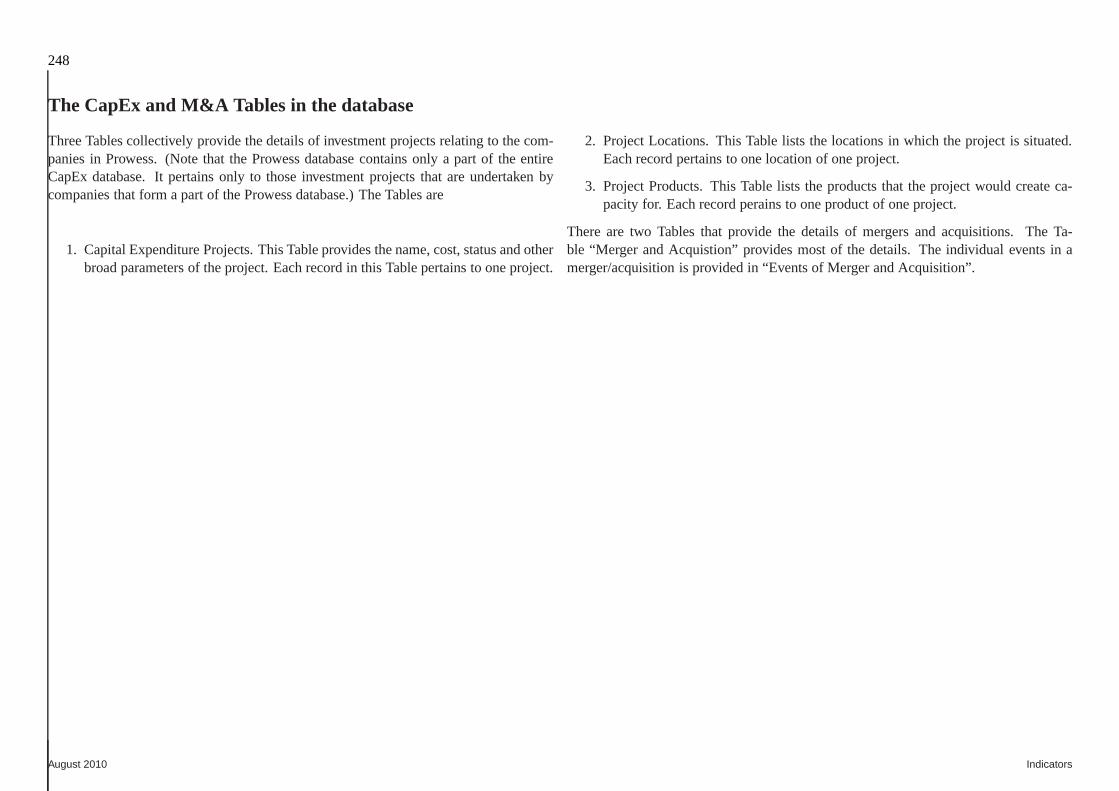
248
The CapEx and M&A Tables in the database
Three Tables collectively provide the details of investment projects relating to the com-panies in Prowess. (Note that the Prowess database containsonly a part of the entireCapEx database. It pertains only to those investment projects that are undertaken bycompanies that form a part of the Prowess database.) The Tables are
1. Capital Expenditure Projects. This Table provides the name, cost, status and otherbroad parameters of the project. Each record in this Table pertains to one project.
2. Project Locations. This Table lists the locations in which the project is situated.Each record pertains to one location of one project.
3. Project Products. This Table lists the products that the project would create ca-pacity for. Each record perains to one product of one project.
There are two Tables that provide the details of mergers and acquisitions. The Ta-ble “Merger and Acquistion” provides most of the details. The individual events in amerger/acquisition is provided in “Events of Merger and Acquisition”.
August 2010 Indicators
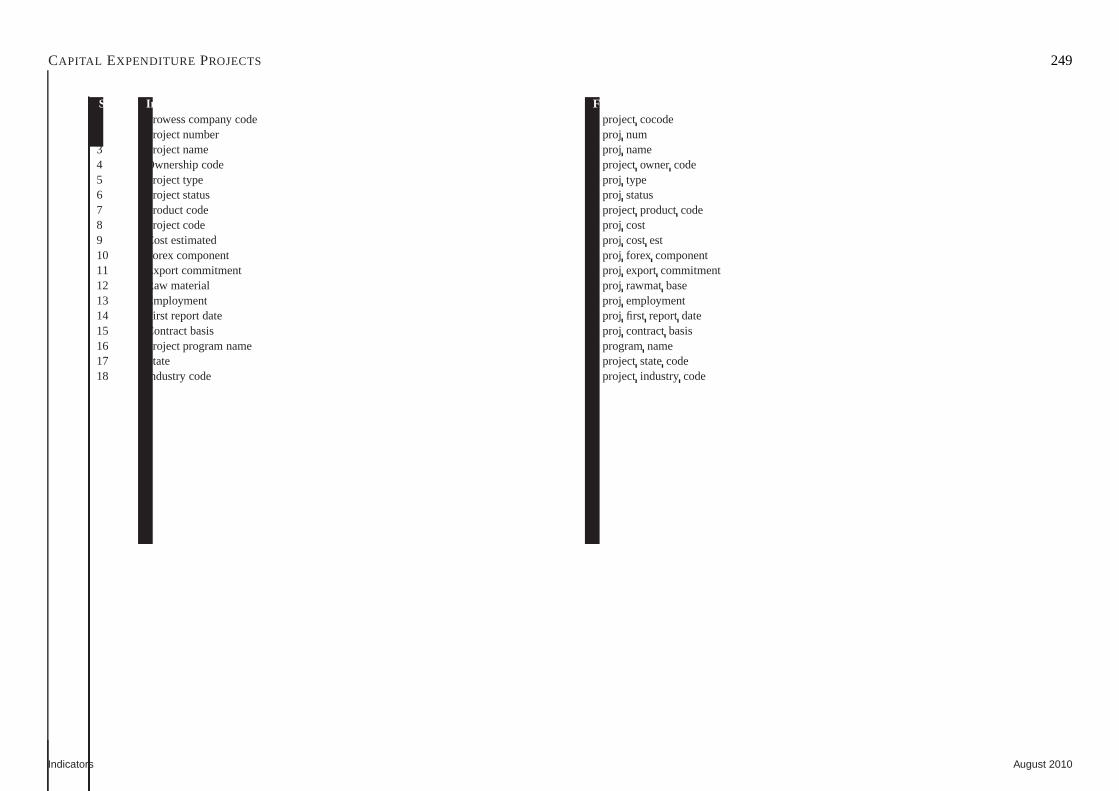
CAPITAL EXPENDITURE PROJECTS 249
Sr.No. Indicator Fields & formula1 Prowess company code = project cocode2 Project number = proj num3 Project name = proj name4 Ownership code = projectowner code5 Project type = proj type6 Project status = proj status7 Product code = projectproductcode8 Project code = proj cost9 Cost estimated = proj cost est10 Forex component = proj forex component11 Export commitment = proj export commitment12 Raw material = proj rawmatbase13 Employment = proj employment14 First report date = proj first report date15 Contract basis = proj contractbasis16 Project program name = programname17 State = project statecode18 Industry code = project industry code
Indicators August 2010

250 PROJECTLOCATIONS
Sr.No. Indicator Fields & formula1 Prowess company code = prjloc cocode2 Project number = prjloc proj num3 Project location = proj location4 Project location district code = prjloc district code
August 2010 Indicators
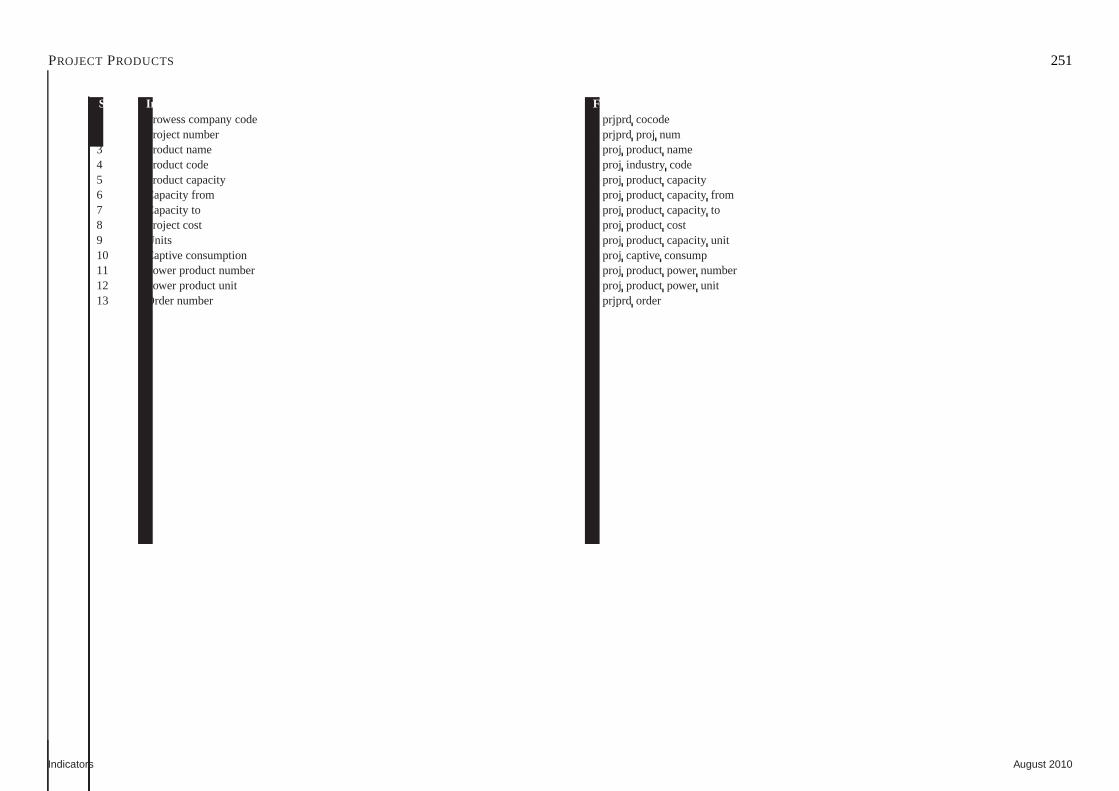
PROJECTPRODUCTS 251
Sr.No. Indicator Fields & formula1 Prowess company code = prjprd cocode2 Project number = prjprd proj num3 Product name = proj productname4 Product code = proj industry code5 Product capacity = proj productcapacity6 Capacity from = proj productcapacityfrom7 Capacity to = proj productcapacityto8 Project cost = proj productcost9 Units = proj productcapacityunit10 Captive consumption = proj captiveconsump11 Power product number = proj productpower number12 Power product unit = proj productpower unit13 Order number = prjprd order
Indicators August 2010
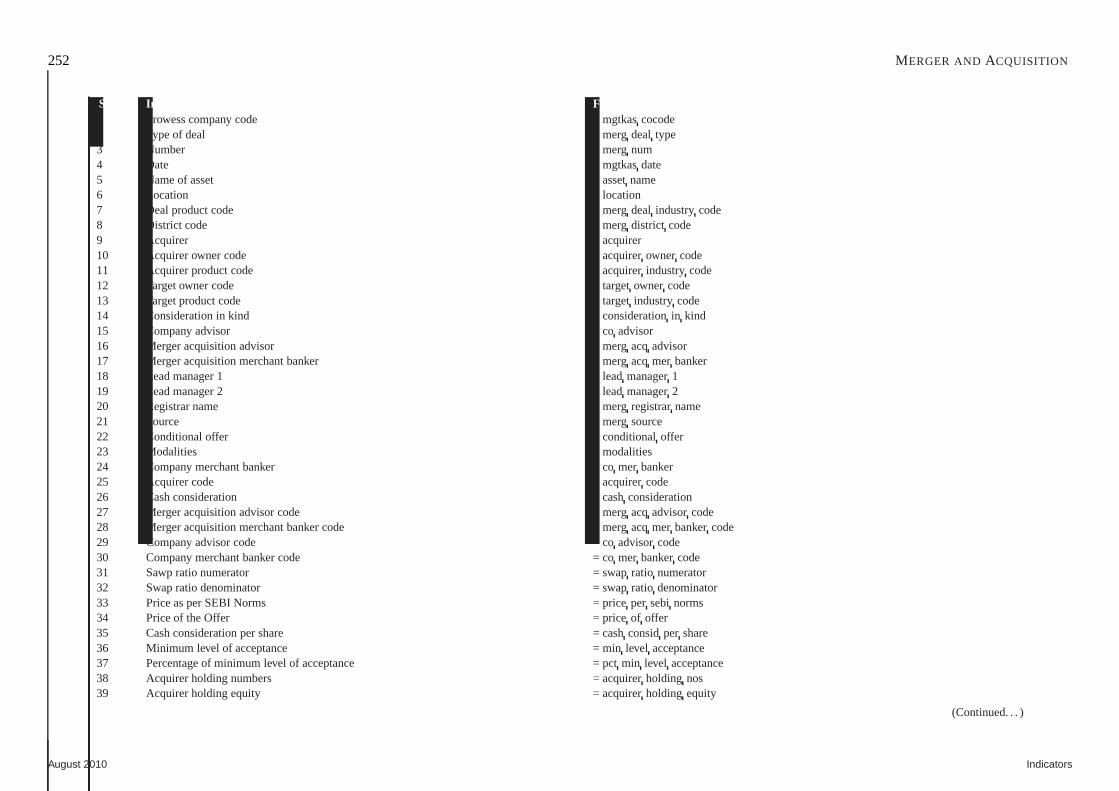
252 MERGER ANDACQUISITION
Sr.No. Indicator Fields & formula1 Prowess company code = mgtkascocode2 Type of deal = mergdeal type3 Number = mergnum4 Date = mgtkasdate5 Name of asset = assetname6 Location = location7 Deal product code = mergdeal industry code8 District code = mergdistrict code9 Acquirer = acquirer10 Acquirer owner code = acquirerowner code11 Acquirer product code = acquirerindustry code12 Target owner code = targetowner code13 Target product code = targetindustry code14 Consideration in kind = considerationin kind15 Company advisor = co advisor16 Merger acquisition advisor = mergacqadvisor17 Merger acquisition merchant banker = mergacqmer banker18 Lead manager 1 = leadmanager119 Lead manager 2 = leadmanager220 Registrar name = mergregistrarname21 Source = mergsource22 Conditional offer = conditionaloffer23 Modalities = modalities24 Company merchant banker = co mer banker25 Acquirer code = acquirercode26 Cash consideration = cashconsideration27 Merger acquisition advisor code = mergacqadvisorcode28 Merger acquisition merchant banker code = mergacqmer bankercode29 Company advisor code = co advisorcode30 Company merchant banker code = co mer bankercode31 Sawp ratio numerator = swapratio numerator32 Swap ratio denominator = swapratio denominator33 Price as per SEBI Norms = price per sebi norms34 Price of the Offer = price of offer35 Cash consideration per share = cashconsidper share36 Minimum level of acceptance = min level acceptance37 Percentage of minimum level of acceptance = pct min level acceptance38 Acquirer holding numbers = acquirerholding nos39 Acquirer holding equity = acquirerholding equity
(Continued. . . )
August 2010 Indicators

MERGER ANDACQUISITION 253
Sr.No. Indicator Fields & formula40 Shares proposed to be acquired (nos.) = sharesprop to acq nos41 Percentage share of total equity = sharespct42 Serial number = mgtkasunique
Indicators August 2010
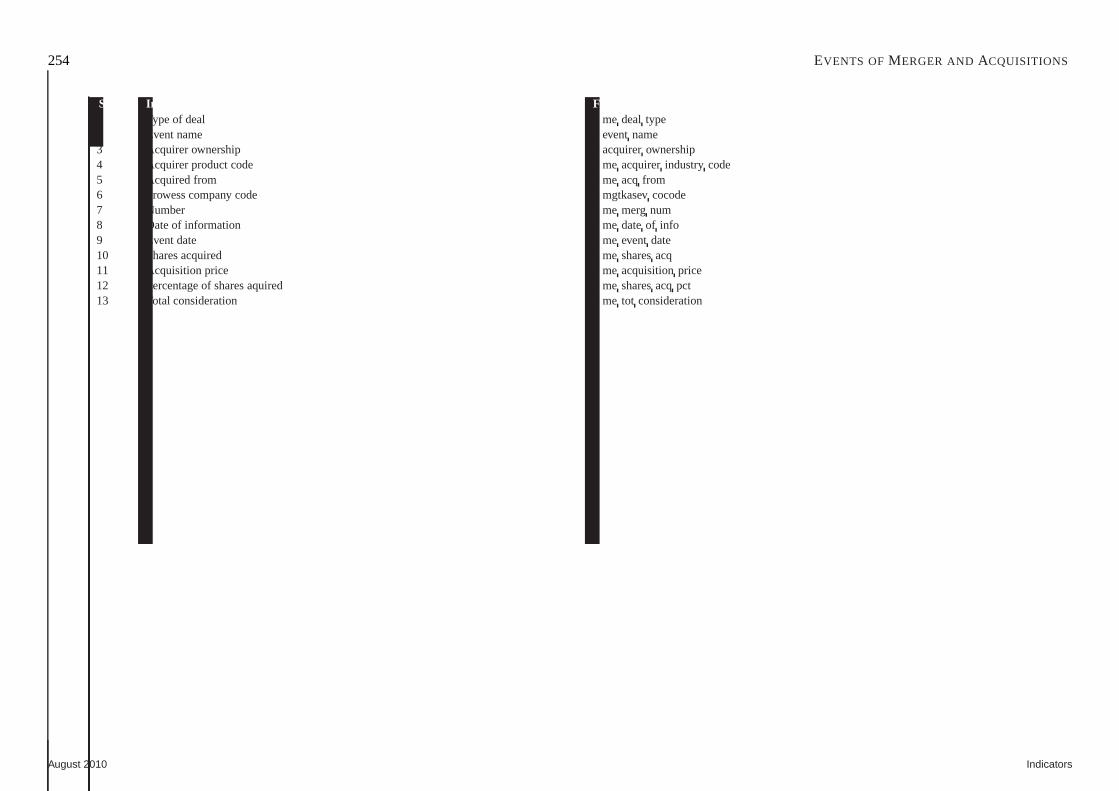
254 EVENTS OF MERGER ANDACQUISITIONS
Sr.No. Indicator Fields & formula1 Type of deal = me deal type2 Event name = eventname3 Acquirer ownership = acquirerownership4 Acquirer product code = me acquirerindustry code5 Acquired from = me acq from6 Prowess company code = mgtkasevcocode7 Number = me mergnum8 Date of information = me dateof info9 Event date = me eventdate10 Shares acquired = me sharesacq11 Acquisition price = me acquisitionprice12 Percentage of shares aquired = me sharesacq pct13 Total consideration = me tot consideration
August 2010 Indicators

255
Chapter 7
Masters information
ContentsMasters information . . . . . . . . . . . . . . . . . . . . . . . . . . . . . . . . .. . . . . . . . . . . . . . . . . . . . . . . . . . . . . . . . . . . . . . . . . . . . . . . 256
CMIE Industry Classification Master . . . . . . . . . . . . . . . . . . . . . . . . . . . . . . . . . . . . . . . . . . . . . . . . . . . . . . . . . . . . . . . . . . . . . . 257
Industry Aliases . . . . . . . . . . . . . . . . . . . . . . . . . . . . . . . . . . . .. . . . . . . . . . . . . . . . . . . . . . . . . . . . . . . . . . . . . . . . . . . . . . 258
CMIE Ownership Classificaiton Master . . . . . . . . . . . . . . . . . . .. . . . . . . . . . . . . . . . . . . . . . . . . . . . . . . . . . . . . . . . . . . . . . . . . . 259
CMIE District Master . . . . . . . . . . . . . . . . . . . . . . . . . . . . . . . . .. . . . . . . . . . . . . . . . . . . . . . . . . . . . . . . . . . . . . . . . . . . . . . 260
CMIE Company Sets Master . . . . . . . . . . . . . . . . . . . . . . . . . . . . . .. . . . . . . . . . . . . . . . . . . . . . . . . . . . . . . . . . . . . . . . . . . . . 261
NIC Master . . . . . . . . . . . . . . . . . . . . . . . . . . . . . . . . . . . . . . . . . .. . . . . . . . . . . . . . . . . . . . . . . . . . . . . . . . . . . . . . . . . . . 262
Indicators August 2010
256
Masters information
In order to present the information content of Prowess in a structured manner, CMIEhas created several standard hierarchial classification masters such as those covering
Products, Districts and Ownership. These unique CMIE masters are used extensively inProwess and also for all data and analytical outputs made available by CMIE.
August 2010 Indicators

CMIE INDUSTRY CLASSIFICATION MASTER 257
Sr.No. Indicator Fields & formula1 Industry/product code = industrycode2 Industry/product name = industrynamemst3 NIC code mapping for product = nic code
Indicators August 2010

258 INDUSTRY ALIASES
Sr.No. Indicator Fields & formula1 Product alias = productalias2 Product code = prdally industry code
August 2010 Indicators
CMIE OWNERSHIPCLASSIFICAITON MASTER 259
Sr.No. Indicator Fields & formula1 CMIE ownership group coding structure = ownergp code2 CMIE’s ownership group names = ownergp name
Indicators August 2010

260 CMIE DISTRICT MASTER
Sr.No. Indicator Fields & formula1 District code = district code2 District name = district name3 State name = statename4 State short name = statenameshort
August 2010 Indicators
CMIE COMPANY SETS MASTER 261
Sr.No. Indicator Fields & formula1 Industry name = industryname2 Industry code = industrygp code3 Set name = industryset4 Market weighted CMIE indices code = mktcapwt index code5 Equal weighted CMIE indices code = equalwt index code6 Unique identifier name = ind mqvname
Indicators August 2010

262 NIC MASTER
Sr.No. Indicator Fields & formula1 Product code by CMIE = nicmastindustry code2 Product code by NIC = nic prod code3 Short name for the product by NIC = nic short name4 Product name by NIC = nic name
August 2010 Indicators

263
Chapter 8
Functions
Indicators August 2010
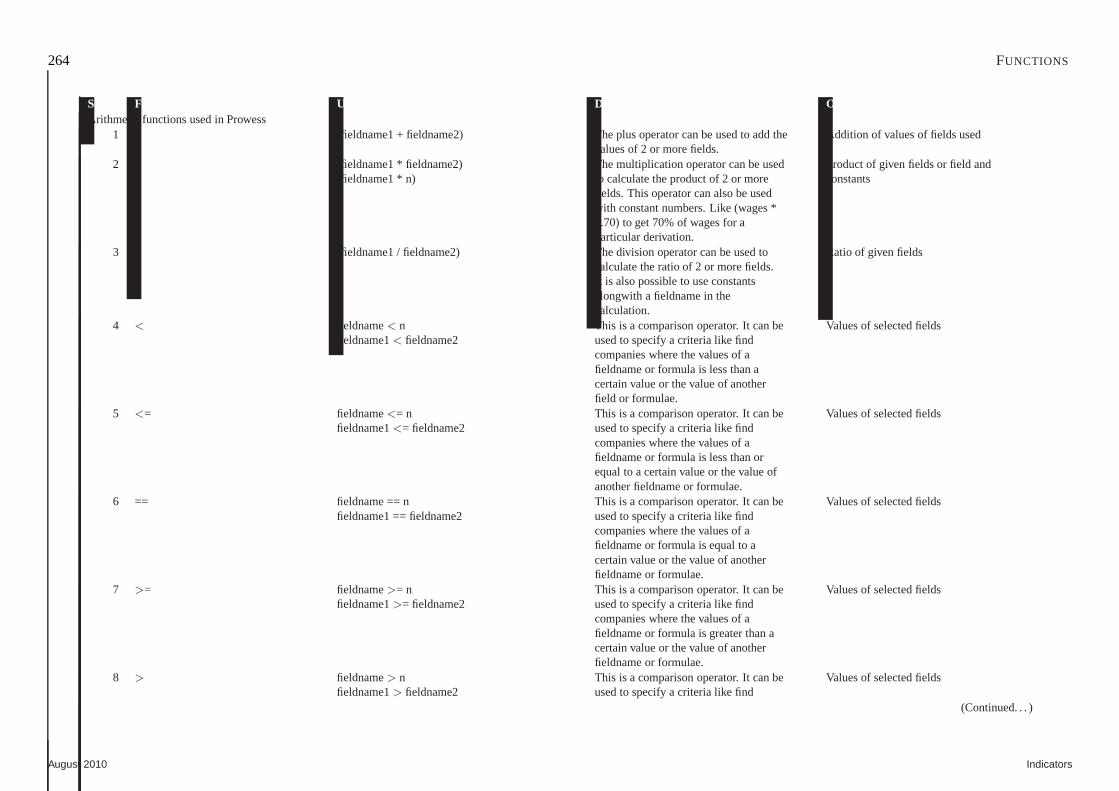
264 FUNCTIONS
Sr.No. Functions Usage Description OutcomeArithmetic functions used in Prowess
1 + (fieldname1 + fieldname2) The plus operator can be used to add the Addition of values of fields usedvalues of 2 or more fields.
2 * (fieldname1 * fieldname2) The multiplication operator can beused Product of given fields or field and(fieldname1 * n) to calculate the product of 2 or more constants
fields. This operator can also be usedwith constant numbers. Like (wages *0.70) to get 70% of wages for aparticular derivation.
3 / (fieldname1 / fieldname2) The division operator can be used to Ratio of given fieldscalculate the ratio of 2 or more fields.It is also possible to use constantsalongwith a fieldname in thecalculation.
4 < fieldname< n This is a comparison operator. It can be Values of selected fieldsfieldname1< fieldname2 used to specify a criteria like find
companies where the values of afieldname or formula is less than acertain value or the value of anotherfield or formulae.
5 <= fieldname<= n This is a comparison operator. It can be Values of selectedfieldsfieldname1<= fieldname2 used to specify a criteria like find
companies where the values of afieldname or formula is less than orequal to a certain value or the value ofanother fieldname or formulae.
6 == fieldname == n This is a comparison operator. It can be Values of selected fieldsfieldname1 == fieldname2 used to specify a criteria like find
companies where the values of afieldname or formula is equal to acertain value or the value of anotherfieldname or formulae.
7 >= fieldname>= n This is a comparison operator. It can be Values of selectedfieldsfieldname1>= fieldname2 used to specify a criteria like find
companies where the values of afieldname or formula is greater than acertain value or the value of anotherfieldname or formulae.
8 > fieldname> n This is a comparison operator. It can be Values of selected fieldsfieldname1> fieldname2 used to specify a criteria like find
(Continued. . . )
August 2010 Indicators
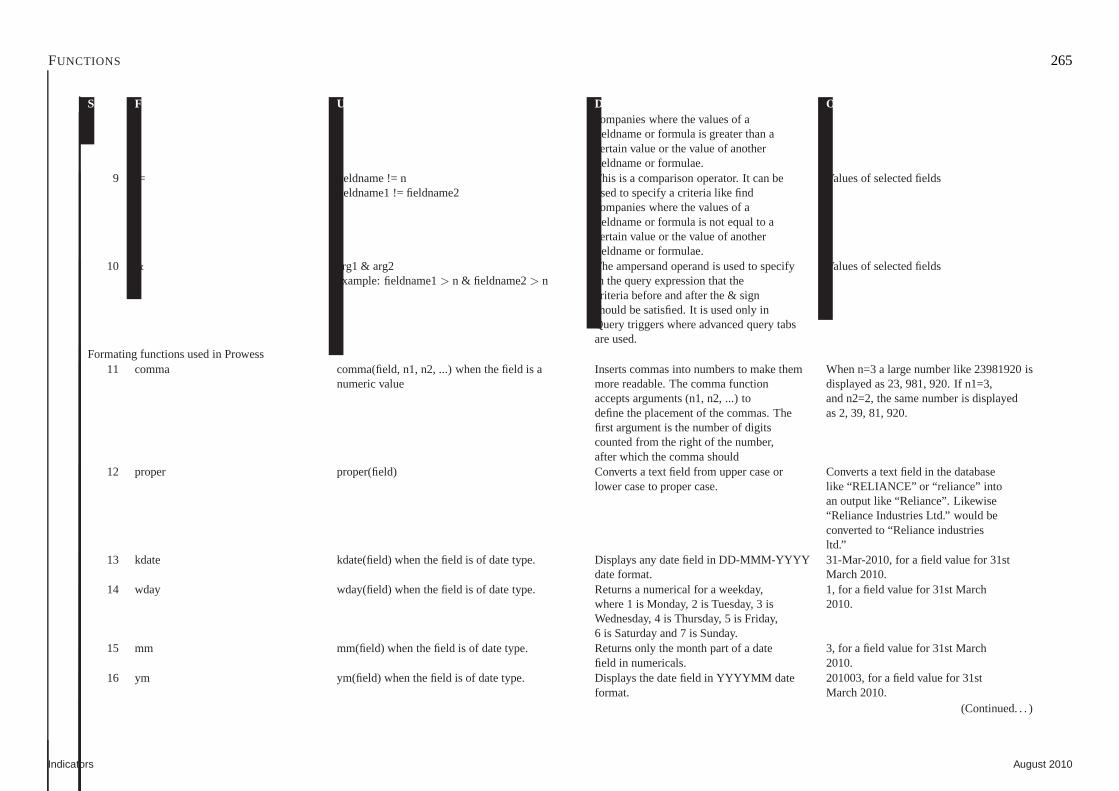
FUNCTIONS 265
Sr.No. Functions Usage Description Outcomecompanies where the values of afieldname or formula is greater than acertain value or the value of anotherfieldname or formulae.
9 != fieldname != n This is a comparison operator. It can be Values of selected fieldsfieldname1 != fieldname2 used to specify a criteria like find
companies where the values of afieldname or formula is not equal to acertain value or the value of anotherfieldname or formulae.
10 & arg1 & arg2 The ampersand operand is used to specify Values of selected fieldsexample: fieldname1> n & fieldname2> n in the query expression that the
criteria before and after the & signshould be satisfied. It is used only inQuery triggers where advanced query tabsare used.
Formating functions used in Prowess11 comma comma(field, n1, n2, ...) when the field is a Inserts commas into numbers to make them When n=3 a large number like 23981920 is
numeric value more readable. The comma function displayed as 23, 981, 920. If n1=3,accepts arguments (n1, n2, ...) to and n2=2, the same number is displayeddefine the placement of the commas. The as 2, 39, 81, 920.first argument is the number of digitscounted from the right of the number,after which the comma should
12 proper proper(field) Converts a text field from upper case or Converts a text field inthe databaselower case to proper case. like “RELIANCE” or “reliance” into
an output like “Reliance”. Likewise“Reliance Industries Ltd.” would beconverted to “Reliance industriesltd.”
13 kdate kdate(field) when the field is of date type. Displays any date field in DD-MMM-YYYY 31-Mar-2010, for a field value for31stdate format. March 2010.
14 wday wday(field) when the field is of date type. Returns a numerical for a weekday, 1, for a field value for 31st Marchwhere 1 is Monday, 2 is Tuesday, 3 is 2010.Wednesday, 4 is Thursday, 5 is Friday,6 is Saturday and 7 is Sunday.
15 mm mm(field) when the field is of date type. Returns only the month part of a date 3, for a field value for 31st Marchfield in numericals. 2010.
16 ym ym(field) when the field is of date type. Displays the datefield in YYYYMM date 201003, for a field value for 31stformat. March 2010.
(Continued. . . )
Indicators August 2010
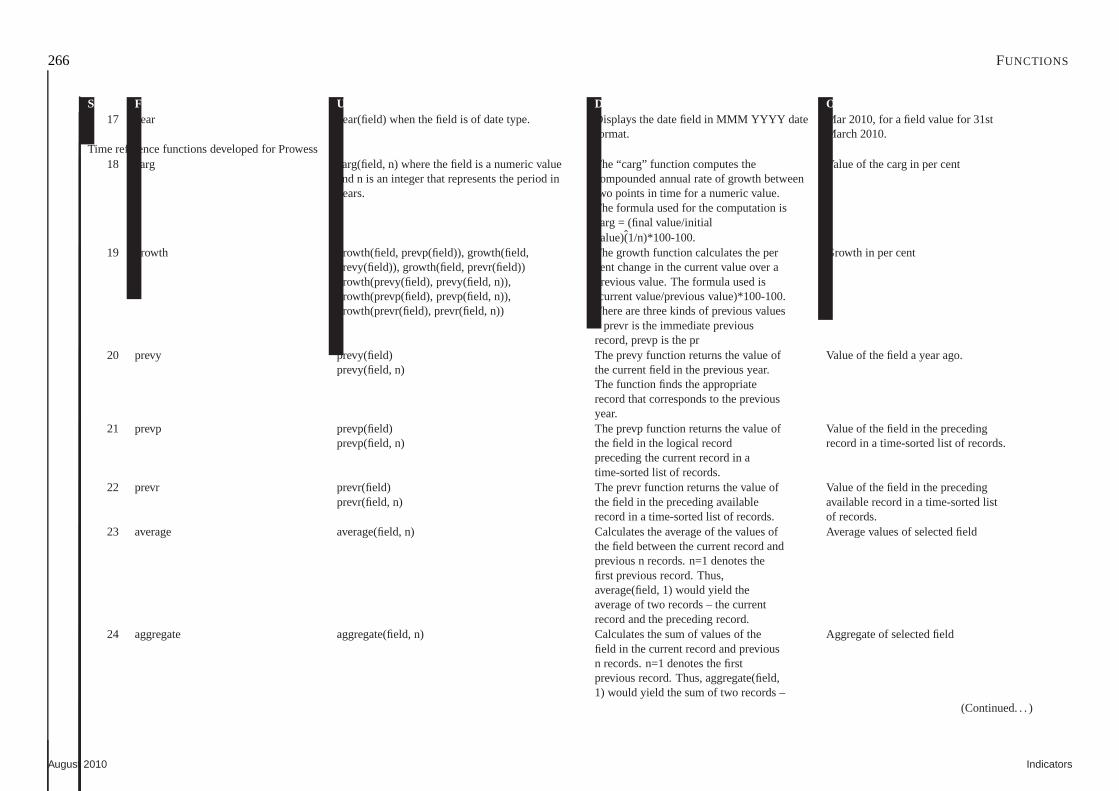
266 FUNCTIONS
Sr.No. Functions Usage Description Outcome17 year year(field) when the field is of date type. Displays thedate field in MMM YYYY date Mar 2010, for a field value for 31st
format. March 2010.Time reference functions developed for Prowess
18 carg carg(field, n) where the field is a numeric value The “carg” function computes the Value of the carg in per centand n is an integer that represents the period in compounded annual rate of growth betweenyears. two points in time for a numeric value.
The formula used for the computation iscarg = (final value/initialvalue)̂(1/n)*100-100.
19 growth growth(field, prevp(field)), growth(field, The growth function calculates the per Growth in per centprevy(field)), growth(field, prevr(field)) cent change in the current value over agrowth(prevy(field), prevy(field, n)), previous value. Theformula used isgrowth(prevp(field), prevp(field, n)), (current value/previous value)*100-100.growth(prevr(field), prevr(field, n)) There are three kindsof previous values
– prevr is the immediate previousrecord, prevp is the pr
20 prevy prevy(field) The prevy function returns the value of Value of the field a year ago.prevy(field, n) the current field in the previous year.
The function finds the appropriaterecord that corresponds to the previousyear.
21 prevp prevp(field) The prevp function returns the value of Value of the field in the precedingprevp(field, n) the field in the logical record record in a time-sorted list of records.
preceding the current record in atime-sorted list of records.
22 prevr prevr(field) The prevr function returns the value of Value of the field in the precedingprevr(field, n) the field in the preceding available available record in a time-sorted list
record in a time-sorted list of records. of records.23 average average(field, n) Calculates the average of the values of Average values of selected field
the field between the current record andprevious n records. n=1 denotes thefirst previous record. Thus,average(field, 1) would yield theaverage of two records – the currentrecord and the preceding record.
24 aggregate aggregate(field, n) Calculates the sum of values of the Aggregate of selected fieldfield in the current record and previousn records. n=1 denotes the firstprevious record. Thus, aggregate(field,1) would yield the sum of two records –
(Continued. . . )
August 2010 Indicators
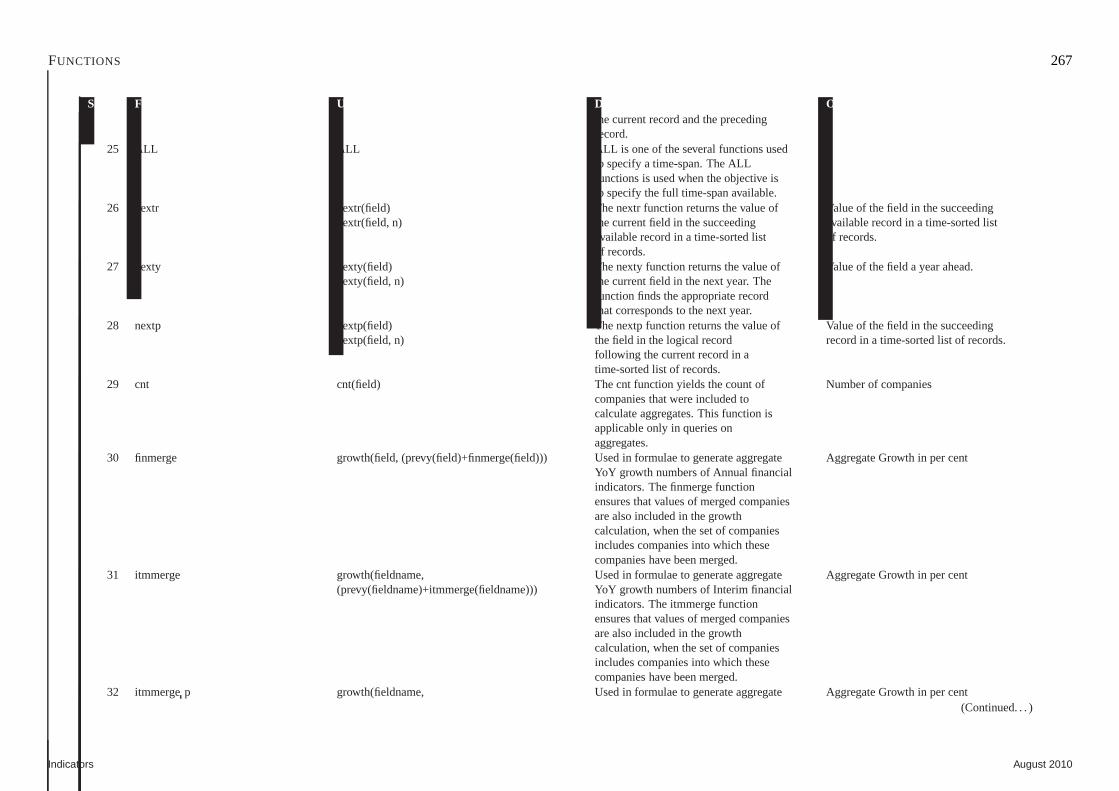
FUNCTIONS 267
Sr.No. Functions Usage Description Outcomethe current record and the precedingrecord.
25 ALL ALL ALL is one of the several functions usedto specify a time-span. The ALLfunctions is used when the objective isto specify the full time-span available.
26 nextr nextr(field) The nextr function returns the value of Value of the field in the succeedingnextr(field, n) the current field in the succeeding availablerecord in a time-sorted list
available record in a time-sorted list of records.of records.
27 nexty nexty(field) The nexty function returns the value of Value of the field a year ahead.nexty(field, n) the current field in the next year. The
function finds the appropriate recordthat corresponds to the next year.
28 nextp nextp(field) The nextp function returns the value of Value of the field in the succeedingnextp(field, n) the field in the logical record record in a time-sorted list of records.
following the current record in atime-sorted list of records.
29 cnt cnt(field) The cnt function yields the count of Number of companiescompanies that were included tocalculate aggregates. This function isapplicable only in queries onaggregates.
30 finmerge growth(field, (prevy(field)+finmerge(field))) Used in formulae to generate aggregate Aggregate Growth in percentYoY growth numbers of Annual financialindicators. The finmerge functionensures that values of merged companiesare also included in the growthcalculation, when the set of companiesincludes companies into which thesecompanies have been merged.
31 itmmerge growth(fieldname, Used in formulae to generate aggregate Aggregate Growth in per cent(prevy(fieldname)+itmmerge(fieldname))) YoY growth numbers of Interim financial
indicators. The itmmerge functionensures that values of merged companiesare also included in the growthcalculation, when the set of companiesincludes companies into which thesecompanies have been merged.
32 itmmergep growth(fieldname, Used in formulae to generate aggregate Aggregate Growth in per cent(Continued. . . )
Indicators August 2010
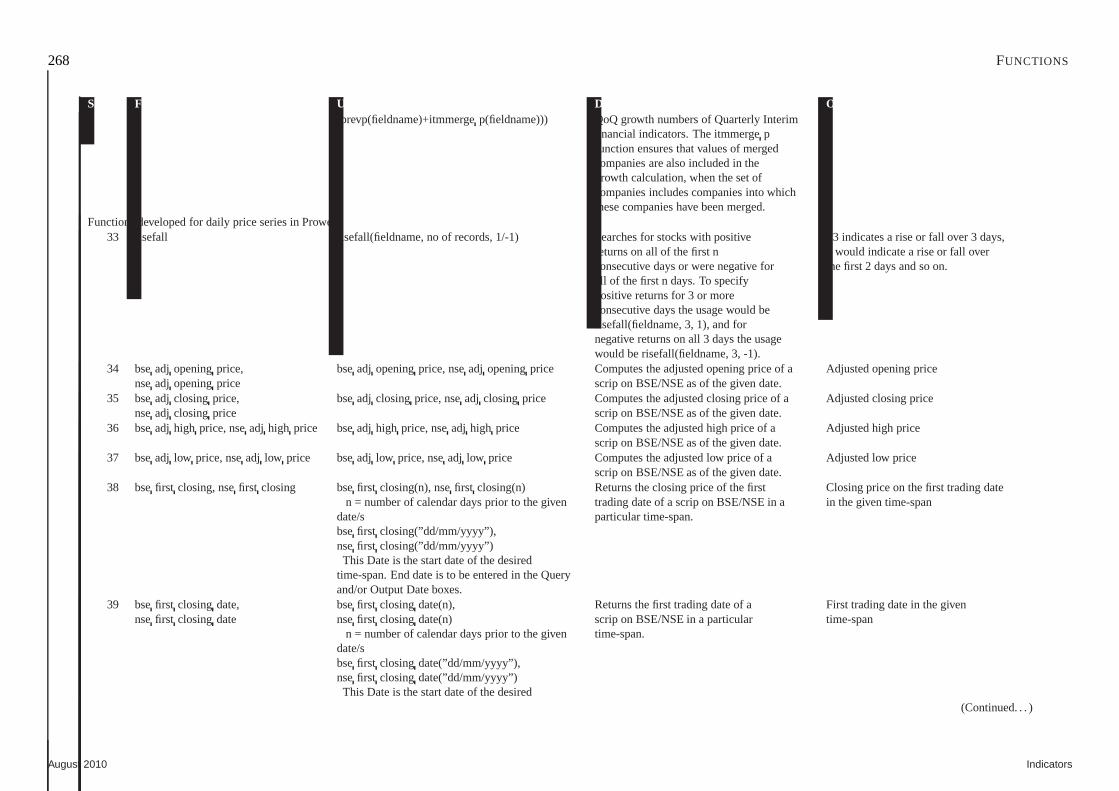
268 FUNCTIONS
Sr.No. Functions Usage Description Outcome(prevp(fieldname)+itmmergep(fieldname))) QoQ growth numbers of Quarterly Interim
financial indicators. The itmmergepfunction ensures that values of mergedcompanies are also included in thegrowth calculation, when the set ofcompanies includes companies into whichthese companies have been merged.
Functions developed for daily price series in Prowess33 risefall risefall(fieldname, no of records, 1/-1) Searches for stocks with positive +3 indicates a rise or fall over 3 days,
returns on all of the first n 2 would indicate a rise or fall overconsecutive days or were negative for the first 2 days and so on.all of the first n days. To specifypositive returns for 3 or moreconsecutive days the usage would berisefall(fieldname, 3, 1), and fornegative returns on all 3 days the usagewould be risefall(fieldname, 3, -1).
34 bseadj openingprice, bseadj openingprice, nseadj openingprice Computes the adjusted opening price of a Adjusted opening pricenseadj openingprice scrip on BSE/NSE as of the given date.
35 bseadj closing price, bseadj closingprice, nseadj closing price Computes the adjusted closing price of a Adjusted closing pricenseadj closing price scrip on BSE/NSE as of the given date.
36 bseadj high price, nseadj high price bseadj high price, nseadj high price Computes the adjusted high price of a Adjusted high pricescrip on BSE/NSE as of the given date.
37 bseadj low price, nseadj low price bseadj low price, nseadj low price Computes the adjusted low price of a Adjusted low pricescrip on BSE/NSE as of the given date.
38 bsefirst closing, nsefirst closing bsefirst closing(n), nsefirst closing(n) Returns the closing price of the first Closing price on the first trading daten = number of calendar days prior to the given trading date of ascrip on BSE/NSE in a in the given time-span
date/s particular time-span.bsefirst closing(”dd/mm/yyyy”),nsefirst closing(”dd/mm/yyyy”)This Date is the start date of the desired
time-span. End date is to be entered in the Queryand/or Output Date boxes.
39 bsefirst closing date, bsefirst closingdate(n), Returns the first trading date of a First trading date in the givennsefirst closing date nsefirst closingdate(n) scrip on BSE/NSE in a particular time-span
n = number of calendar days prior to the given time-span.date/sbsefirst closingdate(”dd/mm/yyyy”),nsefirst closingdate(”dd/mm/yyyy”)This Date is the start date of the desired
(Continued. . . )
August 2010 Indicators
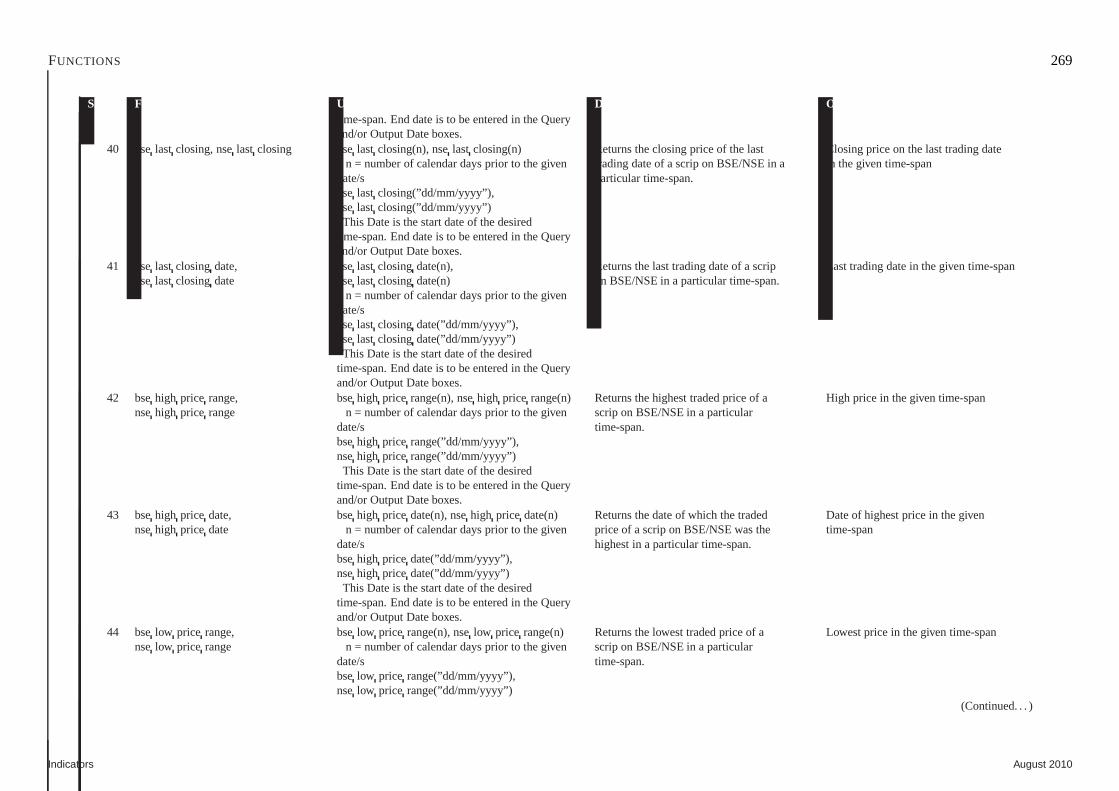
FUNCTIONS 269
Sr.No. Functions Usage Description Outcometime-span. End date is to be entered in the Queryand/or Output Date boxes.
40 bselast closing, nselast closing bselast closing(n), nselast closing(n) Returns the closing price of the last Closing price on the last trading daten = number of calendar days prior to the given trading date of ascrip on BSE/NSE in a in the given time-span
date/s particular time-span.bselast closing(”dd/mm/yyyy”),nselast closing(”dd/mm/yyyy”)This Date is the start date of the desired
time-span. End date is to be entered in the Queryand/or Output Date boxes.
41 bselast closing date, bselast closing date(n), Returns the last trading date of a scrip Last trading date in the given time-spannselast closing date nselast closing date(n) on BSE/NSE in a particular time-span.
n = number of calendar days prior to the givendate/sbselast closing date(”dd/mm/yyyy”),nselast closing date(”dd/mm/yyyy”)This Date is the start date of the desired
time-span. End date is to be entered in the Queryand/or Output Date boxes.
42 bsehigh price range, bsehigh price range(n), nsehigh price range(n) Returns the highest traded price of a High price in the given time-spannsehigh price range n = number of calendar days prior to the given scrip on BSE/NSE in a particular
date/s time-span.bsehigh price range(”dd/mm/yyyy”),nsehigh price range(”dd/mm/yyyy”)This Date is the start date of the desired
time-span. End date is to be entered in the Queryand/or Output Date boxes.
43 bsehigh price date, bsehigh price date(n), nsehigh price date(n) Returns the date of which the traded Date of highest price in the givennsehigh price date n = number of calendar days prior to the given price of a scrip on BSE/NSE was the time-span
date/s highest in a particular time-span.bsehigh price date(”dd/mm/yyyy”),nsehigh price date(”dd/mm/yyyy”)This Date is the start date of the desired
time-span. End date is to be entered in the Queryand/or Output Date boxes.
44 bselow price range, bselow price range(n), nselow price range(n) Returns the lowest traded price of a Lowest price inthe given time-spannselow price range n = number of calendar days prior to the given scrip on BSE/NSE in a particular
date/s time-span.bselow price range(”dd/mm/yyyy”),nselow price range(”dd/mm/yyyy”)
(Continued. . . )
Indicators August 2010
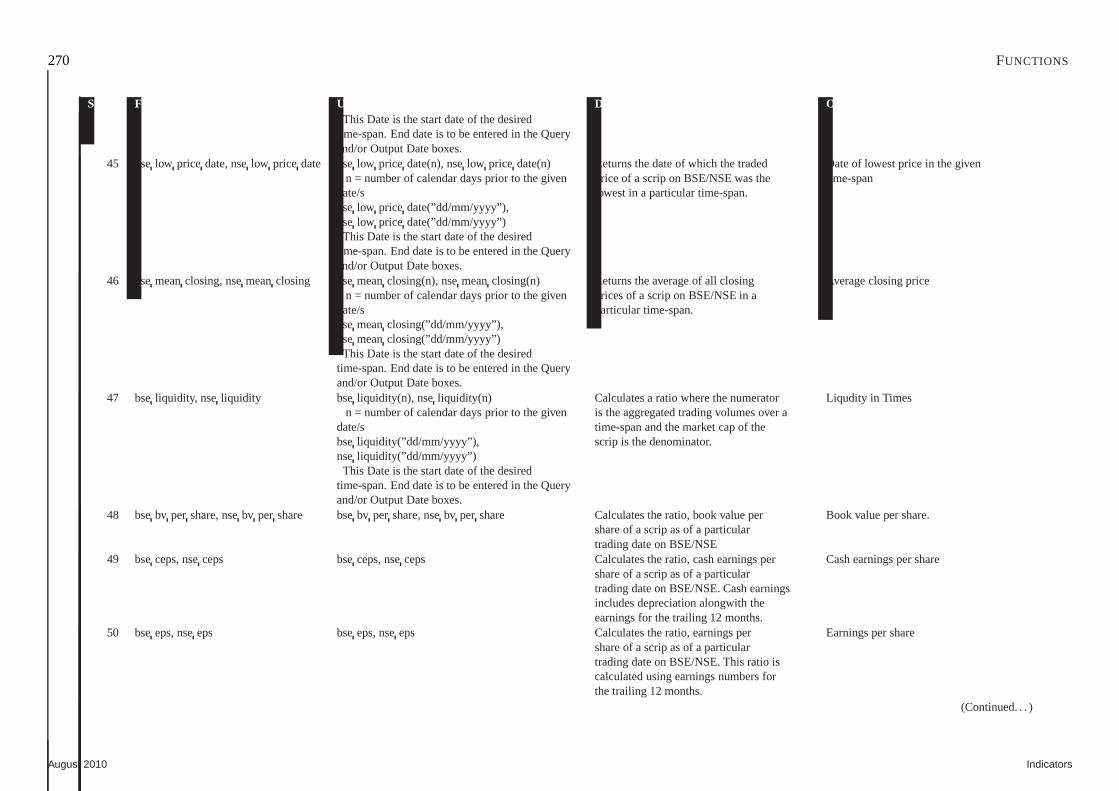
270 FUNCTIONS
Sr.No. Functions Usage Description OutcomeThis Date is the start date of the desired
time-span. End date is to be entered in the Queryand/or Output Date boxes.
45 bselow price date, nselow price date bselow price date(n), nselow price date(n) Returns the date of which the traded Date of lowest price in the givenn = number of calendar days prior to the given price of a scrip on BSE/NSE was the time-span
date/s lowest in a particular time-span.bselow price date(”dd/mm/yyyy”),nselow price date(”dd/mm/yyyy”)This Date is the start date of the desired
time-span. End date is to be entered in the Queryand/or Output Date boxes.
46 bsemeanclosing, nsemeanclosing bsemeanclosing(n), nsemeanclosing(n) Returns the average of all closing Average closing pricen = number of calendar days prior to the given prices of a scripon BSE/NSE in a
date/s particular time-span.bsemeanclosing(”dd/mm/yyyy”),nsemeanclosing(”dd/mm/yyyy”)This Date is the start date of the desired
time-span. End date is to be entered in the Queryand/or Output Date boxes.
47 bseliquidity, nse liquidity bse liquidity(n), nseliquidity(n) Calculates a ratio where the numerator Liqudity in Timesn = number of calendar days prior to the given is the aggregated trading volumes over a
date/s time-span and the market cap of thebseliquidity(”dd/mm/yyyy”), scrip is the denominator.nseliquidity(”dd/mm/yyyy”)This Date is the start date of the desired
time-span. End date is to be entered in the Queryand/or Output Date boxes.
48 bsebv per share, nsebv per share bsebv per share, nsebv per share Calculates the ratio, book value per Book value per share.share of a scrip as of a particulartrading date on BSE/NSE
49 bseceps, nseceps bseceps, nseceps Calculates the ratio, cash earnings per Cash earnings per shareshare of a scrip as of a particulartrading date on BSE/NSE. Cash earningsincludes depreciation alongwith theearnings for the trailing 12 months.
50 bseeps, nseeps bseeps, nseeps Calculates the ratio, earnings per Earnings per shareshare of a scrip as of a particulartrading date on BSE/NSE. This ratio iscalculated using earnings numbers forthe trailing 12 months.
(Continued. . . )
August 2010 Indicators
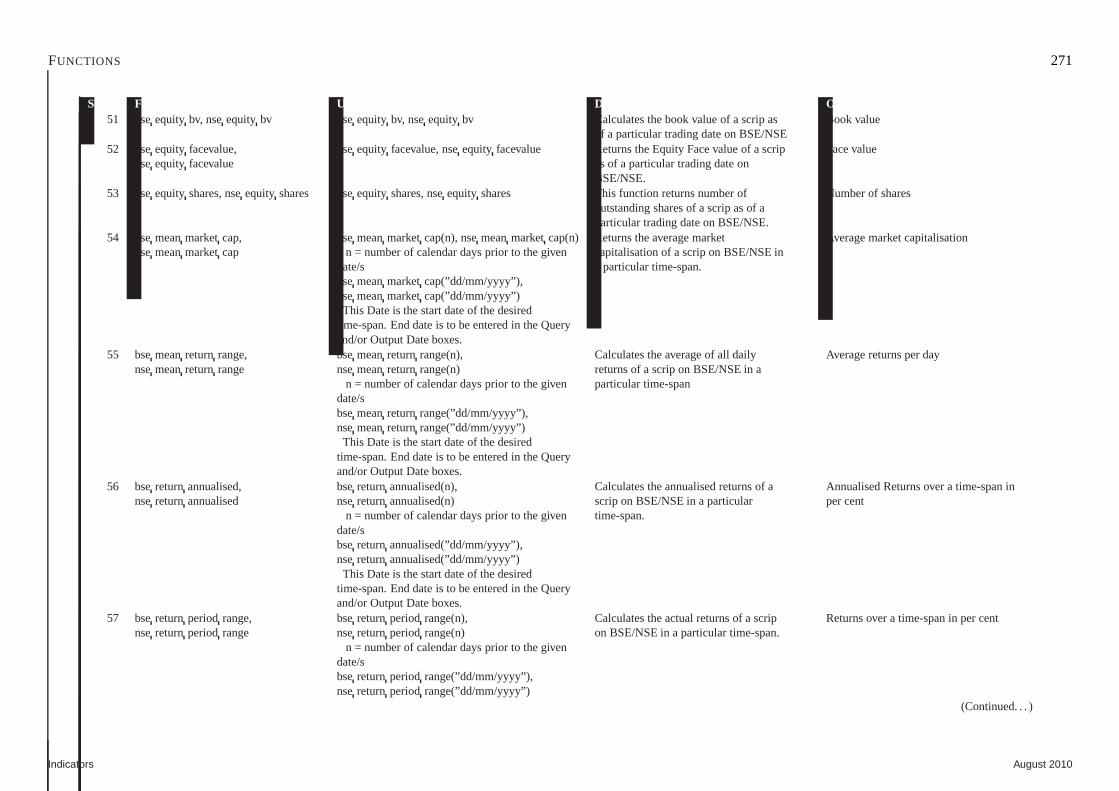
FUNCTIONS 271
Sr.No. Functions Usage Description Outcome51 bseequity bv, nseequity bv bseequity bv, nseequity bv Calculates the book value of a scrip as Book value
of a particular trading date on BSE/NSE52 bseequity facevalue, bseequity facevalue, nseequity facevalue Returns the Equity Face value of a scrip Face value
nseequity facevalue as of a particular trading date onBSE/NSE.
53 bseequity shares, nseequity shares bseequity shares, nseequity shares This function returns number of Number of sharesoutstanding shares of a scrip as of aparticular trading date on BSE/NSE.
54 bsemeanmarketcap, bsemeanmarketcap(n), nsemeanmarketcap(n) Returns the average market Average market capitalisationnsemeanmarketcap n = number of calendar days prior to the given capitalisation of a scrip on BSE/NSE in
date/s a particular time-span.bsemeanmarketcap(”dd/mm/yyyy”),nsemeanmarketcap(”dd/mm/yyyy”)This Date is the start date of the desired
time-span. End date is to be entered in the Queryand/or Output Date boxes.
55 bsemeanreturn range, bsemeanreturn range(n), Calculates the average of all daily Average returns per daynsemeanreturn range nsemeanreturn range(n) returns of a scrip on BSE/NSE in a
n = number of calendar days prior to the given particular time-spandate/sbsemeanreturn range(”dd/mm/yyyy”),nsemeanreturn range(”dd/mm/yyyy”)This Date is the start date of the desired
time-span. End date is to be entered in the Queryand/or Output Date boxes.
56 bsereturnannualised, bsereturn annualised(n), Calculates the annualised returns of a Annualised Returns over a time-span innsereturnannualised nsereturn annualised(n) scrip on BSE/NSE in a particular per cent
n = number of calendar days prior to the given time-span.date/sbsereturn annualised(”dd/mm/yyyy”),nsereturn annualised(”dd/mm/yyyy”)This Date is the start date of the desired
time-span. End date is to be entered in the Queryand/or Output Date boxes.
57 bsereturnperiod range, bsereturn period range(n), Calculates the actual returns of a scrip Returns over a time-span in per centnsereturnperiod range nsereturn period range(n) on BSE/NSE in a particular time-span.
n = number of calendar days prior to the givendate/sbsereturn period range(”dd/mm/yyyy”),nsereturn period range(”dd/mm/yyyy”)
(Continued. . . )
Indicators August 2010
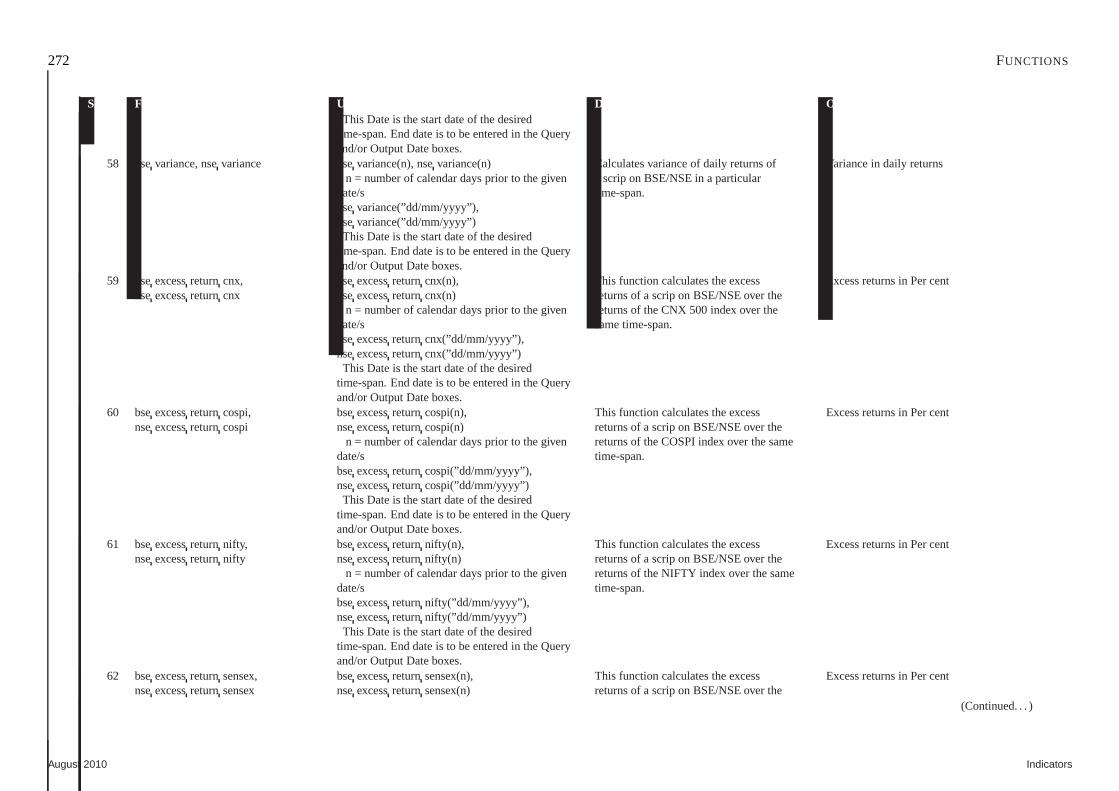
272 FUNCTIONS
Sr.No. Functions Usage Description OutcomeThis Date is the start date of the desired
time-span. End date is to be entered in the Queryand/or Output Date boxes.
58 bsevariance, nsevariance bsevariance(n), nsevariance(n) Calculates variance of daily returns of Variance in daily returnsn = number of calendar days prior to the given a scrip on BSE/NSE in a particular
date/s time-span.bsevariance(”dd/mm/yyyy”),nsevariance(”dd/mm/yyyy”)This Date is the start date of the desired
time-span. End date is to be entered in the Queryand/or Output Date boxes.
59 bseexcessreturn cnx, bseexcessreturncnx(n), This function calculates the excess Excess returnsin Per centnseexcessreturn cnx nseexcessreturncnx(n) returns of a scrip on BSE/NSE over the
n = number of calendar days prior to the given returns of the CNX 500 index over thedate/s same time-span.bseexcessreturncnx(”dd/mm/yyyy”),nseexcessreturncnx(”dd/mm/yyyy”)This Date is the start date of the desired
time-span. End date is to be entered in the Queryand/or Output Date boxes.
60 bseexcessreturn cospi, bseexcessreturncospi(n), This function calculates the excess Excess returns in Per centnseexcessreturn cospi nseexcessreturncospi(n) returns of a scrip on BSE/NSE over the
n = number of calendar days prior to the given returns of the COSPI index over the samedate/s time-span.bseexcessreturncospi(”dd/mm/yyyy”),nseexcessreturncospi(”dd/mm/yyyy”)This Date is the start date of the desired
time-span. End date is to be entered in the Queryand/or Output Date boxes.
61 bseexcessreturn nifty, bseexcessreturnnifty(n), This function calculates the excess Excess returns in Per centnseexcessreturn nifty nseexcessreturnnifty(n) returns of a scrip on BSE/NSE over the
n = number of calendar days prior to the given returns of the NIFTY index over the samedate/s time-span.bseexcessreturnnifty(”dd/mm/yyyy”),nseexcessreturnnifty(”dd/mm/yyyy”)This Date is the start date of the desired
time-span. End date is to be entered in the Queryand/or Output Date boxes.
62 bseexcessreturn sensex, bseexcessreturnsensex(n), This function calculates the excess Excess returns in Per centnseexcessreturn sensex nseexcessreturnsensex(n) returns of a scrip on BSE/NSE over the
(Continued. . . )
August 2010 Indicators
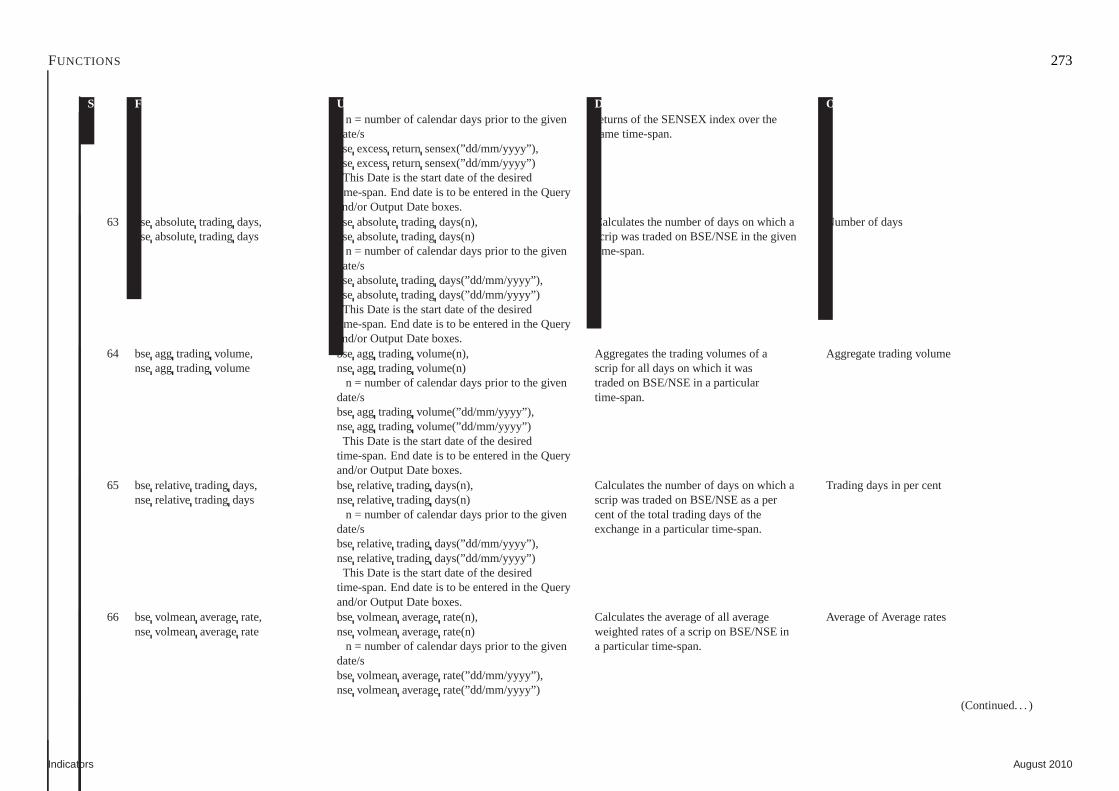
FUNCTIONS 273
Sr.No. Functions Usage Description Outcomen = number of calendar days prior to the given returns of the SENSEX index over the
date/s same time-span.bseexcessreturnsensex(”dd/mm/yyyy”),nseexcessreturnsensex(”dd/mm/yyyy”)This Date is the start date of the desired
time-span. End date is to be entered in the Queryand/or Output Date boxes.
63 bseabsolutetradingdays, bseabsolutetrading days(n), Calculates the number of days on which a Number of daysnseabsolutetradingdays nseabsolutetrading days(n) scrip was traded on BSE/NSE in the given
n = number of calendar days prior to the given time-span.date/sbseabsolutetrading days(”dd/mm/yyyy”),nseabsolutetrading days(”dd/mm/yyyy”)This Date is the start date of the desired
time-span. End date is to be entered in the Queryand/or Output Date boxes.
64 bseagg trading volume, bseagg trading volume(n), Aggregates the trading volumes of a Aggregate trading volumenseagg trading volume nseagg trading volume(n) scrip for all days on which it was
n = number of calendar days prior to the given traded on BSE/NSE in a particulardate/s time-span.bseagg trading volume(”dd/mm/yyyy”),nseagg trading volume(”dd/mm/yyyy”)This Date is the start date of the desired
time-span. End date is to be entered in the Queryand/or Output Date boxes.
65 bserelative tradingdays, bserelative trading days(n), Calculates the number of days on which a Trading days in per centnserelative tradingdays nserelative trading days(n) scrip was traded on BSE/NSE as a per
n = number of calendar days prior to the given cent of the totaltrading days of thedate/s exchange in a particular time-span.bserelative trading days(”dd/mm/yyyy”),nserelative trading days(”dd/mm/yyyy”)This Date is the start date of the desired
time-span. End date is to be entered in the Queryand/or Output Date boxes.
66 bsevolmeanaveragerate, bsevolmeanaveragerate(n), Calculates the average of all average Average of Average ratesnsevolmeanaveragerate nsevolmeanaveragerate(n) weighted rates of a scrip on BSE/NSE in
n = number of calendar days prior to the given a particular time-span.date/sbsevolmeanaveragerate(”dd/mm/yyyy”),nsevolmeanaveragerate(”dd/mm/yyyy”)
(Continued. . . )
Indicators August 2010
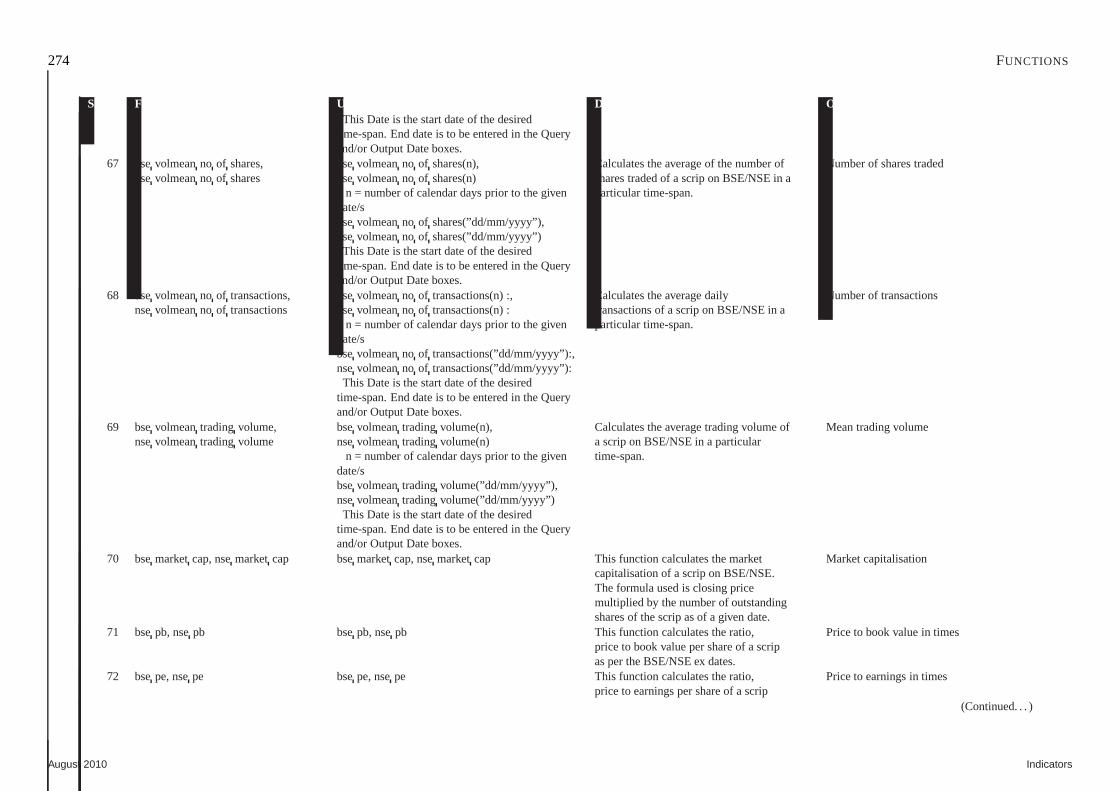
274 FUNCTIONS
Sr.No. Functions Usage Description OutcomeThis Date is the start date of the desired
time-span. End date is to be entered in the Queryand/or Output Date boxes.
67 bsevolmeanno of shares, bsevolmeanno of shares(n), Calculates the average of the number of Number ofshares tradednsevolmeanno of shares nsevolmeanno of shares(n) shares traded of a scrip on BSE/NSE in a
n = number of calendar days prior to the given particular time-span.date/sbsevolmeanno of shares(”dd/mm/yyyy”),nsevolmeanno of shares(”dd/mm/yyyy”)This Date is the start date of the desired
time-span. End date is to be entered in the Queryand/or Output Date boxes.
68 bsevolmeanno of transactions, bsevolmeanno of transactions(n) :, Calculates the average daily Number of transactionsnsevolmeanno of transactions nsevolmeanno of transactions(n) : transactions of a scrip on BSE/NSE in a
n = number of calendar days prior to the given particular time-span.date/sbsevolmeanno of transactions(”dd/mm/yyyy”):,nsevolmeanno of transactions(”dd/mm/yyyy”):This Date is the start date of the desired
time-span. End date is to be entered in the Queryand/or Output Date boxes.
69 bsevolmeantrading volume, bsevolmeantrading volume(n), Calculates the average trading volume of Mean trading volumensevolmeantrading volume nsevolmeantrading volume(n) a scrip on BSE/NSE in a particular
n = number of calendar days prior to the given time-span.date/sbsevolmeantrading volume(”dd/mm/yyyy”),nsevolmeantrading volume(”dd/mm/yyyy”)This Date is the start date of the desired
time-span. End date is to be entered in the Queryand/or Output Date boxes.
70 bsemarketcap, nsemarketcap bsemarketcap, nsemarketcap This function calculates the market Market capitalisationcapitalisation of a scrip on BSE/NSE.The formula used is closing pricemultiplied by the number of outstandingshares of the scrip as of a given date.
71 bsepb, nsepb bsepb, nsepb This function calculates the ratio, Price to book value intimesprice to book value per share of a scripas per the BSE/NSE ex dates.
72 bsepe, nsepe bsepe, nsepe This function calculates the ratio, Price to earnings in timesprice to earnings per share of a scrip
(Continued. . . )
August 2010 Indicators
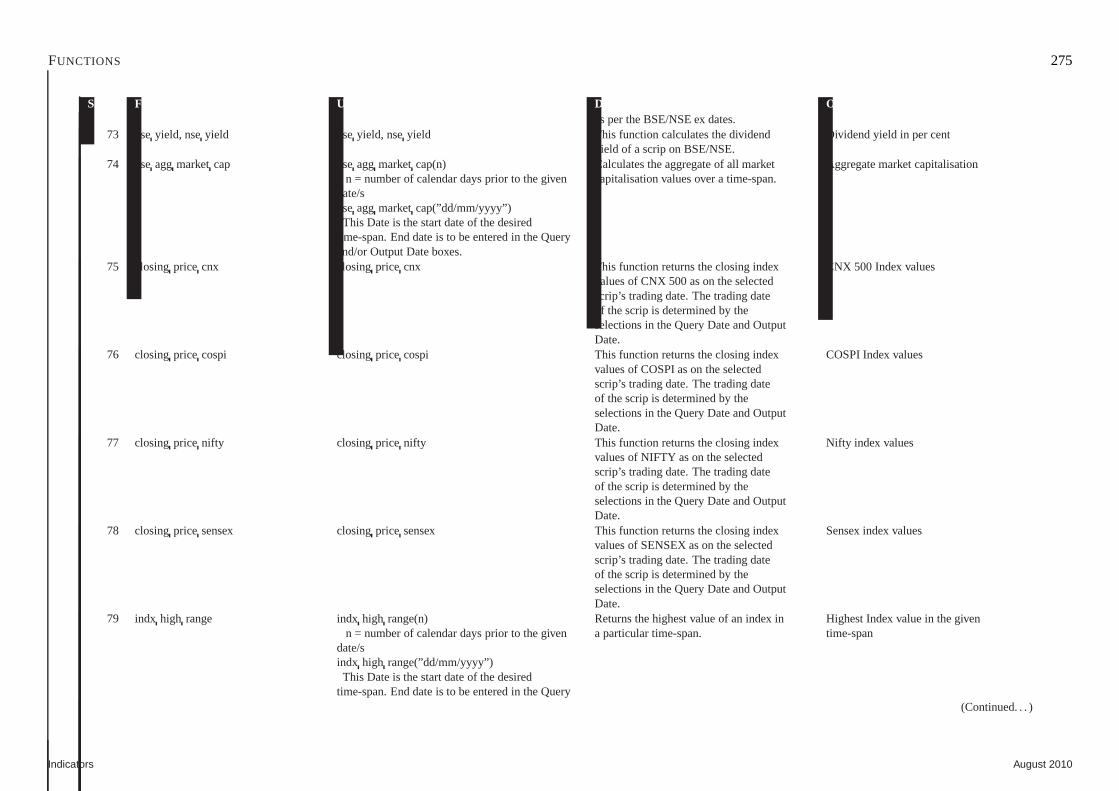
FUNCTIONS 275
Sr.No. Functions Usage Description Outcomeas per the BSE/NSE ex dates.
73 bseyield, nseyield bseyield, nseyield This function calculates the dividend Dividend yieldin per centyield of a scrip on BSE/NSE.
74 bseaggmarketcap bseagg marketcap(n) Calculates the aggregate of all market Aggregate market capitalisationn = number of calendar days prior to the given capitalisationvalues over a time-span.
date/sbseagg marketcap(”dd/mm/yyyy”)This Date is the start date of the desired
time-span. End date is to be entered in the Queryand/or Output Date boxes.
75 closingprice cnx closingprice cnx This function returns the closing index CNX 500 Index valuesvalues of CNX 500 as on the selectedscrip’s trading date. The trading dateof the scrip is determined by theselections in the Query Date and OutputDate.
76 closingprice cospi closingprice cospi This function returns the closing index COSPI Index valuesvalues of COSPI as on the selectedscrip’s trading date. The trading dateof the scrip is determined by theselections in the Query Date and OutputDate.
77 closingprice nifty closing price nifty This function returns the closing index Nifty index valuesvalues of NIFTY as on the selectedscrip’s trading date. The trading dateof the scrip is determined by theselections in the Query Date and OutputDate.
78 closingprice sensex closingprice sensex This function returns the closing index Sensex indexvaluesvalues of SENSEX as on the selectedscrip’s trading date. The trading dateof the scrip is determined by theselections in the Query Date and OutputDate.
79 indx high range indxhigh range(n) Returns the highest value of an index in Highest Index value in the givenn = number of calendar days prior to the given a particular time-span. time-span
date/sindx high range(”dd/mm/yyyy”)This Date is the start date of the desired
time-span. End date is to be entered in the Query(Continued. . . )
Indicators August 2010
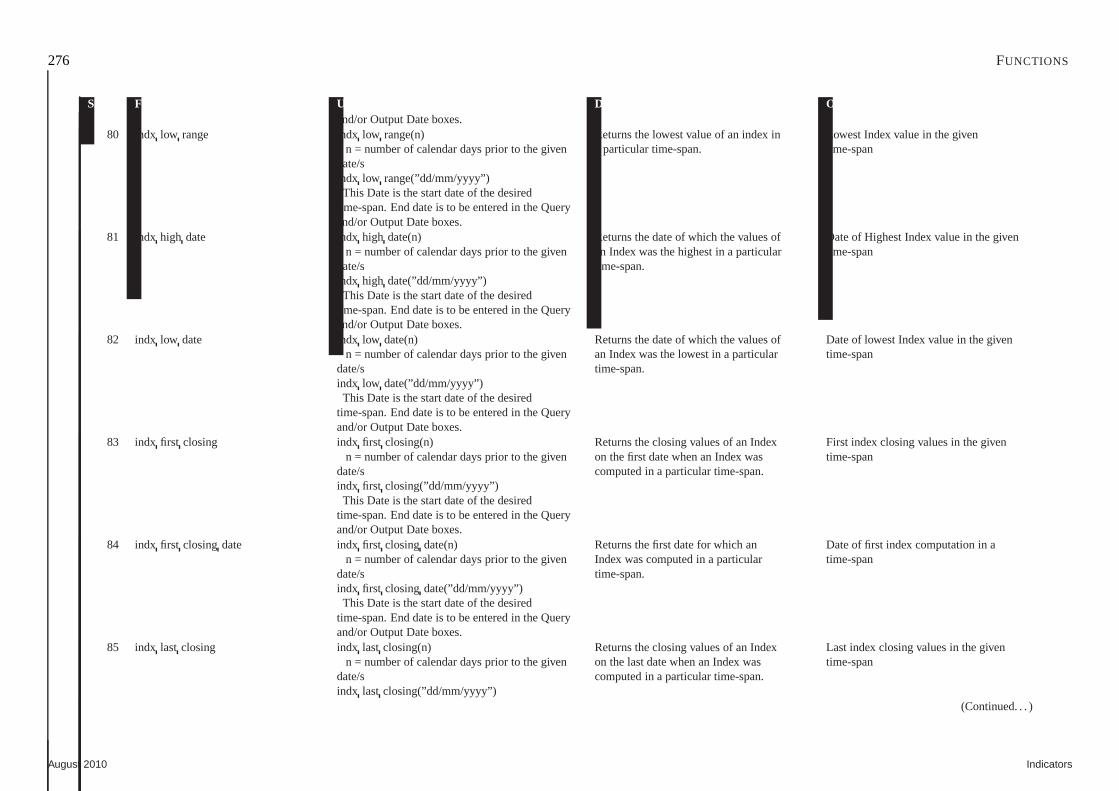
276 FUNCTIONS
Sr.No. Functions Usage Description Outcomeand/or Output Date boxes.
80 indx low range indxlow range(n) Returns the lowest value of an index in Lowest Indexvalue in the givenn = number of calendar days prior to the given a particular time-span. time-span
date/sindx low range(”dd/mm/yyyy”)This Date is the start date of the desired
time-span. End date is to be entered in the Queryand/or Output Date boxes.
81 indx high date indxhigh date(n) Returns the date of which the values of Date of Highest Index value in the givenn = number of calendar days prior to the given an Index was the highest in a particular time-span
date/s time-span.indx high date(”dd/mm/yyyy”)This Date is the start date of the desired
time-span. End date is to be entered in the Queryand/or Output Date boxes.
82 indx low date indxlow date(n) Returns the date of which the values of Date of lowestIndex value in the givenn = number of calendar days prior to the given an Index was the lowest in a particular time-span
date/s time-span.indx low date(”dd/mm/yyyy”)This Date is the start date of the desired
time-span. End date is to be entered in the Queryand/or Output Date boxes.
83 indx first closing indxfirst closing(n) Returns the closing values of an Index First index closing values in the givenn = number of calendar days prior to the given on the first date when an Index was time-span
date/s computed in a particular time-span.indx first closing(”dd/mm/yyyy”)This Date is the start date of the desired
time-span. End date is to be entered in the Queryand/or Output Date boxes.
84 indx first closing date indxfirst closing date(n) Returns the first date for which an Date of first index computation in an = number of calendar days prior to the given Index was computed in a particular time-span
date/s time-span.indx first closing date(”dd/mm/yyyy”)This Date is the start date of the desired
time-span. End date is to be entered in the Queryand/or Output Date boxes.
85 indx last closing indxlast closing(n) Returns the closing values of an Index Last indexclosing values in the givenn = number of calendar days prior to the given on the last date when an Index was time-span
date/s computed in a particular time-span.indx last closing(”dd/mm/yyyy”)
(Continued. . . )
August 2010 Indicators
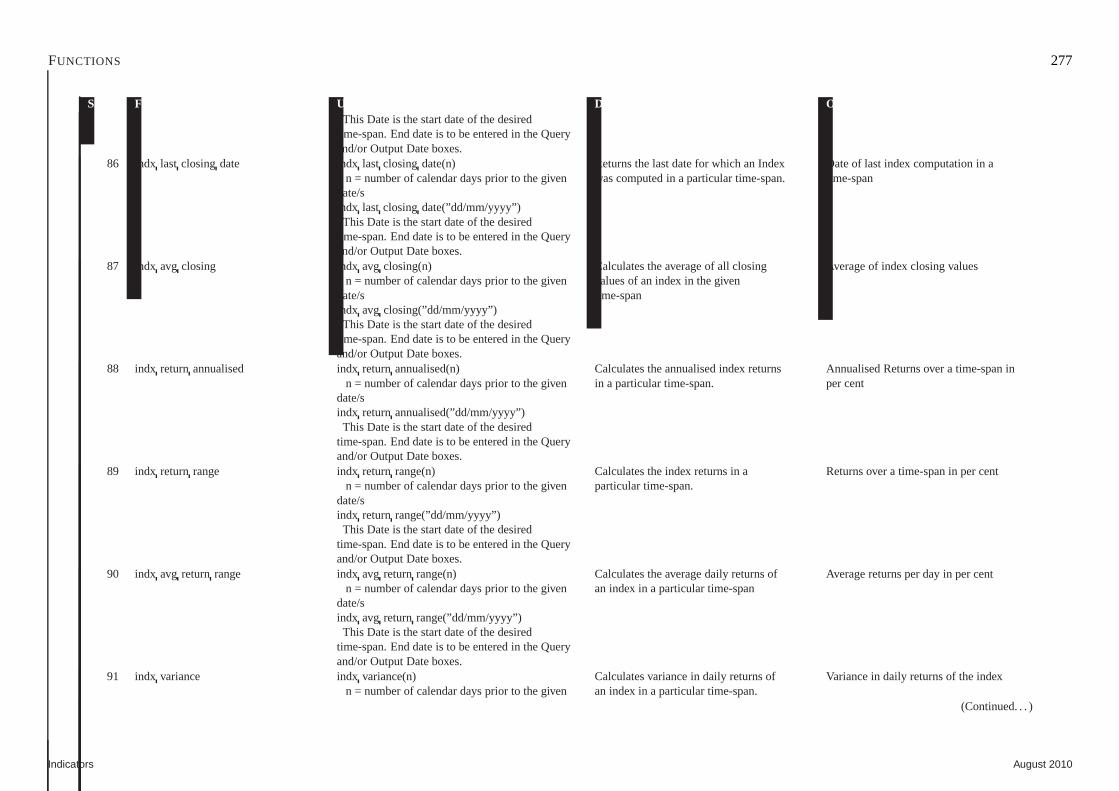
FUNCTIONS 277
Sr.No. Functions Usage Description OutcomeThis Date is the start date of the desired
time-span. End date is to be entered in the Queryand/or Output Date boxes.
86 indx last closingdate indxlast closing date(n) Returns the last date for which an Index Date of last index computation in an = number of calendar days prior to the given was computed in aparticular time-span. time-span
date/sindx last closing date(”dd/mm/yyyy”)This Date is the start date of the desired
time-span. End date is to be entered in the Queryand/or Output Date boxes.
87 indx avg closing indxavg closing(n) Calculates the average of all closing Average ofindex closing valuesn = number of calendar days prior to the given values of an index in the given
date/s time-spanindx avg closing(”dd/mm/yyyy”)This Date is the start date of the desired
time-span. End date is to be entered in the Queryand/or Output Date boxes.
88 indx returnannualised indxreturnannualised(n) Calculates the annualised index returns Annualised Returns over a time-span inn = number of calendar days prior to the given in a particular time-span. per cent
date/sindx returnannualised(”dd/mm/yyyy”)This Date is the start date of the desired
time-span. End date is to be entered in the Queryand/or Output Date boxes.
89 indx return range indxreturn range(n) Calculates the index returns in a Returns over a time-span in per centn = number of calendar days prior to the given particular time-span.
date/sindx return range(”dd/mm/yyyy”)This Date is the start date of the desired
time-span. End date is to be entered in the Queryand/or Output Date boxes.
90 indx avg return range indxavg return range(n) Calculates the average daily returns of Average returns per day in per centn = number of calendar days prior to the given an index in a particular time-span
date/sindx avg return range(”dd/mm/yyyy”)This Date is the start date of the desired
time-span. End date is to be entered in the Queryand/or Output Date boxes.
91 indx variance indxvariance(n) Calculates variance in daily returns of Variance in daily returns of the indexn = number of calendar days prior to the given an index in a particular time-span.
(Continued. . . )
Indicators August 2010
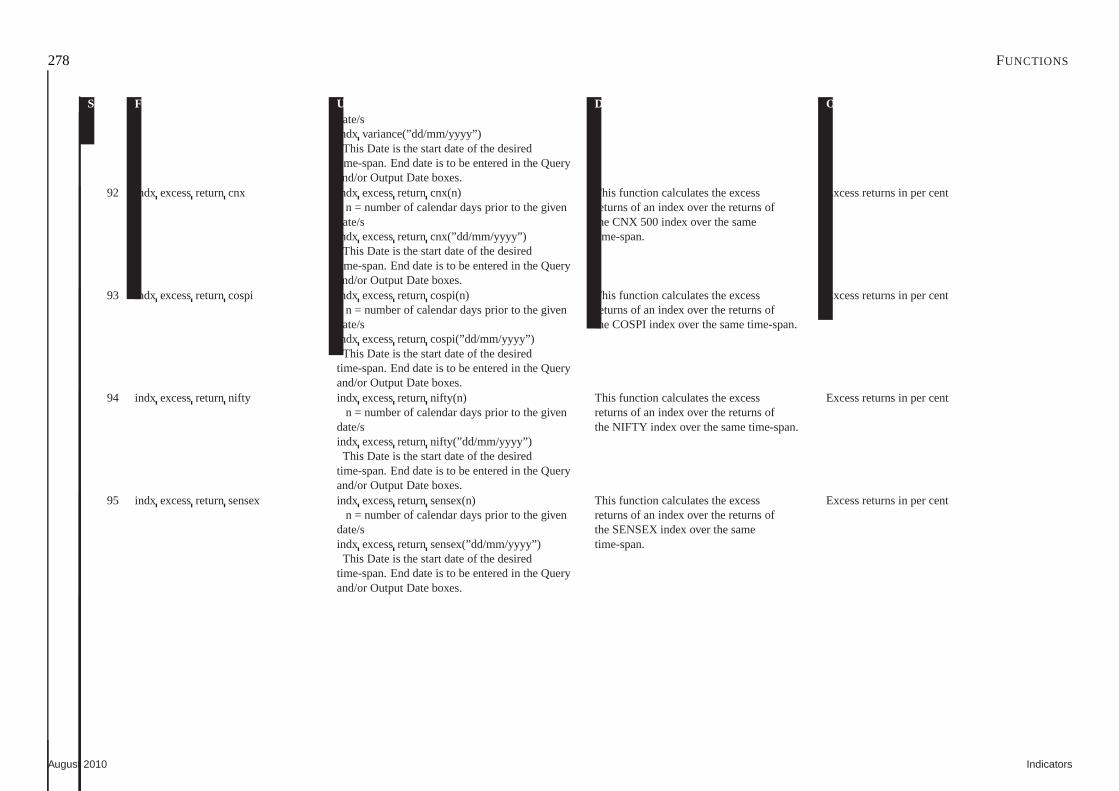
278 FUNCTIONS
Sr.No. Functions Usage Description Outcomedate/sindx variance(”dd/mm/yyyy”)This Date is the start date of the desired
time-span. End date is to be entered in the Queryand/or Output Date boxes.
92 indx excessreturncnx indx excessreturn cnx(n) This function calculates the excess Excess returns in per centn = number of calendar days prior to the given returns of an index over the returns of
date/s the CNX 500 index over the sameindx excessreturn cnx(”dd/mm/yyyy”) time-span.This Date is the start date of the desired
time-span. End date is to be entered in the Queryand/or Output Date boxes.
93 indx excessreturncospi indxexcessreturn cospi(n) This function calculates the excess Excess returns in per centn = number of calendar days prior to the given returns of an index over the returns of
date/s the COSPI index over the same time-span.indx excessreturn cospi(”dd/mm/yyyy”)This Date is the start date of the desired
time-span. End date is to be entered in the Queryand/or Output Date boxes.
94 indx excessreturnnifty indx excessreturn nifty(n) This function calculates the excess Excess returns in per centn = number of calendar days prior to the given returns of an index over the returns of
date/s the NIFTY index over the same time-span.indx excessreturn nifty(”dd/mm/yyyy”)This Date is the start date of the desired
time-span. End date is to be entered in the Queryand/or Output Date boxes.
95 indx excessreturnsensex indxexcessreturn sensex(n) This function calculates the excess Excess returns in per centn = number of calendar days prior to the given returns of an index over the returns of
date/s the SENSEX index over the sameindx excessreturn sensex(”dd/mm/yyyy”) time-span.This Date is the start date of the desired
time-span. End date is to be entered in the Queryand/or Output Date boxes.
August 2010 Indicators