Embed Size (px)
Citation preview

Provincial Government Western Cape Provincial Treasury
PROVINCIAL ECONOMIC REVIEW & OUTLOOK 2009

PR: 265/2009 ISBN: 978-0-621-38994-4 To obtain additional information and/or copies of this document, please contact: Western Cape Provincial Treasury Directorate Budget Management Private Bag X9165 15 Wale Street Cape Town Tel: (021) 483-5618 Fax: (021) 483-6601 E-mail: [email protected] This publication is also available online at http://www.capegateway.gov.za/eng/your_gov/3576/pubs/reports_research/W Printed in the Republic of South Africa For the Government Printers Cape by Formeset Printers Cape

Foreword The 2009 Provincial Economic Review and Outlook (PER&O) is in its fifth annual publication, since introduced in 2005. At the time of the first publication, the Western Cape was the only Provincial Government to have published an economic snapshot of the Province, despite the challenge of limited economic data disaggregated at regional level.
The 2009 PER&O attempts to provide an overall picture of the Western Cape economy to position this within the national and global contexts. It highlights the high growth and performance sectors in the national and provincial economies and their contribution to national and regional gross domestic product and employment. It shows that the four bigger sectors (in terms of GDPR growth and labour absorption) in the Province are: the Financial Services; Wholesale and Retail; Manufacturing; and Community and Personal Services. The PER&O also recognises the contribution of the Agriculture and Micro Economic Development Sectors, which include Information and Communication Technology (ICT), Business Process Outsourcing (BPO), Boat-building, Tourism, Oil and Gas and Clothing and Textiles.
The publication also shows that in the Western Cape a large proportion of the labour force, in the formal economy, has incomplete Further Education and Training educational levels and employment, to a large extent, is taken up in the four biggest economic sectors in the Province. The unemployed are predominantly the youth, with limited to no exposure to the labour market.
Ensuring higher levels of labour force absorption to reverse the current adverse socio-economic conditions and socio destructive trends such as substance and drug abuse across the Province remain a challenge. Improving our competitiveness, removing constraints to innovation and building on our geographic comparative advantage will prove fundamental to growing the economy.
Important contributions to reducing poverty and achieving higher levels of economic growth lie in the improved quality, effective, efficient and accessible government social services in education, health and social development programmes.
Assimilating the findings and recommendations of a number of national and international studies, have all pointed to a common set of possible economic remedies to addressing our aspirations of improving the socio economic betterment of our people. These require further interrogation, dialogue, commitment and implementation.
Alan Winde Minister of Finance, Economic Development and Tourism 24 November 2009

i
Contents Foreword
Executive Summary Chapter 1 Economic Outlook: 2009/10 – 2012/13 1
Chapter 2 Labour Market Dynamics in the Western Cape 2
Chapter 3 Overview of the Western Cape Economic Sectors 3
Chapter 4 Socio-Economic Outlook 5 Chapter 1: Economic Outlook: 2009/10 – 2012/13 1. Introduction 8
2. Developments in the global economy 9
2.1 Global economic performances and the impact of economic and financial crises
10
2.2 Medium term global economic outlook 11
2.3 World inflation and outlook 13
2.4 Risks and prospects for global economic recovery 14
3. Developments in the South African economy 15
3.1 South Africa’s economic performance 15
3.2 South Africa’s responses to global economic crises 17
4. Medium term economic outlook for South Africa 18
4.1 Final household consumption expenditure 19
4.2 Gross Fixed Capital Formation 20
4.3 Balance of payments and Rand exchange rates outlook 20
4.4 Inflation and interest rate outlook 21
4.5 Developments in Headline Consumer Price Index 22
4.6 How soon can the SA economy bounce back from the recession? 24
5. Western Cape economic review and outlook 24
5.1 Performance of the Western Cape economy 24
5.2 Composition of the Western Cape economy 26
5.3 Performance of the Western Cape sectors 27
5.4 Trend in Western Cape exports 32
5.5 Direct investment in the Western Cape 36
5.6 Policy implications for the Western Cape 37
6. Conclusion 38

ii
Chapter 2: Labour Market Dynamics in the Western Cape 1. Introduction 42
2. Data 43
3. The Western Cape labour force 45
3.1 Overview of the labour force 45
3.2 Demographic composition of the labour force 48
3.3 Labour force participation amongst the working-age population 50
4. Total Employment 51
4.1 Demographics and employment 51
4.2 Economic structure and labour demand of the formal sector 54
5. Informal sector employment 58
5.1 Demographic composition of employment 59
5.2 Skills profile of the informal sector workforce 61
6. Unemployment in the Western Cape 62
6.1 Demographic characteristics of unemployment 62
6.2 A profile of unemployed youth 66
7. A note on recent labour market trends 68
8. Conclusion 69
Appendix 1: Labour market specific terminology definitions 72
Appendix 2: Education Levels amongst the Labour Force, Western Cape, 2007 and 2008
74
Chapter 3: Overview of the Western Cape Economic Sectors 1. Introduction 76
2. Sector Developments 76
2.1 Contribution of Western Cape sectors to national aggregates 77
2.2 Trends in the Western Cape and South African sectoral contributions to GDP
78
2.3 A synopsis of the major contributing sectors in the Western Cape 79
2.4 Financial services in the Western Cape economy 80
3. Performance and outlook for selected economic sectors 81
3.1 Agriculture 82
3.2 Oil and Gas Service Industry (including Ship Repair) 87
3.3 Boat-building 89
3.4 Clothing and Textiles 91
3.5 Film 93

iii
3.6 Business Process Outsourcing (BPO) 93
3.7 Information and Communications Technologies (ICT) 96
3.8 Craft 99
3.9 Tourism 100
4. Conclusion 102 Chapter 4: Socio-Economic Outlook 1. Introduction 104
2. Demography 104
3. Poverty 106
4. Education 108
4.1 Enrolment trends 109
4.2 Academic performance indicators 111
5. Health 113
6. Substance abuse trends 115
7. Crime overview 117
8. Conclusion 118
Appendix 3: Substance abuse terminology definitions 119
References 121

iv
Tables
Chapter 1: Economic Outlook: 2009/10 – 2012/13 Table 1.1 World economic outlook 2009 - 2010 (percentage points change
unless otherwise noted) 11
Table 1.2 Economic Outlook for South Africa, growth in GDP (%), 2009 to 2012
19
Table 1.3 Economic outlook for the Western Cape (%) growth in GDP-R, 2008 - 2014
26
Table 1.4 Confidence index data for the Western Cape versus National indices
28
Table 1.5 Trends in Western Cape exports to the rest of the world (R’million at 2000 constant prices)
32
Table 1.6 Sector breakdown of international investments, 2008 37 Chapter 2: Labour Market Dynamics in the Western Cape Table 2.1 Comparisons of labour market status using official and Hybrid
definitions, 2003, 2007 and 2008 44
Table 2.2 Labour market aggregates, 2003 and 2008 45
Table 2.3 Target and actual employment growth of the Western Cape, 2003 - 2008
48
Table 2.4 Composition of the Western Cape narrow labour force, 2003 and 2008
49
Table 2.5 Composition of total employment, 2003 and 2008 52
Table 2.6 Formal employment in the Western Cape, 2008 55
Table 2.7 Sectoral distribution of formal employment, South Africa & Western Cape, 2008
56
Table 2.8 Occupational structure of formal employment, 2008 57
Table 2.9 Skill structure of employment by industry, Western Cape and South Africa, 2008
58
Table 2.10 Composition of informal sector employment, 2008 60
Table 2.11 Composition of the informal sector by race and gender, 2008 61
Table 2.12 Skills structure of informal sector, 2008 61
Table 2.13 Composition of the unemployed, 2003 and 2008 63
Table 2.14 Duration of unemployment, 2008 65
Table 2.15 Unemployment rates for youth and non-youth, 2008 66
Table 2.16 Recent Labour Market Trends, 2008Q3 - 2009Q3 69
v
Chapter 3: Overview of the Western Cape Economic Sectors Table 3.1 Western Cape production (%) to national aggregate of value
added 77
Table 3.2 Sector distribution (%) of gross domestic product at basic prices, constant 2000 prices
78
Table 3.3 Number of emerging farmers per district in the Western Cape (2007)
83
Table 3.4 Distribution of persons who benefited directly from food gardens in the Western Cape Province during 2008/09
84
Table 3.5 Arrivals to the Western Cape 101 Chapter 4: Socio-Economic Outlook Table 4.1 Enumerated population in the Western Cape Province 104
Table 4.2 Total population by district municipality in 2007 105
Table 4.3 Percentage population group distribution by district municipality in 2007
105
Table 4.4 Social Grants to be paid out during September 2009 108
Table 4.5 Grade 3 results 2002 - 2008 111
Table 4.6 Grade 6 results 2003 – 2007 112
Table 4.7 2008 Matric pass rate per gender 112
Figures Chapter 1: Economic Outlook: 2009/10 – 2012/13 Figure 1.1 Sectoral contribution to Western Cape GDP-R (%), 2008 27
Figure 1.2 Composition of the Western Cape manufacturing sector, 2008 29
Figure 1.3 Provincial infrastructure payments (R’million), 2005/06 - 2011/12 32
Figure 1.4 Major destinations for Western Cape Exports (% share), 2008 35
Figure 1.5 District distribution of Western Cape investment: 2004 - 2008/09 36 Chapter 2: Labour Market Dynamics in the Western Cape Figure 2.1 Western Cape narrow labour force participation rates, 2008 51
Figure 2.2 Western Cape unemployment rates, 2003 - 2008 65
Figure 2.3 Narrow youth and non-youth unemployment rates in the Western Cape, 2008
67

vi
Chapter 3: Overview of the Western Cape Economic Sectors Figure 3.1 Share of industry in total gross income in the Western Cape – 2002
and 2007 83
Figure 3.2 Value of fruit exports to main destinations: 2000 to 2008 84
Figure 3.3 2007/08 International tourist arrivals within the South African context
100
Figure 3.4 2005 – 2007 International Arrivals to the Western Cape by region of origin
101
Chapter 4: Socio-Economic Outlook Figure 4.1 Poverty index by district municipality 107
Figure 4.2 Population distribution per age and gender 109
Figure 4.3 Public Ordinary Schools enrolment numbers between 1996 and 2008
110
Figure 4.4 FET enrolment trends 2005 – 2012 (actual and estimated) 110
Figure 4.5 Drug-related Crime in the Western Cape between 2001 and 2008 117
vii
Abbreviations AsgiSA Accelerated and Shared Growth Initiative of South Africa BCI Business Confidence Index BER Bureau for Economic Research BFAP Bureau for Food and Agricultural Policy BoD Burden of Disease BoP Balance of Payments BPO Business Process Outsourcing BPO&O Business Process Outsourcing and Off-shoring CBD Central Business District CCI Consumer Confidence Index CCTC Cape Clothing and Textile Council CMT Cut, Make and Trim COICOP Classification of Individual Consumption by Purpose CPI Consumer Price Index CPIX Consumer Price Index (excluding interest rates on mortgage bonds) CSIR Council for Scientific and Industrial Research CSP Community, Social and Personal CTBi Cape Town Boatbuilding and Technology Initiative DBSA Development Bank of South Africa DSD Department of Social Development EAR Employment Absorption Rate ECD Early Childhood Development EPWP Expanded Public Works Programme EU European Union FAO Food and Agriculture Organisation FASD Foetal Alcohol Spectrum Disorders FDI Foreign Direct Investment FET Further Education and Training FHCE Final Household Consumption Expenditure FIFA Federation Internationale de Footbal Association GDP Gross Domestic Product GDP-R Regional Gross Domestic Product GET General Education and Training GFCF Gross Fixed Capital Formation GVA Gross Value Added HIV/Aids Human Immunodeficiency Virus/Acquired Immune Deficiency Syndrome ICOMIA International Council of Marine Industry Associations ICT Information and Communications Technology IDC Industrial Development Corporation

viii
IES Income and expenditure Survey (Stats SA) ILO International Labour Organisation IMF International Monetary Fund ISETT SETA Information Systems, Electronics and Telecommunications Sector
Education & Training Authority IT Information Technology LFPR Labour Force Participation Rate LFS Labour Force Survey (Stats SA) LSEN Learners with special education needs MEDS Microeconomic Development Strategy MRC Medical Research Council (South Africa) MTBPS Medium Term Budget Policy Statement MTEF Medium Term Expenditure Framework NCA National Credit Act NIMSS National Injury Mortality Surveillance System NIPF National Industrial Policy Framework NSF National Skills Fund OECD Organisation for Economic Cooperation and Development PER&O Provincial Economic Review and Outlook PGWC Provincial Government of the Western Cape PMI Purchasing Manager’s Index PPI Producer Price Index QLFS Quarterly Labour Force Survey RTI Road Traffic Injuries SACENDU South African Community Epidemiology Network on Drug Use SARB South African Reserve Bank SETA Sector Education Training Authority SIC Standard Industrial Classification SMMEs Small, Medium and Micro Enterprises Stats SA Statistics South Africa TB Tuberculosis TGR Target Growth Rate the dti The Department of Trade and Industry (South Africa) UIF Unemployment Insurance Fund UK United Kingdom US United States Wesgro Western Cape Trade and Investment Promotion Agency

1
Executive Summary
Chapter 1: Economic Outlook: 2009/10 – 2012/13 Chapter 1 reviews developments in the global and domestic economy since the publication of the 2008 Provincial Economic Review and Outlook (PER&O).
Advanced economies entered into a recession following the intense financial turmoil that erupted in September 2007. The efforts of policymakers across the world did not achieve much in stabilising the financial markets and cushioning the world economy from entering into a recession. These efforts should further be supported by strong macroeconomic policy, restoring financial stability in the world’s major economies thereby providing sustained and strong support for aggregate demand.
The outlook for the global economy in 2009 still remains gloomy, characterised by negative economic growth and recovery is expected to be slow. Global economic growth more recently has turned positive as a result of broad-based signs of recovery in developing and emerging markets. Global economic growth is expected to start expanding in 2010 supported by wide-ranging public interventions, reduced uncertainty and lower risks in financial markets.
After showing resilience in 2008, the South African economy succumbed to external economic pressures and has also since slipped into recession in the first quarter of 2009 and remained deep in recession in the second quarter. Fiscal and monetary policies enacted for the past six months since December 2008 have had little impact in averting the recession.
Output in the manufacturing sector, South Africa’s main economic engine, fell dramatically in the first and second quarters of 2009, while the construction sector continued to buoy the economy. Mining production expanded in the second quarter of 2009 after a steep fall in the first quarter. Household consumption has lost momentum as the key driver of the economy in 2008, but is expected to recover in the fourth quarter of 2009. Investment spending is expected to lead economic growth in 2009 and over the medium term.
The general consensus amongst economic analysts is that the South African economy would return to low but positive growth in the third or fourth quarter of 2009, as long as the global economy stays on the recovery path.

WESTERN CAPE PROVINCIAL ECONOMIC REVIEW AND OUTLOOK 2009
2
The Bureau for Economic Research (BER) projects the Headline Consumer Price Index would revert back to the target band in the second quarter of 2010, while National Treasury expects such a retreat the latest by 2011.
The main challenges for the domestic economy are to stimulate economic growth, save existing jobs and create additional employment opportunities, support exporting industries and strive to bring the inflation back within the target band. Government therefore faces the challenge of increasing its efforts to protect the poor from the impacts of the recession while striving to maintain the fiscal balance.
The Western Cape economy is estimated to have grown by 3.5 per cent in 2008, with the finance, insurance and construction sectors being the main drivers of growth. However, in line with the national economy, the regional economic outlook is bleak with downward revisions in growth projections for the medium term.
Exports from the Western Cape grew in 2007 and 2008, with vegetable products, mineral products; and prepared food stuffs, beverages, spirits & vinegar, tobacco & manufactured tobacco substitutes the principle exports comprising over half the value of exports.
The Western Cape economy is forecast to contract in 2009 before a moderate recovery for 2010. The sectors dominating economic activity in the Western Cape are: financial intermediation, insurance, real estate and business services; manufacturing and wholesale, retail trade, catering and accommodation. With the exception of low growth in the business services sector, all these sectors are forecasted to contract in 2009. Construction is however expected to remain a key driver of growth in the Province.
Over the MTEF, the Province should intensify the implementation of interventions that aim to remove bottlenecks to growth and enhance regional economic development.
Chapter 2: Labour Market Dynamics in the Western Cape South Africa and the Western Cape, continues to face the challenge of creating sufficient employment opportunities and mitigate rising unemployment levels. Addressing this challenge is made more difficult as the labour market is characterised by a structural mismatch of having a large supply of unskilled labour but high demand for skilled labour.
The labour force experienced strong growth over the period 2003 to 2008 in the Western Cape outstripping the national average. In the Western Cape the growth in the labour force was mainly driven by increased participation of working-aged Africans, females, older age segments and individuals with incomplete further education and training and those with higher levels of education.

EXECUTIVE SUMMARY
3
Employment in the Western Cape increased over the period 2003 to 2008, however this growth was slower than that experienced nationally and was not adequate to stem rising levels of unemployment. Unemployment levels are highest amongst Africans, Coloureds and females, despite having experienced a relatively higher growth rate in employment between 2003 and 2008. Those aged 15 - 24 and 25 – 34 years continue to bear the burden of the highest levels of unemployment.
Employment within the formal sector is correlated with higher levels of education and skill. Growth in total employment has been stronger for individuals with higher education levels. Half of the Western Cape’s formal sector workforce is employed in skilled occupations, with nearly 30 per cent employed in high-skilled occupations. Major employers in the Western Cape for 2008 were the Wholesale and Retail, Manufacturing and Community, Social and Personal Services.
The labour market in the Western Cape has, thus far, been less impacted by the global recession. Nationally there has been a decline in the labour force participation rate due to the increase in the number of discouraged workseekers as well as an increase in the unemployment rate. In contrast the Western Cape has seen an increase in the labour force participation rate, although the unemployment rate has edged upwards.
In response to the continued challenge of creating sufficient employment opportunities and mitigating rising unemployment levels, greater emphasis needs to be placed on skills development in order to meet the skill demands required by the Western Cape economy.
Chapter 3: Overview of the Western Cape Economic Sectors Chapter 3 reviews economic conditions of key Western Cape sectors and other selected sectors at a more micro level. The Western Cape economy in recent years has maintained its tendency to grow faster than the national economy. The regional economy has also undergone significant structural changes, notably characterised by a decline in the relative contribution of manufacturing. The commensurate and compensating development has been the faster growth of the services industry. While it is recognised that it is quite possible to have viable and sustainable growth by producing services for export to other provinces and countries, the fact remains that for most developing countries, and for regions within developing countries, it would not be wise to neglect industrialisation as growth engine.
The current recession has adversely affected almost all of the sectors of the Western Cape economy. While there have been some significant firm closures, particularly in manufacturing and more particularly in export oriented labour intensive sectors such as clothing, overall productive capacity has remained intact.

WESTERN CAPE PROVINCIAL ECONOMIC REVIEW AND OUTLOOK 2009
4
From a sector perspective, it is expected that the economic crisis will have an impact on the production and processing capacity of the agricultural sector where production capacity could be harmed by the availability of credit, stricter regulation and extreme market volatility. However, fundamental demand for commodities has not decreased significantly. Nevertheless, agriculture is recognised for its contribution to income and employment, rural development, as an earner of foreign exchange and custodian for the largest part of natural resources in the country.
In the oil and gas sector, there are major variations in employment figures between project periods and lull periods. For example, the Polaris (oilfield pipe-laying barge) will employ over 2 000 people during the project peak, but once the vessel is completed and sails out of the local port, there is no employment linked to the project.
Export revenues generated in the boat-building industry have almost doubled between 2007 and 2008 suggesting growth potential within the industry. This coupled with the existence of various factors suitable to boat-building in the Western Cape creates an environment for a highly competitive industry with opportunity for improvement of revenue generation.
Since the onset of the global economic downturn, the boat-building industry has seen many boat yards doing smaller repair jobs, training interventions and workshop maintenance, in an attempt to avoid retrenching staff.
While the import quota agreement with China shielded the clothing and textile industries from Chinese imports, its protection was weakened by imports from other countries. At the beginning of 2009 the agreement has lapsed, opening up the sector to renewed pressure from Chinese imports.
The Western Cape is South Africa’s foremost tourism region and this sector in the Province continues to show growth. This is reflected in the high and increasing contribution to the national aggregate of value added, demonstrating potential for further growth in the Catering and Accommodation sector.
The Finance and Insurance sector has grown its relative contribution to the Western Cape GDP, and this sector’s Western Cape contribution in the national aggregate has marginally increased. The correct policy and environment could stimulate potential growth of the finance and insurance sector through the supply of their services to regional and national markets.
While South Africa, and hence the Western Cape, does not rate highly in terms of its competitiveness as a low cost location (it is considered to be a high cost location, relative to other Business Process Outsourcing (BPO) locations such as Malaysia, Egypt, Philippines, etc.), the Province’s value-proposition is more firmly based on a competitive cost to quality ratio. Hence while labour costs tend to be comparatively higher, the quality of service delivered to clients is generally ranked very positively. The increase in number of contact centre agents demonstrates the growth in the telecoms sector (in delivering both low and high complexity services) with further growth expected in the sector over the next 12 months.

EXECUTIVE SUMMARY
5
Chapter 4: Socio-Economic Outlook The aim of the socio-economic outlook chapter is to identify some of the socio-economic challenges in the Western Cape that should form the basis for policy direction and intervention.
The chapter presents a brief overview of the population in the Western Cape and poverty trends within the municipal district areas in the Province. It also provides some educational outcomes, identifies the main reasons for the burden of disease and reveals some statistics on substance abuse and the relationship between alcohol abuse, crime and injury in the Province.
Projections of the age distribution of the Western Cape’s population identified that the Province is in a process of population ageing, which could have significant socio-economic consequences for the Province such as the need for social security and appropriate forms of care for older persons.
The major contributing indicators of poverty are unemployment and housing. Although interventions to decrease unemployment and to provide houses to the poor by government are ongoing, specific districts have been identified for possible prioritisation.
Despite the strong correlation between education and employment opportunities, learner numbers show a decline after age 14 and particularly at ages 17 and 18, and approximately 65 per cent of our youth do not receive a matric qualification. As a first step it is therefore critical that we keep youth in schools as long as possible or provide alternative training programmes to develop specialised skills, e.g. FET colleges.
Many of the determinants of health rest outside the direct influence of the health and social care sectors, for example: education, employment, housing, poverty and the environment have a significant impact on health. Homicide and road traffic injuries, as a result of alcohol abuse, have also been identified as major contributors to the burden on health services in the Western Cape. Therefore, the provision of health services, cannot be isolated from addressing the wide range of upstream and downstream risk factors of disease.
Beyond the PER&O The Western Cape’s economic outlook is tied to developments in the global and national economy. The impact of the global economic crisis seems to be less severe in the Province than at a national level and has adversely affected almost all of the sectors of the Western Cape economy. The bigger sectors have experienced contractions in output and employment and export sectors have also been affected as a result on the downturn in global demand. The 2009 PER&O contextualises the labour demand and supply in relation to the real economy, shows the sectors contributing the most in term of regional production and employment and also signifies sectors where we are losing ground and where there may be potential to capitalise on exports. The main challenges facing the provincial economy is a better understanding of the real economy, particularly of the

WESTERN CAPE PROVINCIAL ECONOMIC REVIEW AND OUTLOOK 2009
6
constraints, opportunities and enablers to economic growth relating to the different sectors and particularly the larger sectors and what would save and create employment opportunities including issues such as skills development. Going forward, to facilitate inclusive economic growth and employment the key issue becomes how to support export and growing industries and contribute to the removal of constraints, improve competitiveness, innovation and build on the comparative advantage of the Province. Topical issues are also around improvements in socio-economic outcomes (particularly education and health) and mitigating the effects of social dysfunction, manifested in high levels of alcohol and substance abuse and crime.

7
1
Economic Outlook: 2009/10 – 2012/13 Key findings:
• The massive financial bailout packages implemented by governments in most advanced economies were not very effective in cushioning their respective economies from slipping into a recession.
• Recently, the global economic growth has turned positive as a result of broad-based signs of recovery led by economies of the developing and emerging markets.
• The outlook for the global economy in 2009 still remains gloomy, characterised by negative economic growth. Global economic growth is expected to start expanding in 2010 supported by wide-ranging public interventions and reduced uncertainty and risks in financial markets.
• The South African economy entered into a recession in the first quarter of 2009 and remained deep in recession in the second quarter. Fiscal and monetary policies enacted in December 2008 by the South African government have had little impact in averting the recession.
• Output in the manufacturing sector, South Africa’s main economic engine, fell dramatically in the first and second quarters of 2009, while the construction sector continued to buoy the economy. Mining production expanded in the second quarter of 2009 after a steep fall in the first quarter.
• The BER projects that the Headline Consumer Price Index inflation would revert back to the target band in the second quarter of 2010 while National Treasury expects such a retreat the latest by 2011.
• Household consumption has lost momentum as the key driver of the real economy in 2008 but it is expected to recover in the fourth quarter of 2009. Investment spending is expected to lead economic growth in 2009.

WESTERN CAPE PROVINCIAL ECONOMIC REVIEW AND OUTLOOK 2009
8
• The general consensus amongst economic analysts is that the South African economy would return to low but positive growth in the third or fourth quarter of 2009, as long as the global economy stays on the recovery path.
• Economic growth for the Western Cape is estimated at 3.5 per cent for 2008, with the finance, insurance and construction sectors as the main drivers of growth.
• In line with the national economy, the Western Cape’s growth projections have been downgraded and the economy is forecast to contract to by 1.1 per cent in 2009 before a moderate recovery forecast for 2010.
• The downgrading of the Western Cape’s growth projections present a bleak regional short-term outlook with many sectors experiencing a decline in regional gross domestic product.
• The sectors dominating economic activity in the Western Cape are: financial intermediation, insurance, real estate and business services; manufacturing and wholesale, retail trade, catering and accommodation.
• Exports from the Western Cape to the rest of the world grew by 24.7 per cent between 2007 and 2008.
1. Introduction The global economy and advanced economies such as the United States, the major European economies and Japan entered into a recession following the intense financial turmoil that erupted in September 2007. The fiscal rescue packages and monetary policy actions enacted by most governments of advanced economies had limited success in preventing a recession in the global economy but they remain important for a sustainable recovery. These interventions helped to significantly improve financial conditions and to moderate the decline in economic activity.
Since July 2009, there have been signs that the global economy is beginning to recover from the recession. However, stabilisation would be uneven and recovery is expected to be sluggish. Recently, the global recession started showing signs of ending and global economic growth is expected to start expanding in 2010, albeit at a slow rate.
The South African economy slipped into a technical recession after succumbing to the sub-prime1 crisis and the international financial market turmoil it initiated. The manufacturing and mining sectors were the hardest hit by the recession as global demand for commodities slumped. As a result, the economy started shedding jobs. Although monetary and fiscal policy interventions could not avert the recession, these tools remain important in stimulating the domestic economy over the medium to long-term period.
1 Sub-prime mortgages are loans made to borrowers who are perceived to have high credit risk, often because they lack a strong credit history or have other characteristics that are associated with high probabilities of default.

CHAPTER 1: ECONOMIC OUTLOOK 2009/10 – 2012/13
9
The Western Cape has continued to achieve growth rates that exceed the national averages. The performance of the Western Cape economy in 2008 was largely driven by robust growth in the construction and finance and insurance sectors. However, similar to the national economy, the medium term-economic outlook has deteriorated as a result of the global economic crisis. A contraction in output is projected for the Western Cape in 2009. However, this contraction is expected to turn around in 2010, albeit at a slower pace.
Section 2 discusses the developments in the global economy since the eruption of the United States housing market crisis. The discussion includes the recent economic performance and the medium-term outlook for the global and regional economies, the impact of the economic and financial crises, the policies adopted to mitigate such crises and the risks and prospects for economic recovery. Similar discussions are done for the South African economy in section 3.
Section 4 focuses on the Western Cape economy and reviews the provincial economic growth performance and medium term economic outlook in light of the economic crisis. This section also includes an analysis of the sectors in terms of composition and performance and discusses trends in exports and direct investment. Policy implications are discussed thereafter.
2. Developments in the global economy2 The United States (US) sub-prime crisis weakened global economic activity leading to mild recessions in advanced economies by mid-2008 while the developing and emerging economies maintained strong growth trends. In September 2008, the collapse of US investment banks such as Lehman Brothers, the rescue of the largest US insurance company (American International Group) and intervention in a range of other systemic institutions in the US and Europe dramatically worsened the financial market turmoil. The global economy entered into a recession in late 2008, as a result of increased risk aversion and uncertainty and the sharp downturn in the demand for tradable goods.
The problems that led to the crises are structural in nature (global trade and financial imbalances, unscrupulous banking practices, etc.) and therefore could not be successfully eradicated by cyclical policy tools such as fiscal and monetary policy. This resulted in negative real interest rates and increased unsustainable government debt. Some governments across the world resorted to protectionist trade measures to deal with the crises.
By July 2009, the global economy started showing signs of stabilisation as financial conditions improved and the rate of decline in economic activity moderated in response to macroeconomic and financial policy. Fiscal rescue packages and expansive monetary policy played a significant role in stimulating global economic activity but recovery is expected to be slow.
2 Various International Monetary Fund and World Bank documents are the main sources of information used in these sections.

WESTERN CAPE PROVINCIAL ECONOMIC REVIEW AND OUTLOOK 2009
10
According to the latest IMFs World Economic Outlook release, the global economy is expanding again, led by strong public policies across the developing and emerging markets and by generally improved financial conditions.
2.1 Global economic performances and the impact of economic and financial crises
The global economic crisis weighed down economic growth in 2008. Annual global economic growth rate declined to 3.0 per cent in 2008 after registering a sterling performance of 5.2 per cent in 2007.
2.1.1 Advanced economies
In 2008, advanced economies experienced 0.6 per cent real Gross Domestic Product (GDP) growth after recording a contraction of 7.5 per cent during the fourth quarter. Europe and advanced Asia have been hard hit by the collapse in global trade, rising financial problems of their own and housing corrections in some countries.
The US economy contracted by 6.2 per cent and 6.1 per cent in the last quarter of 2008 and the first quarter of 2009, respectively. Nevertheless, economic growth averaged 0.4 per cent in 2008. This economy particularly suffered from intensified financial strains and the continued fall in the housing sector. A similar trend was observed for the economies of the United Kingdom (UK), Japan, and Germany in the first quarter of 2009.
The Japanese economy was the most negatively affected, shrinking by 12.1 per cent in the fourth quarter of 2008, and averaging a contraction of 0.7 per cent for the year. Investment spending in economies that specialise in capital goods production such as Japan, Germany, Taiwan, China and the US have been adversely affected by the downturn. In 2008, the volume of exports from Japan declined by 40 per cent while China and Singapore experienced a 30 per cent and 25 per cent decline in exports, respectively.
2.1.2 Developing and emerging markets
Developing and emerging economies contracted by 4 per cent on average in the fourth quarter of 2008. However, the economic growth rate for these economies decelerated to 6.0 per cent in 2008 from 8.3 per cent in 2007, supported by the buoyant economies of China and India.
Downturns in China and India have been moderate given the lower shares of their export sectors in domestic production and more resilient domestic demand. Emerging Europe suffered due to a heavy reliance on external financing and on manufacturing exports. Countries in Africa, Latin America and the Middle East have suffered from plummeting commodity prices, financial strains and weak export demand.

CHAPTER 1: ECONOMIC OUTLOOK 2009/10 – 2012/13
11
The impact of the crisis differed from country to country and from region to region, but in summary, the following collective effects emerged:
• Build up of foreign debt; • Deteriorating terms of trade for commodity exporters; • Decline in global investment and trade; • Diminishing capital inflows affecting investment growth; • Reduced oil revenue for oil exporters as international commodity prices decline; • Reduced tourism arrivals and remittance flows; • Decline in GDP, production and trade; • Lower domestic inflation across the world; • Increased fiscal pressures; • Collapse in stock markets and tighter global credit; and • Large financing gaps on balance of payments.
2.2 Medium term global economic outlook
The global economy is expanding supported by strong economic performance of Asian economies and modest recovery elsewhere. Consequently, the global economic prospects were revised slightly up in October 2009. The outlook for the global economy in 2009 remains gloomy, characterised by negative growth and slow recovery as financial systems remain impaired, the rate of unemployment remains high and support from public policies would be withdrawn over time.
According to the latest International Monetary Fund (IMF) projections in Table 1.1, global economic activity is expected to contract by 1.1 per cent in 2009, which represents an increase of 0.3 percentage points from a contraction of 1.4 per cent projected in July 2009. Economic growth is projected to recover in 2010 at a rate of 3.1 per cent (0.6 percentage points higher than the July 2009 forecast).
These projections are based on the assumption that the restoration of stability in the financial markets will take longer than previously envisaged, despite the efforts by policymakers. The projections also assume continued strong macroeconomic policy support, which depends on financial authorities in the world’s major economies acting decisively to restore financial stability.
Table 1.1 World economic outlook 2009 - 2010 (percentage points change unless otherwise noted)
Actual Projections Difference from July 2009 projections
2007 2008 2009 2010 2009 2010 World output 5.2 3.0 -1.1 3.1 0.3 0.6 Advanced economies 2.7 0.6 -3.4 1.3 0.4 0.7 United States 2.1 0.4 -2.7 1.7 -0.1 0.7 Euro area 2.7 0.7 -4.2 -0.3 0.6 0.6 Germany 2.5 1.2 -5.3 -0.3 0.9 0.9 France 2.3 0.3 -2.4 0.9 0.6 0.5 Italy 1.6 -1.0 -5.1 -0.2 0.0 0.3 Spain 3.6 0.9 -3.8 -0.7 0.2 0.1

WESTERN CAPE PROVINCIAL ECONOMIC REVIEW AND OUTLOOK 2009
12
Actual Projections Difference from July 2009 projections
2007 2008 2009 2010 2009 2010 Japan 2.3 -0.7 -5.4 1.7 0.6 0.0 United Kingdom 2.6 0.7 -4.4 0.9 -0.2 0.7 Canada 2.5 0.4 -2.5 2.1 -0.2 0.5 Other advanced economies 4.7 1.6 -2.1 2.6 1.8 1.6 Emerging and developing economies 8.3 6.0 1.1 5.1 0.2 0.4
Africa 6.3 5.2 1.7 4.0 -0.1 -0.1 Sub-Sahara 7.0 5.5 1.3 4.1 -0.2 0.0 Central and Eastern Europe 5.5 3.0 -5.0 1.8 0.0 0.8 Developing Asia 10.6 7.6 6.2 7.3 0.7 0.3 China 13.0 9.0 8.5 9.0 1.5 0.5 India 9.4 7.3 5.4 6.4 0.0 -0.1 Consumer prices Advanced economies 2.2 3.4 0.1 1.1 0.0 0.2 Emerging and developing economies 6.4 9.3 5.5 4.9 0.2 0.3
Source: Adapted from the International Monetary Fund (IMF), World Economic Outlook, October 2009.
2.2.1 Outlook for advanced economies
Advanced economies are expected to contract by 3.4 per cent in 2009 and register a 1.3 per cent economic growth rate in 2010. Unprecedented public interventions in these economies have stabilised economic activity. The outlook for employment is expected to take time before it improves significantly. In addition, private credit is projected to contract in 2009 and 2010.
The US and UK economies will continue to suffer heavily from credit constraints given the direct damage to their financial institutions, major housing corrections and reliance on household borrowing to support consumption. Economic growth in these economies is projected to contract by 2.7 per cent and 4.4 per cent in 2009, respectively. Consumption will be particularly weak in the US and the UK, the economies that experienced credit booms, housing bubbles and large current account deficits. However, business and consumer confidence in the US has improved and the rate of deterioration in economic activity is moderating, but risks remain.
The downturn in Japan has been exceptionally severe, due to deterioration in trade, the economy’s heavy reliance on manufacturing exports and as a result of spillovers to domestic investment. Consequently, the IMF projects the economy of Japan to be most negatively affected, contracting by 5.4 per cent in 2009 and rebounding to 1.7 per cent in 2010.
Overall, economic activity in the Euro area is projected to contract by 4.2 per cent in 2009, led by Germany (-5.3 per cent), Italy (-5.1 per cent), Spain (-3.8 per cent) and France (-2.4 per cent). The rising rate of unemployment and the region’s heavy reliance on the banking sector is expected to weigh down consumption and real economic activity.

CHAPTER 1: ECONOMIC OUTLOOK 2009/10 – 2012/13
13
Massive government spending globally assisted the economies of Germany, France and Japan to return to positive growth in the second quarter of 2009. In Japan, consumer confidence has improved in the second quarter of 2009 and output is stabilising.
2.2.2 Economic outlook for emerging and developing economies
Emerging and developing economies are forecast to decelerate sharply from 6.0 per cent in 2008 to 1.1 per cent in 2009 and then expand by 5.1 per cent in 2010. The rebound is driven by China, India and other Asian economies and attributed to state enterprise-led investment, recovery in global trade and a surge in domestic spending. The modest recoveries in other economies are supported by policy stimulus and improving global trade and financial conditions. Macroeconomic stimuli and faster reverse in capital flows afforded China and India the opportunity to upgrade economic growth projections.
Projections in emerging economies assume that capital flows will stabilise and grow moderately and that credit growth would continue to be constrained delaying investment (except for China). Sustained economic growth recovery in the developed countries and unprecedented public interventions in these has fostered a return to modest growth in several emerging economies.
The recent rebound in commodity prices and supportive policies are helping many of the emerging economies to stabilise their economic activity. The macroeconomic policies adopted have helped to improve declining financial conditions and otherwise weakening economies. The main policy priorities remain, i.e. restoring the health of the financial sector and continued support of macroeconomic policies. These entail: (1) Ensuring that financial institutions have access to liquidity; (2) Identifying and dealing with distressed assets; and (3) Recapitalising weak, but viable institutions.
Economic growth in Africa is expected to average 1.7 per cent in 2009. The availability of external financing will remain highly constrained. The IMF projects growth in sub-Saharan Africa to decline to 1.3 per cent in 2009, from 5.5 per cent in 2008, before it recovers to 4.1 per cent in 2010.
2.3 World inflation and outlook
Inflation pressures have subsided due to a sharp fall in commodity prices and moderate wage increases. Headline Consumer Price Index (CPI) inflation in advanced economies is projected to average 0.1 per cent in 2009.
According to the IMF projections, interest rates are expected to be lowered to or remain zero bound in 2009 and to increase slightly to 1.1 per cent in 2010 in major advanced economies, while central banks continue to explore alternative ways to ease credit conditions and provide liquidity. Inflation rates have been revised upwards by 0.2 percentage points for 2010 following stronger consumer demand and commodity prices.

WESTERN CAPE PROVINCIAL ECONOMIC REVIEW AND OUTLOOK 2009
14
Inflation has also moderated notably across emerging economies. A downward inflation trend is expected (5.5 per cent in 2009 and 4.9 per cent in 2010) for developing countries, following the fall in commodity prices, weak demand and continued increase in unemployment.
2.4 Risks and prospects for global economic recovery
The global economy has started to recover, led by emerging and developing, particularly Asian, economies. Financial conditions have also improved quite significantly, but the outlook for employment is likely to take time before it improves. The financial market sentiment has rebounded and risk aversion towards emerging economies has subsided as a result of strong public policies across both emerging and advanced economies.
The factors driving the current rebound in economic activity, such as large fiscal stimuli and the central bank’s support for credit markets are temporary in nature and therefore likely to diminish in 2010.
The rate of recovery in the world economy will still be slow and depend on several factors including how soon macroeconomic stability can be restored in the US, the European Union (EU) and other key regions and the reversion of real interest rates in advanced economies to positive levels. Recovery would also depend on how soon global trade barriers can be lowered and the availability of credit.
One of the key factors determining the course of the downturn and recovery will be the rate of progress towards restoring the financial sector to health. The process of removing bad assets, deleveraging balance sheets and restoring market institutions will be prolonged.
On the downside, the rising rate of unemployment, loss of confidence in the stability of the financial sector, unsustainability of public debt in some countries, falling house prices and constrained credit could undermine confidence in bank capital bases in advanced economies. Downward risks to growth are receding gradually but remain a concern. The global economy remains fragile and other factors such as rising oil prices, geopolitical events and protectionism are likely to weigh down economic growth.
Monetary and fiscal policies should therefore remain supportive until growth continues and deflationary risks subside. As such, the remaining room to further cut interest rates should be exploited, although fiscal deficits are expected to widen sharply in both advanced and emerging economies. Rising concerns about fiscal sustainability therefore underline the need for stronger medium-term fiscal policy frameworks.
Policies should start focusing on key medium-term challenges, including the need to reform financial systems, boosting potential growth and rebalancing the patterns of global demand. This will require significant structural reforms such as measures to repair financial systems, improve corporate governance and financial intermediation, support public investment, and improve social safety nets.

CHAPTER 1: ECONOMIC OUTLOOK 2009/10 – 2012/13
15
Fiscal stimulus should be sustained until the global economic recovery stabilises and be extended beyond the initial plans if the risks to growth materialise. Monetary policy should accommodate the gradual withdrawal of fiscal support. The financial market policy challenge is to ensure that markets and banks can support economic recovery (i.e. repair bank balance sheets, increase bank capital, etc.).
3. Developments in the South African economy The SA financial sector survived the US sub-prime crisis almost unscathed, supported by a well-regulated banking system and prudent fiscal and monetary policies adopted in government in 1996. The economy remained resilient for most of 2008 but gave in to deteriorating global economic developments in the last quarter of 2008.
SA entered into economic recession in the first quarter of 2009 when GDP growth contracted for the second consecutive quarter. Production in the mining and manufacturing sectors fell dramatically in the same period as global demand slowed and commodity prices plummeted. Subsequently, the SA economy started shedding jobs in the first, second and third quarters of 2009, predominantly in these sectors. Since unemployment is a lagged indicator, it is expected that the economy will continue to shed more jobs in the last quarter of 2009.
Other impacts of the recession include a decline in commodity prices and exports due to reduced global demand, a possibility of a shortfall in public revenue (National Treasury estimated a shortage of around R70 billion), capital outflows, which also have implications for exchange rates and the financing of current account deficits. Despite lower capital inflows, SA still managed to finance the deficit on the current account. The Rand has recovered considerably since late 2008, but as a result of the projected revenue shortfall SA has resorted to borrowing, thereby increasing the budget deficit as a percentage of GDP.
Monetary policy and fiscal stimulus packages that SA implemented since October 2008 have had little impact in averting the recession, but remain critical for stimulating the domestic economy in the short to medium-term period. The South African Reserve Bank (SARB) continued to cut interest rates by a cumulative 500 basis points between December 2008 and August 2009.
3.1 South Africa’s economic performance
The SA economy registered real GDP growth rate of 5.1 per cent in 2007. The continued deteriorating conditions in the global economy led to a decline of 3.1 per cent in real GDP growth rate in 2008, compared to an average annual growth rate of 5 per cent between 2004 and 2007. The economy was already in a cyclical downturn in 2008 as a result of tighter monetary policy.
The slump in economic activity in the last quarter of 2008 was caused mainly by a drop in consumer and business confidence, declining global demand, falling commodity prices, tighter domestic monetary policy and consequent stricter lending conditions by financial institutions.

WESTERN CAPE PROVINCIAL ECONOMIC REVIEW AND OUTLOOK 2009
16
In the second quarter of 2009, the quarter-on-quarter seasonally adjusted GDP growth rate contracted by 3.0 per cent following a contraction of 6.4 per cent in the first quarter. The deceleration in growth was more broad-based in the first and second quarters of 2009 than in the fourth quarter of 2008 where manufacturing was the main sector that contracted significantly.
The manufacturing and mining sectors were the most adversely affected by the recession in the first quarter of 2009 and contributed 3.3 and 1.7 percentage points, respectively, to the quarter-on-quarter GDP contraction of 6.4 per cent. Growth performance in the agriculture, wholesale and retail trade and finance and business services sectors also deteriorated.
In 2008, manufacturing, which is the second largest sector in the economy, registered GDP growth of only 1.2 per cent, down from 4.5 per cent in 2007. Weakening global demand, reduced domestic consumer expenditure, disruptions in electricity supply and relatively high input costs were the main factors that added to the slump in manufacturing activity. Manufacturing sub-sectors that were mainly affected were basic iron and steel, metal and metal products, motor vehicles, vehicle parts and other transport equipment subsectors. Growth in manufacturing activity contracted 10.9 per cent in the second quarter of 2009 after a slump of 22.1 per cent in the first quarter.
Overall, the seasonally adjusted Kagiso Purchasing Manager’s Index (PMI)3, a broad measure of manufacturing activity compiled by the Bureau for Economic Research (BER), improved slightly from a revised 45.9 in September 2009 to 47.6 in October 2009. The PMI shows that new sales orders have increased, while the purchasing managers are more optimistic (increased from 44.3 to 50.0 points), with the expected business conditions index expected to decrease slightly to 67.9 points over the following six month period, down from 70.3 points in September 2009. The employment index, a lagging indicator, rose from 42.0 points to 45.0 points between September 2009 and October 2009, indicating that the manufacturing sector was still shedding jobs, but at a slower rate. However, in the third quarter of 2009 alone, the sector shed 150 000 jobs, more than double the 71 000 jobs lost in the first half of 2009.
Mining production contracted by 6.5 per cent in 2008, after a zero growth performance in 2007, as global demand for platinum further plunged. In the first quarter of 2009, growth in mining contracted by 32.8 per cent but benefited from improved commodity prices in the second quarter, expanding by 5.5 per cent.
The civil construction sector, supported by investment in infrastructure, continued to bolster economic activity in 2008, albeit at a moderated pace (from 17.1 per cent in 2007 to 13.9 per cent in 2008). On a quarter-on-quarter basis, growth in construction activity accelerated from 10.8 per cent in the fourth quarter of 2008 to 14.7 per cent in the first quarter of 2009, supported by government’s significant infrastructure expenditure. However, the growth performance of this sector dropped to 12.2 per cent in the second quarter of 2009.
3 Purchasing Manager’s Index is a broad measure of factory output. A reading below 50 signifies a contraction. The index covers a spectrum of sub-indices including business activity, new sales orders, backlog of sales orders, inventories, purchasing commitments, expected business conditions, suppliers’ performances, prices and employment.

CHAPTER 1: ECONOMIC OUTLOOK 2009/10 – 2012/13
17
The agricultural sector gained momentum in 2008, growing by 18.8 per cent compared to a moderate growth rate of 2.9 per cent in 2007. This growth was the result of an increase in production of field crops, particularly maize and wheat, as well as raw milk. The high levels of production, in combination with lower prices, have led to a quarter-on-quarter seasonally adjusted contraction of the sector by 2.9 per cent and 17.1 per cent in the first and second quarters of 2009, respectively.
The wholesale and retail trade, hotels and restaurants sector is interest and exchange rate sensitive. This sector registered a negative growth rate of 4.5 per cent in the second quarter of 2009, its fifth consecutive fall. Job losses, falling incomes and high household debt levels would continue to weigh on the economy’s trade-related sectors. The motor industry, in particular, has been badly affected by a continued fall in global demand.
The construction, general government services and personal services sectors are the only sectors that showed positive performance in both the first and second quarters of 2009. The mining sector experienced positive growth in the second quarter.
3.2 South Africa’s responses to global economic crises
SA responses to the global financial and economic crises
Investment in public infrastructure
The Government has committed itself to a major public investment programme of approximately R787 billion over the medium term to March 2012 as one of the responses to the global crises. These funds are also expected to stimulate growth while creating much-needed jobs. These investments are expected to stimulate private job creating investments. Public investments would also be prioritised and funds would be raised from development finance institutions such as the Industrial Development Corporation (IDC), Development Bank of Southern Africa (DBSA) etc. Infrastructure spending increased rapidly, supported by government guaranteed borrowing of state enterprises. Gross Fixed Capital Formation (GFCF) by the public sector has increased from 5.9 per cent of GDP in 2007 to 9.4 per cent in 2009. The programme has helped to sustain much needed jobs and investment during the recession.
Macroeconomic policy
Fiscal and monetary policies are necessary to address the crises. The interest rate should be used aggressively as a monetary policy tool to stimulate the economy and demand and lower the cost of capital. The National budget tabled in February 2009, partly addressed some of the issues. The South African Government supports faster economic recovery through fiscal and monetary measures while avoiding the build-up of unsustainable debt. According to the national MTBPS 2009, SAs fiscal adjustment to the global economic crisis is quite significant, rising from a deficit of 1 per cent of GDP in 2008/09 to an expected deficit of 7.6 per cent of GDP in the 2009/10 financial year. Fiscal and monetary policies remained expansionary in the midst of the recession and are likely to remain so as long as is necessary.
Industrial and trade policy
The Government aims to help vulnerable sectors that have significant employment and labour intensity through the provision of rescue packages. These are sectors such as textile, clothing and footwear, mining and automotive and capital equipment sectors. The National Jobs Initiative will coordinate and accelerate financing to sectors facing job losses. As such, the IDC intends to make greater investment in vulnerable sectors, while social partners will encourage local procurement of supplies, services etc. to maintain and increase local output and employment levels. The “buy local” policy should be followed for the Confederations Cup and 2010 FIFA World Cup.
WESTERN CAPE PROVINCIAL ECONOMIC REVIEW AND OUTLOOK 2009
18
Employment measures
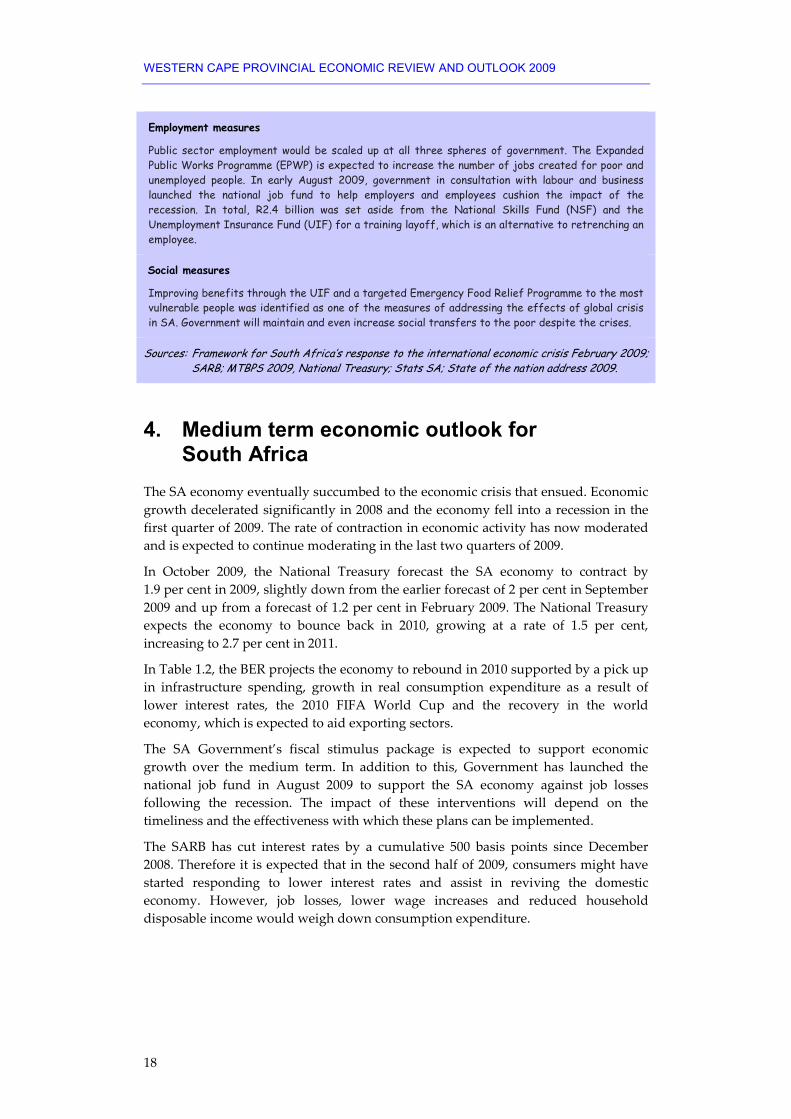
Public sector employment would be scaled up at all three spheres of government. The Expanded Public Works Programme (EPWP) is expected to increase the number of jobs created for poor and unemployed people. In early August 2009, government in consultation with labour and business launched the national job fund to help employers and employees cushion the impact of the recession. In total, R2.4 billion was set aside from the National Skills Fund (NSF) and the Unemployment Insurance Fund (UIF) for a training layoff, which is an alternative to retrenching an employee.
Social measures
Improving benefits through the UIF and a targeted Emergency Food Relief Programme to the most vulnerable people was identified as one of the measures of addressing the effects of global crisis in SA. Government will maintain and even increase social transfers to the poor despite the crises.
Sources: Framework for South Africa’s response to the international economic crisis February 2009; SARB; MTBPS 2009, National Treasury; Stats SA; State of the nation address 2009.
4. Medium term economic outlook for South Africa
The SA economy eventually succumbed to the economic crisis that ensued. Economic growth decelerated significantly in 2008 and the economy fell into a recession in the first quarter of 2009. The rate of contraction in economic activity has now moderated and is expected to continue moderating in the last two quarters of 2009.
In October 2009, the National Treasury forecast the SA economy to contract by 1.9 per cent in 2009, slightly down from the earlier forecast of 2 per cent in September 2009 and up from a forecast of 1.2 per cent in February 2009. The National Treasury expects the economy to bounce back in 2010, growing at a rate of 1.5 per cent, increasing to 2.7 per cent in 2011.
In Table 1.2, the BER projects the economy to rebound in 2010 supported by a pick up in infrastructure spending, growth in real consumption expenditure as a result of lower interest rates, the 2010 FIFA World Cup and the recovery in the world economy, which is expected to aid exporting sectors.
The SA Government’s fiscal stimulus package is expected to support economic growth over the medium term. In addition to this, Government has launched the national job fund in August 2009 to support the SA economy against job losses following the recession. The impact of these interventions will depend on the timeliness and the effectiveness with which these plans can be implemented.
The SARB has cut interest rates by a cumulative 500 basis points since December 2008. Therefore it is expected that in the second half of 2009, consumers might have started responding to lower interest rates and assist in reviving the domestic economy. However, job losses, lower wage increases and reduced household disposable income would weigh down consumption expenditure.

CHAPTER 1: ECONOMIC OUTLOOK 2009/10 – 2012/13
19
Table 1.2 Economic outlook for South Africa, growth in GDP (%), 2009 to 2012
Actual Projections Projections 2007 2008 2009f 2010f 2011f 2012f Real GDP growth (real y-o-y %)
Final household consumption expenditure 6.6 2.3 -2.9 3.0 4.2 4.3
Government consumption expenditure 4.9 5.0 4.4 4.3 4.2 4.2
Gross fixed capital formation 16.3 10.2 1.6 -0.2 2.2 8.6
Real GDE 6.1 3.1 -2.0 4.5 4.2 5.2
Total exports 7.7 1.7 -19.6 4.2 6.8 5.2
Total imports 10.6 2.2 -16.4 10.3 7.6 7.6
Real GDP 5.1 3.1 -1.7 2.7 3.7 4.4 Inflation (annual averages)
CPI (Headline) 7.1 11.5 7.1 5.7 5.4 5.5
PPI (All items) 11.0 14.3 0.4 6.5 6.7 5.1
Exchange rates (annual averages)
R/US$ 7.05 8.26 8.44 8.28 8.65 9.09
R/Euro 9.65 12.06 11.65 11.71 12.38 13.27
R/Pound sterling 14.12 15.12 13.17 13.63 14.44 16.36
Source: Bureau for Economic Research, October 2009
4.1 Final household consumption expenditure
After proving to be the mainstay of the SA economy between 2004 and 2007, Final Household Consumption Expenditure (FHCE) lost momentum in 2008. Higher food and petrol prices, relatively higher interest rates emanating from the tighter monetary policy stance in 2008 and the impact of the National Credit Act (NCA) implemented in June 2007 contributed to the overall decline. All these factors led to high levels of household debt, a decline in consumer confidence and less disposable income.
Table 1.2 shows that growth in FHCE dipped to 2.3 per cent (year-on-year) in 2008 from 6.6 per cent in 2007. Real spending on durable goods contracted by 5.2 per cent in 2008 compared to an increase of 4.7 per cent in 2007. The rate of decline in real FHCE accelerated from 4.8 per cent (seasonally adjusted annualised rate) in the first quarter of 2009 to 5.8 per cent in the second quarter.
According to the BER, growth in FHCE is estimated to average –2.9 per cent in 2009 before it bounces back to growth of 3.0 per cent in 2010, assuming lower interest rates would kick start consumer spending as it often takes up to 18 months for interest rate cuts to take effect in the real economy. The National Treasury projects growth in FHCE to contract by 3.1 per cent in 2009 and a slight recovery of 0.9 per cent in 2010.
Consistent with consumer spending and disposable income trends, the FNB/BER Consumer Confidence Index (CCI) decreased slightly by 3 index points (from +4 to +1) in the third quarter of 2009, a confidence level that can be described as neutral. Consumers expect the economic performance and their own finances to be better in 12 months time, backed mainly by recent interest rate cuts, but remain cautious and consider the current time inappropriate to purchase durable goods. Recovery in consumer spending is likely to be slow, even if household income starts to improve.
WESTERN CAPE PROVINCIAL ECONOMIC REVIEW AND OUTLOOK 2009
20
4.2 Gross Fixed Capital Formation
Main drivers of growth in Gross Fixed Capital Formation (GFCF) includes public sector investments such as for the 2010 FIFA World Cup, Eskom’s investment in upgrading existing electricity supply and its capacity expansion plans.
In 2008, public corporations increased spending on GFCF by 30 per cent in a bid to improve power supply and public transport capacity. This led to an average growth of 10.2 per cent in GFCF in 2008. As a ratio of GDP, GFCF measured 22.8 per cent in 2008 compared to 15.3 per cent in 2001. Growth in real GFCF slowed further to 0.1 per cent (seasonally adjusted annualised rate) in the second quarter of 2009 after decelerating to 12.7 per cent in the first quarter.
The BER forecasts growth in GFCF to decline considerably to 1.6 per cent (year-on-year) in 2009 and contract by 0.2 per cent in 2010. This prediction is based on the impact of the domestic economic recession and the uncertainties regarding the timing of global economic recovery and the depth of the recession. The National Treasury expects growth in GFCF to decline to 3.5 per cent in 2009 and to increase slightly to 4.4 per cent in 2010.
Historically low business and consumer confidence led to delays of capital expansion programmes and postponement of new expansion projects in SA. Decreased global demand, domestic recession and the decline in commodity prices substantiated these decisions.
The RMB/BER Business Confidence Index (BCI) registered 33 points in the fourth quarter of 2008 after a reading of 67 in the fourth quarter of 2007. In the third quarter of 2009, the index declined further to 23 points from 27 points in the first quarter. Compared to the second quarter, business confidence stabilised in the building and construction sector (+1) in the third quarter of 2009, improved in motor trade (+7) and manufacturing (+11) sectors but the wholesale (-19) and retail sectors (-12) declined. Overall, the decline in business confidence was marginal but could also indicate worsening economic activity.
4.3 Balance of payments and Rand exchange rates outlook
Developments in the global economy have had an adverse effect on SA’s Balance of Payments (BoP) in 2008, particularly in the second half of the year. SA’s main trading partners’, Europe and the US, experienced a sharp contraction in real output growth. This led to weaker export performance. However, a dramatic decline in international energy prices and reduced demand for imported manufactured goods helped cushion SA prices.
The trade deficit amounted to R35.6 billion in 2008 compared to a deficit of R40.5 billion in 2007. The deficit on the current account of the BoP expanded from R146 billion in 2007 to R169.2 billion in 2008. Expressed as a percentage of GDP, the current account deficit declined marginally to 7.0 per cent in the first quarter of 2009 after recording 7.4 per cent for 2008. The National Treasury predicts the current account deficit to average 4.9 per cent as a percentage of GDP in 2009 and 5.7 per cent in 2010.

CHAPTER 1: ECONOMIC OUTLOOK 2009/10 – 2012/13
21
SA exports might pick up momentum backed by signs of a moderating decline in global economic activity, stronger demand and stronger commodity prices. More recently, commodity prices have rebounded strongly in a more broad-based manner reflecting improved market sentiment.
The Rand exchange rate was highly volatile in 2008 as the global financial and economic crises in developed countries intensified. In 2008, the weighted average exchange rate of the Rand depreciated by 23.5 per cent compared to a decrease of 3.9 per cent in 2007. This was underpinned mainly by the deterioration in the prices of export commodities and continued investors’ risk aversion to emerging markets.
The Rand has appreciated by approximately 20 per cent since the beginning of 2009 on a trade-weighted basis. This could be attributed to stronger capital inflows, following improved investor sentiment towards emerging markets, and increased commodity prices. In October 2009, the Rand regained its strength and was hovering around levels of R7.79 on the back of a weaker US Dollar.
The BER projects the exchange rate to depreciate to R8.44 per US dollar on average in 2009 and to recover slightly to R8.28 per US dollar in 2010. It is also projected that the Rand would appreciate against the Euro to average R11.65 and R11.71 in 2009 and 2010, respectively. This follows uncertainties around the outlook for international capital flows to emerging markets and the expectation that the US dollar would remain strong over the short term and weaken over the medium term.
It is also expected that SA will comfortably finance the current account deficit, since the expected benefits of a reduced imports bill would offset the reduced demand for exports.
4.4 Inflation and interest rate outlook
Developments in the global economy, most of which were beyond the control of the SARB, rendered the inflation targeting policy ineffective in maintaining the inflation rate within the targeted range of 3 to 6 per cent since March 2007.
CPIX inflation reached a high of 13.7 per cent in August 2008 and has remained outside the target range since March 2007 when it measured 6.1 per cent. For the year 2008, CPIX inflation measured 11.5 per cent compared to 7.1 per cent in 2007. The main drivers of highly volatile inflation figures since 2007 were international prices of food and oil.
International oil prices have dropped significantly from a peak of US$147 per barrel in July 2008, reached a low of US$35 per barrel in November 2008, before accelerating again to US$79 per barrel in mid-October 2009. These fluctuations in the level of oil prices in 2008 were mainly driven by speculation and supply-related reasons. The recent increase in the energy prices can be attributed to higher equity markets, the weaker dollar, signs that demand was rising in India and China, rising confidence in the US economy and generally improved global growth prospects.
Stats SA has discontinued the calculation and publication of CPIX inflation subsequent to the announcement by Government that the new CPI inflation will replace the CPIX as the official target consumer inflation measure with effect from January 2009 (see text box).

WESTERN CAPE PROVINCIAL ECONOMIC REVIEW AND OUTLOOK 2009
22
The Headline CPI inflation decelerated to 6.1 per cent in September 2009 after recording a year-on-year inflation rate of 8.4 per cent in April 2009. The slump in global economic activity helped ease the pressure on global and domestic inflation as commodity prices fell in the second half of 2008.
The Headline Producer Price Index (PPI) inflation contracted considerably from a high of 19.8 per cent in August 2008 to a year-on-year rate of 3.7 per cent in September 2009, its fifth consecutive fall. The deceleration in 2008 could be attributed to lower farm prices, particularly prices of wheat and maize and might lower the double-digit food prices by August/September 2009. Input costs of vegetables, weather related factors and the sharp drop in commodity prices are some of the reasons that kept food inflation high. Even though Headline PPI inflation is a lagging indicator of economic growth, this deflation indicates that there is practically little or no demand in the domestic and global economy.
According to the BER forecasts, Headline CPI inflation would average 7.1 per cent in 2009. Inflation is forecast to revert to the target band in 2010, averaging 5.7 per cent. The forecast factors in an increase in Eskom’s electricity tariff rates roughly in line with the 2009 increase (31.1 per cent) for 2010. Consistent with the BER 2009 forecast, the National Treasury forecasts headline CPI inflation of 7.1 per cent in 2009 and 6.3 per cent in 2010. The National Treasury forecasts assume an electricity price hike of 35 per cent over each of the next three years. The SARB also expects headline CPI inflation to revert back to the target band in the second quarter of 2010, without taking into account Eskom’s proposed price increases of 45 per cent per annum for the next three years.
4.5 Developments in Headline Consumer Price Index
Developments in Consumer Price Index
Why the change?
Stats SA aligned itself with international best practice of the International Labour Organisation (ILO) guidelines in developing a new CPI basket and weights in 2005/06. Essentially, this meant rebasing, reweighting and adapting a new basket using alternative methods. As such, the new basket is based on the Classification of Individual Consumption by Purpose (COICOP), which is an international norm for classifying items in CPI baskets. The CPI basket and weights were derived from the 2005/06 Income and Expenditure Survey (IES).
The periodic revision of the consumer basket is necessary to keep up to date with developments in consumer preferences and to ensure that the basket is representative of what the majority of SA consumers purchase. Technologies advance and expenditure patterns change in response to socio-economic expectations and aspirations. For instance, cellular communication, computer hardware and software, DVD’s and compact disk players are more important now for monitoring the economy than ten years ago.
What are the differences?
In developing the new CPI, field teams were used to collect prices from retail stores rather than the stores themselves providing information. Items such as hotel and restaurant prices, minibus taxi fares, sporting events and house rentals were collected for the first time. The new CPI basket now reflects changes experienced by SA consumers regarding technology and taste. Products and services have been identified for inclusion based on total expenditure on an item and the number of households that buy the item.
CHAPTER 1: ECONOMIC OUTLOOK 2009/10 – 2012/13
23
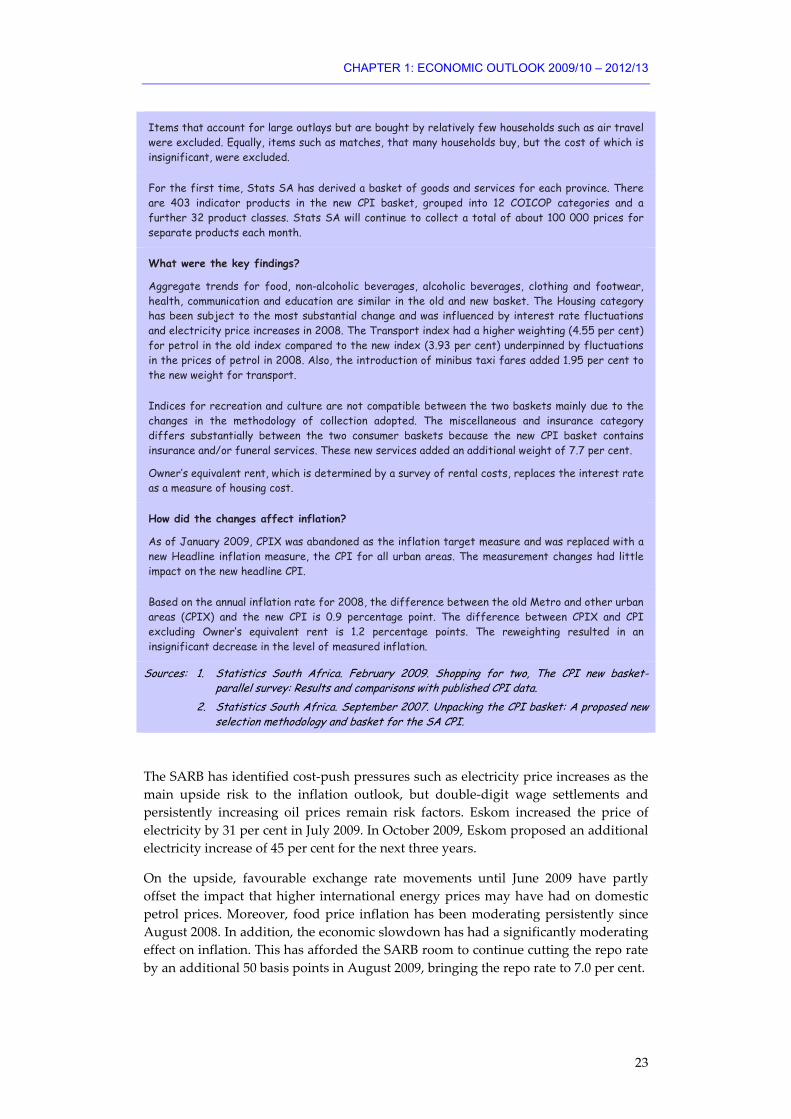
Items that account for large outlays but are bought by relatively few households such as air travel were excluded. Equally, items such as matches, that many households buy, but the cost of which is insignificant, were excluded.
For the first time, Stats SA has derived a basket of goods and services for each province. There are 403 indicator products in the new CPI basket, grouped into 12 COICOP categories and a further 32 product classes. Stats SA will continue to collect a total of about 100 000 prices for separate products each month.
What were the key findings?
Aggregate trends for food, non-alcoholic beverages, alcoholic beverages, clothing and footwear, health, communication and education are similar in the old and new basket. The Housing category has been subject to the most substantial change and was influenced by interest rate fluctuations and electricity price increases in 2008. The Transport index had a higher weighting (4.55 per cent) for petrol in the old index compared to the new index (3.93 per cent) underpinned by fluctuations in the prices of petrol in 2008. Also, the introduction of minibus taxi fares added 1.95 per cent to the new weight for transport.
Indices for recreation and culture are not compatible between the two baskets mainly due to the changes in the methodology of collection adopted. The miscellaneous and insurance category differs substantially between the two consumer baskets because the new CPI basket contains insurance and/or funeral services. These new services added an additional weight of 7.7 per cent.
Owner’s equivalent rent, which is determined by a survey of rental costs, replaces the interest rate as a measure of housing cost.
How did the changes affect inflation?
As of January 2009, CPIX was abandoned as the inflation target measure and was replaced with a new Headline inflation measure, the CPI for all urban areas. The measurement changes had little impact on the new headline CPI.
Based on the annual inflation rate for 2008, the difference between the old Metro and other urban areas (CPIX) and the new CPI is 0.9 percentage point. The difference between CPIX and CPI excluding Owner’s equivalent rent is 1.2 percentage points. The reweighting resulted in an insignificant decrease in the level of measured inflation.
Sources: 1. Statistics South Africa. February 2009. Shopping for two, The CPI new basket-parallel survey: Results and comparisons with published CPI data.
2. Statistics South Africa. September 2007. Unpacking the CPI basket: A proposed new selection methodology and basket for the SA CPI.
The SARB has identified cost-push pressures such as electricity price increases as the main upside risk to the inflation outlook, but double-digit wage settlements and persistently increasing oil prices remain risk factors. Eskom increased the price of electricity by 31 per cent in July 2009. In October 2009, Eskom proposed an additional electricity increase of 45 per cent for the next three years.
On the upside, favourable exchange rate movements until June 2009 have partly offset the impact that higher international energy prices may have had on domestic petrol prices. Moreover, food price inflation has been moderating persistently since August 2008. In addition, the economic slowdown has had a significantly moderating effect on inflation. This has afforded the SARB room to continue cutting the repo rate by an additional 50 basis points in August 2009, bringing the repo rate to 7.0 per cent.

WESTERN CAPE PROVINCIAL ECONOMIC REVIEW AND OUTLOOK 2009
24
Worsening domestic economic conditions and the fact that SA is lagging the global recovery, motivated the last interest rate cut. The SARB left interest rates constant in October 2009 because of the Bank’s view that the risks to the inflation outlook have moderated and are fairly evenly balanced.
4.6 How soon can the SA economy bounce back from the recession?
Recovery in the SA economy largely depends on the rate at which the global economy bounces back, which is expected to be slow. The general view is that globally, the worst is probably over and that economic recovery is possible starting from later in 2009, albeit at a slow rate. Therefore, given the latest domestic and international economic developments, it can be deduced that the short-term outlook for the SA economy remains gloomy but recovery is highly likely in the last quarter of 2009.
There are some positive indications that the rate of contraction of the domestic economy has declined and that the economy may emerge from the recession by the end of 2009. However, the mixed picture from the published data shows that the recovery is likely to be uncertain and slow.
The composite leading business cycle indicator, compiled by the SARB, signals the growth outlook 6 to 12 months ahead and it increased to 112.5 in August 2009 from 106.3 in April 2009.
The Stats SA Quarterly LFS showed that between the second and third quarter of 2009 alone, the economy shed 484 000 jobs. A total of 770 000 jobs were shed between the third quarter 2008 and the third quarter 2009. This is an indication that demand might take time to pick up despite the interest rate cuts.
According to the National Treasury, the SA economy might have started rebounding in the third quarter of 2009 backed by improving global conditions, expansionary fiscal policy, lower rates of inflation and resilient commodity prices.
5. Western Cape economic review and outlook The national Government has identified speeding up growth as a priority area in its Medium Term Strategic Framework. The Western Cape similarly prioritises increasing economic opportunity and reducing poverty. In light of the current economic situation, policy implications are considered and discussed.
5.1 Performance of the Western Cape economy
The impact of the global economic crisis significantly compounded the national cyclical economic slowdown already in motion during 2008 (as a result of higher interest rates given significant inflation pressure). The South African economy officially entered into economic recession in the first quarter of 2009, resulting in significant downward revisions for the short-term domestic economic outlook.

CHAPTER 1: ECONOMIC OUTLOOK 2009/10 – 2012/13
25
Indications are that the Western Cape economy was affected to a lesser extent, however the regional economic growth prospect for 2009 is rather bleak.
Initially, economic performance remained resilient at the onset of the financial crisis in 2007. The most recent regional gross domestic product (GDP-R)4 statistics for the Western Cape indicate that the Province again posted an above-average growth rate in real output of 5.8 per cent in 2007 whereas South African GDP growth averaged 5.1 per cent5.. In 2008, the economic environment proved to be more challenging.
According to Quantec Research estimates, the Western Cape economy continued to outperform the national economy in 2008: growth is estimated at 3.5 per cent for the Western Cape with the South African figure6 slightly lower at 3.1 per cent for the same year. The Western Cape GDP-R (at basic prices) in 2008 is estimated to be R174.1 billion (measured in 2 000 constant prices).
In line with the global and national projections, the 2009 and 2010 growth forecasts for the Province have been revised downwards. The downgrading of the Province’s growth projections presents a subdued regional short-term outlook with many sectors experiencing a decline in GDP-R in 2009.
The most recent forecast provided by Quantec Research and the BER indicate that the Western Cape economy will contract by 1.0 per cent in 2009 compared to an expected contraction of 1.7 per cent for the national economy. The main reasons for a somewhat less pronounced decline in regional growth include the relative resilience in the Province’s manufacturing sector, the limited share of mining in regional activity, as well as the positive impact of a growing agricultural sector (which comprises a relatively large part of regional activity). However, the contraction in output is expected to turn around in 2010, albeit at a slow pace. The provincial economy is expected to expand in line with the national economy at a rate of 2.6 per cent in 2010.
These projections are significantly lower than those provided in February 2009, when Western Cape GDP-R was projected to increase by 1.7 and 3.7 per cent in 2009 and 2010, respectively.
Moderate improvements in the trend are projected from 2011 onwards (see Table 1.3). However, the medium-term outlook contains notable risks given the uncertainty regarding the strength of the global recovery.
4 GDP-R is defined as the real value of the final goods and services produced within particular region in a period of a year.
5 SA figures is for GDP at market prices (official) while the GDP-R for Western Cape is for GDP at basic prices.
6 SA figures are official, but Western Cape’s estimated.
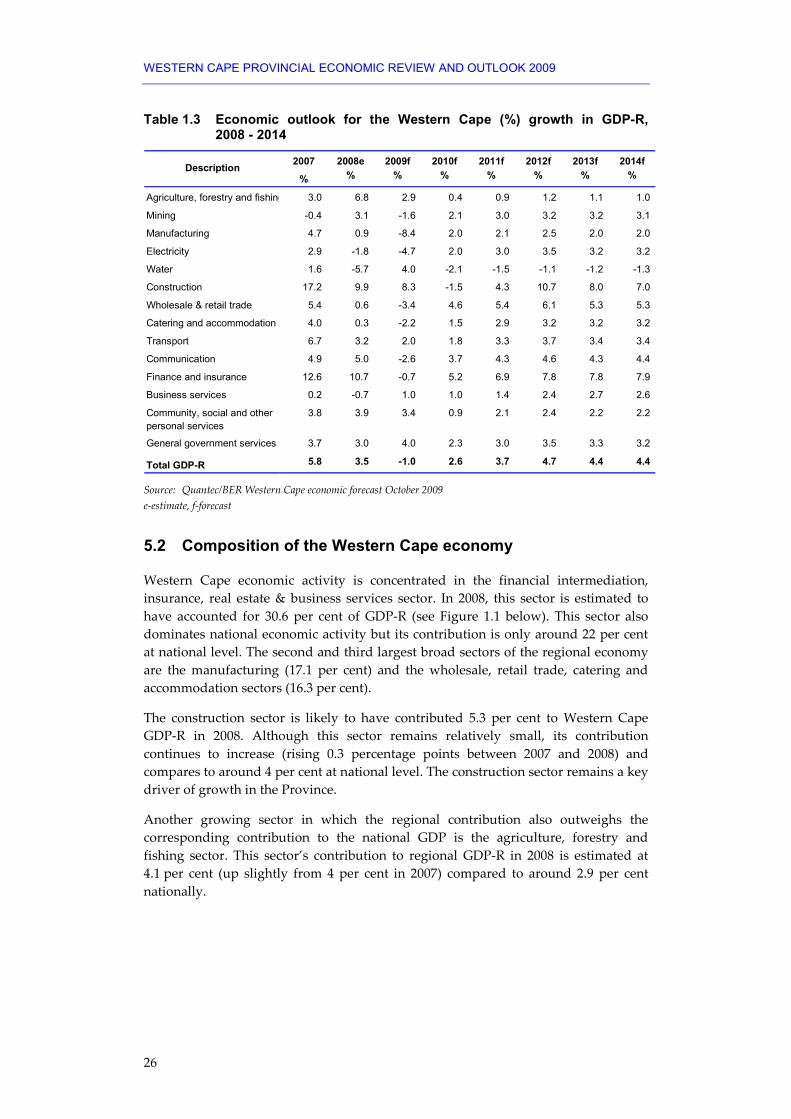
WESTERN CAPE PROVINCIAL ECONOMIC REVIEW AND OUTLOOK 2009
26
Table 1.3 Economic outlook for the Western Cape (%) growth in GDP-R, 2008 - 2014
2007 2008e 2009f 2010f 2011f 2012f 2013f 2014f
% % % % % % % %
Agriculture, forestry and fishing 3.0 6.8 2.9 0.4 0.9 1.2 1.1 1.0
Mining -0.4 3.1 -1.6 2.1 3.0 3.2 3.2 3.1
Manufacturing 4.7 0.9 -8.4 2.0 2.1 2.5 2.0 2.0
Electricity 2.9 -1.8 -4.7 2.0 3.0 3.5 3.2 3.2
Water 1.6 -5.7 4.0 -2.1 -1.5 -1.1 -1.2 -1.3
Construction 17.2 9.9 8.3 -1.5 4.3 10.7 8.0 7.0
Wholesale & retail trade 5.4 0.6 -3.4 4.6 5.4 6.1 5.3 5.3
Catering and accommodation 4.0 0.3 -2.2 1.5 2.9 3.2 3.2 3.2
Transport 6.7 3.2 2.0 1.8 3.3 3.7 3.4 3.4
Communication 4.9 5.0 -2.6 3.7 4.3 4.6 4.3 4.4
Finance and insurance 12.6 10.7 -0.7 5.2 6.9 7.8 7.8 7.9
Business services 0.2 -0.7 1.0 1.0 1.4 2.4 2.7 2.6
Community, social and other personal services
3.8 3.9 3.4 0.9 2.1 2.4 2.2 2.2
General government services 3.7 3.0 4.0 2.3 3.0 3.5 3.3 3.2
Total GDP-R 5.8 3.5 -1.0 2.6 3.7 4.7 4.4 4.4
Description
Source: Quantec/BER Western Cape economic forecast October 2009 e-estimate, f-forecast
5.2 Composition of the Western Cape economy
Western Cape economic activity is concentrated in the financial intermediation, insurance, real estate & business services sector. In 2008, this sector is estimated to have accounted for 30.6 per cent of GDP-R (see Figure 1.1 below). This sector also dominates national economic activity but its contribution is only around 22 per cent at national level. The second and third largest broad sectors of the regional economy are the manufacturing (17.1 per cent) and the wholesale, retail trade, catering and accommodation sectors (16.3 per cent).
The construction sector is likely to have contributed 5.3 per cent to Western Cape GDP-R in 2008. Although this sector remains relatively small, its contribution continues to increase (rising 0.3 percentage points between 2007 and 2008) and compares to around 4 per cent at national level. The construction sector remains a key driver of growth in the Province.
Another growing sector in which the regional contribution also outweighs the corresponding contribution to the national GDP is the agriculture, forestry and fishing sector. This sector’s contribution to regional GDP-R in 2008 is estimated at 4.1 per cent (up slightly from 4 per cent in 2007) compared to around 2.9 per cent nationally.

CHAPTER 1: ECONOMIC OUTLOOK 2009/10 – 2012/13
27
Figure 1.1 Sectoral contribution to Western Cape GDP-R (%), 2008
Agriculture, forestry & fishing4.1%
Manufacturing17.1%
Construction5.3%
Wholesale & retail trade, catering & accommodation
services16.3%
Transport & storage & communication
11.0%
Mining & quarrying0.2%
Financial intermediation,
insurance, real estate & business services
30.6%
Community, social & personal services
4.8%
General government9.0%
Electricity, gas & water1.5%
Source: Provincial Treasury calculations based on Quantec estimates, 2009
5.3 Performance of the Western Cape sectors
This sub-section highlights the performance of the major sectors in the Western Cape economy as well as the medium-term outlook for these sectors during 2009 – 2014. The analysis broadly covers the manufacturing sector, agriculture, forestry and fishing, construction and tertiary industries such as finance and business services.
5.3.1 Manufacturing sector
The manufacturing sector is a key contributor to economic activity in the Western Cape. As noted earlier, the sector is likely to have constituted 17.1 per cent of the Western Cape GDP-R in 2008. The sector has been identified through the Micro Economic Development Strategy (MEDS) as having the capacity to absorb a significant portion of the excess supply of unskilled and semi-skilled labour in the Western Cape.

WESTERN CAPE PROVINCIAL ECONOMIC REVIEW AND OUTLOOK 2009
28
However, the regional manufacturing sector has historically underperformed relative to the national trend. Growth in the manufacturing sector is estimated at 0.9 per cent for 2008, compared to 1.2 per cent for the national manufacturing sector. The economic crisis resulted in a dramatic contraction in the manufacturing sector at a national level in the first quarter of 2009. Evidence suggests that Western Cape manufacturers have been somewhat shielded from the effects of the global economic crisis, mostly due to the composition of production activity. Regional manufacturing activity is projected to contract by 8.4 per cent, compared to a contraction of 15.5 per cent for the country.
The BER Manufacturing Survey revealed that business confidence amongst Western Cape manufacturers was consistently higher from the third quarter of 2008 (see Table 1.4). Furthermore, the same trend emerged from the survey data on production volumes with the BER Manufacturing Survey showing that contraction in regional production has been significantly less pronounced during the first half of 2009 than in the rest of South Africa.
Table 1.4 Confidence index data for the Western Cape versus National indices
2008 Q1
2008 Q2
2008 Q3
2008 Q4
2009 Q1
2009 Q2
WC Manufacturing 22 18 31 39 35 24
RSA Manufacturing 46 37 30 31 16 11
Source: Bureau for Economic Research
Manufacturers of consumer goods made up the largest share of production activity in the Province: according to the latest GDP-R figures as released by Stats SA producers of food, beverages and tobacco contributed 25 per cent to regional manufacturing volumes in 2007 and Quantec Research estimates this figure at 24.8 per cent in 2008 (see Figure 1.2). These producers are only at 14.8 per cent of manufacturing activity at national level in 2008. The disproportional representation in the Western Cape seems to be one of the main reasons why regional production outperformed national production so far this year. The relative success of these producers in weathering the economic turbulence lies therein that it is a less cyclical industry.
Other prominent manufacturing sub-sectors include the petroleum products, chemicals, rubber and plastic industries (20.4 per cent of manufacturing output), the production of metals, metal products, machinery and equipment (13.8 per cent), wood and paper, publishing and printing (11.1 per cent) as well as furniture and other manufacturing (10.9 per cent).

CHAPTER 1: ECONOMIC OUTLOOK 2009/10 – 2012/13
29
Figure 1.2 Composition of the Western Cape manufacturing sector, 2008
Food, beverages and tobacco 24.8%Textiles, clothing and
leather goods 6.2%
Wood, paper,publishing and printing
11.1%
Petroleum products, chemicals, rubber and
plastic 20.4%
Other non-metal mineral products
2.9%
Metals, metal products, machinery and
equipment 13.8%
Electrical machinery and apparatus
2.3%Radio, TV,
instruments,watches and clocks
1.0%
Transport equipment 6.6%
Furniture and other manufacturing
10.9%
Source: Provincial Treasury calculations based on the Quantec estimates, 2009
The outlook beyond 2009 remains uncertain given the global economic situation, but growth in the sector should recover in 2010 (currently estimated at 2.0 per cent). Risks to the outlook include a stronger Rand exchange rate, which may hamper provincial exports and growth.
5.3.2 Agriculture, forestry and fishing
Real value added in the Western Cape agricultural, forestry and fishing sector is estimated to have posted a strong increase in 2008 (6.8 per cent). Growth in the sector is expected to come in at 2.9 per cent in 2009.
The medium-term outlook for the sector remains one of muted growth of about 0.9 per cent between 2010 and 2014. The sector’s performance can be quite volatile (owing to unpredictable factors like weather conditions). Growth was 6.3 per cent in 2005, -4.5 per cent in 2006 and recovered to 3 per cent in 2007. The difficulties experienced by the sector have been compounded by the global economic crisis. However, the impact on different agricultural sub-sectors has not been uniform with export intensive industries being more affected than others. As with the manufacturing sector, the performance is of concern as the implications are potential job losses and reduced opportunities for unskilled labour to participate in the mainstream economy.
Chapter 3 provides a more in depth analysis of the state of the agricultural sector.

WESTERN CAPE PROVINCIAL ECONOMIC REVIEW AND OUTLOOK 2009
30
5.3.3 Construction
Since 2003, the construction sector has been an important driver of economic growth in the Western Cape. More recently the preparations for 2010 FIFA World Cup have also given momentum to infrastructure development. The construction sector has continually increased in terms of its contribution to the Western Cape GDP-R from 3.7 per cent in 2003 to 5.3 per cent (estimate) in 2008. The sector has achieved impressive growth rates in recent years (14.1 per cent in 2006 and 17.2 per cent in 2007) and is estimated to have grown at a rate of 9.9 per cent in 2008. The projected slowdown in growth can be attributed to the sharp downturn in residential building activity resulting from tighter lending conditions, the introduction of the National Credit Act and high levels of household debt coupled with falling property prices. The low business confidence environment has also impacted on the sector.
Growth in the construction sector is projected at 8.3 per cent for 2009 and 5.7 per cent on average between 2010 and 2014. The construction sector is expected to remain a key driver of economic growth in the Province.
5.3.4 Wholesale and retail trade, catering and accommodation
Growth in the Western Cape wholesale and retail trade, catering and accommodation sectors is estimated to have slowed notably in 2008. Real output growth is projected to decelerate from 5.4 and 4.0 per cent in 2007 to 0.6 and 0.3 per cent in the wholesale and retail trade and catering and accommodation sectors respectively. These declines could be related to the less accommodative monetary policy, inflationary pressures, tightness of credit extension on the part of domestic banks and the drop in consumer confidence.
Medium term projections have also been downgraded since 2008 (in line with the national outlook) and declines in GDP-R are projected for wholesale and retail trade (-3.4 per cent) and catering and accommodation (-2.2 per cent) in 2009. Although projections for 2010 are lower than before, growth in these sectors is anticipated to accelerate in 2010. Consumption spending resulting from 2010 FIFA World Cup is expected to boost growth in this sector.
5.3.5 Finance and insurance, business services
The performance of the Western Cape is strongly dependent on the performance of the finance and insurance and business services sectors. These two sectors dominate the Western Cape economy, constituting nearly one third of the Province’s economic output in 2008 (estimate). Their future performance is likely to play a big role in how the provincial economy fares in the future.
According to the BER, the Ernst and Young Financial Services Survey indicates that the unfavourable effect of the global financial crisis on the life insurance and investment management industries, which dominate in the Western Cape, has been evident since the second half of 2008. However, data for the first quarters of 2009 show that confidence in these two sub-sectors have already moved above that of the overall industry. The increased confidence is partly due to declines in risk aversion and recovered net inflows.

CHAPTER 1: ECONOMIC OUTLOOK 2009/10 – 2012/13
31
Growth in the business services sector is estimated to have slowed down significantly in 2008 and is projected at 1 per cent in 2009. The finance and insurance sector is forecast to contract slightly in 2009, before recovering in 2010. Factors impacting on these sectors are primarily the tightening of monetary policy, the impact of the National Credit Act, the sharp fall in asset values and the uncertain effects of the global economic crisis and current recessionary environment. While growth in the finance and insurance sector is expected to recover strongly from 2010 onwards, it is expected to remain restrained in the business services sector.
5.3.6 Investment in infrastructure: A key to economic growth
Infrastructure is regarded as one of the key levers in boosting economic growth potential. A robust fixed investment base is required to avoid inadequate infrastructure limiting the use of productive capital and a region’s economic growth potential. Public infrastructure plays a pivotal role in alleviating poverty through investment in roads, schools, health facilities and water and electricity thereby improving access to economic and social infrastructure.
Investing in infrastructure also remains a high priority for Government. National government has planned a major public investment programme of approximately R787 billion over the medium term to March 2012 as a response to the global financial and economic crisis. This sub-section highlights the contribution to infrastructure spending by the provincial government in terms of total provincial infrastructure payments and estimates for the current medium term expenditure framework (MTEF).
From a public infrastructure perspective, infrastructure funds are spent on capital projects and maintenance and repairs of the assets government owns. Capital projects consist of new and replacement assets; upgrades and additions; rehabilitation, renovations and refurbishments and other capital projects. The Western Cape has allocated approximately 79 per cent of its infrastructure spend in 2009/10 to capital projects, reflecting an increase from previous years. The total infrastructure budget for 2009/10 to 2011/12 amounts to R9.247 billion, the most of which is allocated to the Departments of Transport and Public Works, Health and Education. The allocation includes provision for major infrastructure projects such as the upgrade of the Koeberg Interchange and the construction of the new Khayelitsha and Mitchell’s Plain Hospitals.

WESTERN CAPE PROVINCIAL ECONOMIC REVIEW AND OUTLOOK 2009
32
Figure 1.3 Provincial infrastructure payments (R’million), 2005/06 - 2011/12
500
1 000
1 500
2 000
2 500
3 000
3 500
Maintenance and repairs 401 550 562 606 616 776 878
Capital projects 1 336 1 646 1 665 2 413 2 311 2 240 2 426
2005/06 2006/07 2007/08 2008/09 2009/10 2010/11 2011/12
Source: Western Cape Provincial Government Budget Overview, 2009
5.4 Trend in Western Cape exports
This section examines the composition and destination of Western Cape exports. It also considers the historical growth trends of exports to the rest of the world.
Table 1.5 Trends in Western Cape exports to the rest of the world (R’million at 2000 constant prices)
Export goods 2003 2004 2005 2006 2007 2008
% share of total exports
2008
Average annual growth rate (%)
2003 - 2008
Live animals, animal products
2 697 2 398 2 343 2 360 3 072 3 431 5.7 4.9
Vegetable products 5 676 6 402 6 375 6 459 9 120 11 614 19.4 15.4
Animal or vegetable fats & oils
76 33 30 24 36 76 0.1 0.2
Prepared foodstuffs; beverages, spirits & vinegar; tobacco & manufactured tobacco substitutes
5 622 5 566 6 267 6 696 8 082 10 476 17.5 13.3
Mineral products 8 242 5 541 8 256 9 386 10 068 11 558 19.3 7.0
Products of the chemical or allied industries
914 1 103 1 245 1 317 1 931 3 036 5.1 27.1
Plastics & articles thereof; rubber & articles
630 526 675 663 913 900 1.5 7.4
Raw hides & skins, leather
402 447 439 491 494 245 0.4 -9.4
Wood & articles of wood 415 427 416 328 281 281 0.5 -7.5
Pulp of wood or other fibrous cellulosic material
286 203 268 262 381 344 0.6 3.7

CHAPTER 1: ECONOMIC OUTLOOK 2009/10 – 2012/13
33
Export goods 2003 2004 2005 2006 2007 2008
% share of total exports
2008
Average annual growth rate (%)
2003 - 2008
Textiles & textile articles 1 919 1 236 1 171 1 090 1 142 1 040 1.7 -11.5
Footwear, headgear, umbrellas
72 39 40 30 52 74 0.1 0.5
Articles of stone, plaster, cement, asbestos, mica ceramic products; glass & glassware
115 103 114 124 158 184 0.3 9.9
Natural or cultured pearls, precious or semi-precious stones, precious metals
966 1 221 1 470 1 016 1 182 1 363 2.3 7.1
Base metals & articles of base metal
2 261 2 574 2 558 3 008 4 268 5 924 9.9 21.2
Machinery & mechanical appliances; electrical equipment.
1 548 2 143 2 816 3 169 4 488 6 286 10.5 32.4
Vehicles, aircraft, vessels & associated transport equipment
1 112 943 929 1 142 1 511 1 860 3.1 10.8
Optical, photographic, cinematographic, instruments.
131 160 227 202 335 592 1.0 35.2
Arms & ammunition; parts & accessories
- - - - - - - -
Miscellaneous manufactured articles
393 326 290 309 408 423 0.7 1.4
Works of art, collectors' pieces & antiques
27 25 20 29 39 69 0.1 20.6
Other unclassified goods 0 3 17 18 26 41 0.1 267.6
Special classification of original equipment components/parts for motor vehicles
1 - - 1 - - - -45.2
Total 33 505 31 419 35 966 38 124 47 987 59 817 1.0 12.3
Source: Provincial Treasury calculations based on Quantec Research data, 2009
Exports from the Western Cape to the rest of the world grew by 24.7 per cent between 2007 and 2008, up from R47.988 billion in 2007 to R59.817 billion in 2008. Western Cape exports account for 9.4 per cent of total exports in South Africa in 2008.
Vegetable products (19.4 per cent share), mineral products (19.3 per cent share), and prepared foodstuffs; beverages, spirits & vinegar, tobacco & manufactured tobacco substitutes (17.5 per cent share) comprised the three principle export goods from the Western Cape in 2008. These three export goods constitute 56.3 per cent of the total share of all export goods from the Western Cape in 2008.
There were no changes in the top ten ranking of export goods in 2008, with the exception of vegetable products that replaced mineral products as the principal export good from the Western Cape in 2008.

WESTERN CAPE PROVINCIAL ECONOMIC REVIEW AND OUTLOOK 2009
34
The top ten exports from the Western Cape in 2008 are:
• Vegetable products (19.4 per cent);
• Mineral products such as mineral fuels, oils, distillation products, cement, salt, ores, stone , plaster, lime (19.3 per cent);
• Prepared foodstuffs, beverages, spirits and vinegar; tobacco and manufactured tobacco substitutes (17.5 per cent);
• Machinery & mechanical appliances; electrical equipment (10.5 per cent);
• Base metals & articles of base metal (9.9 per cent);
• Live animals & animal products (5.7 per cent);
• Products of the chemical or allied industries (5.1 per cent);
• Vehicles, aircraft, vessels & associated transport equipment (3.1 per cent);
• Natural or cultured pearls, precious or semi-precious stones, precious metals (2.3 per cent); and
• Textiles & textile articles (1.7 per cent).
Overall, exports from the Western Cape grew on average by 12.3 per cent between 2003 and 2008. The sub-sectors with the fastest growth over the five year period were the optical & photographic category (35.2 per cent), machinery & mechanical appliances and electrical equipment (32.4 per cent), and products of the chemical or allied industries (27.1 per cent). Other unclassified goods7 registered the fastest/highest growth over the five-year period at 267.6 per cent. However, this growth stems from a low base and therefore one cannot as yet tread too much into these growth spurts.
Export goods from the Western Cape that registered significant declines over the five year period include:
• Textiles & textile articles (-11.5 per cent);
• Raw hides & skins, leather (-9.4 per cent); and
• Wood & articles of wood (-7.5 per cent).
7 Unclassified goods generally include goods of a sensitive nature (political/economic) or are goods that do not meet the classification criteria of the broad sub-sector good categories.

CHAPTER 1: ECONOMIC OUTLOOK 2009/10 – 2012/13
35
Figure 1.4 Major destinations for Western Cape Exports (% share), 2008
Africa19.5%
Americas9.7%
Asia15.8%
Europe45.9%
Oceania1.9%
Not allocated7.2%
Source: Provincial Treasury calculations based on Quantec Research data, 2009
Figure 1.4 shows that Europe (45.9 per cent of total exports) represents the largest market for Western Cape export goods in 2008, followed by Africa (19.5 per cent), Asia (15.8 per cent) and the Americas (9.7 per cent). This is in line with the national export pattern and further illustrates the importance of external global demand and its implications on the eventual trade surplus/deficit of the region.
Africa, Oceania and Europe registered the fastest growing export markets for the Western Cape over the five-year period, having grown at 14.7 per cent, 14.4 per cent and 13.6 per cent, respectively.
The top ten national markets in terms of Rand value for Western Cape export goods in 2008 are: United Kingdom, Netherlands, Not allocated8, Germany, United States, Belgium, France, Zambia, Angola and Spain. The top ten national markets all experienced positive growth rates over the 2003 to 2008 period. The exception is Belgium where the Rand value for Western Cape exports declined by 15.0 per cent between 2007 and 2008.
At a national level, all major export categories recorded declines in the first quarter of 2009. The lower volume of manufactured exports was linked to the contraction experienced in the manufacturing activity of South Africa’s major trading partners (SARB Quarterly Economic Review, June 2009). Looking ahead, Western Cape exports are expected to grow at a slower pace over the medium term (Quantec Research Estimates). However, uncertainty remains regarding the global and South African outlook and the sustainability of the recovery. The BER foresees that a weaker Rand in 2010 may support growth specifically for agricultural and
8 Not allocated refers to the situation whereby Customs officials were unable to specifically identify the export destination due to administrative anomalies. The next significant export destination market in Rand value terms in 2008 is Italy, if the category “not allocated” is excluded from the analysis.
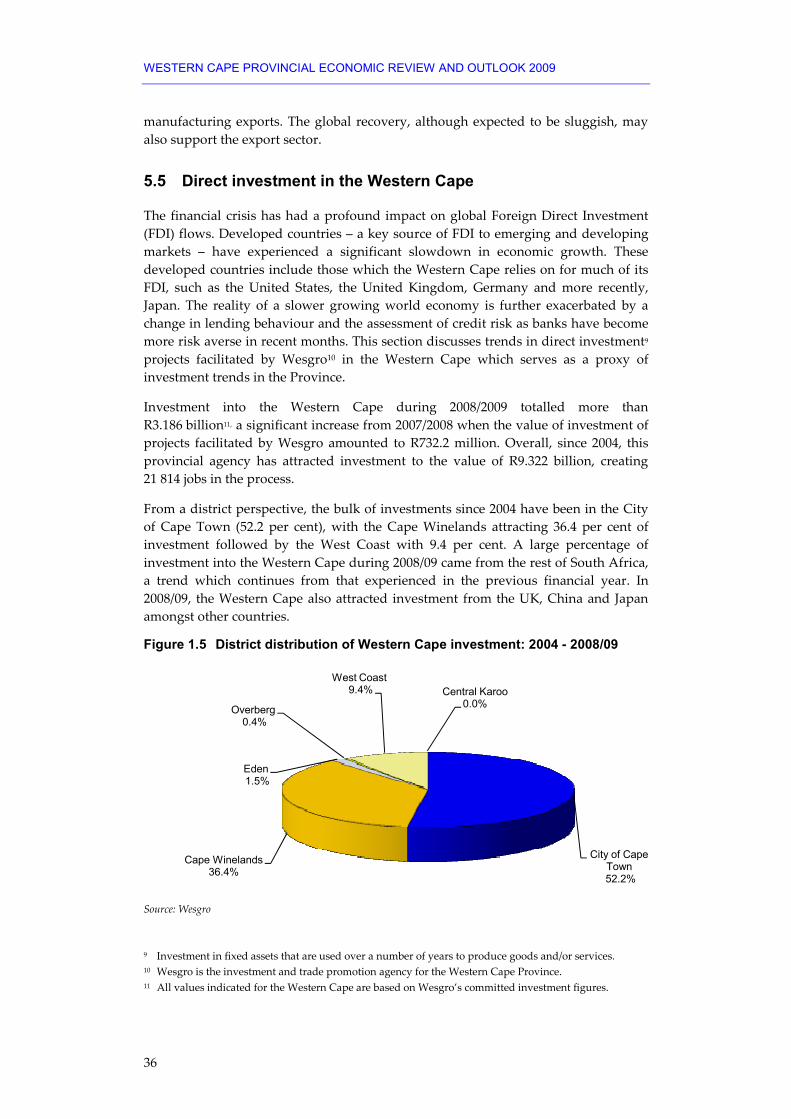
WESTERN CAPE PROVINCIAL ECONOMIC REVIEW AND OUTLOOK 2009
36
manufacturing exports. The global recovery, although expected to be sluggish, may also support the export sector.
5.5 Direct investment in the Western Cape
The financial crisis has had a profound impact on global Foreign Direct Investment (FDI) flows. Developed countries – a key source of FDI to emerging and developing markets – have experienced a significant slowdown in economic growth. These developed countries include those which the Western Cape relies on for much of its FDI, such as the United States, the United Kingdom, Germany and more recently, Japan. The reality of a slower growing world economy is further exacerbated by a change in lending behaviour and the assessment of credit risk as banks have become more risk averse in recent months. This section discusses trends in direct investment9 projects facilitated by Wesgro10 in the Western Cape which serves as a proxy of investment trends in the Province.
Investment into the Western Cape during 2008/2009 totalled more than R3.186 billion11, a significant increase from 2007/2008 when the value of investment of projects facilitated by Wesgro amounted to R732.2 million. Overall, since 2004, this provincial agency has attracted investment to the value of R9.322 billion, creating 21 814 jobs in the process.
From a district perspective, the bulk of investments since 2004 have been in the City of Cape Town (52.2 per cent), with the Cape Winelands attracting 36.4 per cent of investment followed by the West Coast with 9.4 per cent. A large percentage of investment into the Western Cape during 2008/09 came from the rest of South Africa, a trend which continues from that experienced in the previous financial year. In 2008/09, the Western Cape also attracted investment from the UK, China and Japan amongst other countries.
Figure 1.5 District distribution of Western Cape investment: 2004 - 2008/09
City of Cape Town52.2%
Cape Winelands 36.4%
Eden 1.5%
Overberg 0.4%
West Coast9.4% Central Karoo
0.0%
Source: Wesgro
9 Investment in fixed assets that are used over a number of years to produce goods and/or services. 10 Wesgro is the investment and trade promotion agency for the Western Cape Province. 11 All values indicated for the Western Cape are based on Wesgro’s committed investment figures.

CHAPTER 1: ECONOMIC OUTLOOK 2009/10 – 2012/13
37
During 2008/09, the most prominent sector receiving investment in the Western Cape was the renewable energy sector. This was followed by the automotive sector and other manufacturing. Although the Western Cape’s investment performance was dominated by a few large-scale projects during 2008/09 it is still very positive given broader economic constraints which impacted on the local and international investment climate.
From an international perspective, the 2008 FDI review highlights a shift in FDI to services. For the first time, financial services overtook software and IT services to become the leading sector for FDI. These two sectors combined with business services accounted for 27 per cent of global FDI projects, more than the 23 per cent share accounted for by manufacturing. Lastly, the growth in emerging industry projects such as renewable energy increased 10-fold over the past 5 years.
Table 1.6 Sector breakdown of international investments, 2008
Rank Sector Number of projects
1 Financial services 1 568
2 Software and IT services 1 476
3 Business service 1 158
4 Real estate 880
5 Industrial machinery, equipment and tools 781
Source: FDI Markets
5.6 Policy implications for the Western Cape
The first recession experienced in South Africa in 17 years is associated with a decline in economic activity and employment levels and a downward trend in tax collection. The economic crisis therefore puts additional pressure on already strained public finances. The Finance Ministry recently announced that if the current trends persist, revenue collection could be as much as R70 billion below (and indications are that this may be larger) what was projected for this financial year. Nationally, the main implications of a shortfall in revenue collection is an increase in the budget deficit as a percentage of GDP, implying an increase in financing and debt service costs.
At a provincial level, the implications of the broader external environment requires a more focused approach in implementing policies that will facilitate growth, lessen the impact on the poor and vulnerable and promote investment in public infrastructure that provide social benefits.
The national government’s response to the global economic crisis to mitigate the impact of the crisis is discussed earlier in the chapter. Provincial departments and municipalities need to focus on how to moderate the socio-economic impact of the crisis on the regional and local level in alignment with the broader national framework.

WESTERN CAPE PROVINCIAL ECONOMIC REVIEW AND OUTLOOK 2009
38
At the aggregate and regional economic level, the economy has performed well in recent years in terms of growth. The global financial and economic crisis has resulted in deteriorating prospects in the short term. As the global economy recovers, it is expected that the improved outlook will be reflected in the country’s economic performance. However, looking at broader socio-economic development objectives such as improvements in poverty and inequality, health, education and safety and security, progress has been more sluggish.
In light of the above, the Province should intensify the implementation of interventions that aim to remove bottlenecks to growth. The Province should also enhance its role in regional economic development and at the same time vigorously pursue improvements in the socio-economic status of the population.
Human capital is critical to growth and development objectives and there is an urgent need to accelerate the delivery of more and appropriately skilled and educated people.
Issues of climate change and natural resource management such as water, energy, biodiversity and land use and its impact regional growth and competitiveness need to be considered. This is particularly important given contribution of the agricultural sector to growth, employment and exports.
6. Conclusion Adverse global economic developments that ensued in the second half of 2008 have worsened the global economic outlook. The impact of the crises differs from country to country and from region to region, but the economies of the United States, United Kingdom, Germany and Japan, which relied heavily on manufacturing exports, bore the brunt of the crises.
The efforts of policymakers across the world did not achieve much in stabilising the financial markets and cushioning the world economy from entering into a recession. These efforts should further be supported by strong macroeconomic policy support, restoring financial stability in the world’s major economies thereby providing sustained and strong support for aggregate demand.
South Africa eventually entered into recession in the first quarter of 2009 as the international financial and economic turmoil intensified. Monetary and fiscal policy tools implemented to stimulate economic growth proved to be less effective instruments in the short term. Consequently, the economy started shedding jobs, export volumes and competitiveness plunged, and South Africa became more exposed to external shocks.
The main challenges for the domestic economy are to stimulate economic growth, save and create employment opportunities, support exporting industries and strive to bring the inflation back to within the target band. Domestically, recovery in economic growth is largely at the mercy of the global economic developments and that is only expected by 2010.

CHAPTER 1: ECONOMIC OUTLOOK 2009/10 – 2012/13
39
The economic outlook for the Western Cape is inextricably tied to that of the global and national economy. The regional economic outlook is bleak with downward revisions in growth projections for the medium term. However, the impact of the global economic crisis seems to be less severe in the Province than at a national level. This is largely due to the relative resilience in the Western Cape manufacturing sector, the limited share of mining in regional economic activity and the positive impact of the growing agricultural sector.
The implications of the broader economic environment necessitates a more focused approach in implementing policies that will facilitate growth in the Province such as continued investment in infrastructure.


41
2
Labour Market Dynamics in the Western Cape Key findings:
• Between 2003 and 2008 the working age population in the Western Cape grew more rapidly than South Africa as a whole at 2.8 per cent compared to 1.4 per cent nationally.
• Employment in the Western Cape grew on average by 2.5 per cent per annum between 2003 and 2008, which is significantly lower than the national average of 4.2 per cent.
• The racial composition of the narrow labour force and employed has shifted over the period 2003 to 2008. Both the African and Coloured population increased their share of the labour force and employed. In contrast the White population’s share of the labour force declined. Despite this, Whites in the Province still experience the highest labour absorption rate amongst all race groups in the Province.
• The narrow unemployment rate has increased slightly from 19.2 per cent in 2003 to 20.2 per cent in 2008. The narrow unemployment rates have declined from 36.2 per cent to 30.2 per cent for Africans and from 5.6 per cent to 4 per cent for Whites over the period. The narrow unemployment rate for the Coloured population has increased from 16.8 per cent to 17.3 per cent over this period.
• The Western Cape’s labour force has become slightly more educated between 2003 and 2008, with 29.3 per cent of the labour force having complete secondary education in 2008, up from 27.7 per cent.
• The three major employment sectors in the Western Cape are wholesale and retail trade (22.8 per cent), manufacturing (19.7 per cent) and community, social and personal services (19.6 per cent).
• Close to 50 per cent of the employed are engaged in medium-skill occupations, while the remainder of the workforce is split roughly between high- and low-skilled occupations.
• The informal sector employs 10.3 per cent of the Western Cape labour force.

WESTERN CAPE PROVINCIAL ECONOMIC REVIEW AND OUTLOOK 2009
42
• Informal sector employment is mostly made up of those aged between 25 and 34 years (29.9 per cent), 35 and 44 years (27.9 per cent) and 45 and 54 years (23.2 per cent).
• The education level of the informal sector in the Western Cape is largely distributed across the lower education cohorts, with most of those employed having incomplete FET education (33.6 per cent), incomplete GET (32.2 per cent) and Grade 12 (22.3 per cent).
• Unlike the national trend, which saw narrow unemployment decreasing significantly between 2003 and 2008, the Province experienced an average growth of 2.7 per cent in narrow unemployment for the period. The Coloured population group experienced the largest growth in unemployment over this period with a rise in the average narrow unemployment rate of 3.8 per cent. Unemployment increased by average of 3.9 per cent amongst females compared to 1.5 per cent among males over the same period.
• Individuals aged 15 to 24 years have the highest unemployment rates compared to other age cohorts.
• For the period under review the effects of the global recession have been less severe in the Western Cape relative to South Africa. Unlike the rest of South Africa, the Western Cape did not experience a contraction in the labour force participation rate between the third quarter 2008 and third quarter 2009. Nevertheless unemployment in the Western Cape has edged upwards from 19.7 per cent in the third quarter 2008 to 22.5 per cent in the third quarter 2009.
1. Introduction One of the key challenges facing the Western Cape is to create sufficient employment opportunities and mitigate rising unemployment levels. The task of creating sustainable employment is however not an easy one, with the labour market in South Africa and Western Cape facing structural challenges of having a large supply of unskilled labourers and high demand for skilled labour. It is through improved performance of the labour market that poverty and rising levels of inequality can be addressed. This chapter presents an analysis of the labour market in the Western Cape between 2003 and 2008. The first section considers the change in the narrow labour force for both the province, and where appropriate for South Africa as a whole. The second and third sections explore the change in total employment, followed by a static comparison of the formal and informal sector. The trends of unemployed are examined, and it is noted that the national and provincial trend differs substantially. The fourth section takes a closer look at youth unemployment for the Western Cape and South Africa. The last section looks at more recent labour market trends and in doing so tries to capture the initial effects of the economic downturn. All labour market specific terminology used throughout this chapter is defined in Appendix 1.

CHAPTER 2: LABOUR MARKET DYNAMICS IN THE WESTERN CAPE
43
2. Data Two nationally representative household surveys conducted by Statistics South Africa are utilised in the analysis, namely the bi-annual Labour Force Survey and, its successor, the Quarterly Labour Force Survey. Data for 2003 is obtained from the September edition of the Labour Force Survey (LFS), while data for 2008 derives from the Quarterly Labour Force Survey (QLFS) of the third quarter of that year.
Between 2000 and 2007, the primary instrument for the collection of labour market data in South Africa was the nationally representative LFSs. These surveys were conducted twice a year by Statistics South Africa, in March and September. In 2008, the LFS was replaced by the QLFS, which is conducted quarterly and, whereas the former was collected at one point in time (during a particular month), the latter collects data continuously across the quarter. Like the LFS, the QLFS collects a range of information from households in order to allow for an analysis of the labour market in South Africa. However, there have been a variety of changes in the cross-over between the two surveys, including the addition of questions in the QLFS, dropping of questions in the QLFS that were previously used in the LFS, and definition changes between the two surveys.
One of the major changes in the cross-over relates to the way in which labour market status is defined and coded in the two surveys. Three key changes are noted here. Firstly, while non-market production activities were regarded as employment in the LFS, they were excluded from the definition of employment in the QLFS. Secondly, while the derivation of unemployment is similar between the two surveys, the reference period for one of the methods of determining unemployment in the LFS is different from the reference period used in any of the methods of determining unemployment in the QLFS. Thirdly, a much tighter definition of discouraged workseekers is used in the QLFS compared to the LFS.
In an analysis of the labour market in South Africa using both the LFSs and the QLFSs, it is necessary to bring together the labour market status definitions used in the two surveys. Statistics South Africa has published revised figures for 2000 and 2007 based on the differences observed in September 2008 when the two surveys were run in parallel (a September LFS and a July - September QLFS). However, these revised estimates are published for only certain aggregates and only in table format, and thus detailed labour market analyses can only make superficial use of them. In an attempt to circumvent this problem, a set of labour market definitions for persons in the LFS has been constructed, based on the definitions of ‘employment’, ‘narrow unemployment’, ‘discouraged workers’ and ‘inactive workers’ as used in the QLFS. While the newly constructed definitions are not an exact match of those used in the QLFS, they mirror the definitions used in the QLFS as closely as possible and are thus ‘hybrid’ labour market definitions. Specific problems encountered here related to different ordering of questions in the QLFS compared to the LFS, the addition of questions in the QLFS previously not used in the LFS, and differences in the manner in which certain questions were asked between the two surveys. Table 2.1 compares the number of working-age individuals by their labour market status for each of the two sets of definitions, the official dataset definition and the hybrid definition, used.

WESTERN CAPE PROVINCIAL ECONOMIC REVIEW AND OUTLOOK 2009
44
Table 2.1 Comparisons of labour market status using official and Hybrid definitions, 2003, 2007 and 2008
Thousands LFS 2003:2 LFS 2007:3 QLFS 2008:3
Official Hybrid Official Hybrid Official Hybrid
Employed 11 394 11 150 13 306 12 998 13 681 13 681
Narrow unemployed 4 383 4 435 3 905 3 940 4 124 4 038
Discouraged 3 718 2 415 3 443 2 437 1 072 1 072
Other inactive 9 443 10 938 9 766 11 046 12 103 12 186
Working-age population 28 938 28 938 30 420 30 420 30 979 30 979
Source: Labour Force Survey (2003), Quarterly Labour Force Survey (2007, 2008), Own Calculations.
As expected, using the hybrid definitions (based on QLFS definitions) decreases the number of employed labour market participants, since those individuals that were only involved in non-market production activities in the seven days prior to the interview were excluded from the definition of employment. Furthermore, the number of discouraged workseekers also decreases since a tighter definition of employment is used in the QLFS compared to the LFS. Unsurprisingly then, the number of inactive labour market participants increases with the use of the hybrid definition compared to the definition used in the LFS datasets. In the QLFS 2008:3, the aggregates derived according to the hybrid definition differ slightly from the official aggregates in that the latter are derived using residual coding, rather than explicitly coding each labour market status, as is done under the hybrid definition.
Finally, it must be noted that in creating the hybrid definitions used in the table above, each of the labour market states were specifically and individually coded. In practice, though, the ‘status’ definitions created by Statistics South Africa in both the LFS and the QLFS datasets are coded using ‘residual coding’, that is, all of the labour market states captured by the status variable are not explicitly coded in either of the two surveys. For instance, in the QLFS ‘employment’, ‘unemployment’ and ‘discouraged workseekers’ are explicitly coded, while ‘inactive workers’ are essentially the residual. Overall, the use of the hybrid definition does not appear to result in large unexpected variations in the absolute sizes of the labour market aggregates, nor does it result in substantial unexplained changes in individuals’ labour market status within a given dataset. It is this hybrid labour market status definition that is utilised in the analysis that follows. Nevertheless, it must be noted that neither the official revised estimates published by Statistics South Africa, nor the hybrid definition employed here are perfect remedies to the problem of comparability. Until such time as there is a time series of QLFS estimates of sufficient length, analysis of labour markets in South Africa will be vulnerable to these comparability issues.
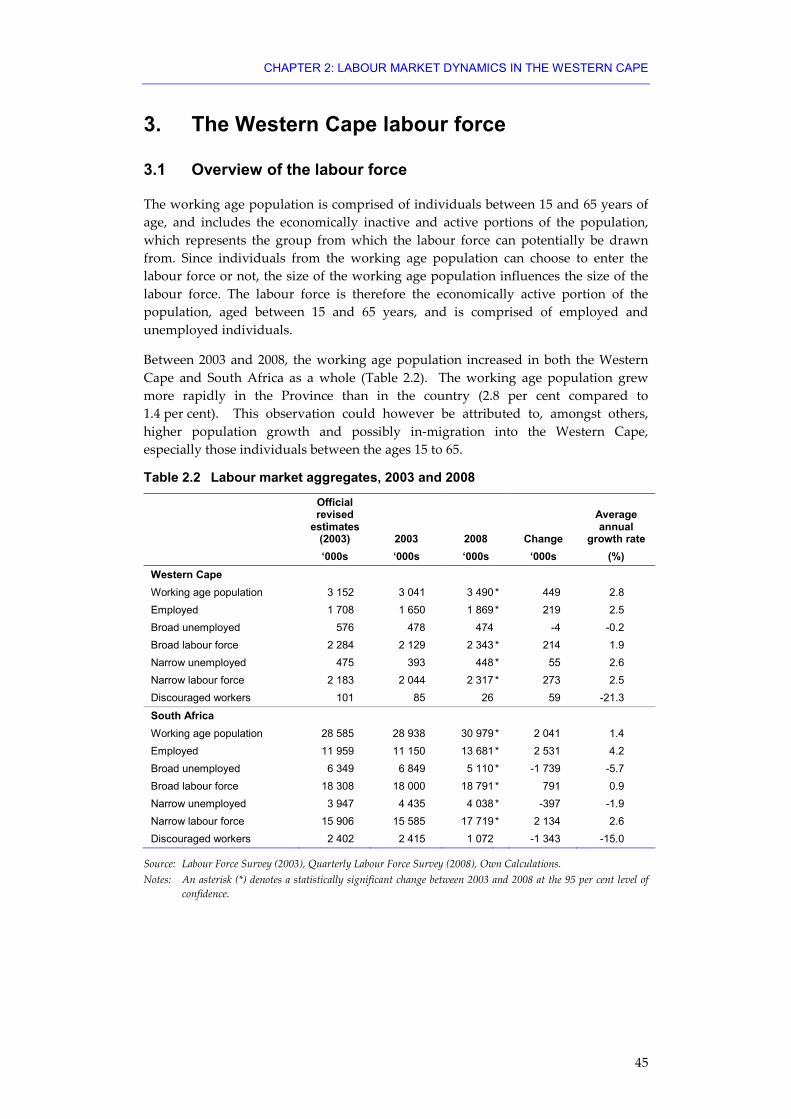
CHAPTER 2: LABOUR MARKET DYNAMICS IN THE WESTERN CAPE
45
3. The Western Cape labour force
3.1 Overview of the labour force
The working age population is comprised of individuals between 15 and 65 years of age, and includes the economically inactive and active portions of the population, which represents the group from which the labour force can potentially be drawn from. Since individuals from the working age population can choose to enter the labour force or not, the size of the working age population influences the size of the labour force. The labour force is therefore the economically active portion of the population, aged between 15 and 65 years, and is comprised of employed and unemployed individuals.
Between 2003 and 2008, the working age population increased in both the Western Cape and South Africa as a whole (Table 2.2). The working age population grew more rapidly in the Province than in the country (2.8 per cent compared to 1.4 per cent). This observation could however be attributed to, amongst others, higher population growth and possibly in-migration into the Western Cape, especially those individuals between the ages 15 to 65.
Table 2.2 Labour market aggregates, 2003 and 2008
Official revised
estimates(2003) 2003 2008 Change
Average annual
growth rate ‘000s ‘000s ‘000s ‘000s (%) Western Cape Working age population 3 152 3 041 3 490* 449 2.8 Employed 1 708 1 650 1 869* 219 2.5 Broad unemployed 576 478 474 -4 -0.2 Broad labour force 2 284 2 129 2 343* 214 1.9 Narrow unemployed 475 393 448* 55 2.6 Narrow labour force 2 183 2 044 2 317* 273 2.5 Discouraged workers 101 85 26 59 -21.3
South Africa Working age population 28 585 28 938 30 979* 2 041 1.4 Employed 11 959 11 150 13 681* 2 531 4.2 Broad unemployed 6 349 6 849 5 110* -1 739 -5.7 Broad labour force 18 308 18 000 18 791* 791 0.9 Narrow unemployed 3 947 4 435 4 038* -397 -1.9 Narrow labour force 15 906 15 585 17 719* 2 134 2.6 Discouraged workers 2 402 2 415 1 072 -1 343 -15.0
Source: Labour Force Survey (2003), Quarterly Labour Force Survey (2008), Own Calculations. Notes: An asterisk (*) denotes a statistically significant change between 2003 and 2008 at the 95 per cent level of
confidence.

WESTERN CAPE PROVINCIAL ECONOMIC REVIEW AND OUTLOOK 2009
46
Employment in the Western Cape increased from 1.650 million individuals in 2003 to 1.869 million individuals in 2008. Employment thus grew on average by 2.5 per cent per annum between 2003 and 2008, which is significantly lower than the national average of 4.2 per cent. It is not possible to discern whether the number of the broad unemployed individuals, and therefore discouraged workers, has increased between 2003 and 2008 in the Western Cape since the change in the number of unemployed is not statistically significant at the 95 per cent level of confidence.1 While the number of narrowly unemployed individuals decreased in South Africa as a whole, from 4.435 million in 2003 to 4.038 million in 2008, the same trend is not present in the Western Cape as the number of narrowly unemployed individuals has increased from 393 000 in 2003 to 448 000 in 2008.
Both the broad and the narrow labour force have increased over the five years. The broad labour force increased at an average rate of 1.9 per cent in the Western Cape and 0.9 per cent in South Africa as a whole. Additionally, the narrow labour force grew at an average rate of 2.5 per cent in the Western Cape and 2.6 per cent in South Africa. The narrow labour force in the Western Cape increased by 273 000 individuals, from 2.044 million in 2003 to 2.317 million in 2008. A large portion of the increase in the narrow labour force is related to increased employment in the Province: 48.8 per cent of the change in the labour force is accounted for by employment growth.
The official revised estimates in the second column of Table 2.2 are the revisions provided by Statistics South Africa on the basis of the parallel LFS of September 2008 and QLFS of July - September 2008. Broad unemployment and broad labour force figures are calculated on the basis of narrow unemployment, employment and discouraged workseeker estimates. What is evident is that the hybrid definition does not have a major unexpected impact on these labour market aggregates, either in the Western Cape or in the country as a whole, with the official revised estimates being generally close to those of the hybrid definition.
It is important to relate employment growth to labour force growth in order to judge employment performance. This is done by calculating the target growth rate for employment and employment absorption rates.
1 The official, or narrow, definition of unemployment used by Statistics South Africa (2004) defines the unemployed as those individuals within the economically active population who did not work during the seven days prior to the interview, who want to work and who are available to start work within a week of the interview, and who have taken steps to look for work or to start some form of self-employment in the four weeks prior to the interview. The expanded definition excludes the last criterion. Although this definition has been slightly modified in the QLFS, it is essentially unchanged.

CHAPTER 2: LABOUR MARKET DYNAMICS IN THE WESTERN CAPE
47
Target growth rates for employment and employment absorption
Target growth rates for employment and the employment absorption rates are particularly useful as the target growth rate (TGR) indicates how fast employment would have to expand in order to provide jobs for all net entrants to the job market.
The Employment Absorption Rate (EAR) is the ratio between actual employment growth and the desired or target rate, and it is expressed as a percentage. To calculate these growth rates, we use the narrow definition of the labour force.
The TGR is defined as:
tk,
tk,tk,
L
EAPEAP −+= 1kTGR
EAPk refers to the economically active population of Group k, where Group k is defined by any given covariate, and Lk is the number of employed Group k individuals (Bhorat and Oosthuizen 2006).
The EAR is defined as:
tkEAPEAPLL
LEAPEAP
LLL
EARtk
tkkt
tk
tk
tk
tktk
ktk ,1,
,1
,
,
,
,1,
1, −
−
−+
−
+
+
+
==
Simply put, the EAR is the change of employment between time periods t and t+1 relative to the change in the labour force over the same time period. An EAR of 100 indicates a scenario where an increase in the labour force is fully accounted for by an increase in employment. It is also possible to find an EAR that is greater than 100, occurring when the change in employment is greater than the change in the labour force in absolute terms, Oosthuizen 2006.
Using the official definition, employment would have had to have grown by 16.6 per cent for all the net entrants to the labour force to have found work between 2003 and 2008. In reality however, employment only grew on average by 13.2 per cent in the Western Cape over the period and the EAR for the Western Cape was 79.9 per cent. Analyses of the TGRs and the EARs for the various race groups shows that the African population has the highest target growth rate of 59.6 per cent, followed by Coloureds at a significantly lower target growth rate of 19.5 per cent. Unexpectedly, the White population exhibits a negative TGR of 22.7 per cent. The negative values of the actual growth rate and the TGR of the White population is due to their declining employment and labour force. Ultimately however, the underlying reason for the sharp decline in the labour force is unknown.

WESTERN CAPE PROVINCIAL ECONOMIC REVIEW AND OUTLOOK 2009
48
Table 2.3 Target and actual employment growth of the Western Cape, 2003 - 2008
Actual growth rate
Target growth rate
Employment absorption rate
Total 13.2 16.6 79.9 Race African 51.0 59.6 85.7 Coloured 15.4 19.5 79.1 White -20.2 -22.7 88.7 Gender Male 12.4 14.1 88.2 Female 14.3 19.9 72.0
Source: Labour Force Survey (2003), Quarterly Labour Force Survey (2008), Own Calculations.
Table 2.3 shows that 79.9 per cent of entrants to the labour force in the Western Cape found employment between 2003 and 2008. Even though the target growth rate for Africans was high, actual employment growth was also relatively high, at 51.0 per cent. This means that the employment absorption rate, which compares the actual growth rate to the target growth rate, stood at 85.7 per cent for the period between 2003 and 2008. In other words, employment grew at a rate sufficient to employ almost 86 out of every 100 net labour market entrants amongst Africans. For Coloureds, both the actual and target growth rates were correspondingly lower for the period. However, employment absorption stood at 79.1 per cent for the period. White employment absorption for the period was 88.7 per cent, although this derived from a reduction in both the number of employed individuals and the size of the White labour force and is, therefore, not a very useful statistic in this regard. These employment absorption rates are very different to the results found by previous research showing that the EAR for the White population far exceeded that of the African and Coloured population (see Bhorat and Oosthuizen 2006; Oosthuizen 2006). These results may therefore be an indication that the employment growth opportunities for the various race groups are levelling out.
From the table above it is noted that both the actual growth rate and the TGR for female employment (14.3 per cent and 19.9 per cent respectively) were slightly higher than the actual growth rate and the TGR for male employment (12.4 per cent and 14.1 per cent respectively). The EAR for the male cohort is however higher than the EAR for the female cohort confirming that the male population benefits more from employment growth than their female counterparts do.
3.2 Demographic composition of the labour force
As already noted, the number of narrow labour force participants in the Western Cape increased from 2.044 million participants in 2003 to 2.317 million participants in 2008 (Table 2.4). The Coloured population continues to dominate the narrow labour force, increasing its share from 52.8 per cent in 2003 to 54.1 per cent in 2008. While the African and White population accounted for a similar portion of the narrow labour force in 2003, the White population saw a sharp decline in their share of the labour force, from 21.2 per cent in 2003 to 14.7 per cent in 2008. Africans represent the largest increase in the number of individuals entering the labour force, from 519 000 in 2003 to 716 000 in 2008, or at an average growth rate of 6.6 per cent.

CHAPTER 2: LABOUR MARKET DYNAMICS IN THE WESTERN CAPE
49
Table 2.4 Composition of the Western Cape narrow labour force, 2003 and 2008
2003 2008 Change
Average annual
growth rate ‘000s Share (%) ‘000s Share (%) ‘000s (%)
Narrow labour force 2 044 2 317 * 273 2.5 Race African 519 25.4 716 30.9 * 197 6.6 Coloured 1 078 52.8 1 253 54.1 * 175 3.1 White 433 21.2 340 14.7 * -93 -4.7 Gender Male 1 148 56.2 1 280 55.3 * 133 2.2 Female 896 43.8 1 037 44.7 * 141 3.0 Age 15 - 24 year-olds 408 20.0 407 17.6 * -1 -0.1 25 - 34 year-olds 701 34.3 810 35.0 * 109 2.9 35 - 44 year-olds 509 24.9 611 26.4 * 102 3.7 45 - 54 year-olds 311 15.2 359 15.5 * 48 2.9 55 - 65 year-olds 114 5.6 130 5.6 * 16 2.7 Education No education 45 2.2 22 1.0 * -23 -13.3 Grades 0 - 8 565 27.6 526 22.7 * -39 -1.4 Grades 9 - 11 539 26.4 720 31.1 * 181 5.9 Grade 12 566 27.7 679 29.3 * 114 3.7 Diploma/Certificate 172 8.4 206 8.9 * 33 3.6 Degree 145 7.1 136 5.9 * -9 -1.2
Source: Labour Force Survey (2003), Quarterly Labour Force Survey (2008), Own Calculations. Notes: An asterisk (*) denotes a statistically significant change between 2003 and 2008 at the 95 per cent level of
confidence.
Despite the continued domination of the male population in the Western Cape’s narrow labour force, the number of female participants has increased considerably, from 896 000 to 1.037 million between 2003 and 2008. There was also an almost equal increase in the number of males and females in the labour force between 2003 and 2008, with male labour force entrants increasing by 133 000 and female labour participants increasing by 141 000.
A large portion of the labour force is made up of individuals aged between 25 and 34 year olds, and 35 and 44 year olds. These are the only two age groups which experienced a statistically significant change at the 95 per cent level of confidence between 2003 and 2008. Overall these two age groups contributed approximately 211 000 to the narrow labour force. Both age groups expanded relatively rapidly at an average annual rate of 2.9 per cent for the 25 and 34 year olds and 3.7 per cent for those aged between 35 and 44 years.
The number of individuals in the labour force within the Western Cape with no education significantly decreased, from 45 000 in 2003 to 22 000 in 2008. These individuals only account for 1.0 per cent of the labour force in 2008, compared to 2.2 per cent in 2003. The largest increase in the labour force comprises individuals who have incomplete FET, i.e. those between Grade 9 and Grade 11. These individuals account for 31.1 per cent of the labour force in 2008, compared to 26.4 per cent of the labour force in 2003. The evidence suggests that the Western Cape’s labour force has become slightly more educated between 2003 and 2008. The number of individuals who have completed secondary education (Grade 12)
WESTERN CAPE PROVINCIAL ECONOMIC REVIEW AND OUTLOOK 2009
50
increased from 566 000 in 2003 to 679 000 in 2008, or from 27.7 per cent of the labour force in 2003 to 29.3 per cent in 2008. While the number of individuals in the labour force with a diploma increased from 172 000 to 206 000 between 2003 and 2008, the number of individuals with a degree in the labour force decreased over the same time period, from 145 000 to 136 000. This decline in the number of individuals who have a degree is evident for the narrow labour force in general, the employed, and the unemployed. It unclear what the reason for the decline is, but it appears that the trend was reversed to a certain extent between 2007 and 2008 in both employment and the labour force generally (see Appendix 2).
3.3 Labour force participation amongst the working-age population
The estimates of the narrow labour force participation rates for 2003 and 2008 within the Western Cape are presented in Figure 2.1. The size of the working age population directly affects the size of the labour force. The labour force is also influenced by an individuals’ propensity or choice to enter the labour market. The labour force participation rate (LFPR) reflects the size of the labour force as a proportion of the total number of individuals between the ages of 15 and 65 years and indicates the probability of entering the labour force.
At 67.4 per cent the LFPR amongst the African population is slightly higher that that of Coloureds and Whites, each at 65.9 per cent. Furthermore, the male LFPR, which is 75.6 per cent, is significantly higher than the female LFPR of 57.7 per cent. This result can partially be explained by the lower retirement age for the female population, with females retiring at the age of 60 years compared to 65 years for their male counterparts. Female labour force participants also leave the labour force in order to bear and rear their children which also lowers the female LFPR.

CHAPTER 2: LABOUR MARKET DYNAMICS IN THE WESTERN CAPE
51
Figure 2.1 Western Cape narrow labour force participation rates, 2008
Total African Coloured White Male Female 15-24 years
25-34 years
35-44 years
45-54 years
55-65 years
Series 1 66.4 67.4 65.9 65.9 75.6 57.7 44.7 81.9 81.6 72.0 37.7
0
10
20
30
40
50
60
70
80
90
Source: Quarterly Labour Force Survey (2008), Own Calculations. Note: The 2003 labour force participation rates are not included in the figure below as none of the changes between
2003 and 2008 in the LFPR were statistically significant at the 95 per cent level of confidence.
Labour force participation is lowest among the youngest and oldest age cohorts. Additionally, we observe that the LFPR peaks for those aged between 25 and 34 years and 35 and 44 years. This trend is expected since those aged between 15 and 24 years have relatively high involvement in education, while individuals entering retirement explain the significant drop in the LFPR for the older cohort.
4. Total Employment
4.1 Demographics and employment
Total employment in South Africa increased at an average rate of 4.2 per cent per annum, from 11.150 million in 2003 to 13.681 million individuals in 2008. While employment in the Western Cape increased, it grew on average at a slower rate of 2.5 per cent, from approximately 1.650 million to almost 1.869 million individuals over the same time period. Total employment includes formal employment, informal employment and employment from private households.

WESTERN CAPE PROVINCIAL ECONOMIC REVIEW AND OUTLOOK 2009
52
Table 2.5 Composition of total employment, 2003 and 2008
2003 2008 Change
Average annual
growth rate
‘000s Share
(%) ‘000s Share
(%) ‘000s (%) Western Cape Total Employment 1 650 1 869 * 218 2.5 Race African 331 20.0 500 26.7 * 169 8.6 Coloured 898 54.4 1 036 55.4 * 138 2.9 White 409 24.8 327 17.5 * -82 -4.4 Gender Male 942 57.1 1 060 56.7 * 117 2.4 Female 708 42.9 809 43.3 * 101 2.7 Age 15 - 24 year-olds 241 14.6 251 13.4 10 0.8 25 - 34 year-olds 569 34.5 618 33.1 49 1.7 35 - 44 year-olds 449 27.2 550 29.4 * 100 4.1 45 - 54 year-olds 288 17.4 328 17.5 40 2.7 55 - 65 year-olds 103 6.3 122 6.5 19 3.4 Education No education 35 2.1 19 1.0 * -16 -11.7 Grades 0 - 8 438 26.5 405 21.7 -33 -1.5 Grades 9 - 11 395 23.9 527 28.2 * 132 5.9 Grade 12 467 28.3 569 30.4 * 102 4.0 Diploma/Certificate 165 10.0 193 10.3 28 3.2 Degree 139 8.4 131 7.0 -8 -1.2 South Africa Total Employment 11 150 13 681 * 2 530 4.2 Race African 7 314 65.6 9 582 70.0 * 2 268 5.6 Coloured 1 309 11.7 1 543 11.3 * 234 3.3 White 2 087 18.7 2 072 15.1 -15 -0.1 Gender Male 6 467 58.0 7 640 55.8 * 1 173 3.4 Female 4 684 42.0 6 041 44.2 * 1 357 5.2 Age 15-24 year-olds 1 158 10.4 1 602 11.7 * 444 6.7 25-34 year-olds 3 866 34.7 4 663 34.1 * 797 3.8 35-44 year-olds 3 109 27.9 3 618 26.4 * 509 3.1 45-54 year-olds 2 136 19.2 2 630 19.2 * 494 4.2 55-65 year-olds 882 7.9 1 168 8.5 * 287 5.8 Education No education 606 5.4 565 4.1 -41 -1.4 Grades 0 - 8 3 132 28.1 3 048 22.3 -84 -0.5 Grades 9 - 11 2 386 21.4 3 492 25.5 * 1 105 7.9 Grade 12 3 039 27.3 3 924 28.7 * 885 5.2 Diploma/Certificate 1 124 10.1 1 580 11.5 * 456 7.0 Degree 792 7.1 914 6.7 * 122 2.9
Source: Labour Force Survey (2003), Quarterly Labour Force Survey (2008), Own Calculations. Notes: An asterisk (*) denotes a statistically significant change between 2003 and 2008 at the 95 per cent level of
confidence.

CHAPTER 2: LABOUR MARKET DYNAMICS IN THE WESTERN CAPE
53
The racial composition in the Western Cape is significantly different to that of the South Africa as a whole, with the Coloured population contributing to 55.4 per cent of those employed in 2008, while the African share of employment is more dominant at 70 per cent nationally.
Employment within the Western Cape is changing slowly, with a large portion of the increase in employment being accounted for by Africans, with employment increasing from 331 000 in 2003 to 500 000 in 2008. The average annual employment rate amongst Africans grew by 8.6 per cent in the Western Cape and by 5.6 per cent in South Africa. There has been a decrease in White employment in the Western Cape, from 409 000 in 2003 to 327 000 in 2008. Again, the reason for this decline is unclear.
The share of female employment has increased slightly in the Western Cape and in South Africa as a whole. In the Western Cape the share of female employment increased from 42.9 per cent in 2003 to 43.3 per cent in 2008, while in South Africa as a whole it increased from 42.0 per cent to 44.2 per cent. The share of female employment grew on average by 2.7 per cent in the Western Cape compared to the national average of 5.2 per cent.
Male employment increased from 942 000 in 2003 to 1.060 million in 2008 while female employment increased from 708 000 in 2003 to 809 000 in 2008 within the Western Cape. While in South Africa as whole, male employment increased from 6.467 million in 2003 to 7.640 million in 2008 and female employment increased from 4.684 million in 2003 to 6.041 million in 2008. From the aggregate figures, it appears as if the gap between male and female employment is contracting.
The only statistically significant change in employment in the Western Cape with regard to age was for those who were aged between 35 to 44 years. For South Africa as a whole, changes in employment were statistically significant for all age groups. For the 35 to 44 year old age cohort, employment grew on average by 4.1 per cent between 2003 and 2008, or from 449 000 to 550 000 within the Western Cape. The growth rate for this age cohort was higher in the Western Cape than South Africa as a whole (3.1 per cent).
There has been a general decline in the number of employed with no education within the Western Cape. This trend is expected since it is virtually impossible to obtain employment with little or no education and therefore individuals should have a strong incentive to seek education to ensure employability. Additionally, improvement in access to education over time means that it is generally the older generation that has no education, rather than the younger population. Thus as older individuals leave the workforce over time, this proportion of employed individuals with no education will continue to decline. The changes for the employed with no education and those with Grade 0 to Grade 8 level of education are not statistically significant at the 95 per cent level of confidence for South Africa as a whole.
The most rapid growth in employment occurred where individuals have incomplete FET education. The average rate of growth for this education cohort was 5.9 per cent in the Western Cape and 7.9 per cent for South Africa as a whole. At the lower skill levels, employment levels are a close approximation of labour demand, meaning that there has been an expansion of labour demand at these lower education levels. At higher skill levels, employment is less often constrained by demand and is more often
WESTERN CAPE PROVINCIAL ECONOMIC REVIEW AND OUTLOOK 2009
54
a reflection of labour supply. The underlying reason for this rise in employment at this level is however unclear and deserves further research.
While the greatest growth in employment might have occurred within the Grade 9 to Grade 11 cohort, the majority of employed had completed secondary education. In South Africa, the number of employed individuals with completed secondary education has increased from 3.039 million in 2003 to 3.924 million in 2008, while in the Western Cape, growth in the employment of this cohort increased from 467 000 to 569 000. Employment changes between 2003 and 2008 varied for those with tertiary education depending on whether individuals were in possession of a Diploma or a Degree in the Western Cape. For South Africa as a whole however, employment increased regardless of the type of tertiary education obtained. In the Western Cape employment increased for those who obtained a Diploma from 165 000 to 193 000 while it declined slightly for those who were in possession of a Degree from 139 000 to 131 000 between 2003 and 2008. Generally those who graduated with a Diploma attended a technical institution where it is mandatory for students to gain work experience at firms. The higher growth rate in employment for those in possession of a Diploma could reflect the demand for graduates with work experience.
4.2 Economic structure and labour demand of the formal sector
It is not possible to analyse the structural changes and the changes in the labour demand in the formal and informal sectors as the distinction between formal and informal has changed significantly with the adoption of the Quarterly Labour Force Survey. The analysis resorts to static analysis of differences between the Western Cape and the rest of the Country only as it is not possible to create comparable variables due to a lack of certain key variables excluded in either the 2003 LFS or the QLFS.
In 2008 there were 1.573 million individuals employed in the formal sector in the Western Cape and 10.113 million in South Africa (Table 2.6). Relative to South Africa, the Western Cape’s racial composition varies significantly, with 55.8 per cent of the employed in the Western Cape being Coloured. Africans and Whites make up a smaller proportion of the employed in the Province, accounting for 24.8 per cent and 19.2 per cent of the employed respectively. The bulk of the employed in South Africa are African (63.3 per cent), with 12.8 per cent of the employed being Coloured. Whites account for just under one-fifth of employment nationally.
Employed individuals in the Province appear to be slightly younger than in the Country as a whole. Although there are no statistically significant differences between the Province and the Country as a whole in the proportions accounted for by any of the age groups, almost half, or 48.1 per cent, of the employed in the Western Cape are aged 15 to 34 years. Individuals who have completed their matric constitute the largest proportion of the employed, amongst the educational categories, accounting for almost one-third (32.8 per cent) of the employed. This is followed by those with incomplete FET education (Grades 9 through 11), who account for 27.5 per cent of employment and those with complete GET education (18.6 per cent). Just 11.4 per cent and 7.9 per cent of the employed in the Western Cape have diplomas and/or certificates, and degrees respectively. The proportion of the employed with incomplete FET is somewhat higher in the Province than is the case nationally, while the opposite is true of those with diplomas and/or certificates.

CHAPTER 2: LABOUR MARKET DYNAMICS IN THE WESTERN CAPE
55
Almost all people employed within the Province have some form of education as only 0.7 per cent of the workforce has no education.
Table 2.6 Formal employment in the Western Cape, 2008
South Africa Western Cape ‘000s Per cent ‘000s Per cent Formal employment 10 113 1 573 * Race African 6 407 63.3 390 24.8 * Coloured 1 295 12.8 877 55.8 * White 1 970 19.5 302 19.2 Gender Male 6 103 60.3 927 58.9 Female 4 011 39.7 646 41.1 Age 15 - 24 year-olds 1 232 12.2 222 14.1 25 - 34 year-olds 3 539 35.0 534 34.0 35 - 44 year-olds 2 668 26.4 459 29.1 45 - 54 year-olds 1 865 18.4 261 16.6 55 - 65 year-olds 810 8.0 97 6.2 Education No education 258 2.6 11 0.7 * Grades 0 – 8 1 666 16.5 293 18.6 Grades 9 – 11 2 364 23.4 433 27.5 * Grade 12 3 349 33.1 516 32.8 Diploma/Certificate 1 485 14.7 179 11.4 * Degree 886 8.8 124 7.9
Source: Labour Force Survey (2003), Quarterly Labour Force Survey (2008), Own Calculations. Notes: An asterisk (*) denotes a statistically significant change between 2003 and 2008 at the 95 per cent level of
confidence.
The major employment sectors in the Western Cape in 2008 were Wholesale and Retail Trade (359 000 workers or 22.8 per cent of employment), Manufacturing (310 000 workers or 19.7 per cent of employment) and Community, Social and Personal (CSP) Services (308 000 workers or 19.6 per cent of employment) (Table 2.7). These three sectors account for 62.1 per cent of total Provincial employment.

WESTERN CAPE PROVINCIAL ECONOMIC REVIEW AND OUTLOOK 2009
56
Table 2.7 Sectoral distribution of formal employment, South Africa & Western Cape, 20082
South Africa Western Cape ‘000s Per cent ‘000s Per cent Agriculture, forestry & fishing 656 6.5 112 7.1 Manufacturing 1 697 16.8 310 19.7 * Construction 816 8.1 157 10.0 * Wholesale and retail trade 2 126 21.0 359 22.8 Transport, storage and communication 569 5.6 78 4.9 Financial and business services 1 512 14.9 236 15.0 CSP Services 2 328 23.0 308 19.6 *
Total 10 113 100.0 1 573 100.0
Source: Labour Force Survey (2003), Quarterly Labour Force Survey (2008), Own Calculations. Notes: An asterisk (*) denotes a statistically significant difference between the sectoral distributions of formal
employment in the Western Cape and South Africa respectively at the 95 per cent level of confidence. Mining and quarrying, and Utilities have been omitted from the table due to their negligible size within total
formal employment.
Statistically significant differences in the sectoral distribution of formal employment between the Western Cape and South Africa are observed only for manufacturing, construction and, CSP services. Simply by comparing these three sectors, it is evident that the Province’s economy is structured slightly different to the national economy. The construction sector accounts for 10.0 per cent of employment in the Province, compared to 8.1 per cent nationally, making it a somewhat more important employer in the Province than is the case nationally. Similarly, the manufacturing sector accounts for a larger share of employment provincially than is the case nationally (19.7 per cent in the Province, compared to 16.8 per cent nationally), making the Province’s employment somewhat more vulnerable to foreign competition. In contrast, CSP services employ a smaller share of the workforce in the Western Cape (19.6 per cent) than in South Africa (23.0 per cent).
More than a quarter of the Western Cape workforce is employed in high-skill occupations (managers, professionals and technicians), while the bulk (49.9 per cent) of the workforce is engaged in skilled occupations (clerks, services and sales, craft workers and operators) (Table 2.8). The remainder of the workforce, 20.9 per cent, is employed in elementary or low skill occupations. Besides elementary workers, the largest occupation groups in the Western Cape are craft workers (15.4 per cent) and clerks (15.0 per cent).
2 Selected sectors only

CHAPTER 2: LABOUR MARKET DYNAMICS IN THE WESTERN CAPE
57
Table 2.8 Occupational structure of formal employment, 20083
South Africa Western Cape ‘000s Per cent ‘000s Per cent Managers 972 9.6 140 8.9 Professionals 685 6.8 110 7.0 Technicians 1 371 13.6 198 12.6 Clerks 1 376 13.6 236 15.0 Service and sales 1 291 12.8 174 11.0 Crafts 1 358 13.4 242 15.4 Operators 1 028 10.2 134 8.5 Elementary 1 957 19.4 329 20.9
Total 10 113 100.0 1 573 100.0
Source: Quarterly Labour Force Survey (2008), Own Calculations. Notes: None of the proportions of the occupational structure of formal employment in the Western Cape are
statistically significant different than that of South Africa at the 95 per cent confidence level.
The concentration of skill level by industry within the Western Cape differs slightly to South Africa as whole. The high skilled workers in the Western Cape are concentrated in the CSP services (24.7 per cent of the workforce), financial and businesses service and wholesale and retail trade (22.9 per cent of the workforce) and manufacturing (14.9 per cent of the workforce). Nationally, high-skilled workers are employed in the CSP services (26.0 per cent of the workforce), financial and businesses service (24.4 per cent of the workforce) and wholesale and retail trade (19.9 per cent of the workforce).
The majority of medium-skilled workers in the Western Cape are found in wholesale and retail trade (23.9 per cent of the workforce), manufacturing (21.2 per cent) and CSP services (20.3 per cent). These three industries combined employ almost two-thirds of the medium-skilled workforce in the Province. A similar distribution of the medium-skilled workforce is found in the rest of South Africa.
3 Selected sectors only

WESTERN CAPE PROVINCIAL ECONOMIC REVIEW AND OUTLOOK 2009
58
Table 2.9 Skill structure of employment by industry, Western Cape and South Africa, 2008
Total employment
(‘000s)
High skilled
(%)
Medium skilled
(%) Low skilled
(%) Western Cape Agriculture, forestry & fishing 112 2.0 2.1 26.2 Manufacturing 310 14.9 21.1 19.2 Construction 157 6.7 10.5 10.8 Wholesale and retail trade 359 22.9 23.9 19.5 Transport, storage and communication
78 5.0 5.2 4.1
Financial and business services 236 22.9 15.8 6.6 CSP 308 24.7 20.3 13.3 Total 1 573 100.0 100.0 100.0 South Africa Agriculture, forestry & fishing 656 1.9 2.5 23.7 Manufacturing 1 697 12.6 18.4 14.9 Construction 816 6.0 7.4 11.9 Wholesale and retail trade 2 126 19.9 22.4 17.6 Transport, storage and communication
569 6.9 5.6 4.6
Financial and business services 1 512 24.4 14.4 8.7 CSP 2,328 26.0 24.6 15.1 Total 10 113 100.0 100.0 100.0
Source: Labour Force Survey (2003), Quarterly Labour Force Survey (2008), Own Calculations.
The bulk of the low-skilled workers in the Western Cape are employed in agriculture (26.2 per cent), wholesale, retail and trade (19.5 per cent) and manufacturing (19.2 per cent) sectors. Apart from the agricultural sector (23.7 per cent of the workforce), which is the leading sector employing low-skilled workers in South Africa, the two other key sectors are wholesale and retail trade (17.6 per cent of the workforce) and CSP services (15.1 per cent of the workforce).
5. Informal sector employment4 Informal sector workers were less likely to wholly benefit from the economic growth experienced in South Africa in the period under review (2003 to 2008) as they belong to a vulnerable and unprotected segment of the workforce.
Working in the informal sector would not be a first-choice for many workers as it provides less security, less stability, and lower wages than the formal sector. The informal sector does, however, provide a safety net of sorts as it provides employment to those who would otherwise be unemployed. Therefore, while the informal sector is less preferred than the formal sector, it does provide otherwise impoverished households with access to some income.
4 The Western Cape PER&O 2008 contains a more detailed analysis of the Western Cape informal sector for the period 2002 to 2007.

CHAPTER 2: LABOUR MARKET DYNAMICS IN THE WESTERN CAPE
59
Measuring the informal sector’s impact, performance, contribution to economic activity and poverty alleviation is not an easy task. One of the challenges in this regard relates to the availability of data, and more recently the development of time series in instances where the source of collection has undergone structural changes. A case in point is the change as mentioned between the 2003 and 2008 Labour Force Surveys, in which some questions were changed, questions have been omitted and new questions included. This difficulty is shared internationally, nationally as well as in the Province, where the extent of informal sector activities are often underestimated in surveys and to complicate matters further, many participants of this sector do not consider themselves to be part of the informal market.
5.1 Demographic composition of employment
The formal sector dominates employment in the Western Cape, the rest of South Africa (all provinces except for the Western Cape) and South Africa as a whole (see Table 2.10). In the Western Cape the formal sector contributes almost 90 per cent to total employment, compared to 80.2 per cent in the rest of South Africa as a whole. The informal sector employed 180 000 workers or 10.3 per cent of the total workforce in the Western Cape, while 2.292 million workers or 18.5 per cent of the total workforce employed in the informal sector within South Africa as a whole.
The Coloured population dominates the Western Cape’s informal sector, with 96 000 informal sector workers. These workers represent 53.5 per cent of the informal sector. This is in stark contrast to the rest of South Africa, where the Coloured population as a share of the informal sector is considerably less than that of the Western Cape. Specifically, 56 000 informal sector workers or 2.6 per cent of the informal sector and 152 000 workers or 6.6 per cent of informal sector workers belong to the Coloured population group.
The African population makes up the bulk of people employed in the informal sector within South Africa with 2.003 million informal sector workers or 87.4 per cent. In the Western Cape only 59 000 informal sector workers or 33.0 per cent of the informal sector are African. The White population represents an even smaller share in the Western Cape, and even less so in South Africa as a whole, with 23 000 informal sector workers or 12.5 per cent of the informal sector and 97 000 informal sector workers or 4.2 per cent of the informal sector belonging to the White population respectively. An analysis of the African and White population between the Western Cape, the rest of South Africa and South Africa as a whole is not possible as the results are not statistically significantly different at the 95 per cent level of confidence.
The Western Cape informal employment is male dominated, with males more likely to engage in the informal sector than the female population. Males account for 62.2 per cent of the informal sector while females constitute 37.8 per cent of the informal sector. The predominant age-groups engaged in informal activities in the Western Cape are those aged between 25 and 34 years, 35 and 44 years and 45 and 54 years. These age groups account for 29.9 per cent, 27.9 per cent and 23.2 per cent of the informal sector respectively. The young (between 15 and 24 years) and old (between 55 and 65 years) individuals form a small part of the informal sector, with 13.1 per cent and 5.9 per cent of the informal employment respectively within the Western Cape.
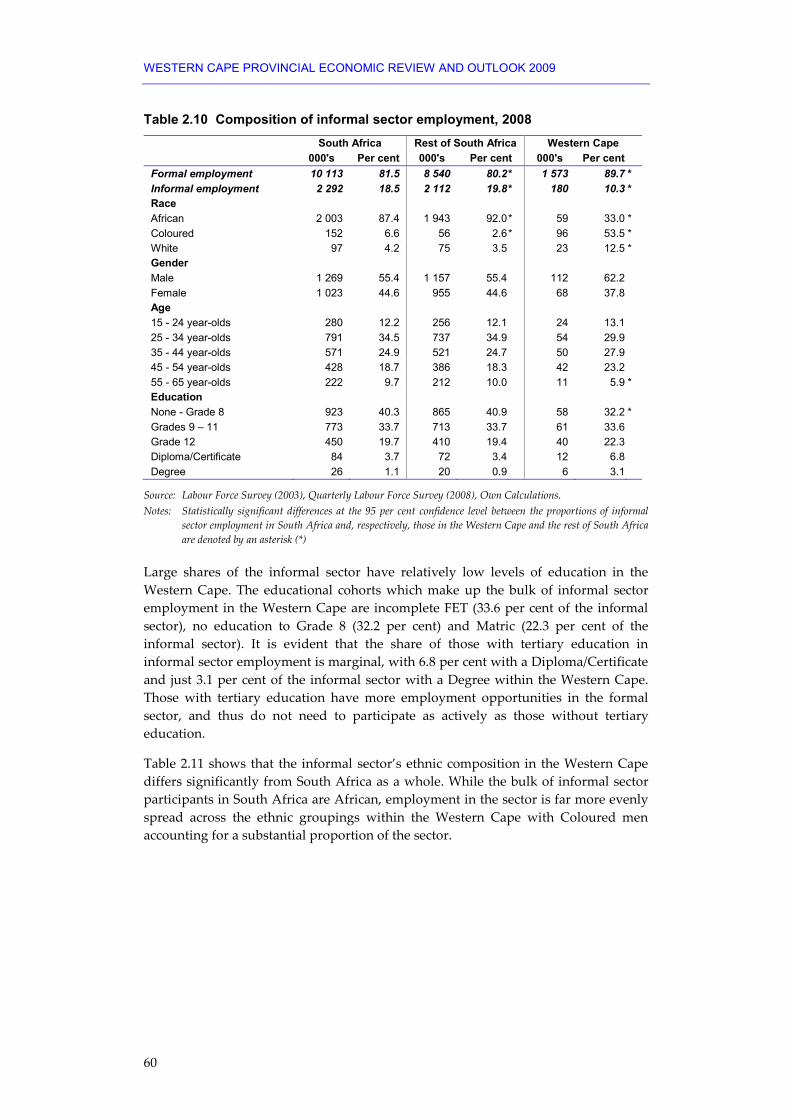
WESTERN CAPE PROVINCIAL ECONOMIC REVIEW AND OUTLOOK 2009
60
Table 2.10 Composition of informal sector employment, 2008 South Africa Rest of South Africa Western Cape 000's Per cent 000's Per cent 000's Per cent Formal employment 10 113 81.5 8 540 80.2* 1 573 89.7 * Informal employment 2 292 18.5 2 112 19.8* 180 10.3 * Race African 2 003 87.4 1 943 92.0* 59 33.0 * Coloured 152 6.6 56 2.6* 96 53.5 * White 97 4.2 75 3.5 23 12.5 * Gender Male 1 269 55.4 1 157 55.4 112 62.2 Female 1 023 44.6 955 44.6 68 37.8 Age 15 - 24 year-olds 280 12.2 256 12.1 24 13.1 25 - 34 year-olds 791 34.5 737 34.9 54 29.9 35 - 44 year-olds 571 24.9 521 24.7 50 27.9 45 - 54 year-olds 428 18.7 386 18.3 42 23.2 55 - 65 year-olds 222 9.7 212 10.0 11 5.9 * Education None - Grade 8 923 40.3 865 40.9 58 32.2 * Grades 9 – 11 773 33.7 713 33.7 61 33.6 Grade 12 450 19.7 410 19.4 40 22.3 Diploma/Certificate 84 3.7 72 3.4 12 6.8 Degree 26 1.1 20 0.9 6 3.1
Source: Labour Force Survey (2003), Quarterly Labour Force Survey (2008), Own Calculations. Notes: Statistically significant differences at the 95 per cent confidence level between the proportions of informal
sector employment in South Africa and, respectively, those in the Western Cape and the rest of South Africa are denoted by an asterisk (*)
Large shares of the informal sector have relatively low levels of education in the Western Cape. The educational cohorts which make up the bulk of informal sector employment in the Western Cape are incomplete FET (33.6 per cent of the informal sector), no education to Grade 8 (32.2 per cent) and Matric (22.3 per cent of the informal sector). It is evident that the share of those with tertiary education in informal sector employment is marginal, with 6.8 per cent with a Diploma/Certificate and just 3.1 per cent of the informal sector with a Degree within the Western Cape. Those with tertiary education have more employment opportunities in the formal sector, and thus do not need to participate as actively as those without tertiary education.
Table 2.11 shows that the informal sector’s ethnic composition in the Western Cape differs significantly from South Africa as a whole. While the bulk of informal sector participants in South Africa are African, employment in the sector is far more evenly spread across the ethnic groupings within the Western Cape with Coloured men accounting for a substantial proportion of the sector.

CHAPTER 2: LABOUR MARKET DYNAMICS IN THE WESTERN CAPE
61
Table 2.11 Composition of the informal sector by race and gender, 2008
South Africa Western Cape ‘000s Per cent ‘000s Per cent
African Male 1 081 47.2 34 18.7 Female 921 40.2 26 14.3
Coloured Male 102 4.5 65 36.3 Female 50 2.2 31 17.2
White Male 54 2.4 12 6.6 Female 43 1.9 11 5.9
Total Male 1 269 55.4 112 62.2 Female 1 023 44.6 68 37.8
Source: Labour Force Survey (2003), Quarterly Labour Force Survey (2008), Own Calculations.
African men (18.7 per cent) and Coloured females (17.2 per cent) are the next largest contributors to informal sector employment in the Province. Both White males and females constitute a small share of the informal sector in the Western Cape. However, when the white population in the Province is compared to that of South Africa, it is clear that a larger share of the White population participates in the informal sector within the Western Cape than South Africa.
5.2 Skills profile of the informal sector workforce
The skill structure of informal sector employment within the Western Cape mirrors that of South Africa. The Western Cape has, however, a slightly more skilled informal sector workforce, since medium-skilled workers account for almost two-thirds of informal sector employment, compared to 60.6 per cent of informal sector employment within South Africa as a whole belonging to the medium-skilled cohorts.
Table 2.12 Skills structure of informal sector, 2008
South Africa Western Cape ‘000s Per cent ‘000s Per cent Skilled workers 129 5.6 20 10.8 * Medium skilled workers 1,388 60.6 118 65.3 Low skilled workers 775 33.8 43 23.9 *
Total 2 292 100.0 180 100.0
Source: Labour Force Survey (2003), Quarterly Labour Force Survey (2008), Own Calculations.
The Western Cape also has a higher share of skilled workers within the informal sector than the country as a whole, accounting for 10.8 per cent of informal sector employment within the Western Cape and 5.6 per cent in South Africa. Low-skill workers account for 23.9 per cent of informal sector employment in the Province and 33.8 per cent nationally.

WESTERN CAPE PROVINCIAL ECONOMIC REVIEW AND OUTLOOK 2009
62
6. Unemployment in the Western Cape The estimates for unemployment are based exclusively on the official definition of unemployment since the broad definition used in the Quarterly Labour Force Surveys differs significantly from the Labour Force Survey. Additionally, despite the creation of a comparable variable of both the narrow and broad definition of unemployment, we continue to use the narrow definition of unemployment instead of the broad definition. The narrow definition of unemployment has not changed between the two labour force surveys and is thus more comparable over time than the broad definition of unemployment. All figures for the labour force analysed below uses the official definition of unemployment.
6.1 Demographic characteristics of unemployment
Narrow unemployment in the Western Cape increased by 55 000 people, from 393 000 in 2003 to 448 000 in 2008. The majority of the unemployed are evenly spread between the African and Coloured population, with 48.2 per cent of unemployed individuals belonging to the African population, and 48.4 per cent of unemployed individuals belonging to the Coloured population. The White population constitutes a mere 3.0 per cent of the unemployed. Nationally, the racial composition of unemployment is vastly different to that of the Western Cape, with 87.6 per cent of the unemployed classified as African. Coloureds and Whites make up a much smaller share of the unemployed, nationally 8.8 per cent and 2.0 per cent respectively.
The unemployed in the Western Cape in 2008 were almost equally split between males and females, with 49.3 per cent males and 50.7 per cent females. The majority of the unemployed in 2008 in the Western Cape (42.9 per cent of the unemployed) are aged between 25 and 34 years, 15 and 24 years (34.8 per cent of the unemployed), and 35 and 44 years (13.7 per cent of the unemployed). The national and provincial age structures of the unemployed are very similar, with 40.2 per cent, 34.1 per cent and 17.4 per cent of the unemployed aged between 25 and 34 years, 15 and 24 years, and 35 and 44 years respectively.
In the Western Cape, those with incomplete FET, GET and completed FET make up 42.9 per cent, 27.0 per cent and 24.6 per cent of the unemployed respectively. Nationally, it is individuals who have incomplete FET (38.6 per cent), completed FET (30.7 per cent) and GET (22.4 per cent) who constitute the majority of the unemployed.
While unemployment levels have increased within the Western Cape, the number of unemployed individuals has decreased nationally by 397 000 from 4.435 million in 2003 to 4.038 million unemployed. As for the changes in unemployment in the Western Cape, only the Coloured population, those aged between 25 and 34 years and individuals with incomplete FET experienced a statistically significant increase. The number of Coloured unemployed individuals’ grew at an average annual rate of 3.8 per cent, increasing from 181 000 to 217 000 between 2003 and 2008. Those aged between 25 and 35 years also experienced an increase in unemployment levels, from 133 000 in 2003 to 193 000 in 2008. The unemployment for this age cohort increased on average by 7.7 per cent per annum over the period of five years. Individuals with
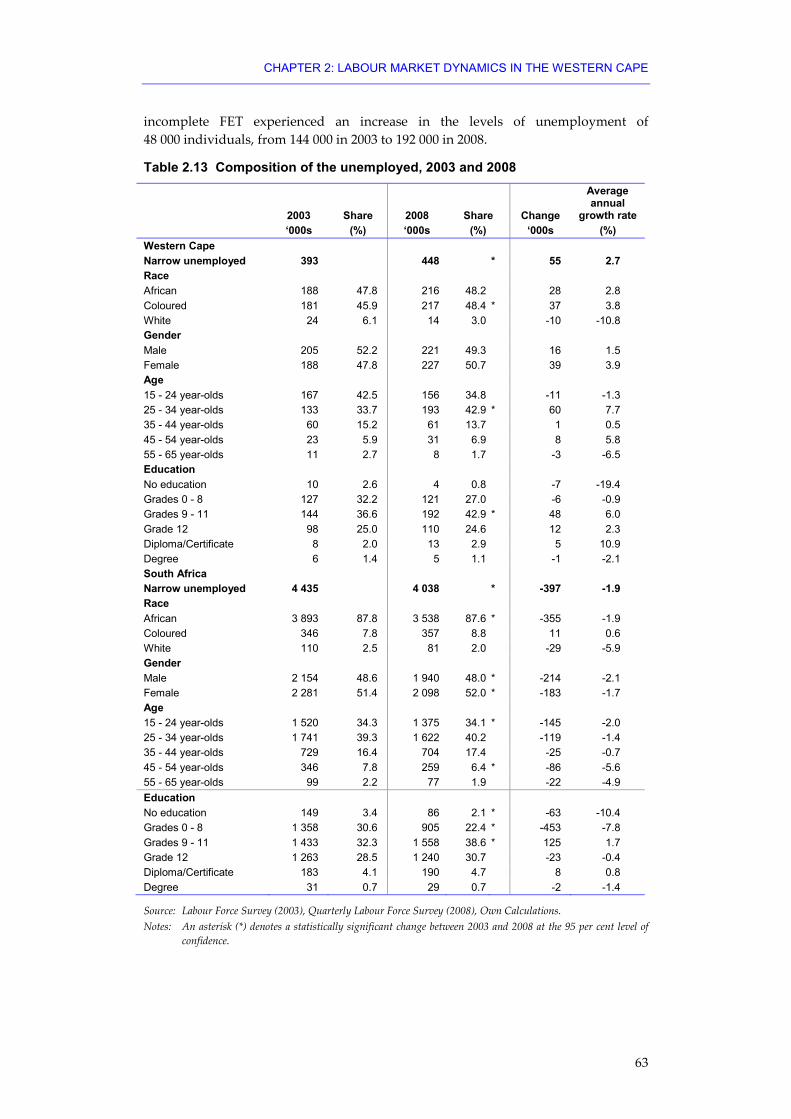
CHAPTER 2: LABOUR MARKET DYNAMICS IN THE WESTERN CAPE
63
incomplete FET experienced an increase in the levels of unemployment of 48 000 individuals, from 144 000 in 2003 to 192 000 in 2008.
Table 2.13 Composition of the unemployed, 2003 and 2008
2003 Share 2008 Share Change
Average annual
growth rate ‘000s (%) ‘000s (%) ‘000s (%) Western Cape Narrow unemployed 393 448 * 55 2.7 Race African 188 47.8 216 48.2 28 2.8 Coloured 181 45.9 217 48.4 * 37 3.8 White 24 6.1 14 3.0 -10 -10.8 Gender Male 205 52.2 221 49.3 16 1.5 Female 188 47.8 227 50.7 39 3.9 Age 15 - 24 year-olds 167 42.5 156 34.8 -11 -1.3 25 - 34 year-olds 133 33.7 193 42.9 * 60 7.7 35 - 44 year-olds 60 15.2 61 13.7 1 0.5 45 - 54 year-olds 23 5.9 31 6.9 8 5.8 55 - 65 year-olds 11 2.7 8 1.7 -3 -6.5 Education No education 10 2.6 4 0.8 -7 -19.4 Grades 0 - 8 127 32.2 121 27.0 -6 -0.9 Grades 9 - 11 144 36.6 192 42.9 * 48 6.0 Grade 12 98 25.0 110 24.6 12 2.3 Diploma/Certificate 8 2.0 13 2.9 5 10.9 Degree 6 1.4 5 1.1 -1 -2.1 South Africa Narrow unemployed 4 435 4 038 * -397 -1.9 Race African 3 893 87.8 3 538 87.6 * -355 -1.9 Coloured 346 7.8 357 8.8 11 0.6 White 110 2.5 81 2.0 -29 -5.9 Gender Male 2 154 48.6 1 940 48.0 * -214 -2.1 Female 2 281 51.4 2 098 52.0 * -183 -1.7 Age 15 - 24 year-olds 1 520 34.3 1 375 34.1 * -145 -2.0 25 - 34 year-olds 1 741 39.3 1 622 40.2 -119 -1.4 35 - 44 year-olds 729 16.4 704 17.4 -25 -0.7 45 - 54 year-olds 346 7.8 259 6.4 * -86 -5.6 55 - 65 year-olds 99 2.2 77 1.9 -22 -4.9 Education No education 149 3.4 86 2.1 * -63 -10.4 Grades 0 - 8 1 358 30.6 905 22.4 * -453 -7.8 Grades 9 - 11 1 433 32.3 1 558 38.6 * 125 1.7 Grade 12 1 263 28.5 1 240 30.7 -23 -0.4 Diploma/Certificate 183 4.1 190 4.7 8 0.8 Degree 31 0.7 29 0.7 -2 -1.4
Source: Labour Force Survey (2003), Quarterly Labour Force Survey (2008), Own Calculations. Notes: An asterisk (*) denotes a statistically significant change between 2003 and 2008 at the 95 per cent level of
confidence.

WESTERN CAPE PROVINCIAL ECONOMIC REVIEW AND OUTLOOK 2009
64
The unemployment picture for South Africa as a whole differs substantially from the Western Cape. Changes in unemployment levels for the African population were the only results for the racial groups, which were statistically significant at the 95 per cent level of confidence. The African population experienced a significant decline in levels of unemployment, from 3.893 million in 2003 to 3.538 million in 2008. This translates to an average decline in unemployment levels of 1.9 per cent per annum.
The male population experienced a larger decline between 2003 and 2008 in unemployment than their female counterparts, with a decline from 2.154 million to 1.940 million for the male population compared to a decline from 2.281 million to 2.098 million for females. Absolute unemployment levels are, however, higher and are declining less rapidly for females than for males, falling by 1.7 per cent and 2.1 per cent per annum respectively.
Those aged between 15 and 24 years experienced a decline of 145 000 individuals, from 1.520 million to 1.375 million unemployed, while those aged between 45 and 54 years saw a less significant declined in their unemployment levels of 86 000 or from 346 000 to 259 000 individuals.
The three educational categories which experienced statistically significant changes in unemployment at the 95 per cent level of confidence were those with no education, complete GET, and incomplete FET. The unemployed with incomplete FET increased from 1.433 million to 1.558 million, while the unemployed with no education and those with complete GET saw a decline in unemployment. The unemployed with complete GET education experienced the most significant decline in their unemployment levels, falling by 453 000 from 1.358 million to 905 000, while the unemployed with no education declined by 63 000, from 149 000 to 86 000.
Unemployment rates provide an indication of the severity of the unemployment problem afflicting specific groups. Again, the narrow definition of unemployment is used to define the unemployment rates for the various groups. Changes in unemployment rates for the African population, the White population, males, those aged between 15 and 24 years, 35 and 44 years, 55 and 65 years, individuals with no education, and individuals with completed FET are statistically significant at the 95 per cent level of confidence within the Western Cape.
It is evident that the narrow unemployment rate increased slightly in the Western Cape, from 19.2 per cent in 2003 to 20.2 per cent in 2008 (Figure 2.2). Disaggregation by race reveals contrasting fortunes in terms of unemployment rates for Africans and Whites on the one hand, and Coloureds on the other. The unemployment rates for Africans and Whites both saw statistically significant declines between 2003 and 2008, from 36.2 per cent to 30.2 per cent and from 5.6 per cent to 4.0 per cent respectively. Nevertheless, the rate of unemployment amongst Africans remained, in 2008, considerably higher than that of Coloureds, while Whites were by far least often unemployed. It therefore appears as if there is some convergence between Africans and Coloureds in terms of the overall probability of unemployment, although this is not true of Whites. The unemployment rates for males in the Western Cape decreased from 17.9 per cent in 2003 to 17.3 per cent in 2008. The unemployment rate for the females exceeded that of males in 2008 at 21.9 per cent compared to 17.3 per cent respectively.

CHAPTER 2: LABOUR MARKET DYNAMICS IN THE WESTERN CAPE
65
Figure 2.2 Western Cape unemployment rates, 2003 - 2008
Narrow Unemployed African Coloured White Male Female 15-24 25-34 35-44 45-54 55-65
2003 19.2 36.2 16.8 5.6 17.9 21.0 40.9 18.9 11.7 7.5 9.4
2008 20.2 30.2 17.3 4.0 17.3 21.9 38.3 23.8 10.0 8.6 5.9
05
1015202530354045
Per
cent
(%
)
Source: Labour Force Survey (2003), Quarterly Labour Force Survey (2008), Own Calculations.
Crucially, the unemployment rate for those aged between 15 and 24 years declined, from 40.9 per cent to 38.3 per cent. While this age cohort has experienced a slight decline in their unemployment levels, it is important to note that those aged between 15 and 24 years have the highest unemployment rates when compared to the other age cohorts. The unemployment rate for persons aged between 35 and 44 years and those aged between 55 and 65 years declined, from 11.7 per cent in 2003 to 10 per cent in 2008 for persons aged between 35 and 44 years and from 9.4 per cent in 2003 to 5.9 per cent in 2008 for persons aged between 55 and 65 years. Not only did those aged between 55 and 65 years experience the largest decline in their unemployment rate, but they are also the age cohort which experienced the lowest unemployment rates in 2008.
When considering the duration of current unemployment, it is evident that a large share of the individuals experienced unemployment for less than a year in 2008. However two observations with regard to unemployment in 2008 of the 15 - 24 group are made: 38.8 per cent of those aged between 15 and 24 years were unemployed for less than a year, while 48.1 per cent of persons aged between 15 and 24 years reported that they have never worked.
Table 2.14 Duration of unemployment, 2008
15 - 24 Years 25 - 34 Years 35 - 44 Years 45 - 54 Years 55 - 65 Years Western Cape < 1 year 38.8 48.7 56.8 51.8 39.3 < 3 years 11.0 16.7 14.4 27.4 14.9 3 years + 2.2 14.8 23.5 18.0 41.8 Never worked 48.1 19.8 5.3 2.8 3.9
Total 100.0 100.0 100.0 100.0 100.0 South Africa < 1 year 23.0 31.6 35.8 32.6 32.8 < 3 years 7.1 12.7 13.7 12.4 9.5 3 years + 2.5 15.3 34.4 50.7 54.9 Never worked 67.3 40.4 16.1 4.3 2.8
Total 100.0 100.0 100.0 100.0 100.0
Source: Quarterly Labour Force Survey (2008), Own Calculations.

WESTERN CAPE PROVINCIAL ECONOMIC REVIEW AND OUTLOOK 2009
66
The bulk of the unemployed for the other age cohorts, i.e. for those aged between 35 and 44 years, 45 and 54 years, and 55 and 65 years, experienced relatively short periods of unemployment. More than half of those aged between 35 and 44 years, and 45 and 54 years experienced frictional unemployment, i.e. less than one year of unemployment. The duration of unemployment for those aged between 55 and 65 years were evenly split between less than one year (39.3 per cent) and more than three years (41.8 per cent).
The Western Cape finds itself in a favourable position relative to the rest of the country, as a larger share of those aged between 15 and 24 years and 25 and 34 years have never worked in South Africa as a whole. Nationally, 67.3 per cent of unemployed persons aged between 15 and 24 years have never worked, in contrast to the Western Cape where almost half of persons aged between 15 and 24 years have never worked. For those aged between 25 and 35 years in South Africa as a whole, 40.4 per cent report that they have never worked, whereas in the Western Cape, 19.8 per cent of the same age cohort report that they have never worked. Furthermore, in South Africa as a whole, more than half of those aged between 45 and 54 years, and 55 and 65 years report that they have been unemployed for longer than three years whereas in the Western Cape the share of those unemployed for longer than three years is less severe than the duration of unemployment in South Africa as a whole.
6.2 A profile of unemployed youth
Both in South Africa and in the Western Cape, youth (defined as those aged between 15 and 35 years) experienced a significantly higher unemployment rate than non-youth. Importantly, youth in the Western Cape experienced lower unemployment rates than their counterparts in the rest of the country for the narrow unemployed. The narrow unemployment rate for the youth in the Western Cape was 28.6 per cent compared to 32.4 per cent for the youth in South Africa.
Table 2.15 Unemployment rates for youth and non-youth, 2008
Per cent South Africa Western Cape Youth Narrow unemployment rate 32.4 28.6 Broad unemployment rate 37.4 29.6 Non-youth Narrow unemployment rate 12.3 9.1 Broad unemployment rate 15.5 9.9
Source: Quarterly Labour Force Survey (2008), Own Calculations.
Youth experienced significantly higher rates of unemployment than the non-youth. In South Africa, the narrow unemployment rate for youth was 32.4 per cent, compared to 12.3 per cent for the non-youth population. Similarly, the unemployment rate, for the non-youth in the Western Cape was lower than the unemployment rate for South Africa as a whole. The unemployment rate for the youth in the Western Cape was 28.6 per cent compared to 9.1 per cent for the non-youth.

CHAPTER 2: LABOUR MARKET DYNAMICS IN THE WESTERN CAPE
67
Figure 2.3 clearly shows that the unemployment rates for the youth in the Western Cape is significantly higher than the unemployment rates for the non-youth across the demographic groups.
Figure 2.3 Narrow youth and non-youth unemployment rates in the Western Cape, 2008
Narrow unemployment rate (per cent)
28.6
37.6
25.9
5.1
25.6
32
36.7
36
22.2
11.6
7.3
9.1
16.1
8.4
3.6
8.9
9.4
12.8
13.2
12.5
5.9
3.1
2.1
68.4
0 10 20 30 40 50 60 70
All
African
Coloured
White
Male
Female
No Educ
Gr 0-8
Gr 9-11
Gr 12
Dip/Cer
Degree
Youth Non-youth
Source: Labour Force Survey (2003), Quarterly Labour Force Survey (2008), Own Calculations.
The youth unemployment rate for the various education cohorts is unsurprising, as the evidence clearly shows that the youth that have little or no education, experience the highest unemployment rates. Youth with tertiary education, and to some extent youth with completed secondary education, experience lower unemployment rates than youth with no or little education. This is less true for the non-youth population of the Western Cape, where the unemployment rates range between 12.8 per cent for those with no education to 12.5 per cent for those who have incomplete FET. The unemployment rates for the non-youth population in the Western Cape peaked at 13.2 per cent for persons with primary school education.

WESTERN CAPE PROVINCIAL ECONOMIC REVIEW AND OUTLOOK 2009
68
7. A note on recent labour market trends The economic turmoil originating in the US and other developed economies has quickly spread around the world, with most countries experiencing sharply weaker growth and, often, even recession. As a result, South Africa entered its first recession in 17 years in 2009. Within this weak economic environment, coupled with a relatively strong Rand and recession hitting our major trading partners, it is inevitable that the labour market would be impacted.
The first real evidence from the QLFSs of deteriorating labour market conditions emerged from the first quarter of 2009, which saw the national economy shed almost 200 000 jobs and unemployment surging by over 300 000 – an increase of eight per cent. Between the third quarter of 2008 and the third quarter of 2009, employment contracted by 5.6 per cent to 12.885 million nationally. Interestingly, narrow unemployment was virtually unchanged over the period, particularly when the controversial figures from the fourth quarter of 2008 are discounted. As a result, there has been a somewhat subdued rise in the rate of unemployment, from 23.2 per cent in the third quarter of 2008, to 23.6 per cent in the second quarter of 2009, although the third quarter saw an increase in the unemployment rate of almost one percentage point to 24.5 per cent. However, what has happened is that the number of discouraged workseekers has surged over the period, from 1.071 million to 1.632 million, equivalent to growth of 52.4 per cent. The surge in the number of discouraged workseekers is as a result of individuals shifting from employment to unemployment and exiting the labour force as discouraged workseekers. This in turn has resulted in the labour force participation rate, declining by 2.9 percentage points to 54.8 per cent nationally. On a year-on-year basis, most job losses nationally originated in wholesale and retail trade (a loss of 324 000 jobs), manufacturing (194 000 jobs), agriculture (114 000 jobs) and private households (108 000 jobs). The only sectors to experience growth in employment over the past year are finance (50 000 jobs) and CSP services (24 000 jobs).
The Western Cape has, thus far, been less impacted, with employment unchanged over the period. Employment in the province stood at just under 1.9 million in the third quarter of 2009. While the national economy saw job losses, but relatively stable unemployment numbers over the period, the Western Cape economy saw stagnant employment and a rapid increase in unemployment numbers. The unemployment rate increased by 2.8 percentage points to 22.5 per cent in the third quarter of 2009, while the labour force participation rate, in contrast to the national trend, rose by 1.6 percentage points to 68.7 per cent. This appears to indicate a more favourable situation in terms of perceptions surrounding the labour market, with people more likely to actively seek employment in the Province than nationally, although this may be related to relatively lower costs associated with job search in the Province.
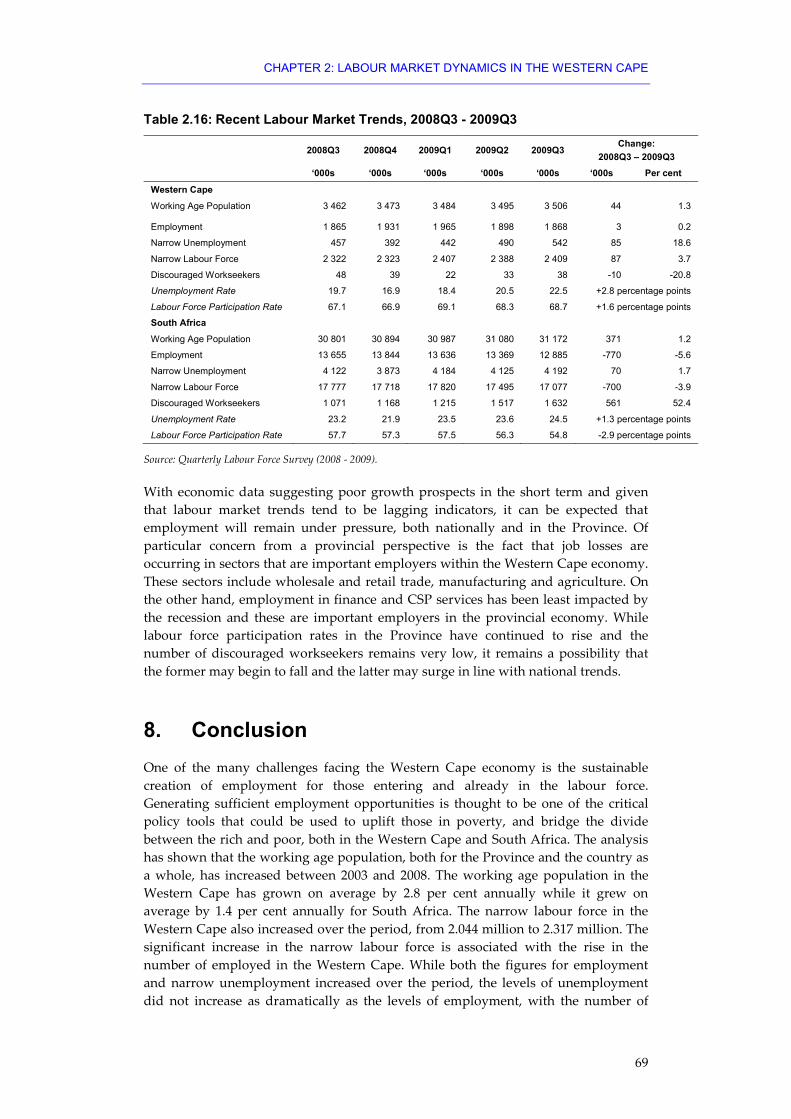
CHAPTER 2: LABOUR MARKET DYNAMICS IN THE WESTERN CAPE
69
Table 2.16: Recent Labour Market Trends, 2008Q3 - 2009Q3
2008Q3 2008Q4 2009Q1 2009Q2 2009Q3 Change:
2008Q3 – 2009Q3
‘000s ‘000s ‘000s ‘000s ‘000s ‘000s Per cent
Western Cape
Working Age Population 3 462 3 473 3 484 3 495 3 506 44 1.3
Employment 1 865 1 931 1 965 1 898 1 868 3 0.2
Narrow Unemployment 457 392 442 490 542 85 18.6
Narrow Labour Force 2 322 2 323 2 407 2 388 2 409 87 3.7
Discouraged Workseekers 48 39 22 33 38 -10 -20.8
Unemployment Rate 19.7 16.9 18.4 20.5 22.5 +2.8 percentage points
Labour Force Participation Rate 67.1 66.9 69.1 68.3 68.7 +1.6 percentage points
South Africa
Working Age Population 30 801 30 894 30 987 31 080 31 172 371 1.2
Employment 13 655 13 844 13 636 13 369 12 885 -770 -5.6
Narrow Unemployment 4 122 3 873 4 184 4 125 4 192 70 1.7
Narrow Labour Force 17 777 17 718 17 820 17 495 17 077 -700 -3.9
Discouraged Workseekers 1 071 1 168 1 215 1 517 1 632 561 52.4
Unemployment Rate 23.2 21.9 23.5 23.6 24.5 +1.3 percentage points
Labour Force Participation Rate 57.7 57.3 57.5 56.3 54.8 -2.9 percentage points
Source: Quarterly Labour Force Survey (2008 - 2009).
With economic data suggesting poor growth prospects in the short term and given that labour market trends tend to be lagging indicators, it can be expected that employment will remain under pressure, both nationally and in the Province. Of particular concern from a provincial perspective is the fact that job losses are occurring in sectors that are important employers within the Western Cape economy. These sectors include wholesale and retail trade, manufacturing and agriculture. On the other hand, employment in finance and CSP services has been least impacted by the recession and these are important employers in the provincial economy. While labour force participation rates in the Province have continued to rise and the number of discouraged workseekers remains very low, it remains a possibility that the former may begin to fall and the latter may surge in line with national trends.
8. Conclusion One of the many challenges facing the Western Cape economy is the sustainable creation of employment for those entering and already in the labour force. Generating sufficient employment opportunities is thought to be one of the critical policy tools that could be used to uplift those in poverty, and bridge the divide between the rich and poor, both in the Western Cape and South Africa. The analysis has shown that the working age population, both for the Province and the country as a whole, has increased between 2003 and 2008. The working age population in the Western Cape has grown on average by 2.8 per cent annually while it grew on average by 1.4 per cent annually for South Africa. The narrow labour force in the Western Cape also increased over the period, from 2.044 million to 2.317 million. The significant increase in the narrow labour force is associated with the rise in the number of employed in the Western Cape. While both the figures for employment and narrow unemployment increased over the period, the levels of unemployment did not increase as dramatically as the levels of employment, with the number of

WESTERN CAPE PROVINCIAL ECONOMIC REVIEW AND OUTLOOK 2009
70
employed individuals increasing by 219 000 individuals and the amount of unemployed increasing by 55 000 individuals.
Total employment, which includes formal and informal employment, grew at a slower rate in the Province (2.5 per cent annually) than in South Africa (4.2 per cent annually). While the Coloured population accounted for the bulk of the employed in the Western Cape in 2008, this was not true for South Africa as a whole, where 70.0 per cent of the employed were Africans. The racial composition of the employed has shifted somewhat in the Western Cape, with the African population making up a larger share of the employed, whereas the portion of White employed workers has declined somewhat. The reason for the significant decline in the White population remains unclear. One more unexpected result was the increase in the share of employed with incomplete FET education: increasing from 395 000 to 527 000. Even though those with incomplete FET education increased dramatically, the education cohort with the greatest number of individuals employed were those that completed Grade 12.
It was not possible to analyse formal and informal employment over time due to the change in the construction of the formal and informal sector between the LFS and the QLFS. The analyses of the formal and informal sectors have thus been restricted to 2008 for the Western Cape and South Africa. The majority of the employed in the Western Cape are engaged in the formal sector, with the formal sector contributing almost 90.0 per cent to total employment. The Coloured population dominates the formal sector in the Province, with more than half of the employed belonging to this race group. The racial composition of the employed in South Africa is significantly different since 63.3 per cent of the employed belong to the African population group, compared to 24.8 per cent of the employed in the Western Cape belonging to the same population group. As for the education cohorts, the majority of the employed have Matric (32.8 per cent), incomplete FET (27.5 per cent) and complete GET (18.6 per cent). The Western Cape has a smaller share of individuals which has no education (0.7 per cent) compared to the national share (2.6 per cent), and a larger share of individuals with incomplete FET: 27.5 per cent for the Western Cape in contrast to 23.4 per cent for South Africa). There is however a greater share of the employed with a diploma or certificate in South Africa (14.7 per cent) compared to this employed in the Province (11.4 per cent).
The structure of the Western Cape economy shows that the three major employment sectors were wholesale and retail trade, manufacturing and CSP services. Comparing South Africa to the Western Cape, where possible, shows that the share of employment differs between sectors, with manufacturing and construction playing a more dominant role in employment for the Province than in South Africa, while CSP services playing a less significant role in employment in the Province. In terms of occupational structure, we see that almost half of the employed are engaged in medium-skill occupations. The remainder of the workforce is split roughly between high and low skilled occupations.

CHAPTER 2: LABOUR MARKET DYNAMICS IN THE WESTERN CAPE
71
Informal sector employment plays a very small role in the Western Cape, with only 10.3 per cent of the employed engaged in this sector. Once more, the racial composition of the informal sector in the Western Cape is significantly different to that of the national informal sector. Coloureds are the population group which dominate informal sector employment in the Western Cape, followed by the Africans and the Whites. Nationally, it is Africans, which make up almost 90.0 per cent of the informal sector employment, and the remainder of the workforce is split roughly between Coloureds (6.6 per cent) and Whites (4.2 per cent). Informal sector employment is mostly made-up of those aged between 25 and 34 years (29.9 per cent), 35 and 44 years (27.9 per cent) and 45 and 54 years (23.2 per cent). The education level of the informal sector in the Western Cape is largely distributed across the lower education cohorts. Most of those employed have incomplete FET education (33.6 per cent), none to Grade 8 (32.2 per cent) and Grade 12 (22.3 per cent).
Unlike the national trend, which saw narrow unemployment decreasing significantly between 2003 and 2008, the Province experienced a rise in narrow unemployment levels. The change in narrow unemployment levels for Coloureds were the only statistically significant changes, with their unemployment levels increasing by 37 000, from 181 000 to 217 000. Those aged between 25 and 34 and those with incomplete FET also experienced a substantial increase in their unemployment levels, growing on average by 7.7 per cent and 6.0 per cent respectively. The evidence suggests that the younger workforce is struggling to find employment, with 48.1 per cent of those unemployed who are aged between 15 and 24 years having never worked. Very few of those older unemployed individuals who are older than 35 have never worked before, (5.3 per cent for those aged between 35 and 44 years, 2.8 per cent for those aged between 45 and 55 years, and 3.9 per cent for those aged between 55 and 65 years). These results have important implications for the younger unemployed, since the longer the unemployed remain unemployed, the less likely it is that they will be employed, which could lead to a large chunk of the future labour force experiencing chronic unemployment.
Yet again, youth unemployment is higher than non-youth unemployment. Despite the higher levels of education of the youth, they nonetheless struggle to find employment. It appears that the unemployment levels for the youth remain high across the education cohorts, especially for the youth that have no education, complete GET and incomplete FET. It is only those that have a diploma or a degree that experience lower unemployment rates. The relatively high unemployment rates among the youth have a strong social implication, with unemployed youth more likely to engage in activities which are both destructive to themselves, and society in general.

WESTERN CAPE PROVINCIAL ECONOMIC REVIEW AND OUTLOOK 2009
72
Appendix 1
Labour market specific terminology definitions
Discouraged work-seeker is a person who was not employed during the reference period, wanted to work, was available to work/start a business but did not take active steps to find work during the last four weeks, provided that the main reason given for not seeking work was any of the following: no jobs available in the area; unable to find work requiring his/her skills; lost hope of finding any kind of work.
Economic activities are those that contribute to the production of goods and services in the country. There are two types of economic activities as follows: (1) Market production activities (work done for others and usually associated with pay or profit) and (2) Non-market production activities (work done for the benefit of the household e.g. subsistence farming).
Persons employed in market production activities are those (aged 15 - 65 years) who during the reference week, even if it was for only one hour, did any of the following:
• Worked for a wage, salary, commission or payment in kind (including paid domestic work).
• Ran any kind of business, big or small, on their own or with one or more partners.
• Helped without being paid in a business run by another household member. Persons helping unpaid in such businesses who were temporarily absent in the reference week are not considered as employed, they are routed eventually to questions about: job search activities; their desire to work; and their availability to work - to determine whether they are unemployed or inactive.
• Were temporarily absent from their jobs or businesses to which they would definitely return. They could have been absent in the reference week but definitely returning to their job if the reason given for their absence was any of the following: ill-health, vacation leave, caring for family or others; maternity or paternity leave, other family/community obligations; strike/stay-away/lockout; problems with transport; bad weather; study or training leave; unrest; temporarily laid off; other reasons. There are two groups of individuals that may have been temporarily absent from their jobs in the reference week who are not considered as being employed as follows:
i) Persons who were absent from work in the reference week because of seasonal factors.
ii) Persons who were absent from work in the reference week because they had a new job or business to start at a definite date in the future.

CHAPTER 2: LABOUR MARKET DYNAMICS IN THE WESTERN CAPE
73
Informal sector: (This definition is subject to review pending final consultations with the ILO). The informal sector has two components as follows:
• Employees working in establishments that employ less than five employees and do not deduct income tax from their salary/wage;
• Employers, own account workers and persons helping unpaid in their household business who are not registered for either income tax or value-added tax.
The labour force comprises all persons who are employed plus all persons who are unemployed.
Labour absorption rate/employment to population ratio is the proportion of the working age population that is employed.
Labour force participation rate is the proportion of the working age population that is either employed or unemployed.
Market production activities: The production of goods and services for sale, such activities are associated with payment. See economic activities.
Non-market production activities: The production of goods and services for household consumption/use, such activities are not associated with payment. See economic activities.
Not economically active: Persons aged 15 - 65 years who are neither employed nor unemployed in the reference week.
Unemployed persons are those (aged 15 - 65 years) who:
• Were not employed in the reference week.
• Actively looked for work or tried to start a business in the four weeks preceding the survey interview.
• Were available for work i.e. would have been able to start work or a business in the reference week.
Unemployment rate is the proportion of the labour force that is unemployed.
The working-age population comprises all persons aged 15 - 65 years.
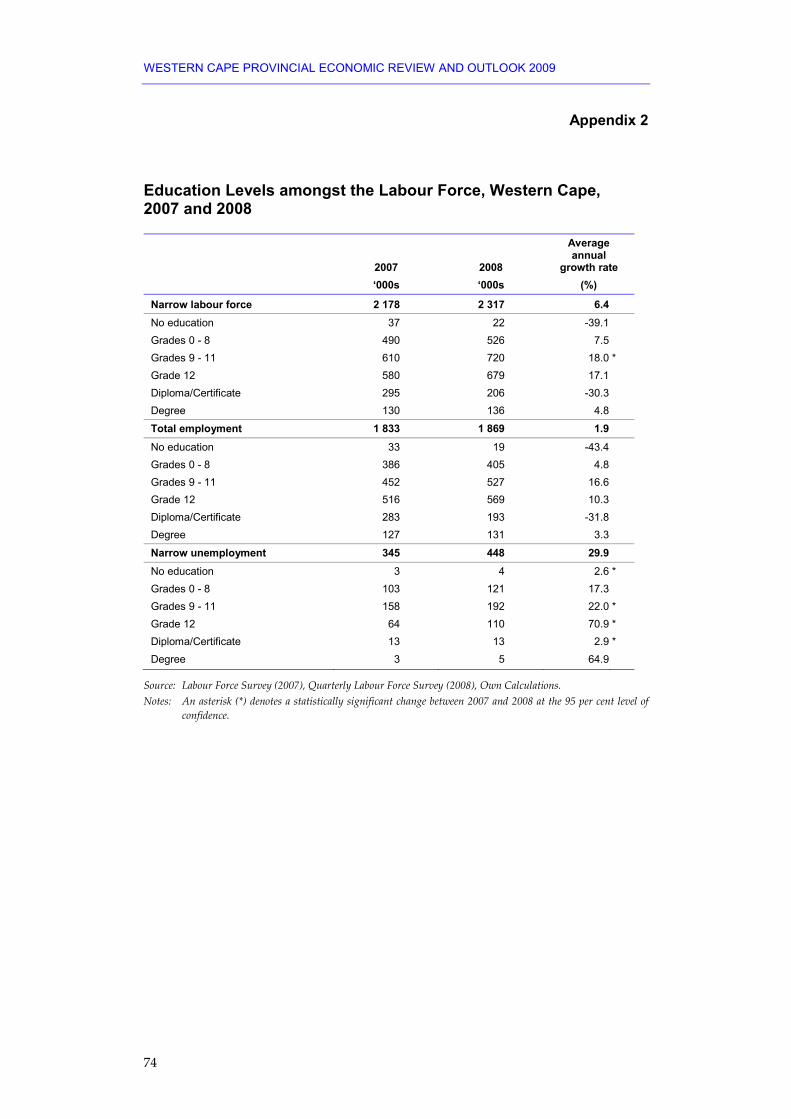
WESTERN CAPE PROVINCIAL ECONOMIC REVIEW AND OUTLOOK 2009
74
Appendix 2
Education Levels amongst the Labour Force, Western Cape, 2007 and 2008
2007 2008
Average annual
growth rate ‘000s ‘000s (%)
Narrow labour force 2 178 2 317 6.4 No education 37 22 -39.1 Grades 0 - 8 490 526 7.5 Grades 9 - 11 610 720 18.0 * Grade 12 580 679 17.1 Diploma/Certificate 295 206 -30.3 Degree 130 136 4.8
Total employment 1 833 1 869 1.9 No education 33 19 -43.4 Grades 0 - 8 386 405 4.8 Grades 9 - 11 452 527 16.6 Grade 12 516 569 10.3 Diploma/Certificate 283 193 -31.8 Degree 127 131 3.3
Narrow unemployment 345 448 29.9 No education 3 4 2.6 * Grades 0 - 8 103 121 17.3 Grades 9 - 11 158 192 22.0 * Grade 12 64 110 70.9 * Diploma/Certificate 13 13 2.9 * Degree 3 5 64.9
Source: Labour Force Survey (2007), Quarterly Labour Force Survey (2008), Own Calculations. Notes: An asterisk (*) denotes a statistically significant change between 2007 and 2008 at the 95 per cent level of
confidence.

75
3
Overview of the Western Cape Economic Sectors Key findings:
• The Western Cape has maintained faster growth than the national average, growing its relative contribution to the national GDP.
• Growth in the Province has been characterised by a relative decline in the contribution of manufacturing to regional GDP. It is largely the growth in the services industry, and to a lesser extent construction, that allowed the Western Cape to grow faster than the national average.
• The current recession has adversely affected almost all of the sectors of the Western Cape economy.
• Although there have been some significant firm closures, particularly in manufacturing and more particularly in export oriented labour intensive sectors such as clothing, overall productive capacity has remained intact.
• Although the agricultural production capacity could be harmed by the availability of credit, stricter regulation and extreme market volatility, the fundamental demand for agricultural commodities has not decreased significantly.
• Since the onset of the global economic downturn, the boat-building industry has seen many boat yards doing smaller repair jobs, training interventions and workshop maintenance in an attempt to avoid retrenching staff.
• Although the import quota agreement with China shielded the clothing and textile industries from Chinese imports, its protection was weakened by imports from other countries.
WESTERN CAPE PROVINCIAL ECONOMIC REVIEW AND OUTLOOK 2009
76
• South Africa, and hence the Western Cape, does not rate highly in terms of its competitiveness as a low cost location, relative to other Business Process Outsourcing (BPO) locations such as Malaysia, Egypt, Philippines, etc.
1. Introduction In Chapter 1 Macroeconomic Review and Outlook, the emphasis is on the impact of the global contraction and its contagious effect in causing a deep recession in South Africa. The Western Cape, as a sizeable producer of tradable goods and services, and therefore exposed to the fluctuations in economic activity, has also been adversely affected.
In this chapter, which reviews the economic conditions by sector at a more micro level, it is possible to dwell on the recessionary spin-offs with respect to sector development and the divergent impact of the recession on the different sectors and markets. However, the approach adopted was to take the old saying of “this (the recession) too will pass” as the point of departure and to focus on the longer term, whether in terms of a historical perspective on structural change or looking ahead to what the future might hold for these sectors.
The chapter reviews development in the economic sectors identified by division of the Standard Industrial Classification (SIC) with a specific focus on the three sectors making the largest contribution to economic activity in the Province. As discussed in Chapter 1 these sectors are broadly the financial intermediation, insurance, real estate & business services sector (approximately 30.6 per cent of GDP-R), manufacturing (17.1 per cent) and the wholesale, retail trade, catering and accommodation sectors (16.3 per cent).
Furthermore, the agricultural sector and sectors that have been identified in terms of the Microeconomic Development Strategy (MEDS) are also briefly reviewed.
In writing the chapter, the ubiquitous problem experienced by researchers working on regional issues was the lack of disaggregated hard data. What is presented in the chapter must be judged against the background of the paucity of published data. Nonetheless, the aim is to provide a general and broad overview relying on available data and sector specific surveys.
2. Sector Developments Amongst others, Chapter 1 broadly discussed the growth and outlook of the Western Cape economic sectors. This is now taken further to give an overview of the relative performance of Western Cape industries and their development patterns, with reference to the national situation, and summarised in Tables 3.1 and 3.2. These tables allow a number of observations with respect to the pattern of development, bearing in mind the caveat that a decline in the percentage share of a sector in output does not necessarily equate to a decline in the real value of the sector’s share. For example, the real production of manufacturing might increase while the relative share of the sector in total output falls, which will occur if other sectors grow faster.

CHAPTER 3: OVERVIEW OF THE WESTERN CAPE ECONOMIC SECTORS
77
2.1 Contribution of Western Cape sectors to national aggregates
Table 3.1 shows trends in the contribution of the different sectors in the Western Cape to the national aggregate of value added for those sectors.
Table 3.1 Western Cape production (%) to national aggregate of value added
1995 2000 2004 2008
Gross domestic product 14.2 14.2 14.7 15.0
Manufacturing 15.9 15.1 14.8 14.7
Food, bev & tobacco 24.4 24.0 24.1 24.6
Textiles, clothing and leather 23.2 22.2 21.9 21.9
Metal, products & machinery 10.9 10.4 10.0 9.9
Wood, paper, publishing & printing 17.9 17.2 16.1 15.3
Petroleum, chemicals, rubber & plastics 13.2 13.1 13.2 13.5
Wholesale & retail trade 14.3 15.3 15.8 15.9
Catering and accommodation 18.7 20.0 20.6 20.9
Transport & storage 13.7 14.0 13.7 13.9
Finance & insurance 19.9 19.0 20.0 20.2
Business services 21.3 20.9 21.4 21.9
Source: Calculated from Quantec data and estimates, 2009
From 1995 to 2008 the Western Cape succeeded in marginally increasing its share in national GDP: from 14.2 per cent to an estimated 15.0 per cent in 2008. This indicates that the Western Cape grew faster than the national average over this period. It should be noted that if Gauteng, which is by far the most economically dominant province, is excluded, the comparative growth performance of the Western Cape is even more pronounced.
Manufacturing, through the process of industrialisation, is widely considered to be the growth engine of economic development. Table 3.1 shows that the relative contribution achieved of Western Cape manufacturing to national manufacturing GDP, has consistently declined, from 15.9 per cent in 1995 to an estimated 14.7 per cent in 2008.
If the contribution of selected subsectors of manufacturing to the respective national aggregates are considered, it is clear that the decline of the Western Cape’s share in national manufacturing can be related to declines in prominent manufacturing sectors.

WESTERN CAPE PROVINCIAL ECONOMIC REVIEW AND OUTLOOK 2009
78
The Western Cape has traditionally been the heartland of the textile and clothing industry. This is a declining industry nationally, but even so, the Western Cape share in the national textile and clothing output is estimated to have fallen from 23.2 per cent in 1995 to 21.9 per cent in 2008. However, for the Western Cape, the contribution of textiles and clothing to the national output remains one of the largest of all sub-sectors of economic output. Another manufacturing subsector that experienced a decline in its share in national output over the same period is wood, paper, publishing and printing, which suffered a decline of 2.6 percentage points.
Metal, metal products and machinery, also decreased its share in national output, while petroleum, chemicals, rubber and plastics maintained its share. On the other hand, finance and insurance have increased its share relative to the national output. The high and increasing share of catering and accommodation can be linked to the prominence of the Western Cape as a tourist destination.
2.2 Trends in the Western Cape and South African sectoral contributions to GDP
Table 3.2 below illustrates trends in the relative sectoral contributions to total output in the Western Cape and national economy for the selected key sectors.
Table 3.2 Sector distribution (%) of gross domestic product at basic prices, constant 2000 prices
1995 2000 2002 2004 2006 2008 Manufacturing W Cape 21.7 20.2 19.3 18.2 17.8 17.1 RSA 19.3 19.0 18.9 18.0 17.9 17.4 Trade, catering & accom W Cape 14.2 16.1 15.9 16.4 16.9 16.3 RSA 13.7 14.6 14.3 14.9 15.5 15.3 Finance & insurance W Cape 9.3 10.9 12.5 14.0 15.3 17.5 RSA 6.6 8.2 9.4 10.3 11.4 13.0 Business services W Cape 16.0 15.4 15.6 15.5 14.5 13.2 RSA 10.6 10.5 10.7 10.6 9.9 9.0
Source: Calculated from Quantec data, 2009
In 1995 the share of manufacturing in the regional GDP exceeded the share of manufacturing in the national GDP. Since then the situation has changed fairly dramatically, with the share of manufacturing in the Western Cape GDP falling by 4.6 percentage points compared to the national decline of 1.9 percentage points in the contribution of manufacturing to GDP. A tentative conclusion would be that the economy of the Western Cape is de-industrialising.

CHAPTER 3: OVERVIEW OF THE WESTERN CAPE ECONOMIC SECTORS
79
Considering the decline in the relative contribution of manufacturing, the increasing importance of service industries is a striking and compensating feature of the development of the Western Cape economy. Table 3.2 shows the increasing shares for the following subsectors in the regional GDP over the period 1995 to 2008: trade, catering and accommodation (with the exception of a slight decline in 2008); and finance and insurance. Business services also show a slight decline in their share of the Western Cape GDP-R.
2.3 A synopsis of the major contributing sectors in the Western Cape
The Western Cape economy in recent years has undergone significant changes in its pattern of production, primarily characterised by a decline in the relative position of manufacturing. The regional economy is conceivably in a process of de-industrialisation. On the other hand, the faster growth in the regional GDP, compared to the growth of the national economy is relevant to the growth in the service sectors. This phenomenon is not necessarily a weak point with respect to future growth, especially since a significant component of the service growth emanates from so-called autonomous sources linked to tourism, which is a major export industry for the Province (exports both to the rest of South Africa and foreign countries). The same can be said of financial and business services, which to a significant extent ‘export’ these services (for example, asset management and call centre services) to other provinces, as well as to other countries.
Furthermore, it should be noted that this overview is focused on sector production. The sectoral distribution of formal employment is discussed in Chapter 2. It should be noted that in relation to the three biggest production sectors reviewed in this chapter, all of these are also major labour absorbing sectors. Generally observations on employment can be made a priori. A benefit of the service industries and their growth is that they tend to be labour intensive. However, in many instances workers are required to have a high level of formal education, for example, in the financial services industry. But services can also be a significant source of job opportunities for workers with limited education and an opportunity to develop skills though on-the-job training. The tourism industry and jobs offered by guest houses, hotels and catering are examples of this. What is important to note is that in service industries, the quality of the service provided by workers is of fundamental importance, which in turn serves to emphasise the importance of training.
Recognising the importance of the services sector should not detract from the role which manufacturing should play in employment and income creation, and every effort should be made to encourage manufacturing subsectors in which the region has a comparative advantage. This, essentially, is what the Micro Economic Development Strategy (MEDS) is all about: encouraging identified industries in manufacturing, but also in services.

WESTERN CAPE PROVINCIAL ECONOMIC REVIEW AND OUTLOOK 2009
80
2.4 Financial services in the Western Cape economy
In considering the role of financial services as an engine of development, it is important to distinguish between those services that develop on the basis of a derived demand for services in a particular locality and those that develop independent of the market in the immediate geographical area by developing on the basis of the wider demand in the country and abroad. In the first category, a typical example would be the demand for commercial banking services, which in the Western Cape are provided by institutions with head offices in Gauteng, supplying these services where the demand is through countrywide branch networks. The growth in the number and size of branches (in terms of employment) will depend causally on the growth in the economy of the area and therefore the growth in the demand for banking services. In the second category are institutions that develop and supply services to meet the local demand but perhaps more extensively ‘export’ their services to other provinces and even countries.
While institutions in the first category are important in expanding the multiplier effect of growth in other sectors, the second category is important from the perspective of a development strategy since they serve as autonomous sources of growth. The second category is not constrained by the size of the local market and can expand by exporting their services to other regions and countries. To the extent that their growth can be encouraged by creating, as deliberate policy, a favourable environment in support of their ability to develop and supply services, they can be important growth agents that operate independent of local demand.
A number of South Africa’s most prominent investment managers have their head offices in South Africa. The footprint of the insurance industry is also substantial in Cape Town. Until recently, three major insurers had their head offices in Cape Town; now, unfortunately, only one remains firmly based in the Western Cape. Nevertheless, Cape Town, although not on par with Johannesburg as a financial centre, is a substantial source of financial service ‘exports’ to the rest of the country and even abroad.
Although the financial sector has been negatively influenced by the recession and the sharp fall in the equity market, the potential of the sector to contribute to the regional economy remains substantial. As shown in Table 3.2, finance and insurance have consistently grown their relative contribution to the Western Cape GDP-R. From Table 3.1 it would appear that at the national level, the contribution of Western Cape finance and insurance has marginally increased. It should be a matter of conscious policy to do whatever is viable and possible to provide financial institutions with an environment in which they can grow their supply of services to the regional and national market in the long run.
The current economic environment is reining in new business growth and the financial services industry is focused on cost control and improving efficiency. This has included management of the sector’s wage bill. Following a rise in net job creation in 2008, employment in the Western Cape financial services industry declined sharply by an estimated 9.1 per cent in quarter 2 of 2009 from quarter 1 of

CHAPTER 3: OVERVIEW OF THE WESTERN CAPE ECONOMIC SECTORS
81
2009. At 259 000, the level of employment is unchanged from a year ago1. Employment losses appear to have been relatively larger amongst banks than insurers although the latter, at the very least, froze hiring in non-essential posts.
Since the financial services industry contributed 18.2 per cent of total formal, non-agriculture employment in the Western Cape in quarter 2 of 2009, the decline in employment and earnings in this sector will have a significant impact on the future growth of personal disposable income growth in the Province.
While the nascent recovery in the stock market provides a measure of relief, momentum in job growth is likely to remain weak for the foreseeable future. Firms in the financial services sector can be expected to maintain their focus on cost control and capital preservation. Attention is currently fixed on forging strategic partnerships rather than growth. However, currently an Ernst and Young Financial Services Survey shows a significant increase in confidence in the life assurance and investment management industries, which are dominant in the Western Cape. At 51 and 66 respectively, these two industries have the highest levels of confidence between quarter 1 and quarter 2 of 20092.
3. Performance and outlook for selected economic sectors
Having reviewed broad sector changes in the Western Cape economy, this section pays attention to specific sectors, specifically agriculture given its relative importance in the Western Cape economy and those identified as priority3 or significant areas4 in the Micro Economic Development Strategy (MEDS).
It should be noted that special care will have to be taken to align provincial policy initiatives aimed at developing the priority and significant MEDS sectors with national policies. In this regard special attention should be given to the Accelerated and Shared Growth Initiative of South Africa (AsgiSA), the National Industrial Policy Framework (NIPF) and the anticipated South African Trade Policy and Strategy Framework.
1 Western Cape employment data sourced from Statistics South Africa. 2 Quoted in the BER (2009) The Current State and Short-term Prospects for the South African and
Western Cape Economies: 5. A report prepared for the Western Cape Department of Economic Development and Tourism by the Bureau for Economic Research, University of Stellenbosch (30 July).
3 Priority (high impact “flag ship”) Sectors: where government policy support has clear potential for high impact on output growth and equity, especially employment and new business entry.
4 Important/Significant sectors which have lower medium potential impact but are of high social and economic significance by virtue of their social and economic significance to the Western Cape.

WESTERN CAPE PROVINCIAL ECONOMIC REVIEW AND OUTLOOK 2009
82
3.1 Agriculture
As noted in the previous chapters, agriculture is recognised for its contribution to income and employment, although it is unlikely that the relative share of the sector in total activity will increase significantly. However, this sector is an important mechanism for rural economic development; and an earner of foreign exchange and as well as a provider of food for the people of the country and nutrition at household level. The agricultural sector is also a custodian for the largest part of the natural resources of the country.
Given the different roles of agriculture, it is a vital development tool for achieving the Millennium Development Goals in the bid to halve poverty and hunger by 2014.
The importance of the agricultural sector lies within the backward and forward linkages to other sectors of the economy, which indirectly impact on economic growth. The labour intensity of the agricultural sector, combined with the export potential of local produce, creates a vital platform for employment creation and black economic empowerment, especially amongst new emerging farmers.
Some of the primary agricultural enterprises in the Western Cape that, due to special geographical and climatic niches, are fairly unique to the Province are canola, barley, fynbos, rooibos tea, hoodia, table grapes, wine grapes, and ostriches.
3.1.1 Sector performance, developments and trends
The agriculture scene in South Africa has changed significantly over the past 20 years considering the levels of protection that were previously enjoyed by various agricultural industries. The opening up of international markets has led to changes in the relative competitiveness of certain industries and this in turn has led to structural changes in the agricultural sector.
Figure 3.1 shows that there has been a shift in the distribution of gross income in agriculture between 2002 and 2007. The contributory shares to total agricultural income of horticulture, field crops and animal crops have been decreasing while those for animals have increased more than two-fold.

CHAPTER 3: OVERVIEW OF THE WESTERN CAPE ECONOMIC SECTORS
83
Figure 3.1 Share of industry in total gross income in the Western Cape – 2002 and 2007
2002
Horticulture 54%
Animals 14%
Animal Products
15%
Field Crops12%
Other5%
2007
Other 1%
Horticulture 47%
Animals 30%
Animal Products
13%
Field Crops 9%
Source: Stats SA (2006 and 2009)
The number of farming units in the Western Cape (enterprises that are VAT registered) decreased from 7 185 in 2002 to 6 682 in 2007 (Statistics SA, 2006 and 2009). At the same time new farmers are also entering this adjusting and increasingly more efficient sector. Table 3.3 below (Geostratics, 2007) shows the distribution of the 5 660 emerging farmers5 in the Western Cape in 2007.
Table 3.3 Number of emerging farmers per district in the Western Cape (2007)
District Individual farmers Group members Total
City of Cape Town 3 183 186
Cape Winelands 14 1 592 1 606
Central Karoo 7 377 384
Eden 32 920 952
Overberg 30 624 654
West Coast 8 1870 1 878
Total 94 5 566 5 660
Source: Geostratics (2007)
The number of individuals in the agricultural workforce in the Western Cape in 2007 came to 146 378, of which 53.2 per cent were working in the Boland and 62.2 per cent were male. There has been an increase in the share of seasonal workers between 2000 (13 per cent) and 2007 (23 per cent of workforce) (Jacobs and Punt, 2009).
5 Emerging farmers for this survey were defined as people previously excluded from land ownership and voting, currently undertaking agricultural activities on land parcels greater than 1ha or keeping at least 1 livestock unit of animals (which is equivalent to 6 sheep/100 chickens at any one time during the year).

WESTERN CAPE PROVINCIAL ECONOMIC REVIEW AND OUTLOOK 2009
84
With regard to food security internationally, between 2001 and 2007 the world on average experienced a deficit of 28.6 million tons in grains annually. Globally 800 million people are experiencing chronic hunger (OECD/FAO, 2008) annually. The Western Cape figures indicate abundance of food using production per capita as criterium. Despite this, 16.2 per cent of adults and 12.8 per cent of children in the Western Cape experienced some form of hunger during 2007 and this relates to effective demand, i.e. ability to afford food.
Table 3.4 indicates the number of people that benefited directly from food gardens in the Province during 2008/09, having received start up resources from government. During the 2008/09 financial year 1 177 individuals were supported in starting food gardens in the Western Cape. Of the total number of 1 177, 39 per cent live in the Cape Winelands.
Table 3.4 Distribution of persons who benefited directly from food gardens in the Western Cape Province during 2008/09
District Men Women Youth Disabled Total
City of Cape Town 48 121 36 13 169
Cape Winelands 237 222 133 8 459
Central Karoo 162 44 65 2 206
Eden 34 20 7 0 54
Overberg 93 120 161 41 213
West Coast 48 28 13 6 76
Total 622 555 415 70 1 177
Source: Western Cape Department of Agriculture (WCDOA, 2009)
Western Cape exports of fruit accounted for 77 per cent of Western Cape agricultural exports and for 13.5 per cent of total Western Cape exports in 2008. In nominal value terms, fruit exports increased from R2.48 billion in 2000 to R10.57 billion in 2008. However, the contribution of fruit exports to total Western Cape exports remained relatively constant changing from 13.2 per cent in 2000 to 13.5 per cent in 2008. Figure 3.2 indicates the value of exports to the main fruit export destinations from 2000 until 2008. The five countries illustrated in the figure were the top five fruit export destinations in 2008.
Figure 3.2 Value of fruit exports to main destinations: 2000 to 2008
CHAPTER 3: OVERVIEW OF THE WESTERN CAPE ECONOMIC SECTORS
85
3.1.2 The impact of the recession
Agricultural industries have been affected differently by the economic recession. The red meat industry appears to be more shielded from the impact of the economic crisis than most of the other agricultural industries. On the other hand the table grape industry experienced significantly lower prices during the 2008/09 season compared to the previous year, as a result of its export destinations being quite hard hit by the economic recession.
In addition, the credit profile of the agricultural sector has been affected by a cost squeeze, where input costs have increased faster than prices of products, aggravated by the economic recession. Recently, seasonal production credit has overtaken land in comprising the main part of debt payments.
It is expected that the economic crisis will have an impact on the production and processing capacity of the agricultural sector. Production capacity could be harmed by the availability of credit, stricter regulation and extreme market volatility. The fundamental demand for agricultural commodities has however, not decreased significantly (Bureau of Food and Agricultural Policy (BFAP, 2009)).
3.1.3 Challenges within the agriculture sector
The two challenges that remain characteristic of mainstream agriculture are:
• Most individual agricultural producers are price takers, i.e. they have limited bargaining power with regard to prices of both inputs and products. This placed pressure on profit margins during 2008 when input costs (using a weighted basket of all direct and indirect input costs) increased by more than 35 per cent. In addition, South Africa competes against the heavily subsidised and supported agricultural sectors of European countries and the United States, while non-tariff barriers faced by South African exporters appear to be on the increase; and
• The successful achievement of the 30 per cent land reform target by 2014 remains of the utmost importance for the long term sustainability of South Africa. As there are approximately 11.5 million hectares of farmable land in the Western Cape, this means that 3.5 million hectares need to be transferred. This endeavour is complicated by increasing pressures on the agricultural sector to release natural resources (land and water) for human consumption.
3.1.4 Future developments in the agriculture sector
The National Minister of Agriculture, Forestry and Fisheries, recognised in her budget vote that as developed countries continue to subsidise their agriculture, steps need to be taken to protect the South African agricultural sector from unfair global competition, while also stimulating increased production.
After the 2009 national elections there seems to be a renewed political will to support agriculture and rural development, which might lead to the development and implementation of various support schemes and mechanisms. Rural development has been added to the portfolio of the Western Cape Minister of Agriculture and concerted efforts from various government departments and a more holistic
WESTERN CAPE PROVINCIAL ECONOMIC REVIEW AND OUTLOOK 2009
86
approach to addressing rural development, of which agriculture is just one facet, is expected to gain momentum in the near future.
In the context of rural development, investment in infrastructure is recognised as a key success factor. The efforts of the last three to four years to revitalise rail transport of agricultural products in conjunction with Transnet, has shown successes in the grain industry. This is expected to spill over to the fruit and horticultural industries.
Additional insights with specific reference to future developments in agriculture
Disinvestments in agriculture have continued for a number of years. However this trend appears to have been reversed with capital finding its way back into the agriculture sector.
It is recognised that non-farm income to supplement farm income will become increasingly important, which could include income from the whole range of agri-tourism type activities, even supplementing farm income with work in other industries.
Game farming is still relatively small in the Western Cape compared to other provinces, but it is a growing industry. A new crop that is being researched by the Western Cape Department of Agriculture is the carob tree for the use of the carob pods as cattle feed.
South Africa has the potential to export dairy products, vegetables and fruit to India in addition to the current wool exports (Trade Probe, 2009). These exports might become a reality in future, if the two countries are successful in their current trade agreement negotiations.
Climate change and its environmental and economic impacts are starting to become an integral part of general strategic and economic planning, although it is acknowledged that climate change mitigating initiatives are only in its infancy in the agricultural sector in South Africa, with relatively few examples of what can be achieved in this regard.
Climate change is also expected to lead to changes in spatial production patterns, although the specifics are still debatable. An increase in the occurrence of natural disasters, with its impact on agricultural production is also found in the literature.
Scope exists for initiatives to lower methane gas emissions on dairy farms, electricity generation from wind, biofuel production, selling of carbon credits, etc. These initiatives require varying amounts of capital investment, which seems to be coming from outside of agriculture. (This is particularly evident in developed countries such as the United States and those in Europe.)
Fair trade certification in the fruit industry has increased from 31 certificates in 2007 to 129 in middle 2009 (SA Fruit Journal, 2009), and is expected to increase further with social premiums received from marketing of produce under the Fair Trade label being reinvested into the communities that produced the fruit. Fair Trade has a specific country policy for South Africa based on South African Black Economic Empowerment legislation.
According to the Bureau for Food and Agricultural Policy (BFAP, 2009) there has been a notable increase in the volatility of agricultural futures markets over the past few years. Large hedge funds have used agricultural futures markets to hedge themselves against the depreciating dollar. It is likely that the activity of hedge funds will increase, which could also lead to higher commodity prices. The activity of large hedge funds should therefore be regarded as a fundamental driver in agricultural markets in coming years.
The South African Agricultural Baseline, produced annually by the Bureau of Food and Agricultural Policy, can be consulted with regard to price and production trends of selected commodities over the medium term (BFAP, 2009).

CHAPTER 3: OVERVIEW OF THE WESTERN CAPE ECONOMIC SECTORS
87
In closing, agriculture is recognised for its contribution to income and employment, rural development, as an earner of foreign exchange and custodian for the largest part of the natural resources of the country. Ideally all of these roles of the agricultural sector should shape the long term vision for the sector.
3.2 Oil and Gas Service Industry (including Ship Repair)
The oil and gas services industry include a variety of activities, such as ship and rig maintenance repair, marine construction and engineering, sea and air freight and personnel transport. The identification of interventions in this industry aim to enable the Western Cape as the preferred oil and gas service and supply hub for exploration and production off the African West Coast.
3.2.1 Sector performance, developments and trends
It is estimated that the oil and gas services and supply industry (including ship repair) in the Western Cape currently produces in the vicinity of R1.3 billion worth of output, with exports comprising in the region of R1 billion. This estimate is not easily validated as many companies’ turnover are partly directly billed to international clients while another portion is billed locally, but as a sub-contractor on an international project.
The majority of the Western Cape employment in this industry is on a contract basis. About 60 per cent of the total labour bill constitutes semi-skilled artisan type labour including welders, pipe-fitters, burners, fitters and turners, riggers, boiler makers, etc. There are major variations in employment figures between project periods and lull periods. The Polaris project (oilfield pipe-laying barge) is a case in point – employing over 2 000 people during the project peak, but once the vessel is completed and sails out of the local port, there is no employment linked to the project.
Global energy shortages, the rise of China, tensions in the Middle East and the long expected peak in world oil discoveries are all factors that intensified the spotlight on the African Oil and Gas Industry over the past five to ten years. In 2008, the Polaris6 project generated in the order of R250 million worth of work (turnover of the 4 month project) and significantly boosted industry output for the period. Even companies who did little or no work on the Polaris reported record years, many doing infrastructure related work in Angola, Nigeria and other oil rich countries. However, the end of 2008 and the beginning of 2009 heralded extremely quiet periods in the marine manufacturing industries.
6 The Polaris is a foreign-owned, specialised oilfield vessel that spent approximatley 4 months in the Port of Cape Town (much of it in dry dock) for major restoration, refurbishment and upgrading work.

WESTERN CAPE PROVINCIAL ECONOMIC REVIEW AND OUTLOOK 2009
88
3.2.2 Future developments in the Oil and Gas industry
Fundamental influences on the state of the sector that have been indentified are:
• The approval of the merger between the two largest ship repair companies in the Port of Cape Town has caused a considerable consolidation of assets and geographic footprint. This may have a positive influence by creating a strong entity with a balance sheet and project management focus to be able to do larger projects (payment guarantees, turnkey project solutions to international clients, etc.);
• The repair infrastructure in the Port of Cape Town is a challenge. This results in companies operating in for example the dry dock having to mobilise back-up equipment like pumps and generators in case of failure of port equipment. Overdue repairs to both the syncro-lift7 and the Sturrock dry-dock8 have significantly reduced the capacity of these facilities and therefore the number of vessels that can and were serviced;
• The Namibian authority (through the Walvis Bay port) has taken a strategic position to target oil and gas vessels. This has resulted in a significant loss in market share for Cape Town. A client friendly approach and lower docking fees have seen their two new floating dry-docks and quay space filled up with oilfield vessels; and
• Cancelled or delayed capital expenditure by major international players is causing a very significant slump in the market. No major projects have been scheduled for the first three quarters of 2009 with the first rig only scheduled to arrive in September 2009.
On the positive side, the oil price has recovered from its initial slump of below US$50 per barrel. Although the oil price is not near the record levels seen during 2008, it seems that the US$60 - US$80 per barrel price range will be sustained in the near future, with upward pressures remaining reasonably strong.
7 Syncro-lift, also known as a ship lift, is a “table” underwater that a ship stops on top of. In turn, this “table” then lifts the ship and is able to move it into another lane.
8 Sturrock dry-dock is the name given to the dock and is effectively a hole in the ground where a ship docks. This dry-dock encompasses the ship and separates the water from it.

CHAPTER 3: OVERVIEW OF THE WESTERN CAPE ECONOMIC SECTORS
89
Benchmark for the sector 2008/09 A-Berth (also existing are B, C, D . . . to M-Berth) in the Port of Cape Town has been the preferred position for large repair and refurbishment projects, mostly on oil field vessels, such as oil rigs and production platforms. However, the infrastructure at this quay, which is adjacent industrial space is sub-optimal and requires a significant upgrade.
The German company MAN-Ferrostaal carries some counter trade obligations as a result of the South Africa's armaments procurement drive a few years ago. The upgrade and reconfiguration of A-Berth was accepted as a National Industrial Participation project. MAN-Ferrostaal partnered with a local company and a German bank to structure a finance package for this investment project. A major marine repair company in the Port of Cape Town will be the operator of the site over a ten year lease. Their strategy is to focus on large oil and gas repair, maintenance and refurbishment projects, similar to the upgrade of oil rigs that have been done there over the last few years.
The R60 million investment in A-Berth would allow Cape Town to better compete with international ship yards when tendering for these major projects and will form part of the Western Cape's service offering to the Oil and Gas industry.
3.3 Boat-building
The Western Cape has all of the factors to make the boat-building industry highly competitive as well as improve the revenue generation of the industry. These factors include a wide range of suppliers of materials for boat construction, supply industries of related products and services, such as sail-making, mast builders, and naval architecture; outsourced manufacturing of component parts as well as post production services.
The International Council of Marine Industry Associations (ICOMIA) sub-divides the industry into 5 main categories namely:
• Building of boats (comprises the core boat-building industry sub-classified by type of vessel);
• The manufacture and trade in engines and engine systems (e.g. outboard, inboard, cooling and hydraulic systems, mounting equipment, stern gear and propellers etc.);
• The manufacture and trade in marine equipment and accessories (e.g. boat-building materials and equipment, boat care products such as paint and resins, boat covers, deck hardware, electrical and electronic equipment, personal gear, hardware etc.);
• Consumer goods and services (e.g. charter/rentals, repairs, maintenance, retail, events management, yacht clubs); and
• Business goods and services (e.g. consulting, design, surveying, training, government agencies etc.).
The last four categories could be considered as the support/auxiliary industry to the core boat-building industry.

WESTERN CAPE PROVINCIAL ECONOMIC REVIEW AND OUTLOOK 2009
90
3.3.1 Sector performance, developments and trends
It is estimated that the core boat-building industry (excluding the support/auxiliary industry) in the Western Cape currently produces in the vicinity of R2 billion worth of boats, with exports comprising in the region of R1.2 billion, i.e. 60 per cent of total turnover. It is pertinent to note that this estimate is based upon actual survey results (CTBi, Sept 2008), which is almost twice as high as the official 2007 Customs and Excise figure of R661 million.
Based on turnover figures for 2007, the total value added (GDP) of the core sector is estimated at R0.4 billion or 0.2 per cent of total provincial output, while its contribution to Western Cape exports is significantly higher at 2.5 per cent.9
The industry employs more than 3 000 permanent employees, representing 0.2 per cent of total employment (1.869 million)10 in the Western Cape. In addition to permanent employment opportunities, the core industry employs an estimated 500 temporary workers/sub-contractors (CTBi Market Survey 2008). The industry has a strong reliance on a variety of artisans including carpenters, welders, laminators, painters, electricians, sail and mast makers. The largest component of industry employment is represented by semi-skilled workers accounting for 60 per cent of total employment. Unskilled labour contributes only 15 per cent of total industry employment.
With regard to the geographic spread of boat-builders (core industry), there are currently approximately 60 boat-builders in the Western Cape; 44 (73 per cent) located in Cape Town; 6 in the Southern Cape spread between Swellendam and Knysna; 4 in the outer boundaries of the Western Cape (officially part of the Eastern Cape) around Port Alfred, St Francis Bay and Kenton-on-Sea; 4 in the Atlantis area and only 2 in the West Coast.
3.3.2 Future developments in the Boat-building industry
Most boat-builders reported an extremely busy and profitable 2008. Half way through the year companies were struggling under capacity constraints, which included the lack of workshop space and a shortage of skilled and semi-skilled labour.
In the beginning of 2009 many companies were still executing orders that were procured during 2008, but the global economic downturn now seems to have caught up with the local industry. Many boat yards are doing smaller repair jobs, training interventions and workshop maintenance, in order to keep staff busy. A number of yards have now started retrenchment discussions and are operating on short time.
9 This export ratio is much higher than the ratio based on the R661 million figure of Customs and Excise of 1.4 per cent, assuming that there was no under-counting across the other export product categories of the Western Cape.
10 CTBi Market Survey, 2008 and QLFS 2008. CTBi defined as Cape Town Boatbuilding and Technology Initiative: The Western Cape Boatbuilding industry Market Survey, prepared by Future Land (Innovative Market Solutions).

CHAPTER 3: OVERVIEW OF THE WESTERN CAPE ECONOMIC SECTORS
91
Growth in the sector is expected to stagnate, and possibly decline over the next 12 to 24 months. The major factor influencing the outlook is the credit crunch, which has significantly impacted on the main export markets (US and Europe). The Caribbean cruising market, where most South African boats are despatched to, gets service customers from the USA, while the Mediterranean cruising market is the European equivalent - also one of SA’s major export markets. Both these markets have been severely affected by the global credit crisis. This industry has also experienced increased competition from low cost locations such as Turkey, Poland and China. These countries have improved their reputation as quality manufacturers over the last 5 years and are now starting to increase their market share, while being able to keep production costs low.
South Africa has a systemic challenge in that it has a boat-building industry that is located far from all major markets. The cost of delivering boats over long distances is a significant contributor to overall cost of the product and remains a challenge. Some countries have introduced specific government assistance for delivery of yachts to markets.
Although South Africa has been building quality yachts for some years, the enforcement of international quality standards adds an additional control and auditing requirement to attain certification. Many local yards currently do not have the required culture of, for example, documented procedures and quality monitoring systems. This will be a determining factor in the export success of boat yards in the future.
There have been a number of positive developments in the industry over the past 12 months, most notably the boat-building academy, a joint initiative between CTBi, its members and False Bay College to address appropriate skills shortage in the industry, and the rental of the Elliot basin in the Port of Cape Town, which allows for water access for launching and mooring of export yachts.
3.4 Clothing and Textiles
The clothing, textiles and leather goods industry is an important part of the Western Cape economy, especially as an employment provider. As noted in section 2, the sector has been declining nationally and its relative share in the GDP of the Province has also fallen. The sector remains under strain as the result of high import levels and dampened local demand.
3.4.1 Sector performance, developments and trends
The different clothing, textiles and leather goods industries are important parts of the Western Cape economy, making up about 6.2 per cent of manufacturing in 2008 and representing approximately 21.9 per cent to the national aggregate.11
11 Source: A Quantec, EasyData, RSA Regional Market Indicators (Economic: Output and gross value-added (GVA) at market prices (2008)).

WESTERN CAPE PROVINCIAL ECONOMIC REVIEW AND OUTLOOK 2009
92
3.4.2 Future developments in the Clothing and Textiles Industry
The formal clothing industry has been through an exceptionally difficult year, largely as a result of the slow-down in consumer spend. Many retailers have reduced orders significantly, with the result that many firms have had to go on short-time, with several medium-sized firms being forced into liquidation. This has impacted on the formal Bargaining Council figures, which reflect a deduction of close to 2 000 workers for the Province. The Cape Clothing and Textile Council (CCTC) has been extremely active in driving programmes to increase the competitiveness in the industry, and has been integrally involved in the roll-out of the new clothing incentives by the Department of Trade and Industry (the dti).
While the import quota agreement with China shielded the clothing and textile industries from Chinese imports, its protection was weakened by imports from other countries. At the beginning of 2009 the agreement lapsed, opening up the sector to renewed pressure from Chinese imports.
Over the past 5 years the clothing industry has lost 10 309 formal jobs, and although there are currently firms in the sector that are hiring, overall employment continues to decline. Official figures for formal employment reflect a decline from 26 395 in 2008 to 23 770 in 2009. In recent years a few large firms adopting world class manufacturing methods have shown resilience. The expansion of small Cut, Make and Trim (CMT) operations underlines the transitional state of the industry and its evolving structure. Fashion design firms producing higher-value added products have also come under pressure, but are beginning to show signs of increased competitiveness and market alignment.
The CMT sector, as with the formal industry has nonetheless been under intense pressure. Unlike the formal industry however, overheads are considerably lower, and CMTs are better structured to adapt to lower demand, through cost cutting measures.
The anticipated review of tariffs and the possibility of increased levels of protection are welcomed by the industry and the dti’s recapitalisation programme for the sector has opened up an opportunity for technological upgrading.
The sector is expected be under continued strain from the economic down-turn and importation, but in the future this could be moderated by the sector’s current initiatives. Improved market alignment, increased competiveness and higher value addition can create possibilities for the sector’s stability and enhance its importance to the domestic market.
Looking forward, one of the most promising initiatives is a fast-fashion approach by both retailers and manufacturers. This approach involves retailers focusing their attention on enhancing communication through the value chain, close control of the design and development process (from conception to delivery), and supply chain integration. It is helping to facilitate a mind shift in the value-chain of the local industry, with the objective of reducing product turnaround times.

CHAPTER 3: OVERVIEW OF THE WESTERN CAPE ECONOMIC SECTORS
93
3.5 Film
The film industry includes feature film production, documentary production, TV, commercials, stills photography and also extends to contemporary new media platforms such as animation and gaming. Each of these sub-sector activities comprise design/creative processes, pre-production, facilitation, cast and crewing, training, hire and post-production services.
3.5.1 Sector performance, developments and trends
The total turnover of the Western Cape film industry was estimated at R2.56 billion for the 2005/06 financial year of which about 77 per cent (R2.03 billion) occurred in Cape Town. Long form, with a turnover of R1.12 billion has the largest share of the industry. This is followed by commercials at R0.87 billion and stills at an estimated R0.66 billion. Part of long form, feature films added R934.3 million and made for TV productions R181.3 million. It is estimated that the Western Cape Film industry contributed R3.5 billion to national GDP in the 2006 financial year (Standish et al 2007).
3.5.2 Future developments in the Film Industry
Going forward, a number of global trends and internal structural problems threaten the film sector’s growth prospects. These include the increase in competition from other countries (especially in relation to foreign public support schemes); in-expensive foreign film and television products (against which local products cannot compete); a strong Rand that makes the exchange rate unfavourable relative to other competitor locations; and the escalation in support industry prices. Local filmmakers also face limited access to funding, distribution and facilitation facilities. To counter-act these negative conditions, international marketing has recently shifted to sell service excellence, high skill and eco-conscious locations.
Future opportunities for growth is evident in the potential of the newly developed Cape Film Studios to provide new prospects and new jobs as well as the opportunities opened up by “the 3rd screen” (such as the gaming market and the blending of advertising with entertainment).
3.6 Business Process Outsourcing (BPO)
As a regional and highly successful BPO hub in South Africa, the Western Cape has, over the last five years, consistently outperformed national industry trends and offers an attractive value proposition and significant opportunities as a provider of niche-based Business Process Outsourcing and Off-shoring (BPO&O) industry-specific services.

WESTERN CAPE PROVINCIAL ECONOMIC REVIEW AND OUTLOOK 2009
94
3.6.1 Sector performance, developments and trends
The Province’s BPO industry is characterised as a young, fast growing and major employer within the Province. By 2008, 27 819 people were employed in this sector, with an annual employment growth rate of 29 per cent since 2004, compared to the 8 per cent annual industry growth rate over the same period (2008 national industry employment was estimated at 80 000) (Deloitte 2008). As a Top 10 employer within Cape Town, this young industry accounts for about 3.1 per cent of the total number of people in formal employment in Cape Town. Hence, BPO is regarded as a major contributor to the provincial economy, with an estimated total economic impact of R2.5 to R3.3 billion of WC Gross Regional Product.
Attrition in the industry for the Western Cape has increased slightly, from 14 to 17 per cent but still remains low by global standards (UK and US attrition averages between 30 to 40 per cent). Lower or stable attrition rates bode well for the Province’s marketing efforts to attract foreign investors. Emphasis should be placed on maintaining and reducing this comparative advantage (low attrition rate) in the future.
The estimated industry comprises approximately 250 firms. The major sectors of the industry are telecommunications, retail, the various categories of financial services, healthcare, marketing and information technology, confirming that the Province has an advanced and growing expertise as a financial services (particularly insurance) hub in Africa, with most large retail and telecoms companies also established here.12
The following major sectors and its significant growth potential enhances the Western Cape’s value proposition for serving as a destination, attracting global niche-based BPO work.
Telecommunications
The growth in the telecoms sector has been particularly apparent, with an increase of over 1 000 agents in 2007. Much of this growth was in low complexity sales and service work to pre-paid mobile customers in the domestic market.
However, there has also been significant growth in high complexity work within the telecoms space, both from an onshore and offshore perspective. Two of the top three South African telecoms companies have major contact centre operations in Cape Town and, significantly, they tend to focus their Cape Town operations on the more complex end of the call spectrum – dealing, for example, with broadband internet enquiries and with wireless broadband technical support.
Other outsourcing companies have also won significant contracts with telecoms providers, adding to the pool of skills. This skill set is a valuable asset to the region, and has laid a good platform for future offshore growth in this area.
There is an expected growth in the Telecoms sector over the next 12 months.
12 Delloite’s Key Indicator Report 2007/08

CHAPTER 3: OVERVIEW OF THE WESTERN CAPE ECONOMIC SECTORS
95
Financial Services
The industry is extremely diverse as is contact centre and BPO component. The majority of contact centre agents in financial services are involved in financial services other than banking or insurance. The less complex end of the spectrum, includes sales, service and collections for personal loans, short term savings products, retail cards, and mortgages. The more complex end, includes high value wealth management, pension administration and funds management.
As with telecoms, the presence of established insurance companies has attracted offshore insurance providers. Similarly, the strength of the investment management industry in Cape Town has created the possibility for Cape Town to become a major processing and administration hub in the investment management middle-office space.
Wholesale, Retail & Hospitality
The presence of major retailers in Cape Town such as Woolworths, Foschini, Edcon and Truworths adds to the depth of the financial services skills in the market (due to the fact that the retailers generally offer store cards and credit cards). Their presence has created a strength in collections skills, which is also attracting significant international investment.
Finally, the large number of people working in the hospitality industry in Cape Town is also a key source of new entrants to the contact centre and BPO industry, since the skills required for tourism and those required in contact centres are somewhat similar.
3.6.2 Future developments in the BPO sector
New growth in the industry has largely stemmed from two major expansions by existing international outsourcers based in the City, both of whom service the international market. A total of five new foreign investments have been facilitated over the last year, with the total value of investments amounting to R219.8 million, resulting in 3 258 jobs (Deloitte 2008).
South Africa as a whole received good ratings (as per the Gartner Research Report, October 2008) on the outsourcing rating criteria (used by potential BPO investors and clients when considering a particular location for off shore service investment). Furthermore, BPO industry commentators predict that, as a result of the current global economic slowdown, major BPO clients (buyers) will generally look to off-shore locations to help them meet their cost reduction targets (i.e. reduce their cost base).
While South Africa, and hence the Western Cape, does not rate highly in terms of its competitiveness as a low cost location (considered to be a high cost location, relative to other BPO locations such as Malaysia, Egypt, Philippines, etc.), the Province’s value-proposition is more firmly based on a competitive cost to quality ratio. Hence while labour costs tend to be comparatively higher, the quality of service delivered to clients is generally ranked very positively.
WESTERN CAPE PROVINCIAL ECONOMIC REVIEW AND OUTLOOK 2009
96
As a result our local BPO and call centre industry may well positively benefit from opportunities and interest from international call centres wanting to reduce costs in Europe and the US, and also gain from cheaper relative costs in SA.
High internet connectivity costs, a critical scarcity of experienced middle management staff, inadequacies in our primary and secondary schooling system and an overall inertia by national government in formulating a niche-specific country marketing strategy to ensure a global promotion of South Africa as a BPO destination, are some of the future high-level risks which could impact negatively this sector.
3.7 Information and Communications Technologies (ICT)
3.7.1 Sector performance, developments and trends
South Africaʹs Information Technology market is the largest in Africa, ranking 20th in the world in overall market size, and eighth in IT spending as a proportion of GDP. The South African ICT industry is estimated to be worth R60 billion in 2009 with projections increasing it to R96 billion in 2013 (Business Monitor International 2009), with the Western Cape accounting for approximately 15 per cent of the South African market.
The Information Systems, Electronics and Telecommunications Sector Education & Training Authority (ISETT SETA) is estimating that the Province would have approximately 3 000 companies, making up 17 per cent of national IT employment, or 23 430 people. However, this could be an under-calculation.13 Unlike the Gauteng province, where industry employment is concentrated in a much higher concentration of medium and large sized firms (78 per cent), the local ICT firms are predominantly small and micro in size; with 91 per cent classifying themselves as either micro, very small and small start-up and established firms.
The ICT industry is highly fragmented with many niche segments operating within the Western Cape. The growth segments with the most promising growth potential, particularly to position the region as an ICT Outsourcing destination and international trade competencies are:
• Business Application and Software Development (financial services, retail);
• Open Source Software development;
• Wi-Fi Technologies;
• Mobile applications;
• Web development;
13 Isett does not comprise all organisations in the Information and Communications Technology (ICT) Sector because there are companies that have defined themselves to be in other sectors, such as professional services, despite these companies being recognised as ICT companies. There are also organisations, such as the banks, which have a large ICT skill component but which belong to other industry sectors and SETAs.

CHAPTER 3: OVERVIEW OF THE WESTERN CAPE ECONOMIC SECTORS
97
• Multimedia applications (Gaming, Animation, Post-Production in Creative Industries);
• Online, internet based advertising and marketing;
• Telecommunications equipment;
• e-Government software development;
• Managed Services and IT Support Outsourcing (including technology support/ service hub); and
• Security Software Development.
One particularly important driver for the region’s ICT industry is the rise in the number of clients requiring specialised skills. It is envisaged that this increased demand will prompt the development of more niche areas in the industry and further driving innovation. However, an acute lack of high quality specialists exist; with the industry highlighting not only a shortage of quality technical skills – especially those required by niche areas, but also a shortage of specific skill combinations such as critical business management/specialist skills. While this is a countrywide issue, it is particularly exacerbated by the Western Cape’s relatively small skills pool, which is worsened by outward migration of IT professionals.
Government, corporate retail, SMEs and corporate financial services companies are the most important customer groups for the Western Cape ICT industry. Nevertheless, the size of the local market is small with the bulk of the procurement occurring in Gauteng. Export potential is therefore critical for growth, and the online digital media and software development sectors have had the highest levels of exports (29 per cent in 2007), which are driven by factors that include an increased use of the Internet globally, limited local market size and an increased international demand for specialised skills located in the Western Cape.
Although foreign investment levels vary significantly, less than 6 per cent of firms have received foreign investment (via joint ventures, equity and proof of concept funding). Securing investment is a particular challenge by all ICT industry sectors in the Western Cape.
More positively, a growing trend is shown in the development of outsourcing and off shoring relationships, with many foreign clients choosing the Western Cape as an outsourcing destination due to its culture, shared business ethos and the innovative approach to solution delivery, as well as its cost effectiveness, which sees high quality skills made available at a lower cost compared to other outsource destinations.
The Western Cape ICT sector is recognised by industry as a niche provider with innovative solutions and specialised skills. This is its competitive advantage with other regions within South Africa, and globally. According to BMI International’s industry forecasts, software spending will rise from US$1.7 billion to US$2.4 billion and IT services spending, from US$3.2 billion to US$4.7 billion. Despite a slowdown in 2009, the software market is projected to have an annual growth rate of around 10 per cent over 2009 to 2013. Regionally, the Western Cape ICT market (particularly in ICT Services, Telecoms and Software Development) is estimated to grow by between 15 per cent and 20 per cent over the next 5 years.

WESTERN CAPE PROVINCIAL ECONOMIC REVIEW AND OUTLOOK 2009
98
In addition to the above, the Province’s ICT market is driven by the growing demand for ADSL, further investment in infrastructure, increased competition and a growing rate of adoption of technology, growth in key verticals like oil and gas, as well as the growth of ICT as a business enabler in general. As such, the key competencies of the Western Cape ICT sector certainly lend itself to strengthening the regional value proposition that is focused on its uniqueness.
3.7.2 Future developments in the ICT industry
Employment in the ICT industry seems to have been negatively affected by the economic environment. According to industry commentators this is not too surprising in that (as a result of the global financial downturn) most companies are looking to efficiency savings. This downward employment trend is particularly evident in technology based firms largely because companies generally have tended to reduce demand for ICT-services and applications, avoiding the procurement of expensive technology solutions during periods of economic downturn.
A further trend in terms of employment is that many ICT companies have found difficulty in retaining newly-trained staff, who are often poached by rival companies.
The percentage of ICT companies that engaged in exporting has dropped from 34 per cent in 2003 to 29 per cent in 2007. Turnover attributable to exports is low, as 46 per cent of firms generate less than 15 per cent of their turnover from exports.
Foreign Direct Investment (FDI) levels into the ICT industry is quite diverse and low, with only 6 per cent of the ICT industry having received some form of FDI (2007). More generally, Western Cape telecommunications firms and software development companies tend to receive the highest levels of foreign investment. Partnerships, joint ventures, strategic alliances, licensing agreements and equity purchases are all favourable investment forms in the ICT sector.
Despite the softening market, positive trends can be envisaged:
• In the short term this would relate to those businesses that operate predominantly in the public sector, particularly as a supplier of goods and services to meet the ICT consumption needs of government;
• A further driver of growth, particularly for telecommunications companies over the next five years, centres on the recent and further planned projects to increase additional international connectivity bandwidth capacity. It is predicted that as a cumulative effect of the various under-sea cable projects, South Africa’s international bandwidth will increase five-fold within the next five years. The net impact over the long-term could affect a gradual decrease in the cost of internet connectivity for businesses and consumers; and
• In keeping with the latter statement, it is maintained that the cost of high internet connectivity is often rated as the major obstacle to business growth. This does not only apply to the ICT sector but to most other sectors. Cheaper connectivity could potentially be a major advancement to unleashing the economic potential of ICT companies to contribute to increased outputs and greater employment for both the ICT and ICT-enabled sectors and industries in the Province.

CHAPTER 3: OVERVIEW OF THE WESTERN CAPE ECONOMIC SECTORS
99
3.8 Craft
3.8.1 Sector performance, developments and trends
Baseline indicators generated through the dti Programme for Craft (Version 1 January 2007) highlights key statistics with specific reference to the South African Craft industry:
• The sector contributes approximately R2 billion to the Western Cape GDP (0.14 per cent);
• The sector provides income and employment to approximately 38 062 people nationally through economic activity and approximately 7 028 micro and small enterprises;
• South Africa contributes just less than 1 per cent of the global trade in craft (estimated to be approximately US$35 billion dollars); and
• Over the last 5 years the industry has shown an average growth rate of 8 per cent, which is attributed to growth in tourism and interventions in this industry. The dti estimates that at this rate by 2015 the industry could be contributing approximately R3.6 billion to GDP.
The total number of enterprises in the Western Cape’s Craft industry is estimated at 2010 (with 1 662 producers and 348 retail outlets), employing 7 165 people. From a national perspective, 27 per cent of all producers and 60 per cent of retailers are estimated to be based in the Western Cape with an estimated retail turnover in the Province of between R200 million and R500 million. (CSP, the dti 2005). The craft sector has significant linkages with tourism and acts as an important draw-card for visitors to the Province. Key characteristics of the sector are a strong retail component, which focusses on local and international tourism; good commercial orientation; a diverse and sophisticated product range reflecting different cultural influences which target high-end consumers with a good urban orientation and fair proximity to export.
The craft industry exhibits great diversity as materials, specific techniques, scale of production and product types and quality may vary significantly. Market positioning also varies from functional items to fashion-led items, gift and souvenirs to collectives or Craft Art.
In addition, most producers operate on a micro or small scale. Production is orientated towards mid-to-high pricing, with a very diverse product range and enterprises are linked into established local and global value chains, and therefore intermediaries play an important role in the sector.
3.8.2 Future developments in the Craft industry
Opportunities exist for increased global consumer demand for handcrafted unique African inspired products, a tourist demand and a procurement demand from corporates and government for specialist products.

WESTERN CAPE PROVINCIAL ECONOMIC REVIEW AND OUTLOOK 2009
100
The craft industry offers strong opportunities for enterprise development and appears to be especially significant to women (especially economic empowerment of rural women – mainstreaming women into economic development) and new entrants to the formal economy as “stepping stones” to other economic activities.
Furthermore, it has the potential to create sustainable livelihoods out of a relatively low skills base with minimal capital input.
A barrier to growth and development of this industry has been inadequate co-ordination and diverse objectives driving development.
3.9 Tourism
3.9.1 Sector performance, developments and trends
Tourism in South Africa and in the Western Cape is a large, steadily growing industry with substantive numbers of stakeholders and role players. This is particularly true when engaging with the statistics (Figure 3.3) that relate to overseas tourists14. Overall average growth over 2007/08 in intersectoral tourist arrivals in South Africa amounted to 11.3 per cent.
Figure 3.3 2007/08 International tourist arrivals within the South African context
World Europe Asia and the Pacific Americas Africa Middle East
2007 908 488 185.4 142.5 44.9 47.52008 924 488.5 188.3 147.6 46.9 52.907/08 % Change 1.8 0.1 1.6 3.6 4.6 11.3
0
2
4
6
8
10
12
0
100
200
300
400
500
600
700
800
900
1000
2007
/08
% C
hang
e
Num
ber
of i
nter
natio
nal
arriv
als
(mill
ions
)
Source: UNWTO, 2009
14 Please note that there are limited information available regarding domestic tourists and visitors from the rest of Africa.
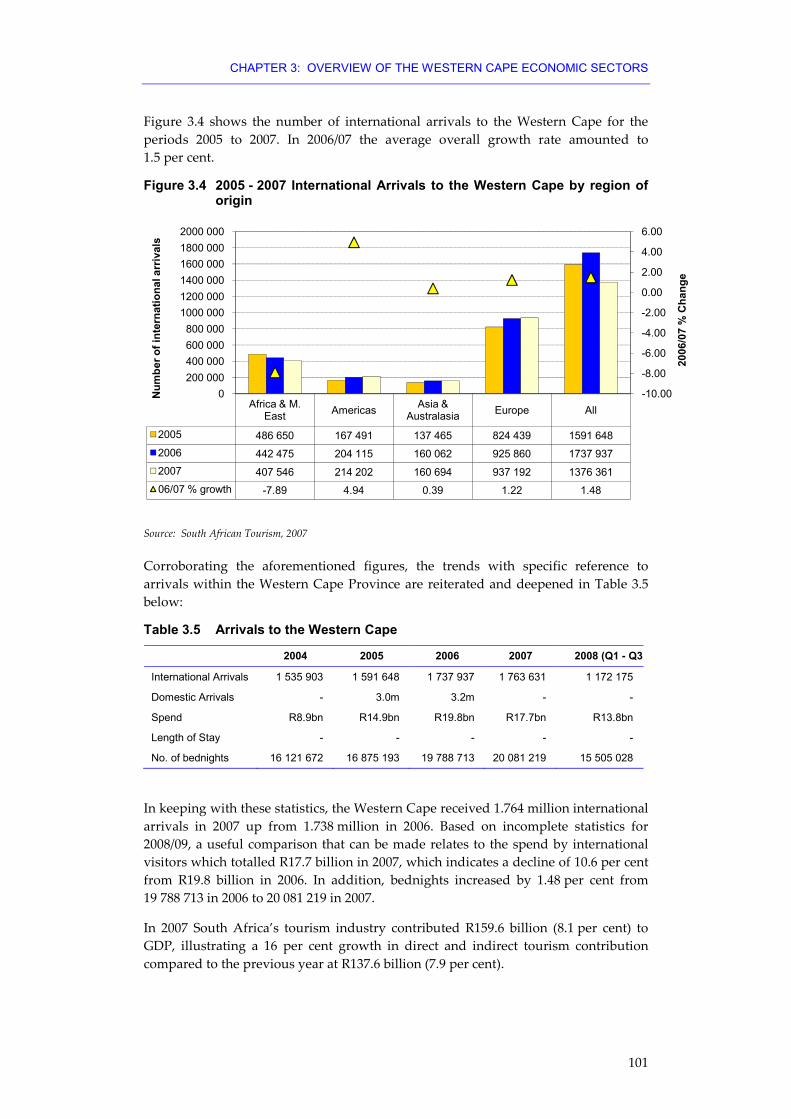
CHAPTER 3: OVERVIEW OF THE WESTERN CAPE ECONOMIC SECTORS
101
Figure 3.4 shows the number of international arrivals to the Western Cape for the periods 2005 to 2007. In 2006/07 the average overall growth rate amounted to 1.5 per cent.
Figure 3.4 2005 - 2007 International Arrivals to the Western Cape by region of origin
Africa & M. East Americas Asia &
Australasia Europe All
2005 486 650 167 491 137 465 824 439 1591 6482006 442 475 204 115 160 062 925 860 1737 9372007 407 546 214 202 160 694 937 192 1376 36106/07 % growth -7.89 4.94 0.39 1.22 1.48
-10.00
-8.00
-6.00
-4.00
-2.00
0.00
2.00
4.00
6.00
0200 000400 000600 000800 000
1000 0001200 0001400 0001600 0001800 0002000 000
2006
/07
% C
hang
e
Num
ber o
f int
erna
tiona
l arr
ival
s
Source: South African Tourism, 2007
Corroborating the aforementioned figures, the trends with specific reference to arrivals within the Western Cape Province are reiterated and deepened in Table 3.5 below:
Table 3.5 Arrivals to the Western Cape
2004 2005 2006 2007 2008 (Q1 - Q3)
International Arrivals 1 535 903 1 591 648 1 737 937 1 763 631 1 172 175
Domestic Arrivals - 3.0m 3.2m - -
Spend R8.9bn R14.9bn R19.8bn R17.7bn R13.8bn
Length of Stay - - - - -
No. of bednights 16 121 672 16 875 193 19 788 713 20 081 219 15 505 028
In keeping with these statistics, the Western Cape received 1.764 million international arrivals in 2007 up from 1.738 million in 2006. Based on incomplete statistics for 2008/09, a useful comparison that can be made relates to the spend by international visitors which totalled R17.7 billion in 2007, which indicates a decline of 10.6 per cent from R19.8 billion in 2006. In addition, bednights increased by 1.48 per cent from 19 788 713 in 2006 to 20 081 219 in 2007.
In 2007 South Africa’s tourism industry contributed R159.6 billion (8.1 per cent) to GDP, illustrating a 16 per cent growth in direct and indirect tourism contribution compared to the previous year at R137.6 billion (7.9 per cent).

WESTERN CAPE PROVINCIAL ECONOMIC REVIEW AND OUTLOOK 2009
102
Both direct and indirect tourist sector employment in South Africa increased in 2007; a total of 413 100 direct employment (2.1 per cent positive growth year-on-year) and a total of 527 900 indirect employment opportunities generated. This latter represents a growth of 7.3 per cent from the previous year.
It is acknowledged that the Western Cape is South Africa’s foremost tourism region and the sector in the Province continues to show growth. Tourism accounts for 10 per cent of total employment in the Province. In 2007, direct spending by visitors of R17.7 billion in the Western Cape contributed 11.1 per cent of total tourism spending in South Africa.
4. Conclusion The Western Cape economy in recent years has maintained its tendency to grow faster than the national economy. The regional economy has also undergone significant structural change, notably characterised by a decline in the relative contribution of manufacturing which in Section 2 is described as a process of de-industrialisation. The commensurate and compensating development has been the fast growth of the services industry. While it is recognised that it is quite possible to have viable and sustainable growth by producing services for export to other provinces and countries, the fact remains that for most developing countries, and for regions within developing countries, it would not be wise to neglect industrialisation as growth engine. Manufacturing remains an important growth engine in all large developing countries and regions.
The current recession has adversely affected almost all the sectors of the Western Cape economy, although the slowdown has been less pronounced than nationally. While there have been significant firm closures, particularly in manufacturing and more particularly in export oriented labour intensive sectors such as clothing, overall productive capacity has remained intact.
As a result, the Western Cape economy in general, and the sectors outlined here in particular, is well positioned to benefit from the expected economic revival. This is particularly true of the export oriented sectors. A number of sectors have developed new products and offerings and could see substantial and rapid expansion on the back of a global economic revival. The financial and business services sector, for example, has been particularly innovative in developing both new products and new markets and given its importance to the regional economy, strong growth here would give significant impetus to future growth prospects for the Province.

103
4
Socio-Economic Outlook Key findings:
• The Western Cape Province has an estimated population of 5 278 572 people.
• The Western Cape’s population is ageing.
• One of the building blocks of a vibrant economy is a skilled workforce.
• The literacy rate (of Grade 3 Pupils) across the Western Cape has increased steadily over the past four years from 35 per cent in 2003 to 42.1 per cent in 2005 and 44.8 per cent in 2007.
• Most of the determinants of health rest outside the direct influence of the health and social care sectors, for example education, employment, housing, poverty and the environment have a significant impact on health.
• Homicide and road traffic injuries as a result of alcohol abuse have been identified as major contributors to the burden of disease and have a significant impact on health services in the Western Cape.
• A recent analysis of substance abuse trends in the Western Cape indicated that the prevalence of lifetime alcohol use in the Western Cape ranges from 39 per cent to 64 per cent and the Western Cape has the highest incidence of risky drinking in the country at 16 per cent.

WESTERN CAPE PROVINCIAL ECONOMIC REVIEW AND OUTLOOK 2009
104
1. Introduction Over the past decade Government introduced several policies to address previous insufficiencies, inequalities and failures within our society. These interventions range from the delivery of free services to the provision of social assistance. Although beneficiary numbers of these services and social assistance have increased over time, the imperative is still to improve the impact of policies which create employment opportunities, which are considered as the gateway to success. The aim of the socio-economic outlook chapter is, to illustrate some of the challenges in the Western Cape that should inform policy decisions.
The chapter starts with a brief overview of the population in the Western Cape and poverty trends within the municipal district areas in the Province. Some trends in Education also illustrate Government’s progress with regard to enrolment and academic performance. Finally, the chapter identifies the main reasons for the burden of disease and furthermore reveals some statistics on substance abuse and the relationship between alcohol abuse, crime and injury in the Province. Substance abuse has been identified as one of the biggest social challenges in the Western Cape.
2. Demography The 2009 Mid-year Population Estimates of Statistics South Africa estimated population numbers of 5 356 900 for the Western Cape Province. Table 4.1 shows the increase in the enumerated population in the Western Cape between 1996 and 2007. According to Community Survey 20071, which will be used for the purpose of this document, the Western Cape Province has an estimated population of 5 278 572 people.
Table 4.1 Enumerated population in the Western Cape Province
Female population Male population
Total population
1996 Census 2 021 382 1 935 494 3 956 876
2001 Census 2 331 963 2 192 368 4 524 333
2007 Community Survey 2 705 179 2 573 393 5 278 573
Source: Statistics South Africa
The population in the Western Cape Province has increased by a growth rate of 3 per cent per year between the 1996 Census and the 2007 community survey, which is higher than the national growth rate of about 2 per cent per year. Both male and female growth rates for the Western Cape are higher than the national growth rates and these can be explained by in-migration from other provinces, especially Gauteng and the Eastern Cape and the ageing of the population of the Province. The fertility rate in the Province is 2.1 per cent, which is equal to the replacement rate of the population. We can expect the current growth trend in the population to continue for the next few years.
1 Statistics South Africa (2008). Community Survey 2007.

CHAPTER 4: SOCIO-ECONOMIC OUTLOOK
105
Table 4.2 below shows the total population by district municipality. The table shows that there are about 95 males to every 100 females in the Province.
Table 4.2 Total population by district municipality in 2007
District Municipality Total population % of population Sex ratio
West Coast 286 746 5.4 99.0
Cape Winelands 712 411 13.5 95.2
Overberg 212 780 4.0 97.6
Eden 513 305 9.7 101.1
Central Karoo 56 230 1.1 90.8
Cape Town Metro 3 497 100 66.3 93.9
Western Cape 5 278 573 100.0 95.1
Source: Statistics South Africa, Community Survey 2007
Eden is the only district municipality with more males than females and this is probably due to migrant workers moving into the area.
About two thirds of the Western Cape population reside in the Cape Town Metro, whilst Cape Winelands and Eden district municipality contribute about 13.5 per cent and 9.7 per cent of the provincial population respectively.
Table 4.3 below shows the distribution of the population groups by municipal district areas. In 2007, 50.2 per cent of the Western Cape population was Coloured, 30.1 per cent Black/African, 18.4 per cent White and 1.3 per cent Indian/Asian.
Table 4.3 Percentage population group distribution by district municipality in 2007
District municipality Black/ African Coloured Indian/
Asian White
West Coast 9.0 71.6 0.3 19.1
Cape Winelands 20.5 65.1 0.5 14.0
Overberg 20.0 59.6 0.3 20.1
Eden 29.0 52.2 0.5 18.3
Central Karoo 9.5 80.4 0.1 9.9
Cape Town Metro 34.9 44.0 1.8 19.3
Western Cape 30.1 50.2 1.3 18.4
Source: Statistics South Africa, Community Survey 2007
Table 4.3 shows the distribution by group across district municipalities. In the Central Karoo, 80.4 per cent of the population is Coloured. In the Cape Town Metro, 34.9 per cent of the population is Black/African.

WESTERN CAPE PROVINCIAL ECONOMIC REVIEW AND OUTLOOK 2009
106
Another phenomenon in the Western Cape is that in 2007, 299 106 (5.7 per cent) persons were aged 65 years and above2. Furthermore, according to Haldenwang, 20073, the Western Cape is in the process of population ageing, which will have significant socio-economic consequences for the Province. Projections indicate that by 2025, the Province will have 0.5 million persons over the age of 65 years. This will increase the need for social security in the form of Old Age Grants, of which beneficiary numbers are currently already more than 200 000, and appropriate forms of care for older persons. The Provincial Department of Social Development also currently supports 13 500 older persons in registered service centres in the Western Cape.
Data on the age distribution for the different population groups also shows that the majority of persons up to 69 years were Coloured. The majority of persons 70 years or older were White. In terms of gender, the majority of older persons were female. The Black African population was, demographically speaking, very young.
3. Poverty Using Census and Community Survey data, a poverty index has been constructed4
based on the following ten indicators:
1. Female headed households, proportion of households headed by women; 2. Illiteracy, proportion of population (15+) who have not completed Std 5/Grade 7; 3. Unemployment rate, proportion of the economically active who are unemployed,
regardless of whether or not they recently looked for work; 4. Household income, proportion of households without annual income; 5. Over-crowding, proportion of households sharing one room with at least one
other household; 6. Dwelling type, proportion of households classified informal or traditional; 7. Sanitation, proportion of households without a flush or chemical toilet; 8. Water, proportion of households who have no tap/piped water inside dwelling or
on site; 9. Electricity, proportion of households who do not have electricity for lighting
purposes; and 10. Refuse removal, proportion of households whose refuse is not removed by the
local authority.
2 Statistics South Africa 2007. Community Survey 2007. 3 Haldenwang, B. (2007). Population Ageing in the Western Cape Province. Policy Brief: The State of the
Population in the Western Cape Province. Commissioned by DSD, Western Cape. 4 Department of Social Development in the Western Cape

CHAPTER 4: SOCIO-ECONOMIC OUTLOOK
107
A proportion for each indicator was calculated as a percentage. The poverty index was then calculated by adding the scores for each indicator and then divided by 10 to obtain an average overall score out of 100. A score of 100 would reflect an extremely high level of poverty while a score of 0 would reflect an extremely low level of poverty.
Figure 4.1 shows the changes in the poverty index by district municipal area between 1996 and 2007.
Figure 4.1 Poverty index by district municipality
0
5
10
15
20
25
West Coast Cape Winelands Overberg Eden Central Karoo Cape Town
1996 2001 2007
The poverty index is showing increasing levels of poverty in the West Coast, Cape Winelands and Eden districts, with decreases being noted in the Central Karoo district, whilst the Overberg district and the Cape Town metro peaked in 2001 before dropping in 2007. The poverty index lies between 15 per cent and 20 per cent in all the districts and in all the years covered, except in 1996 in the Cape Town metro, where it lies below 15 per cent. Major contributing indicators of poverty are the ‘no’ income, unemployment, female-headed households, sharing one room, overcrowding and increase in some areas of informal and traditional dwellings. There are improvements in service delivery indicators, refuse collection, access to water, and electricity for lighting. Poverty is a multi-dimensional critical phenomenon in the Western Cape, which should be addressed in a holistic manner.
Social assistance provided by government is a programme that primarily aims to reduce poverty. An income transfer is made to beneficiaries in the form of old age, disability, war veterans, grant-in-aid, child support, foster care and care-dependency grants.
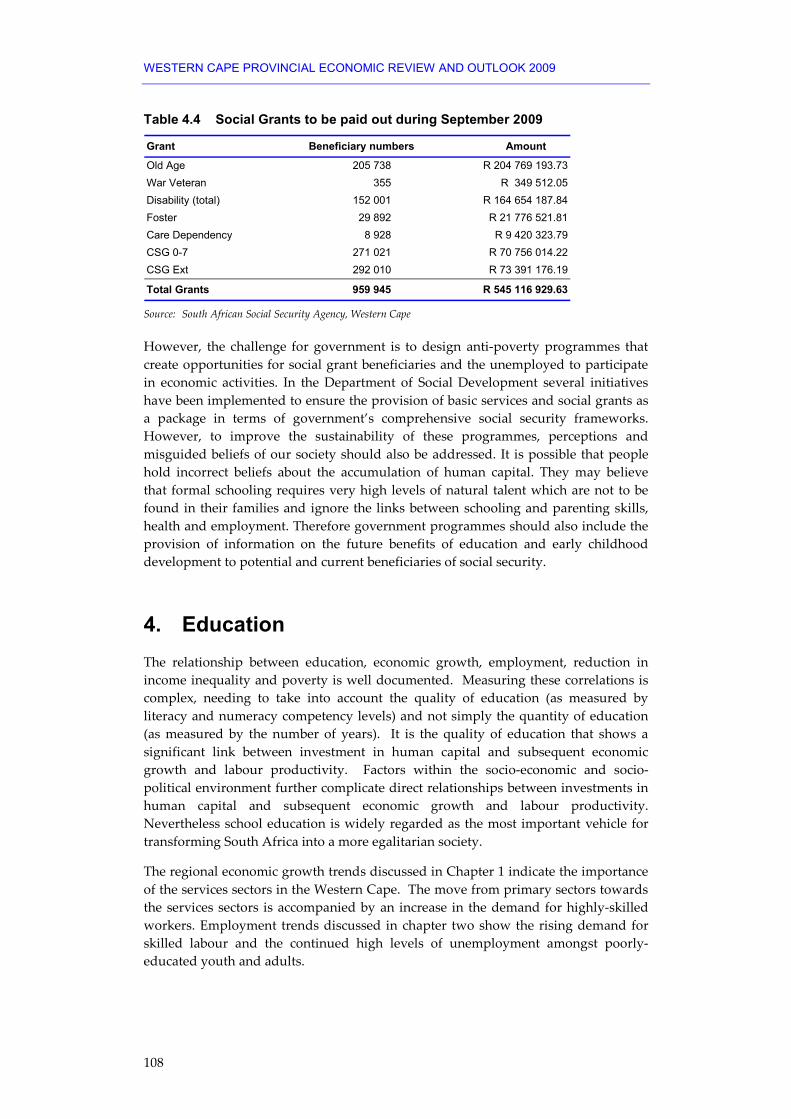
WESTERN CAPE PROVINCIAL ECONOMIC REVIEW AND OUTLOOK 2009
108
Table 4.4 Social Grants to be paid out during September 2009
Grant Beneficiary numbers Amount
Old Age 205 738 R 204 769 193.73War Veteran 355 R 349 512.05Disability (total) 152 001 R 164 654 187.84Foster 29 892 R 21 776 521.81Care Dependency 8 928 R 9 420 323.79CSG 0-7 271 021 R 70 756 014.22CSG Ext 292 010 R 73 391 176.19
Total Grants 959 945 R 545 116 929.63
Source: South African Social Security Agency, Western Cape
However, the challenge for government is to design anti-poverty programmes that create opportunities for social grant beneficiaries and the unemployed to participate in economic activities. In the Department of Social Development several initiatives have been implemented to ensure the provision of basic services and social grants as a package in terms of government’s comprehensive social security frameworks. However, to improve the sustainability of these programmes, perceptions and misguided beliefs of our society should also be addressed. It is possible that people hold incorrect beliefs about the accumulation of human capital. They may believe that formal schooling requires very high levels of natural talent which are not to be found in their families and ignore the links between schooling and parenting skills, health and employment. Therefore government programmes should also include the provision of information on the future benefits of education and early childhood development to potential and current beneficiaries of social security.
4. Education The relationship between education, economic growth, employment, reduction in income inequality and poverty is well documented. Measuring these correlations is complex, needing to take into account the quality of education (as measured by literacy and numeracy competency levels) and not simply the quantity of education (as measured by the number of years). It is the quality of education that shows a significant link between investment in human capital and subsequent economic growth and labour productivity. Factors within the socio-economic and socio-political environment further complicate direct relationships between investments in human capital and subsequent economic growth and labour productivity. Nevertheless school education is widely regarded as the most important vehicle for transforming South Africa into a more egalitarian society.
The regional economic growth trends discussed in Chapter 1 indicate the importance of the services sectors in the Western Cape. The move from primary sectors towards the services sectors is accompanied by an increase in the demand for highly-skilled workers. Employment trends discussed in chapter two show the rising demand for skilled labour and the continued high levels of unemployment amongst poorly-educated youth and adults.
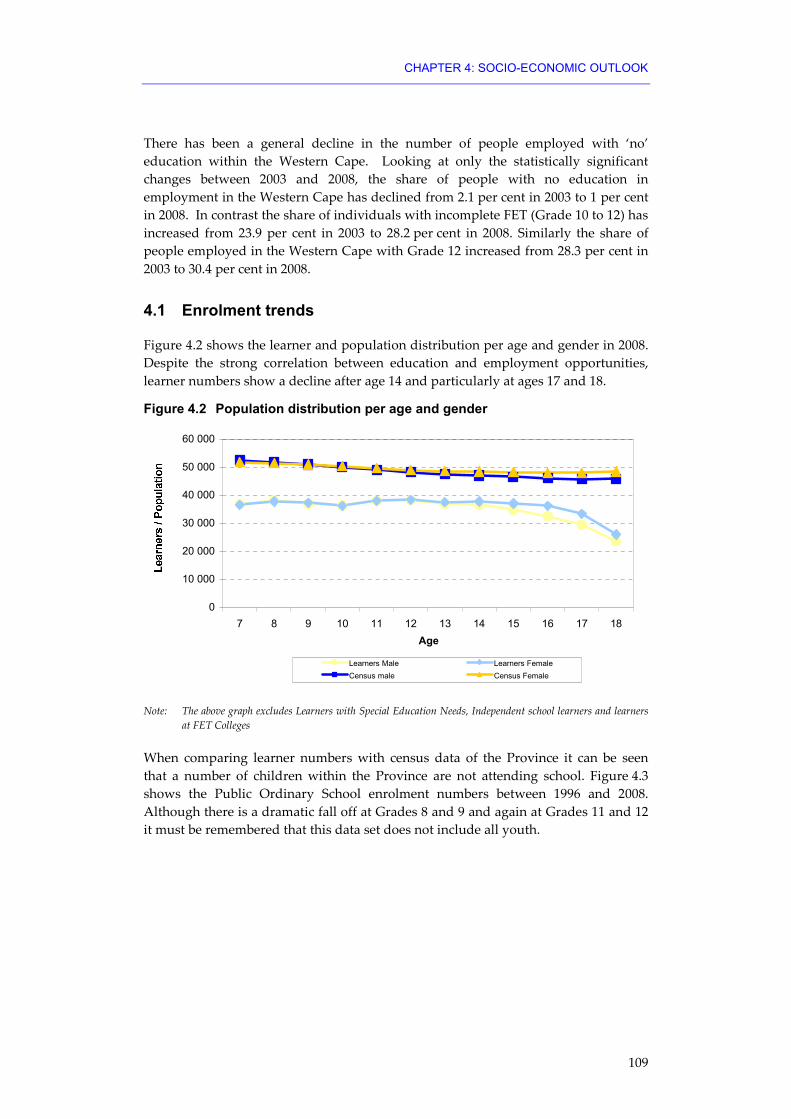
CHAPTER 4: SOCIO-ECONOMIC OUTLOOK
109
There has been a general decline in the number of people employed with ‘no’ education within the Western Cape. Looking at only the statistically significant changes between 2003 and 2008, the share of people with no education in employment in the Western Cape has declined from 2.1 per cent in 2003 to 1 per cent in 2008. In contrast the share of individuals with incomplete FET (Grade 10 to 12) has increased from 23.9 per cent in 2003 to 28.2 per cent in 2008. Similarly the share of people employed in the Western Cape with Grade 12 increased from 28.3 per cent in 2003 to 30.4 per cent in 2008.
4.1 Enrolment trends
Figure 4.2 shows the learner and population distribution per age and gender in 2008. Despite the strong correlation between education and employment opportunities, learner numbers show a decline after age 14 and particularly at ages 17 and 18.
Figure 4.2 Population distribution per age and gender
0
10 000
20 000
30 000
40 000
50 000
60 000
7 8 9 10 11 12 13 14 15 16 17 18Age
Learners Male Learners FemaleCensus male Census Female
Note: The above graph excludes Learners with Special Education Needs, Independent school learners and learners at FET Colleges
When comparing learner numbers with census data of the Province it can be seen that a number of children within the Province are not attending school. Figure 4.3 shows the Public Ordinary School enrolment numbers between 1996 and 2008. Although there is a dramatic fall off at Grades 8 and 9 and again at Grades 11 and 12 it must be remembered that this data set does not include all youth.

WESTERN CAPE PROVINCIAL ECONOMIC REVIEW AND OUTLOOK 2009
110
Figure 4.3 Public Ordinary Schools enrolment numbers between 1996 and 2008
0
20 000
40 000
60 000
80 000
100 000
120 000
Gr1 Gr2 Gr3 Gr4 Gr5 Gr6 Gr7 Gr8 Gr9 Gr10 Gr11 Gr12
1996 1998 2000 20022004 2006 2008
A challenge in the Province is to collect adequate learner enrolment data for FET Colleges. The collection of FET College data is problematic due to the nature of the courses offered at Colleges (namely formal and informal courses, short and long).
Figure 4.4 below shows the actual and estimated enrolment numbers and pass rates at FET colleges between the period 2005 and 2012.
Figure 4.4 FET enrolment trends 2005 – 2012 (actual and estimated)
0
10 000
20 000
30 000
40 000
50 000
60 000
2005-2006 2006-2007 2007-2008 2008-2009 2009-2010 2010-2011 2011-2012
FET
Enro
lmen
t
Fulltime Headcount Females Female Tech Pass

CHAPTER 4: SOCIO-ECONOMIC OUTLOOK
111
The need to respond to the intermediate skills needs of the Province has also been identified as a key challenge. In response to these needs, FET Colleges have a mandate to both expand enrolment and to incrementally provide courses which are responsive to the needs of the economy. Over the past 5 year period the following statistics were recorded as per the WCED:
• Student numbers of those graduating from short courses have grown from 965 to 10 062;
• Expanded industry-related programmes from 13 to 36 and partnerships have grown from 54 in 2004 to 73 in 2008/09;
• Centres of Excellence have been established as follows: boat-building at False Bay; Creative Arts and ICT at Cape Town; Welding at West Coast and Tool-making at Northlink Colleges;
• SETA Centres of Excellence: Early Childhood Development (ECD) at the College of Cape Town, and at South Cape College; and
• Over 700 skills enhancement programmes were offered in 2008 at colleges: these included occupational industry related and vocational programmes.
4.2 Academic performance indicators
One of the building blocks of a vibrant economy is a skilled workforce. It is especially technical and numerical skills that are in short supply in our economy. The foundation for these skills rests in primary education where basic literacy and numeracy is taught. This area has enjoyed much attention since the first broad-based testing of results for numeracy and literacy in 2002 illustrated the problem so vividly.
Table 4.5 shows the Grade 3 literacy and numeracy pass rates between 2002 and 2008. Since 2002 extensive research has been conducted into literacy and numeracy performance in the Western Cape, alternating between Grades 3 and 6, at the end of the foundation and intermediate phases of primary schooling respectively.
Table 4.5 Grade 3 results 2002 - 2008
2002 2004 2006 2008
Literacy pass % 35.7 39.5 47.7 53.5
Numeracy pass % 37.1 37.3 31.0 35.0
No. of learners tested 29 220 34 487 82 879 74 119
No. of schools tested 866 1 093 1 086 1 066
The pass rate for literacy has improved by 17.8 percentage points since testing began in 2002, when 35.7 per cent of learners achieved more than 50 per cent. This improved to 39.5 per cent in 2004, 47.7 per cent in 2006 and 53.5 per cent in 2008. The pass rate for numeracy has fluctuated from 37.1 per cent and 37.3 per cent in 2002 and 2004, to 31 per cent in 2006 and 35 per cent in 2008. Progress to date in literacy compares favourably with literacy programmes anywhere in the world, but we have to ensure further improvement.

WESTERN CAPE PROVINCIAL ECONOMIC REVIEW AND OUTLOOK 2009
112
However, the results open up questions when the Grade 6 results are superimposed. Table 4.6 shows the Grade 6 literacy and numeracy pass rates between 2003 and 2007.
Table 4.6 Grade 6 results 2003 – 2007
2003 2005 2007
Literacy pass % 35.0 42.1 44.8
Numeracy pass % 15.6 17.2 14.0
No. of learners tested 34 596 31 726 71 854
No. of schools tested 1 079 1 040 1 034
The percentage of learners achieving more than 50 per cent for literacy across the Western Cape has increased steadily over the past four years from 35 per cent in 2003 to 42.1 per cent in 2005 and 44.8 per cent in 2007. This reflects an increase of 9.8 percentage points since 2003. However, while the results reflect consistent progress in literacy, we still have a long way to go to ensure that our learners meet the 50 per cent target for both literacy and numeracy.
These early experiences point the way to the eventual school-leaving results. Table 4.7 shows the 2008 matric pass rates per gender in Public Ordinary Schools, Independent Ordinary Schools and Learners with Special Education Needs (LSEN) Schools.
Table 4.7 2008 Matric pass rate per gender
Matric learners:
Public Ordinary Schools
Total candidates
Male numbers
Male per cent
Female numbers
Female per cent
Percentage passed
Registered 42 883 18 186 42.4 24 697 57.6
78.6 Wrote 41 504 17 613 42.4 23 891 57.6
Passed 32 359 13 965 43.2 18 394 56.8
Matric learners:
Independent Ordinary Schools
Total candidates
Male numbers
Male per cent
Female numbers
Female per cent
Percentage passed
Registered 2 273 1 093 48.1 1 180 51.9
91.5 Wrote 2 149 1 026 47.7 1 123 52.3
Passed 1 967 917 46.6 1 050 53.4
Matric learners:
LSEN Schools
Total candidates
Male numbers
Male per cent
Female numbers
Female per cent
Percentage passed
Registered 258 152 58.9 106 41.1
96.8 Wrote 251 146 58.2 105 41.8
Passed 243 142 58.4 101 41.6

CHAPTER 4: SOCIO-ECONOMIC OUTLOOK
113
The overall 2008 matric pass rate of the Western Cape is 78.6 per cent. Many learners have performed admirably, despite the higher demands of the new curriculum and higher pass requirements. Although this figure is lower than the 80.6 per cent pass rate recorded in 2007, one cannot compare the National Curriculum Statement examination with that of the old curriculum. The new system replaces endorsement or matriculation exemption with qualification for access to bachelors’ degree, diploma or certificate studies. A total of 33 per cent qualified for access to studies for bachelorsʹ degrees, compared to 24.6 per cent who achieved endorsement in 2007.
Whilst the pass rate of 78.6 per cent in public ordinary schools may look impressive, it must be juxtaposed with the 39.2 per cent throughput rate of the cohort that started Grade 1.
5. Health The treatment of disease and injury does not only have a direct cost on health services, but also an indirect cost of disease that impacts on the economy in terms of lost productivity, and the necessity for the provision of indigent policies and social assistance.
The Western Cape, suffers a quadruple burden of disease which includes conditions related to under-development, i.e. infectious diseases such as TB, non-communicable or chronic diseases, injuries and HIV and Aids. It is important to note that although the Departments of Health and Social Development contribute to the health status in the Province, most of the determinants of health lie outside the direct influence of the health and social development sectors. These determinants of health encompass downstream risk factors such as biological and behavioural factors and upstream, societal and structural risk factors, such as poverty, unemployment, homelessness, etc.
There is a complex relationship between these upstream and downstream factors that contribute to the burden of disease. Upstream factors for example influence the ability of people to make the correct choices for healthy living and their ability to take responsibility for their health status. Improved health status is also one of the outcomes of general development. Background information for the report on the overview of the projects to decrease the burden of disease in the Western Cape indicated that decreased death rates from infectious diseases occurred prior to the advent of antibiotics or other effective medical interventions and were rather a consequence of improved nutrition, quality housing, cleaner drinking water and improved sanitation. Another outcome of development is the increase in the number of overweight people as the result of the typically ‘Western’ diet which contributes to the increase in the number of people suffering from chronic diseases such as diabetes, hypertension, etc.

WESTERN CAPE PROVINCIAL ECONOMIC REVIEW AND OUTLOOK 2009
114
While it is accepted that an improved health status is a developmental outcome, the converse of health as a driving force for development and socio-economic upliftment has not been fully recognised. The Commission on Macroeconomics and Health asserts that if upstream risk factors were controlled in conjunction with improved health services to address the downstream risk factors, “impoverished families could not only enjoy lives that are longer, healthier, and more productive, but they would also choose to have fewer children, secure in the knowledge that their children would survive, and could thereby invest more in the education and health of each child” (Sachs, 2001). According to Sachs, 2001 improvement in health would also translate into higher incomes, higher economic growth, and reduced population growth.
An investigation of the Burden of Disease (BoD) in the Western Cape indicated that injuries (homicide and road traffic injuries) and alcohol abuse have a significant impact on health services. It is estimated that the cost of one human causality driver death in an urban area is R624 4055, half of that cost is said to be borne directly by the Health sector. Furthermore, in the Western Cape, deaths due to injuries particularly from Homicide and Road Traffic Injuries (RTI) constitute nearly a quarter of all premature deaths after HIV/Aids and TB put together. The National Injury Mortality Surveillance System (NIMSS) shows that homicide rates in Cape Town were more than 10 per cent higher than in Durban, more than 60 per cent higher than in Johannesburg and almost 300 per cent more than the rates in Pretoria. Furthermore, the rates in Cape Town are estimated to be 8 times higher than the world average for males and 3 times higher for females and even more so in high density areas such as Khayelitsha (Joanne Corrigal and Tracey Naledi, Cape Argus, 16 February 2009).
Alcohol abuse not only impacts on the BoD, but also undermines families and the wider social fabric through its effects on interpersonal relationships, child abuse, teenage pregnancy and school drop-outs. It also exacerbates and in some instances causes poverty and exacts an enormous cost to the economy through lost productivity.
Another finding of the BoD study is that the burden of disease is inequitably distributed in the Province and is significantly higher in specific areas (such as Khayelitsha) than in other sub-districts of the Cape Town Metro. This is clearly related to the poverty and living conditions in these areas.
Upstream and downstream risks identified by the BoD Report need to be addressed, not only to improve the living conditions and quality of life of the people, but also to realise their economic and development potential and this is the responsibility of all sectors in the province. The Department of Health has very little direct responsibility in the prevention of upstream risks that contribute to the burden of motor vehicle injuries for an example and, therefore, is focusing on specific preventative interventions, in collaboration with the Departments of Social Development and Community Safety in this regard.
5 SA National Department of Transport and the Council for Scientific and Industrial Research (CSIR).

CHAPTER 4: SOCIO-ECONOMIC OUTLOOK
115
6. Substance abuse trends A recent analysis of substance abuse trends in the Western Cape between 2000 and 20086 highlighted the following:
• The Western Cape had the second highest (7.1 per cent) 12 month prevalence of substance use disorders and the highest (18.5 per cent) lifetime prevalence of substance use disorders.
• Alcohol is the most frequently abused substance in the Province. Across household surveys, the prevalence of lifetime alcohol use in the Western Cape ranges from 39 per cent to 64 per cent and the prevalence of risky drinking or problematic use among drinkers ranges from 9 per cent to 34 per cent. Compared to other provinces, the Western Cape has the highest incidence of risky drinking at 16 per cent.
• The province also has the highest lifetime prevalence (70.3 per cent) and highest past 12 month (55.1 per cent) use of alcohol among males.
• High levels of problem drinking exist among women. For females, the Western Cape had the highest lifetime prevalence (39.2 per cent) and past 12 month use (28.8 per cent) of alcohol.
• Compared to other provinces, the Western Cape has the second highest prevalence of harmful drinking during pregnancy. The province also has one of the highest rates of Foetal Alcohol Spectrum Disorders (FASD) in the world.
• Rural areas appear to have higher rates of binge-drinking than urban areas.
• The use of methamphetamine (Tik) is escalating. By 2007, the proportion of patients admitted for treatment reporting methamphetamine as a primary or secondary substance of abuse had increased to 49 per cent.
• Treatment data from South African Community Epidemiology Network on Drug Use (SACENDU) indicates that, compared to other provinces, the use of methamphetamine as a primary drug of abuse is the highest in the Western Cape at 35 per cent followed by the Eastern Cape at 5 per cent.
• Polystimulant abuse is also increasing. For example, methamphetamine is often used in conjunction with other substances such as cocaine.
• Cannabis and mandrax remain some of the most frequently used illicit drugs in the province.
• Cocaine is one of the less frequently used illicit drugs, while the use of heroin appears to be on the increase.
6 Harker, N., et al. (2008). Substance abuse trends in the Western Cape. Medical Research Council. Research report for DSD. Western Cape.
WESTERN CAPE PROVINCIAL ECONOMIC REVIEW AND OUTLOOK 2009
116
The social impact of substance abuse is a major risk factor for child maltreatment in the Province. A recent study of Children’s Court Inquiries in the Western Cape, found that substance abuse was the main reason for the removal of children from their families, in the Province. There are also several indications that alcohol and substance abuse play an important role in driving the high levels of violence in South Africa. In an assessment of more than 30 international studies with over 18 000 participants studying the association between alcohol and aggressive behaviour, a positive association was found in more than 95 per cent of them. The relationship between alcohol and aggression/victimhood persists, despite taking account of ‘confounders’ such as age, education, employment, trait aggression etc. (Joanne Corrigal and Tracey Naledi, Cape Argus, 16 February 2009).
Alcohol dependence is also linked to child abuse and excessive drinking by men associated with intimate-partner violence. Substance abuse contributes to sexual risk behaviour: for example, through the trade of sex for substances, having multiple sexual partners or engaging in unprotected sex. Substance abuse has a detrimental economic impact on individuals and households due to the use of scarce resources on substances. It further encourages financially reckless behaviour. At work it contributes to higher levels of accidents and lower productivity. Finally, substance abuse is also one of the main causes of absenteeism from work.
The Provincial Department of Social Development treated 2 798 clients at out-patient treatment centres and more than 1 200 clients at in-patient treatment centres for substance abuse in the first quarter of the 2009/10 financial year. To prevent substance abuse, the Department also implemented awareness programmes at school and district levels.
The major health-related harms caused by alcohol are violence, road traffic injuries and mental illness. The MRC estimates that alcohol abuse accounts for at least half of all interpersonal violence and road crashes. Almost 80 per cent of all assault patients - both male and female - presented at an urban hospital Trauma Unit in Cape Town were found to be either under the influence of alcohol or injured because of alcohol-related violence. It is clear that alcohol is either the number one or number two risk factor driving the burden in the province, particularly that of injuries.
The evidence regarding substance misuse clearly indicates that interventions which address the supply-side (such as raising the cost of alcohol or restricting accessibility through legislative means) are important. The Western Cape Liquor Act, 2008 (Act 4 of 2008) whose aim it is to restrict access to alcohol through restricted trading hours and restricted liquor outlets (taverns) in residential areas, together with policing and improved criminal justice, would go a long way tackling issues around the supply side.
Legislation, however, is necessary but not sufficient to decrease alcohol misuse. People who want to drink will inevitably find ways around legislative barriers to drink as much as they want. What is crucial is to understand the socio-cultural factors driving alcohol misuse in the province and initiate interventions that decrease the demand for alcohol as well.

CHAPTER 4: SOCIO-ECONOMIC OUTLOOK
117
For that to happen there needs to be an investment in early interventions such as early childhood development, life skills education and empowerment; the strengthening of communities with increasing positive adult involvement in young people’s lives in the form of e.g. mentorship programmes, showcasing of positive role models in communities, job creation programmes etc. Changing of societal and cultural norms around alcohol also needs to be addressed: an important component of this will be addressing the currently unregulated advertising of alcohol. The last thing South Africa should be doing is promoting drinking; we drink way too much already (Joanne Corrigal and Tracey Naledi, Cape Argus, 16 February 2009).
Some of the substance abuse terminology used within this section is defined in Appendix 3.
7. Crime overview Research done by the Department of Community Safety showed a strong relationship between alcohol abuse, crime and injury. Almost 60 per cent of those arrested in Cape Town in 2000 were tested positive for an illegal drug, with levels particularly high (66 per cent) for crimes such as housebreaking. Figure 4.5 shows the number of drug-related crimes in the Western Cape between 2001/02 and 2007/08. Although the numbers increased significantly from 13 429 in 2001/02 to 45 985 in 2007/08 it must be noted that these increases can also be an indication of an improved policing service in the Province.
Figure 4.5 Drug-related Crime in the Western Cape between 2001 and 2008
13 429 13 813
19 940
30 432
34 788
41 067
45 985
0
5 000
10 000
15 000
20 000
25 000
30 000
35 000
40 000
45 000
50 000
2001/02 2002/03 2003/04 2004/05 2005/06 2006/07 2007/08
Years

WESTERN CAPE PROVINCIAL ECONOMIC REVIEW AND OUTLOOK 2009
118
The gang phenomenon on the Cape Flats in the Western Cape is another challenge facing the PGWC. Youth in urban areas spend a lot of time on the streets and gangs become a kind of surrogate family, but with a different set of norms. When the norms of the street become more important than the norms at home, a gang develops (Leggett: 2004,3). Figures from the National Injury Mortality Surveillance System (NIMSS) shows that homicide is the number one cause of non-natural deaths amongst Coloured people and that Coloured victims are the ethnic group more likely to be stabbed. These disturbing facts can be attributed to gangsterism, specifically on the Cape Flats.
8. Conclusion This chapter has only highlighted a few of the social challenges in the Province that constrain economic growth and development. Besides the constraint on economic growth and development, the social challenges also put pressure on Government to invest in the social sector. The demographic overview identifies the challenges with regard to an aging population, which must be considered with regard to social security as well as the social welfare programmes developed by the Department of Social Development. Although a social security framework is in place to address the increasing poverty levels in the Province, the social welfare programmes should also address misguided beliefs within societal and cultural norms.
An investment in and continuous revision of policies in education would have a positive impact on economic growth, employment and even health due to the relationship between these indicators.
The determinants of health encompass risk factors such as biological, behavioural, societal and structural risk factors (poverty, unemployment, homelessness, etc). There is a complex relationship between these factors that contributes to the burden of disease in the Province. General development, economic growth and poverty alleviation would result in an improved health status in the Province.
Other social behaviours such as drug abuse and gangsterism are challenges facing the Province. These challenges also have a direct impact on education, health, poverty, crime and ultimately the economic growth and development of the Western Cape.
Even though government is committed to enacting progressive legislation to address some of these challenges, legislation is necessary but not sufficient to address many of the challenges of our province. People will inevitably find ways around legislative barriers to engage with activities that could have detrimental consequences. What is crucial is for us to understand the socio-cultural factors driving inappropriate behaviour in the province and in conjunction initiate comprehensive interventions that decrease the need to engage with these. This is the challenge for all sectors and not just government.

CHAPTER 4: SOCIO-ECONOMIC OUTLOOK
119
Appendix 3
Substance abuse terminology definitions
Substance abuse disorders: Any of a category of disorders in which pathological behavioral changes are associated with the regular use of substances that affect the central nervous system.
Alcohol abuse: The frequent intake of large amounts of alcohol, typically distinguished by decreased health and physical and social functioning impairment.
Binge drinking: An early phase of chronic alcoholism, characterized by episodic ʹflirtationʹ with the bottle by binges of drinking to the point of stupor, followed by periods of abstinence; BD is accompanied by alcoholic ketoacidosis–accelerated lipolysis and hydroxybutyric acid production due to impaired insulin secretion, food consumption and recurrent vomiting.
Lifetime prevalence of substance use disorders:
• Lifetime prevalence (LTP) is the number of individuals in a statistical population that at some point in their life (up to the time of assessment) have experienced a ʺcaseʺ (e.g. a disorder such as substance abuse), compared to the total number of individuals (i.e. it is expressed as a ratio or percentage).
• The number of cases of a disease (Substance abuse) which occur during a specified period, e.g. in a lifetime, as a percentage of the total or average total number of people at risk during the same period.


121
References
Chapter 1: Economic Outlook: 2009/10 – 2012/13
Framework for South Africa’s response to the international economic crisis: February 2009.
National Treasury, October 2009, Medium Term Budget Policy Statement.
Provincial Government of the Western Cape, 2008, Provincial Economic Review and Outlook (PER&O).
South African Government, March 2009, State of nation address.
South African Reserve Bank, March 2009, Quarterly Bulletin.
South African Reserve Bank, June 2009, Quarterly Bulletin.
Statistics South Africa. September 2007. Unpacking the CPI basket: A proposed new selection methodology and basket for the SACPI.
Statistics South Africa, 2009, Gross Domestic Product: First quarter.
Statistics South Africa, 2009, Gross Domestic Product: Second quarter.
Statistics South Africa. February 2009. Shopping for two, The CPI new basket-parallel survey: Results and comparisons with published CPI data.
The Bureau for Economic Research (BER) Third quarter 2009, Economic Prospects.
The Bureau for Economic Research (BER) Third Quarter 2009, Economic Outlook.
The Bureau for Economic Research (BER) Second quarter 2009, Economic Prospects.
The Bureau for Economic Research (BER). The current state and short-term prospects for the South African & Western Cape Economies, July 2009.
The International Monetary Fund, January 2009, World Economic Outlook Update.
The International Monetary Fund, April 2009, World Economic Outlook.
The International Monetary Fund, July 2009, World Economic Outlook Update.
The International Monetary Fund, October 2009, World Economic Outlook.
The International Monetary Fund, Working papers and transcripts 2008 and 2009.
The South African Reserve Bank, 2009, Statements of the Monetary policy Committee (various).
WESTERN CAPE PROVINCIAL ECONOMIC REVIEW AND OUTLOOK 2009
122
Chapter 2: Labour Market Dynamics in the Western Cape
Bhorat and Oosthuizen, M. (2006), ʺEvolution of the Labour Market: 1995-2002ʺ, in Bhorat and Kanbur, R., eds. Poverty and Policy in Post-Apartheid South Africa. Cape Town: HSRC Press, pp. 143-193.
Oosthuizen, M. (2006), The Post-Apartheid Labour Market: 1995-2004. Working Paper 06/103. Development Policy Research Unit.
Statistics South Africa (2004), ʺLabour Force Survey September 2003ʺ. Statistical Release P0210. Available (online): http://www.statssa.gov.za. Accessed: March 2004.
Statistics South Africa (August 2008) Concepts and definitions used in the Quarterly Labour Force Survey. Report number: 02-11-01. Pretoria: Own Publication.
Statistics South Africa (August 2008) Guide to the Quarterly Labour Force Survey. Report number: 02-11-01. Pretoria: Own Publication.
Chapter 3: Overview of the Western Cape Economic Sectors
BFAP (2009) The South African Agricultural Baseline. Bureau for Food and Agricultural Policy, Pretoria.
Business Monitor International (2009) South African Information Technology
Customised Sector Program for Crafts (2005) Publication by the Department of Trade and Industry.
Dairy Mail Africa (2009) Publication for the dairy industry in Africa. Agri Connect, Pretoria.
Deloitte (2005) Key Indicator Report
Deloitte (2006) Key Indicator Report
Deloitte (2007) Key Indicator Report
Deloitte (2008) Key Indicator Report
Department of Economic Development and Tourism
Geostratics (2007) Data Base Of Emergent Farmers in Western Cape. Department of Agriculture Western Cape, Elsenburg.
Jacobs, E and Punt, C (2009) A Profile of the Western Cape Province: Demographics, Poverty, Income, Inequality and Unemployment from 2000 till 2007. Western Cape Department of Agriculture, Elsenburg.
SA Fruit Journal (2009) A Journal for the South African Fruit Industry. June/July 2009.
Statistics SA (2006) Census of Agriculture Provincial Statistics 2002 - Western Cape: Financial and production statistics. Report No. 11-02-02 (2002). Statistics South Africa, Pretoria.

REFERENCES
123
Statistics SA (2009) Census of Commercial Agriculture 2007 (Preliminary) Statistical release P1101. Statistics South Africa, Pretoria.
WCDOA (2009) Western Cape Department of Agriculture, Elsenburg.
Chapter 4: Socio Economic Outlook
Department of Social Development in the Western Cape
Haldenwang, B. (2007). Population Ageing in the Western Cape Province. Policy Brief: The State of the Population in the Western Cape Province. Commissioned by DSD, Western Cape.
Harker, N., et al. (2008). Substance abuse trends in the Western Cape. Medical Research Council. Research report for DSD. Western Cape.
Leggett, T. “Crime in the coloured community”. ISS Crime Quaterly No 7, 2004.
Louw et.al. “Contextualising crime and poverty”. ISS Monograph. No 14. Stolen opportunities, July 1997, p.1-9.
Naledi T, Househam C and Myers J. Sharing the burden of disease. State of the province Western Cape: an integrated approach for service delivery. Cape Town. Provincial Government of the Western Cape. 2009.
NIMSS, 2001.
Parry, C. Director of the Alcohol and Drug Abuse Research Unit, MRC, Substance Abuse Trends in the Western Cape: SUMMARY (25/2/05). 2005. Medical Research Council and South Africa Health Information.
SA National Department of Transport and the Council for Scientific and Industrial Research (CSIR).
SA’s heavy burden of alcohol abuse. The Cape Argus: Written by Joanne Corrigal and Tracey Naledi. 16 Feb 2009.
SACENDU: South African Community Epidemiology Network on Drug Use. 2007. Regular Updates, Research briefs and reports. Available online at http://www.sahealthinfo.org/admodule/sacendu.htm. Update 15 May 2007. Data for Jul-Dec 2006.
Sachs D. (2001). Report of the Commission on Macroeconomics and Health. World Health Organisation, December 2001 found at: http://whqlibdoc.who.int/publications/2001/924154550x.pdf
Statistics South Africa (2008). Community Survey 2007.
Statistics South Africa 2007. Community Survey 2007.