Embed Size (px)
Citation preview
40 Years after Hirschman’s Tunnel Parable:
Income Inequality, Economic Development and Aspirations
Failures in Latin America
Svenja Flechtner (University of Flensburg, Germany)
Paper Prepared for the IARIW-IBGE Conference
on Income, Wealth and Well-Being in Latin America
Rio de Janeiro, Brazil, September 11-14, 2013
Session 8: Multidimensional Poverty
Time: Friday, September 13, 2:00-3:30
1
40 Years after Hirschman’s Tunnel Parable: Income Inequality, Economic
Development and Aspirations in Latin America
Svenja Flechtner1
This version: 25 August 2013
Originating from Albert O. Hirschman’s tunnel parable and the recently
evolving aspirations literature, this paper investigates the effect of income and
economic variables at country level on an individual’s aspiration level. A locus
of control variable from the World Values Survey is used to estimate these
effects in a multilevel model for six Latin American countries. The results seem
to be in line with key aspects of Hirschman’s tunnel effect: different interplays
of growth and inequality dynamics can lead to different patterns of perceived
control within a society. Growth is associated to higher perceived control in all
income spheres when it is inclusive. This is important in the context of poverty
alleviation and development because aspiration levels have been shown to be
an important determinant of economic behavior and decision-making.
1. Introduction
Albert O. Hirschman’s tunnel parable in “The Changing Tolerance for Income Inequality in the Course
of Economic Development” (Hirschman/Rothschild 1973) explained how growth and inequality can
impact people’s evaluation of their current and future economic possibilities at different stages of
economic development. The “tunnel effect” describes the initial tolerance of increased inequality
resulting from uneven economic growth processes on the part of relatively disadvantaged members
of society, who, expecting to catch up and benefit in the near future, drew gratification from the
improved income situation of others. If this moment of catching up did not arrive, however, the
initial tolerance could switch, giving way to feelings of falling behind, envy and grievance and possibly
resulting in social upheaval.
This idea has been taken up by the literature stream on aspiration traps. The basic idea is that
people’s evaluations of what they view as possible and achievable determine their aspirations and
thereby their actions. When actors underestimate their possibilities or capacities, they will
underinvest – in terms of education, capital investment or effort, for instance. Since aspirations
determine effort levels, they will consequently achieve relatively low goals, which apparently confirm
the adequateness of the chosen aspiration level (Dalton et al. 2011, Heifetz, Minelli 2006). Since such
underestimations of possibilities and capacities are typically correlated to experiences of poverty and
1 Research assistant, University of Flensburg, Professorship for International and Institutional Economics
2
deprivation (Appadurai 20042), the described downward spiral mechanism lends itself to the
perpetuation of poverty.
People’s evaluations are built by cognitive processes, beliefs, identities, worldviews and expectations
and take into account both individual factors and the economic context and framework conditions.
This dichotomy between one external and one internal component is in line with social psychology
research on aspirations, where the external component is referred to as locus of control beliefs, and
the internal one as self-efficacy (Bandura 1977).
Hirschman’s tunnel parable is an important theory when it comes to the evaluation of the economic
framework conditions (or, the locus of control beliefs). His work argued that inequality can,
depending on the stage of economic development and interplays with other social dynamics, stifle or
motivate actors’ beliefs about future prospects. Similarly, self-efficacy beliefs as the second pillar of
aspiration formation can be interpreted in this rational as well: In analogy to the tunnel parable in
the case of locus of control beliefs, the argument goes that socio-economic factors and positions
shape people’s level of perceived self-efficacy in non-linear ways.
The goal of this paper is to resume the relevant aspects of this theoretical framework and to expose
it to data from the World Values Survey (WVS). Although the tunnel effect underlies aspiration trap
models, it has not been tested empirically thus far. For this purpose, an empirical operationalization
of aspiration levels of WVS variables will be proposed. Since there are not sufficient self-efficacy
variables available, only locus of control beliefs will be analyzed. Latin American countries are chosen
as sample for empirical investigation due to historically high inequality on the one hand and
inequality reduction and growth dynamics in recent times on the other. Furthermore, these countries
are assumed to minimize problems of cross-cultural comparisons inherent in survey research thanks
to cultural and historical similarities and identical or similar languages. A multilevel regression model
is employed to estimate the effects of individual socio-economic features, economic indicators at
national level and cross-level interaction effects.
The remainder of this paper is organized as follows. Section 2 introduces the aspirations literature,
including an interpretation in light of the tunnel parable and its links to existing fields of research.
The third section identifies variables from the WVS for the empirical part, proposes hypotheses
about expected effects and specifies the model. The forth section discusses the estimation results,
before section 5 concludes.
2. Concept and related literature
2.1 The framework: aspiration failures
Aspiration failures and aspiration traps have gained importance for the investigation of the
persistence of poverty and inequality (see for instance Ray 2010; Ray 2006; Dalton et al. 2011;
Bernard et al. 2011). The idea of aspiration traps is constructed upon a diverse literature from
2 Arjun Appadurai speaks of a low „capacity to aspire“. The capacity to aspire can be understood as capacity to
identify that aspiration level which maximizes output or well-being.
3
different disciplines and has only recently been brought into economics.3 The starting point is that
cognitive processes, beliefs, identities, worldviews and expectations figure prominently when actors
assess both their current situation and their options for action. Decisions will be influenced by the
author’s evaluation of her capacities to achieve goals – her perceived self-efficacy – and her beliefs
about conditions imposed by the social environment – her locus of control beliefs (Bandura 1977).
This mindset is shaped and constrained by factors such as the social background of the family or
living conditions: actors from lower socio-economic backgrounds typically tend to build lower
aspirations (Heifetz, Minelli 2006, Appadurai 2004). Lower schooling aspirations of parents with low
educational levels are one example of how aspirations levels are transferred from one generation to
another.
The “capacity to aspire” is fundamental in this regard: according to Appadurai (2004), this meta-
capacity allows us to make connections between investments and rewards, between efforts and
achievements. The capacity to aspire allows us to promote our wishes, to see the road towards the
achievement of goals, to assess whether goals are attainable and realistic and if the required effort is
worthwhile and, thus, to aspire to those goals that maximize or outcomes, given our preferences,
resources and capabilities.
One basic issue of the capacity to aspire is its unequal distribution among individuals of a society.
Poor and excluded people have fewer opportunities to train their capacity to aspire by personal trial-
and-error investment, which leads to a social bias in favor of rather rich and privileged people.
Furthermore social comparison plays a role: “in general the further up the social ladder you are, the
more help the world seems to give you in keeping the self-doubts at bay. … [T]he social hierarchy is
seen (…) as if it were a ranking of the human race by ability (…)” (Wilkinson, Pickett 2010, p. 40). Thus
poor people tend to be conservative and rather pessimistic about what they might achieve, aspire to
lower achievements and thereby perpetuate their living conditions. This risk aversion makes a
significant difference: in a recent study among school leavers with high school diploma in Germany,
the highly socially biased decision to access tertiary education was attributed to higher risk aversion
among students from lower socio-economic backgrounds (Schindler 2012). Talent is wasted;
possibilities of improving one’s situation are not used. In other words, aspiration failures do not focus
on individual psychology but in situations where aspiration levels are structurally – not individually -
biased along socio-economic structures. Nonetheless this field of research is closely linked to
inequality literature that emphasizes that “psychology and societal inequality relate to each other
like lock and key” from a structural perspective (Wilkinson, Pickett 2010, p. 33).
In addition to initially low aspirations, Dalton et al. (2011) model aspiration traps as downward circle
dynamics, in the sense of self-fulfilling prophecies. Low aspirations lead to the choice of suboptimal
effort levels. Since actors adapt their aspiration levels to achieved efforts, downward spirals easily
arise without the actor’s consciousness. As a consequence, people systematically underestimate
their potential and possibilities and therefore aim at goals that perpetuate their living conditions
instead of overcoming them (Heifetz, Minelli 2006, Dalton et al. 2011).
These kinds of downward spirals and under-achievements due to aspiration failures are not the only,
and probably not even the most important kind of poverty trap. Neither are aspiration failures a
relevant explanation for each and every individual who is unable to move out of poverty. Many
3In some sense, of course, Hirschman had already presented one main aspect of this idea decades ago.
4
external factors and conditions may be responsible or contribute to a specific outcome. Separating
aspiration failures from external causes of persistent poverty is not always an easy task and maybe
even impossible in some cases. How can one determine whether an individual aspires to exactly that
action which maximizes his possible outcome? Since aspiration processes are not transparent – not
even to the individual – one difficulty resides in separating good and bad equilibria.
Research on aspiration failures is interested in situations of persistent poverty and/or social exclusion
in which people do not invest in their or their children’s education although education is not costly;
where they do not make use of support programs – for example, literacy programs – although these
are offered at apparently no cost (maybe not even opportunity costs); and where people do not
stand up for political redistribution of income and resources.
As one rather general example, Alsup et al. (2005) report that “women and minority groups
frequently underinvest in their human capital because they have been brought up to believe that
they cannot do certain things that other people can do. As a result, [they] internalize their second
class status in ways that cause them to make choices that perpetuate their disempowered status”
(Alsop et al. 2005, p. 12). Here, gender and identity are factors that apparently account for aspiration
failures under certain social conditions.
Another example can be given from development research, where parents from poor families who
estimate that their children are less intelligent compared to what richer parents think about their
offspring. Statistically, in a large-N group like a country, we can assume that intelligence is distributed
among children in a balanced way. A considerable fraction of parents from lower socio-economic
backgrounds who have low aspirations for their child are likely to underinvest in education and
training. Banerjee and Duflo (Banerjee, Duflo 2012, p. 86) speak of structural biases, stating that
thoughts about the benefits and returns to education and decision about educational investments
are in a peculiar way distorted by “expectations about what education is supposed to deliver” – which
in turn are shaped by socioeconomic categories and social surroundings. Both teachers and parents
will have low expectations of what a student can accomplish rather when the student is from lower
socioeconomic category than if he was from a higher one. “[O]ld-fashioned sociological determinism,
whether based on caste, class, or ethnicity, are rife in conversations involving the poor” (Banerjee,
Duflo 2012, p. 91). Low expectations will translate into low investments and efforts and “confirm”
the low expectations – perpetuating the belief in low capacities in the family, the teachers,
uninvolved others and, worst, the child himself who will carry with him such experiences during his
life course.
Many empirical papers have shown that aspirations are relevant for actions and decisions (Dalton et
al. 2011; Locke, Latham 2002; Camerer et al. 1997; Cochran et al. 2011; Helwig 2001). This paper is
not interested in the effect-side but rather in the structural explanation of aspiration levels. Based
upon Hirschman’s famous tunnel parable (Hirschman, Rothschild 1973), the aspiration literature (Ray
2010) advocates that social inequality and polarization in interaction with wealth levels and growth
shape aspirations.
5
2.2 Aspirations and the tunnel parable
According to the tunnel parable, inequality can be assessed in many different ways by society
members, according to the individual’s socio-economic position and the recent dynamics of
inequality during processes of social and economic change. Following the same logic, it can be argued
that inequality dynamics can impact aspirations in non-linear ways (Ray 2010). More specifically,
inequality and economic dynamics in general terms can have adverse consequences for both
perceived locus of control and perceived self-efficacy. Inequality dynamics should not be looked at in
isolation but in the context of overall wealth and economic dynamics.
Already in a comparative statics perspective (independently of the tunnel parable), rather equal
income distributions must not automatically benefit high aspirations. In low-income countries with
high equality, people would perceive very low or no incentives to engage in entrepreneurship or
education, since no probable rewards are observed in society as positive examples. In contrast, in a
high-income society with low inequality, individuals are as well incentivized to maintain their income
level, the difference being that at a high level, this maintenance calls for investment. In societies with
high inequality between groups and a steep social ladder, people can feel defeated and deterred
from productive efforts, since the road to improvements in terms of income or living conditions
seems far away and maybe unattainable. This effect intensifies when there is little contact between
different groups or even polarization: people’s capacity to aspire is hampered by the little knowledge
they have of how different groups live, how they act and how they reach and maintain their jobs or
positions. Segregation is discussed as potential impact factor in this context (Mookherjee et al. 2010;
Jensen 2010). A frequent notion is that of limited horizons: people cannot aspire to what they do not
know, and they are less likely to know the next steps on the ladder of living conditions when the step
is large.
The tunnel parable suggests precise relationships between aspirations, increasing inequality and
economic development from a dynamic perspective. Hirschman explains that growth signalizes in
the first place that things are going on in a society, making everybody expect benefits. Increased
inequality would then stimulate aspirations, except in societies with extreme polarization where the
most disadvantaged group does not believe in future benefits at any moment. When not all parts
benefit after some time, the initial hopes can be reversed and result in frustration and grievance.
Hirschman does not differentiate these effects for different national wealth levels. However, the
wealth level was important in the comparative statics perspective. Against this background, the
empirical part of this paper will consider income inequality levels and dynamics, the national wealth
level and growth dynamics and test their impact on locus of control beliefs.
2.3 Related literature
The aspiration literature enquires why living conditions and notably those of long-term poverty
persist even in contexts where an observer from the outside would ask: why does a family not invest
more in the education of their children? Why do students from working-class or migration
households in Germany not choose to study at university although they are qualified and entitled to
enter higher education? Questions asked by aspirations research can be read as asking why social
mobility is in many cases lower than it could be. More precisely, people’s beliefs about social mobility
6
are important when it comes to aspiration formation. Thus aspiration research connects to a whole
body of research on social mobility in these two ways. Andersen (2001) makes this link between
aspirations and social mobility explicit: she exposes a relationship between social mobility and
inequality which is somewhat similar to the growth-inequality relationship that determines
aspirations according to the tunnel parable. While high inequality is not detrimental to incentives,
high inequality and low mobility stifle people’s aspirations. Social mobility beliefs are, in other words,
one determinant of people’s assessment of possible outcomes and therefore deserve attention in
the analysis of aspiration building processes.
In the context of social mobility, aspirations research can as well be connected to the equality of
opportunity literature. Roemer’s distinction between determinants of inequality which are
exogenous to the individual and endogenous (effort) variables (Roemer 1998) provides a different
perspective on the nature of aspirations. Aspiration failures describe the links and feedback loops
between initial exogenous disadvantages and those disadvantages resulting from low efforts. This
perspective emphasizes how aspiration failures are initially conditioned by underprivileged living
conditions which they then contribute to perpetuate.
The aspirations literature has taken from Hirschman’s tunnel parable the view that relative
placements within dynamic societies and social comparisons offer better explanations of aspiration
dynamics than wealth levels or inequality, without taking account of the course of economic
development. Reenock et al. (2009) confirm that people do not assess absolute levels of
development or inequality bur rather changes over time and relations and differences within society.
Greater inequality can be accepted by a society when it results from economic development which is
on the one hand uneven, but which on the other one allows deprived fractions of the population to
have their basic needs met. In a broader sense, these ideas connect to sociological theories of
relative deprivation and as well to relative income hypotheses.
Last but not least, the aspirations literature can be linked to Bourdieu’s sociological theories of milieu
and habitus. The assessment of possible or impossible goals, the choice of career decisions and social
achievements are strongly shaped by the milieu a person is raised in and the habitus she develops.
El-Mafaalani (2012) has shown that educational climbers from working class and migration
backgrounds undergo important habitus transformations during the processes of social mobility. This
argument can as well be linked to identity threats as proposed by Akerlof and Kranton (Akerlof,
Kranton 2000).
3. Empirical analysis
3.1 Identification of the dependent variable from the WVS data set
For an operationalization of the aspiration framework, Albert Bandura’s social cognitive theory
(Bandura 1997) from social psychology is particularly useful. This theory models aspirations as
interplay of characteristics along two dimensions: perceived locus of control and perceived self-
efficacy. Agents who believe that they can determine to a great extent what happens in their life and
who believe to have high capacities to achieve their goals are said to be (high-) aspiring individuals.
The same agent would end up despondent and with a devaluated self-image if he believed to have
low instead of high capacities to do certain things. The outcome is again different when individuals
7
believe they have little influence on what happens to them, either due to fate or destiny or due to
rigid social structures. In this constellation, high self-efficacy beliefs would lead to protest or
grievance, while low self-efficacy beliefs result in resignation and apathy (Bandura 1997).
The WVS data catalogue is not perfect in terms of usefulness for this operationalization. While locus
of control beliefs and self-efficacy beliefs are usually measured on psychometric scales, no
combination of variables is available in order to construct an appropriate set of items. However, two
variables come close to locus of control items: one asking for freedom of choice and control over
one’s life and another that inquires whether fate is generally determined by the individual or
predetermined by destiny. Since the latter variable was rarely asked in surveys, the first variable is
used to measure locus of control beliefs in the present analysis. No single variable or set of variable
can be identified to proxy for self-efficacy measures.
The full variable text of variable a1734 is: “Some people feel they have completely free choice and
control over their lives, while other people feel that what they do has no real effect on what happens
to them. Please use this scale where 1 means ‘none at all’ and 10 means ‘a great deal’ to indicate
how much freedom of choice and control you feel you have over the way your life turns out.”
Locus of control beliefs are usually related to an individual’s socio-economic background. During
childhood and youth, experiences of acting and making choices result in independence and
autonomy. Such experiences require space and resources. On the other extreme, “the less
responsive and less opportune milieu surrounding the poor, the ostracized and the deprived creates
a climate of fatalism and helplessness” (Lefcourt 1982, p. 140). This is in line with a voluminous body
of literature about the negative relationship between aspiration levels and socio-economic status
(see for instance Bernard et al. 2011a for an example from Ethiopia). Data about the respondent’s
income level and the educational level will be used to measure the socio-economic background.
3.2 Descriptive statistics of the data set
The dataset for the present analysis contains data from the fifth wave 2005-2008 for six Latin
American countries. Argentina and Chile were part of the original sample, but were then removed
because they did not feature variables which turned out highly important in the course of the
investigation. Table 1 shows the mean average of the response to the item a173 for each country and
year. Overall, Latin American average scores around 7 or 8 points are, which is quite high compared
to international averages.5 For all Latin American countries where more than one survey is available,
the scores have increased over time. It is remarkable that only few correlations of responses along
socio-economic structures are to be found. Columns four to seven indicate the within-country
correlation of the response score and the subjective social class, the income share, the highest
educational level attained and the degree of self-reported happiness.6 The only variable with
4 The variable names refer to the Integrated Questionnaire for the waves 1991-2008 and the corresponding
dataset. 5 The mean average of the response score in a dataset of 30 countries for the 5
th wave is 7.1033. However, this
finding should not be attributed too much importance, since cross-cultural comparisons of absolute response scores can be quite unsubstantial (Blasius, Thiessen 2012). 6 Only significant correlations were reported; „n.s.“ = not significant.
8
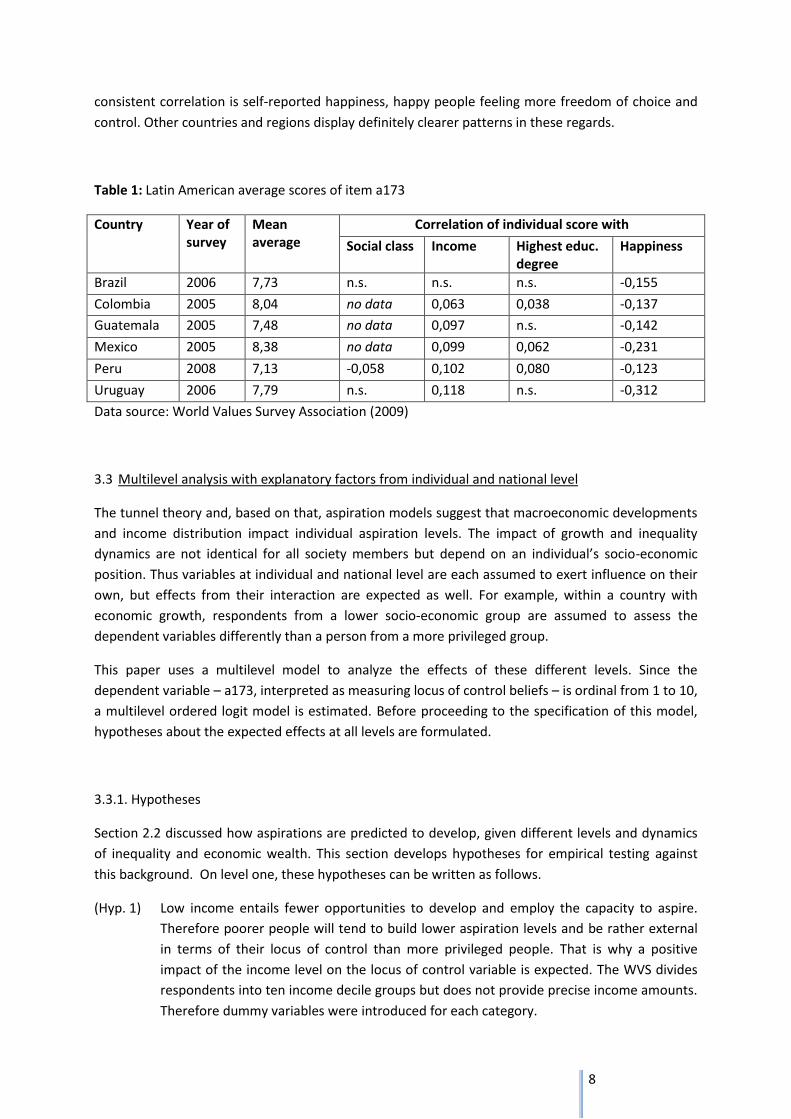
consistent correlation is self-reported happiness, happy people feeling more freedom of choice and
control. Other countries and regions display definitely clearer patterns in these regards.
Table 1: Latin American average scores of item a173
Country Year of survey
Mean average
Correlation of individual score with
Social class Income Highest educ. degree
Happiness
Brazil 2006 7,73 n.s. n.s. n.s. -0,155
Colombia 2005 8,04 no data 0,063 0,038 -0,137
Guatemala 2005 7,48 no data 0,097 n.s. -0,142
Mexico 2005 8,38 no data 0,099 0,062 -0,231
Peru 2008 7,13 -0,058 0,102 0,080 -0,123
Uruguay 2006 7,79 n.s. 0,118 n.s. -0,312
Data source: World Values Survey Association (2009)
3.3 Multilevel analysis with explanatory factors from individual and national level
The tunnel theory and, based on that, aspiration models suggest that macroeconomic developments
and income distribution impact individual aspiration levels. The impact of growth and inequality
dynamics are not identical for all society members but depend on an individual’s socio-economic
position. Thus variables at individual and national level are each assumed to exert influence on their
own, but effects from their interaction are expected as well. For example, within a country with
economic growth, respondents from a lower socio-economic group are assumed to assess the
dependent variables differently than a person from a more privileged group.
This paper uses a multilevel model to analyze the effects of these different levels. Since the
dependent variable – a173, interpreted as measuring locus of control beliefs – is ordinal from 1 to 10,
a multilevel ordered logit model is estimated. Before proceeding to the specification of this model,
hypotheses about the expected effects at all levels are formulated.
3.3.1. Hypotheses
Section 2.2 discussed how aspirations are predicted to develop, given different levels and dynamics
of inequality and economic wealth. This section develops hypotheses for empirical testing against
this background. On level one, these hypotheses can be written as follows.
(Hyp. 1) Low income entails fewer opportunities to develop and employ the capacity to aspire.
Therefore poorer people will tend to build lower aspiration levels and be rather external
in terms of their locus of control than more privileged people. That is why a positive
impact of the income level on the locus of control variable is expected. The WVS divides
respondents into ten income decile groups but does not provide precise income amounts.
Therefore dummy variables were introduced for each category.
9
(Hyp. 2) Higher levels of achieved education might function as important experience of positive
attainments and reward to effort. Moreover a higher educational level usually opens
doors to higher earnings and professional perspectives, possibly encouraging the
perception of more internal control. The WVS differentiates 8 categories for different
levels of achieved education. Again dummy variables were created to account for these
categories.7
Age, gender, the employment status8 and the degree of self-reported happiness9 are included as
control variables without specific hypotheses.
As to level two, the tunnel theory suggests that the overall level of wealth, growth, and inequality
impact aspiration levels. The GNI per capita, the Gini coefficient of income and growth rates for
several periods are included as explanatory variables.
(Hyp. 3) The overall wealth level of a country is measured as GNI per capita. The income level is
expected to display a positive effect on the locus of control score at the individual level. It
might well be that, ceteris paribus, the locus of control rating in a country with a low GNI
is generally lower than that in a country with a high GNI. More precise predictions are
expected when different income group are differentiated (see cross level hypothesis).
(Hyp. 4) When economies grow, people will expect to benefit from the increasing economic
activity. Ceteris paribus, this would make aspirations grow. On the other hand, sustained
growth without balanced participation of all social groups might also shrink the
aspirations of some groups. This differentiation will be considered by hypothesis (8). This
hypothesis tests whether a general effect of growth dynamics can be found. Since
economic growth rates can be volatile, average values of several years are taken into
consideration instead of punctual growth rates. Because the tunnel theory predicts that
growth rates exert different effects in different time horizons, the average growth rates of
2000-2005, 1995-2005, 1990-2005, 1981-2005 and 1961-2005 were tested.10
(Hyp. 5) According to the tunnel theory, the effect of income inequality dynamics essentially
depends on the time horizon. Increasing inequality, occasioned by unbalanced growth,
can coincide with growing aspirations, at least for short time period, whereas prolonged
high inequality leads to despondence and grievance. Rather than formulating one
straight-forward hypothesis, the impact of the level of inequality will be interpreted
against this background.
7 The categories range from 1= “inadequately completed elementary education” to 8= “University with degree/
Higher education – upper level tertiary certificate”. 8 The WVS offers eight categories out of which eight dummy variables were created.
9 Four binary variables are introduced for the degrees “very happy”, “quite happy” and “not very happy” and
“not at all happy”. 10
The surveys used for the sample of this paper belong to the same WVS wave but were carried out in different years: 2005, 2006 or 2008. The growth rate intervals and all other intervals take account of these differences. In fact, the intervals for the 2006 countries are calculated with respect to the years 1962, 1982, 1991, 1996 and 2001. The intervals ending in 2008 were calculated correspondingly. This procedure is appropriate because the intervals are not used with interest in specific points in time but with interest in developments in specific periods of time before the survey date. For the sake of legibility, the text and the results table name the 2005 intervals only.
10
(Hyp. 6) In addition to income inequality dynamics, the aspirations literature assumes that static
high inequality or even polarization have negative impacts on aspiration levels – at least in
the lower income groups. This hypothesis states that there is an overall effect of highly
unequal social patterns, while hypothesis (10) takes care of a more differentiated view.
The Gini coefficient of land distribution (Deininger et al. 1999) is introduced in order to
control for possible effects of rather static inequality patterns. The Gini coefficient of land
distribution is considered to change more slowly than that of income distribution and to
reflect more fundamental inequalities within a society.
Besides these isolated effects, the effect of the income category is expected to interact with income
inequality dynamics, economic growth and the overall welfare level.
(Hyp. 7) income level * GNI The effect of the GNI per capita might be different for actors from
different income levels. When the GNI level is rather low on average, individuals from
lower income shares might perceive little incentives in terms of higher earnings and
aspirations might therefore be lower on their part. On the contrary, higher overall GNI
levels might lead to less differentiation along income levels because with higher overall
wealth, the relative distances between different income groups appear to be smaller.
(Hyp. 8) income level * growth One main argument derived from the tunnel theory is that growth
might compensate for inequality. Ceteris paribus, individuals from lower income groups
would therefore have lower aspirations when there is no or little growth, but increased
aspirations when there is economic growth (which promises them to catch up soon). This
effect is expected to hold for a limited period only: until individuals begin to perceive that
the moment of catching up has not arrived and they possibly have been left behind. After
that point, aspirations in lower income groups might be stifled despite higher growth.
(Hyp. 9) income level * inequality When there is higher inequality in a society, there is likely to
be more differentiation between the aspiration levels of individuals from different income
groups. This is in line with hypothesis (1): the aspiration level is linked to the income level,
and differences are larger when income gaps are larger. Countries with higher Gini
coefficients are likely to show more heterogeneous locus of control scores along income
levels. Furthermore, the tunnel effect explains that short term inequality dynamics – as a
side effect of increasing growth – is associated to higher aspirations in lower income
groups because they expect to catch up.
(Hyp. 10) income level * land Gini The land Gini is assumed to express deep-rooted patterns of
inequality within a society. Higher inequality of underlying structures might discourage
the perception of internal control in the lower income groups disproportionately.
Therefore a stronger effect of the land Gini on these groups is expected.
11
3.3.2 Model specification
The developed hypotheses suggest that level one predictors cause variance between individuals who
are nested in country-groups and that some variance is caused by predictors at the country level.
For each individual i in country j, the following model is estimated:
Locus of control score = β0 + β1 xij + β2 yj + β3 xi * yj + Rij
where β0 is the intercept, β1 symbolizes the coefficients for individual regressors x, β2 the regressors
at country level y and β3 is the coefficient of the interaction term; Rij stands for the residuals.
4. Presentation and discussion of results
4.1 Results
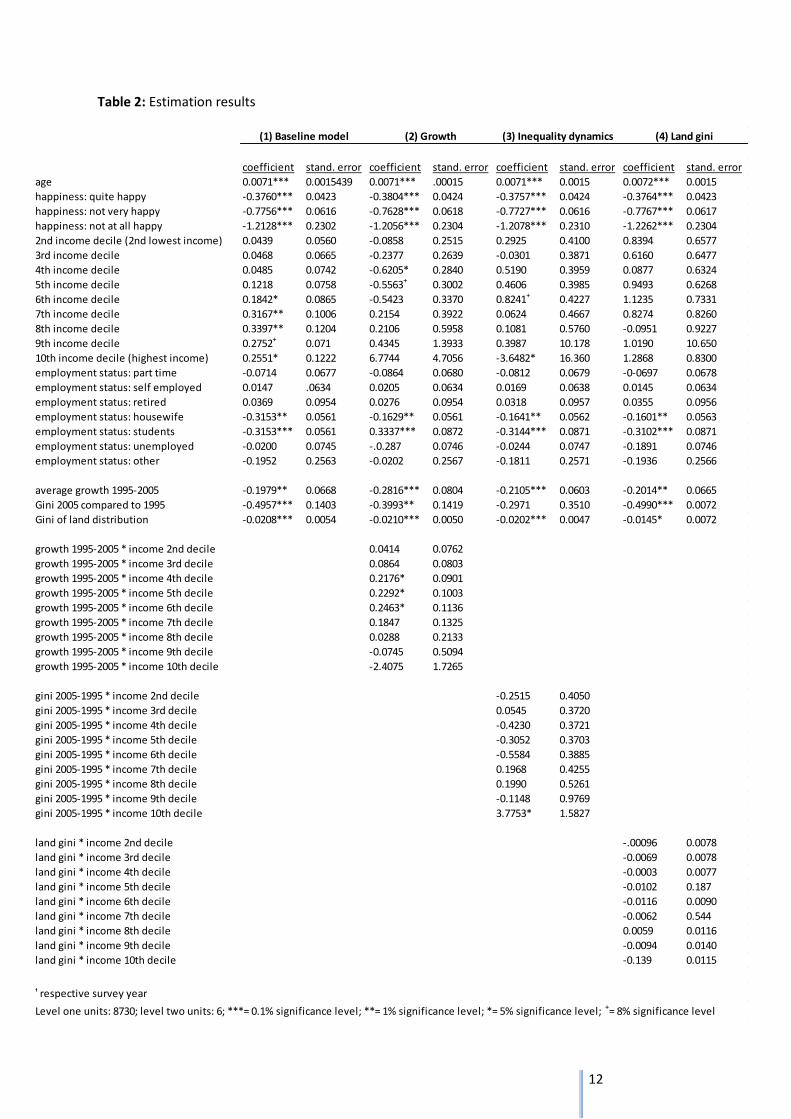
Table 2 shows the results from the multilevel analysis for four different models. Model (1) is the
baseline model and excludes all interaction effects. The individual level includes as regressors the
income share category, age, the employment status and the degree of self-reported happiness. The
latter three are control variables, while primary interest resides on the respondent’s income share. A
gender dummy and the educational level were excluded from the very beginning because they did
not show significant coefficients in any model specification. Thus hypothesis (2) has been discarded
from the beginning.
Participants belonging to the richer half of the sample reported higher locus of control scores than
the poorer half. The dummies for the second, third, fourth and fifth income share group did not
produce significant coefficients: the locus of control scores of respondents from these groups are not
significantly different from the scores of participants from the first (the poorest) income group.
However, the sixth, seventh and eighth income shares have significantly higher scores. Within these
shares, the degree grows proportionately to the income. Income shares nine and ten are as well
significantly above the poorest groups, but less strongly than the former shares and only at an 8%
significance level in the case of income decile nine.
Two employment statuses are significantly different from the default category “fulltime
employment”: Housewives and students perceive less control over their lives. Older respondents and
happier respondents were relatively more internal. On level two, the best fit of the baseline model
was obtained with the inclusion of the average growth rate from 1995 to 2005, the change of the
Gini coefficient within the last ten years before the survey date, and the Gini coefficient of land
distribution.
12
coefficient stand. error coefficient stand. error coefficient stand. error coefficient stand. error
age 0.0071*** 0.0015439 0.0071*** .00015 0.0071*** 0.0015 0.0072*** 0.0015
happiness: quite happy -0.3760*** 0.0423 -0.3804*** 0.0424 -0.3757*** 0.0424 -0.3764*** 0.0423
happiness: not very happy -0.7756*** 0.0616 -0.7628*** 0.0618 -0.7727*** 0.0616 -0.7767*** 0.0617
happiness: not at all happy -1.2128*** 0.2302 -1.2056*** 0.2304 -1.2078*** 0.2310 -1.2262*** 0.2304
2nd income decile (2nd lowest income) 0.0439 0.0560 -0.0858 0.2515 0.2925 0.4100 0.8394 0.6577
3rd income decile 0.0468 0.0665 -0.2377 0.2639 -0.0301 0.3871 0.6160 0.6477
4th income decile 0.0485 0.0742 -0.6205* 0.2840 0.5190 0.3959 0.0877 0.6324
5th income decile 0.1218 0.0758 -0.5563+ 0.3002 0.4606 0.3985 0.9493 0.6268
6th income decile 0.1842* 0.0865 -0.5423 0.3370 0.8241+ 0.4227 1.1235 0.7331
7th income decile 0.3167** 0.1006 0.2154 0.3922 0.0624 0.4667 0.8274 0.8260
8th income decile 0.3397** 0.1204 0.2106 0.5958 0.1081 0.5760 -0.0951 0.9227
9th income decile 0.2752+ 0.071 0.4345 1.3933 0.3987 10.178 1.0190 10.650
10th income decile (highest income) 0.2551* 0.1222 6.7744 4.7056 -3.6482* 16.360 1.2868 0.8300
employment status: part time -0.0714 0.0677 -0.0864 0.0680 -0.0812 0.0679 -0-0697 0.0678
employment status: self employed 0.0147 .0634 0.0205 0.0634 0.0169 0.0638 0.0145 0.0634
employment status: retired 0.0369 0.0954 0.0276 0.0954 0.0318 0.0957 0.0355 0.0956
employment status: housewife -0.3153** 0.0561 -0.1629** 0.0561 -0.1641** 0.0562 -0.1601** 0.0563
employment status: students -0.3153*** 0.0561 0.3337*** 0.0872 -0.3144*** 0.0871 -0.3102*** 0.0871
employment status: unemployed -0.0200 0.0745 -.0.287 0.0746 -0.0244 0.0747 -0.1891 0.0746
employment status: other -0.1952 0.2563 -0.0202 0.2567 -0.1811 0.2571 -0.1936 0.2566
average growth 1995-2005 -0.1979** 0.0668 -0.2816*** 0.0804 -0.2105*** 0.0603 -0.2014** 0.0665
Gini 2005 compared to 1995 -0.4957*** 0.1403 -0.3993** 0.1419 -0.2971 0.3510 -0.4990*** 0.0072
Gini of land distribution -0.0208*** 0.0054 -0.0210*** 0.0050 -0.0202*** 0.0047 -0.0145* 0.0072
growth 1995-2005 * income 2nd decile 0.0414 0.0762
growth 1995-2005 * income 3rd decile 0.0864 0.0803
growth 1995-2005 * income 4th decile 0.2176* 0.0901
growth 1995-2005 * income 5th decile 0.2292* 0.1003
growth 1995-2005 * income 6th decile 0.2463* 0.1136
growth 1995-2005 * income 7th decile 0.1847 0.1325
growth 1995-2005 * income 8th decile 0.0288 0.2133
growth 1995-2005 * income 9th decile -0.0745 0.5094
growth 1995-2005 * income 10th decile -2.4075 1.7265
gini 2005-1995 * income 2nd decile -0.2515 0.4050
gini 2005-1995 * income 3rd decile 0.0545 0.3720
gini 2005-1995 * income 4th decile -0.4230 0.3721
gini 2005-1995 * income 5th decile -0.3052 0.3703
gini 2005-1995 * income 6th decile -0.5584 0.3885
gini 2005-1995 * income 7th decile 0.1968 0.4255
gini 2005-1995 * income 8th decile 0.1990 0.5261
gini 2005-1995 * income 9th decile -0.1148 0.9769
gini 2005-1995 * income 10th decile 3.7753* 1.5827
land gini * income 2nd decile -.00096 0.0078
land gini * income 3rd decile -0.0069 0.0078
land gini * income 4th decile -0.0003 0.0077
land gini * income 5th decile -0.0102 0.187
land gini * income 6th decile -0.0116 0.0090
land gini * income 7th decile -0.0062 0.544
land gini * income 8th decile 0.0059 0.0116
land gini * income 9th decile -0.0094 0.0140
land gini * income 10th decile -0.139 0.0115
ᵻ respective survey year
Level one units: 8730; level two units: 6; ***= 0.1% significance level; **= 1% significance level; *= 5% significance level; += 8% significance level
(1) Baseline model (2) Growth (3) Inequality dynamics (4) Land gini
Table 2: Estimation results
13
The average growth rate between 1995 and 2005 has a highly significant, negative impact on the
locus of control score. On average, locus of control responses were lower in countries where average
growth had been relatively lower during the ten previous years. The Gini coefficient change variable
is positive when the Gini coefficient in 2005 is lower in than it was in 1995.11 The negative
relationship between this variable and the locus of control score therefore indicates that a higher
locus of control response is associated with increased inequality in a ten year period. The Gini
coefficient of land distribution was highly significant and negatively associated with the locus of
control score: countries with more unequal underlying structures and patterns of distribution have
lower scores, on average. The GNI per capita was never significant in any specification.
Model (2) adds to the basic model the conditional effect of the income category under consideration
of the average growth rate 1995-2005. The first level control variables and the effects of housewife
and student status as well as all level two variables remain significant and keep their sign.
The only change is observed regarding the unconditional and the new conditional effect of the
income share groups. While the income level effects from the basic model disappear completely, the
fourth and fifth income share groups now perceive more external control than the poorest decile,
even if the effect for the fifth decile is significant at the 8% level. As to the interaction effect, the
fourth, fifth and sixth income deciles in interaction with the growth rate produce significant, positive
signs. The higher the growth rate and the higher the income category, the higher is the coefficient.
Therefore it is clear that the negative unconditional effect is more than compensated and that model
(2) again reveals that income categories four, five and six ultimately have significantly higher locus of
control scores than the poorer groups. In addition to this result that model (1) had already identified,
the positive interaction effect reinforces this difference for those countries where the average
growth rate was higher in the 1995-2005 period.
Model (3) introduces another interaction term in order to account for the effect of the income share
on the locus of control score under consideration of income inequality dynamics. The level one
control variables and the effect of the employment statuses as well as the average growth and the
land Gini remain unchanged, but the income share result is quite different: the only income decile
with significant difference from the poorest group is the richest decile. Belonging to the ten per cent
of respondents with the highest incomes makes the locus of control response decrease. Again, this
effect is counterbalanced by the conditional effect, where the richest group has a largely higher locus
of control score – all the more, again, in countries with higher Gini change rate. This value was
smaller than one when inequality had increased and higher than one when inequality had decreased.
Since there is more differentiation with higher values, the locus of control score of the richest decile
is more importantly different from the other groups in countries where inequality during the last ten
years has decreased.
Model (4) tests whether the effect of the income category on the locus of control response differs
with different patterns of land distribution. In this specification, all level one variables except the
income categories keep their signs. There are no effects of single income categories on the locus of
control score anymore. The average growth rate, inequality changes and the Gini coefficient of land
11 More precisely, the Gini change variable calculates the Gini of the earlier point in time as percentage of the
2005 Gini. Brazil’s Gini coefficient amounted to 61.0 in 1990 and to 56.8 in 2005. The change coefficient for the period 1990-2005 is thus 1.03 and indicates a decrease of the Gini coefficient.
14
distribution still produce significant effects, although the latter is now significant at 5%, opposed to
0.1% in previous specifications. No conditional effects are found for the income categories. In this
particular model specification, there was no single difference of locus of control scores along income
patterns.
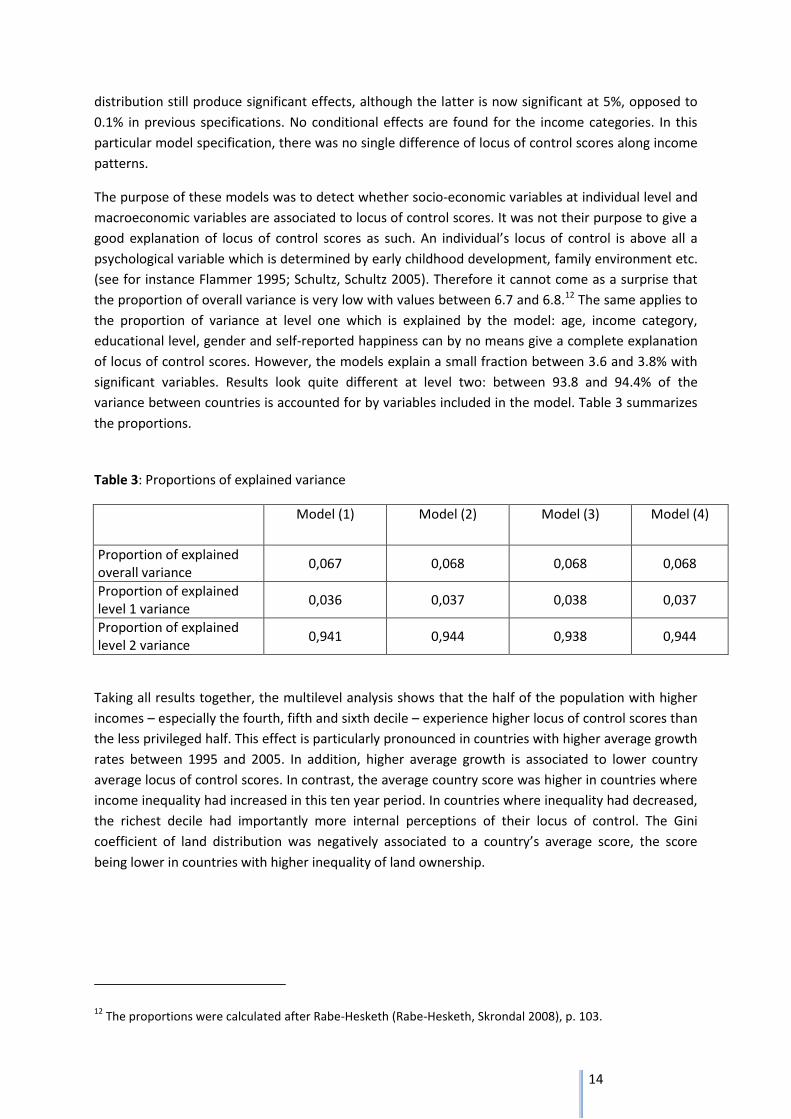
The purpose of these models was to detect whether socio-economic variables at individual level and
macroeconomic variables are associated to locus of control scores. It was not their purpose to give a
good explanation of locus of control scores as such. An individual’s locus of control is above all a
psychological variable which is determined by early childhood development, family environment etc.
(see for instance Flammer 1995; Schultz, Schultz 2005). Therefore it cannot come as a surprise that
the proportion of overall variance is very low with values between 6.7 and 6.8.12 The same applies to
the proportion of variance at level one which is explained by the model: age, income category,
educational level, gender and self-reported happiness can by no means give a complete explanation
of locus of control scores. However, the models explain a small fraction between 3.6 and 3.8% with
significant variables. Results look quite different at level two: between 93.8 and 94.4% of the
variance between countries is accounted for by variables included in the model. Table 3 summarizes
the proportions.
Table 3: Proportions of explained variance
Model (1) Model (2) Model (3) Model (4)
Proportion of explained overall variance
0,067 0,068 0,068 0,068
Proportion of explained level 1 variance
0,036 0,037 0,038 0,037
Proportion of explained level 2 variance
0,941 0,944 0,938 0,944
Taking all results together, the multilevel analysis shows that the half of the population with higher
incomes – especially the fourth, fifth and sixth decile – experience higher locus of control scores than
the less privileged half. This effect is particularly pronounced in countries with higher average growth
rates between 1995 and 2005. In addition, higher average growth is associated to lower country
average locus of control scores. In contrast, the average country score was higher in countries where
income inequality had increased in this ten year period. In countries where inequality had decreased,
the richest decile had importantly more internal perceptions of their locus of control. The Gini
coefficient of land distribution was negatively associated to a country’s average score, the score
being lower in countries with higher inequality of land ownership.
12 The proportions were calculated after Rabe-Hesketh (Rabe-Hesketh, Skrondal 2008), p. 103.
15
4.2 Discussion
The interpretation of results is quite straight-forward at level one and slightly less obvious at level
two. The income level delivered the expected results as formulated in hypothesis (1): in general, the
poorer half of the six Latin American societies from the sample reported less strong feelings of
control over their lives. This is in line with the aspirations literature and requires no further
discussion. On the contrary, the educational level dummies were in no specification significant
predictors although an important effect was expected; hypothesis (2) cannot be supported.
In the context of Latin-American societies, two possible interpretations suggest themselves. First, the
educational level is correlated to the income level. Since the income level is already a highly
significant predictor, the accumulated effects might be predominantly captured by this variable:
more privileged people perceive more control over their lives, but this is primarily due to their higher
income and not to the higher educational level which they happen to have as a side-effect of their
higher income (see Andersen (2001) for an account of interrelations between income level and
educational success). Second, social mobility and educational inequality of opportunity are rather
low (see Paes de Barros et al. (2009) and Ferreira et al. 2013). Thus it might be questioned whether
higher educational levels actually open doors to better job opportunities and income levels. A school-
leaving qualification from a public school is not appreciated to the same extent as a qualification
from a private school, for instance. Since the income level of the parent(s) determines the type and
quality of school a child is able to attend, higher educational levels promise more rewards for initially
more privileged children. This might explain why a higher educational level does not generally make
people perceive more control over their lives. All together, these findings suggest that the disposable
income is of primary importance for the perception of control over one’s life and the aspirations
people build.
The control variables gender, age, employment status and degree of self-reported happiness are not
subject to any efforts of interpretation. Students and housewives most often depend on other
people’s support and are less independent, which possibly explains why they feel less control over
their lives. It is largely unclear what exactly the happiness variable measures and what it is that
makes people report high or low degrees of happiness. This variable is kept for the only reason that it
is highly significant and thus its exclusion would imply an omitted variable bias.
As to the macro-level explanatory factors, interpretation is less intuitive. Hypothesis (4) stated that
higher locus of control scores might be expected in countries with positive growth experiences. At
the same time, one essential aspect of the tunnel theory is that the effect will depend on the time
horizon and the interaction with inequality dynamics. The period of ten years, which turned out to
have the most significant effect, can be interpreted as a short or medium term. Higher growth in
short or medium terms, according to Hirschman, would stimulate people’s hopes and expectations.
In the present sample, however, growth rates in the 1995-2005 were associated negatively to locus
of control scores. This result looks at first sight surprising.
Certainly growth dynamics should not be interpreted without taking account of the interaction with
inequality dynamics. Increased inequality in the same period was associated positively to locus of
control responses. One might argue that this is in line with hypothesis (5): an increase of inequality in
this short or medium term comes along with perceptions of control and optimistic expectations.
However, it was not inequality which was causal in this regard: inequality rather was an expected
16
covariate of unbalanced growth. Therefore it makes little sense to draw such conclusion while
hypothesis (4) is not met.
Two central discrepancies between the tunnel theory and its empirical application come to light at
this point. First, reinforced growth does not always coincide with increasing inequality. Growth is not
always unbalanced; it might as well come along with inequality reduction. The tunnel effect describes
only one possible combination of growth and inequality dynamics, while real cases can be more
diverse. Second, while looking at specific intervals, one cannot know whether a growth period has
been short, medium or long-term already.
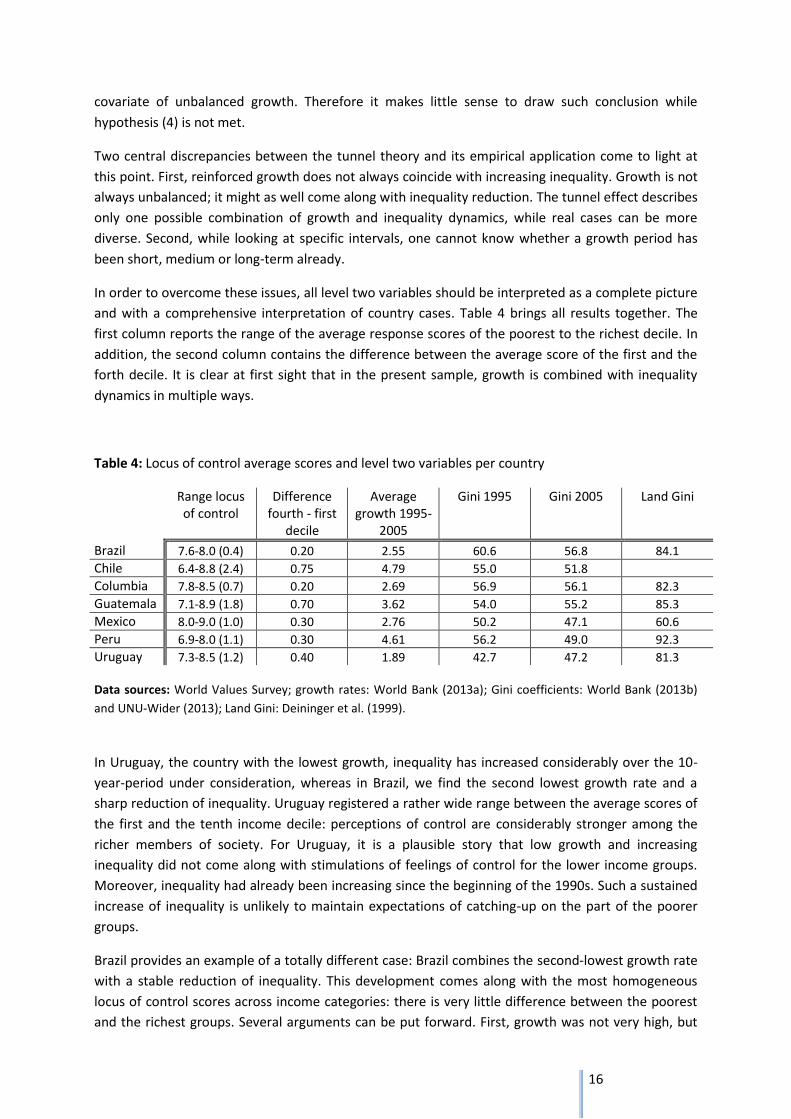
In order to overcome these issues, all level two variables should be interpreted as a complete picture
and with a comprehensive interpretation of country cases. Table 4 brings all results together. The
first column reports the range of the average response scores of the poorest to the richest decile. In
addition, the second column contains the difference between the average score of the first and the
forth decile. It is clear at first sight that in the present sample, growth is combined with inequality
dynamics in multiple ways.
Table 4: Locus of control average scores and level two variables per country
Range locus of control
Difference fourth - first
decile
Average growth 1995-
2005
Gini 1995 Gini 2005 Land Gini
Brazil 7.6-8.0 (0.4) 0.20 2.55 60.6 56.8 84.1
Chile 6.4-8.8 (2.4) 0.75 4.79 55.0 51.8
Columbia 7.8-8.5 (0.7) 0.20 2.69 56.9 56.1 82.3
Guatemala 7.1-8.9 (1.8) 0.70 3.62 54.0 55.2 85.3
Mexico 8.0-9.0 (1.0) 0.30 2.76 50.2 47.1 60.6
Peru 6.9-8.0 (1.1) 0.30 4.61 56.2 49.0 92.3
Uruguay 7.3-8.5 (1.2) 0.40 1.89 42.7 47.2 81.3
Data sources: World Values Survey; growth rates: World Bank (2013a); Gini coefficients: World Bank (2013b)
and UNU-Wider (2013); Land Gini: Deininger et al. (1999).
In Uruguay, the country with the lowest growth, inequality has increased considerably over the 10-
year-period under consideration, whereas in Brazil, we find the second lowest growth rate and a
sharp reduction of inequality. Uruguay registered a rather wide range between the average scores of
the first and the tenth income decile: perceptions of control are considerably stronger among the
richer members of society. For Uruguay, it is a plausible story that low growth and increasing
inequality did not come along with stimulations of feelings of control for the lower income groups.
Moreover, inequality had already been increasing since the beginning of the 1990s. Such a sustained
increase of inequality is unlikely to maintain expectations of catching-up on the part of the poorer
groups.
Brazil provides an example of a totally different case: Brazil combines the second-lowest growth rate
with a stable reduction of inequality. This development comes along with the most homogeneous
locus of control scores across income categories: there is very little difference between the poorest
and the richest groups. Several arguments can be put forward. First, growth was not very high, but
17
rates were higher towards the end of the 1995-2005 period. In addition, Luíz Inácio da Silva became
president in 2003, promising a reinforcement of social policies and increasing inclusion of
underprivileged sectors of Brazilian society. Overall, after Lula’s first two years in presidency and
recent experiences of growth and increasing inequality reduction, it stands to reason that all shares
of Brazilian society seem to have been optimistic and perceived higher control over their lives.
Columbia provides a similar growth picture as Brazil, but with a much more limited reduction of
inequality and without the same changes in the political arena. Until 2000, inequality had still
increased; therefore the reduction was not as sustained as in Brazil. It makes sense that inequality is
a little bit more diverse here – although Columbia still belongs to the more homogeneous countries.
Mexico lies in the middle field of economic growth and has registered a considerable reduction of
inequality. The range of locus of control scores is not really small, but the absolute scores are
remarkably high. Furthermore the difference between the first and the fourth decile is quite small:
the size of the interval seems to be driven by the very high scores of the higher incomes.
Nevertheless, sustained growth and reduction of inequality coincide with the highest feelings of
control of the lowest incomes of the whole sample. The relatively low land Gini is as well remarkable
and might be associated with the generally high scores.
Guatemala is the country with the largest heterogeneity between incomes. Growth was rather high
in comparison to the sample, but inequality has increased. At first glance this contradicts the logic of
the tunnel effect which had predicted that when there is growth, all incomes will be more optimistic
and expect better chances when there is growth, despite temporarily increased inequality. However,
if that was the case, the expected catching-up moment should already have occurred: growth was
even higher at the beginning of the 1990s, accompanied by an initial decrease of inequality in the
1990s, but this tendency was quickly reversed. The potential catching-up moment, if it was there
around 1995, has passed without considerable effects. Peru provides a similar case: average growth
is quite high and was even higher for the 1990-2005 period. Inequality initially increased up to 1995
and decreased since then. The rather large heterogeneity might be related to the extremely high land
Gini.
Chile, finally, had been excluded from the panel because no land Gini was available. However, it is
included in the interpretation because it proposes an interesting illustration of a high growth country
and helps explain the paradox of high growth rates being associated with rather low locus of control
scores. Chile had the highest average growth rate in 1995-2005 and inequality has decreased quite
considerably. Notwithstanding, we find here the largest difference between the first and the forth
decile and high overall heterogeneity. In no other country is the score of the lowest decile as low as
in Chile. These inopportune findings might have a simple explanation: average growth was very high
during the ten years before the survey was conducted, but it had even been higher in previous
periods (1990-2005 and even 1981-2005). Inequality, in contrary, was quite constant between the
1980s and the year 2000. Only during the last five years before the survey did inequality begin to
register falling rates. After the reduction took so long to happen, it is possible that the belief in a
possible catching-up effect was ruined while inequality did not decrease and that particularly the
lower income groups still do not perceive improved possibilities and chances.
Short detours to the country cases apply the logic of the tunnel effect as a whole rather than
decomposing the effects. This was necessary in order to consider relevant interactions. While the
18
hypotheses stated effects under the condition that “all other things be equal”, this condition is not a
characteristic of real world phenomena. Short looks at single cases has allowed giving plausible
explanations of different pictures in different contexts. Going deeper into the cases would probably
bring many more additional details and circumstances to light.
One remaining puzzle is the finding that higher growth rates were associated with lower average
scores – instead of higher scores, which had been expected. It is the case that the countries with the
highest growth rates – Peru, Guatemala and Chile (although Chile is not to blame for the regression
results, of course) – did not achieve the reduction of their inequality levels at the rhythm of growth.
Peru, with more inclusive growth, registers the highest land Gini, indicating high structural inequality.
These pictures might be a particular characteristic of the present sample and by no means identify a
general tendency. However, the results strongly recommend looking at the whole picture instead of
isolating indicators of effects.
Why is increased inequality linked to higher average scores? Inequality increased in only two
countries: Guatemala and Uruguay. These are the two countries with the most heterogeneous
scores. The effect is therefore likely to be driven by high scores of the richer groups. This does
eventually not contradict hypothesis (5). This hypothesis furthermore stated that prolonged high
inequality could lead to despondence and discouragement. Quite high land Gini coefficients in
Guatemala and Peru fit into this picture. Notwithstanding, the structural inequality of Brazil is almost
as high as Guatemala’s, which seems to be difficult to bring together with Brazil’s homogeneous
scores. On the other hand, Brazilian average scores are quite low. In fact, the relationship between
the land Gini and the locus of control scores is difficult to assess. Interpreting the land Gini as an
indicator of structural, underlying inequality patterns might point to interpretations similar to
(Wilkinson, Pickett 2010)’s work: high structural inequality is bad for everybody, not only for the
poorer groups. But more in-depth research is need in this regard before jumping to conclusions.
5. Conclusion and outlook
This paper has investigated the effect of a person’s income level and economic variables at national
level on this person’s locus of control, taken as proxy for aspiration levels. The analysis of WVS data
gave first insights into the relationship between the perceived locus of control and a person’s income
level, growth, inequality and distributional dynamics. However, quantitative interpretation gets to is
limits when interactions between dynamics become complex. The interpretation of country cases as
a whole was a fruitful exercise and in-depth research is likely to hold more detailed lessons.
Notwithstanding, the multilevel regression was a useful tool for identifying interaction effects,
amongst other aspects.
Some results were consistent with main hypotheses derived from Albert Hirschman’s tunnel parable
and from the aspirations literature. Richer income groups perceive more control over their lives. The
level of educational attainment was not related to the locus of control, but this finding might be
particular of a Latin-American sample. One important lesson was that the effects of growth and
inequality dynamics cannot be assessed separately. Looking instead at the ensemble acting of growth
and inequality, it was possible to make sense of every single country case. Of course future
investigation must be open for possible other explanations as well. After the exercises of this paper,
19
one careful conclusion states that growth can stimulate people’s locus of control – even among the
poorer groups – when it is inclusive. Otherwise, only the richer income groups perceive more control.
The land Gini, interpreted as indicator of structural and less volatile inequality, was associated with
lower average scores, regardless of other variables or their dynamics. This finding is very interesting
in the light of the recent inequality literature that argues that high inequality has negative effects not
only for the underprivileged but for the whole society. This is supported as well by the finding that
the richest ten percent of the population perceive more control over their lives – and all the more in
societies were inequality decreased, might point into the same direction. More research is required.
The analysis in this paper was limited by the small data set of only six countries and the availability of
variables in the World Values Survey. For example, it was only possible to look at one component of
aspirations. The investigation of data for self-efficacy beliefs would be highly desirable. The WVS
provides data for countries from several periods, but unfortunately these are no panel data.
Observing the same individuals and their assessments at several times would allow much richer
analysis and deeper understandings on individual’s perceptions and aspiration formation processes.
A further shortcoming of the dataset in relation to the purpose of this paper lies is the imperfect
phrasing of available variables. Social cognitive theory has identified accurate item formulation for
the investigation of people’s perceived locus of control, self-efficacy scales and, thus, aspiration
levels.
As further improvement of the presented analysis, an inquiry into actors’ perception of macro-level
developments would be desirable. Both in theory and empirical analysis, it has been assumed that
people observe and are influenced in their judgments by economic indicators and income
distribution. This assumes that agents are aware of economic development and the evolution of
inequality. However, it is not guaranteed that individuals are constantly aware of the development of
the economy they live in and the distribution of income at a national level. Cognitive heuristics and
corresponding empirical analysis from social psychology provide broad evidence for such
phenomena.
20
Bibliography
Akerlof, George A.; Kranton, Rachel E. (2000): Economics and Identity. In Quarterly Journal of Economics (115(3)), pp. 715–753.
Alsop, Ruth; Bertelsen, Mette; Holland, Jeremy (2005): Empowerment in Practice: World Bank Publications.
Andersen, Lykke (2001): Social Mobility in Latin America: Links with Adolescent Schooling, Interamerican Development Bank Research Network Working Paper # R-433.
Appadurai, Arjun (2004): The Capacity to Aspire: Culture and the Terms of Recognition. In Vijayendra Rao, Michael Walton (Eds.): Culture and public action. Stanford, California: Stanford University Press; Stanford Social Sciences, pp. 59–84.
Bandura, Albert (1977): Social learning theory. Englewood Cliffs, N.J: Prentice Hall.
Bandura, Albert (1997): Self-efficacy. The exercise of control. New York: W.H. Freeman.
Banerjee, Abhijit V.; Duflo, Esther (2012): Poor economics. A radical rethinking of the way to fight global poverty. Pbk.ed. New York: PublicAffairs.
Bernard, Tanguy; Dercon, Stefan; Seyoum Taffesse, Alemayehu (2011): Beyond Fatalism. An Empirical Exploration of Self-Efficacy and Aspirations Failure in Ethiopia. In International Food Policy Research Institute Discussion Paper (01101).
Blasius, Jörg; Thiessen, Victor (2012): Assessing the quality of survey data. London, Thousand Oaks, Calif.: Sage Publications.
Camerer, Colin; Babcock, Linda; Loewenstein, George; Thaler, Richard (1997): Labor supply of New York City cabdrivers. One day at a time. In Quarterly Journal of Economics (112(2)), pp. 407–441.
Cochran, Daria B.; Wang, Eugene W.; Stevenson, Sarah J.; Johnson, Leah E.; Crews, Charles (2011): Adolescent Occupational Aspirations: Test of Gottfredson's Theory of Circumscription and Compromise. In Career Development Quarterly (59), pp. 412–427.
Dalton, Patricio S.; Ghosal, Sayantan; Mani, Anandi (2011): Poverty and Aspirations Failure. Available online at http://www2.warwick.ac.uk/fac/soc/economics/staff/academic/mani/aspire23_2.pdf=0, updated on 3/10/2011, checked on 12/11/2012.
Deininger, Klaus; Olinto, Pedro; Bank, World (1999): Asset Distribution, Inequality, and Growth. Available online at http://elibrary.worldbank.org/docserver/download/2375.pdf?expires=1376476695&id=id&accname=guest&checksum=22E5B21E23E5C6B5E36B0FF1424B5730, updated on 14/08/2013.
El-Mafaalani, Aladin (2012): BildungsaufsteigerInnen aus benachteiligten Milieus. Habitustransformation und soziale Mobilität bei Einheimischen und Türkeistämmigen. Wiesbaden: Springer VS.
Ferreira, Francisco H. G.; Messina, Julian; Rigolini, Jamele; López-Calva, Luis-Felipe; Lugo, Maria Ana; Vakis, Renos (2013): Economic mobility and the rise of the Latin American middle class. Washington, D.C: World Bank (World Bank Latin American and Caribbean studies).
Flammer, August (1995): Kontrolle, Sicherheit und Selbstwert in der menschlichen Entwicklung. In Wolfgang Edelstein (Ed.): Entwicklungskrisen kompetent meistern. Der Beitrag der Selbstwirksamkeitstheorie von Albert Bandura zum pädagogischen Handeln. Heidelberg: Asanger.
Heifetz, Aviad; Minelli, Enrico (2006): Aspiration Traps. Available online at http://www.openu.ac.il/Personal_sites/Aviad-Heifetz/Aspiration-Traps.pdf.
21
Helwig, Andrew A. (2001): A Test of Gottfredson's Theory Using a Ten-Year Longitudinal Study. In Journal of Career Development (28(2)), pp. 77–95.
Hirschman, Albert O.; Rothschild, Michael (1973): The Changing Tolerance for Income Inequality in the Course of Economic Development. In Quarterly Journal of Economics 87 (4), pp. 544–566.
Jensen, Robert (2010): The (Perceived) Returns to Education and the Demand for Schooling. In Quarterly Journal of Economics 125 (2), pp. 515–548.
Locke, Edwin A.; Latham, Gary P. (2002): Building a practically useful theory of goal setting and task motivation: A 35-year odyssey. In American Psychologist 57 (9), pp. 705–717.
Mookherjee, Dilip; Napel, Stefan; Ray, Debraj (2010): Aspirations, Segregation, and Occupational Choice. In Journal of the European Economic Association (8(1)), pp. 139–168.
Paes de Barros, Ricardo; Ferreira, Francisco H. G.; Molinas Vega, José F.; Chanduvi Saavedra, Jaime (2009): Measuring inequality of opportunities in Latin America and the Caribbean. Washington DC, Houndmills, Basingstoke, Hampshire, New York: World Bank; Palgrave Macmillan (Latin American development forum series).
Rabe-Hesketh, S.; Skrondal, Anders (2008): Multilevel and longitudinal modeling using stata. 2nd ed. College Station, Tex: Stata Press Publication.
Ray, Debraj (2006): Aspirations, Poverty and Economic Change. In Abhijit V. Banerjee, Roland Bénabou, Dilip Mookherjee (Eds.): Understanding poverty. Oxford ;, New York: Oxford University Press, pp. 409–421.
Ray, Debraj (2010): Uneven Growth: A Framework for Research in Development Economics. In Journal of Economic Perspectives 24 (3), pp. 45–60.
Reenock, Christopher; Bernhard, Michael; Sobek, David (2007): Regressive Socioeconomic Distribution and Democratic Survival. International Studies Quarterly 51, pp. 677-699.
Roemer, John E. (1998): Equality of opportunity. Cambridge, Mass: Harvard University Press.
Schindler, Steffen (2012): Aufstiegsangst? Eine Studie zur sozialen Ungleichheit beim Hochschulzugang im historischen Zeitverlauf. Edited by Vodafone Stiftung Deutschland. Available online at http://www.vodafone-stiftung.de/meta_downloads/53423/studie_hochschulzugang_web.pdf, checked on 15/03/2013.
Schultz, Duane P.; Schultz, Sydney Ellen (2005): Theories of personality. 8th ed. Australia, Belmont, CA: Thomson/Wadsworth.
Sen, Amartya (2004): How Does Culture Matter? In Vijayendra Rao, Michael Walton (Eds.): Culture and public action. Stanford, California: Stanford University Press; Stanford Social Sciences, pp. 37–58.
Wilkinson, Richard G.; Pickett, Kate (2010): The spirit level. Why equality is better for everyone. Publ. with rev. London: Penguin Books (Pinguin sociology).
World Bank (2013a): GDP growth (annual %). Available online at http://api.worldbank.org/datafiles/NY.GDP.MKTP.KD.ZG_Indicator_MetaData_en_EXCEL.xls, checked on 12/06/2013.
World Bank (2013b): GINI Index. Available online at http://api.worldbank.org/datafiles/SI.POV.GINI_Indicator_MetaData_en_EXCEL.xls, checked on 12/06/2013.
World Values Survey Association (2009): World Values Survey 1981-2008 Official Aggregate v.20090914. Available online at http://www.wvsevsdb.com/wvs/WVSData.jsp?Idioma=I, updated on 14/09/2009.