Embed Size (px)
Citation preview
Province of the
EASTERN CAPEDepartment of Roads & Transport
“Quality Service Delivery through Transportation Excellence”
Report on Conditional Grants and Report on Conditional Grants and Capital Expenditure 3Capital Expenditure 3rdrd Quarter Quarter
2007/2008 Financial Year2007/2008 Financial Year
NCOP PRESENTATION05 FEBRUARY 2008
“Quality Service Delivery through Transportation Excellence” 2
Eastern Cape Department of Roads & Transport
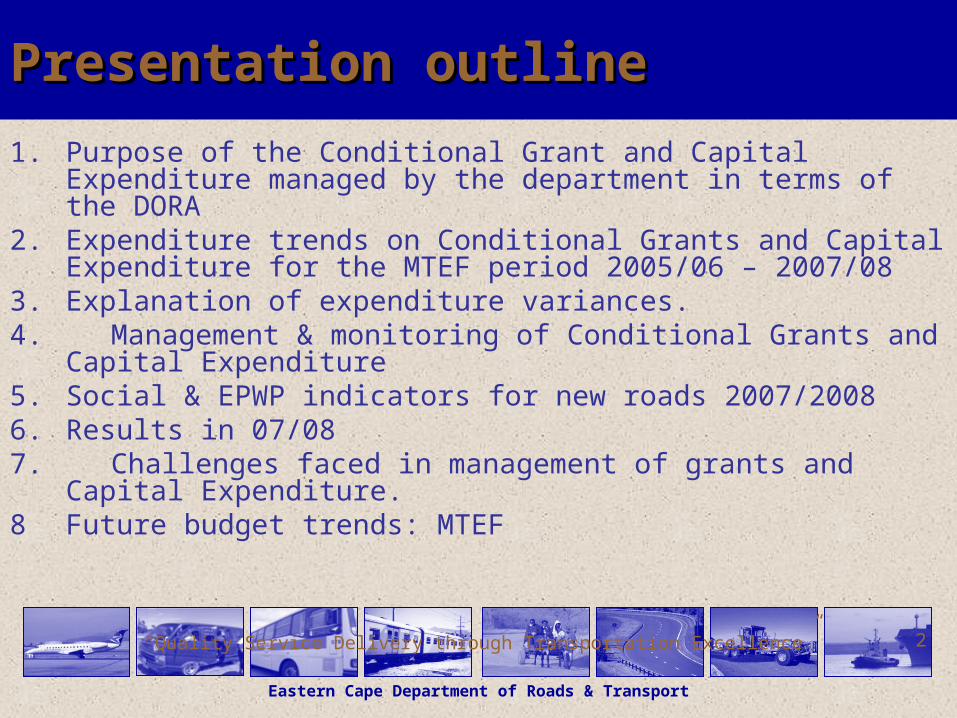
Presentation outlinePresentation outline
1. Purpose of the Conditional Grant and Capital Expenditure managed by the department in terms of the DORA
2. Expenditure trends on Conditional Grants and Capital Expenditure for the MTEF period 2005/06 – 2007/08
3. Explanation of expenditure variances. 4. Management & monitoring of Conditional Grants and Capital
Expenditure5. Social & EPWP indicators for new roads 2007/20086. Results in 07/087. Challenges faced in management of grants and Capital
Expenditure.8 Future budget trends: MTEF

“Quality Service Delivery through Transportation Excellence” 3
Eastern Cape Department of Roads & Transport
1. Purpose of this Conditional 1. Purpose of this Conditional Grant and Capital ExpenditureGrant and Capital Expenditure►To accelerate construction and rehabilitation of new and To accelerate construction and rehabilitation of new and existing Eastern Cape Provincial road infrastructure and Transport existing Eastern Cape Provincial road infrastructure and Transport Services.Services.► Accelerate implementation of the Provincial Growth Accelerate implementation of the Provincial Growth Development Plan.Development Plan.► The grant requires us to focus on the application of labour The grant requires us to focus on the application of labour intensive methods in order to maximise job creation and skills intensive methods in order to maximise job creation and skills development.development.► Enhance capacity to deliver Road Infrastructure and Transport Enhance capacity to deliver Road Infrastructure and Transport facilities.facilities.►Create the necessary Transport Services facilities in Municipal Create the necessary Transport Services facilities in Municipal Areas as supported by ITP and MTABs.Areas as supported by ITP and MTABs.

“Quality Service Delivery through Transportation Excellence” 4
Eastern Cape Department of Roads & Transport
DEPARTMENTAL EXPENDITURE DEPARTMENTAL EXPENDITURE
►Expenditure as at 31/12/07
Program SummaryOriginal Budget
Adjusted Budget
Actual End of
December%
spent
IYM projecti
ons
R'000 R'000 R'001 R'0001. Administration 144,030 157,280 112,536 71.6% 44,744
2. Roads Infrastructure 1,515,105 1,615,105 1,181,513 73.2% 433,592
3. Publ ic Transport 191,884 182,954 115,008 62.9% 67,946
4. Traffi c Management 146,472 146,472 97,210 66.4% 49,262
5. Community Based Transportation 241,574 241,574 148,557 61.5% 93,017
TOTAL PROGRAM SUMMARY 2,239,065 2,343,385 1,654,824 70.6% 688,561

“Quality Service Delivery through Transportation Excellence” 5
Eastern Cape Department of Roads & Transport
3. 3. 2. Expenditure Trends CG2. Expenditure Trends CGProvincial Infrastructure Grant
Provincial Infrastructure Grant
2005/06
R’000
2006/07
R’000
2007/08
R’000
Budget 675,330 742,057 838,937
Expenditure to
31 December 2007
675,330 742,139 682,580
% Expenditure to
31 December 2007
100% 100% 81,36%
“Quality Service Delivery through Transportation Excellence” 6
Eastern Cape Department of Roads & Transport
3. Explanation for expenditure 3. Explanation for expenditure variancesvariances
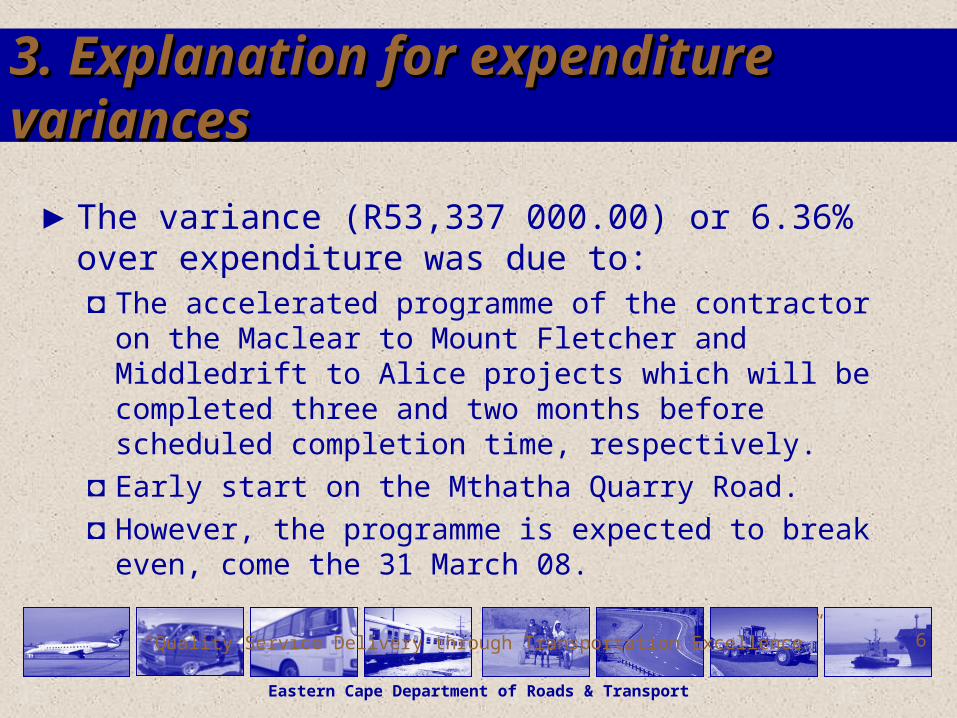
►The variance (R53,337 000.00) or 6.36% over expenditure was due to:◘ The accelerated programme of the contractor on the
Maclear to Mount Fletcher and Middledrift to Alice projects which will be completed three and two months before scheduled completion time, respectively.
◘ Early start on the Mthatha Quarry Road.◘ However, the programme is expected to break even,
come the 31 March 08.
“Quality Service Delivery through Transportation Excellence” 7
Eastern Cape Department of Roads & Transport
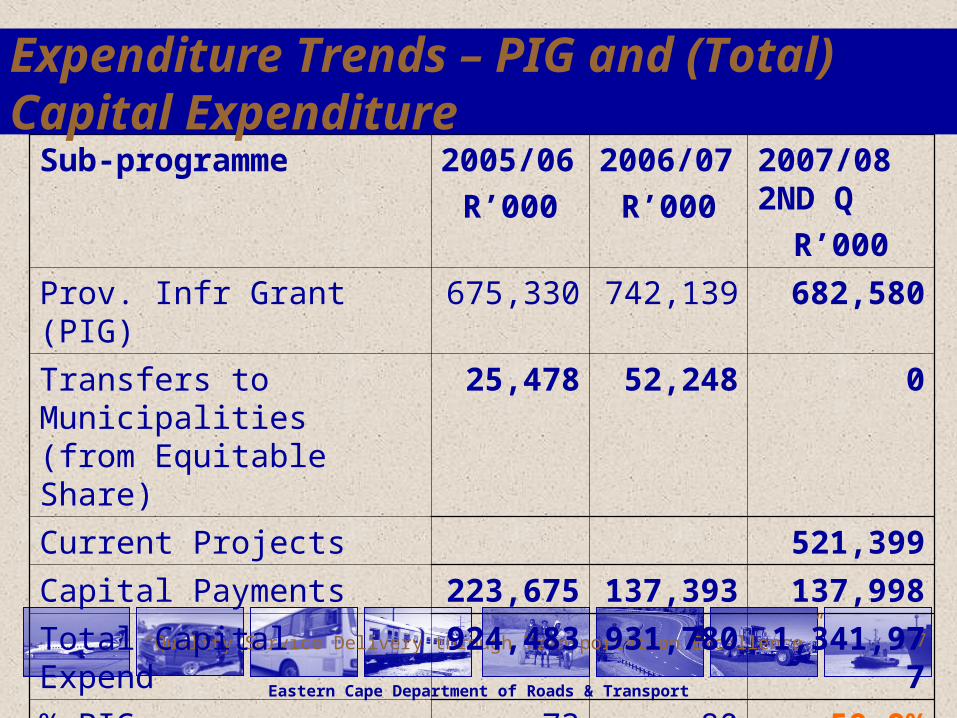
Sub-programme 2005/06
R’000
2006/07
R’000
2007/08 2ND Q
R’000
Prov. Infr Grant (PIG) 675,330 742,139 682,580
Transfers to Municipalities (from Equitable Share)
25,478 52,248 0
Current Projects 521,399
Capital Payments 223,675 137,393 137,998
Total Capital Expend 924,483 931,780 1,341,977
% PIG 73 80 50.9%
Expenditure Trends – PIG and (Total) Capital Expenditure

“Quality Service Delivery through Transportation Excellence” 8
Eastern Cape Department of Roads & Transport
PROJECT BREAKDOWNPROJECT BREAKDOWNProject Information
2007/08Budget
Expenditureup to date
%Exp.
Number of projects
Capital Projects
1,103,210 820,578 74.4% 75
Current Projects
781,833 521,399 66.7% 56
Total
1,885,043 1,341,977 71.2% 131
EPWP ProjectsTotal Available this Financial
Year
Expenditureup to date
%Exp.
Number of projects
Capital Projects
903,575 695,914 77.0% 66
Current Projects
619,234 415,621 67.1% 50
Total
1,522,809 1,111,535 73.0% 116
“Quality Service Delivery through Transportation Excellence” 9
Eastern Cape Department of Roads & Transport
►Departmental officials attend monthly site progress meetings►In addition the CFO and programme manager conduct random site visits on the progress of the contracts.►District Roads Engineers visit and inspect projects in their particular areas.►Professional Engineering Consultants on site monitor the projects.►The Department submits a detailed quarterly report to Provincial and National Treasuries, which captures the full details of the projects including the allocation for the year, the expenditure for the period in question and outputs achieved.► Specific reports are submitted on progress with respect to social indicators such as employment, BEE, local resources etc.►Monthly In-Year Monitoring reports are also submitted to the provincial treasury to monitor the expenditure.►SANRAL(SA National Roads Agency) implements 6 projects on behalf of the department in terms of a Service Level Agreement monitored by Departmental staff.
9. Management & Monitoring mechanism
“Quality Service Delivery through Transportation Excellence” 10
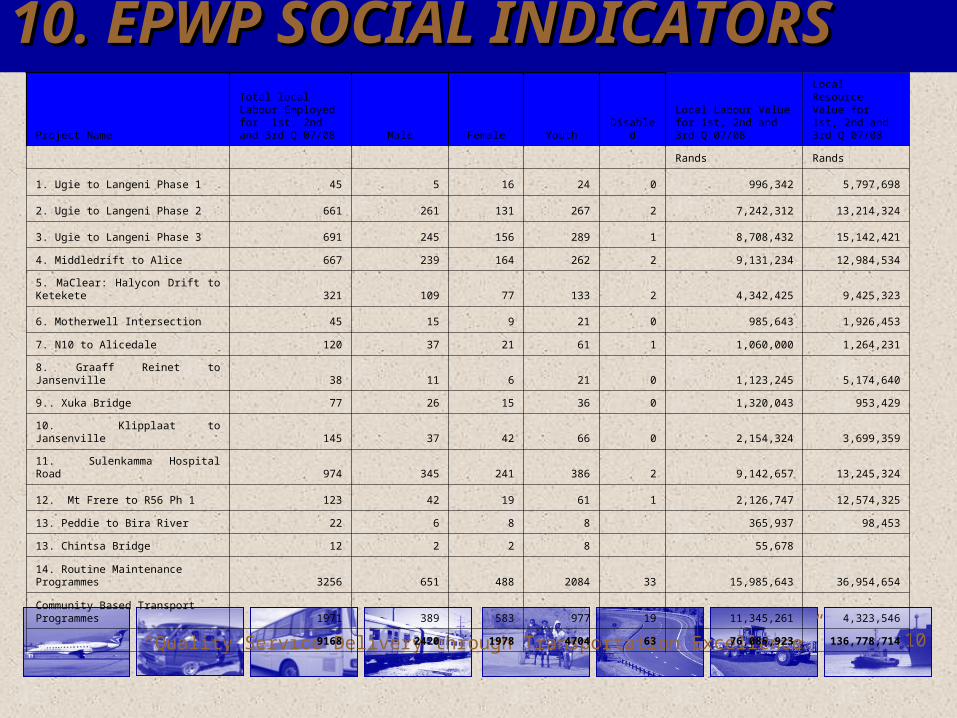
10. EPWP SOCIAL INDICATORS10. EPWP SOCIAL INDICATORS
Project Name
Total local Labour Employed for 1st, 2nd and 3rd Q 07/08 Male Female Youth Disabled
Local Labour Value for 1st, 2nd and 3rd Q 07/08
Local Resource Value for 1st, 2nd and 3rd Q 07/08
Rands Rands
1. Ugie to Langeni Phase 1 45 5 16 24 0 996,342 5,797,698
2. Ugie to Langeni Phase 2 661 261 131 267 2 7,242,312 13,214,324
3. Ugie to Langeni Phase 3 691 245 156 289 1 8,708,432 15,142,421
4. Middledrift to Alice 667 239 164 262 2 9,131,234 12,984,534
5. MaClear: Halycon Drift to Ketekete 321 109 77 133 2 4,342,425 9,425,323
6. Motherwell Intersection 45 15 9 21 0 985,643 1,926,453
7. N10 to Alicedale 120 37 21 61 1 1,060,000 1,264,231
8. Graaff Reinet to Jansenville 38 11 6 21 0 1,123,245 5,174,640
9.. Xuka Bridge 77 26 15 36 0 1,320,043 953,429
10. Klipplaat to Jansenville 145 37 42 66 0 2,154,324 3,699,359
11. Sulenkamma Hospital Road 974 345 241 386 2 9,142,657 13,245,324
12. Mt Frere to R56 Ph 1 123 42 19 61 1 2,126,747 12,574,325
13. Peddie to Bira River 22 6 8 8 365,937 98,453
13. Chintsa Bridge 12 2 2 8 55,678
14. Routine Maintenance Programmes 3256 651 488 2084 33 15,985,643 36,954,654
Community Based Transport Programmes 1971 389 583 977 19 11,345,261 4,323,546
9168 2420 1978 4704 63 76,085,923 136,778,714

“Quality Service Delivery through Transportation Excellence” 11
Eastern Cape Department of Roads & Transport
RESULTSRESULTS
►Launched train service between Queenstown and Molteno in October 07.
►Received Testing License from Rail Safety Regulator.
►Linked MaClear with Mount Fletcher with surfaced road.
►Renovated Bhisho airport such that aircrafts are able to land.
►Handed over to contractors the Greenville Hospital Road, Madwaleni Hospital Road and Zithulele Hospital Road.
“Quality Service Delivery through Transportation Excellence” 12
Eastern Cape Department of Roads & Transport
►Acute shortage of road building materials .►Lack of adequate funding for roads impacts negatively on delivery of a good Road Network and Transport Services.►Ever increasing road construction costs►The construction industry CPIX is currently 24%.►Many of the Access Roads are still impassable and inaccessible.► High Ratio of Gravel to Surfaced Roads (85:15).
12. CHALLENGES12. CHALLENGES
“Quality Service Delivery through Transportation Excellence” 13
Eastern Cape Department of Roads & Transport
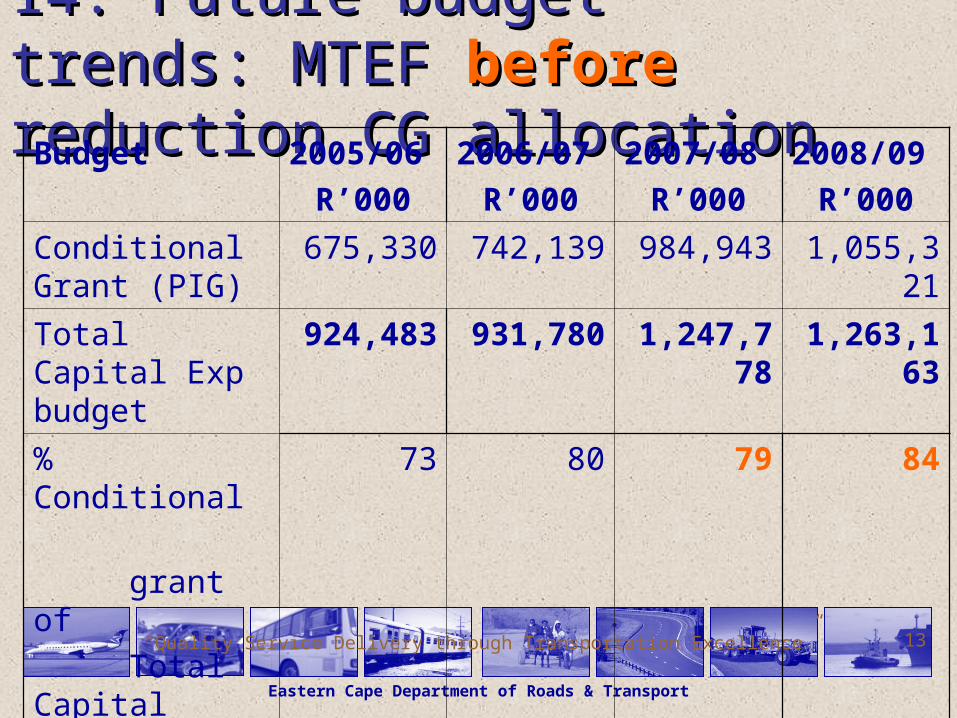
14. Future budget trends: MTEF 14. Future budget trends: MTEF beforebefore reduction CG allocation reduction CG allocation
Budget 2005/06
R’000
2006/07
R’000
2007/08
R’000
2008/09
R’000
Conditional Grant (PIG)
675,330 742,139 984,943 1,055,321
Total Capital Exp budget
924,483 931,780 1,247,778 1,263,163
% Conditional
grant of
Total Capital
budget
73 80 79 84
“Quality Service Delivery through Transportation Excellence” 14
Eastern Cape Department of Roads & Transport
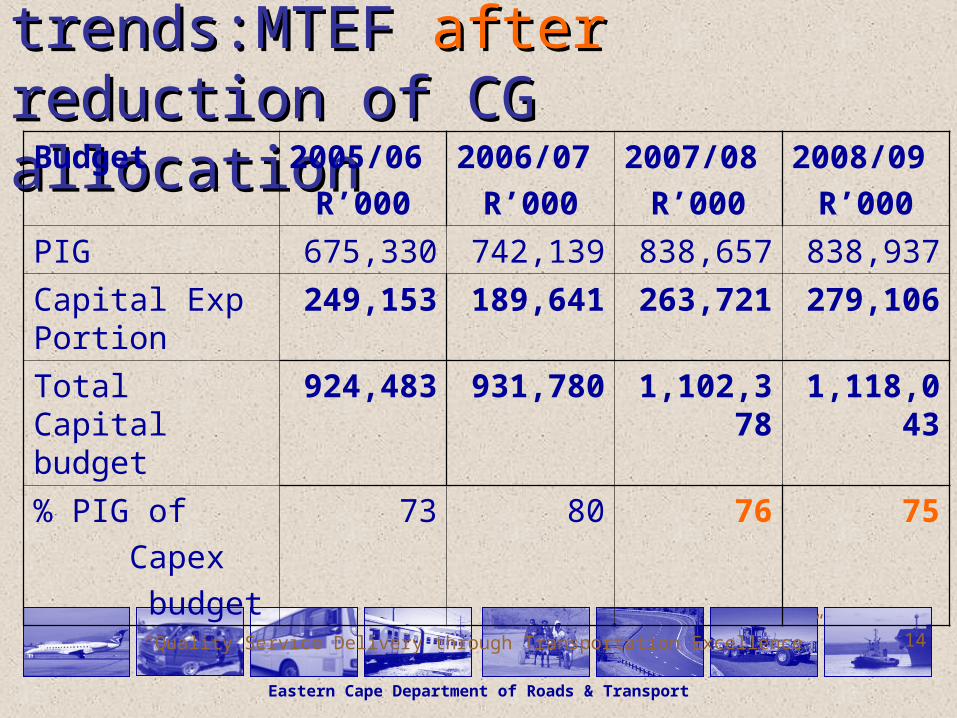
16. Future budget trends:MTEF 16. Future budget trends:MTEF afterafter reduction of CG allocation reduction of CG allocation
Budget 2005/06
R’000
2006/07
R’000
2007/08
R’000
2008/09
R’000
PIG 675,330 742,139 838,657 838,937
Capital Exp Portion
249,153 189,641 263,721 279,106
Total Capital budget
924,483 931,780 1,102,378 1,118,043
% PIG of
Capex
budget
73 80 76 75
“Quality Service Delivery through Transportation Excellence” 15
Eastern Cape Department of Roads & Transport
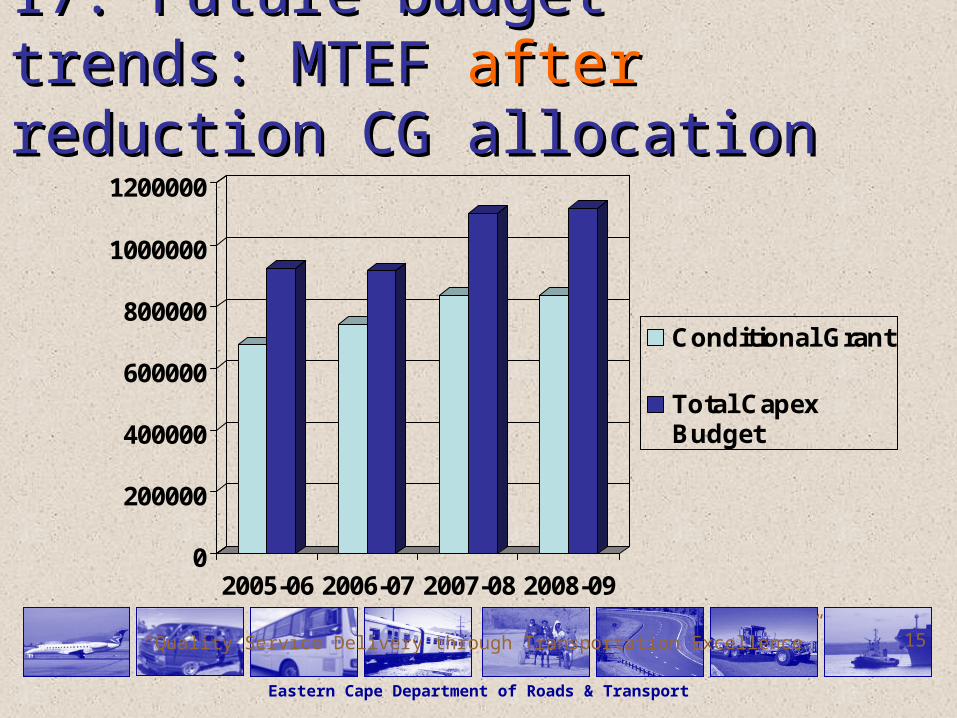
17. Future budget trends: MTEF 17. Future budget trends: MTEF afterafter reduction CG allocation reduction CG allocation
0
200000
400000
600000
800000
1000000
1200000
2005-06 2006-07 2007-08 2008-09
Conditional Grant
Total CapexBudget
“Quality Service Delivery through Transportation Excellence” 16
Eastern Cape Department of Roads & Transport
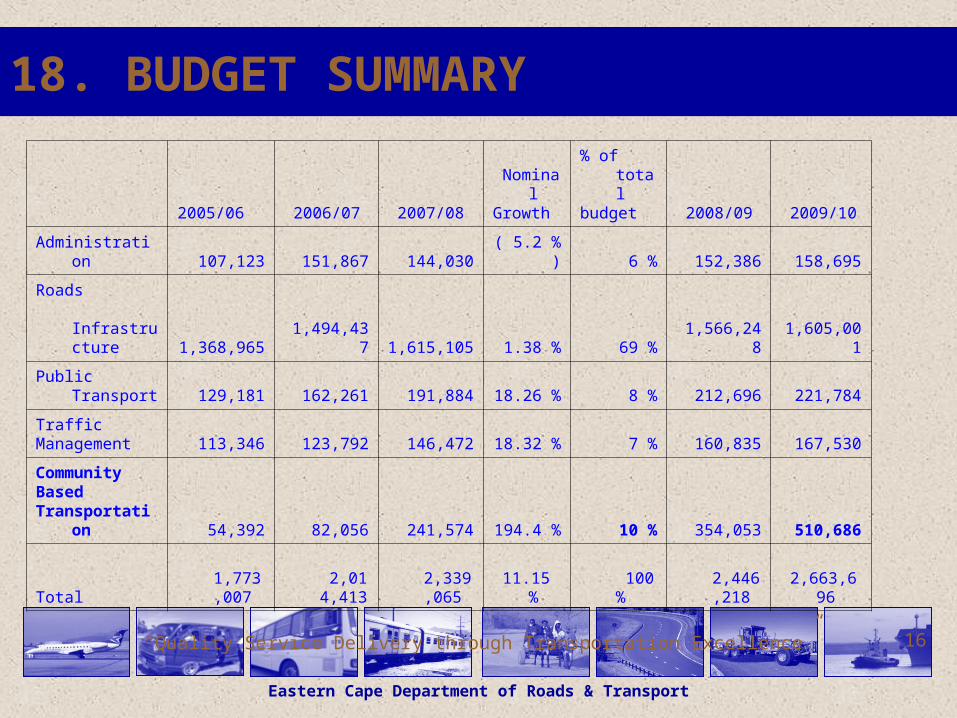
18. BUDGET SUMMARY
2005/06 2006/07 2007/08 Nominal Growth
% of total budget 2008/09 2009/10
Administration 107,123 151,867 144,030 ( 5.2 % ) 6 % 152,386 158,695
Roads Infrastructure 1,368,965 1,494,437 1,615,105 1.38 % 69 % 1,566,248 1,605,001
Public Transport 129,181 162,261 191,884 18.26 % 8 % 212,696 221,784
Traffic Management 113,346 123,792 146,472 18.32 % 7 % 160,835 167,530
CommunityBasedTransportation 54,392 82,056 241,574 194.4 % 10 % 354,053 510,686
Total 1,773,007 2,014,413 2,339,065 11.15 % 100 % 2,446,218 2,663,696
“Quality Service Delivery through Transportation Excellence” 17
Eastern Cape Department of Roads & Transport
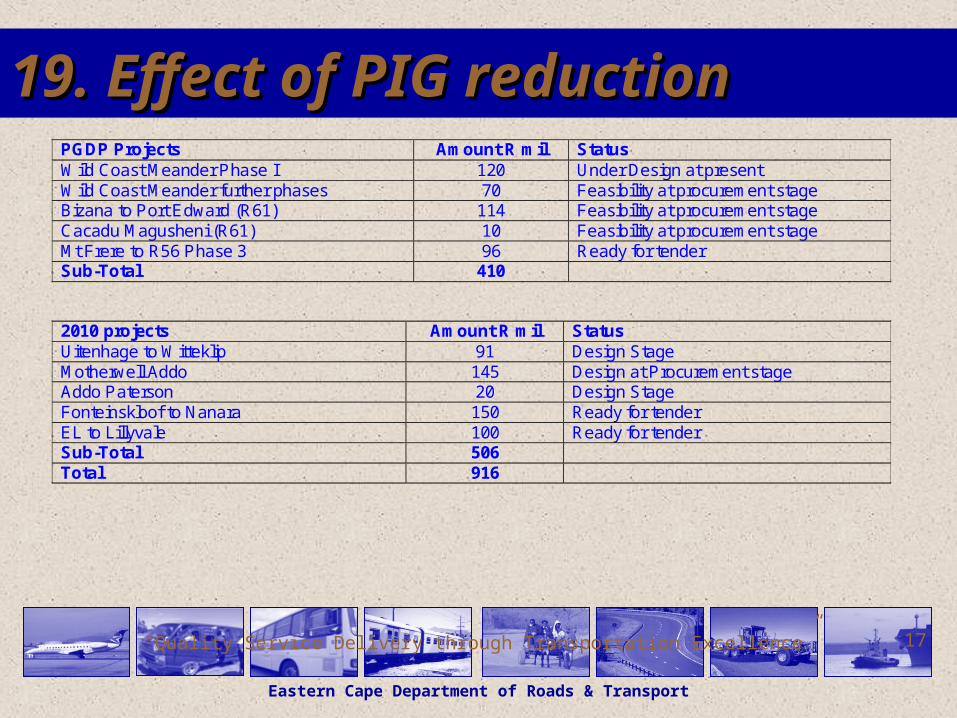
19. Effect of PIG reduction19. Effect of PIG reductionPGDP Projects Amount R mil Status Wild Coast Meander Phase I 120 Under Design at present Wild Coast Meander further phases 70 Feasibility at procurement stage Bizana to Port Edward (R61) 114 Feasibility at procurement stage Cacadu Magusheni (R61) 10 Feasibility at procurement stage Mt Frere to R56 Phase 3 96 Ready for tender Sub-Total 410 2010 projects Amount R mil Status Uitenhage to Witteklip 91 Design Stage Motherwell Addo 145 Design at Procurement stage Addo Paterson 20 Design Stage Fonteinskloof to Nanara 150 Ready for tender EL to Lillyvale 100 Ready for tender Sub-Total 506 Total 916
“Quality Service Delivery through Transportation Excellence” 18
Eastern Cape Department of Roads & Transport
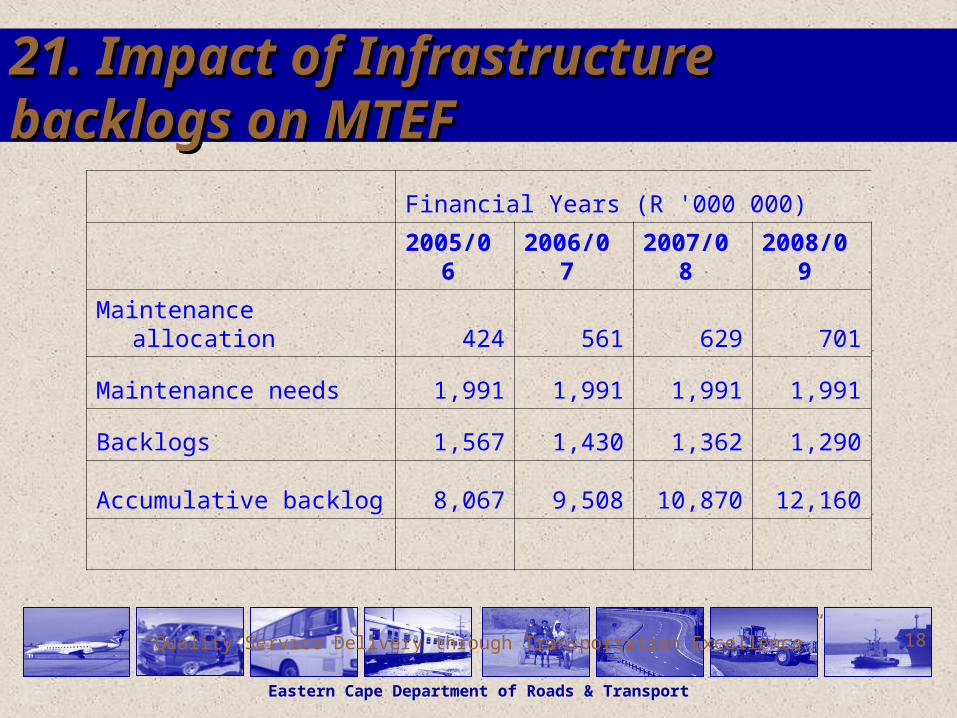
21. Impact of Infrastructure backlogs 21. Impact of Infrastructure backlogs on MTEFon MTEF
Financial Years (R '000 000)
2005/06 2006/07 2007/08 2008/09
Maintenance allocation 424 561 629 701
Maintenance needs 1,991 1,991 1,991 1,991
Backlogs 1,567 1,430 1,362 1,290
Accumulative backlog 8,067 9,508 10,870 12,160

“Quality Service Delivery through Transportation Excellence” 19
Eastern Cape Department of Roads & Transport
23. Estimated Cost of backlog23. Estimated Cost of backlogItem Rand x '000
Gravel roads to surfaced roads 4,479,000
Rehabilitation of surfaced roads 2,520,000
Bridges 89,500
Hospital accesses 1,251,350
Total Provincial backlog 8,339,850
Access roads 3,500,000
Total Backlog 11,839,850
“Quality Service Delivery through Transportation Excellence” 20
Eastern Cape Department of Roads & Transport
II
thank you…thank you…
Province of the
EASTERN CAPEDepartment of Roads & TransportQuality service delivery through transportation excellence