Embed Size (px)
Citation preview

Provider-Sponsored Health Plans for ACOsPhil Kamp, CEO
November 5, 2013
Change is Coming…Or is Here in Some CasesMassive Shift in Payment Models
Source: Oliver Wyman Source: L.E.K. interviews and the L.E.K. Strategic Hospital Priorities Study 2012
<100 100-299 300-499 >500
0
20
40
60
80
Likelihood of Hospitals Gaining Payer Capabilities in the Next 5 Years* (N=192)Percent of Respondents60
40
20
7 -
Very �likely
Mean
1 -
Not �likely at all
23456
Bed Count
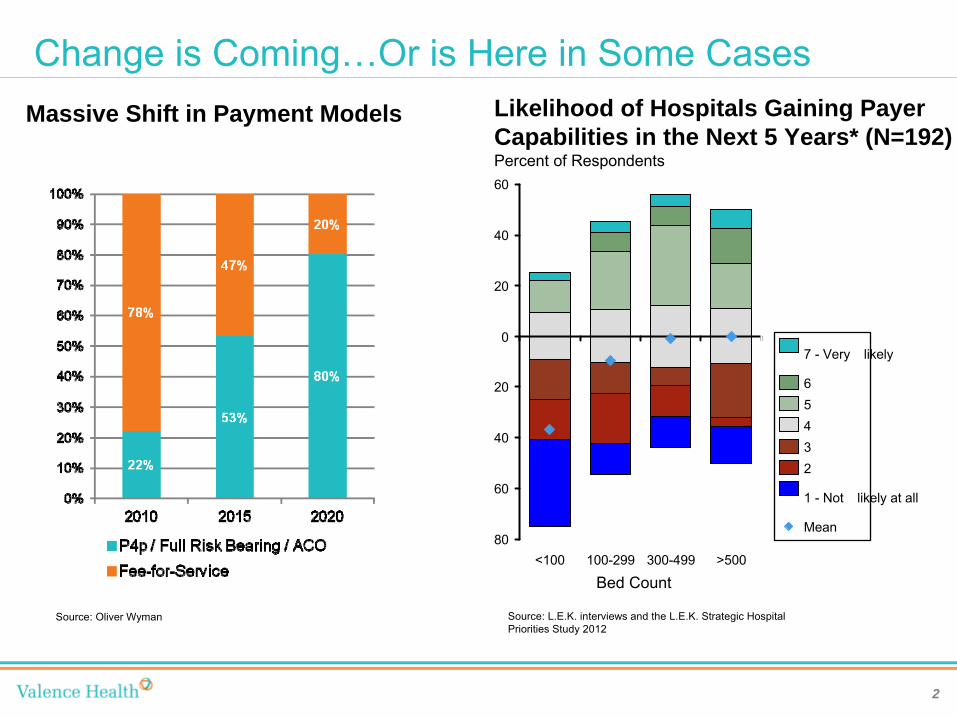
2
Provider-Sponsored Plans as part of the Value-Based Spectrum
= (Access + Quality = Outcomes )
Cost
Value-BasedCare
Financial Opportunity & Incentive Alignment
VALUE-BASED DELIVERY SPECTRUM
PROVIDER-
SPONSORED PLANS
CAPITATION
FULL RISKSHARED
RISKSHARED
SAVINGSBUNDLED
PAYMENTSCLINICAL
INTEGRATIONPCMHP4P
3
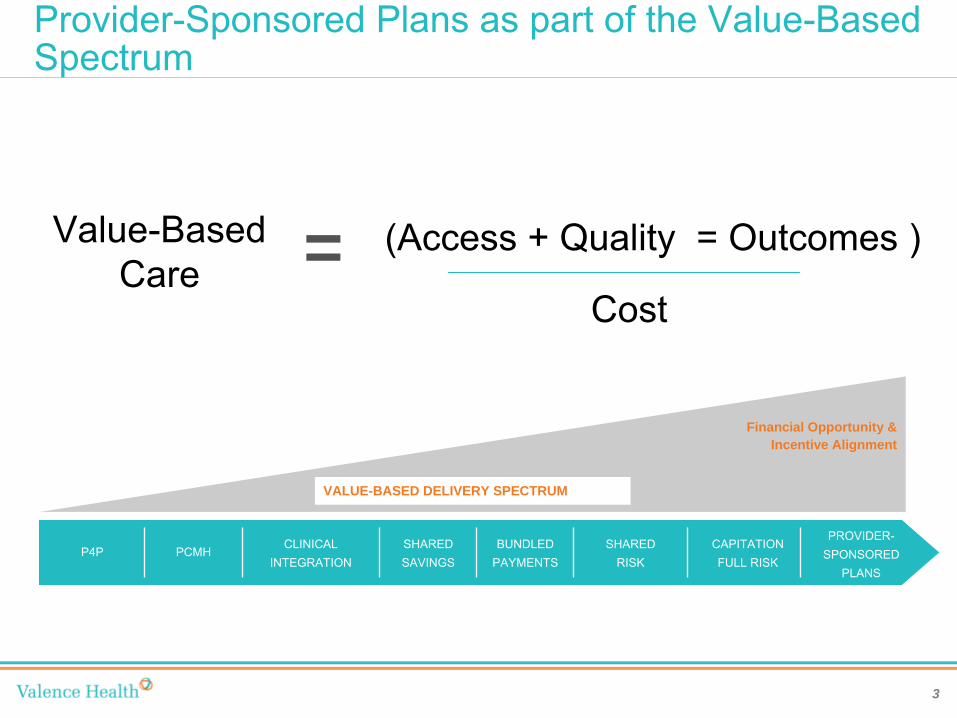
Plans Span the CountryLikely over 100 plans in operations today
4
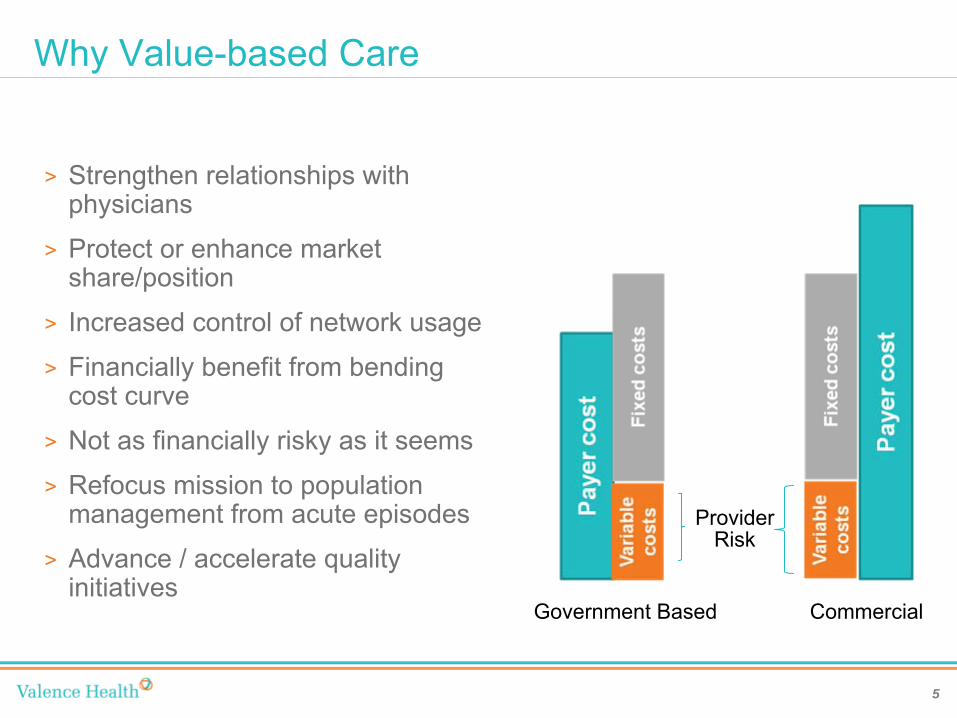
Why Value-based Care
>
Strengthen relationships with physicians
>
Protect or enhance market share/position
>
Increased control of network usage
>
Financially benefit from bending cost curve
>
Not as financially risky as it seems
>
Refocus mission to population management from acute episodes
>
Advance / accelerate quality initiatives
Government Based Commercial
Provider Risk
5
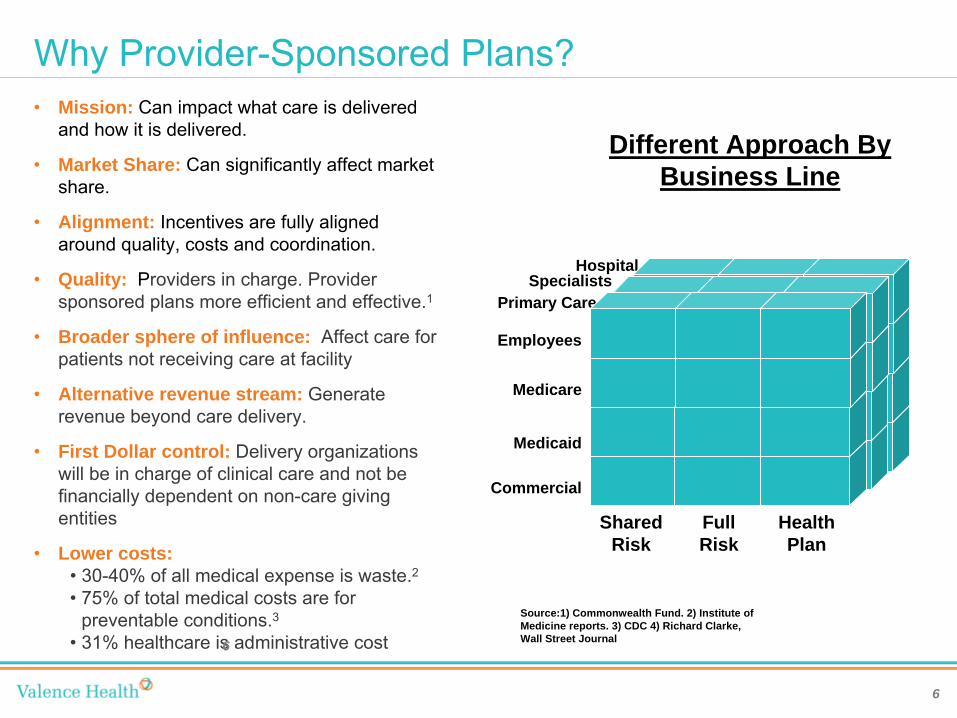
Why Provider-Sponsored Plans?•
Mission: Can impact what care is delivered and how it is delivered.
•
Market Share: Can significantly affect market share.
•
Alignment: Incentives are fully aligned around quality, costs and coordination.
•
Quality: Providers in charge. Provider sponsored plans more efficient and effective.1
•
Broader sphere of influence: Affect care for patients not receiving care at facility
•
Alternative revenue stream: Generate revenue beyond care delivery.
•
First Dollar control: Delivery organizations will be in charge of clinical care and not be financially dependent on non-care giving entities
•
Lower costs:•
30-40% of all medical expense is waste.2•
75% of total medical costs are for preventable conditions.3
•
31% healthcare is administrative cost
Source:1) Commonwealth Fund. 2) Institute of Medicine reports. 3) CDC 4) Richard Clarke, Wall Street Journal6
Different Approach By Business Line
HospitalSpecialists
Primary Care
Medicaid
Commercial
Medicare
Employees
Shared Risk
Full Risk
Health Plan
6
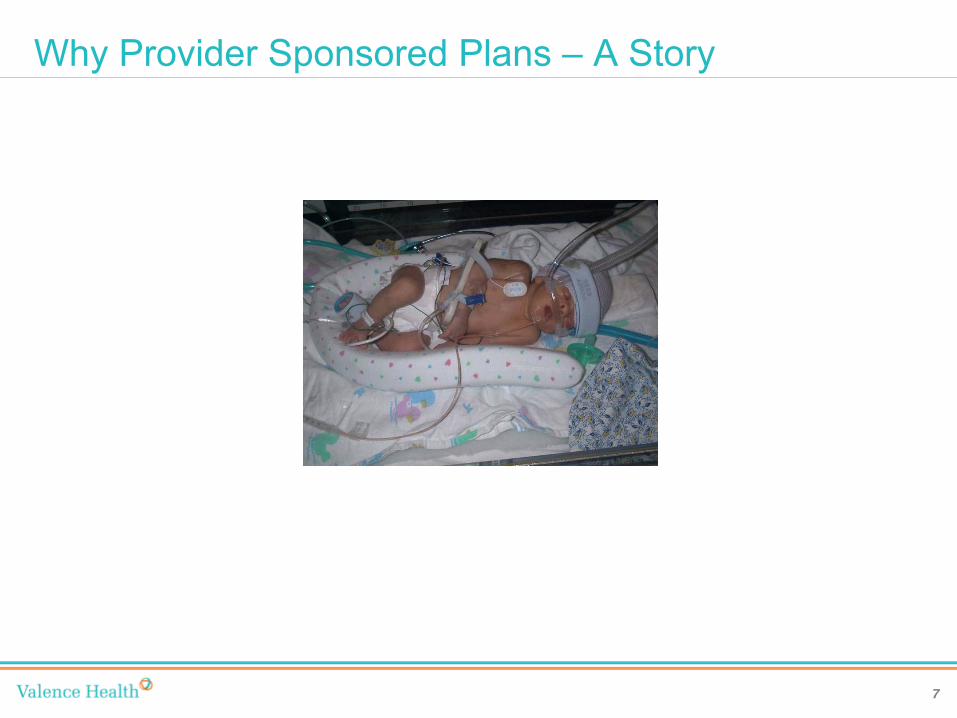
Why Provider Sponsored Plans –
A Story
7
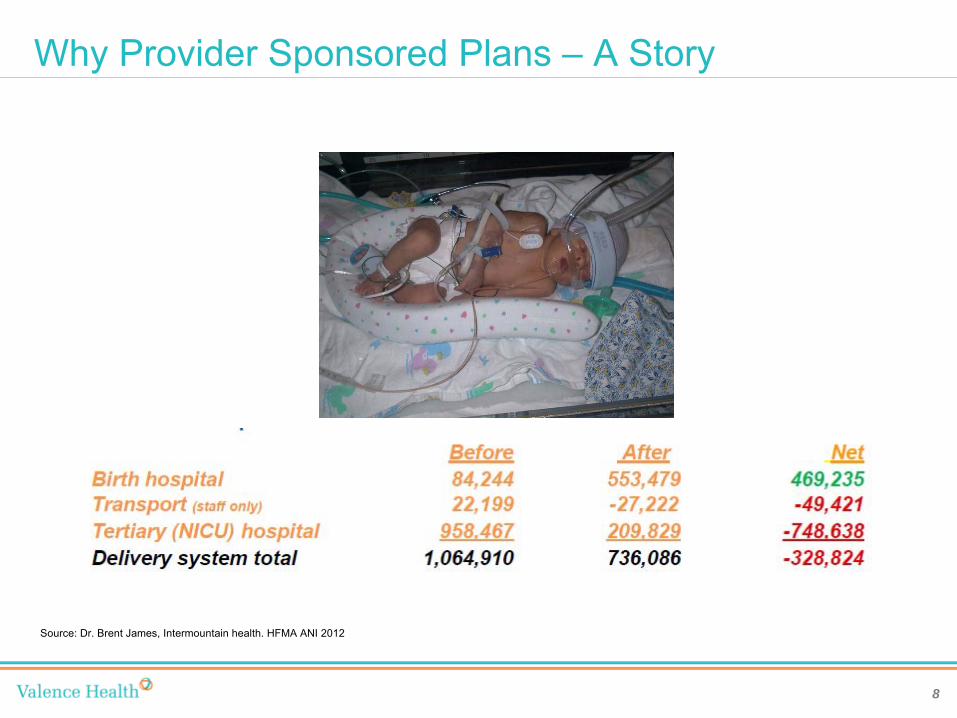
Why Provider Sponsored Plans –
A Story
Source: Dr. Brent James, Intermountain health. HFMA ANI 2012
8

Economic ExampleStartup
BuildRent and
Outsource
Implementation $500,000 $500,000 Claims Platform $15,000,000Staff ‐comp,
facility $3,500,000 $1,500,000
Legal/Consulting $1,000,000 $1,000,000
Other $500,000 $500,000 Outsourced
Partner $2,000,000
Total $20,500,000 $5,500,000
Risk Based
Capital $15,000,000 $15,000,000
Total $35,500,000 $20,500,000
Ongoing FinancialsBuild Rent and Outsource
PMPM Annual* PMPM Annual*Total
Premium
$150.00 $180,000,000 $150.00 $180,000,000
Medical
Costs
$132.00 $158,400,000 $132.00 $158,400,000
Ops $4.25 $5,100,000 $3.75 $4,500,000 Admin/
Med.
Mmgmt
$8.50 $10,200,000 $6.50 $7,800,000
Premium
Tax
$3.00 $3,600,000 $3.00 $3,600,000
Profit $2.25 $2,700,000 $2.25 $5,700,000
*Assumes 100,000 members
9
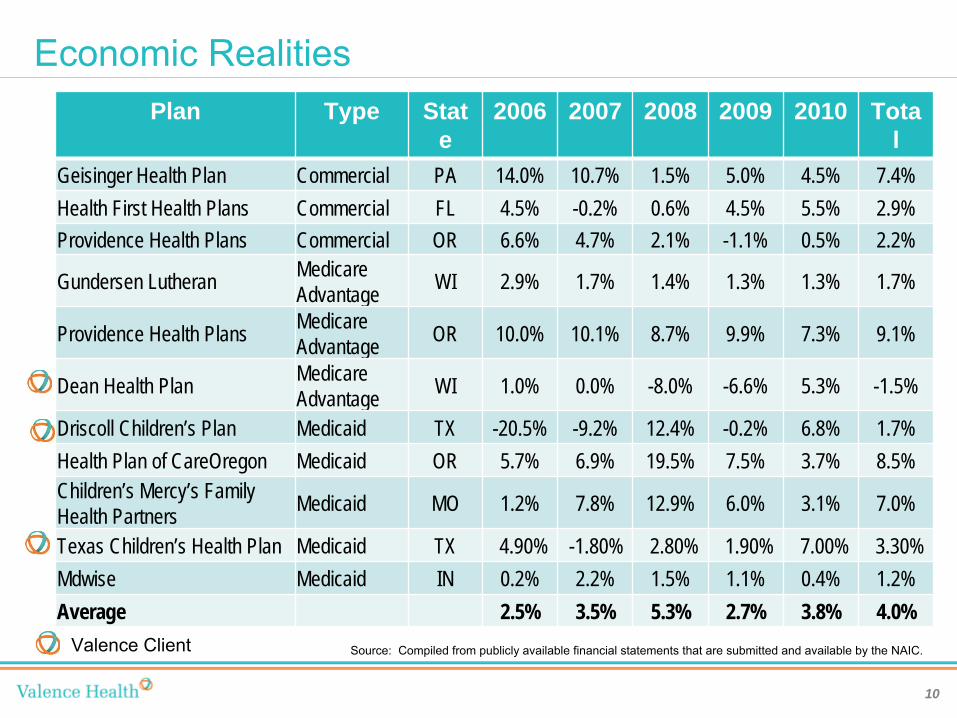
Economic RealitiesPlan Type Stat
e2006 2007 2008 2009 2010 Tota
lGeisinger Health Plan Commercial PA 14.0% 10.7% 1.5% 5.0% 4.5% 7.4%Health First Health Plans Commercial FL 4.5% -0.2% 0.6% 4.5% 5.5% 2.9%Providence Health Plans Commercial OR 6.6% 4.7% 2.1% -1.1% 0.5% 2.2%
Gundersen Lutheran Medicare Advantage WI 2.9% 1.7% 1.4% 1.3% 1.3% 1.7%
Providence Health Plans Medicare Advantage OR 10.0% 10.1% 8.7% 9.9% 7.3% 9.1%
Dean Health Plan Medicare Advantage WI 1.0% 0.0% -8.0% -6.6% 5.3% -1.5%
Driscoll Children’s Plan Medicaid TX -20.5% -9.2% 12.4% -0.2% 6.8% 1.7%Health Plan of CareOregon Medicaid OR 5.7% 6.9% 19.5% 7.5% 3.7% 8.5%Children’s Mercy’s Family Health Partners Medicaid MO 1.2% 7.8% 12.9% 6.0% 3.1% 7.0%
Texas Children’s Health Plan Medicaid TX 4.90% -1.80% 2.80% 1.90% 7.00% 3.30%Mdwise Medicaid IN 0.2% 2.2% 1.5% 1.1% 0.4% 1.2%Average 2.5% 3.5% 5.3% 2.7% 3.8% 4.0%
Valence Client Source: Compiled from publicly available financial statements that are submitted and available by the NAIC.
10
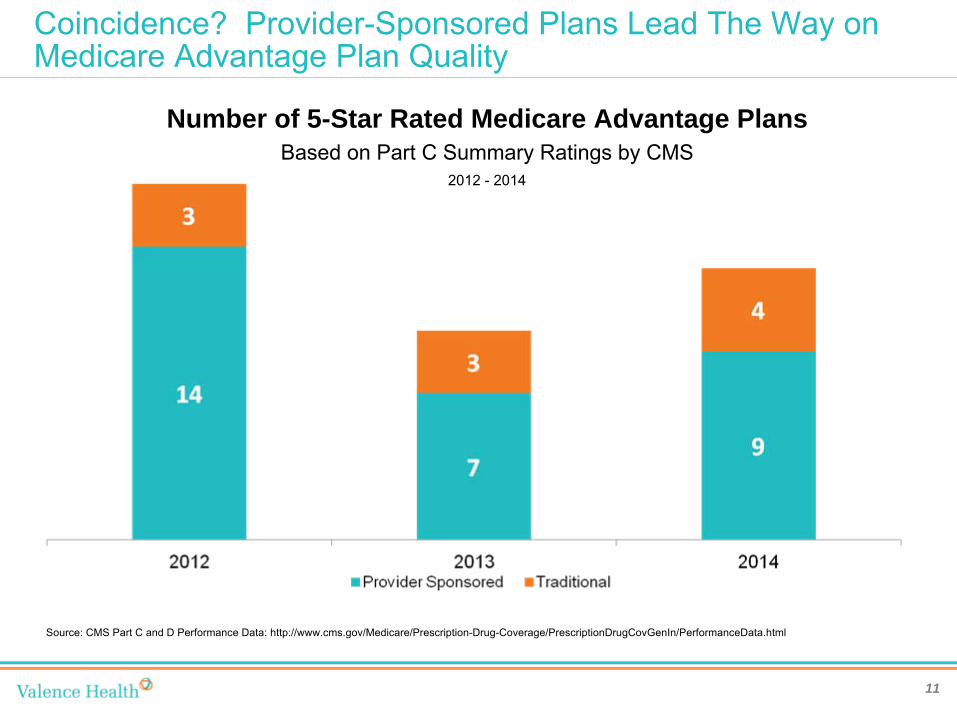
Coincidence? Provider-Sponsored Plans Lead The Way on Medicare Advantage Plan Quality
11
Number of 5-Star Rated Medicare Advantage PlansBased on Part C Summary Ratings by CMS
2012 -
2014
Source: CMS Part C and D Performance Data: http://www.cms.gov/Medicare/Prescription-Drug-Coverage/PrescriptionDrugCovGenIn/PerformanceData.html

Haven’t we seen this movie before
>
First round in 1980s and 1990s
>
Some successes, but many failures
>
Challenges•
Lack of expertise•
“Wrong”
people in charge•
Bad deals from the outset•
Lack of data
12
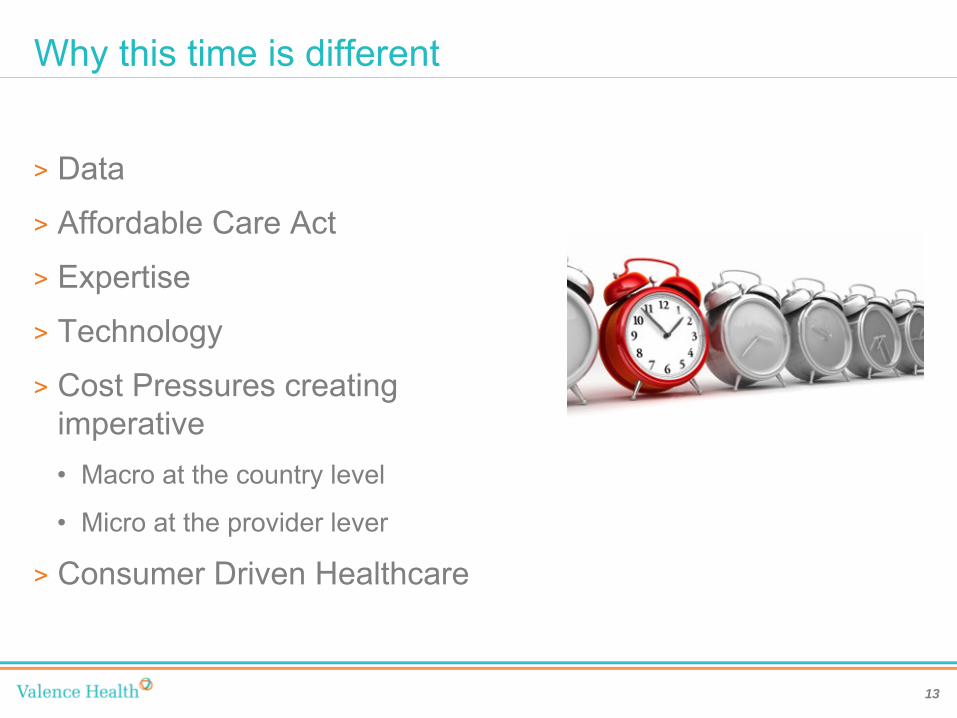
Why this time is different
>
Data
>
Affordable Care Act
>
Expertise
>
Technology
>
Cost Pressures creating imperative•
Macro at the country level
•
Micro at the provider lever
>
Consumer Driven Healthcare
13

Making the Decision
>
Mission and Goals
>
Risk Tolerance
>
Market Position
>
Balance Sheet Impact
>
Brand identification
>
Payer pitfalls
14
Required capabilities
•
Customer Service•
Invoice Management –
Group/Broker
•
Utilization Management –
moderate pre-cert program•
Case & Disease Management –
Complex Case Management
•
Claims Management –
adjudication, audit, recovery, mail•
Eligibility Management
•
Data Integration –
Trading partners•
Finance and Accounting
•
Analytics and Reporting•
Provider Relations and Network Management
•
Compliance•
Marketing
•
Community Relations•
Quality Management
15
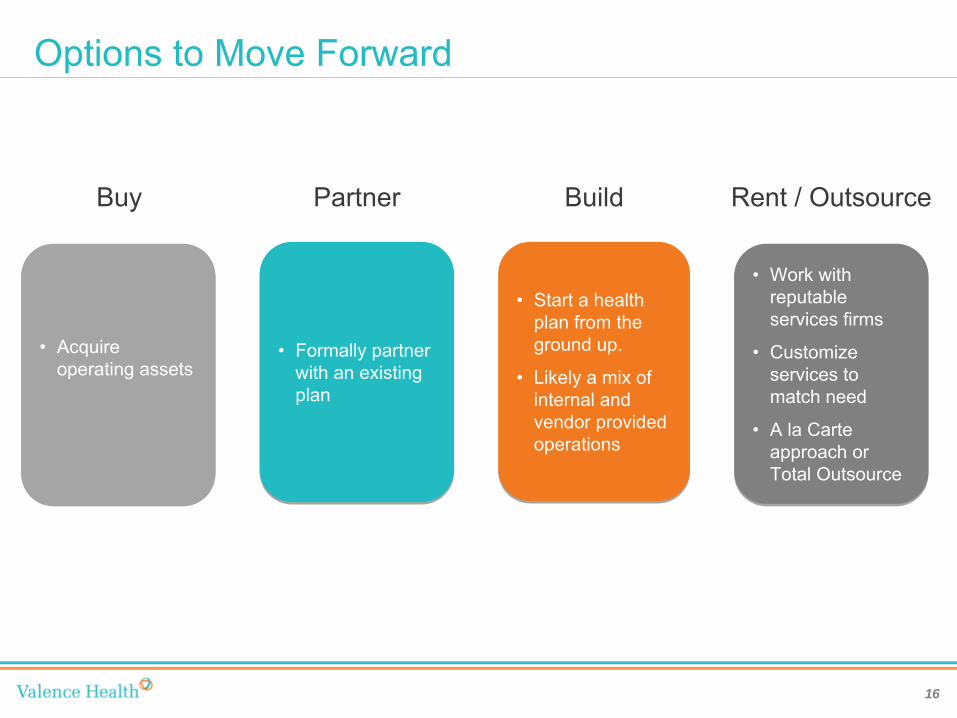
Options to Move Forward
•
Start a health plan from the ground up.
•
Likely a mix of internal and vendor provided operations
•
Start a health plan from the ground up.
•
Likely a mix of internal and vendor provided operations
Build
•
Formally partner with an existing plan
•
Formally partner with an existing plan
Partner
•
Acquire operating assets
•
Acquire operating assets
Buy
•
Work with reputable services firms
• Customize
services to match need
• A la Carte
approach or Total Outsource
•
Work with reputable services firms
•
Customize services to match need
•
A la Carte approach or Total Outsource
Rent / Outsource
16
Tactical Steps to Provider-Sponsored Plans
1.
Develop Risk-based strategy2.
New Organization Formation3.
Network Development4.
Licensure5.
Build/Buy/Rent/Outsource Operations6.
Implementation1.
Provider Relations/Network Development2.
Plan Design3.
Marketing/Sales Plan4.
Care Management5.
Operations6.
Financial Planning and Reporting7.
Technology Systems7.
Operate
17

Assessment and Business Case
Options
Full Risk
Shared Risk
Provider- Sponsored
Plan
Shared Savings
P4P
MDs in leadership;
Strong PCPs
Physician Alignment
Emerging PCP alignment; No
PHO
Little PCP connection
Strong executive alignment
Organizatio
n & Leadership
Consensu
s-based leadership
Divided leadership
Dominant market leader
Market Position
Market leaders, but competition
Not market leader
Dominant payers in
risk contracting
Payor Readiness
Payers with limited risk contracting experience
Adversarial relationships
Owned and tightly
contracted SNFs
Care Continuum
Loose affiliations with
SNF,LTC,HC
No management or
ownership
Current experience
in risk managemen
t
Expertise
Past experience
in risk
Little or no risk
experience
All on common platform
Health IT
Most on EMR, limited connectivity
Limited EMR, no
connectivity
Strong balance
sheet, growing revenue
Financial Position
Strong balance
sheet; flat revenue
Weak balance sheet;
shrinking revenue
18
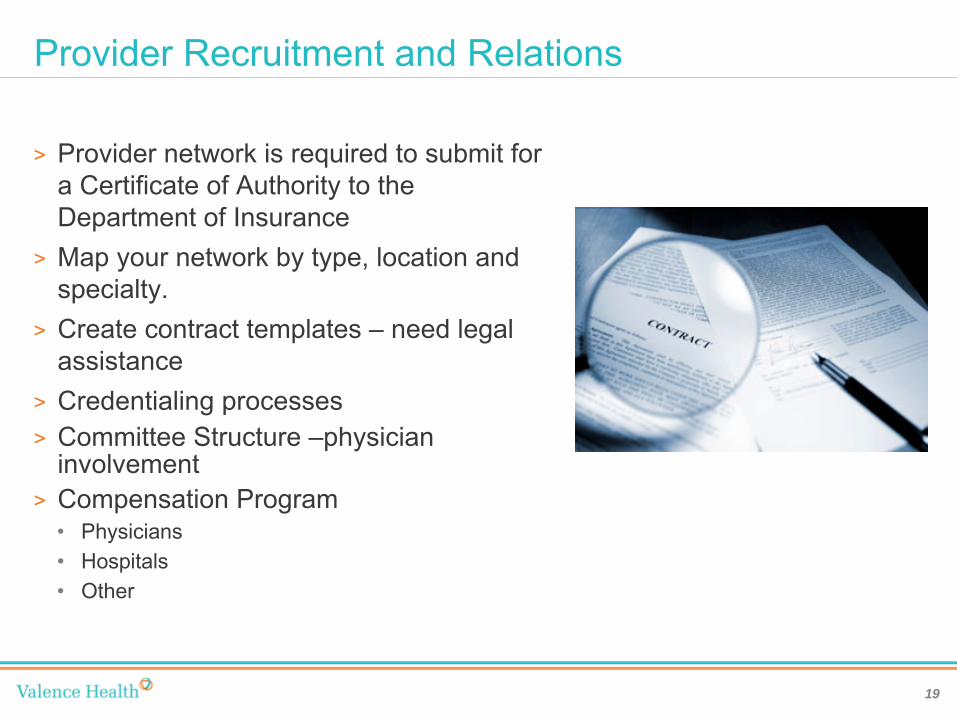
Provider Recruitment and Relations
>
Provider network is required to submit for a Certificate of Authority to the Department of Insurance
>
Map your network by type, location and specialty.
>
Create contract templates –
need legal assistance
>
Credentialing processes>
Committee Structure –physician involvement
>
Compensation Program •
Physicians•
Hospitals•
Other
19
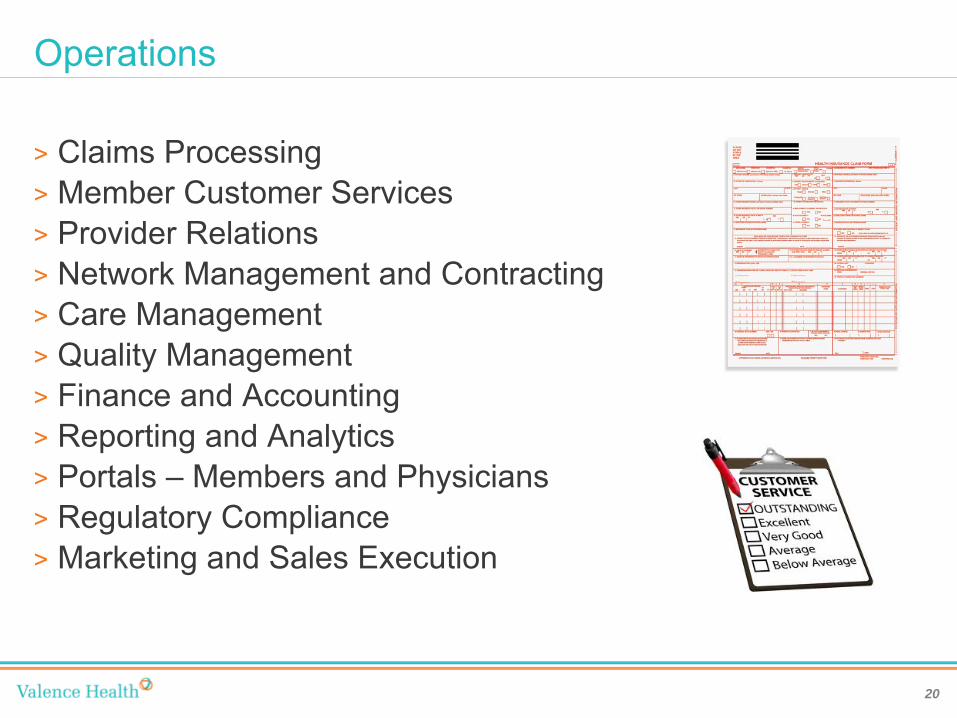
Operations
>
Claims Processing>
Member Customer Services>
Provider Relations>
Network Management and Contracting>
Care Management>
Quality Management>
Finance and Accounting>
Reporting and Analytics>
Portals –
Members and Physicians>
Regulatory Compliance>
Marketing and Sales Execution
20
Some examples
21
>
Scott and White –
Medicaid
>
Alliant Health Plans –
Commercial
>
Dean Health Plan –
Medicare Advantage
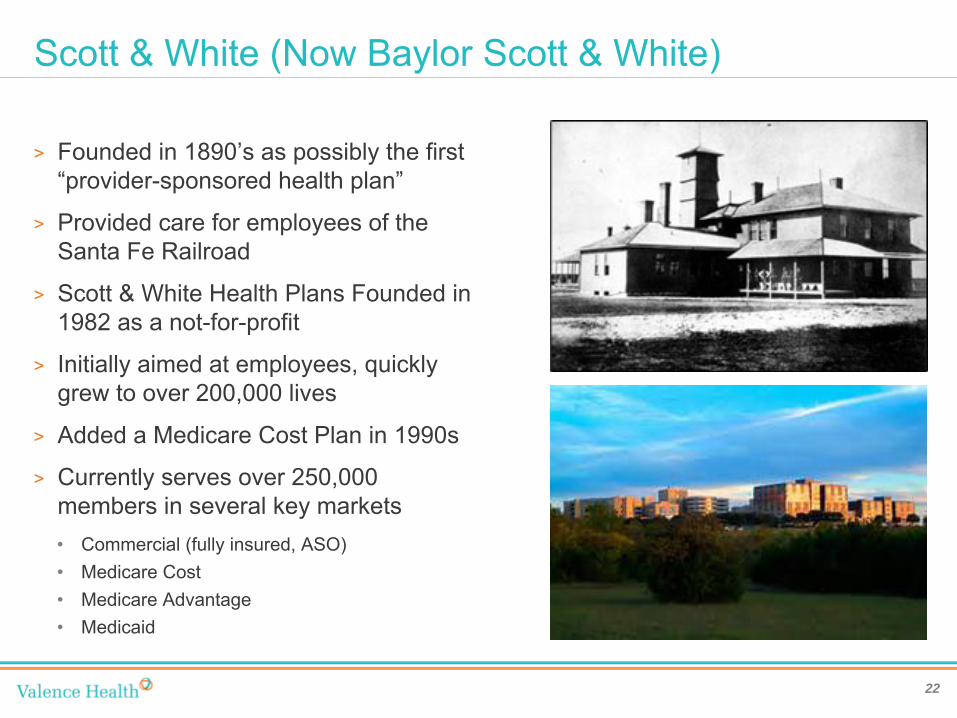
Scott & White (Now Baylor Scott & White)
22
>
Founded in 1890’s as possibly the first “provider-sponsored health plan”
>
Provided care for employees of the Santa Fe Railroad
>
Scott & White Health Plans Founded in 1982 as a not-for-profit
>
Initially aimed at employees, quickly grew to over 200,000 lives
>
Added a Medicare Cost Plan in 1990s
>
Currently serves over 250,000 members in several key markets•
Commercial (fully insured, ASO)•
Medicare Cost•
Medicare Advantage•
Medicaid
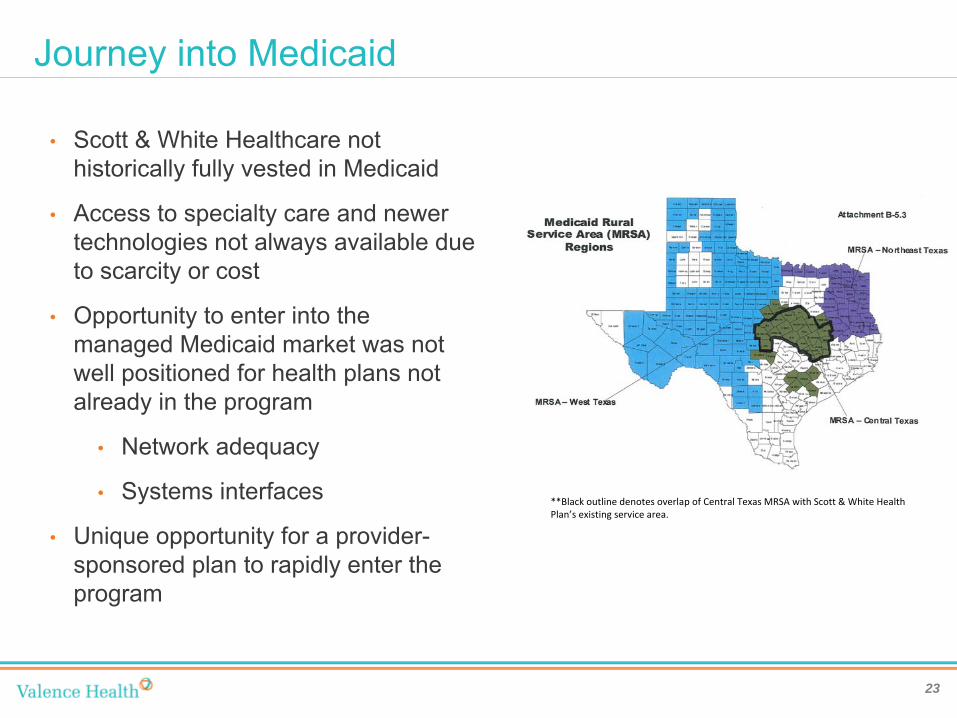
Journey into Medicaid
23
•
Scott & White Healthcare not historically fully vested in Medicaid
•
Access to specialty care and newer technologies not always available due to scarcity or cost
•
Opportunity to enter into the managed Medicaid market was not well positioned for health plans not already in the program
•
Network adequacy
•
Systems interfaces
•
Unique opportunity for a provider-
sponsored plan to rapidly enter the program
**Black outline denotes overlap of Central Texas MRSA with Scott
& White Health
Plan’s existing service area.
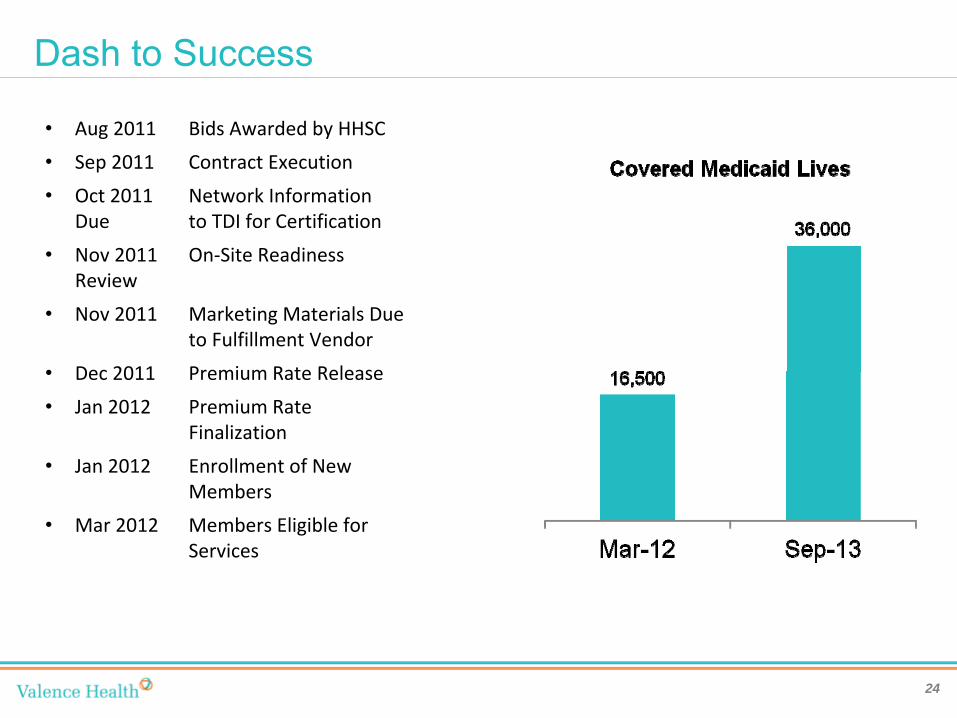
Dash to Success
24
•
Aug 2011
Bids Awarded by HHSC
•
Sep 2011
Contract Execution
•
Oct 2011
Network Information
Due
to TDI for Certification
•
Nov 2011
On‐Site Readiness
Review
•
Nov 2011
Marketing Materials Due
to Fulfillment Vendor
•
Dec 2011
Premium Rate Release
•
Jan 2012
Premium Rate
Finalization
•
Jan 2012
Enrollment of New
Members
•
Mar 2012
Members Eligible for
Services
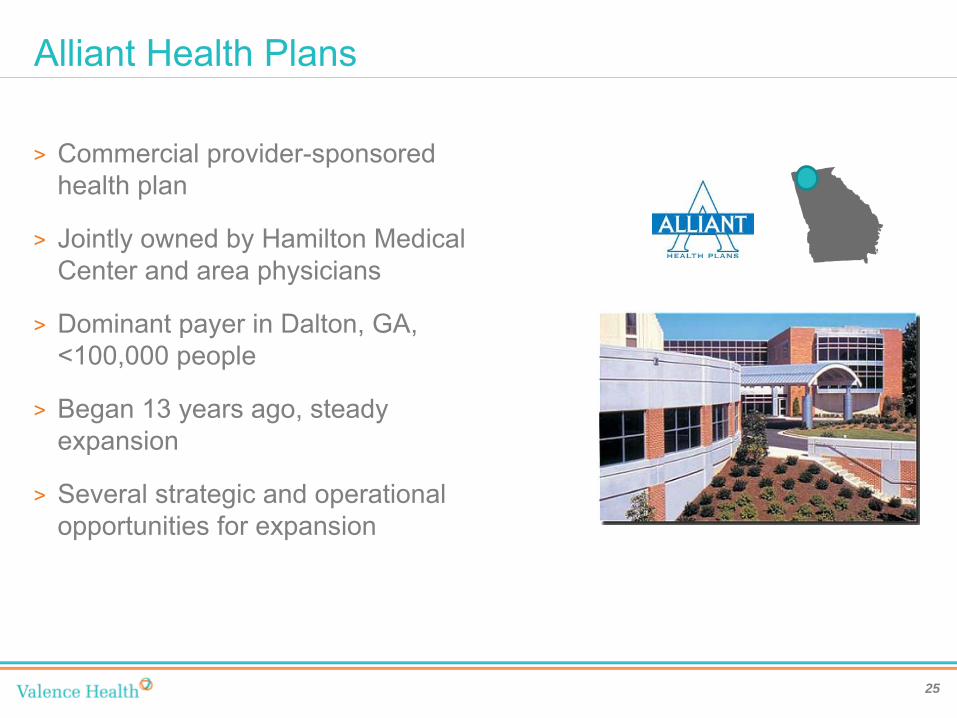
Alliant Health Plans
25
>
Commercial provider-sponsored health plan
>
Jointly owned by Hamilton Medical Center and area physicians
>
Dominant payer in Dalton, GA, <100,000 people
>
Began 13 years ago, steady expansion
>
Several strategic and operational opportunities for expansion
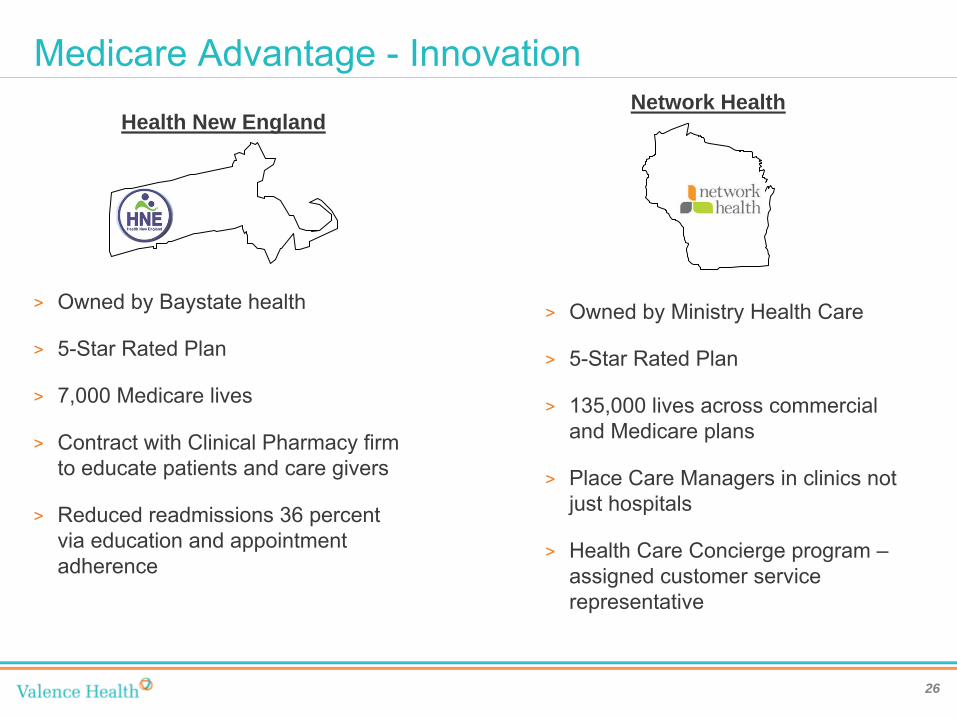
Medicare Advantage -
Innovation
26
Health New EnglandNetwork Health
>
Owned by Baystate health
>
5-Star Rated Plan
>
7,000 Medicare lives
>
Contract with Clinical Pharmacy firm to educate patients and care givers
>
Reduced readmissions 36 percent via education and appointment adherence
>
Owned by Ministry Health Care
>
5-Star Rated Plan
>
135,000 lives across commercial and Medicare plans
>
Place Care Managers in clinics not just hospitals
>
Health Care Concierge program –
assigned customer service representative
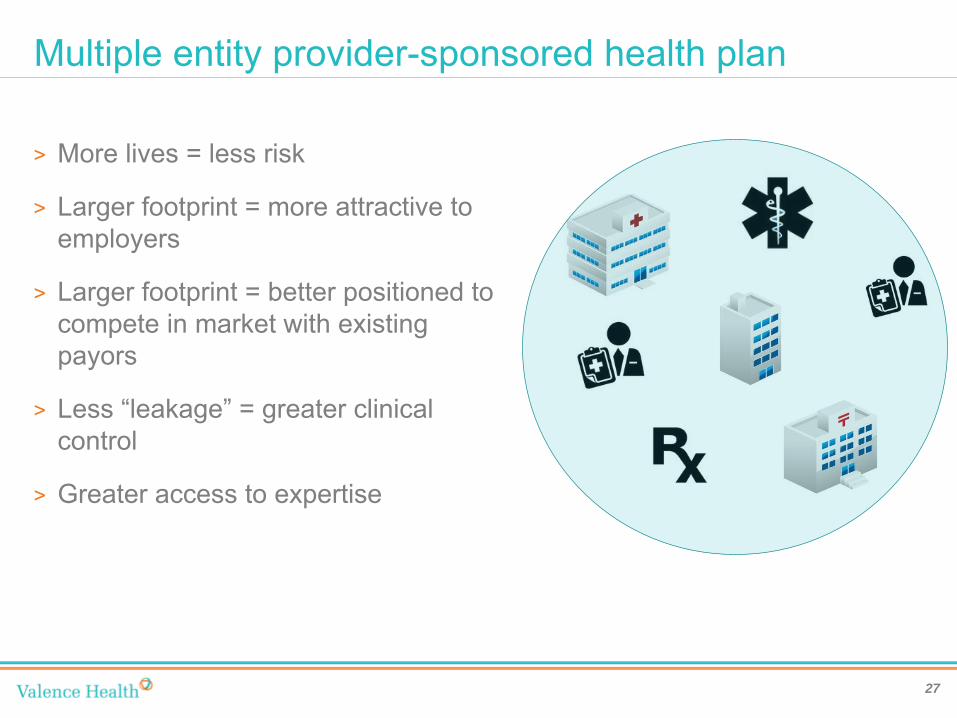
Multiple entity provider-sponsored health plan
27
>
More lives = less risk
>
Larger footprint = more attractive to employers
>
Larger footprint = better positioned to compete in market with existing payors
>
Less “leakage”
= greater clinical control
>
Greater access to expertise

Summary
>
Risk is coming, decide what form and when
>
No provider-sponsored plan is cookie cutter, but parts of other’s experiences can be reused
>
Get the strategy, mission, objectives and governance right
>
Know the market and the providers in the market
>
Don’t be afraid to outsource, but maintain control over your core functions of network, quality and branding
>
There’s no time like the present
28
Questions
?
>
Phil Kamp, CEO, Valence Health•
www.valencehealth.com
>
www.providersponsoredplans.com
>
http://www.commonwealthfund.org/News/News- Releases/2011/Jun/Medicaid-Managed-Care-Plans.aspx
>
http://www.sherlockco.com/


![Acos postcard[final]](https://img.pdfslide.us/doc/110x75/568c55701a28ab4916c2c624/acos-postcardfinal.jpg)