Embed Size (px)
Citation preview
Provider Retention and Turnover in the In-Home Supportive Services Program:
Statistical and Geo-Spatial Analyses
Fei Wu, Ph.D., Lead Analyst
Chief Executive Office Service Integration Branch
Research and Evaluation Services
March 2016 (Revised)
Submitted to: County of Los Angeles, Department of Public Social Services
Project Officer: Michael Bono, Ph.D.
i
Overview
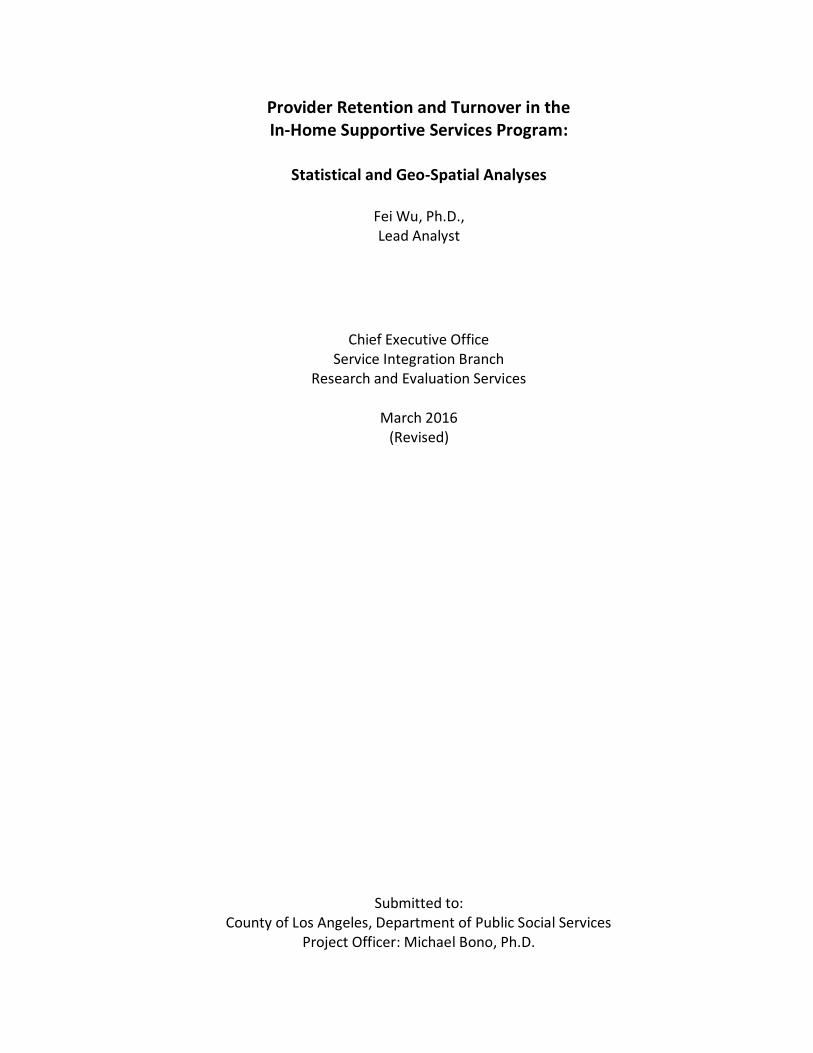
This report examines provider-recipient relationships in the In-Home Supportive Services program (IHSS). In Los Angeles County, IHSS is administered by the Department of Public Social Services (DPSS). The program uses County, State and Federal resources to help low-income seniors and persons with functional disabilities live safely in their homes with the assistance of providers who contract individually with recipients. IHSS is considered an alternative to out-of-home care, such as nursing homes or board and care facilities. DPSS commissioned this report as part of the department’s Fiscal Year 2015-16 research in response to concerns about provider turnover in IHSS and its potential effects on the quality and continuity of the services the program makes available.
The Duration of Provider-Recipient Relationships and the Likelihood of Termination The findings reported here are based on statistical and geo-spatial analyses of administrative records from California’s CMIPS and CMIPS II databases. These data show that IHSS provided services to a cumulative annual total of roughly 200,000 recipients in 2013 and 2014. Active provider-recipient relationships at the start of this period had an average duration of about 14 months and a 1 in 5 likelihood of terminating over the course of 12 months. From a different perspective, roughly half the provider-recipient pairings in the IHSS system at any point in time during 16 months of observation period were relationships terminated for reasons other than a change in the recipient’s eligibility status.
Explaining Turnover and Retention Provider turnover in IHSS is in large part a consequence of the manner in which services are procured through the program, where recipients hire their own providers and can end their relationships with these workers at any time they wish, and where providers working on a freelance basis can likewise terminate their relationships with recipients for any reason. However, the program allows recipients to hire family members as their providers, and roughly two-thirds of the providers observed over the 16-month period of observation were related to their recipients by family. Provider-recipient relationships between family members are three times as likely to endure when compared to relationships in which providers are professional caregivers or otherwise acquainted with their recipients. Statistical analyses of IHSS data for this study produced the following additional findings:
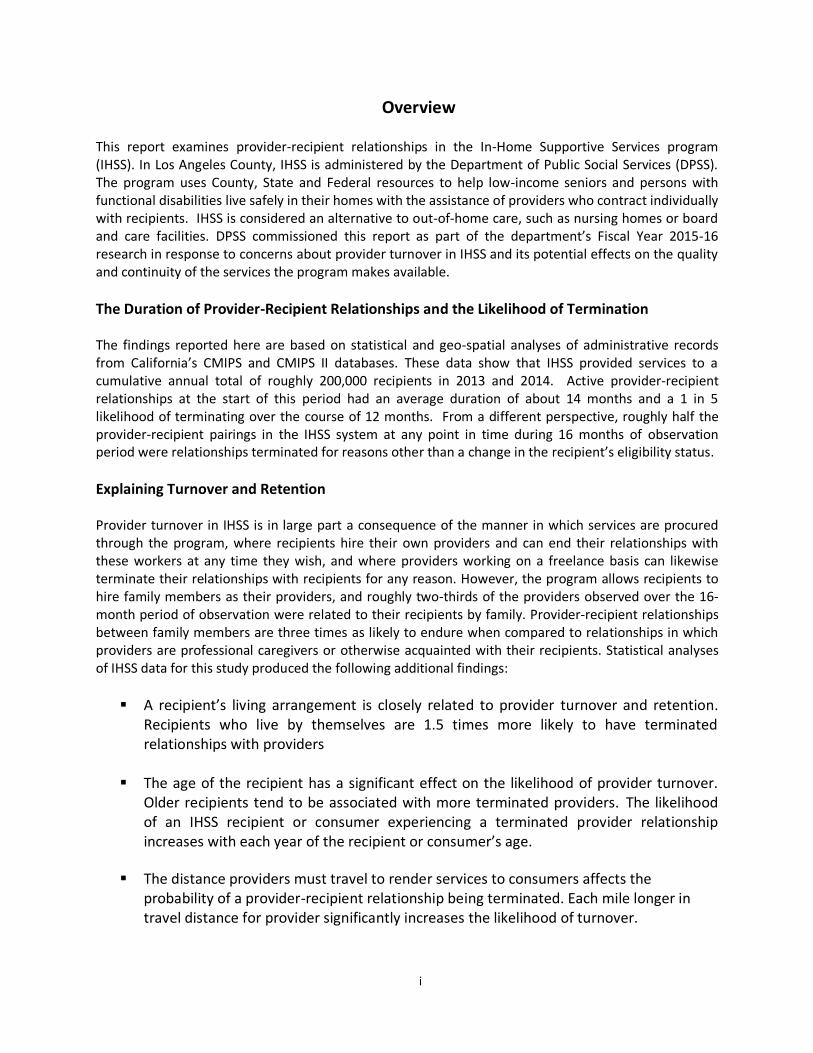
A recipient’s living arrangement is closely related to provider turnover and retention. Recipients who live by themselves are 1.5 times more likely to have terminated relationships with providers
The age of the recipient has a significant effect on the likelihood of provider turnover. Older recipients tend to be associated with more terminated providers. The likelihood of an IHSS recipient or consumer experiencing a terminated provider relationship increases with each year of the recipient or consumer’s age.
The distance providers must travel to render services to consumers affects the probability of a provider-recipient relationship being terminated. Each mile longer in travel distance for provider significantly increases the likelihood of turnover.
ii
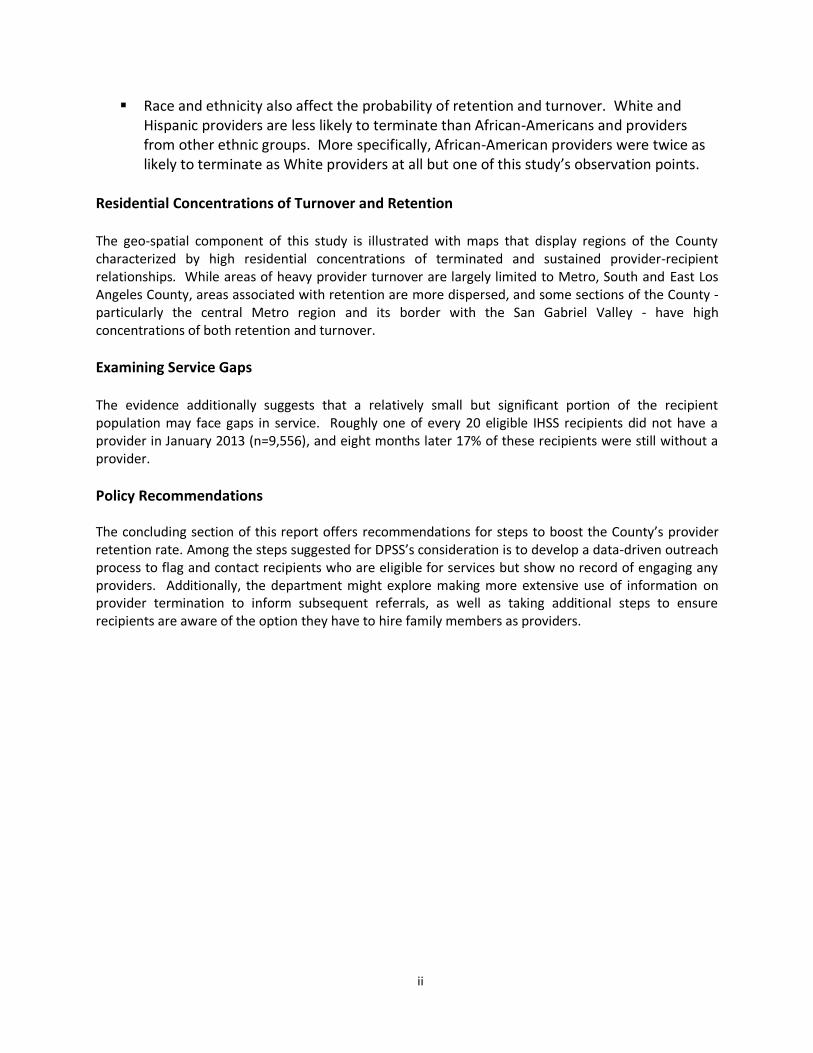
Race and ethnicity also affect the probability of retention and turnover. White and Hispanic providers are less likely to terminate than African-Americans and providers from other ethnic groups. More specifically, African-American providers were twice as likely to terminate as White providers at all but one of this study’s observation points.
Residential Concentrations of Turnover and Retention
The geo-spatial component of this study is illustrated with maps that display regions of the County characterized by high residential concentrations of terminated and sustained provider-recipient relationships. While areas of heavy provider turnover are largely limited to Metro, South and East Los Angeles County, areas associated with retention are more dispersed, and some sections of the County - particularly the central Metro region and its border with the San Gabriel Valley - have high concentrations of both retention and turnover.
Examining Service Gaps The evidence additionally suggests that a relatively small but significant portion of the recipient population may face gaps in service. Roughly one of every 20 eligible IHSS recipients did not have a provider in January 2013 (n=9,556), and eight months later 17% of these recipients were still without a provider.
Policy Recommendations The concluding section of this report offers recommendations for steps to boost the County’s provider retention rate. Among the steps suggested for DPSS’s consideration is to develop a data-driven outreach process to flag and contact recipients who are eligible for services but show no record of engaging any providers. Additionally, the department might explore making more extensive use of information on provider termination to inform subsequent referrals, as well as taking additional steps to ensure recipients are aware of the option they have to hire family members as providers.
iii
Table of Contents
Overview................................................................................................................................................ i Table of Contents ................................................................................................................................. iii
I. Background ................................................................................................................................... 1
Understanding Provider Retention and Turnover ........................................................................... 1 II. Study Period, Data and Sampling ................................................................................................... 2 Comparing Provider and Recipient Counts in CMIPS and CMIPS II ................................................... 2 CMIPS and CMIPS II Compared to DPSS Statistical Reports ............................................................. 3
Sample Size.................................................................................................................................... 3 III. The Basic Demographics of IHSS Providers and Recipients ............................................................ 3 IV. Measuring Provider Turnover over 16 Months .............................................................................. 6
Tracking a Cohort of IHSS Recipients ............................................................................................... 6 Point-in-Time Analysis of Provider-Recipient Relationships ............................................................. 8 Reconciling the Two Perspectives on Provider Terminations ......................................................... 10
V. Service Gaps and Attrition ........................................................................................................... 11 Tracking a Cohort of Eligible Recipients who were without Providers over Eight Months .............. 11 Expanding the Cohort Analysis...................................................................................................... 12 Summarizing the Cohort Analysis ................................................................................................. 13 VI. Geo-Spatial Analysis: Mapping Recipients, Providers, Turnover and Retention ......................... 14
Where Recipients and Providers Reside ........................................................................................ 14 Regions of the County with High Concentrations of Provider Retention and Turnover .................. 17
VII. Statistical Explanations for Provider Retention and Turnover ..................................................... 20 Summary of Statistical Analyses ................................................................................................... 23 A Note on the Observed Effects of Language ................................................................................ 24
VIII. Recommendations ....................................................................................................................... 25
Appendices ......................................................................................................................................... 28 Appendix A: Two Separate Counts of Active IHSS Recipients in Each Month of the Study Period .. 29 Appendix B: Power Analysis and Sample Sizes ............................................................................. 30
Appendix C: Structural Changes in CMIPS II and their Implications for this Report ....................... 33 Appendix D: Validating Representative Samples of Providers and Recipients .............................. 34 Appendix E: The Composition of the 2013 Provider-Recipient Cohort ......................................... 36 Appendix F: Turnover Rates for the Full Universe of Providers within the Study Period ............... 38 Appendix G: Results of Bivariate Significance Tests at Five Observation Points............................ 39 Appendix H: Technical Documentation for General Estimating Equations Model ......................... 45
Endnotes ............................................................................................................................................. 51
iv
List of Tables Table 1. Unique IHSS Providers and Recipients at Five Observation Points ............................................ 2 Table 2. Demographic Composition of Active IHSS Providers at Five Observation Points........................ 4
Table 3. Demographic Composition of Active IHSS Recipients at Five Observation Points ...................... 5 Table 4. Cohort Analysis of Monthly Provider Terminations Over 16 Months ........................................ 7 Table 5. Provider Terminations at Five Observation Points .................................................................... 9 Table 6. Cohort Analysis of Eligible IHSS Recipients with No Service Provider in of January 2013 ......... 11 Table 7. Addition and Attrition of Providers among IHSS Recipients in January 2013 ........................... 12 Table 8. Explaining IHSS Provider Turnover in Los Angeles County ....................................................... 21
Table A1. A Comparison of Monthly Active IHSS Recipient Counts from Two Sources........................... 29 Table D1. Comparison of the Sampled of Provider-Recipient Relationships against Base IHSS Files....... 34 Table E1. Demographics of Providers and Recipients in the January 2013 Cohort ................................. 36 Table F1. Provider Turnover Rates at Five Observation Points .............................................................. 38 Table G1. Results of Bivariate Significance Tests: IHSS Provider Turnover at Five Observation Points .. 39 Table G2. Significance Tests at Observation Point 1: Provider Terminations, January 2013 ................... 40 Table G3. Significance Tests at Observation Point 2: Provider Terminations, April 2013 ....................... 41 Table G4. Significance Tests at Observation Point 3: Provider Terminations, August 2013 .................... 42 Table G5. Significance Tests at Observation Point 4: Provider Terminations, January 2014 ................... 43 Table G6. Significance Tests at Observation Point 5: Provider Terminations, April 2014 ....................... 44 Table H1. Generalized Estimating Equations Model: Predicting Provider Termination, January 2013 .... 46 Table H2. Generalized Estimating Equations Model: Predicting Provider Termination, April 2013 ........ 47 Table H3. Generalized Estimating Equations Model: Predicting Provider Termination, August 2013 ..... 48 Table H4. Generalized Estimating Equations Model: Predicting Provider Termination, January 2014 .... 49 Table H5. Generalized Estimating Equations Model: Predicting Provider Termination, January 2014 .... 50
List of Figures
Figure 1. IHSS Recipients in Los Angeles County: Residential Hot Spots, April 2014 .............................. 15 Figure 2. IHSS Providers in Los Angeles County: Residential Hot Spots, April 2014 ............................... 16 Figure 3. Recipient Residence and Provider Retention, January 2013 to April 2014 (Aggregated) ......... 18 Figure 4. Recipient Residence and Provider Turnover, January 2013 to April 2014 (Aggregated)........... 19 Figure 5. Survival Estimates by Relationship between Provider and Recipient ...................................... 23 Figure 6. Survival Estimates by the Residential Proximity of Provider and Recipient ............................. 24
1
I. Background
The “In-Home Supportive Services (IHSS) Program is centrally administered by the State of California and utilizes a combination of Federal, State and County resources to provide low-income elderly, blind or disabled individuals (including children who qualify) with the services of in-home providers who assist with housework, meal preparation, and personal care. IHSS enables recipients of these services to live safely in their homes and offers an alternative to residential care facilities and institutions. The program’s recipients are effectively consumers insofar as they select and hire their own workers, define how the duties are to be performed, sign the required time sheets, and can terminate their relationships with these providers at any time they wish. Providers likewise work on a freelance basis and can end their relationships with recipients for any reason.
IHSS services in Los Angeles County are authorized through the Department of Public Social Services (DPSS) based on an in-home needs assessment conducted by IHSS Social Workers. DPSS also oversees provider orientation, hiring, terminations, and payment, and additionally works collaboratively with the Public Assistance Services Council (PASC) to maintain a monthly roster of registered providers in the County and make referrals for recipients who need them. HSS recipients can receive concurrent assistance for various tasks rendered by different providers, including family members. IHSS Providers likewise often work for multiple recipients.
Understanding Provider Retention and Turnover Due to the structure of the IHSS Program, recipients are tasked with hiring, training, supervising and terminating their providers. IHSS providers can also terminate their relationships with the recipient or consumer. Therefore, it is not surprising to find a significant degree of provider turnover in the IHSS program. However, quantifying the severity of the turnover depends on the method used to capture provider terminations. Roughly half the provider-recipient pairings in the IHSS system at any point in time are relationships that have been terminated for reasons other than a change in the recipient’s eligibility status, meaning that these terminations are the result of choices made by either providers or recipients. However, as will be discussed in this report, an indeterminate portion of these discontinued provider-recipient pairings are typically residual terminations that remain in the system after they take place. A more balanced understanding of turnover and retention in the program therefore requires alternative methods of measurement. Los Angeles County’s Chief Executive Office (CEO) prepared this report in response to specific questions DPSS has raised about the extent and causes of provider turnover and its effects on the quality and continuity of the services IHSS recipients receive. The department is especially interested in taking steps to ensure IHSS recipients are not exposed to potentially harmful service gaps resulting from frequent provider turnover. The problem of turnover is also important given anecdotal evidence suggesting that the quality of service improves when recipients have a trusting rapport with their providers, which becomes more difficult to establish under circumstances in which the providers delivering particular services to recipients change repeatedly. The analyses conducted for this report utilize statistical and geo-spatial methodologies to provide a data-driven picture of the factors most closely associated with provider retention and turnover. The objective of the analyses summarized in what follows was to produce information DPSS can apply at the
2
policymaking level to foster and encourage lasting provider-recipient relationships and thereby enhance the quality of service and care available through IHSS.
II. Study Period, Data and Sampling
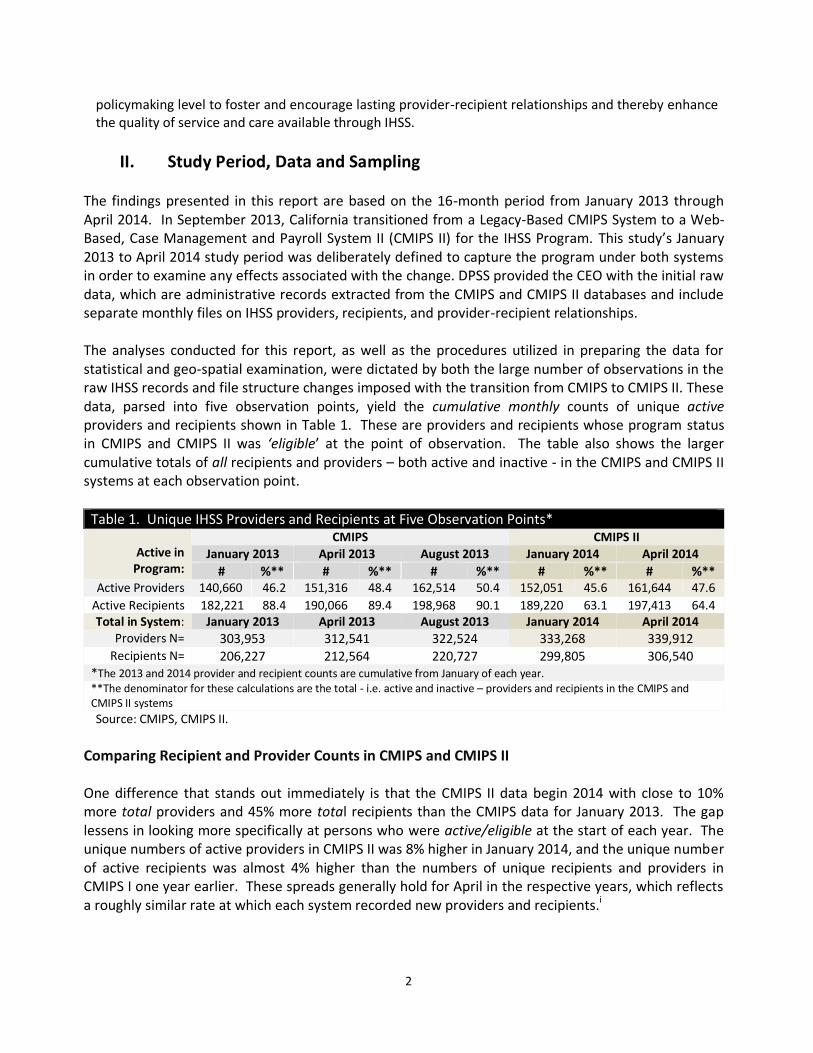
The findings presented in this report are based on the 16-month period from January 2013 through April 2014. In September 2013, California transitioned from a Legacy-Based CMIPS System to a Web-Based, Case Management and Payroll System II (CMIPS II) for the IHSS Program. This study’s January 2013 to April 2014 study period was deliberately defined to capture the program under both systems in order to examine any effects associated with the change. DPSS provided the CEO with the initial raw data, which are administrative records extracted from the CMIPS and CMIPS II databases and include separate monthly files on IHSS providers, recipients, and provider-recipient relationships. The analyses conducted for this report, as well as the procedures utilized in preparing the data for statistical and geo-spatial examination, were dictated by both the large number of observations in the raw IHSS records and file structure changes imposed with the transition from CMIPS to CMIPS II. These data, parsed into five observation points, yield the cumulative monthly counts of unique active providers and recipients shown in Table 1. These are providers and recipients whose program status in CMIPS and CMIPS II was ‘eligible’ at the point of observation. The table also shows the larger cumulative totals of all recipients and providers – both active and inactive - in the CMIPS and CMIPS II systems at each observation point.
Table 1. Unique IHSS Providers and Recipients at Five Observation Points*
Active in Program:
CMIPS CMIPS II
January 2013 April 2013 August 2013 January 2014 April 2014
# %** # %** # %** # %** # %** Active Providers 140,660 46.2 151,316 48.4 162,514 50.4 152,051 45.6 161,644 47.6
Active Recipients 182,221 88.4 190,066 89.4 198,968 90.1 189,220 63.1 197,413 64.4 Total in System: January 2013 April 2013 August 2013 January 2014 April 2014
Providers N= 303,953 312,541 322,524 333,268 339,912 Recipients N= 206,227 212,564 220,727 299,805 306,540
*The 2013 and 2014 provider and recipient counts are cumulative from January of each year. **The denominator for these calculations are the total - i.e. active and inactive – providers and recipients in the CMIPS and CMIPS II systems
Source: CMIPS, CMIPS II.
Comparing Recipient and Provider Counts in CMIPS and CMIPS II
One difference that stands out immediately is that the CMIPS II data begin 2014 with close to 10% more total providers and 45% more total recipients than the CMIPS data for January 2013. The gap lessens in looking more specifically at persons who were active/eligible at the start of each year. The unique numbers of active providers in CMIPS II was 8% higher in January 2014, and the unique number of active recipients was almost 4% higher than the numbers of unique recipients and providers in CMIPS I one year earlier. These spreads generally hold for April in the respective years, which reflects a roughly similar rate at which each system recorded new providers and recipients.i
3
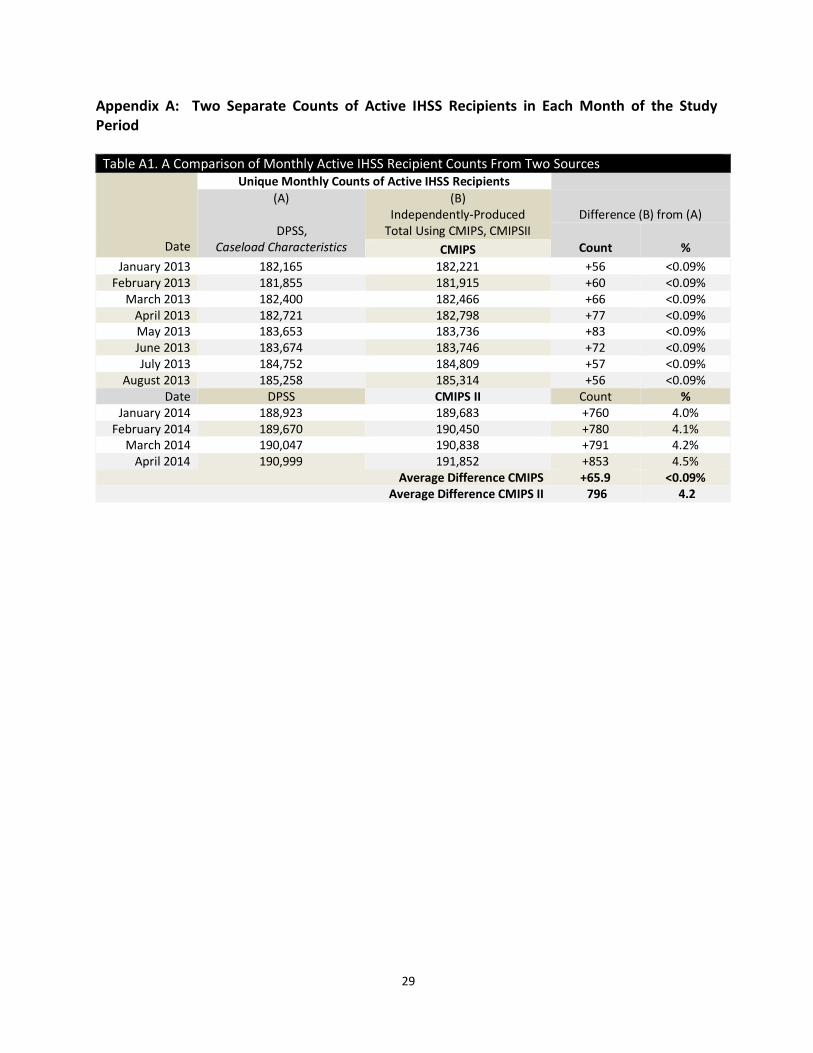
CMIPS and CMIPS II Compared to DPSS Statistical Reports Appendix A provides a table comparing the IHSS monthly recipient totals published in DPSS’s Caseload Characteristics reports with unique counts of active recipients produced independently using raw data in CMIPS and CMIPS II. For the CMIPS period, the average gap between the monthly count published by DPSS and the independently-generated count is about 66 recipients per month, a difference equal to a small fraction of 1%. In the CMIPS II period, the independently-produced number is greater by an average of about 4%, close to 800 recipients per month. Whether the significantly larger number of providers and recipients in CMIPS II reflects a data quality issue or a change in counting procedures at the State level is not known as of this writing.
Sample Size Observations as large as those shown in Table 1 - from roughly 140,000 to 160,000 unique active providers per month over the study period, and between 180,000 and 200,000 unique active recipients per month – tend to both diminish the explanatory power of data and blur key geographic demarcations in working with and mapping geo-coded records.ii For these reasons, discrete random samples of 1,000 provider-recipient relationships were produced for the five observation points over the study period. This sampling approach was necessitated by the previously-noted file structure changes that accompanied the transition from CMIPS to CMIPS II, and by the nature of entry and exit from the IHSS program (i.e. where both providers and recipients can enter and leave the system at any time). The sample size was determined by a power analysis described in technical detail in Appendix B. The file structure changes imposed with the transition from CMIPS to CMIPS II are described in Appendix C. While there is a considerable degree of continuity in the recipient population from one point in time to the next, it must be emphasized that the samples are not longitudinal views of fixed groups of providers and recipients over time but rather distinct, randomly-selected samples at each observation point. The analytical verifications tabulated in Appendix D were performed to ensure that the samples are representative in terms of demographics and background characteristics of the observed populations.
III. The Basic Demographics of IHSS Providers and Recipients
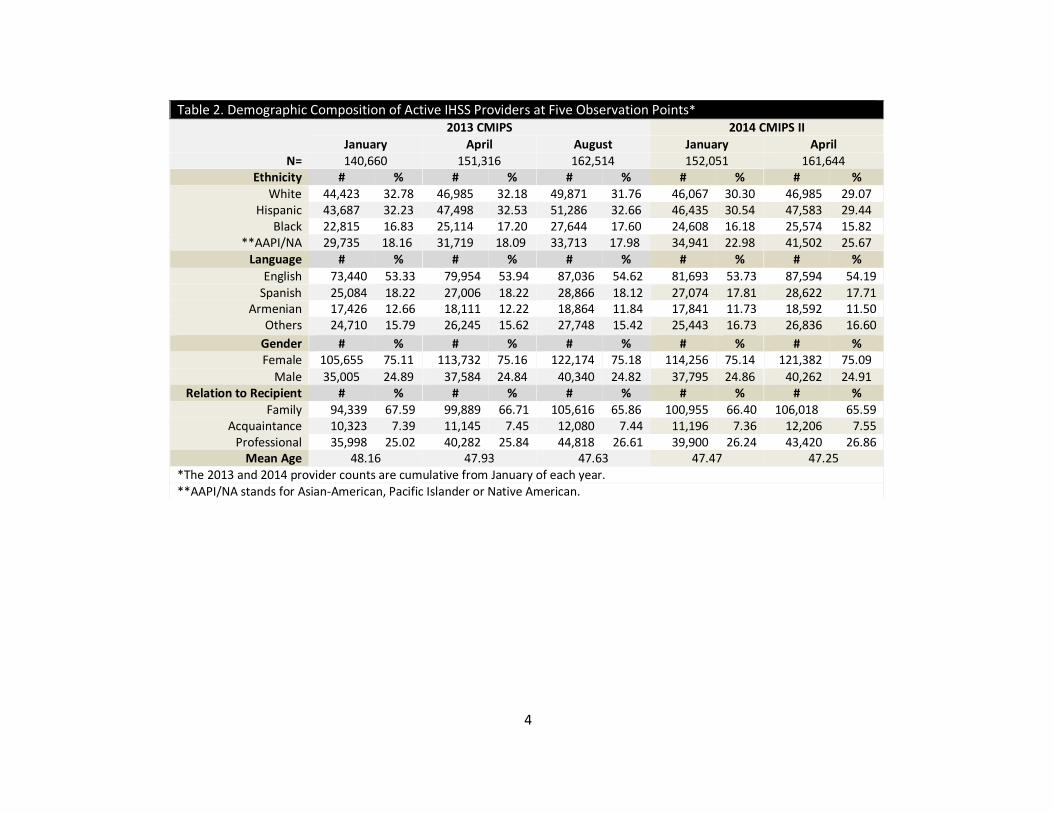
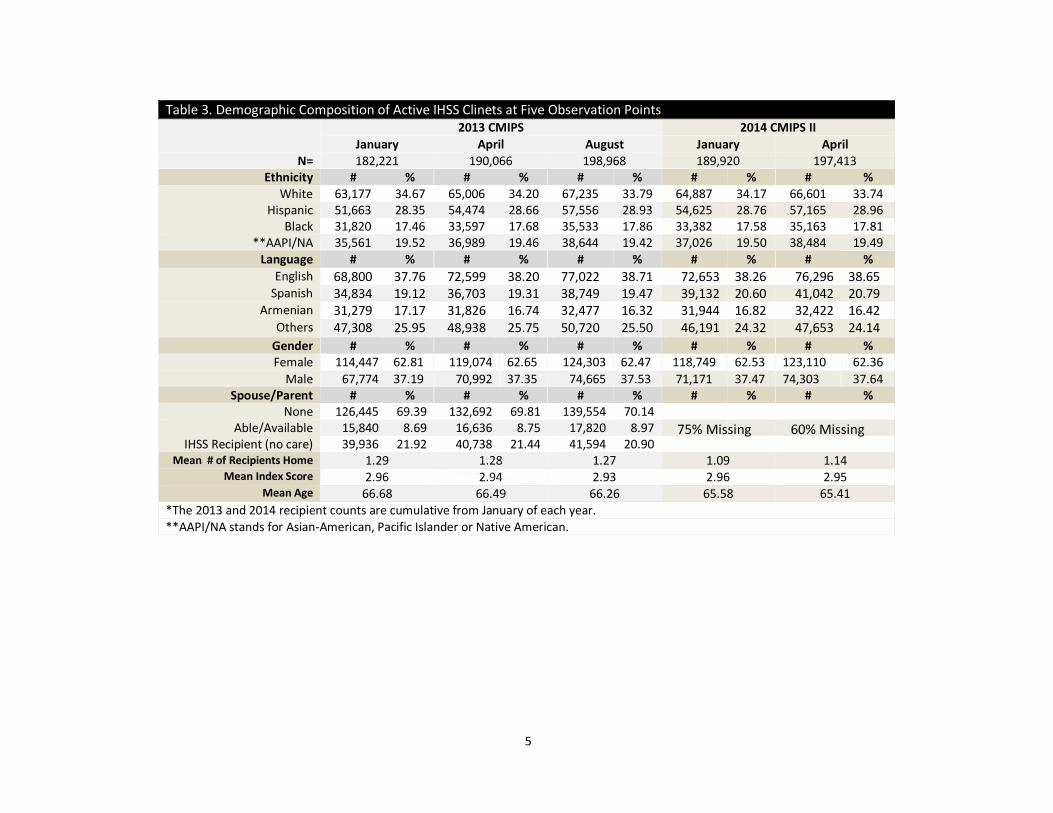
Table 2 and Table 3 provide basic demographic and background information for the active providers and recipients from which the representative provider-recipient samples were extracted for analysis. Both tables indicate that the overall composition of the County’s IHSS providers and recipients tends to remain fairly stable over time. To the extent that any volatility is observed in the compositions of both groups, the tidy demarcation of the fluctuation patterns between 2013 and 2014 suggest that changes are largely technical reflections of the transition from CMIPS to CMIPS II.iii
4
Table 2. Demographic Composition of Active IHSS Providers at Five Observation Points* 2013 CMIPS 2014 CMIPS II
January April August January April N= 140,660 151,316 162,514 152,051 161,644
Ethnicity # % # % # % # % # % White 44,423 32.78 46,985 32.18 49,871 31.76 46,067 30.30 46,985 29.07
Hispanic 43,687 32.23 47,498 32.53 51,286 32.66 46,435 30.54 47,583 29.44 Black 22,815 16.83 25,114 17.20 27,644 17.60 24,608 16.18 25,574 15.82
**AAPI/NA 29,735 18.16 31,719 18.09 33,713 17.98 34,941 22.98 41,502 25.67 Language # % # % # % # % # %
English 73,440 53.33 79,954 53.94 87,036 54.62 81,693 53.73 87,594 54.19 Spanish 25,084 18.22 27,006 18.22 28,866 18.12 27,074 17.81 28,622 17.71
Armenian 17,426 12.66 18,111 12.22 18,864 11.84 17,841 11.73 18,592 11.50 Others 24,710 15.79 26,245 15.62 27,748 15.42 25,443 16.73 26,836 16.60
Gender # % # % # % # % # % Female 105,655 75.11 113,732 75.16 122,174 75.18 114,256 75.14 121,382 75.09
Male 35,005 24.89 37,584 24.84 40,340 24.82 37,795 24.86 40,262 24.91 Relation to Recipient # % # % # % # % # %
Family 94,339 67.59 99,889 66.71 105,616 65.86 100,955 66.40 106,018 65.59 Acquaintance 10,323 7.39 11,145 7.45 12,080 7.44 11,196 7.36 12,206 7.55
Professional 35,998 25.02 40,282 25.84 44,818 26.61 39,900 26.24 43,420 26.86 Mean Age 48.16 47.93 47.63 47.47 47.25
*The 2013 and 2014 provider counts are cumulative from January of each year. **AAPI/NA stands for Asian-American, Pacific Islander or Native American.
5
Table 3. Demographic Composition of Active IHSS Clinets at Five Observation Points 2013 CMIPS 2014 CMIPS II
January April August January April N= 182,221 190,066 198,968 189,920 197,413
Ethnicity # % # % # % # % # % White 63,177 34.67 65,006 34.20 67,235 33.79 64,887 34.17 66,601 33.74
Hispanic 51,663 28.35 54,474 28.66 57,556 28.93 54,625 28.76 57,165 28.96 Black 31,820 17.46 33,597 17.68 35,533 17.86 33,382 17.58 35,163 17.81
**AAPI/NA 35,561 19.52 36,989 19.46 38,644 19.42 37,026 19.50 38,484 19.49 Language # % # % # % # % # %
English 68,800 37.76 72,599 38.20 77,022 38.71 72,653 38.26 76,296 38.65 Spanish 34,834 19.12 36,703 19.31 38,749 19.47 39,132 20.60 41,042 20.79
Armenian 31,279 17.17 31,826 16.74 32,477 16.32 31,944 16.82 32,422 16.42 Others 47,308 25.95 48,938 25.75 50,720 25.50 46,191 24.32 47,653 24.14
Gender # % # % # % # % # % Female 114,447 62.81 119,074 62.65 124,303 62.47 118,749 62.53 123,110 62.36
Male 67,774 37.19 70,992 37.35 74,665 37.53 71,171 37.47 74,303 37.64 Spouse/Parent # % # % # % # % # %
None 126,445 69.39 132,692 69.81 139,554 70.14 Able/Available 15,840 8.69 16,636 8.75 17,820 8.97
IHSS Recipient (no care) 39,936 21.92 40,738 21.44 41,594 20.90 Mean # of Recipients Home 1.29 1.28 1.27 1.09 1.14
Mean Index Score 2.96 2.94 2.93 2.96 2.95 Mean Age 66.68 66.49 66.26 65.58 65.41
*The 2013 and 2014 recipient counts are cumulative from January of each year. **AAPI/NA stands for Asian-American, Pacific Islander or Native American.
75% Missing 60% Missing
6
The average age of active providers and recipients over the five observation points is roughly 48 and 66 respectively. Approximately three-quarters of the providers are women, and about 63% of the program’s recipients are women as well. Ethnically, roughly 27% of the providers at any given point in time are White; 32% of the providers and 29% of the recipients are Hispanic; and between 19% and 22% of both groups are Black. Approximately 45% of the recipients and 55% of the providers are English speakers, and slightly fewer than 20% of both groups are Spanish speakers. A significant minority of both providers and recipients speak either Armenian or other languages that are not English or Spanish. Between 66% and 68% of the providers are related to their recipients by family, and roughly 8% are non-familial acquaintances of their recipients. Approximately one-quarter of the providers are professional care workers (as opposed to being related to their providers by family or other type of acquaintance). Approximately 70% of the observed IHSS recipients had no spouse or parent over the 2013 observation points (insufficient data was available in this area from the 2014 CMIPS II files), but only about 30% of the recipients over the entire period lived independently. At the same time, the mean number of recipients in the household over time indicates that most recipients live by themselves in their homes, which in turn suggests that a considerable portion may live in senior-oriented housing communities. Roughly 2% of IHSS recipient population is blind. The program’s resources are available to non-seniors who are blind or are otherwise functionally impaired, though such recipients comprise an even smaller portion of the recipient population. While the services offered are more broadly targeted in formal terms, IHSS is a program for seniors in practice.
IV. Measuring Provider Turnover over 16 Months
In this section, we examine IHSS provider-recipient relationships in two ways, each of which establishes a distinct perspective on IHSS provider turnover in Los Angeles County. The two perspectives taken together offer a balanced picture of the frequency with which provider-recipient relationships are terminated in Los Angeles County.
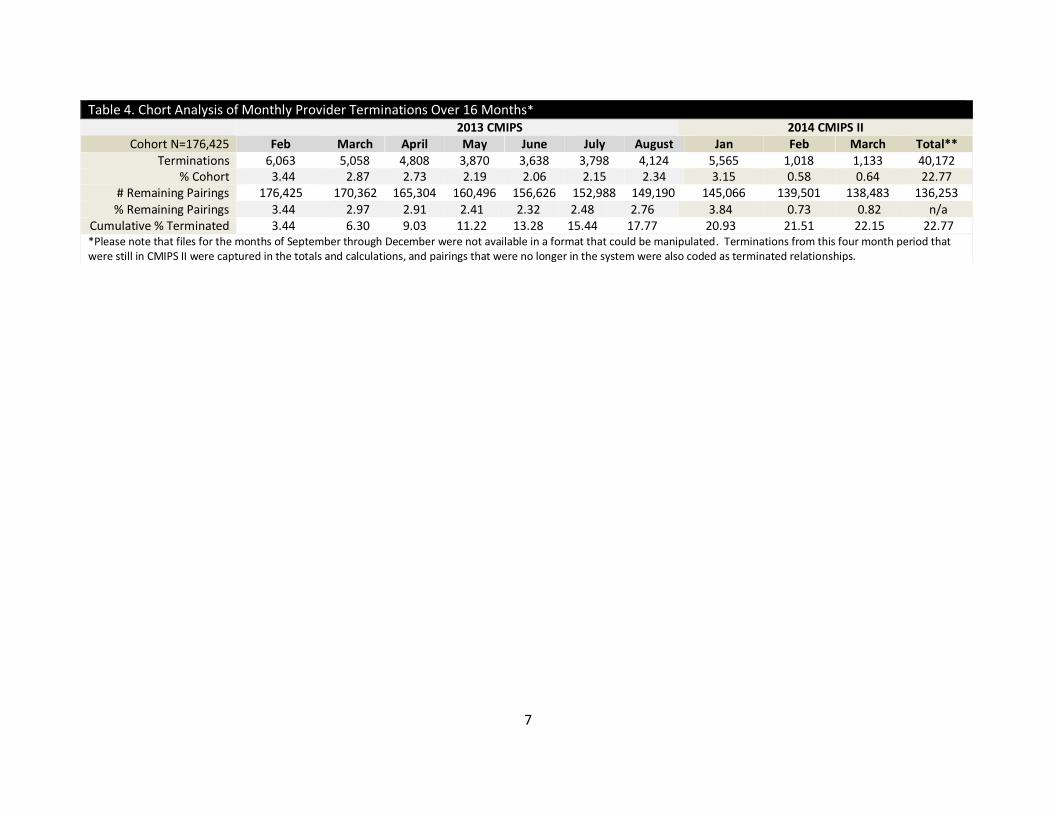
Tracking a Cohort of IHSS Recipients At the first level of analysis, a cohort of all active pairs of IHSS recipients and providers in January 2013 (n=176,425) was followed over the 16-month observation period to gauge terminations over time. Appendix E provides information on the composition of providers and recipients in these pairings and shows the cohort is demographically similar to the overall universe of providers and recipients in the program. Table 4 is an array showing provider terminations within the cohort in two proportional ways: (a) Total monthly terminations at the end of the month as a proportion of the initial cohort; and (b) total monthly terminations at the end of the month as a proportion of the carried-over (i.e. remaining) provider-recipient pairings at the end of the previous month.
7
Table 4. Chort Analysis of Monthly Provider Terminations Over 16 Months* 2013 CMIPS 2014 CMIPS II
Cohort N=176,425 Feb March April May June July August Jan Feb March Total** Terminations 6,063 5,058 4,808 3,870 3,638 3,798 4,124 5,565 1,018 1,133 40,172
% Cohort 3.44 2.87 2.73 2.19 2.06 2.15 2.34 3.15 0.58 0.64 22.77 # Remaining Pairings 176,425 170,362 165,304 160,496 156,626 152,988 149,190 145,066 139,501 138,483 136,253 % Remaining Pairings 3.44 2.97 2.91 2.41 2.32 2.48 2.76 3.84 0.73 0.82 n/a
Cumulative % Terminated 3.44 6.30 9.03 11.22 13.28 15.44 17.77 20.93 21.51 22.15 22.77 *Please note that files for the months of September through December were not available in a format that could be manipulated. Terminations from this four month period that were still in CMIPS II were captured in the totals and calculations, and pairings that were no longer in the system were also coded as terminated relationships.
8
Between 2% and 3% of the initial provider-recipient pairings in the cohort terminated each month in 2013. The monthly rate drops to below 1% in 2014.iv This relatively sharp decline in the rate is largely due to the gradual removal of the most tenuous provider-recipient pairings from the cohort pool over time, the decline may also partially be a technical reflection of the transition to the new data management system. The monthly termination rate is slightly higher when the denominator used is the remaining pairings carried over from the previous month.
Over the entire 16-month tracking period, 23% of the initial recipient-provider relationships
were terminated.
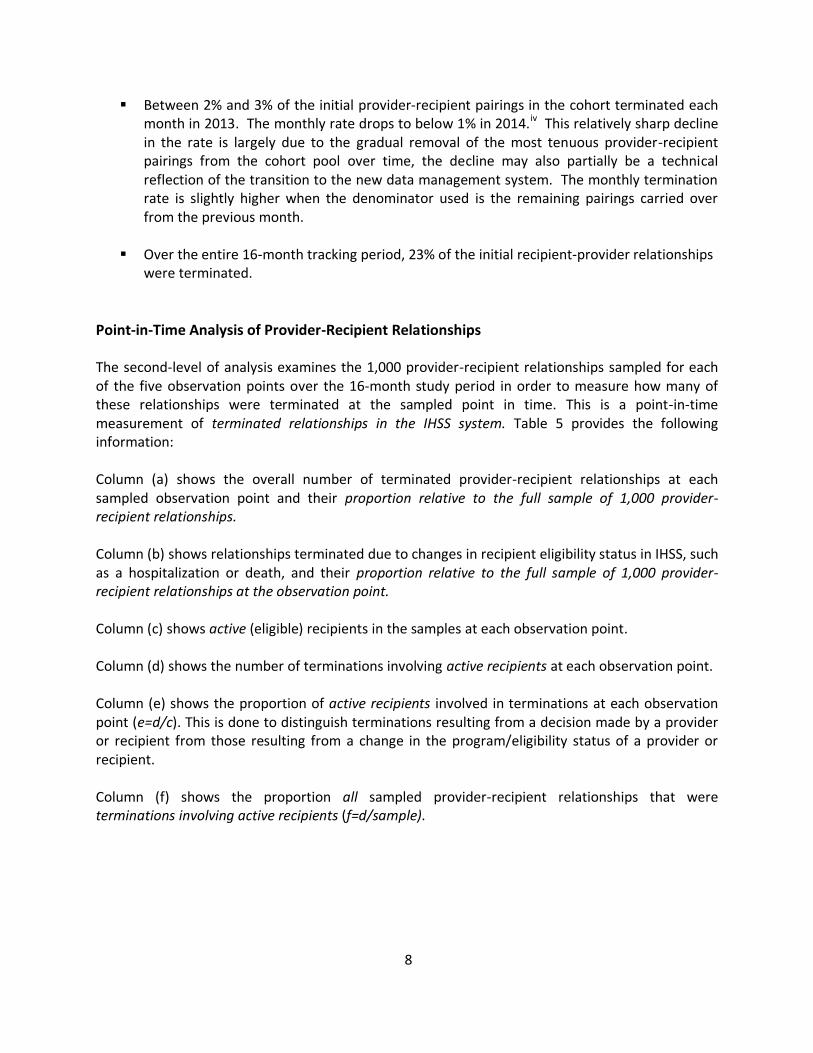
Point-in-Time Analysis of Provider-Recipient Relationships The second-level of analysis examines the 1,000 provider-recipient relationships sampled for each of the five observation points over the 16-month study period in order to measure how many of these relationships were terminated at the sampled point in time. This is a point-in-time measurement of terminated relationships in the IHSS system. Table 5 provides the following information: Column (a) shows the overall number of terminated provider-recipient relationships at each sampled observation point and their proportion relative to the full sample of 1,000 provider-recipient relationships.
Column (b) shows relationships terminated due to changes in recipient eligibility status in IHSS, such as a hospitalization or death, and their proportion relative to the full sample of 1,000 provider-recipient relationships at the observation point.
Column (c) shows active (eligible) recipients in the samples at each observation point. Column (d) shows the number of terminations involving active recipients at each observation point. Column (e) shows the proportion of active recipients involved in terminations at each observation point (e=d/c). This is done to distinguish terminations resulting from a decision made by a provider or recipient from those resulting from a change in the program/eligibility status of a provider or recipient. Column (f) shows the proportion all sampled provider-recipient relationships that were terminations involving active recipients (f=d/sample).
9
Table 5. Provider Terminations at Five Observation Points
CMIPS 2013
Sampled
Provider-Recipient
Relationships
(a)
(b)
(c)
Terminations Among Active
Recipients
Provider
Terminations Overall
Provider Terminations Due to
Change in Recipient Status
Active
Recips in Sample
(d)
(e)
(f) #
% Sample
#
% Sample
January 1,000 608 60.8 107 10.7 893 502 56.2 50.2 April 1,000 589 58.9 140 14.0 860 455 52.9 45.5
August 1,000 538 53.8 148 14.8 852 395 46.4 39.5
CMIPS II: 2014
Sampled Provider-Recipient
Relationships
(a)
(b)
(c)
Terminations Among Active
Recipients
Provider Terminations
Overall
Provider Terminations Due to
Change in Recipient Status
Active Rectips
in Sample
(d)
(e)
(f) #
% Sample
#
% Sample
January 1,000 631 63.1 335 33.5 665 300 45.1 30.0 April 1,000 558 55.8 295 29.5 705 277 39.3 27.8
*The 2013 and 2014 provider counts are cumulative from January of each year.
10
A monthly average of 58.5% (not shown) of provider-recipient pairings in the IHSS system were terminated over the 16-month observation period and there was a 9.3 percentage point spread between the lowest and highest monthly termination rate, 53.8% in August 2013 and 63.1% in January 2014 respectively. If only active/eligible recipients are considered, the average proportion of terminated relationships is about 10 percentage points lower (48%). However, potential data quality issues in CMIPS II may explain the 17 percentage point difference between the highest monthly proportion of terminated relationships among active recipients (56.2% in January 2013) and the lowest monthly proportion among these recipients (39.3% in April 2014). For this reason, it is useful to provide two separate termination measures within the larger study period:
In the CMIPS period (2013), a monthly average of 51.8% of the provider-recipient pairings involving eligible recipients in the system were terminated. These are terminations that occurred for reasons other than a change in the recipient’s eligibility status. Relationships terminated in this way more generally constituted an average of 47.4% of
In the CMIPS II period (2014), for which there are only two observation points, a monthly average of 42.2% of pairings involving eligible recipients in the system were terminated. These relationships comprised about 29% of all monthly provider-recipient pairings in the system.
These rates closely track the rates for the full universe of provider-recipient relationships
over the study shown in Appendix F.
Reconciling the Two Perspectives on Provider Terminations The two methods combined suggest that, while between 40% and 50% of provider-recipient pairings in the IHSS system at any point are recently-terminated relationships discontinued for reasons other than a change in the recipient eligibility status, any established provider-recipient pairing has about a one in five chance of terminating over the course of 12 months, though at this level of analysis the terminations necessarily include those that occur due to changes in program eligibility status. The cohort analysis produces a more modest picture of provider terminations for several reasons. The tracking period in examining the cohort has a fixed starting point and all recipients in the cohort are in active relationships with their providers at the start of this tracking period. By contrast, the point-in-time method is based on a sample of all relationships in the IHSS system, both those that are terminated and those that are ongoing. One advantage of the point-in-time analysis, as noted, is that provider terminations due to changes in recipient eligibility status can be analytically separated from terminations due to individual choices made by recipients or providers. This is not the case for the cohort analysis, where all eligible recipients in the program are followed until their relationship with their provider terminates regardless of the reason. The point-in-time analysis also shows the overall proportion of terminated provider-recipient relationships in the IHSS system at any given point in time, which provides a sense of the likelihood that a recipient will be involved in a terminated relationship over the course of a year. However, since the terminations recorded in CMIPS and CMIPS II do not
11
provide a termination date, the point-in-time method captures an indeterminate number of residual terminations, which are relationships discontinued at some point prior to the observation point but that remain in CMIPS/CMIPS II for a certain period of time before they are removed. The point-in-time method can therefore be interpreted as a measure of terminated relationships in the system at the observation point as opposed to a measure of monthly turnover.
V. Service Gaps and Attrition
Regardless of the method used to measure terminations, DPSS is especially interested in whether provider turnover leaves some IHSS recipients exposed to potentially harmful service gaps. The manner in which data are collected for (and structured in) CMIPS and CMIPS II limits the ability to answer this question without recourse to micro-level qualitative data. Recipients can have multiple providers, and when these recipients are associated with frequent terminations, the data do not offer a reliable means of determining the specific service needs met through newly-formed provider-recipient relationships. What follows is therefore a limited examination of potential service gaps.
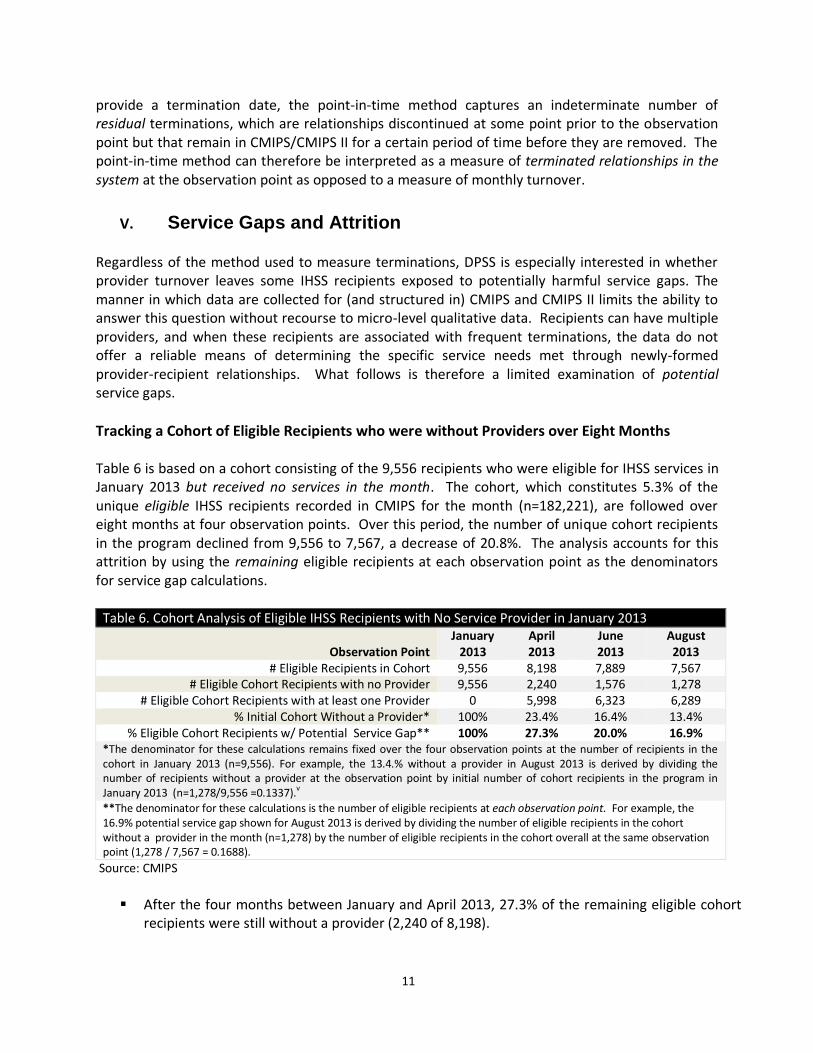
Tracking a Cohort of Eligible Recipients who were without Providers over Eight Months Table 6 is based on a cohort consisting of the 9,556 recipients who were eligible for IHSS services in January 2013 but received no services in the month. The cohort, which constitutes 5.3% of the unique eligible IHSS recipients recorded in CMIPS for the month (n=182,221), are followed over eight months at four observation points. Over this period, the number of unique cohort recipients in the program declined from 9,556 to 7,567, a decrease of 20.8%. The analysis accounts for this attrition by using the remaining eligible recipients at each observation point as the denominators for service gap calculations.
Table 6. Cohort Analysis of Eligible IHSS Recipients with No Service Provider in January 2013
Observation Point January
2013 April 2013
June 2013
August 2013
# Eligible Recipients in Cohort 9,556 8,198 7,889 7,567 # Eligible Cohort Recipients with no Provider 9,556 2,240 1,576 1,278
# Eligible Cohort Recipients with at least one Provider 0 5,998 6,323 6,289 % Initial Cohort Without a Provider* 100% 23.4% 16.4% 13.4%
% Eligible Cohort Recipients w/ Potential Service Gap** 100% 27.3% 20.0% 16.9% *The denominator for these calculations remains fixed over the four observation points at the number of recipients in the cohort in January 2013 (n=9,556). For example, the 13.4.% without a provider in August 2013 is derived by dividing the number of recipients without a provider at the observation point by initial number of cohort recipients in the program in January 2013 (n=1,278/9,556 =0.1337).v
**The denominator for these calculations is the number of eligible recipients at each observation point. For example, the 16.9% potential service gap shown for August 2013 is derived by dividing the number of eligible recipients in the cohort without a provider in the month (n=1,278) by the number of eligible recipients in the cohort overall at the same observation point (1,278 / 7,567 = 0.1688).
Source: CMIPS
After the four months between January and April 2013, 27.3% of the remaining eligible cohort
recipients were still without a provider (2,240 of 8,198).
12
After the six months between January and June 2013, 20.0% of the remaining eligible cohort recipients were still without a provider (1,576 of 7,889).
After the eight months between January and August 2013, 16.9.% of the remaining eligible cohort recipients were still without a provider (1,278 of 7,567)
We refer to these as potential service gaps because the data do not provide a sufficiently reliable way of knowing whether the tracked recipients were in need of services but could not find a provider or did not need or want services but remained in the IHSS system as eligible recipients. It should also be noted that the cohort analysis does not enable us to specifically examine the extent to which the service gaps are a consequence of prior provider terminations.
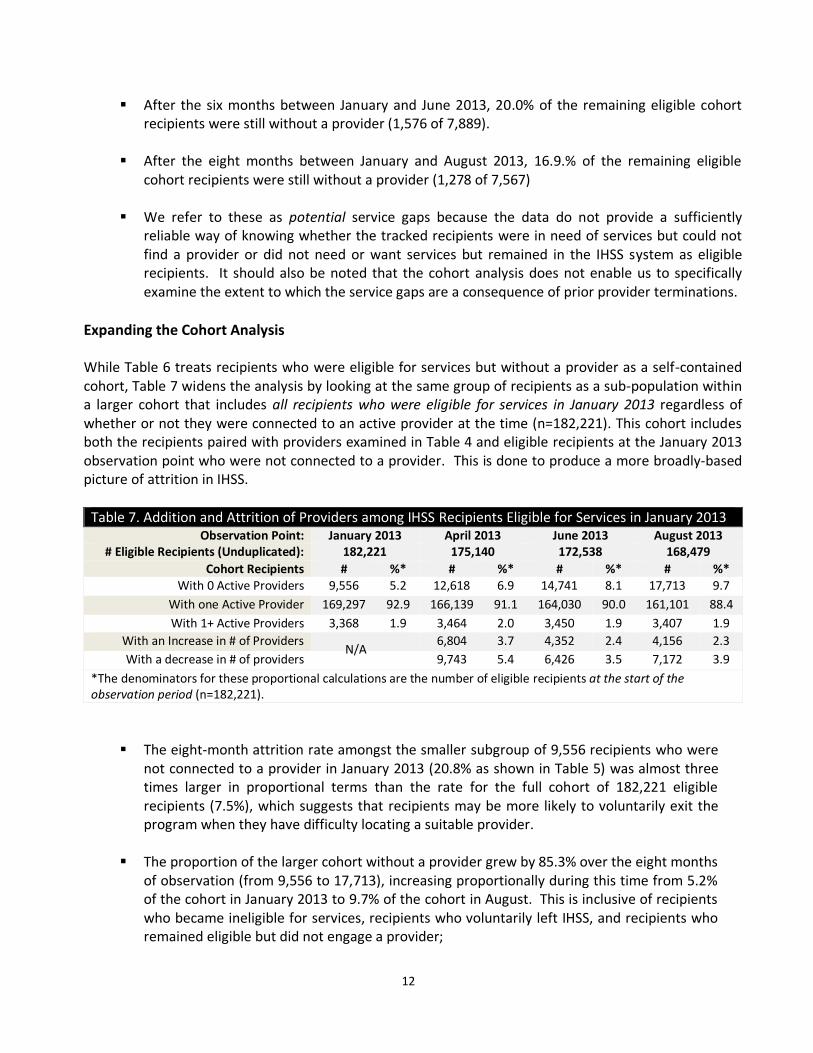
Expanding the Cohort Analysis
While Table 6 treats recipients who were eligible for services but without a provider as a self-contained cohort, Table 7 widens the analysis by looking at the same group of recipients as a sub-population within a larger cohort that includes all recipients who were eligible for services in January 2013 regardless of whether or not they were connected to an active provider at the time (n=182,221). This cohort includes both the recipients paired with providers examined in Table 4 and eligible recipients at the January 2013 observation point who were not connected to a provider. This is done to produce a more broadly-based picture of attrition in IHSS.
Table 7. Addition and Attrition of Providers among IHSS Recipients Eligible for Services in January 2013 Observation Point: January 2013 April 2013 June 2013 August 2013
# Eligible Recipients (Unduplicated): 182,221 175,140 172,538 168,479
Cohort Recipients # %* # %* # %* # %* With 0 Active Providers 9,556 5.2 12,618 6.9 14,741 8.1 17,713 9.7
With one Active Provider 169,297 92.9 166,139 91.1 164,030 90.0 161,101 88.4
With 1+ Active Providers 3,368 1.9 3,464 2.0 3,450 1.9 3,407 1.9
With an Increase in # of Providers 6,804 3.7 4,352 2.4 4,156 2.3
With a decrease in # of providers 9,743 5.4 6,426 3.5 7,172 3.9
*The denominators for these proportional calculations are the number of eligible recipients at the start of the observation period (n=182,221).
The eight-month attrition rate amongst the smaller subgroup of 9,556 recipients who were not connected to a provider in January 2013 (20.8% as shown in Table 5) was almost three times larger in proportional terms than the rate for the full cohort of 182,221 eligible recipients (7.5%), which suggests that recipients may be more likely to voluntarily exit the program when they have difficulty locating a suitable provider.
The proportion of the larger cohort without a provider grew by 85.3% over the eight months of observation (from 9,556 to 17,713), increasing proportionally during this time from 5.2% of the cohort in January 2013 to 9.7% of the cohort in August. This is inclusive of recipients who became ineligible for services, recipients who voluntarily left IHSS, and recipients who remained eligible but did not engage a provider;
N/A
13
The patterns shown in Table 6 indicate more generally that most IHSS recipients employ
only one provider at a time.
An average of roughly 3% of the program’s recipients added more providers to the number they engaged at the previous observation point. However, since most of the program’s recipients only use one provider, it is likely that those who take on providers are adding the only provider they intend to engage, or the one provider they are eligible to hire using IHSS resources. For the same reasons, most recipients who lose providers for any reason are likely shedding the only provider with whom they are engaged at the given point in time.
Summarizing the Cohort Analysis Roughly one out of every six active IHSS recipients (16.9%) who were without a provider in January 2013 remained without a provider eight months later. Over this period, one in five in the same cohort (20.8%) left the program, a rate of attrition roughly three times larger than the rate for the expanded cohort consisting of all eligible recipients in January 2013 (i.e. inclusive of recipients regardless of whether they were connected to a provider or not). The proportion of the larger cohort not connected to a provider for any reason grew steadily over eight months. By the end of this period of observation (9.7%) one out of every 10 recipients in the larger cohort was not engaged with a provider. None of these findings can be taken as definitive evidence of service gaps. Some recipients may decide after their in-home assessment that they do not want or need services and then remain in the program as eligible non-participants thereafter. Similarly, recipients may leave the program voluntarily. The collection of qualitative would afford an opportunity to examine following questions:
o Is the inability to locate a suitable provider one of the more common reasons recipients voluntarily leave IHSS?
o Do significant numbers of recipients in the program have difficulty finding providers?
o What are the most typical barriers preventing recipients from engaging a provider?
Are the barriers due to scarcity of providers and/or do they tend to be the result of either recipient or provider actions, behaviors or preferences?

14
VI. Geo-Spatial Analysis: Mapping Recipients, Providers, Turnover and Retention
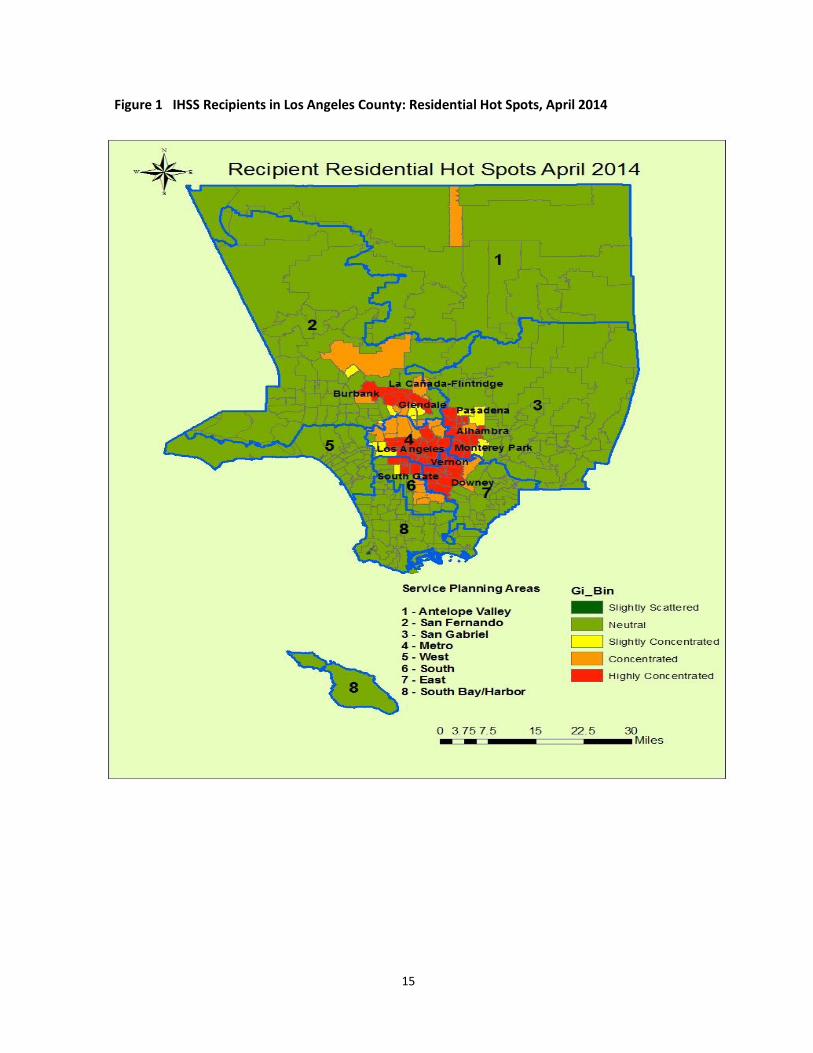
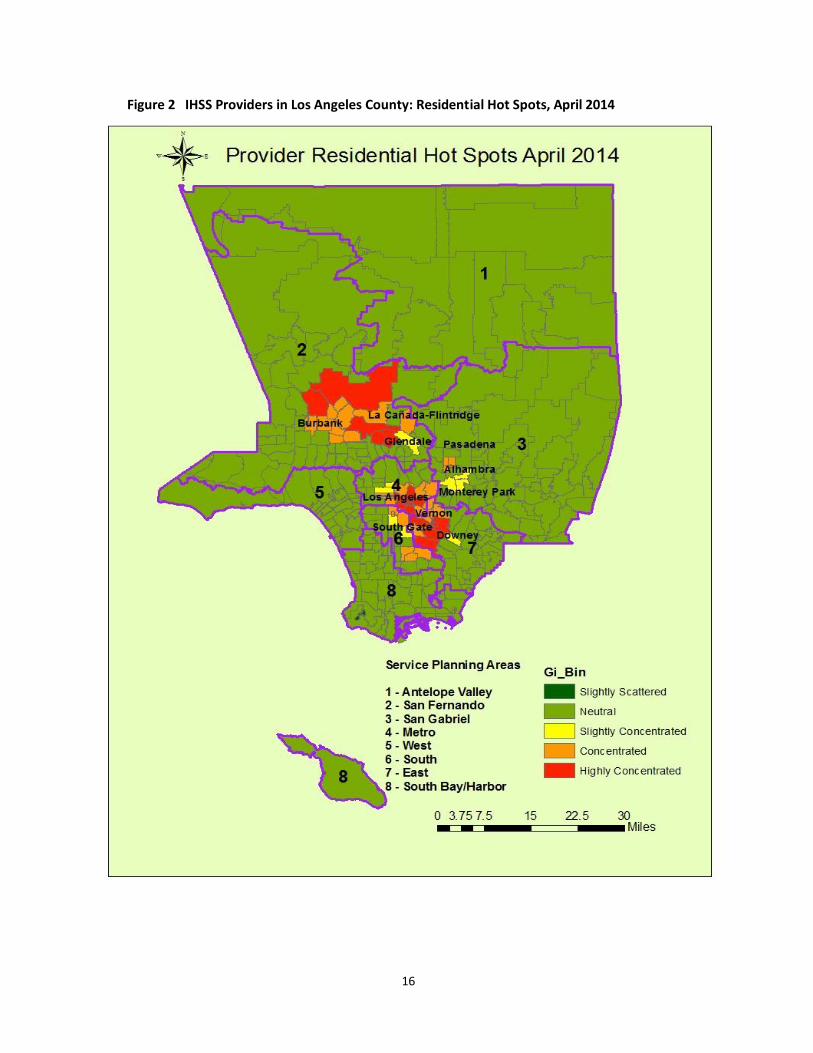
This section is illustrated with a series of maps and summarizes the results of geo-spatial analyses of the samples of 1,000 provider-recipient pairs at the observation points examined in Table 5. The maps reveal where providers and recipients reside and the regions and cities within the County characterized by high and low concentrations of provider turnover and retention. Where Recipients and Providers Reside As expected, analysis of geo-coded CMIPS and CMIPS II data indicates that the residential concentrations of IHSS providers and recipients remained fairly constant over the 16-month observation period. Figures 1 and 2 map the residential ‘hot spots’ (i.e. areas of comparatively high concentration) for recipients and providers respectively at the final observation point (April 2014). The maps show these ‘hot spots’ in relation to DPSS Service Provision Areas (SPAs). Figure 1 shows that IHSS recipients are heavily concentrated in SPA 4, the Greater Los Angeles Metro Area, and this concentration projects outwards to the western tip of the San Gabriel Valley (SPA 3), the Southeastern and central portions of the San Fernando Valley (SPA 2), and along the Northeastern border of South Los Angeles (SPAs 6 and 7). Figure 2 indicates a similar geographic distribution of provider residential locations, though the concentrations are somewhat smaller. More granular analysis at the city level reveals that Burbank, Glendale, La Cañada Flintridge, Pasadena, Monterey Park and Alhambra all have comparatively large numbers of IHSS recipients. These cities are also home to significant clusters of IHSS providers. Similarly, central Los Angeles, Vernon, Downey, and South Gate, have comparatively high concentrations of IHSS recipients and providers in terms of residence. The city of Lancaster (SPA 1) has a significant concentration of recipients but not of providers.
15
Figure 1 IHSS Recipients in Los Angeles County: Residential Hot Spots, April 2014
16
Figure 2 IHSS Providers in Los Angeles County: Residential Hot Spots, April 2014
17
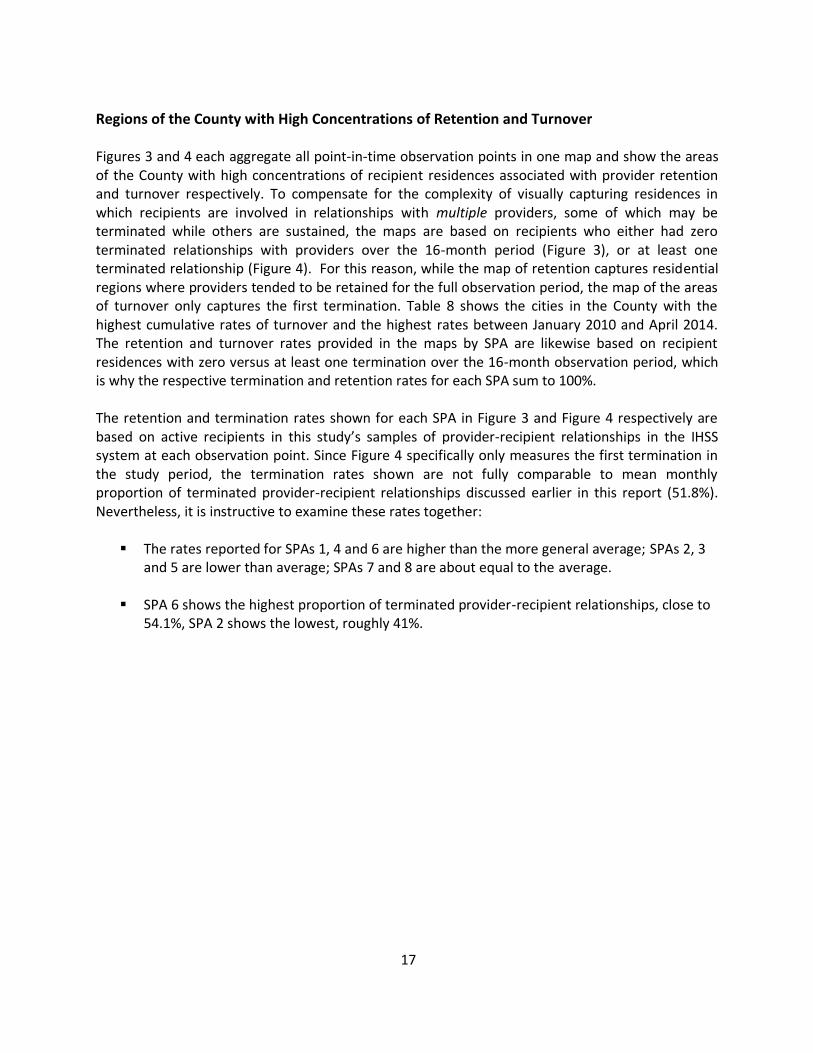
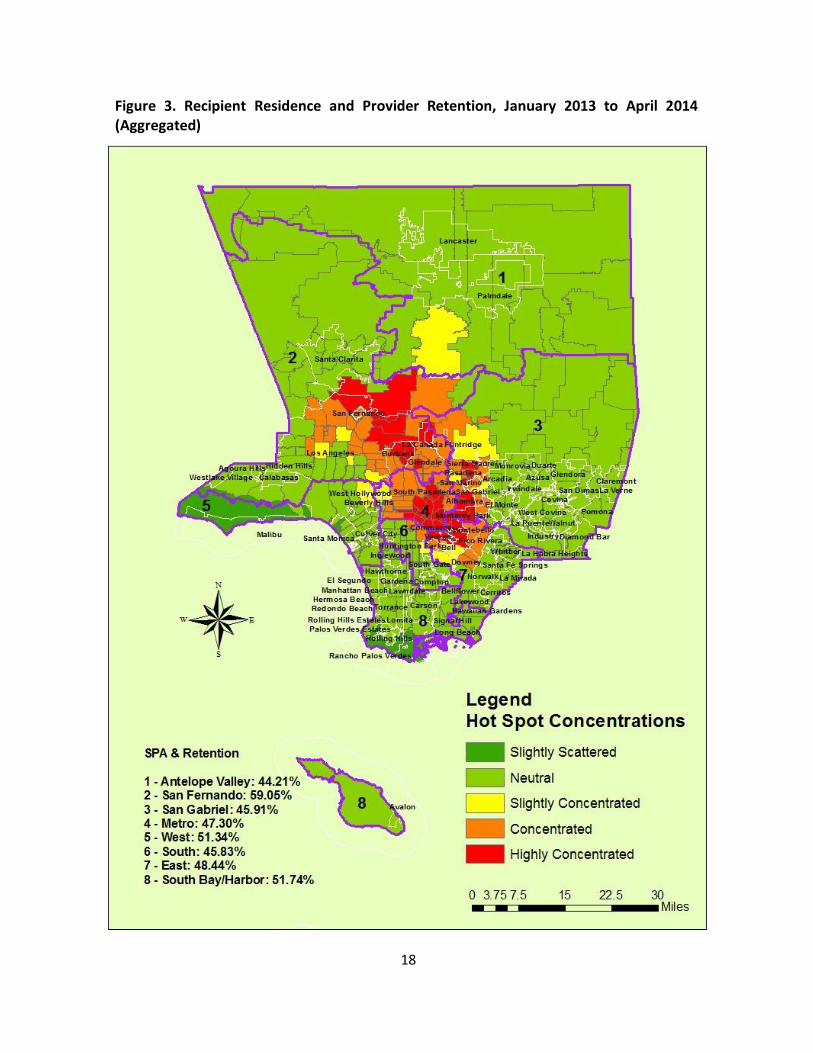
Regions of the County with High Concentrations of Retention and Turnover Figures 3 and 4 each aggregate all point-in-time observation points in one map and show the areas of the County with high concentrations of recipient residences associated with provider retention and turnover respectively. To compensate for the complexity of visually capturing residences in which recipients are involved in relationships with multiple providers, some of which may be terminated while others are sustained, the maps are based on recipients who either had zero terminated relationships with providers over the 16-month period (Figure 3), or at least one terminated relationship (Figure 4). For this reason, while the map of retention captures residential regions where providers tended to be retained for the full observation period, the map of the areas of turnover only captures the first termination. Table 8 shows the cities in the County with the highest cumulative rates of turnover and the highest rates between January 2010 and April 2014. The retention and turnover rates provided in the maps by SPA are likewise based on recipient residences with zero versus at least one termination over the 16-month observation period, which is why the respective termination and retention rates for each SPA sum to 100%. The retention and termination rates shown for each SPA in Figure 3 and Figure 4 respectively are based on active recipients in this study’s samples of provider-recipient relationships in the IHSS system at each observation point. Since Figure 4 specifically only measures the first termination in the study period, the termination rates shown are not fully comparable to mean monthly proportion of terminated provider-recipient relationships discussed earlier in this report (51.8%). Nevertheless, it is instructive to examine these rates together:
The rates reported for SPAs 1, 4 and 6 are higher than the more general average; SPAs 2, 3 and 5 are lower than average; SPAs 7 and 8 are about equal to the average.
SPA 6 shows the highest proportion of terminated provider-recipient relationships, close to 54.1%, SPA 2 shows the lowest, roughly 41%.
18
Figure 3. Recipient Residence and Provider Retention, January 2013 to April 2014 (Aggregated)
19
Figure 4. Recipient Residence and Provider Turnover, January 2013 to April 2014 (Aggregated)
20
The residential concentrations of provider retention are more dispersed than the concentrations of turnover, which are largely limited to adjoining areas of Metro, South and East Los Angles (SPAs 4, 6 and 7), as well as a relatively small band along the western border of the San Gabriel Valley (SPA 3).
In geographic terms, regions of retention and turnover are not mutually exclusive. SPA 4,
the Los Angeles Metro Area, has concentrations of both, as does the adjoining southwestern border of SPA 3. At a more granular level, the cities of Burbank and Glendale in SPA 2 have concentrations of both retention and turnover.
Residential concentrations of retention and turnover are geographic clusters but are not necessarily indicative of a SPA’s overall retention and turnover rates since clusters of both can occur in a SPA at the same time. For example, the central section of SPA 4 shows a concentration of provider retention but also has a 54% termination rate.
The concentration of retention in SPA 2 stretches in an expanding band from the cities of
Burbank and Glendale into the central San Fernando Valley. The concentration of retention in the San Fernando Valley is not offset by a concentration of turnover, which makes the region distinct from other areas of concentrated retention in the County.
The southern border of the Antelope Valley, south of the city of Palmdale (SPA1), shows a
slight concentration of provider retention that expands and intensifies into the northern Border of SPA 2. Further north, a band of turnover runs through the city of Lancaster.
VII. Statistical Explanations for Provider Retention and Turnover Three types of statistical analysis were conducted for this report: (a) Bivariate tests of statistical significance – i.e. chi-square tests applied to categorical variables and t-tests applied to continuous variables – were performed to analyze the strength of the association between a number of variables and provider-recipient relationships that are either terminated or sustained. (b) More rigorous statistical inquiry was performed with multivariate regression models that examined the predictive power of key variables. A Generalized Estimating Equations (GEE) model was fitted to the data based on the results of bivariate and diagnostic statistics. (c) A set of time-to-event analyses based on Kaplan-Meier survival estimates were performed to examine how selected variables affect the duration of provider-recipient relationships. The results of the bivariate and multivariate analyses, summarized in Table 7, are based on the point-in-time random samples of provider-recipient relationships at all five observation points. The survival analysis is described in the summary discussion of this section and is based on the cohort of 176,425 provider-recipient pairings extracted from the January 2013 observation point and examined in Table 4. With one technical exception, the three sets of analyses provide an internally consistent set of explanations for provider retention and termination. Technical documentation for the statistical analyses is provided in Appendices F and G.
21
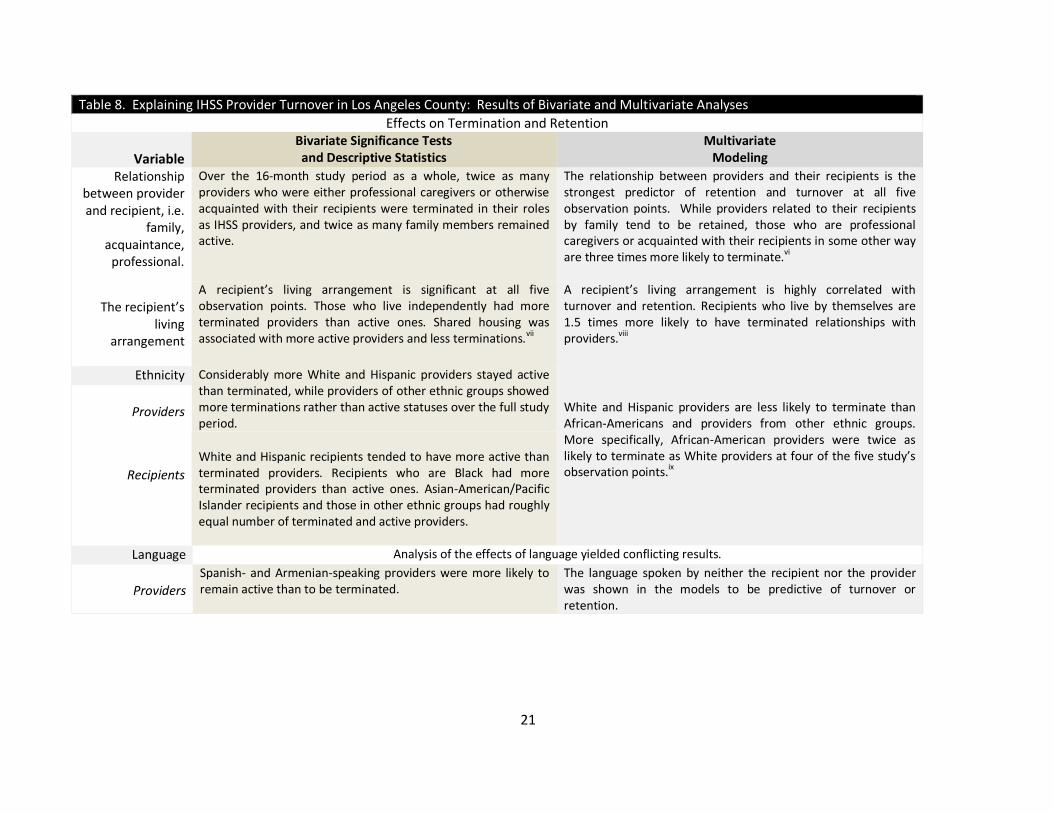
Table 8. Explaining IHSS Provider Turnover in Los Angeles County: Results of Bivariate and Multivariate Analyses
Effects on Termination and Retention
Variable
Bivariate Significance Tests and Descriptive Statistics
Multivariate Modeling
Relationship between provider and recipient, i.e.
family, acquaintance,
professional.
Over the 16-month study period as a whole, twice as many providers who were either professional caregivers or otherwise acquainted with their recipients were terminated in their roles as IHSS providers, and twice as many family members remained active.
The relationship between providers and their recipients is the strongest predictor of retention and turnover at all five observation points. While providers related to their recipients by family tend to be retained, those who are professional caregivers or acquainted with their recipients in some other way are three times more likely to terminate.vi
The recipient’s
living arrangement
A recipient’s living arrangement is significant at all five observation points. Those who live independently had more terminated providers than active ones. Shared housing was associated with more active providers and less terminations.
vii
A recipient’s living arrangement is highly correlated with turnover and retention. Recipients who live by themselves are 1.5 times more likely to have terminated relationships with providers.
viii
Ethnicity Considerably more White and Hispanic providers stayed active than terminated, while providers of other ethnic groups showed more terminations rather than active statuses over the full study period.
White and Hispanic providers are less likely to terminate than African-Americans and providers from other ethnic groups. More specifically, African-American providers were twice as likely to terminate as White providers at four of the five study’s observation points.ix
Providers
Recipients
White and Hispanic recipients tended to have more active than terminated providers. Recipients who are Black had more terminated providers than active ones. Asian-American/Pacific Islander recipients and those in other ethnic groups had roughly equal number of terminated and active providers.
Language Analysis of the effects of language yielded conflicting results.
Providers
Spanish- and Armenian-speaking providers were more likely to remain active than to be terminated.
The language spoken by neither the recipient nor the provider was shown in the models to be predictive of turnover or retention.
22
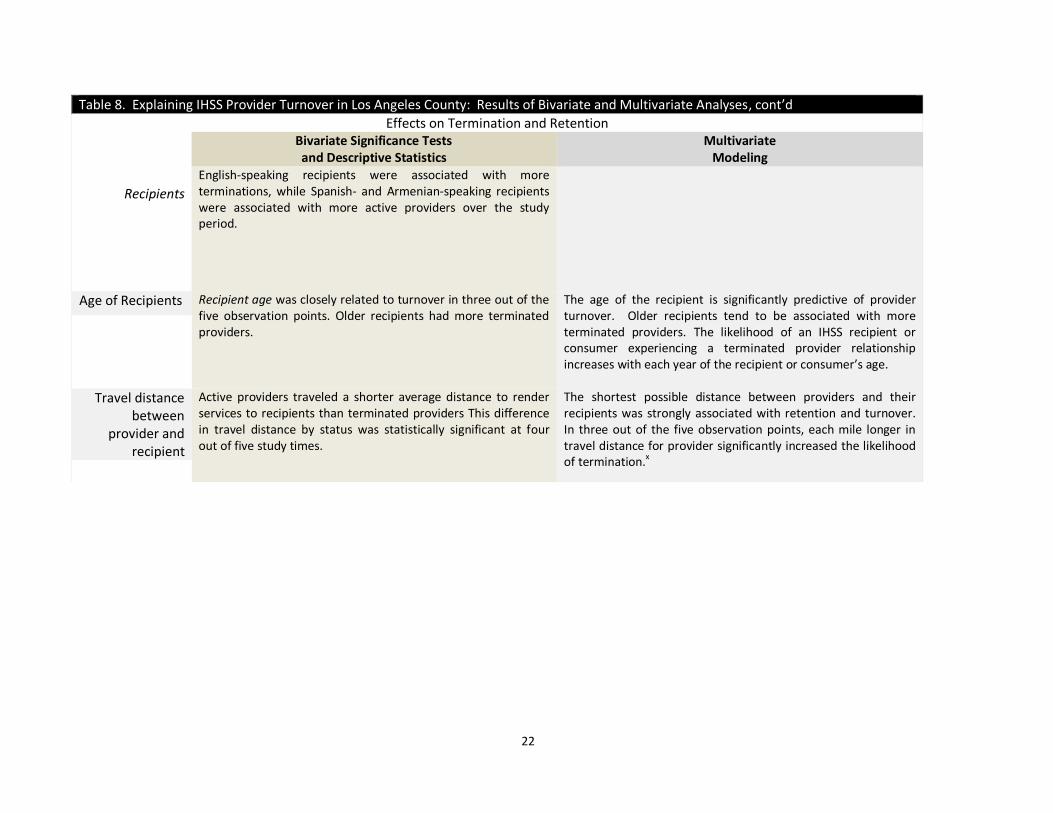
Table 8. Explaining IHSS Provider Turnover in Los Angeles County: Results of Bivariate and Multivariate Analyses, cont’d
Effects on Termination and Retention Bivariate Significance Tests
and Descriptive Statistics Multivariate
Modeling
Recipients
English-speaking recipients were associated with more terminations, while Spanish- and Armenian-speaking recipients were associated with more active providers over the study period.
Age of Recipients Recipient age was closely related to turnover in three out of the five observation points. Older recipients had more terminated providers.
The age of the recipient is significantly predictive of provider turnover. Older recipients tend to be associated with more terminated providers. The likelihood of an IHSS recipient or consumer experiencing a terminated provider relationship increases with each year of the recipient or consumer’s age.
Travel distance between
provider and recipient
Active providers traveled a shorter average distance to render services to recipients than terminated providers This difference in travel distance by status was statistically significant at four out of five study times.
The shortest possible distance between providers and their recipients was strongly associated with retention and turnover. In three out of the five observation points, each mile longer in travel distance for provider significantly increased the likelihood of termination.x
23
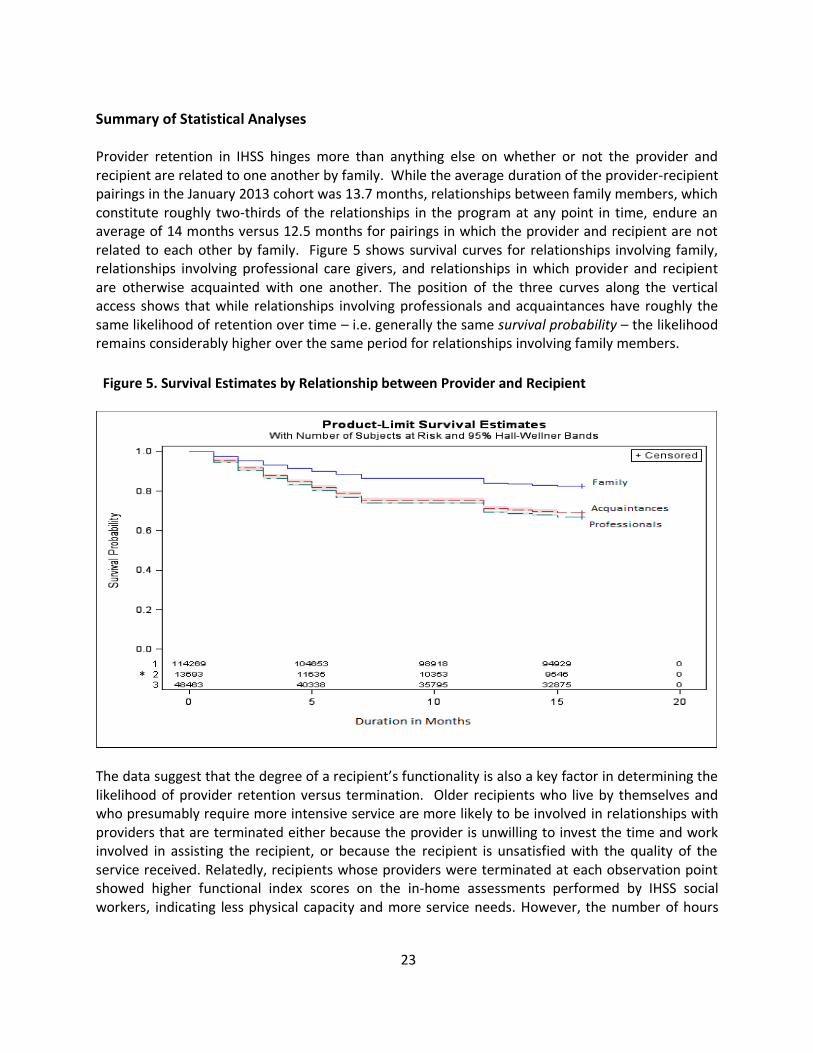
Summary of Statistical Analyses Provider retention in IHSS hinges more than anything else on whether or not the provider and recipient are related to one another by family. While the average duration of the provider-recipient pairings in the January 2013 cohort was 13.7 months, relationships between family members, which constitute roughly two-thirds of the relationships in the program at any point in time, endure an average of 14 months versus 12.5 months for pairings in which the provider and recipient are not related to each other by family. Figure 5 shows survival curves for relationships involving family, relationships involving professional care givers, and relationships in which provider and recipient are otherwise acquainted with one another. The position of the three curves along the vertical access shows that while relationships involving professionals and acquaintances have roughly the same likelihood of retention over time – i.e. generally the same survival probability – the likelihood remains considerably higher over the same period for relationships involving family members.
Figure 5. Survival Estimates by Relationship between Provider and Recipient
The data suggest that the degree of a recipient’s functionality is also a key factor in determining the likelihood of provider retention versus termination. Older recipients who live by themselves and who presumably require more intensive service are more likely to be involved in relationships with providers that are terminated either because the provider is unwilling to invest the time and work involved in assisting the recipient, or because the recipient is unsatisfied with the quality of the service received. Relatedly, recipients whose providers were terminated at each observation point showed higher functional index scores on the in-home assessments performed by IHSS social workers, indicating less physical capacity and more service needs. However, the number of hours
*
24
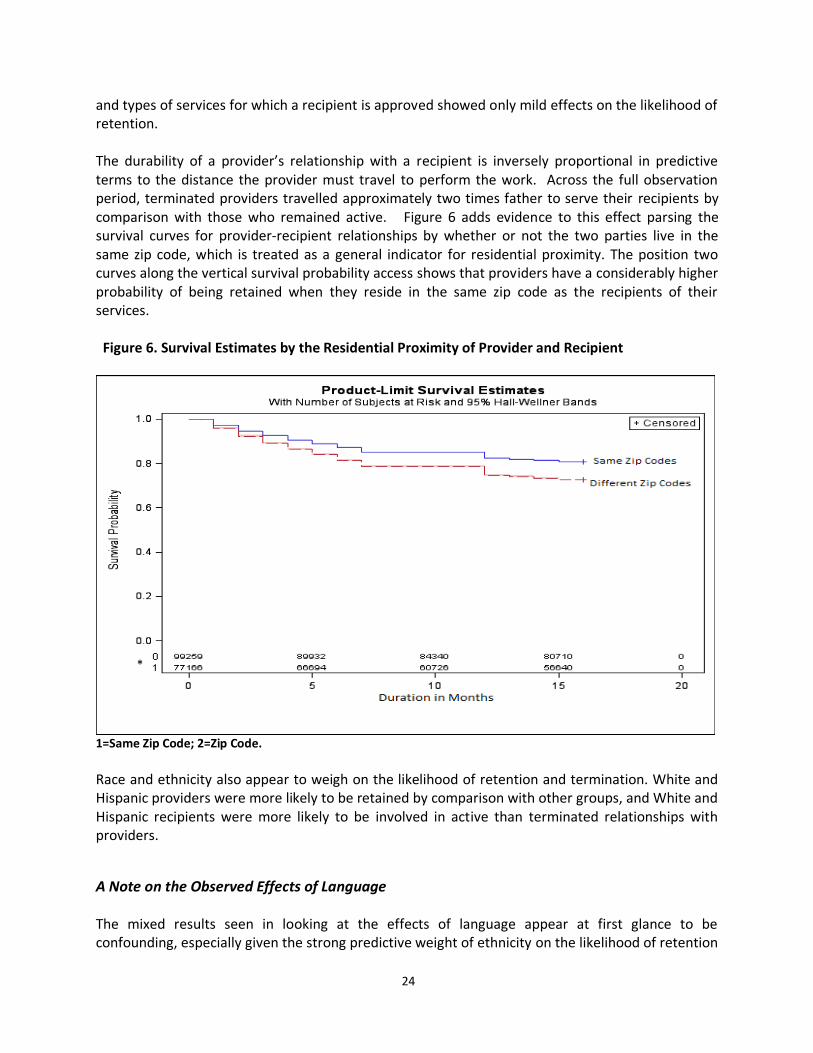
and types of services for which a recipient is approved showed only mild effects on the likelihood of retention. The durability of a provider’s relationship with a recipient is inversely proportional in predictive terms to the distance the provider must travel to perform the work. Across the full observation period, terminated providers travelled approximately two times father to serve their recipients by comparison with those who remained active. Figure 6 adds evidence to this effect parsing the survival curves for provider-recipient relationships by whether or not the two parties live in the same zip code, which is treated as a general indicator for residential proximity. The position two curves along the vertical survival probability access shows that providers have a considerably higher probability of being retained when they reside in the same zip code as the recipients of their services.
Figure 6. Survival Estimates by the Residential Proximity of Provider and Recipient
1=Same Zip Code; 2=Zip Code.
Race and ethnicity also appear to weigh on the likelihood of retention and termination. White and Hispanic providers were more likely to be retained by comparison with other groups, and White and Hispanic recipients were more likely to be involved in active than terminated relationships with providers.
A Note on the Observed Effects of Language The mixed results seen in looking at the effects of language appear at first glance to be confounding, especially given the strong predictive weight of ethnicity on the likelihood of retention
*
25
and termination. Descriptive bivariate analysis suggests that Spanish- and Armenian-speaking providers and recipients are more likely to be involved in enduring relationships than those who are English-speaking. However, the more rigorous advanced statistical modeling suggests that language does not play a significant role in the probability of retention. The explanation for this discrepancy is that language, which in the IHSS data is highly correlated with race and ethnicity, creates a technical phenomenon known as multicovilenarity, which occurs when variables are closely entwined in relation to an outcome measure. In this case, we conclude that the bivariate result showing language to be significantly associated with retention and turnover is sound, but the multivariate result indicates that language cannot be disaggregated from other variables such as race and ethnicity.
VIII. Recommendations Analysis conducted for this report suggests that some IHSS recipients in need of services the program provides may face gaps in services. Examination of a cohort consisting of those who were eligible for services but had not engaged a provider in January 2013 revealed some especially noteworthy results. After six months, 20% of the cohort recipients who remained in the program still had not engaged a provider, and close to 17% still had not engaged a provider after an additional 12 months. Roughly 1 in 5 established provider-client relationships terminate in the course a 12-month period. Relationships involving family members comprise about two-thirds of the relations in the program at any point in time. These types of relationships are more likely to endure than relationships involving either acquaintances or professional caregivers. Other factors that add to the probability of provider retention are the travel distance between provider and recipient, the age and living situation of the recipient (which is likely related to the difficulty of the work involved in providing services), and the ethnicity of both the provider and recipient. In this concluding section, we draw on the results summarized in this report to offer recommendations for policy-related measures DPSS might consider as part of an effort to enhance the services provided through IHSS. The recommendations include steps to minimize potentially harmful service gaps, as well as practices that could promote more durable provider-recipient relationships and boost Los Angeles County’s overall rate of retention.
1. Develop a programmatic mechanism to minimize risks resulting from IHSS service gaps. IHSS is targeted primarily towards low-income seniors who often require assistance with basic functionality and in attending to medical regimens. Although data in CMIPS placed limitations on the analysis of service gaps, these data nevertheless suggest that 27.3% of the eligible IHSS recipients who did not have a provider in January 2013 were still without a provider four months later. Additionally, 16.9% of the recipients from the initial group who remained eligible for services still had no provider after eight months.
To help ensure that recipients in need services are not exposed to potentially harmful service gaps, DPSS might consider developing a procedure that uses information in CMIPS II to flag and
26
communicate with recipients who are eligible for services but show no record of engaging any provider.xi
2. Use comparisons with other counties to set realistic goals for the improvement of retention rates
Provider turnover in IHSS is to some degree a structural issue stemming from both the prerogative recipients have to terminate providers for any reason and the freedom providers have to end relationships with recipients at any time. However, while these factors are built in to the program and have the effect of making provider-recipient relationships more tenuous, the problem of turnover is likely exacerbated in Los Angeles by the County’s vast and highly-diverse territorial and social geographies. Both factors (structural and geographic) raise the question of whether frequent turnover is unique to Los Angeles County or is a more general phenomenon seen in other counties as well. Since the records collected CDSS in CMIPS II capture all California counties, DPSS might consider using these data to conduct a comparative examination of turnover rates across several counties. Although the information produced in doing so would be limited insofar as no other county in California is comparable to Los Angeles in terms of geographic size and population, a comparative analysis would nevertheless provide valuable clues as to how much the turnover rate can be attributed to the way providers are procured through the program, and how much is caused by overarching demographic and geographic factors peculiar to Los Angeles County. Information of this kind would clarify the degree to which policy changes can be expected to produce their intended effects, which in turn would enable DPSS to set realistic goals for IHSS enhancements designed to improve retention rates.
3. Implement procedures to ensure recipients are aware of the option they have to hire family members as their providers.
Approximately half the provider-recipient relationships analyzed for this report are ones in which the two parties are related by family, and the evidence is unambiguous in showing that recipients are more likely to retain providers when this is the case. An important question to address is whether additional steps can be taken to heighten awareness of the option recipients have to hire family members as their providers. For instance, DPSS might consider reviewing the information IHSS social workers are tasked with communicating to recipients during in-home assessments. Additionally, printed matter describing the program and information conveyed over the telephone and internet should emphasize that family members can be providers and encourage recipients to pursue this option if they can.
4. Collect data on the most common reasons for provider terminations Steps taken to improve provider retention in IHSS should be informed by data on the person-level causes of provider terminations. More specific information should additionally be gathered on the most common reasons providers and recipients terminate their relationships so as to more thoroughly determine the types of changes that could be made at the policy level in an effort to promote retention.
27
5. Use information on individual terminations to inform subsequent referrals. For cases in which recipients do not have a ready-made provider to meet their service needs, DPSS delegates the referral process to PASC. Since these referrals presumably involve recipients and providers who are not otherwise related to one another, the evidence presented in this report provides good reason to infer that the resulting service relationships are among the most likely to be terminated. A key issue to address is therefore whether PASC deploys a process to to gather information on the reasons for individual terminations and/or the reasons individuals need new providers. If such a process already exists, does the information gathered inform subsequent referrals to the same recipient? DPSS might consider either evaluating an already-existing process or working with PASC to develop a new method for making more informed referrals.
6. Explore the possibility of incentivizing retention
DPSS might consider the development of a system of financial incentives that would reward providers for developing lasting relationships with recipients, as well as for working with acutely-challenged recipients, and for providing services in regions of the County characterized by high rates of turnover. A DPSS reviewer of an earlier draft of this report correctly notes that implementation of incentives could face difficulties since payments to providers are administered at the State level. However, depending on the priority given to problems of turnover and service gaps, DPSS could explore the possibility of working to change State mandates and, if necessary, identifying County funds to pay the costs that might be added with an incentivized system. Such a system would expand the investment providers have in recipients and in the quality of their service. In connection with this, incentives would potentially place a check on the tendency for providers to terminate relationships with recipients and gravitate to opportunities that are otherwise more favorable in terms of hours, ease of service, commute distances, etc.

28
Appendices
29
Appendix A: Two Separate Counts of Active IHSS Recipients in Each Month of the Study Period
Table A1. A Comparison of Monthly Active IHSS Recipient Counts From Two Sources
Date
Unique Monthly Counts of Active IHSS Recipients
(A)
DPSS, Caseload Characteristics
(B) Independently-Produced
Total Using CMIPS, CMIPSII
Difference (B) from (A)
Count
% CMIPS
January 2013 182,165 182,221 +56 <0.09% February 2013 181,855 181,915 +60 <0.09%
March 2013 182,400 182,466 +66 <0.09% April 2013 182,721 182,798 +77 <0.09% May 2013 183,653 183,736 +83 <0.09% June 2013 183,674 183,746 +72 <0.09% July 2013 184,752 184,809 +57 <0.09%
August 2013 185,258 185,314 +56 <0.09% Date DPSS CMIPS II Count %
January 2014 188,923 189,683 +760 4.0% February 2014 189,670 190,450 +780 4.1%
March 2014 190,047 190,838 +791 4.2% April 2014 190,999 191,852 +853 4.5%
Average Difference CMIPS +65.9 <0.09% Average Difference CMIPS II 796 4.2
30
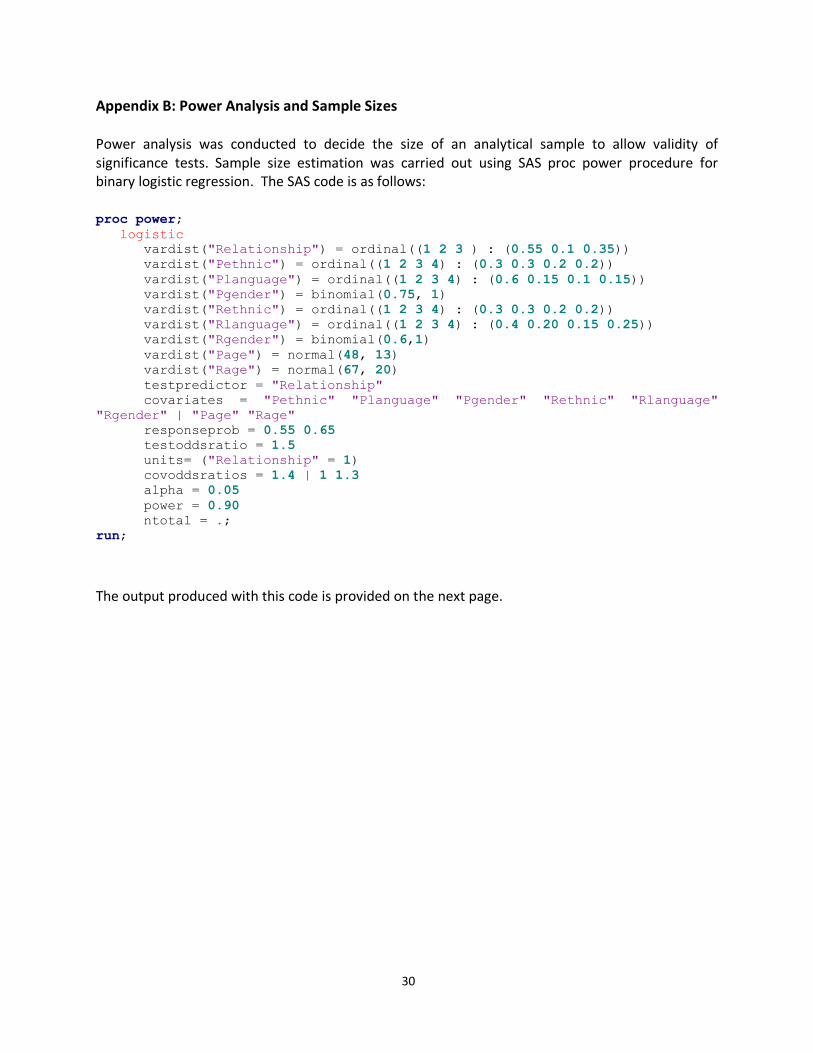
Appendix B: Power Analysis and Sample Sizes Power analysis was conducted to decide the size of an analytical sample to allow validity of significance tests. Sample size estimation was carried out using SAS proc power procedure for binary logistic regression. The SAS code is as follows: proc power;
logistic
vardist("Relationship") = ordinal((1 2 3 ) : (0.55 0.1 0.35))
vardist("Pethnic") = ordinal((1 2 3 4) : (0.3 0.3 0.2 0.2))
vardist("Planguage") = ordinal((1 2 3 4) : (0.6 0.15 0.1 0.15))
vardist("Pgender") = binomial(0.75, 1)
vardist("Rethnic") = ordinal((1 2 3 4) : (0.3 0.3 0.2 0.2))
vardist("Rlanguage") = ordinal((1 2 3 4) : (0.4 0.20 0.15 0.25))
vardist("Rgender") = binomial(0.6,1)
vardist("Page") = normal(48, 13)
vardist("Rage") = normal(67, 20)
testpredictor = "Relationship"
covariates = "Pethnic" "Planguage" "Pgender" "Rethnic" "Rlanguage"
"Rgender" | "Page" "Rage"
responseprob = 0.55 0.65
testoddsratio = 1.5
units= ("Relationship" = 1)
covoddsratios = 1.4 | 1 1.3
alpha = 0.05
power = 0.90
ntotal = .;
run;
The output produced with this code is provided on the next page.
31
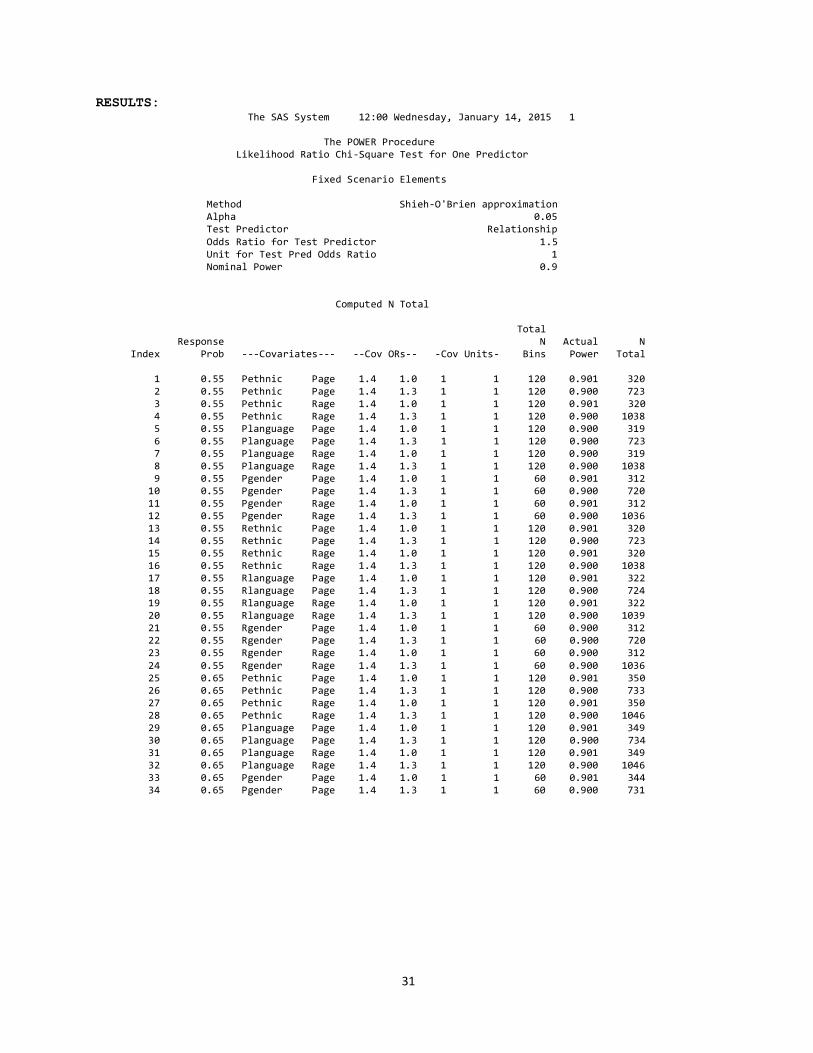
RESULTS: The SAS System 12:00 Wednesday, January 14, 2015 1 The POWER Procedure Likelihood Ratio Chi-Square Test for One Predictor Fixed Scenario Elements Method Shieh-O'Brien approximation Alpha 0.05 Test Predictor Relationship Odds Ratio for Test Predictor 1.5 Unit for Test Pred Odds Ratio 1 Nominal Power 0.9 Computed N Total Total Response N Actual N Index Prob ---Covariates--- --Cov ORs-- -Cov Units- Bins Power Total 1 0.55 Pethnic Page 1.4 1.0 1 1 120 0.901 320 2 0.55 Pethnic Page 1.4 1.3 1 1 120 0.900 723 3 0.55 Pethnic Rage 1.4 1.0 1 1 120 0.901 320 4 0.55 Pethnic Rage 1.4 1.3 1 1 120 0.900 1038 5 0.55 Planguage Page 1.4 1.0 1 1 120 0.900 319 6 0.55 Planguage Page 1.4 1.3 1 1 120 0.900 723 7 0.55 Planguage Rage 1.4 1.0 1 1 120 0.900 319 8 0.55 Planguage Rage 1.4 1.3 1 1 120 0.900 1038 9 0.55 Pgender Page 1.4 1.0 1 1 60 0.901 312 10 0.55 Pgender Page 1.4 1.3 1 1 60 0.900 720 11 0.55 Pgender Rage 1.4 1.0 1 1 60 0.901 312 12 0.55 Pgender Rage 1.4 1.3 1 1 60 0.900 1036 13 0.55 Rethnic Page 1.4 1.0 1 1 120 0.901 320 14 0.55 Rethnic Page 1.4 1.3 1 1 120 0.900 723 15 0.55 Rethnic Rage 1.4 1.0 1 1 120 0.901 320 16 0.55 Rethnic Rage 1.4 1.3 1 1 120 0.900 1038 17 0.55 Rlanguage Page 1.4 1.0 1 1 120 0.901 322 18 0.55 Rlanguage Page 1.4 1.3 1 1 120 0.900 724 19 0.55 Rlanguage Rage 1.4 1.0 1 1 120 0.901 322 20 0.55 Rlanguage Rage 1.4 1.3 1 1 120 0.900 1039 21 0.55 Rgender Page 1.4 1.0 1 1 60 0.900 312 22 0.55 Rgender Page 1.4 1.3 1 1 60 0.900 720 23 0.55 Rgender Rage 1.4 1.0 1 1 60 0.900 312 24 0.55 Rgender Rage 1.4 1.3 1 1 60 0.900 1036 25 0.65 Pethnic Page 1.4 1.0 1 1 120 0.901 350 26 0.65 Pethnic Page 1.4 1.3 1 1 120 0.900 733 27 0.65 Pethnic Rage 1.4 1.0 1 1 120 0.901 350 28 0.65 Pethnic Rage 1.4 1.3 1 1 120 0.900 1046 29 0.65 Planguage Page 1.4 1.0 1 1 120 0.901 349 30 0.65 Planguage Page 1.4 1.3 1 1 120 0.900 734 31 0.65 Planguage Rage 1.4 1.0 1 1 120 0.901 349 32 0.65 Planguage Rage 1.4 1.3 1 1 120 0.900 1046 33 0.65 Pgender Page 1.4 1.0 1 1 60 0.901 344 34 0.65 Pgender Page 1.4 1.3 1 1 60 0.900 731
32
Conclusions from Power Analysis
The distribution of our main predictor “provider-recipient relationship” and those of the covariates (e.g., providers and recipients’ demographic information) were based on our preliminary analysis. The estimated probability of a provider being terminated ranges from 0.55 to 0.65, also based on our preliminary analysis. In order to have a 90% power of detecting a very conservative odds ratio of 1.5 for every change in provider-recipient relationship from close to far (family to acquaintances and to professionals), the total required sample ranges from approximately 350 to 1050. α level was set at .05. Taking into consideration of the geo-mapping component of the study, we determined that a random sample of 1000 provider-recipient records from each of the five time points is optimal for both statistical modeling and geo-mapping.
33
Appendix C: Structural Changes in CMIPS II and their Implications for this Report CMIPS data in Tables 1, 3 and 4 are aggregated together and form the cumulative total of providers and recipients shown for August of 2013. Similarly, CMIPS II data 2014 shown in these tables are aggregated in Month 4 and form the cumulative totals shown in April of 2014. However, 2013 (CMIPS) and 2014 (CMIPS II) are not aggregated together due to data inconsistency resulting from structural changes in the files that were imposed with the transition from one data management system to the next. In CMIPS II, IHSS providers and recipients were numbered differently in the system than in CMIPS. For example, the recipient ID number variable “PRECPNUM” consists of 7 digits in CMIPS, while the same variable has 10 digits in CMIPS II. These are the key variables needed to un-duplicate records after aggregating data and establishing linkages across providers and recipients’ files. Files across the two systems can likely be reconciled, but this would necessitate a considerable investment in time to establish reliable matching rules and procedures across the two systems, such as checking SSNs to determine whether there is a systematic difference between CMIPS and CMIPS II. Since the overarching analysis of retention and turnover does not appear to require a contiguous dataset bridging 2013 and 2014, a decision was made to create separate aggregated files for 2013 and 2014.
34
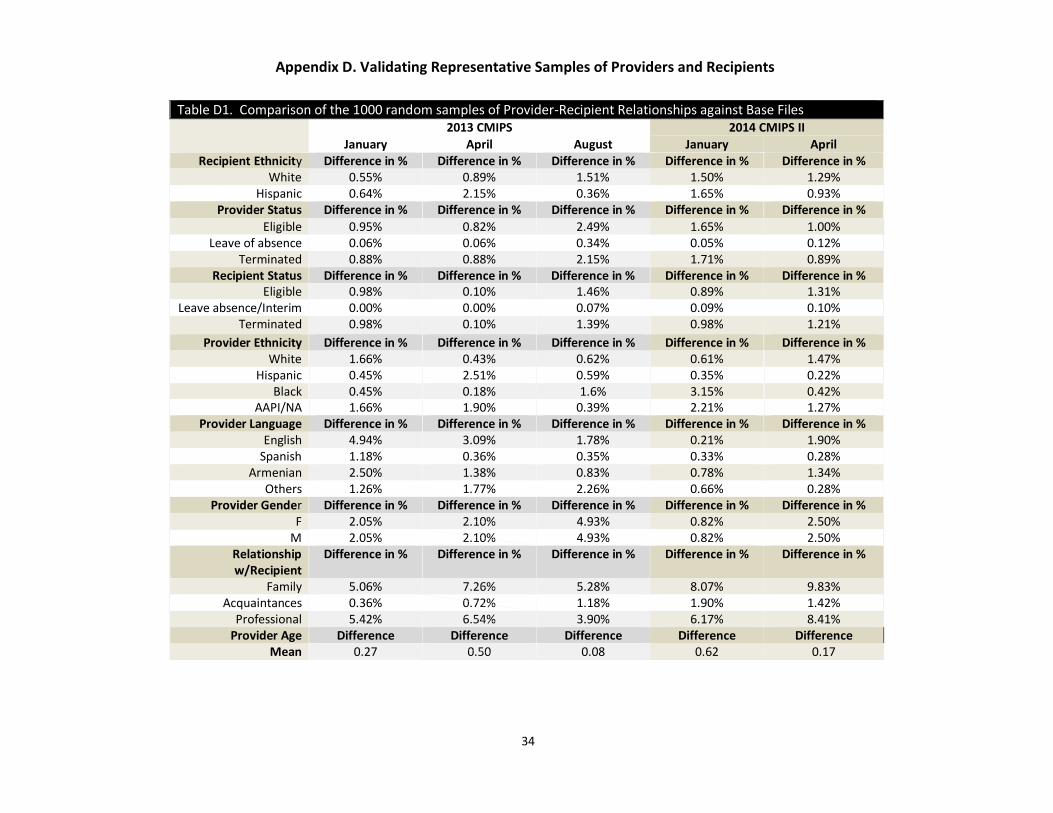
Table D1. Comparison of the 1000 random samples of Provider-Recipient Relationships against Base Files 2013 CMIPS 2014 CMIPS II
January April August January April Recipient Ethnicity Difference in % Difference in % Difference in % Difference in % Difference in %
White 0.55% 0.89% 1.51% 1.50% 1.29% Hispanic 0.64% 2.15% 0.36% 1.65% 0.93%
Provider Status Difference in % Difference in % Difference in % Difference in % Difference in %
Eligible 0.95% 0.82% 2.49% 1.65% 1.00% Leave of absence 0.06% 0.06% 0.34% 0.05% 0.12%
Terminated 0.88% 0.88% 2.15% 1.71% 0.89% Recipient Status Difference in % Difference in % Difference in % Difference in % Difference in %
Eligible 0.98% 0.10% 1.46% 0.89% 1.31% Leave absence/Interim 0.00% 0.00% 0.07% 0.09% 0.10%
Terminated 0.98% 0.10% 1.39% 0.98% 1.21%
Provider Ethnicity Difference in % Difference in % Difference in % Difference in % Difference in % White 1.66% 0.43% 0.62% 0.61% 1.47%
Hispanic 0.45% 2.51% 0.59% 0.35% 0.22% Black 0.45% 0.18% 1.6% 3.15% 0.42%
AAPI/NA 1.66% 1.90% 0.39% 2.21% 1.27% Provider Language Difference in % Difference in % Difference in % Difference in % Difference in %
English 4.94% 3.09% 1.78% 0.21% 1.90% Spanish 1.18% 0.36% 0.35% 0.33% 0.28%
Armenian 2.50% 1.38% 0.83% 0.78% 1.34% Others 1.26% 1.77% 2.26% 0.66% 0.28%
Provider Gender Difference in % Difference in % Difference in % Difference in % Difference in % F 2.05% 2.10% 4.93% 0.82% 2.50%
M 2.05% 2.10% 4.93% 0.82% 2.50% Relationship w/Recipient
Difference in % Difference in % Difference in % Difference in % Difference in %
Family 5.06% 7.26% 5.28% 8.07% 9.83% Acquaintances 0.36% 0.72% 1.18% 1.90% 1.42%
Professional 5.42% 6.54% 3.90% 6.17% 8.41% Provider Age Difference Difference Difference Difference Difference
Mean 0.27 0.50 0.08 0.62 0.17
Appendix D. Validating Representative Samples of Providers and Recipients
35
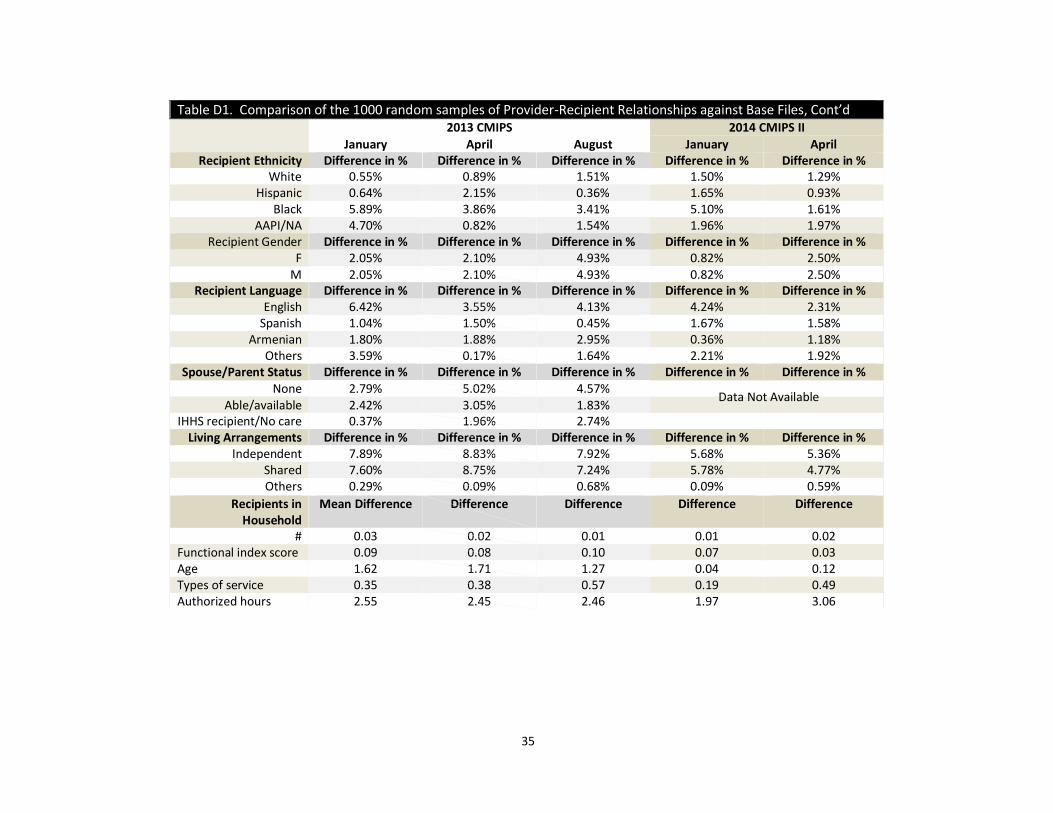
Table D1. Comparison of the 1000 random samples of Provider-Recipient Relationships against Base Files, Cont’d 2013 CMIPS 2014 CMIPS II
January April August January April Recipient Ethnicity Difference in % Difference in % Difference in % Difference in % Difference in %
White 0.55% 0.89% 1.51% 1.50% 1.29% Hispanic 0.64% 2.15% 0.36% 1.65% 0.93%
Black 5.89% 3.86% 3.41% 5.10% 1.61% AAPI/NA 4.70% 0.82% 1.54% 1.96% 1.97%
Recipient Gender Difference in % Difference in % Difference in % Difference in % Difference in % F 2.05% 2.10% 4.93% 0.82% 2.50%
M 2.05% 2.10% 4.93% 0.82% 2.50% Recipient Language Difference in % Difference in % Difference in % Difference in % Difference in %
English 6.42% 3.55% 4.13% 4.24% 2.31% Spanish 1.04% 1.50% 0.45% 1.67% 1.58%
Armenian 1.80% 1.88% 2.95% 0.36% 1.18% Others 3.59% 0.17% 1.64% 2.21% 1.92%
Spouse/Parent Status Difference in % Difference in % Difference in % Difference in % Difference in % None 2.79% 5.02% 4.57%
Able/available 2.42% 3.05% 1.83% IHHS recipient/No care 0.37% 1.96% 2.74%
Living Arrangements Difference in % Difference in % Difference in % Difference in % Difference in % Independent 7.89% 8.83% 7.92% 5.68% 5.36%
Shared 7.60% 8.75% 7.24% 5.78% 4.77% Others 0.29% 0.09% 0.68% 0.09% 0.59%
Recipients in Household
Mean Difference Difference Difference Difference Difference
# 0.03 0.02 0.01 0.01 0.02 Functional index score 0.09 0.08 0.10 0.07 0.03 Age 1.62 1.71 1.27 0.04 0.12 Types of service 0.35 0.38 0.57 0.19 0.49 Authorized hours 2.55 2.45 2.46 1.97 3.06
Data Not Available
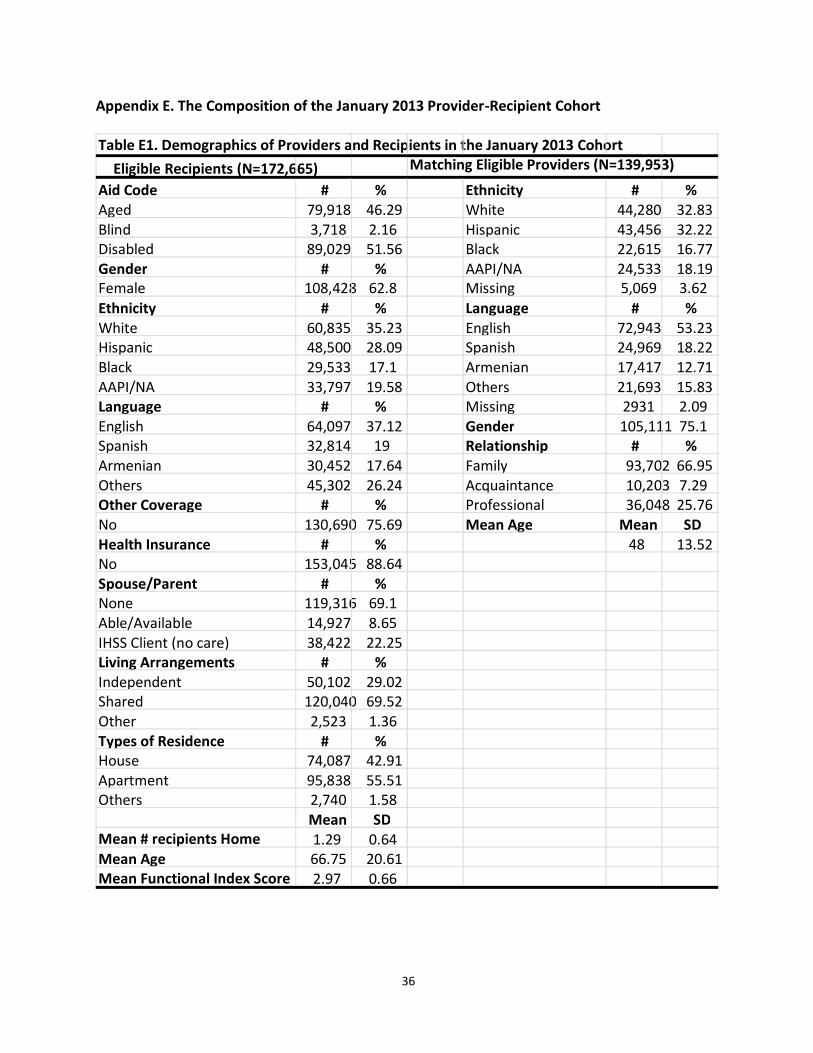
36
Appendix E. The Composition of the January 2013 Provider-Recipient Cohort
Table E1. Demographics of Providers and Recipients in the January 2013 Cohort
Eligible Recipients (N=172,665) Matching Eligible Providers (N=139,953)
Aid Code # % Ethnicity # %
Aged 79,918 46.29 White 44,280 32.83
Blind 3,718 2.16 Hispanic 43,456 32.22
Disabled 89,029 51.56 Black 22,615 16.77
Gender # % AAPI/NA 24,533 18.19
Female 108,428 62.8 Missing 5,069 3.62
Ethnicity # % Language # %
White 60,835 35.23 English 72,943 53.23
Hispanic 48,500 28.09 Spanish 24,969 18.22
Black 29,533 17.1 Armenian 17,417 12.71
AAPI/NA 33,797 19.58 Others 21,693 15.83
Language # % Missing 2931 2.09
English 64,097 37.12 Gender 105,111 75.1
Spanish 32,814 19 Relationship # %
Armenian 30,452 17.64 Family 93,702 66.95
Others 45,302 26.24 Acquaintance 10,203 7.29
Other Coverage # % Professional 36,048 25.76
No 130,690 75.69 Mean Age Mean SD
Health Insurance # % 48 13.52
No 153,045 88.64
Spouse/Parent # %
None 119,316 69.1
Able/Available 14,927 8.65
IHSS Client (no care) 38,422 22.25
Living Arrangements # %
Independent 50,102 29.02
Shared 120,040 69.52
Other 2,523 1.36
Types of Residence # %
House 74,087 42.91
Apartment 95,838 55.51
Others 2,740 1.58
Mean SD
Mean # recipients Home 1.29 0.64
Mean Age 66.75 20.61
Mean Functional Index Score 2.97 0.66

37
The January 2013 cohort of provider recipient pairings was constructed by selecting recipients whose
statuses were “eligible” and their matching “eligible” providers at January 2013 (unique recipients
n=172,665, unique providers n=139,953). Since an IHSS recipient can have multiple providers and vice
versa, the final matched file contains 176,425 unique recipient-provider pairs.
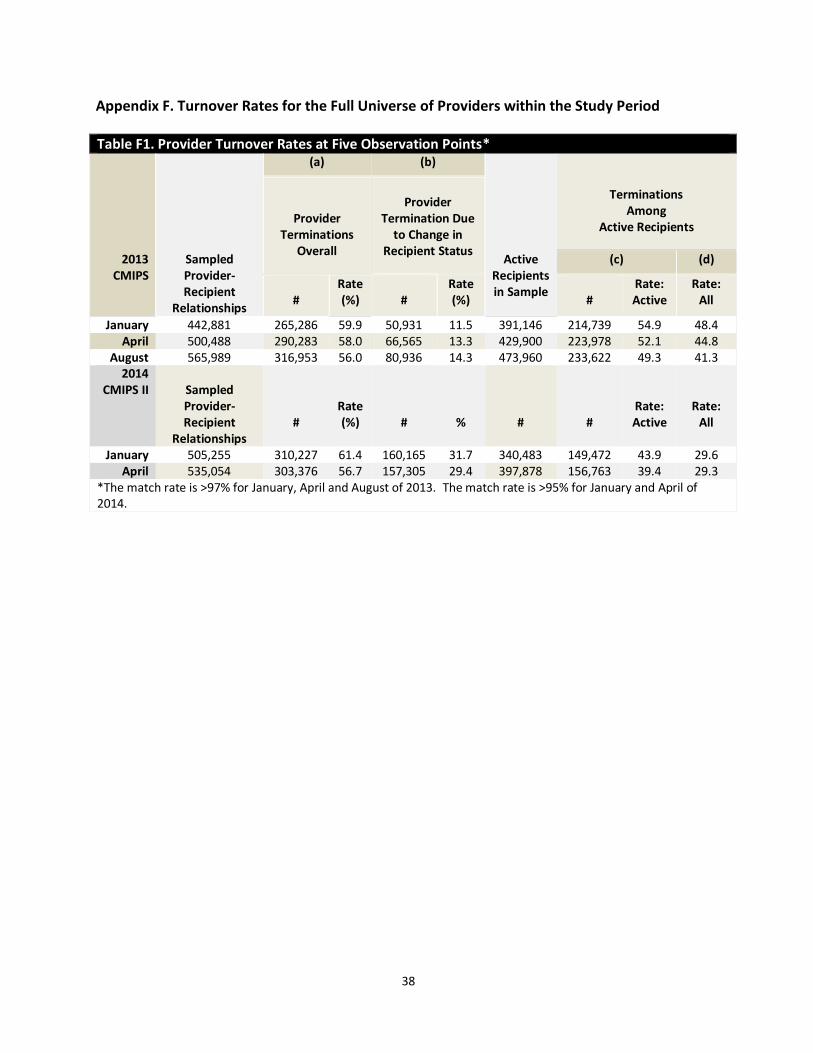
38
Appendix F. Turnover Rates for the Full Universe of Providers within the Study Period
Table F1. Provider Turnover Rates at Five Observation Points*
2013 CMIPS
Sampled Provider-Recipient
Relationships
(a) (b)
Active
Recipients in Sample
Terminations Among
Active Recipients
Provider Terminations
Overall
Provider
Termination Due to Change in
Recipient Status (c) (d)
#
Rate (%)
#
Rate (%)
#
Rate: Active
Rate: All
January 442,881 265,286 59.9 50,931 11.5 391,146 214,739 54.9 48.4 April 500,488 290,283 58.0 66,565 13.3 429,900 223,978 52.1 44.8
August 565,989 316,953 56.0 80,936 14.3 473,960 233,622 49.3 41.3 2014
CMIPS II
Sampled Provider-Recipient
Relationships
#
Rate (%)
#
%
#
#
Rate: Active
Rate: All
January 505,255 310,227 61.4 160,165 31.7 340,483 149,472 43.9 29.6 April 535,054 303,376 56.7 157,305 29.4 397,878 156,763 39.4 29.3
*The match rate is >97% for January, April and August of 2013. The match rate is >95% for January and April of 2014.
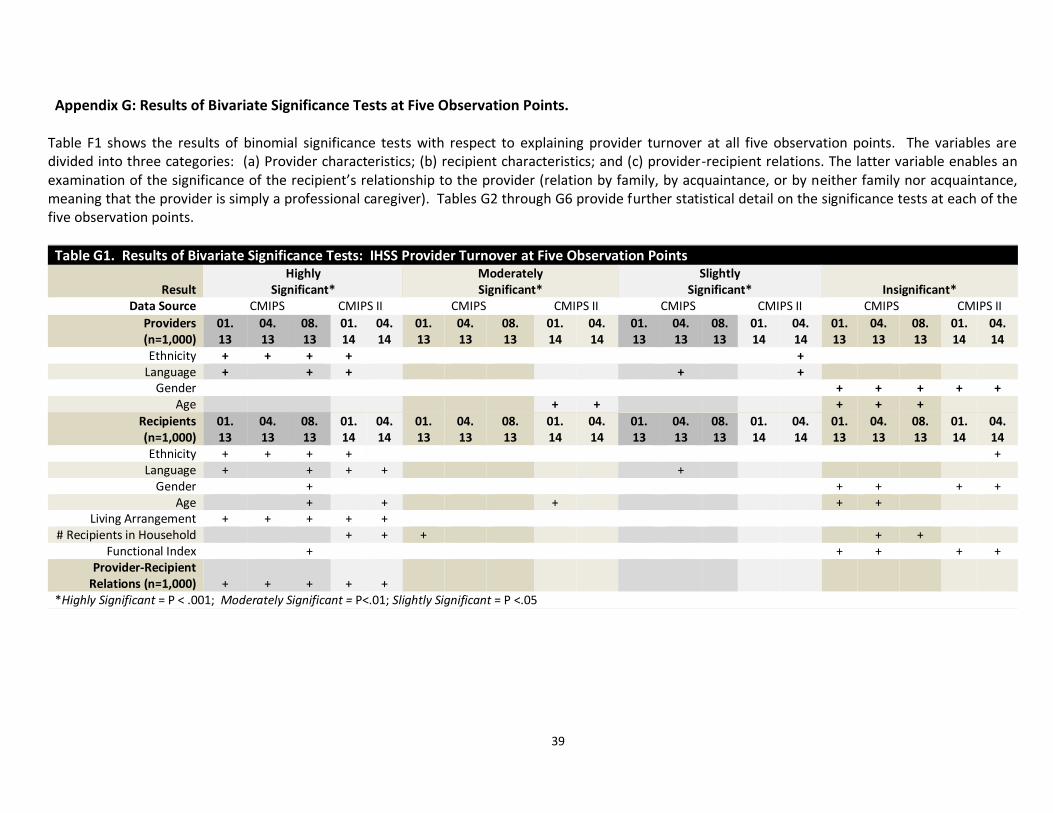
39
Appendix G: Results of Bivariate Significance Tests at Five Observation Points. Table F1 shows the results of binomial significance tests with respect to explaining provider turnover at all five observation points. The variables are divided into three categories: (a) Provider characteristics; (b) recipient characteristics; and (c) provider-recipient relations. The latter variable enables an examination of the significance of the recipient’s relationship to the provider (relation by family, by acquaintance, or by neither family nor acquaintance, meaning that the provider is simply a professional caregiver). Tables G2 through G6 provide further statistical detail on the significance tests at each of the five observation points.
Table G1. Results of Bivariate Significance Tests: IHSS Provider Turnover at Five Observation Points
Result Highly
Significant* Moderately Significant*
Slightly Significant*
Insignificant*
Data Source CMIPS CMIPS II CMIPS CMIPS II CMIPS CMIPS II CMIPS CMIPS II
Providers (n=1,000)
01. 13
04. 13
08. 13
01. 14
04. 14
01. 13
04. 13
08. 13
01. 14
04. 14
01. 13
04. 13
08. 13
01. 14
04. 14
01. 13
04. 13
08. 13
01. 14
04. 14
Ethnicity + + + + + Language + + + + +
Gender + + + + + Age + + + + +
Recipients (n=1,000)
01. 13
04. 13
08. 13
01. 14
04. 14
01. 13
04. 13
08. 13
01. 14
04. 14
01. 13
04. 13
08. 13
01. 14
04. 14
01. 13
04. 13
08. 13
01. 14
04. 14
Ethnicity + + + + + Language + + + + +
Gender + + + + + Age + + + + +
Living Arrangement + + + + + # Recipients in Household + + + + +
Functional Index + + + + + Provider-Recipient
Relations (n=1,000)
+
+
+
+
+
*Highly Significant = P < .001; Moderately Significant = P<.01; Slightly Significant = P <.05
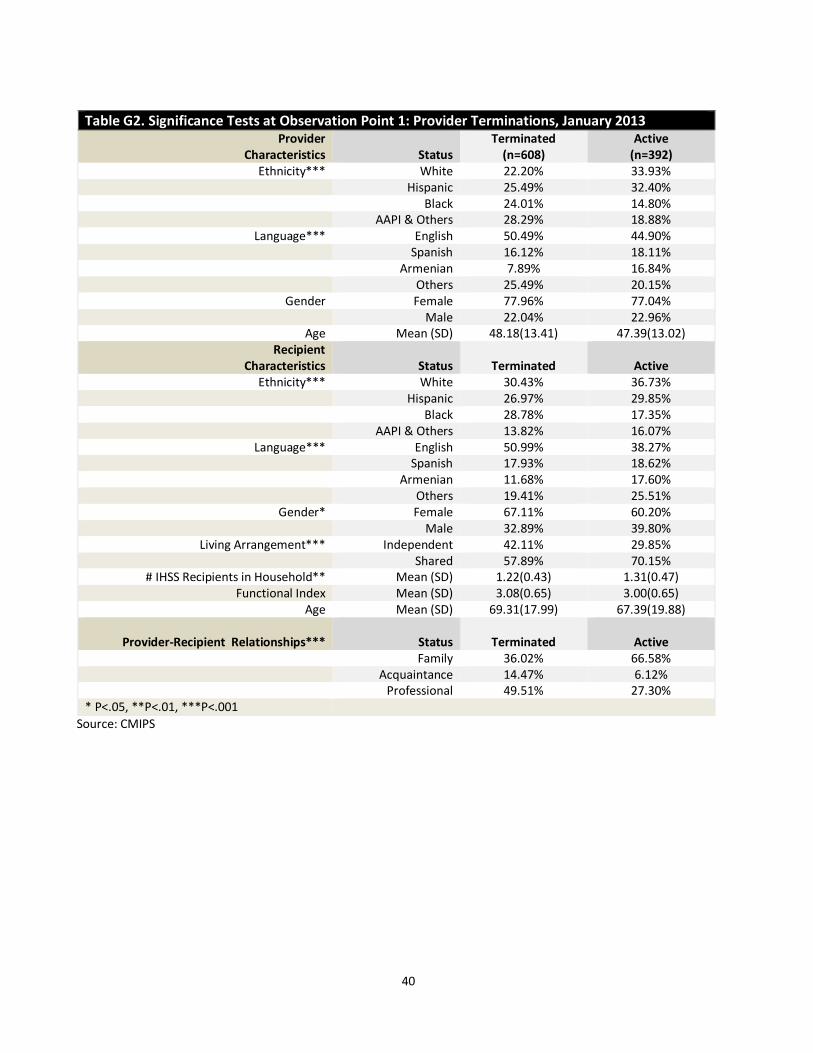
40
Table G2. Significance Tests at Observation Point 1: Provider Terminations, January 2013 Provider
Characteristics
Status Terminated
(n=608) Active
(n=392) Ethnicity*** White 22.20% 33.93%
Hispanic 25.49% 32.40% Black 24.01% 14.80% AAPI & Others 28.29% 18.88%
Language*** English 50.49% 44.90% Spanish 16.12% 18.11% Armenian 7.89% 16.84% Others 25.49% 20.15%
Gender Female 77.96% 77.04% Male 22.04% 22.96%
Age Mean (SD) 48.18(13.41) 47.39(13.02) Recipient
Characteristics
Status
Terminated
Active Ethnicity*** White 30.43% 36.73%
Hispanic 26.97% 29.85% Black 28.78% 17.35% AAPI & Others 13.82% 16.07%
Language*** English 50.99% 38.27% Spanish 17.93% 18.62%
Armenian 11.68% 17.60% Others 19.41% 25.51%
Gender* Female 67.11% 60.20% Male 32.89% 39.80%
Living Arrangement*** Independent 42.11% 29.85% Shared 57.89% 70.15%
# IHSS Recipients in Household** Mean (SD) 1.22(0.43) 1.31(0.47) Functional Index Mean (SD) 3.08(0.65) 3.00(0.65)
Age Mean (SD) 69.31(17.99) 67.39(19.88)
Provider-Recipient Relationships***
Status
Terminated
Active Family 36.02% 66.58% Acquaintance 14.47% 6.12% Professional 49.51% 27.30% * P<.05, **P<.01, ***P<.001
Source: CMIPS
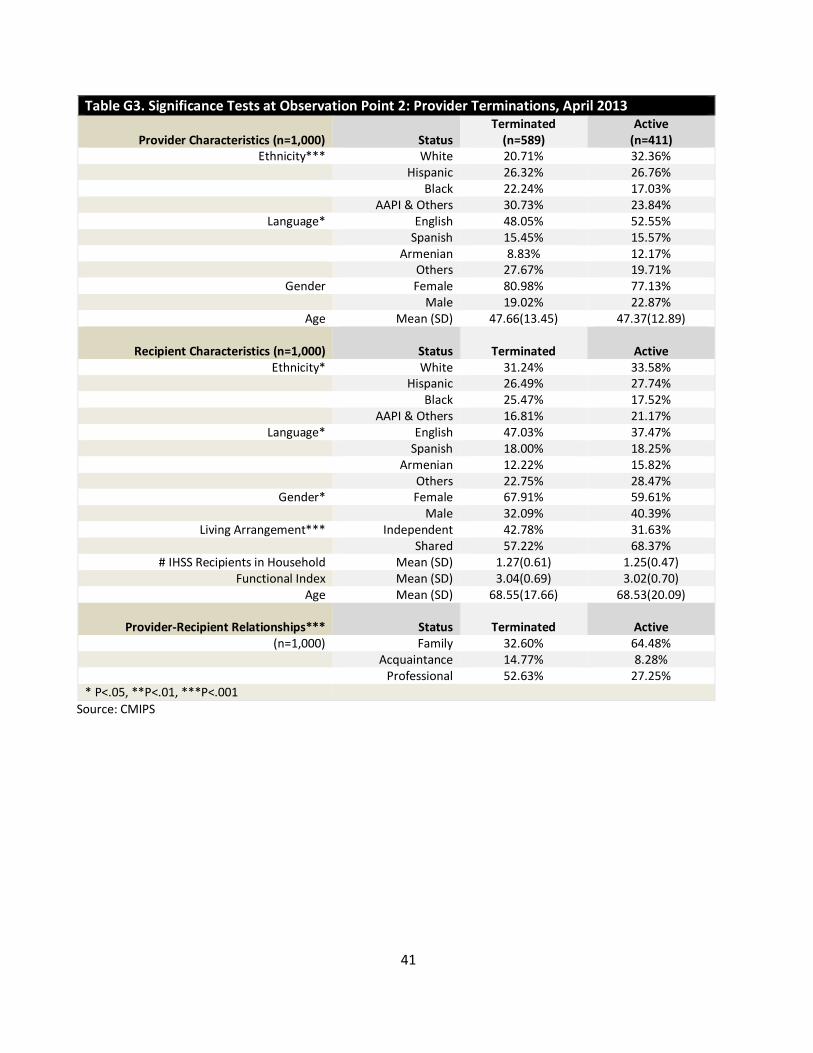
41
Table G3. Significance Tests at Observation Point 2: Provider Terminations, April 2013
Provider Characteristics (n=1,000)
Status Terminated
(n=589) Active
(n=411) Ethnicity*** White 20.71% 32.36%
Hispanic 26.32% 26.76% Black 22.24% 17.03% AAPI & Others 30.73% 23.84%
Language* English 48.05% 52.55% Spanish 15.45% 15.57% Armenian 8.83% 12.17% Others 27.67% 19.71%
Gender Female 80.98% 77.13% Male 19.02% 22.87%
Age Mean (SD) 47.66(13.45) 47.37(12.89)
Recipient Characteristics (n=1,000)
Status
Terminated
Active Ethnicity* White 31.24% 33.58%
Hispanic 26.49% 27.74% Black 25.47% 17.52% AAPI & Others 16.81% 21.17%
Language* English 47.03% 37.47% Spanish 18.00% 18.25%
Armenian 12.22% 15.82% Others 22.75% 28.47%
Gender* Female 67.91% 59.61% Male 32.09% 40.39%
Living Arrangement*** Independent 42.78% 31.63% Shared 57.22% 68.37%
# IHSS Recipients in Household Mean (SD) 1.27(0.61) 1.25(0.47) Functional Index Mean (SD) 3.04(0.69) 3.02(0.70)
Age Mean (SD) 68.55(17.66) 68.53(20.09)
Provider-Recipient Relationships***
Status
Terminated
Active (n=1,000) Family 32.60% 64.48%
Acquaintance 14.77% 8.28% Professional 52.63% 27.25% * P<.05, **P<.01, ***P<.001
Source: CMIPS
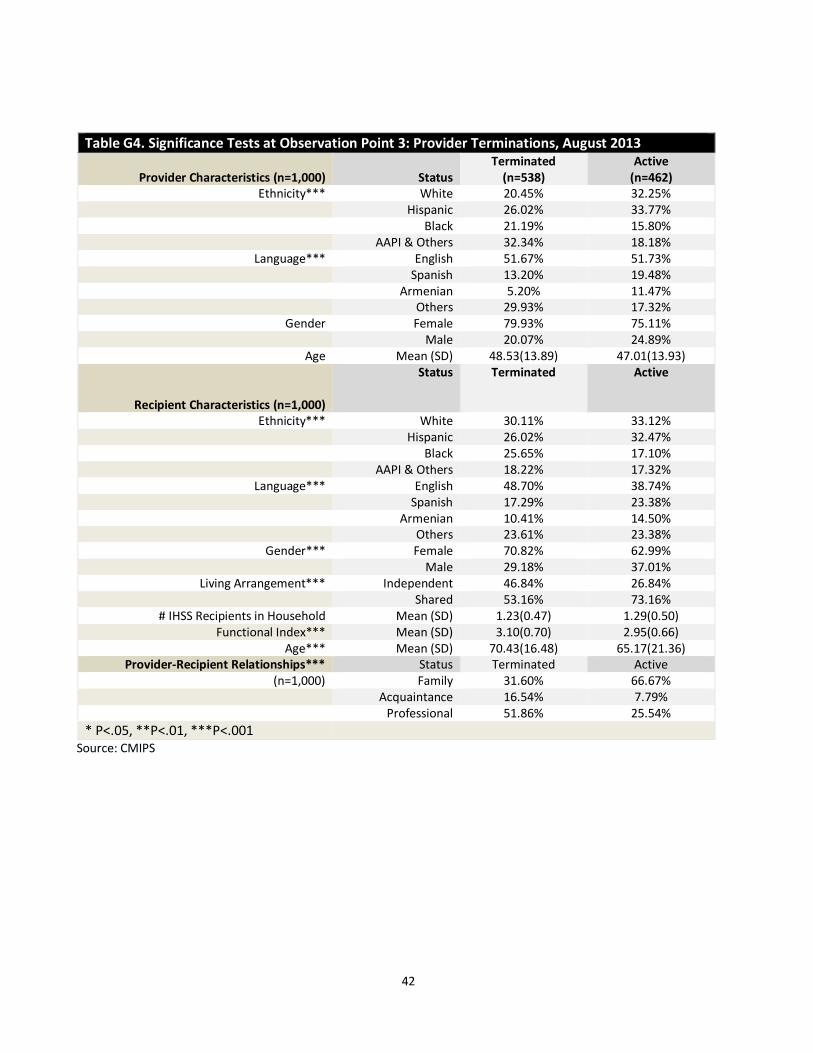
42
Table G4. Significance Tests at Observation Point 3: Provider Terminations, August 2013
Provider Characteristics (n=1,000)
Status Terminated
(n=538) Active
(n=462) Ethnicity*** White 20.45% 32.25%
Hispanic 26.02% 33.77% Black 21.19% 15.80% AAPI & Others 32.34% 18.18%
Language*** English 51.67% 51.73% Spanish 13.20% 19.48% Armenian 5.20% 11.47% Others 29.93% 17.32%
Gender Female 79.93% 75.11% Male 20.07% 24.89%
Age Mean (SD) 48.53(13.89) 47.01(13.93)
Recipient Characteristics (n=1,000)
Status Terminated Active
Ethnicity*** White 30.11% 33.12% Hispanic 26.02% 32.47% Black 25.65% 17.10% AAPI & Others 18.22% 17.32%
Language*** English 48.70% 38.74% Spanish 17.29% 23.38%
Armenian 10.41% 14.50% Others 23.61% 23.38%
Gender*** Female 70.82% 62.99% Male 29.18% 37.01%
Living Arrangement*** Independent 46.84% 26.84% Shared 53.16% 73.16%
# IHSS Recipients in Household Mean (SD) 1.23(0.47) 1.29(0.50) Functional Index*** Mean (SD) 3.10(0.70) 2.95(0.66)
Age*** Mean (SD) 70.43(16.48) 65.17(21.36) Provider-Recipient Relationships*** Status Terminated Active
(n=1,000) Family 31.60% 66.67% Acquaintance 16.54% 7.79% Professional 51.86% 25.54%
* P<.05, **P<.01, ***P<.001
Source: CMIPS
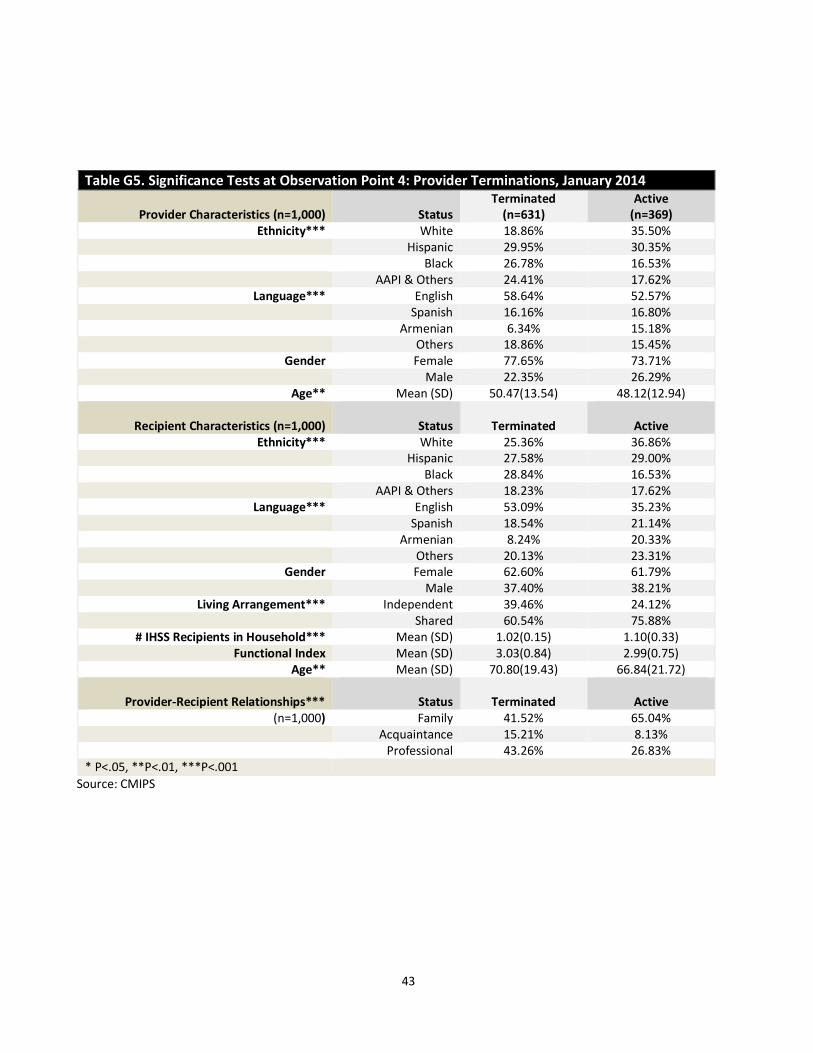
43
Table G5. Significance Tests at Observation Point 4: Provider Terminations, January 2014
Provider Characteristics (n=1,000)
Status Terminated
(n=631) Active
(n=369) Ethnicity*** White 18.86% 35.50%
Hispanic 29.95% 30.35% Black 26.78% 16.53% AAPI & Others 24.41% 17.62%
Language*** English 58.64% 52.57% Spanish 16.16% 16.80% Armenian 6.34% 15.18% Others 18.86% 15.45%
Gender Female 77.65% 73.71% Male 22.35% 26.29%
Age** Mean (SD) 50.47(13.54) 48.12(12.94)
Recipient Characteristics (n=1,000)
Status
Terminated
Active Ethnicity*** White 25.36% 36.86%
Hispanic 27.58% 29.00% Black 28.84% 16.53% AAPI & Others 18.23% 17.62%
Language*** English 53.09% 35.23% Spanish 18.54% 21.14%
Armenian 8.24% 20.33% Others 20.13% 23.31%
Gender Female 62.60% 61.79% Male 37.40% 38.21%
Living Arrangement*** Independent 39.46% 24.12% Shared 60.54% 75.88%
# IHSS Recipients in Household*** Mean (SD) 1.02(0.15) 1.10(0.33) Functional Index Mean (SD) 3.03(0.84) 2.99(0.75)
Age** Mean (SD) 70.80(19.43) 66.84(21.72)
Provider-Recipient Relationships***
Status
Terminated
Active (n=1,000) Family 41.52% 65.04%
Acquaintance 15.21% 8.13% Professional 43.26% 26.83% * P<.05, **P<.01, ***P<.001
Source: CMIPS
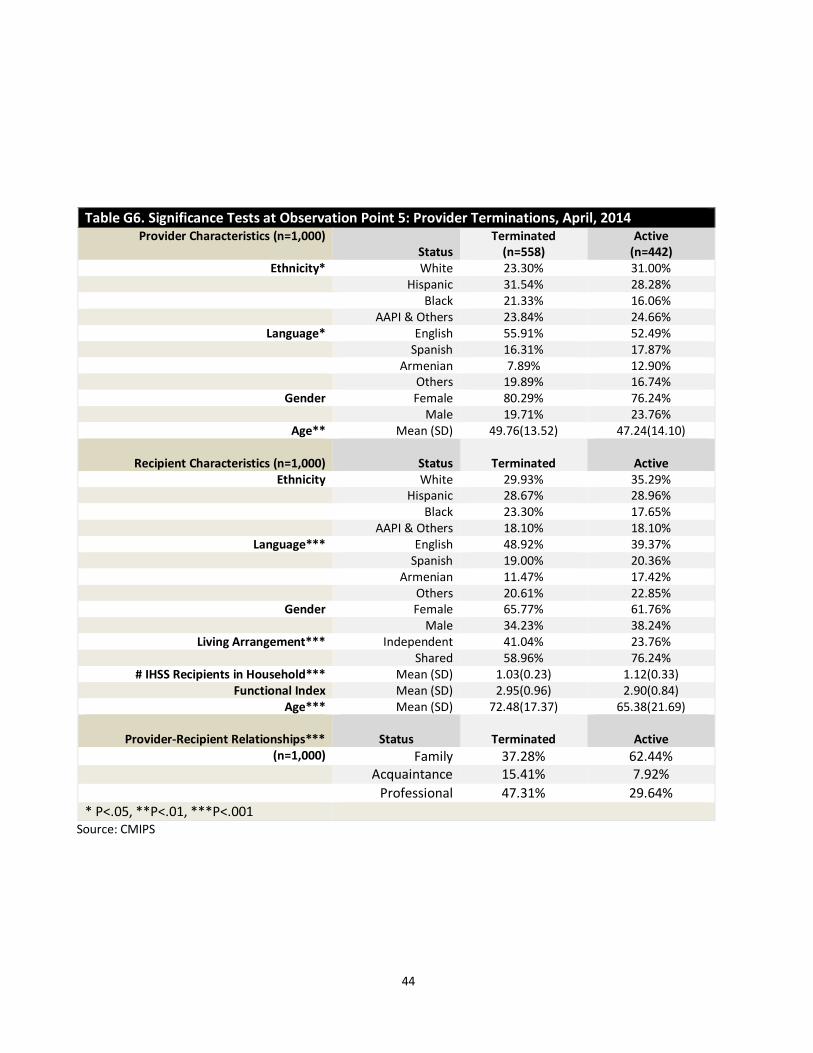
44
Table G6. Significance Tests at Observation Point 5: Provider Terminations, April, 2014 Provider Characteristics (n=1,000)
Status Terminated
(n=558) Active
(n=442) Ethnicity* White 23.30% 31.00%
Hispanic 31.54% 28.28% Black 21.33% 16.06% AAPI & Others 23.84% 24.66%
Language* English 55.91% 52.49% Spanish 16.31% 17.87% Armenian 7.89% 12.90% Others 19.89% 16.74%
Gender Female 80.29% 76.24% Male 19.71% 23.76%
Age** Mean (SD) 49.76(13.52) 47.24(14.10)
Recipient Characteristics (n=1,000)
Status
Terminated
Active Ethnicity White 29.93% 35.29%
Hispanic 28.67% 28.96% Black 23.30% 17.65% AAPI & Others 18.10% 18.10%
Language*** English 48.92% 39.37% Spanish 19.00% 20.36%
Armenian 11.47% 17.42% Others 20.61% 22.85%
Gender Female 65.77% 61.76% Male 34.23% 38.24%
Living Arrangement*** Independent 41.04% 23.76% Shared 58.96% 76.24%
# IHSS Recipients in Household*** Mean (SD) 1.03(0.23) 1.12(0.33) Functional Index Mean (SD) 2.95(0.96) 2.90(0.84)
Age*** Mean (SD) 72.48(17.37) 65.38(21.69)
Provider-Recipient Relationships***
Status
Terminated
Active (n=1,000) Family 37.28% 62.44%
Acquaintance 15.41% 7.92%
Professional 47.31% 29.64%
* P<.05, **P<.01, ***P<.001
Source: CMIPS
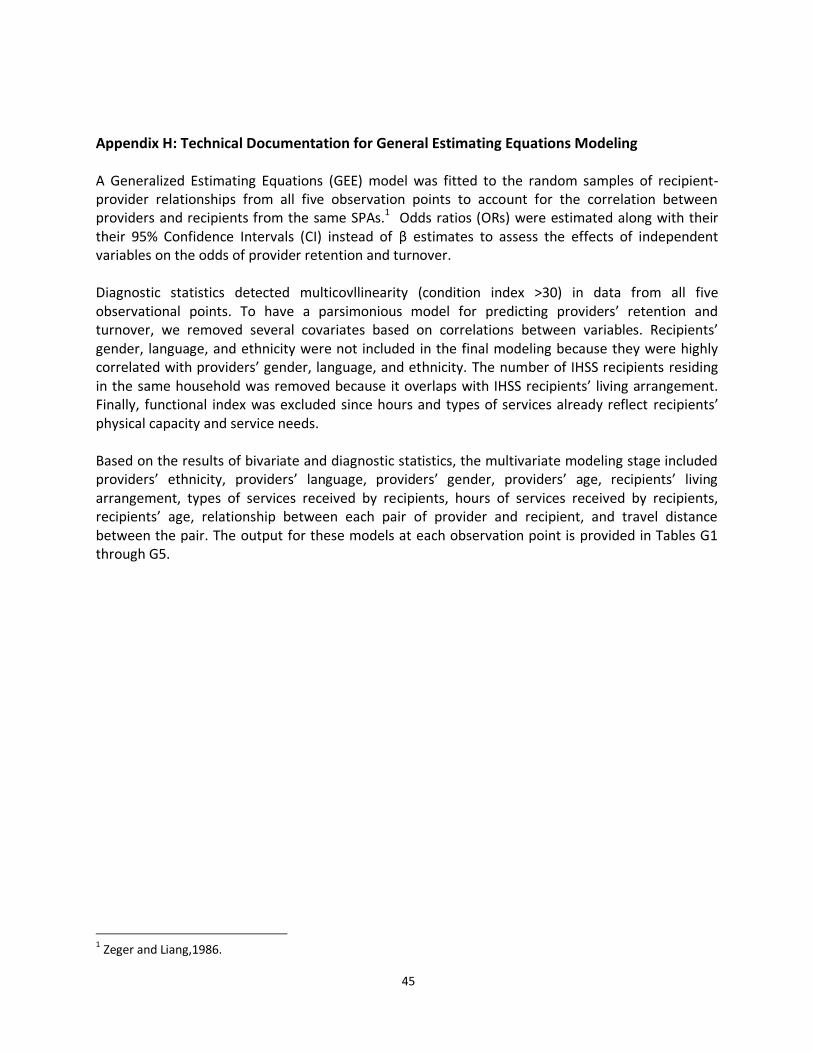
45
Appendix H: Technical Documentation for General Estimating Equations Modeling A Generalized Estimating Equations (GEE) model was fitted to the random samples of recipient-provider relationships from all five observation points to account for the correlation between providers and recipients from the same SPAs.1 Odds ratios (ORs) were estimated along with their their 95% Confidence Intervals (CI) instead of β estimates to assess the effects of independent variables on the odds of provider retention and turnover. Diagnostic statistics detected multicovllinearity (condition index >30) in data from all five observational points. To have a parsimonious model for predicting providers’ retention and turnover, we removed several covariates based on correlations between variables. Recipients’ gender, language, and ethnicity were not included in the final modeling because they were highly correlated with providers’ gender, language, and ethnicity. The number of IHSS recipients residing in the same household was removed because it overlaps with IHSS recipients’ living arrangement. Finally, functional index was excluded since hours and types of services already reflect recipients’ physical capacity and service needs. Based on the results of bivariate and diagnostic statistics, the multivariate modeling stage included providers’ ethnicity, providers’ language, providers’ gender, providers’ age, recipients’ living arrangement, types of services received by recipients, hours of services received by recipients, recipients’ age, relationship between each pair of provider and recipient, and travel distance between the pair. The output for these models at each observation point is provided in Tables G1 through G5.
1 Zeger and Liang,1986.
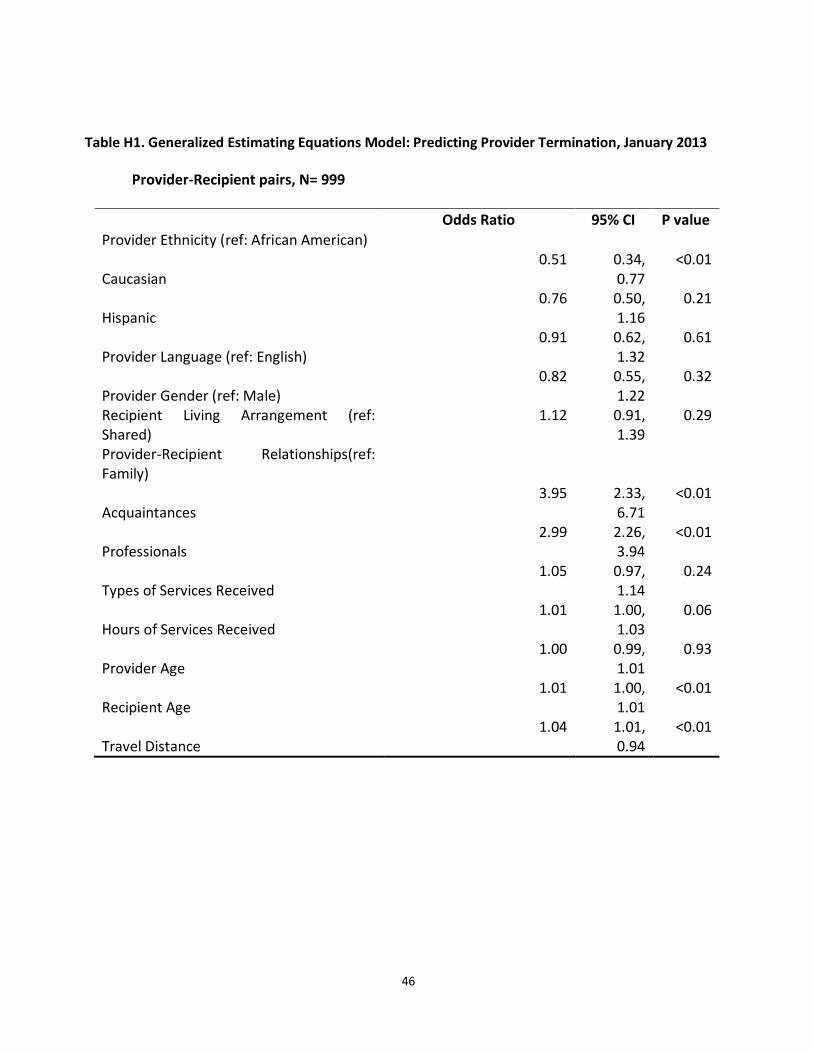
46
Table H1. Generalized Estimating Equations Model: Predicting Provider Termination, January 2013
Provider-Recipient pairs, N= 999
Odds Ratio 95% CI P value
Provider Ethnicity (ref: African American)
Caucasian 0.51 0.34,
0.77 <0.01
Hispanic 0.76 0.50,
1.16 0.21
Provider Language (ref: English) 0.91 0.62,
1.32 0.61
Provider Gender (ref: Male) 0.82 0.55,
1.22 0.32
Recipient Living Arrangement (ref: Shared)
1.12 0.91, 1.39
0.29
Provider-Recipient Relationships(ref: Family)
Acquaintances 3.95 2.33,
6.71 <0.01
Professionals 2.99 2.26,
3.94 <0.01
Types of Services Received 1.05 0.97,
1.14 0.24
Hours of Services Received 1.01 1.00,
1.03 0.06
Provider Age 1.00 0.99,
1.01 0.93
Recipient Age 1.01 1.00,
1.01 <0.01
Travel Distance 1.04 1.01,
0.94 <0.01
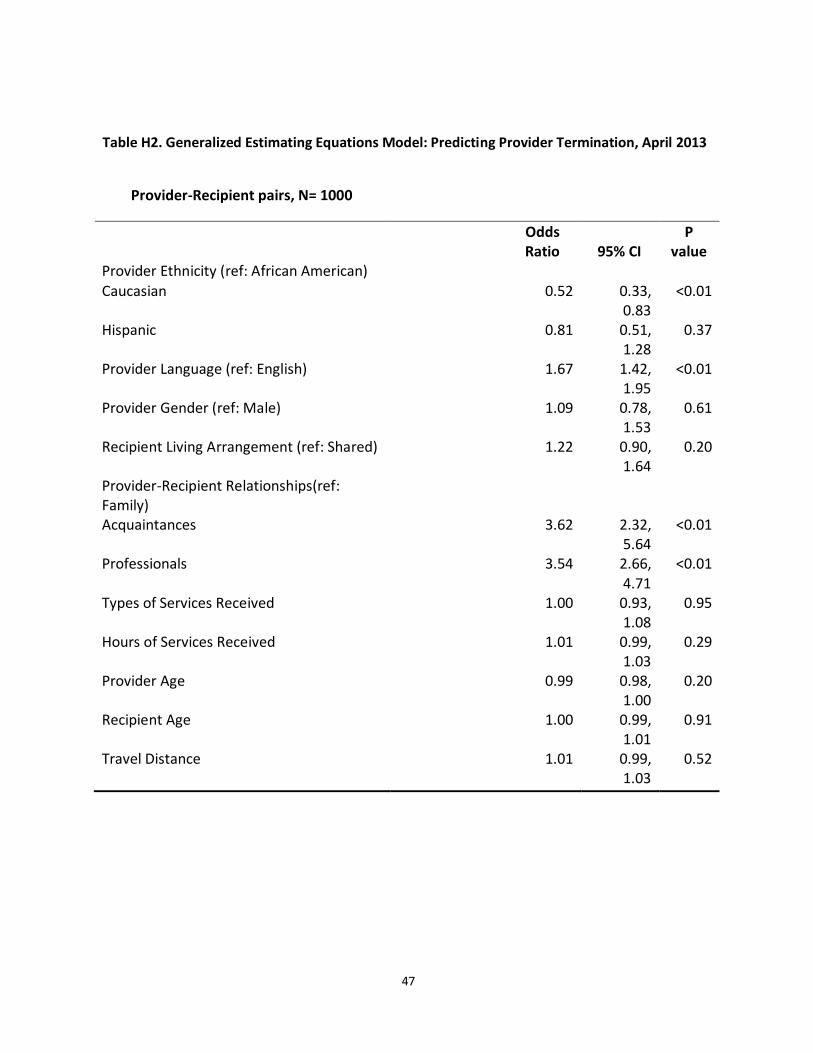
47
Table H2. Generalized Estimating Equations Model: Predicting Provider Termination, April 2013
Provider-Recipient pairs, N= 1000
Odds Ratio 95% CI
P value
Provider Ethnicity (ref: African American)
Caucasian 0.52 0.33, 0.83
<0.01
Hispanic 0.81 0.51, 1.28
0.37
Provider Language (ref: English) 1.67 1.42, 1.95
<0.01
Provider Gender (ref: Male) 1.09 0.78, 1.53
0.61
Recipient Living Arrangement (ref: Shared) 1.22 0.90, 1.64
0.20
Provider-Recipient Relationships(ref: Family)
Acquaintances 3.62 2.32, 5.64
<0.01
Professionals 3.54 2.66, 4.71
<0.01
Types of Services Received 1.00 0.93, 1.08
0.95
Hours of Services Received 1.01 0.99, 1.03
0.29
Provider Age 0.99 0.98, 1.00
0.20
Recipient Age 1.00 0.99, 1.01
0.91
Travel Distance 1.01 0.99, 1.03
0.52
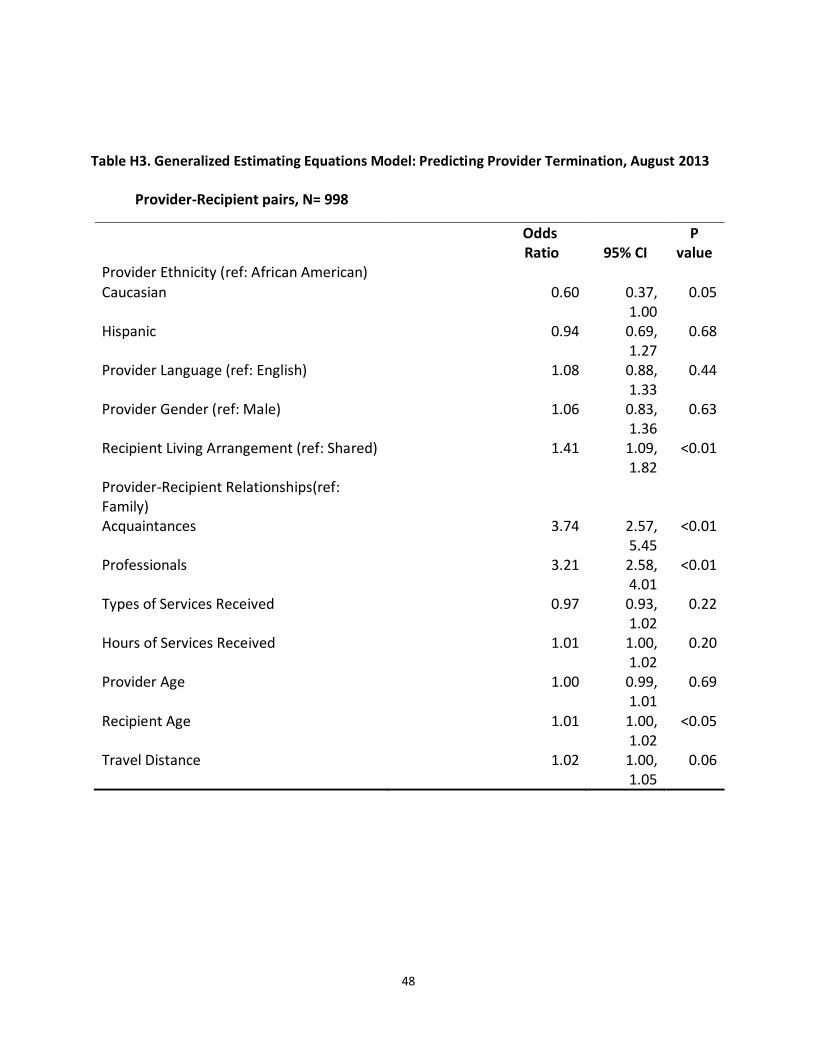
48
Table H3. Generalized Estimating Equations Model: Predicting Provider Termination, August 2013
Provider-Recipient pairs, N= 998
Odds Ratio 95% CI
P value
Provider Ethnicity (ref: African American)
Caucasian 0.60 0.37, 1.00
0.05
Hispanic 0.94 0.69, 1.27
0.68
Provider Language (ref: English) 1.08 0.88, 1.33
0.44
Provider Gender (ref: Male) 1.06 0.83, 1.36
0.63
Recipient Living Arrangement (ref: Shared) 1.41 1.09, 1.82
<0.01
Provider-Recipient Relationships(ref: Family)
Acquaintances 3.74 2.57, 5.45
<0.01
Professionals 3.21 2.58, 4.01
<0.01
Types of Services Received 0.97 0.93, 1.02
0.22
Hours of Services Received 1.01 1.00, 1.02
0.20
Provider Age 1.00 0.99, 1.01
0.69
Recipient Age 1.01 1.00, 1.02
<0.05
Travel Distance 1.02 1.00, 1.05
0.06
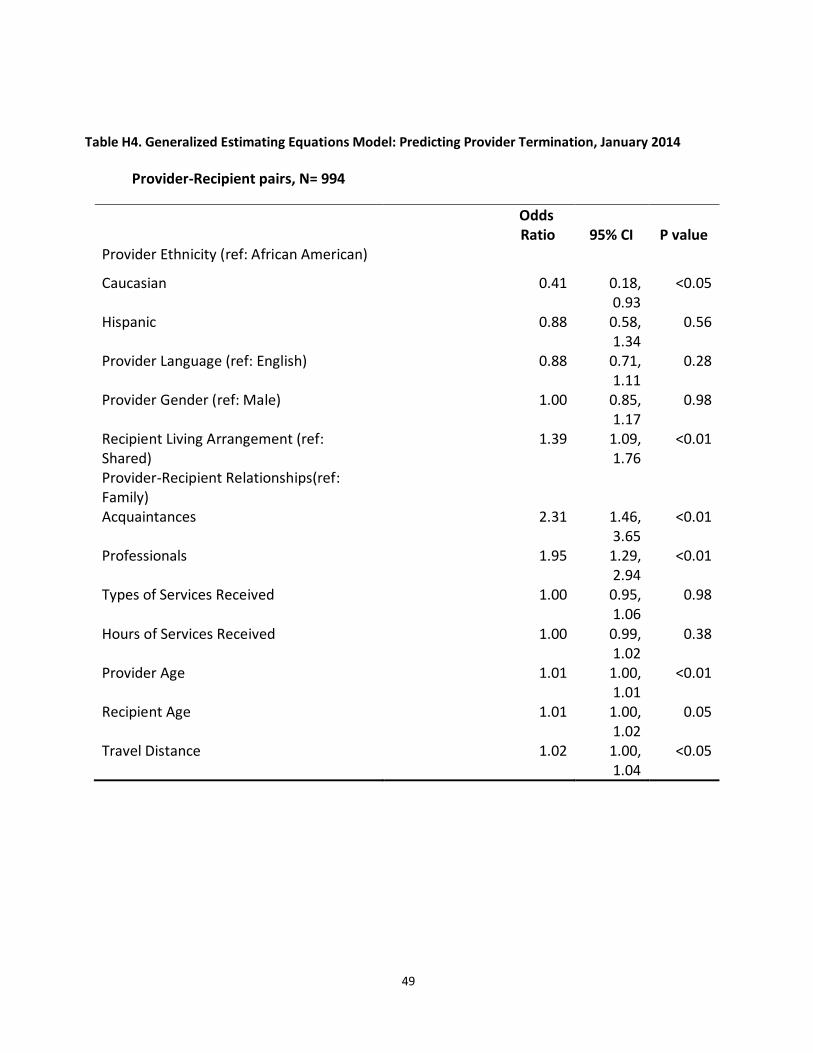
49
Table H4. Generalized Estimating Equations Model: Predicting Provider Termination, January 2014
Provider-Recipient pairs, N= 994
Odds Ratio 95% CI P value
Provider Ethnicity (ref: African American)
Caucasian 0.41 0.18, 0.93
<0.05
Hispanic 0.88 0.58, 1.34
0.56
Provider Language (ref: English) 0.88 0.71, 1.11
0.28
Provider Gender (ref: Male) 1.00 0.85, 1.17
0.98
Recipient Living Arrangement (ref: Shared)
1.39 1.09, 1.76
<0.01
Provider-Recipient Relationships(ref: Family)
Acquaintances 2.31 1.46, 3.65
<0.01
Professionals 1.95 1.29, 2.94
<0.01
Types of Services Received 1.00 0.95, 1.06
0.98
Hours of Services Received 1.00 0.99, 1.02
0.38
Provider Age 1.01 1.00, 1.01
<0.01
Recipient Age 1.01 1.00, 1.02
0.05
Travel Distance 1.02 1.00, 1.04
<0.05
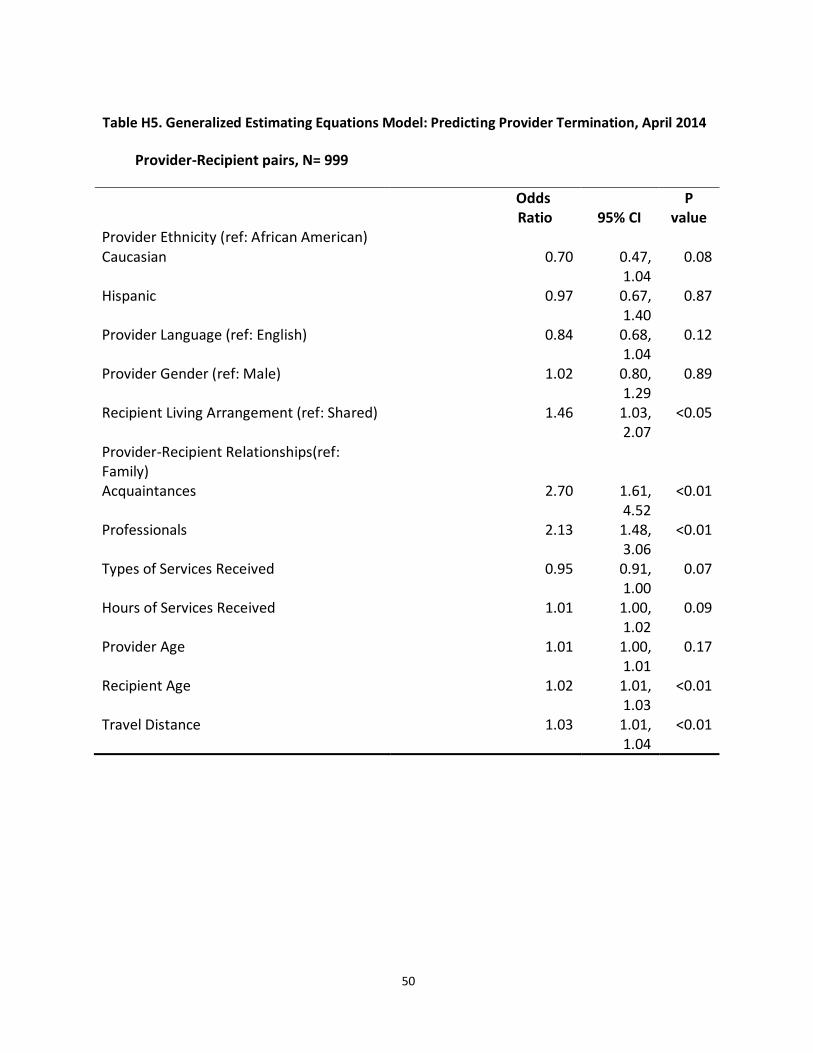
50
Table H5. Generalized Estimating Equations Model: Predicting Provider Termination, April 2014
Provider-Recipient pairs, N= 999
Odds Ratio 95% CI
P value
Provider Ethnicity (ref: African American) Caucasian 0.70 0.47,
1.04 0.08
Hispanic 0.97 0.67, 1.40
0.87
Provider Language (ref: English) 0.84 0.68, 1.04
0.12
Provider Gender (ref: Male) 1.02 0.80, 1.29
0.89
Recipient Living Arrangement (ref: Shared) 1.46 1.03, 2.07
<0.05
Provider-Recipient Relationships(ref: Family)
Acquaintances 2.70 1.61, 4.52
<0.01
Professionals 2.13 1.48, 3.06
<0.01
Types of Services Received 0.95 0.91, 1.00
0.07
Hours of Services Received 1.01 1.00, 1.02
0.09
Provider Age 1.01 1.00, 1.01
0.17
Recipient Age 1.02 1.01, 1.03
<0.01
Travel Distance 1.03 1.01, 1.04
<0.01
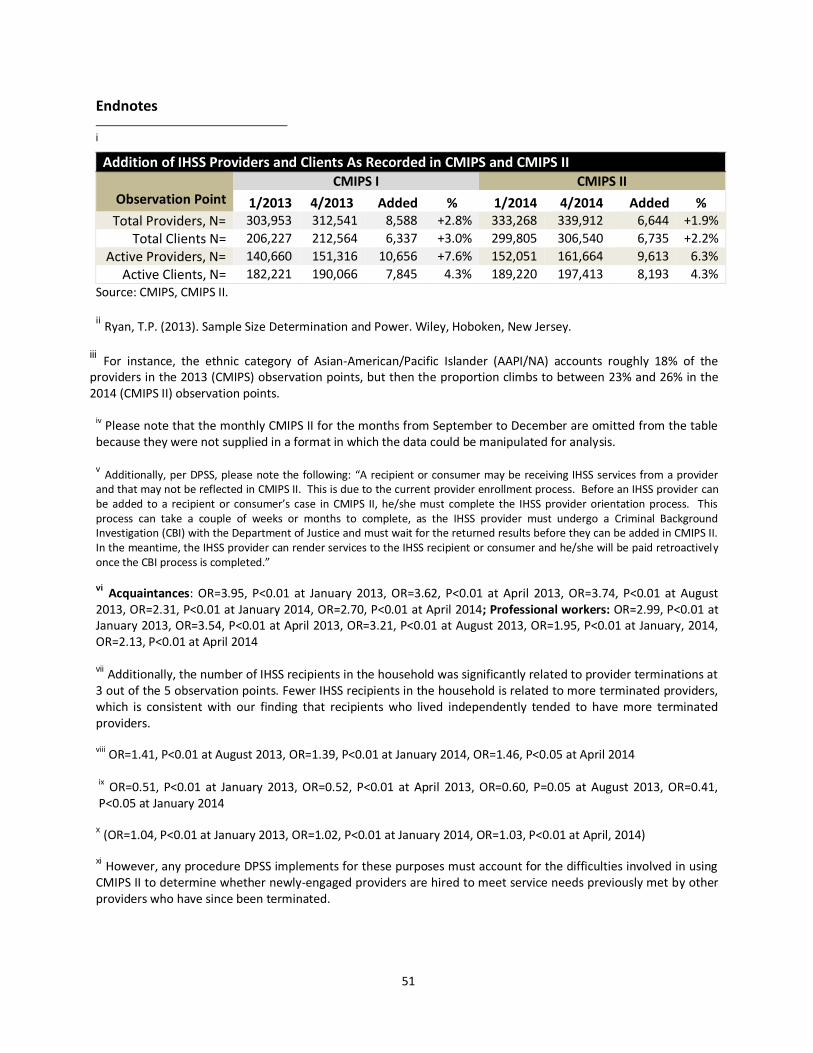
51
Endnotes i
Addition of IHSS Providers and Clients As Recorded in CMIPS and CMIPS II
Observation Point CMIPS I CMIPS II
1/2013 4/2013 Added % 1/2014 4/2014 Added % Total Providers, N= 303,953 312,541 8,588 +2.8% 333,268 339,912 6,644 +1.9%
Total Clients N= 206,227 212,564 6,337 +3.0% 299,805 306,540 6,735 +2.2%
Active Providers, N= 140,660 151,316 10,656 +7.6% 152,051 161,664 9,613 6.3%
Active Clients, N= 182,221 190,066 7,845 4.3% 189,220 197,413 8,193 4.3%
Source: CMIPS, CMIPS II. ii Ryan, T.P. (2013). Sample Size Determination and Power. Wiley, Hoboken, New Jersey.
iii For instance, the ethnic category of Asian-American/Pacific Islander (AAPI/NA) accounts roughly 18% of the providers in the 2013 (CMIPS) observation points, but then the proportion climbs to between 23% and 26% in the 2014 (CMIPS II) observation points.
iv Please note that the monthly CMIPS II for the months from September to December are omitted from the table because they were not supplied in a format in which the data could be manipulated for analysis. v Additionally, per DPSS, please note the following: “A recipient or consumer may be receiving IHSS services from a provider
and that may not be reflected in CMIPS II. This is due to the current provider enrollment process. Before an IHSS provider can be added to a recipient or consumer’s case in CMIPS II, he/she must complete the IHSS provider orientation process. This process can take a couple of weeks or months to complete, as the IHSS provider must undergo a Criminal Background Investigation (CBI) with the Department of Justice and must wait for the returned results before they can be added in CMIPS II. In the meantime, the IHSS provider can render services to the IHSS recipient or consumer and he/she will be paid retroactively once the CBI process is completed.” vi Acquaintances: OR=3.95, P<0.01 at January 2013, OR=3.62, P<0.01 at April 2013, OR=3.74, P<0.01 at August
2013, OR=2.31, P<0.01 at January 2014, OR=2.70, P<0.01 at April 2014; Professional workers: OR=2.99, P<0.01 at January 2013, OR=3.54, P<0.01 at April 2013, OR=3.21, P<0.01 at August 2013, OR=1.95, P<0.01 at January, 2014, OR=2.13, P<0.01 at April 2014 vii
Additionally, the number of IHSS recipients in the household was significantly related to provider terminations at 3 out of the 5 observation points. Fewer IHSS recipients in the household is related to more terminated providers, which is consistent with our finding that recipients who lived independently tended to have more terminated providers. viii
OR=1.41, P<0.01 at August 2013, OR=1.39, P<0.01 at January 2014, OR=1.46, P<0.05 at April 2014 ix OR=0.51, P<0.01 at January 2013, OR=0.52, P<0.01 at April 2013, OR=0.60, P=0.05 at August 2013, OR=0.41,
P<0.05 at January 2014
x (OR=1.04, P<0.01 at January 2013, OR=1.02, P<0.01 at January 2014, OR=1.03, P<0.01 at April, 2014)
xi However, any procedure DPSS implements for these purposes must account for the difficulties involved in using
CMIPS II to determine whether newly-engaged providers are hired to meet service needs previously met by other providers who have since been terminated.