Embed Size (px)
Citation preview
DIRECT SUPPORT STAFF RETENTION AND TURNOVER IN THE FIELD OF
APPLIED BEHAVIOR ANALYSIS: A NATIONAL SURVEY
A Thesis
Submitted to
the Temple University Graduate Board
In Partial Fulfillment
of the Requirements for the Degree
MASTER OF SCIENCE IN EDUCATION
by
Corinne R. Thornton
Diploma Date December 2018
Thesis Approvals:
Donald Hantula, Thesis Advisor, Department of Psychology
iiABSTRACT
This paper explores the current rates and correlates of turnover among direct
support staff working with individuals with developmental disabilities. While the United
State Department of Labor, Bureau of Labor Statistics collects data on annual separation
rates by a variety of industry sectors, there is not a recognized sector for the field of
Applied Behavior Analysis. Other data sources similarly do not include Applied Behavior
Analysis as its own industry sector, which produces a gap in knowledge. This study uses
data obtained from providers of services for individuals with developmental disabilities
in a national online survey to obtain rates of turnover for the field of Applied Behavior
Analysis. Results indicate a lower rate of turnover than what is reported in the fields of
education, and social services in general. The results also indicate that pay rate and
amount of supervision offered increase retention while training offered pre and post hire
has little correlation to rate of turnover.
Keywords: developmental disabilities, staff turnover, job, stress, burnout

iiiDEDICATION
For my wife and son, who are the setting event and reinforcement for so much of
my behavior.
ivTABLE OF CONTENTS
Page
ABSTRACT………………………………………………………………………………ii
DEDICATION……………………………………………………………………………iii
LIST OF TABLES………………………………………………………………………...v
LIST OF FIGURES……………………………………………………………………...vii
CHAPTER
1. INTRODUCTION……………………………………………………………………...1
2. METHOD……………………………………………………………………………..14
3. RESULTS……………………………………………………………………………..16
4. DISCUSSION…………………………………………………………………………28
REFERENCES…………………………………………………………………………..32
APPENDICES
A. SURVEY INTRODUCTION……………………………………………...………...45
B. SURVEY…………………………………………………..…………………………47
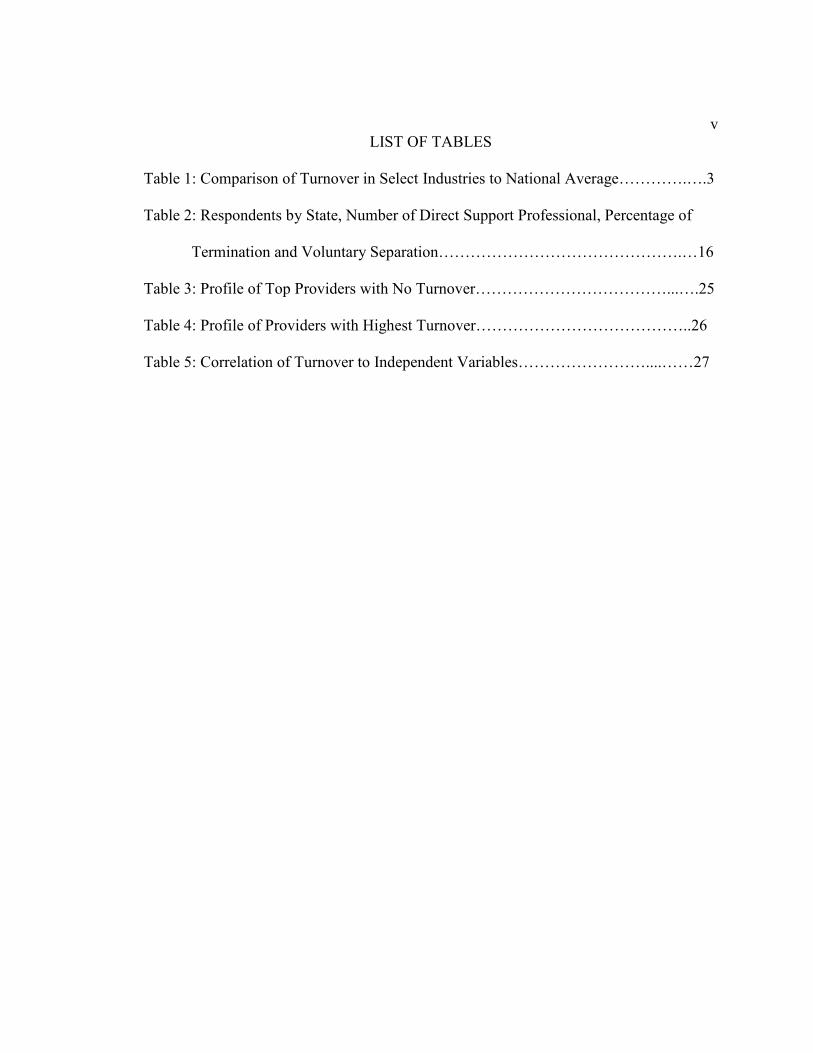
vLIST OF TABLES
Table 1: Comparison of Turnover in Select Industries to National Average………….….3
Table 2: Respondents by State, Number of Direct Support Professional, Percentage of
Termination and Voluntary Separation……………………………………….…16
Table 3: Profile of Top Providers with No Turnover………………………………...….25
Table 4: Profile of Providers with Highest Turnover…………………………………..26
Table 5: Correlation of Turnover to Independent Variables……………………....……27
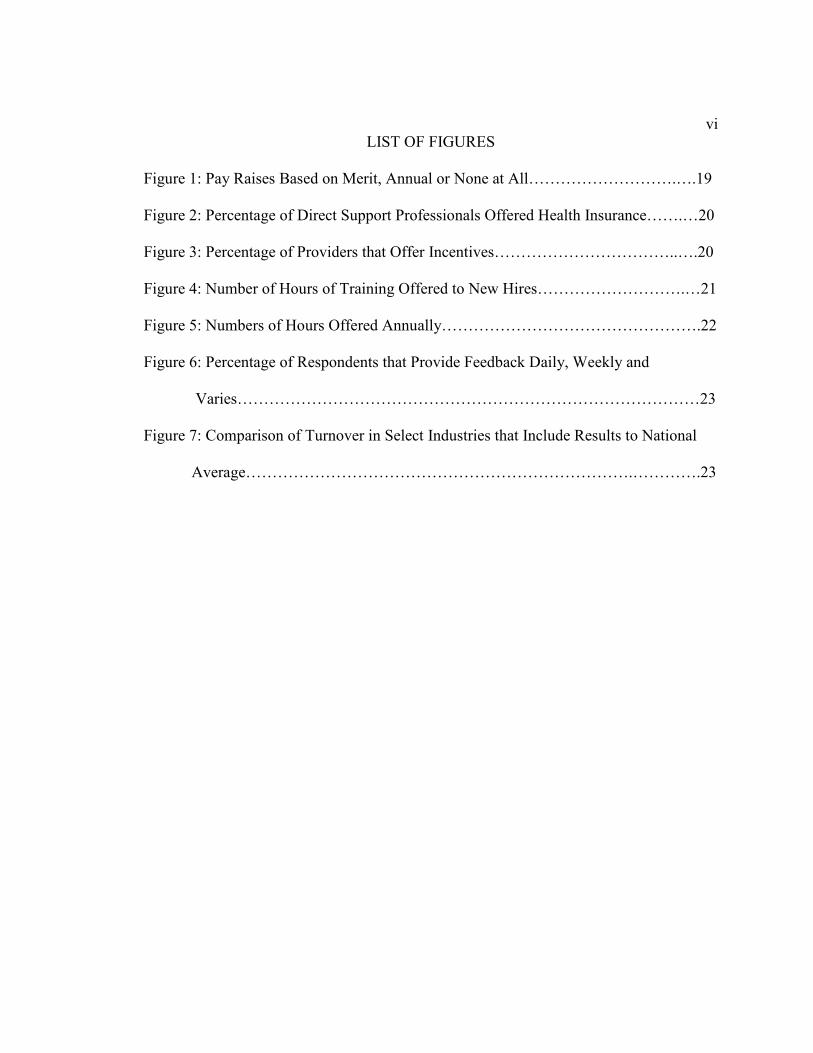
viLIST OF FIGURES
Figure 1: Pay Raises Based on Merit, Annual or None at All……………………….….19
Figure 2: Percentage of Direct Support Professionals Offered Health Insurance…….…20
Figure 3: Percentage of Providers that Offer Incentives……………………………..….20
Figure 4: Number of Hours of Training Offered to New Hires……………………….…21
Figure 5: Numbers of Hours Offered Annually………………………………………….22
Figure 6: Percentage of Respondents that Provide Feedback Daily, Weekly and
Varies……………………………………………………………………………23
Figure 7: Comparison of Turnover in Select Industries that Include Results to National
Average……………………………………………………………….………….23
1CHAPTER 1
INTRODUCTION
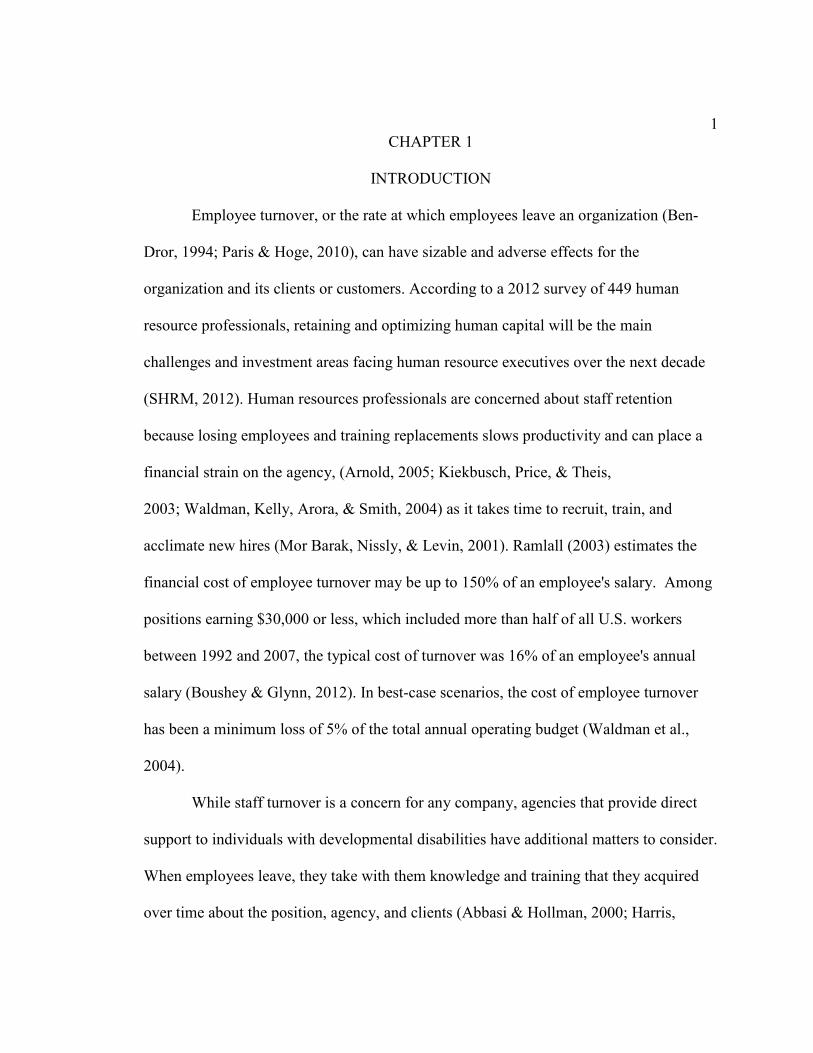
Employee turnover, or the rate at which employees leave an organization (Ben-
Dror, 1994; Paris & Hoge, 2010), can have sizable and adverse effects for the
organization and its clients or customers. According to a 2012 survey of 449 human
resource professionals, retaining and optimizing human capital will be the main
challenges and investment areas facing human resource executives over the next decade
(SHRM, 2012). Human resources professionals are concerned about staff retention
because losing employees and training replacements slows productivity and can place a
financial strain on the agency, (Arnold, 2005; Kiekbusch, Price, & Theis,
2003; Waldman, Kelly, Arora, & Smith, 2004) as it takes time to recruit, train, and
acclimate new hires (Mor Barak, Nissly, & Levin, 2001). Ramlall (2003) estimates the
financial cost of employee turnover may be up to 150% of an employee's salary. Among
positions earning $30,000 or less, which included more than half of all U.S. workers
between 1992 and 2007, the typical cost of turnover was 16% of an employee's annual
salary (Boushey & Glynn, 2012). In best-case scenarios, the cost of employee turnover
has been a minimum loss of 5% of the total annual operating budget (Waldman et al.,
2004).
While staff turnover is a concern for any company, agencies that provide direct
support to individuals with developmental disabilities have additional matters to consider.
When employees leave, they take with them knowledge and training that they acquired
over time about the position, agency, and clients (Abbasi & Hollman, 2000; Harris,
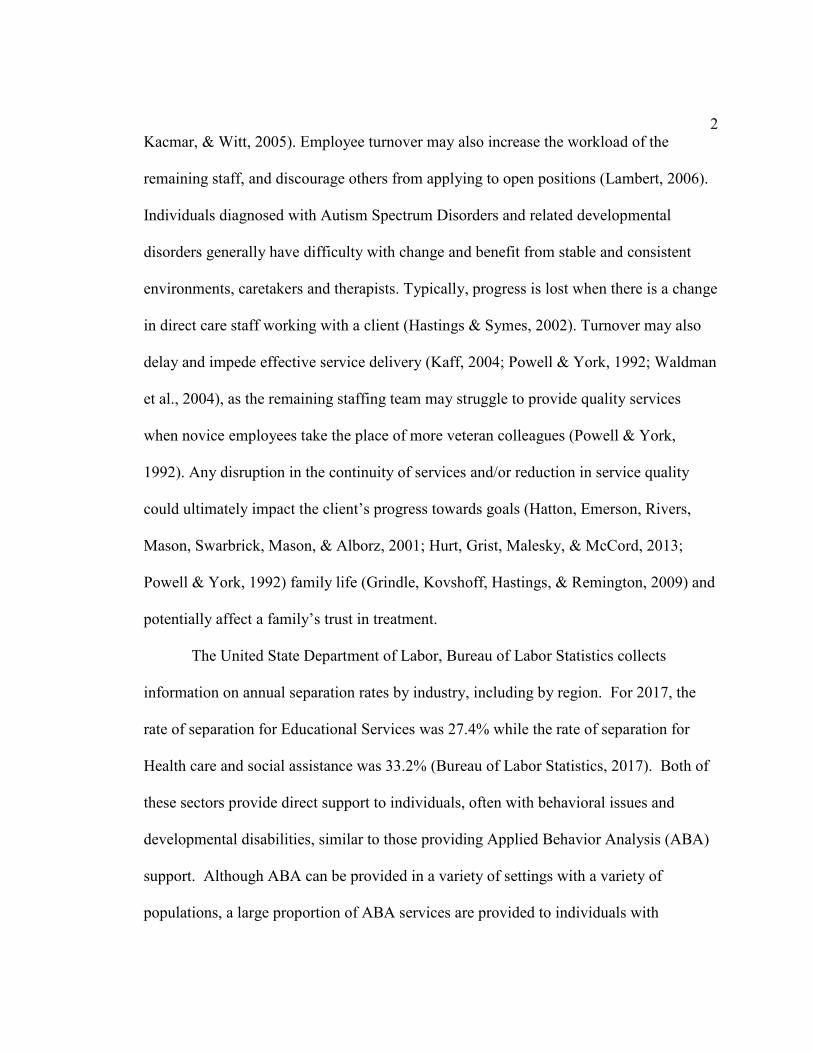
2Kacmar, & Witt, 2005). Employee turnover may also increase the workload of the
remaining staff, and discourage others from applying to open positions (Lambert, 2006).
Individuals diagnosed with Autism Spectrum Disorders and related developmental
disorders generally have difficulty with change and benefit from stable and consistent
environments, caretakers and therapists. Typically, progress is lost when there is a change
in direct care staff working with a client (Hastings & Symes, 2002). Turnover may also
delay and impede effective service delivery (Kaff, 2004; Powell & York, 1992; Waldman
et al., 2004), as the remaining staffing team may struggle to provide quality services
when novice employees take the place of more veteran colleagues (Powell & York,
1992). Any disruption in the continuity of services and/or reduction in service quality
could ultimately impact the client’s progress towards goals (Hatton, Emerson, Rivers,
Mason, Swarbrick, Mason, & Alborz, 2001; Hurt, Grist, Malesky, & McCord, 2013;
Powell & York, 1992) family life (Grindle, Kovshoff, Hastings, & Remington, 2009) and
potentially affect a family’s trust in treatment.
The United State Department of Labor, Bureau of Labor Statistics collects
information on annual separation rates by industry, including by region. For 2017, the
rate of separation for Educational Services was 27.4% while the rate of separation for
Health care and social assistance was 33.2% (Bureau of Labor Statistics, 2017). Both of
these sectors provide direct support to individuals, often with behavioral issues and
developmental disabilities, similar to those providing Applied Behavior Analysis (ABA)
support. Although ABA can be provided in a variety of settings with a variety of
populations, a large proportion of ABA services are provided to individuals with
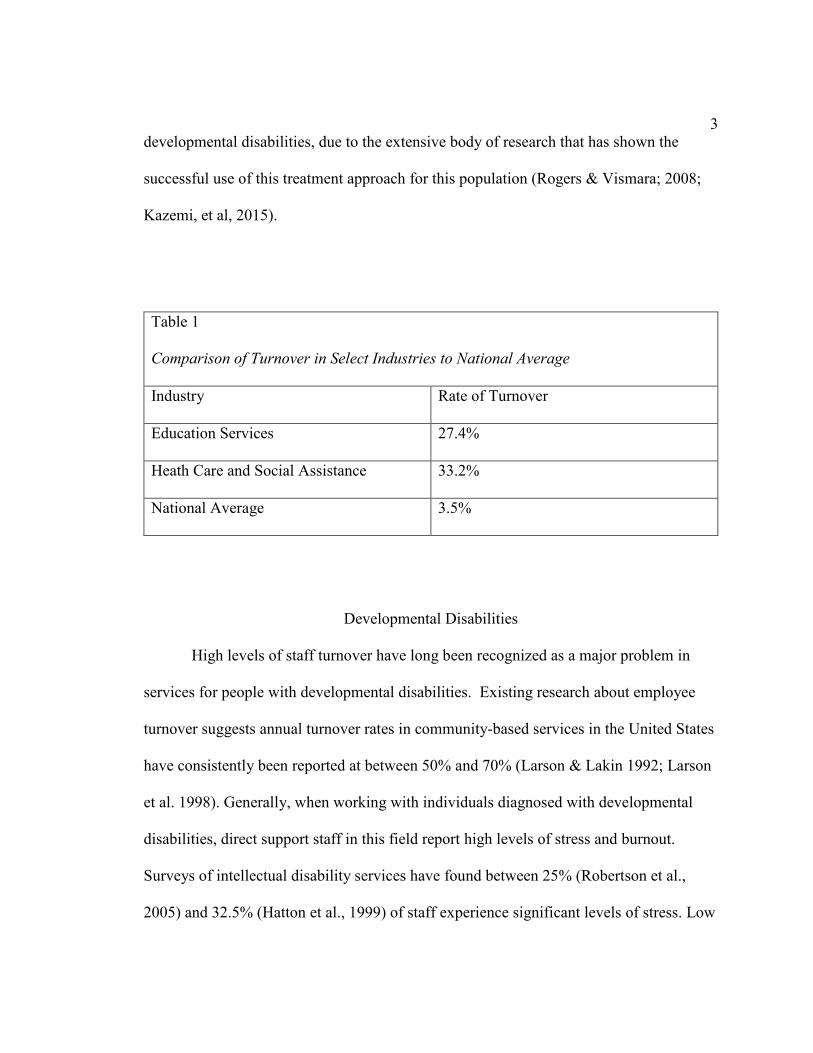
3developmental disabilities, due to the extensive body of research that has shown the
successful use of this treatment approach for this population (Rogers & Vismara; 2008;
Kazemi, et al, 2015).
Table 1
Comparison of Turnover in Select Industries to National Average
Industry Rate of Turnover
Education Services 27.4%
Heath Care and Social Assistance 33.2%
National Average 3.5%
Developmental Disabilities
High levels of staff turnover have long been recognized as a major problem in
services for people with developmental disabilities. Existing research about employee
turnover suggests annual turnover rates in community-based services in the United States
have consistently been reported at between 50% and 70% (Larson & Lakin 1992; Larson
et al. 1998). Generally, when working with individuals diagnosed with developmental
disabilities, direct support staff in this field report high levels of stress and burnout.
Surveys of intellectual disability services have found between 25% (Robertson et al.,
2005) and 32.5% (Hatton et al., 1999) of staff experience significant levels of stress. Low
4wages are an additional contributor to turnover as Larson et al (2007) found the average
wage among direct support staff in intellectual disability services across five states to be
$11.98 per hour. Direct support staff who provide essential services for individuals with
intellectual and developmental disabilities (IDD) in residential, community, and
vocational settings demonstrate higher turnover, ranging from 30% to 86% (Hatton et al.,
2001; Larson & Hewitt, 2005). Burnout has been recognized as an important stress-
related problem for employees working with people with an intellectual disability (ID):
(Skirrow and Hatton, 2007). Given the importance of consistency of services with this
population, we begin to see the negative impact that turnover can have on clients and
staff alike.
The relationship between professionals and clients in this occupational sector is
central to the nature of this highly demanding emotional work (Thomas & Rose, 2010).
Professionals in this field are frequently exposed to stressors identified as relevant
antecedents of burnout, such as role conflict, role ambiguity (Skirrow & Hatton 2007),
low social support at work and work overload (Devereux et al. 2009). Work stress is a
contributor to direct support staffs’ intentions to quit (Hatton et al., 2001) and turnover
(Pfefferle & Weinberg, 2008). Burnout has been recognized as an important stress-related
problem for employees working with people with intellectual disability (ID) (Skirrow &
Hatton, 2007).
The National Core Indicators (NCI) consists of both the National Association of
State Directors of Developmental Disabilities Services (NASDDDS) and the Human
Services Research Institute (HSRI). NCI conducts the Staff Stability Survey, an on-line
5survey of provider agencies supporting adults with developmental disabilities in
residential, employment, day programs and other in-home or community inclusion
programs. The survey collects information about wages, benefits, and turnover of the
direct support staff. The 2016 Staff Stability Survey found that of the staff that left their
employer between January 1, 2016 and December 31 2016, 38.2% had been employed
for less than 6 months. The average turnover rate for direct support staff in 2016 ranged
by state from 24.1% to 69.1%. The NCI average was 45.5% (Hiersteiner, 2016).
The President’s Committee for People with Intellectual Disabilities, established
by President John F. Kennedy in 1961 to address the needs of people with intellectual
disability and their families, released a 2017 report entitled, America’s Direct Support
Workforce Crisis: Effects on People with Intellectual Disabilities, Families, Communities
and the U.S. Economy. The 2017 report addresses a “workforce crisis” consisting of not
enough employees entering the industry to support the amount of individuals that will
need support. The report cited concerns such as low wages, poor benefits, limited training
and lack of career advancement opportunities as reasons for the lack of staff. A high
turnover rate is well documented in the Direct Support Professionals (DSP) workforce
(Bogenshutz, Hewitt, Nord, & Hepperlen, 2014; Braddock & Mitchell, 1992; Larson et
al., 1998; Larson et al, 2005; ANCOR, 2010; Hewitt et al., 2015). Nationally, the average
annual turnover for DSP positions is an estimated 45 percent, with a range of 18–76
percent (Hiersteiner, 2016). About 35 percent of DSPs leave their positions in less than
six months, and approximately 22 percent leave within 6–12 months. As a point of
6comparison, the national average separation (turnover) rate is only 3.5 percent, across all
industries, as reported by BLS (2017).
Due to the costly effects to an agency and adverse effects on consumers of
services, there is a large body of research on predicting intent to turnover in human
service agencies (Acker, 1999; Demerouti, Bakker, Nachreiner, & Schaufeli, 2001;
Drolen & Harrison, 1990; Hatton, Emerson, Rivers, Mason, Swarbrick, Mason & Alborz,
2001; Kim & Kao, 2014; Lawson & O’Brien, 2005) and preventing (Cherniss & Krantz,
1983, Devereux, Hastings, Noone, Firth, & Totsika, 2009; Glisson, Dukes, & Green,
2006; Hanushek, Kain, & Rivkin 1999; Howard & Gould, 2000; Larson & Hewitt, 2005;
Maslach, 2003; Mor Barak, Nissly, & Levin, 2001) staff turnover. The following section
explores correlates of staff turnover.
Burnout
The most common reason for turnover in human services is burnout (see e.g.,
Alarcon, 2011; Arches, 1997; Cherniss & Krantz, 1983; Crawford, LePine, & Rich, 2010;
Devereux et al., 2009, Evers, Tomic, & Brouwers 2004; Freudenberger & Richelson,
1980; Halbesleben, 2006; Lawson & O’Brien, 1994; Maslach, 1978; Shirom and
Melamed; 2006, Schaufeli, Leiter, & Maslach, 2009). The concept of burnout emerged in
the scientific literature in the mid-70s (Freudenberger, 1974; Maslach, 1978) as a
metaphor to describe the process of people’s energy depletion at work. Maslach (1982)
describes burnout as a psychological response to chronic work-related stress of an
interpersonal and emotional nature that appears in professionals in service organizations
who work in direct contact with the clients or users of the organization. Maslach
7characterized burnout as a syndrome of emotional exhaustion, depersonalization, and
reduced personal accomplishment. The Maslach Burnout Inventory (MBI) is a
psychometric tool introduced in 1981 by psychologist Christina Maslach and is a widely
used standardized index employed by many researchers as a means to measure Burnout
Syndrome (Shirom & Melamed, 2006; Maslach & Jackson, 1981).
Demerouti et al., (2001) suggest a model of predicting burnout by correlating high
job demands with low job resources. Job demands can include, but are not limited to role
ambiguity, workload, red tape, and organizational politics. Examples of job resources
include job control, autonomy, job variety, and positive social climate (Alarcon, 2011;
Crawford, LePine, & Rich, 2010). Demerouti, et al. developed a model that simplified
the MBI definition of burnout into the Job Demands-Resources (JD-R) model of Burn
Out. The JD-R model proposes that the demanding aspects of work (i.e., extreme job
demands) lead to constant stress and, eventually, to exhaustion. While simultaneously, a
lack of resources to meet the job demands leads to withdrawal behavior. One long-term
consequence of withdrawal is disengagement from work and ultimately leaving the
organization (Demerouti et al.).
Unfortunately, much of the research on burnout rely on measures of a “state” or
self-reports that are often difficult to measure accurately as opposed to observable
behaviors that can be measured. Research shows that burnout can include behaviors such
as increased absenteeism, tardiness and lowered job performance (Freundenberger &
Richelson, 1980; Dwyer, 1991; Adler, 1981; Hatton et al. 2001). Pines and Maslach
(1978) found that staff working in a mental health residential treatment facility spent
8more time interacting with each other in order to avoid patient interactions. Direct
support staff that interacted more with other staff than clients reported more feelings of
stress, apathy and irresponsibility. The MBI has become a widely used tool to measure
staff burnout yet research focusing on the validity of the MBI relationship to observed
behaviors rather than entirely on self-report had been lacking (Maslach & Jackson, 1986).
Lawson and O’Brien (1994) used this gap in research as an opportunity to explore
staff turnover in a day treatment facility primarily services adults with intellectual
disabilities. The researchers operationally defined burnout “as a decrease in the rate of
desirable behaviors within the work situation as a result of extinction produced by a lack
of reinforcing contingent consequence” (p.38). In other words, a decrease in work
performance directly correlates to a lack of reinforcement for the employee. The study
focused on the direct care staff’s behavior in four general categories: 1) desirable work-
related behavior, 2) undesirable work-related behavior, 3) nonwork-related behavior and
4) other. Observations were conducted during program hours 10 times over a six-week
period. Staff completed the MBI at the start and conclusion of the study. Absenteeism
and tardiness rates stayed relatively consistent throughout the study for staff who
demonstrated a pattern of avoiding client interaction or refraining from interaction had
higher rates of absenteeism and tardiness. The findings suggest that direct measures of
behavior are a better indicator of burnout than the MBI as staff reported lower rates of
burnout than observed in the study. Observations of staff behavior suggested considerable
burnout amount staff as to two thirds of observations found staff either uninvolved with
clients or involved in negative interactions
9Sample sizes and measures to capture turnover with staff that work directly with
individuals with developmental disabilities have varied extensively across studies;
however Larson, Lakin, and Bruininks (1998) have identified several factors that serve as
predictors of turnover or turnover intent, including employee characteristics (e.g.,
younger or more educated employees) and client characteristics (e.g., challenging
behaviors). Compared to employees who remain, employees who intend to leave the
agency reported less satisfaction with their income or benefits, low staff-to-client ratios,
less satisfaction with on-the-job training, difficulties with or lack of support from
supervisors (i.e., practical or emotional support), low levels of feedback on job
performance, and low levels of general job satisfaction (e.g., factors related to the work
atmosphere, self-development opportunities, and pay) (Hatton & Emerson, 1993; Larson
& Lakin, 1992; Larson et al., 1998; Larson & Hewitt, 2005; Razza, 1993; Strouse,
Carroll-Hernandez, Sherman & Sheldon, 2004). Given the costly effects of staff turnover
in this field, there is growing organizational interest in staff retention interventions that
prevent frequent employee turnover.
In the meta-analysis research completed by Larson (1998), it was found that
employees who intend to turnover report less satisfaction with their income or benefits,
less satisfaction with on-the-job training, lack of support from supervisors, little feedback
on job performance, and low levels of general job satisfaction.
In furthering the finding of Larson, et al. (1998), Kazemi, Shapiro, and Kavner
(2015) surveyed 96 behavior technicians from 19 unduplicated Applied Behavior
Analysis (ABA) service companies, asking them about their organization and their
10intentions to quit. Researchers found that four main variables predicted 37% of people’s
intention to quit: lack of reported satisfaction with training, supervision, pay rate, and
overall job satisfaction such as opportunities for advancement and praise for a good work
performance.
Training
Staff training has long thought to be an important component to effective delivery
of services regardless of the industry or target population served as well as antidote to
staff retention. Lack of satisfaction with training was one of four factors in intent to
quit identified by the Kazemi et al (2015) study of behavior technicians. Skill and
performance play a key role in the delivery of good and consistent services (Dillenburger,
McKerr & Jordan, 2016). One model that has been effective is Behavioral Skills Training
(BST), which involves instruction, modeling, practice, and direct feedback (Parsons,
Rollyson, and Reid, 2012; Reid and Parsons, 2000). Research has shown that training to
mastery, also known as Performance-Based Feedback, as opposed to a set amount of time
in training (example: 10 hours of training), is more effective in ensuring good
performance from staff (Harchik and Campbell, 1998; Alvero, Bucklin, & Austin, 2001).
Supervision
Research has shown that satisfaction with training correlates negatively with
intention to quit (Kazemi et al 2015) however, it is also important to understand how to
most effectively utilized the supervisory relationship (Larson, et al. 1998). Research
shows that effective supervision involves antecedents and consequences to encourage
meaningful behavior or performance. Task clarification, job aides, goal-setting, feedback,
11reinforcement, and adequate support are a few examples of advisable approaches to
supervising others (Brown, 1982; Daniels & Bailey, 2014; Daniels, 2000; Gilbert, 2007;
Jacobs, 2013). Supervision allows for a written or vocal report of job performance,
providing information regarding the quality and/or quantity of the staff’s behavior
(Alvero, Bucklin, & Austin, 2001; Cooper, Heron, & Heward, 2007). Additionally, the
information provided in supervision serves a vital role in improving a staff’s performance
by increasing desired behaviors and/or decreasing undesired behaviors (Barton &
Wolery, 2007; Casey & McWilliam, 2011; Cooper et al., 2007; Kreitner, Reif, & Morris,
1977).
Compensation
Billingsley (2004) conducted a literature review to identify and better understand
predictors of turnover intent for special education teachers and found that compared to
teachers who reported intent to stay, teachers who reported intent to leave had lower
paying jobs. Along the same lines, researchers have found that perceptions of pay (i.e.,
pay perceived as unfair) and lack of employee benefits predicted turnover intentions of
social workers and teachers (Lambert et al., 2012; Russell et al., 2010). Larson, et. al
(1998) indicated that staff compensation directly correlated to a decrease in staff
turnover. For this reason, compensation was included in the variables examined here.
Compensation to staff may be impacted by city and state funding for services, which can
influence staffing rates. For example, payment for ABA services frequently originates
from a government entity that have limits on the amount of income that staff can earn
(Riley & Frederiksen, 1984). A behavior-analytic approach to make pay contingent on
12high quality performance allows people greater control over their income potentially by
adding bonuses into the pay structure. Additionally, this model has also shown to
improve reported employee satisfaction, which in turn decreases staff turnover
(Abernathy, 1996, 2011; Bucklin & Dickinson, 2001; Jenkins, Gupta, Mitra, & Shaw,
1998).
Job Satisfaction
Another important area when considering predictors to turnover is the enjoyment
staff experience with their work environment (Green, Reid, Passante, & Canipe, 2008).
The subfield of Organizational Behavior Management (OBM) known as Behavioral
Systems Analysis (BSA) examines ways in which organization-wide contingencies can
be implemented to improve job satisfaction (Diener, McGee, & Miguel, 2009; Rummler
& Brache, 1995). Strouse et al. (2004) found that by changing the staffing schedule,
turnover was reduced by 43% and reported job satisfaction increased. Their research
focused on direct care staff members at group homes for children and adults with
developmental disabilities. The current work schedule utilized traditional shift work with
most of the staff working 7:00 a.m. to 3:00 p.m., 3:00 p. m. to 11:00 p.m. or 11:00 p.m. to
7:00 a.m. five days a week. The agency found that the part-time staff that were used to
fill in or cover weekends, would leave the agency at a rate over 250% higher than full
time employees. The revised staffing schedule allowed for more stability of staff and
minimized the number of people providing care by increasing the shifts to 12-hour days
across three days week. This study found that not only did staff turnover decreased and
staff vacancies decreased, reported job satisfaction also increased.
13 The goal of this study is to gather data on rates of turnover of direct support staff
among providers of ABA. Additionally, data were collected on known strategies to retain
staff such as pay raises, supervision and training. Rate of turnover was used at the
dependent variable to determine the strength of correlation with the strategies that were
reviewed above.
14CHAPTER 2
METHOD
This study used an online survey that was administered to agencies that provide
Applied Behavior Analysis in the United States. As of October 23, 2018, 240 agencies
received this survey. Participants completed an online survey of 20 questions about staff
turnover and correlates of turnover in their setting during the previous year.
Once Institutional Review Board exemption was obtained, an email was sent to
the providers on October 12, 2018 which included a description of the study and an
attached link to access the online survey (Appendix A). A second reminder was sent on
October 19th, 2018 and the survey was closed on November 2nd, 2018. The survey
completion was voluntary, anonymous and without any financial incentive.
Participants
Participants were found using a national search for providers that were accredited
by the Behavior Health Center of Excellence, an international accrediting body specific
to behavior analysis. State provider directories for Applied Behavior Analysis were
utilized, often having been complied by the insurance providers in that specific state. At
least one provider from each of the 50 states were represented. Of the 240 providers
surveyed, 23 providers participated, or 9% of those contacted. One respondent did not
answer any questions; therefore, that survey was not considered eligible and was deleted
from the dataset.
15Survey
A 20 question English language questionnaire was created using Google Forms. A
pilot study involving 5 Human Resource professionals was conducted to ensure that the
survey questions were clear and addressed the study objectives. The survey was modified
for clarity according to the feedback gathered from the pilot study.
Data Collection and Analysis
The survey gathered information on correlates of turnover and geographic
variables for all staff who were on payroll for any length of time during the period of
January 1, 2017 to December 31, 2017, as shown in Appendix B.
Descriptive statistics about the responding agencies are reported. Organizational
practices hypothesized to be related to turnover were analyzed with a person correlation.
Additionally a comparison between the 5 organizations with the highest rates of
turnover were compared to the five with the lowest rates of turnover.
16CHAPTER 3
RESULTS
Size and Location of Responding Agencies
Agencies from 14 states responded, including Alaska, Connecticut, Florida,
Georgia, Hawaii, Illinois, Kentucky, Ohio, Minnesota, Pennsylvania, Tennessee, Texas,
Virginia and Washington. The size of the agencies ranged from 6 direct support staff to
100 staff. The mean size of the agencies that responded was 29 direct support staff.
Rates of Voluntary Separation and Termination
Rate of termination ranged from 0% to 35% with an average rate of 7% for all
respondents. Rates of voluntary separation ranged from 0% to 75% with an average of
19% for all respondents.
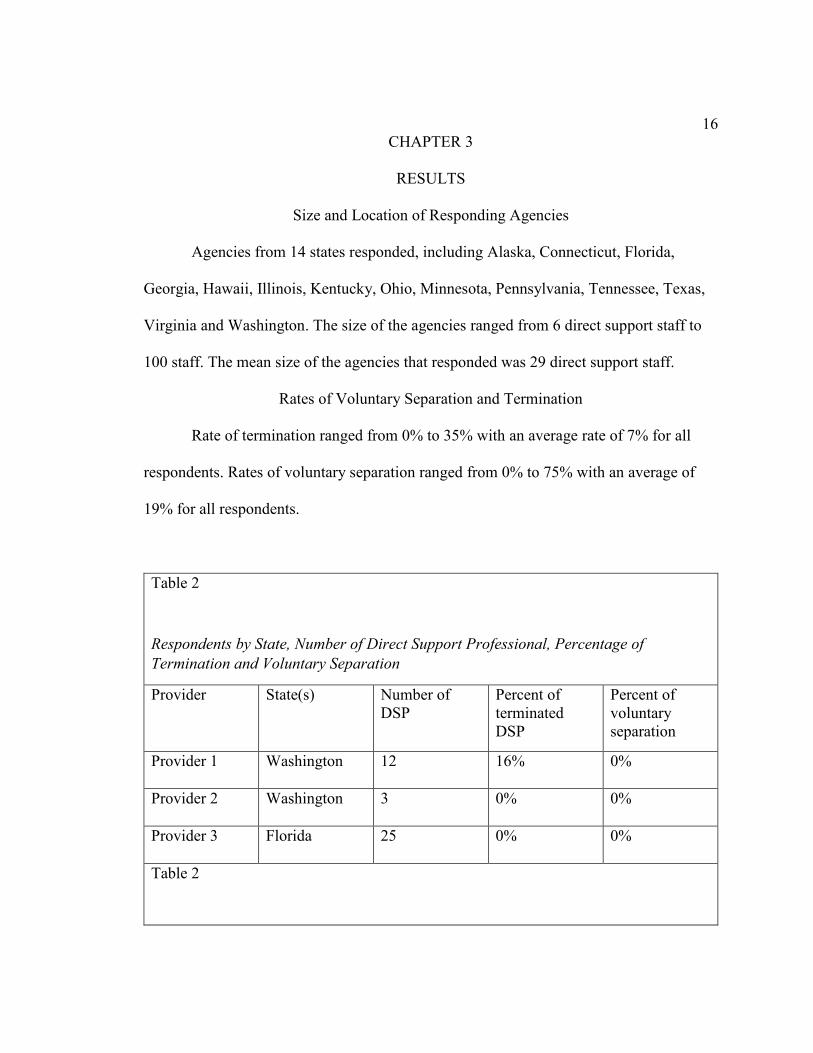
Table 2
Respondents by State, Number of Direct Support Professional, Percentage of
Termination and Voluntary Separation
Provider
State(s) Number of DSP
Percent of terminated DSP
Percent of voluntary separation
Provider 1 Washington 12 16% 0%
Provider 2 Washington 3 0% 0%
Provider 3 Florida 25 0% 0%
Table 2
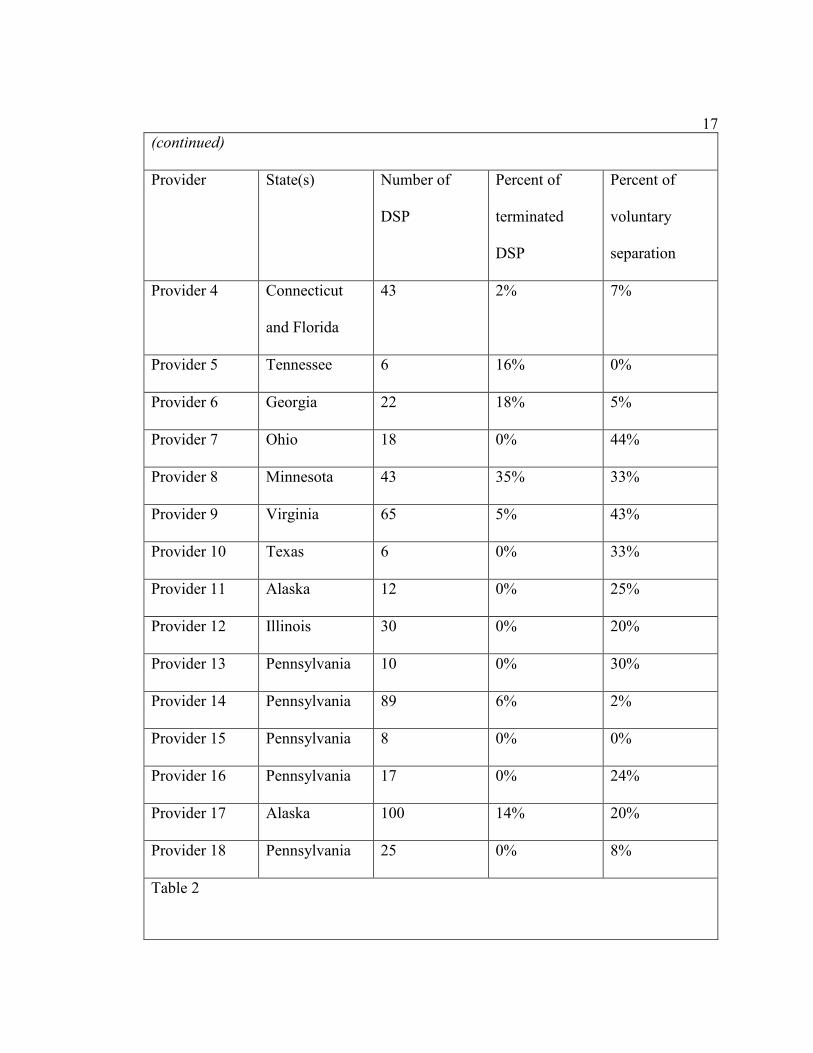
17(continued)
Provider
State(s) Number of
DSP
Percent of
terminated
DSP
Percent of
voluntary
separation
Provider 4 Connecticut
and Florida
43 2% 7%
Provider 5 Tennessee 6 16% 0%
Provider 6 Georgia 22 18% 5%
Provider 7 Ohio 18 0% 44%
Provider 8 Minnesota 43 35% 33%
Provider 9 Virginia 65 5% 43%
Provider 10 Texas 6 0% 33%
Provider 11 Alaska 12 0% 25%
Provider 12 Illinois 30 0% 20%
Provider 13 Pennsylvania 10 0% 30%
Provider 14 Pennsylvania 89 6% 2%
Provider 15 Pennsylvania 8 0% 0%
Provider 16 Pennsylvania 17 0% 24%
Provider 17 Alaska 100 14% 20%
Provider 18 Pennsylvania 25 0% 8%
Table 2
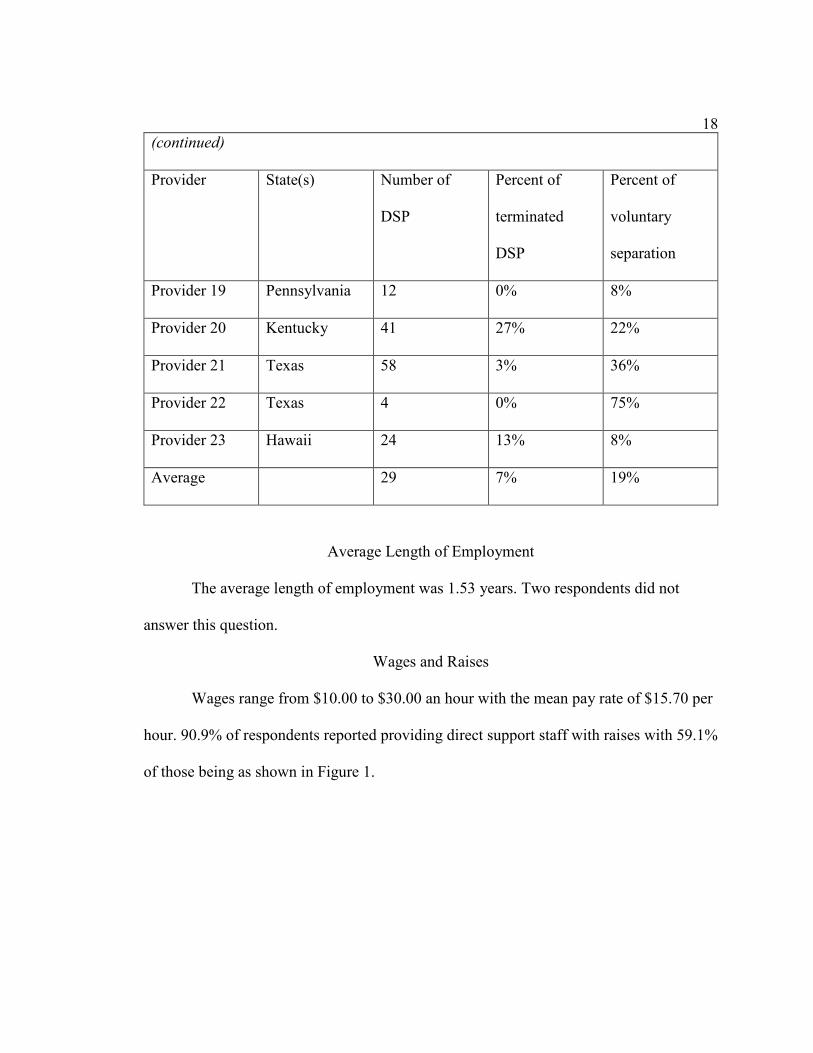
18(continued)
Provider
State(s) Number of
DSP
Percent of
terminated
DSP
Percent of
voluntary
separation
Provider 19 Pennsylvania 12 0% 8%
Provider 20 Kentucky 41 27% 22%
Provider 21 Texas 58 3% 36%
Provider 22 Texas 4 0% 75%
Provider 23 Hawaii 24 13% 8%
Average 29 7% 19%
Average Length of Employment
The average length of employment was 1.53 years. Two respondents did not
answer this question.
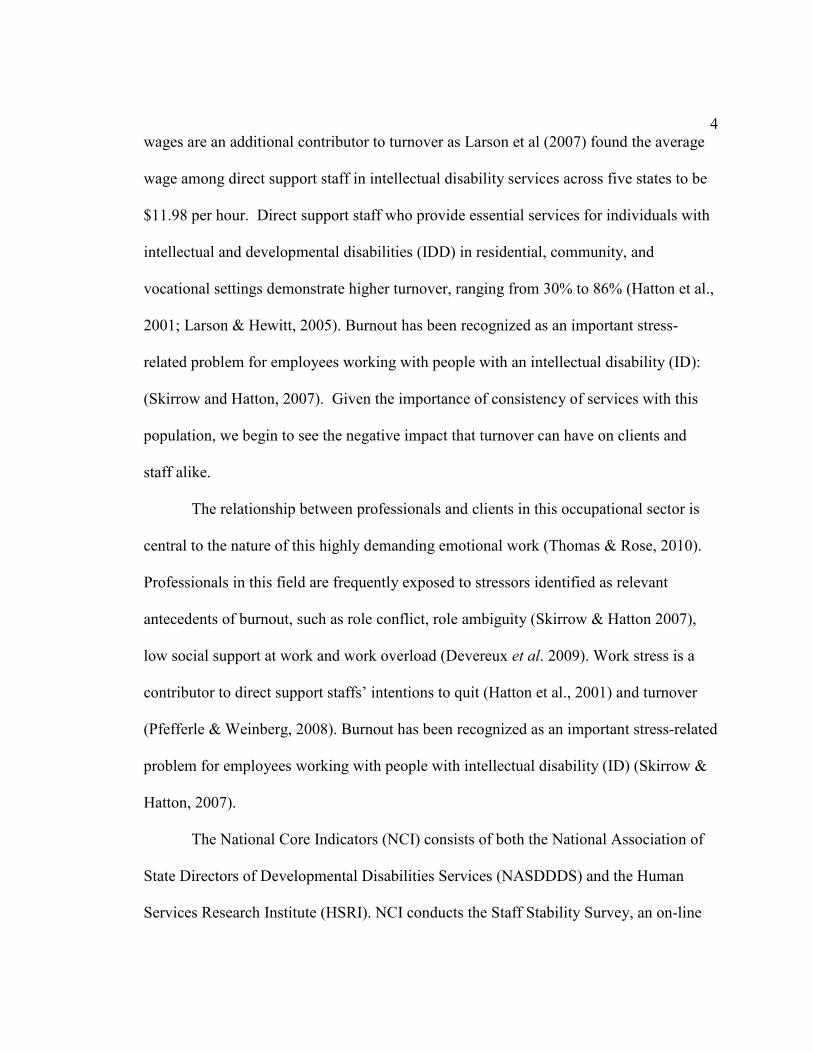
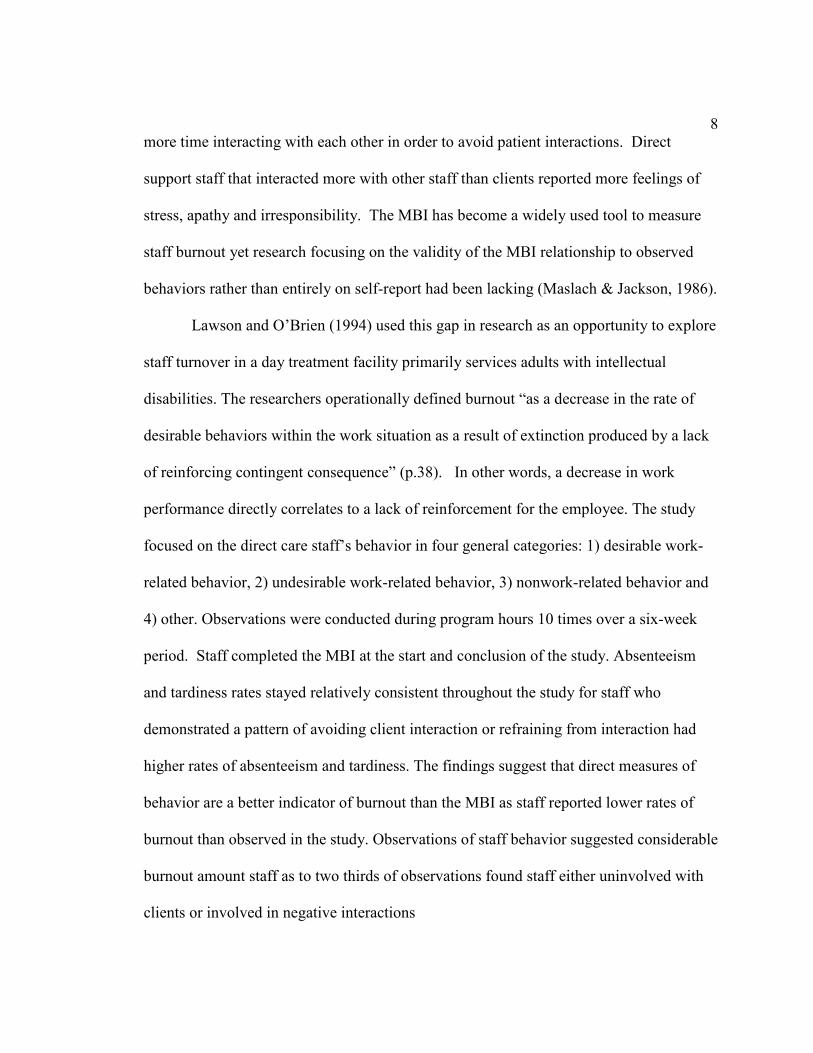
Wages and Raises
Wages range from $10.00 to $30.00 an hour with the mean pay rate of $15.70 per
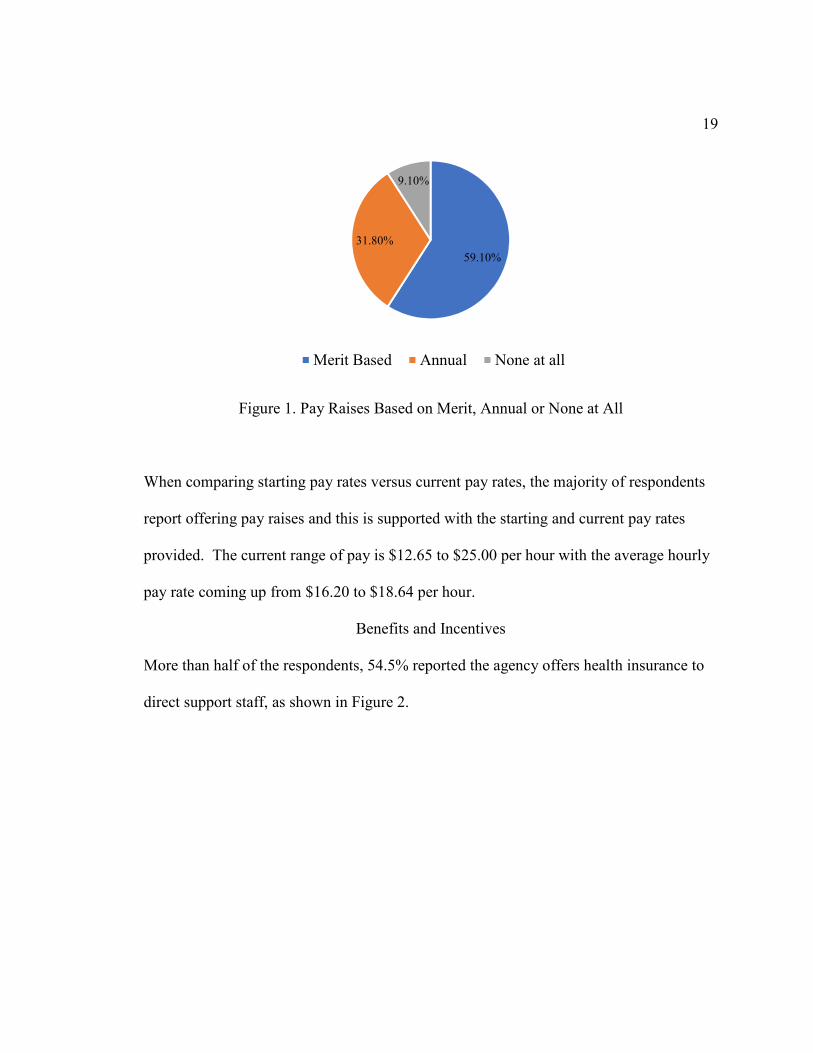
hour. 90.9% of respondents reported providing direct support staff with raises with 59.1%
of those being as shown in Figure 1.
19
Figure 1. Pay Raises Based on Merit, Annual or None at All
When comparing starting pay rates versus current pay rates, the majority of respondents
report offering pay raises and this is supported with the starting and current pay rates
provided. The current range of pay is $12.65 to $25.00 per hour with the average hourly
pay rate coming up from $16.20 to $18.64 per hour.
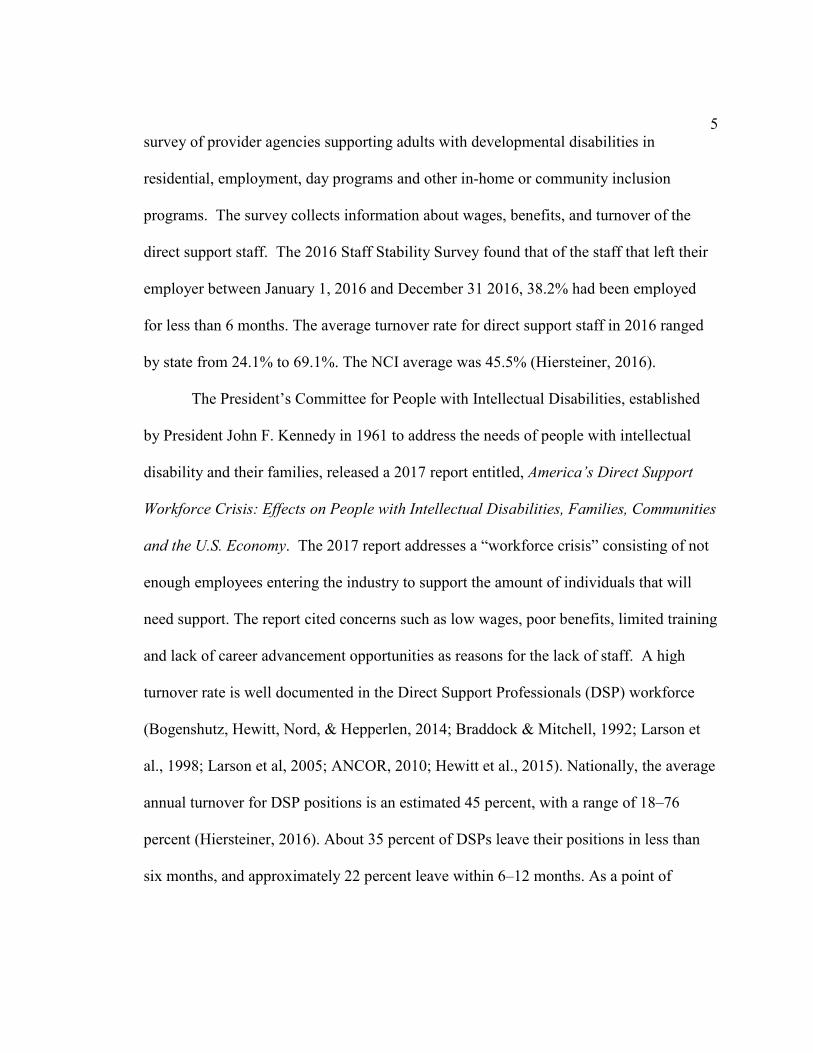
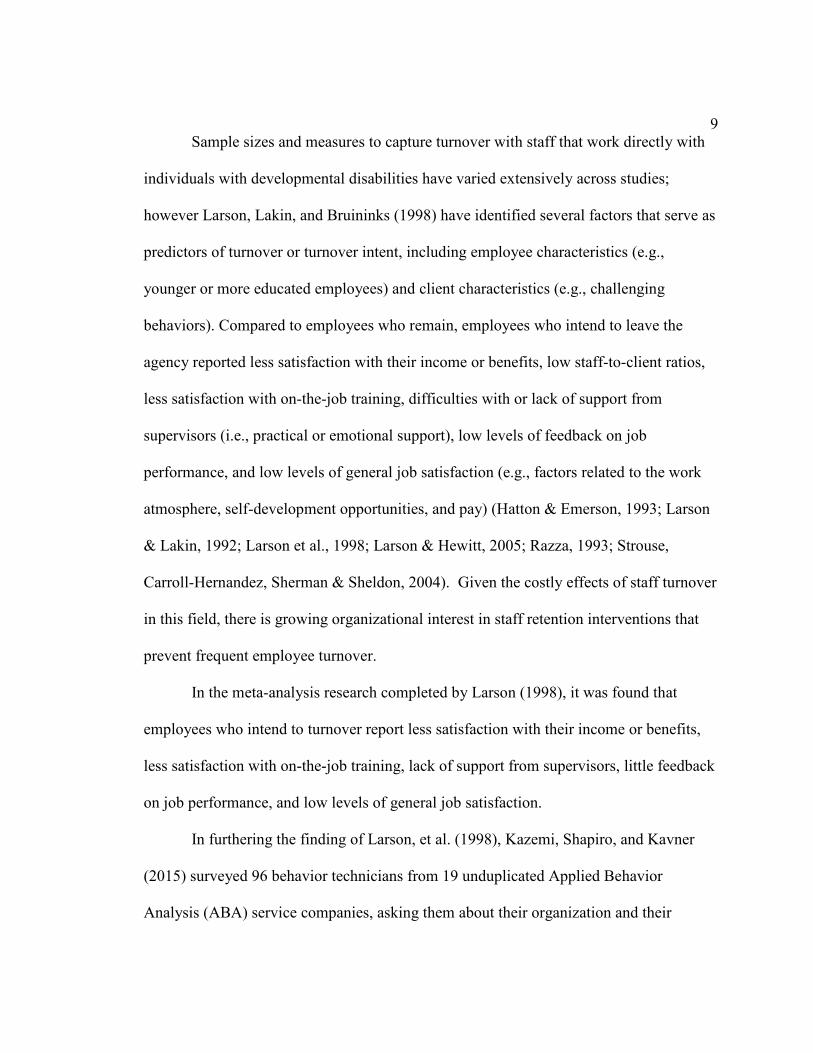
Benefits and Incentives
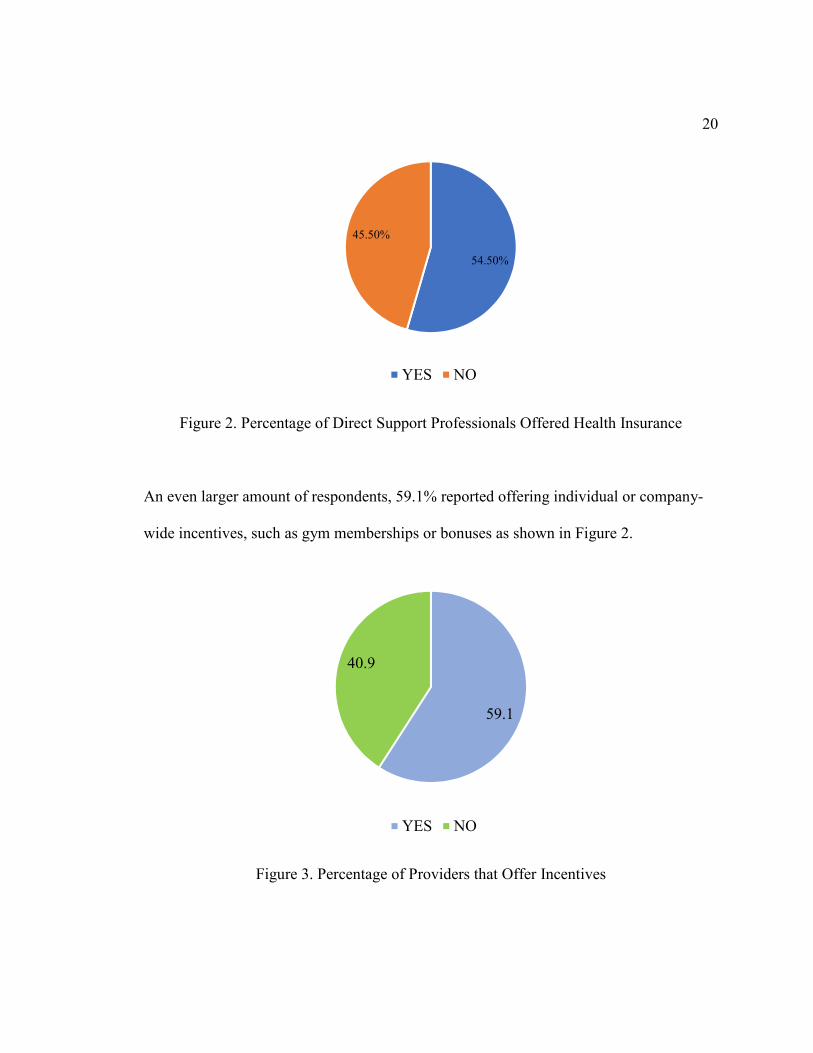
More than half of the respondents, 54.5% reported the agency offers health insurance to
direct support staff, as shown in Figure 2.
59.10%
31.80%
9.10%
Merit Based Annual None at all
20
Figure 2. Percentage of Direct Support Professionals Offered Health Insurance
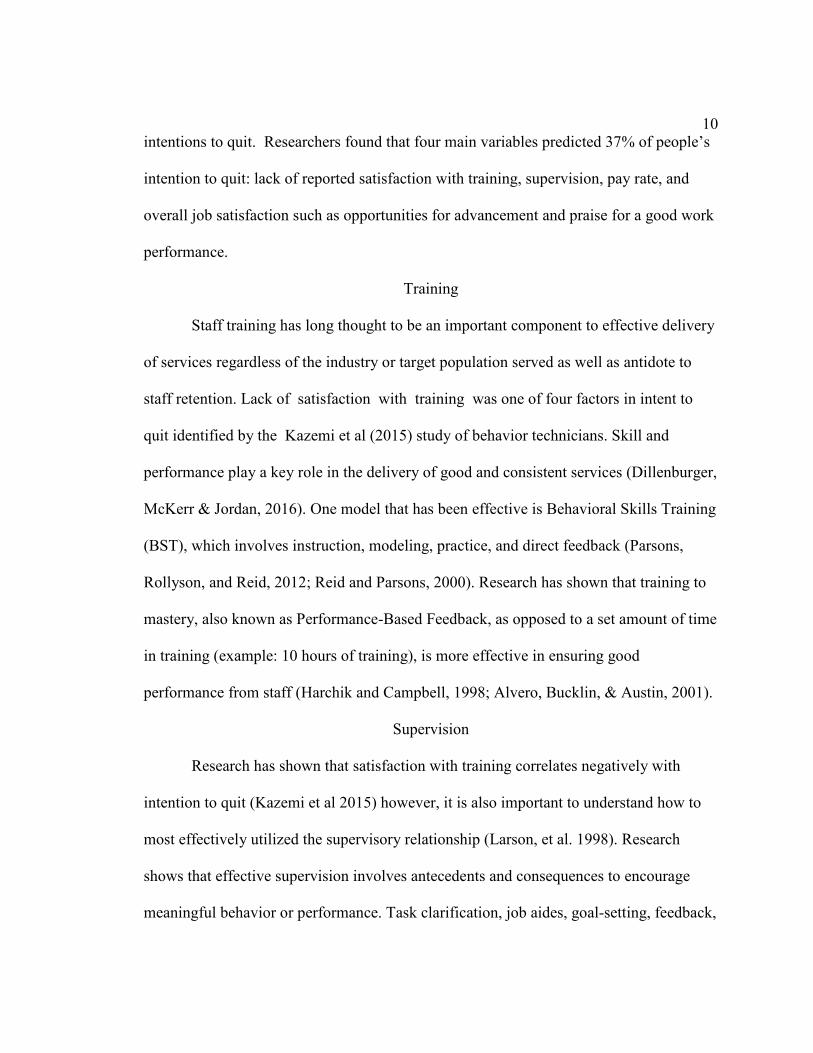
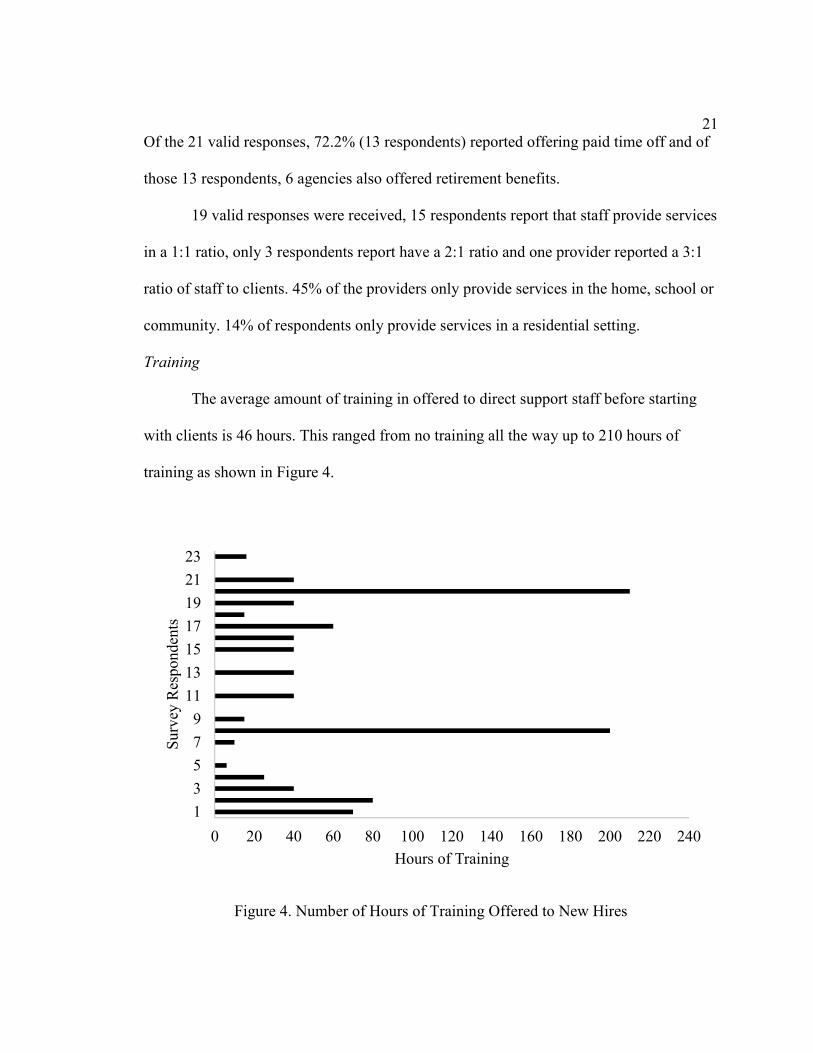
An even larger amount of respondents, 59.1% reported offering individual or company-
wide incentives, such as gym memberships or bonuses as shown in Figure 2.
Figure 3. Percentage of Providers that Offer Incentives
54.50%
45.50%
YES NO
59.1
40.9
YES NO
21Of the 21 valid responses, 72.2% (13 respondents) reported offering paid time off and of
those 13 respondents, 6 agencies also offered retirement benefits.
19 valid responses were received, 15 respondents report that staff provide services
in a 1:1 ratio, only 3 respondents report have a 2:1 ratio and one provider reported a 3:1
ratio of staff to clients. 45% of the providers only provide services in the home, school or
community. 14% of respondents only provide services in a residential setting.
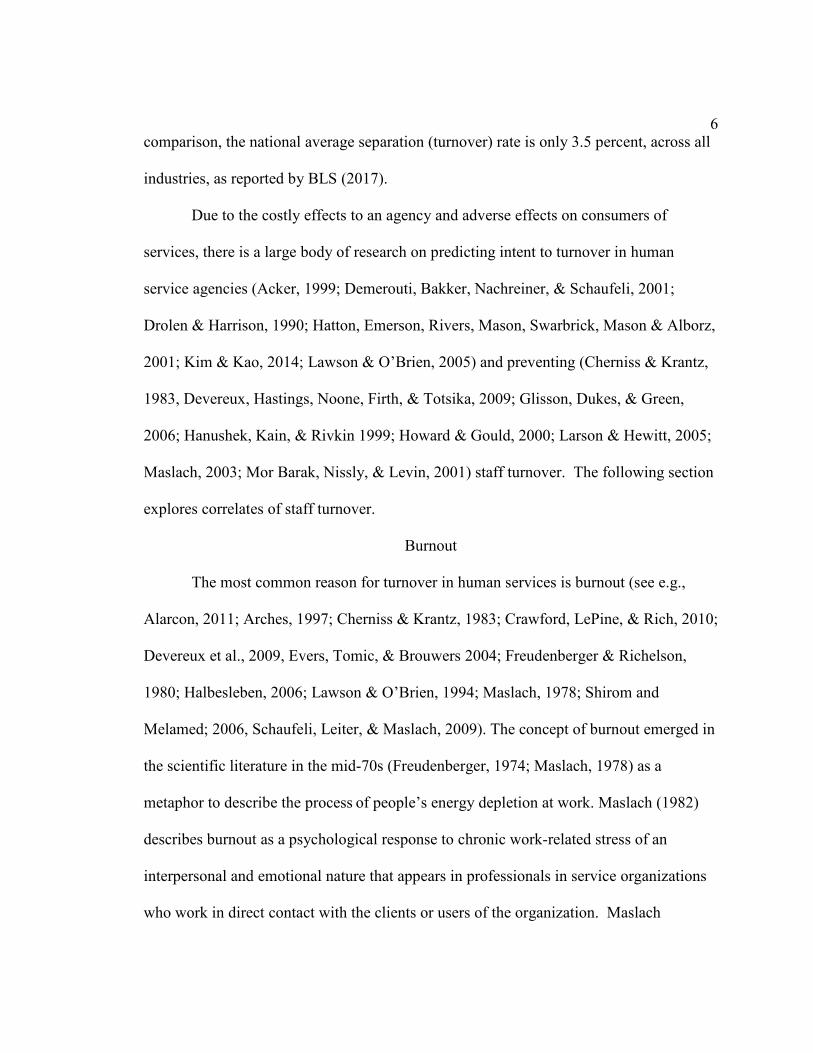
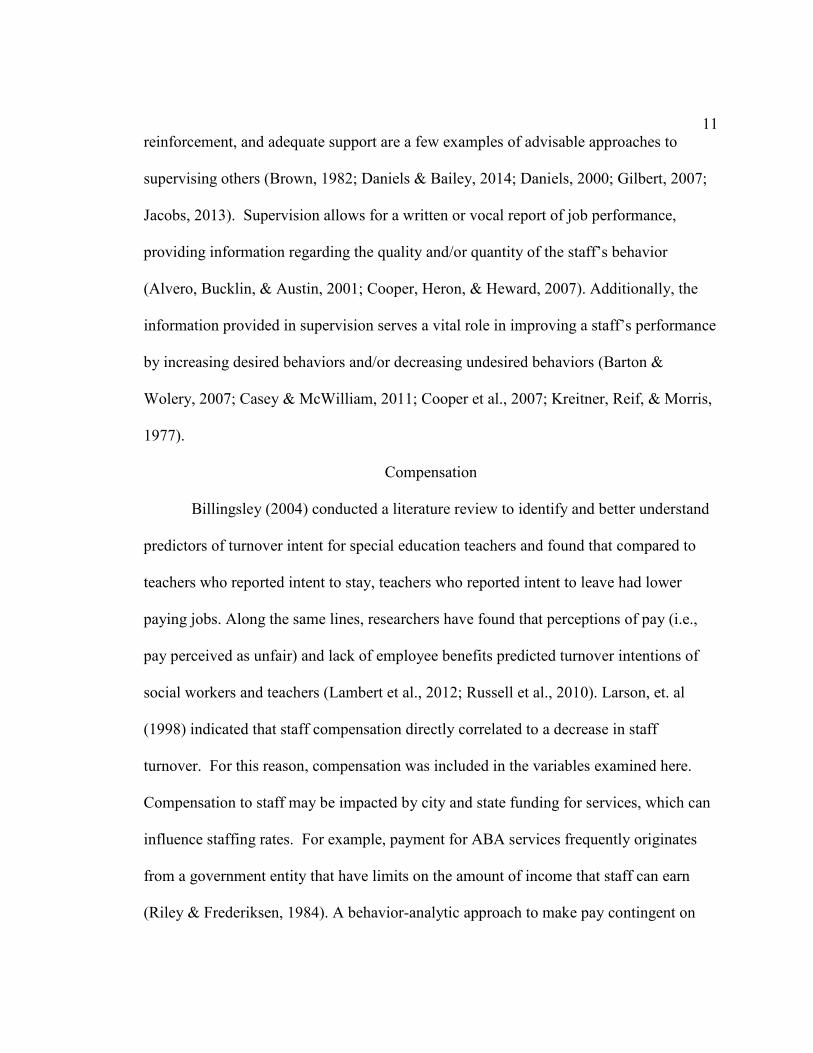
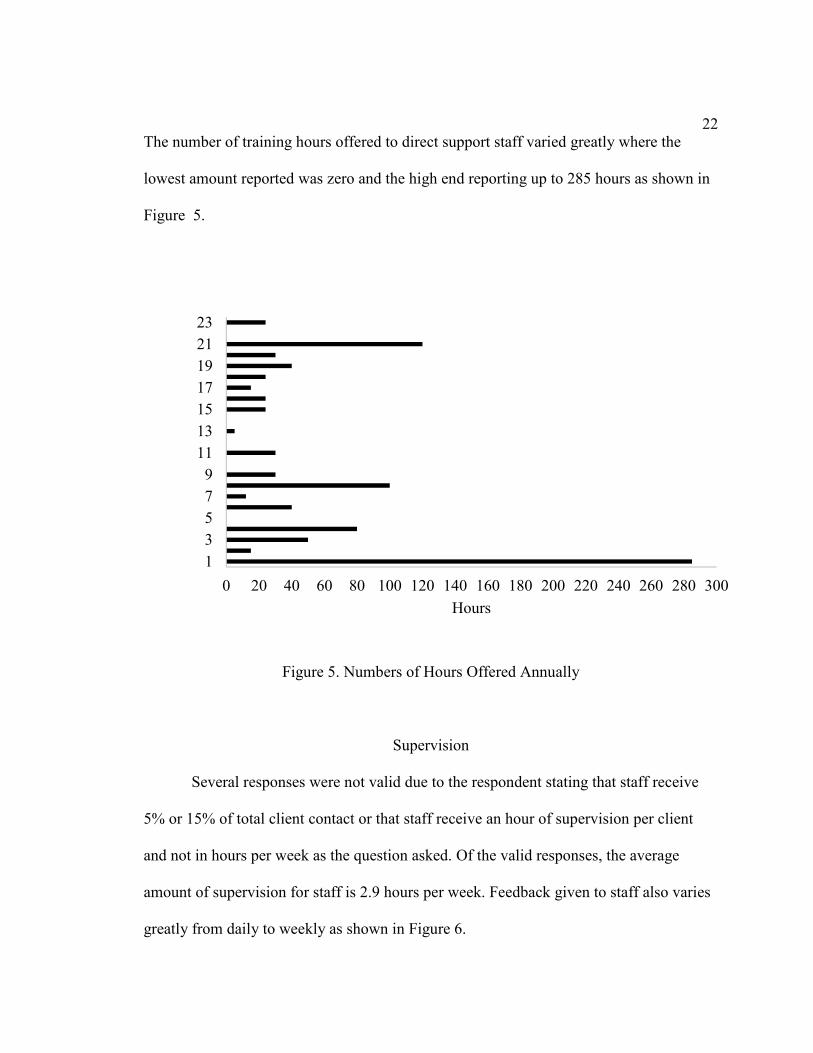
Training
The average amount of training in offered to direct support staff before starting
with clients is 46 hours. This ranged from no training all the way up to 210 hours of
training as shown in Figure 4.
Figure 4. Number of Hours of Training Offered to New Hires
0 20 40 60 80 100 120 140 160 180 200 220 240
1
3
5
7
9
11
13
15
17
19
21
23
Hours of Training
Surv
ey R
esp
onden
ts
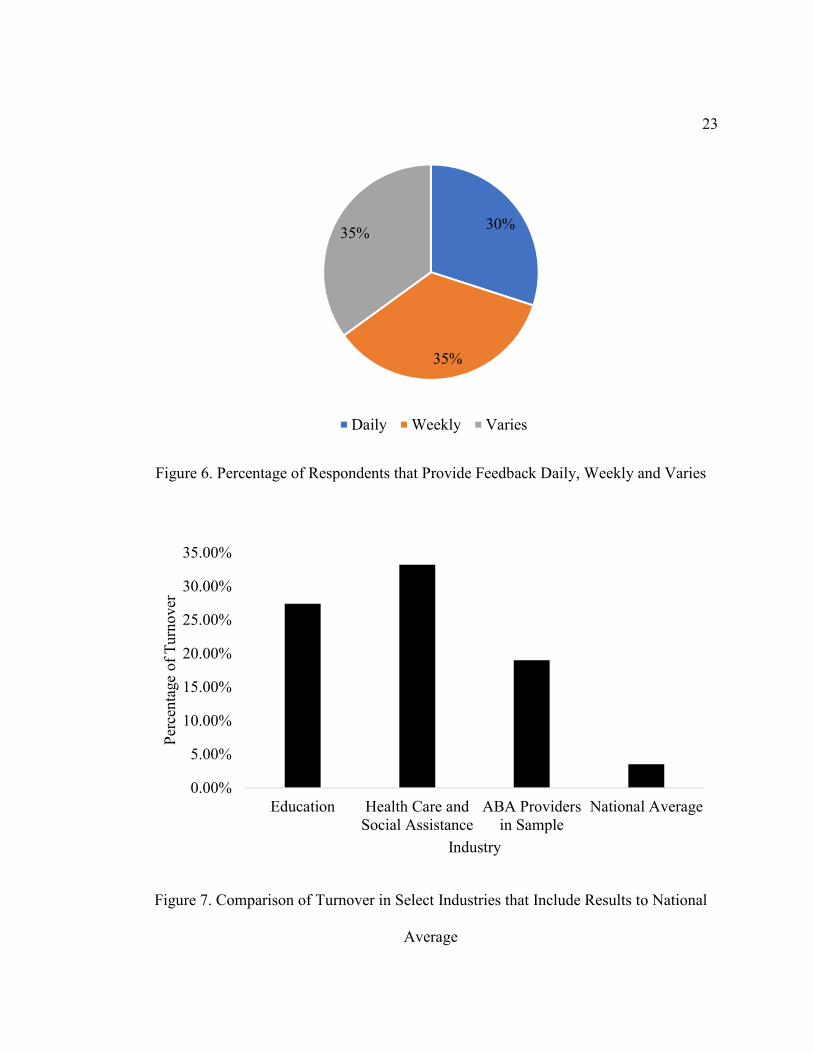
22The number of training hours offered to direct support staff varied greatly where the
lowest amount reported was zero and the high end reporting up to 285 hours as shown in
Figure 5.
Figure 5. Numbers of Hours Offered Annually
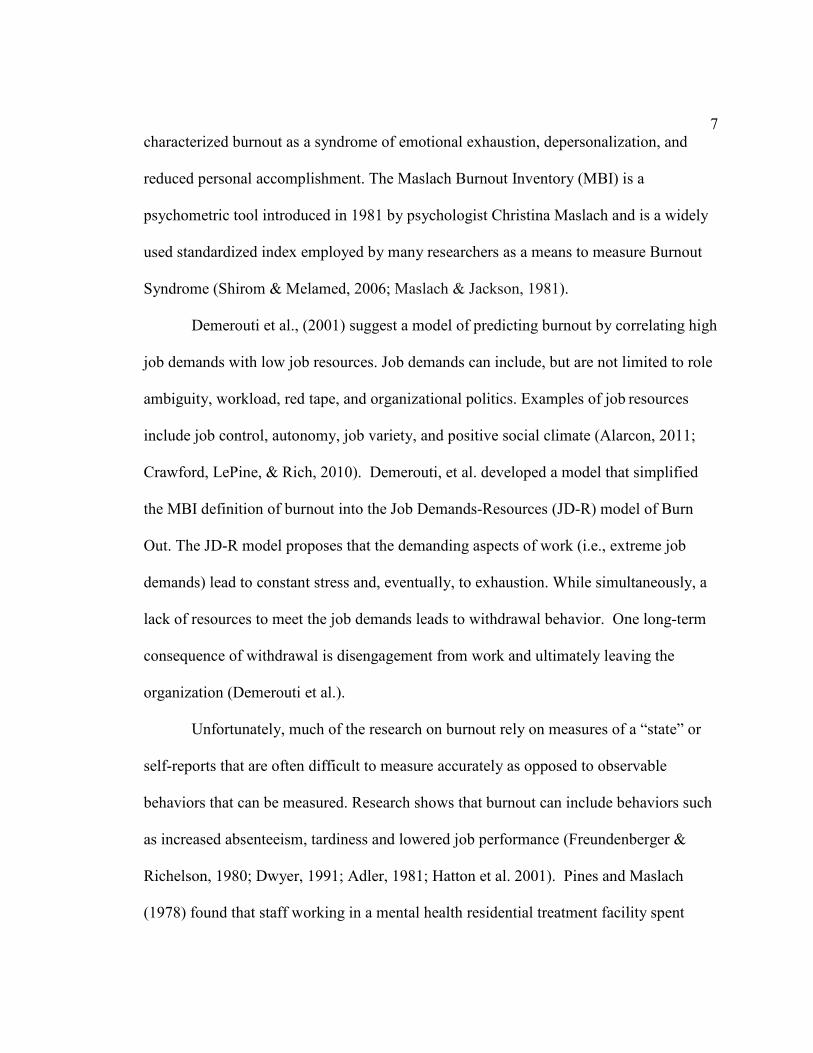
Supervision
Several responses were not valid due to the respondent stating that staff receive
5% or 15% of total client contact or that staff receive an hour of supervision per client
and not in hours per week as the question asked. Of the valid responses, the average
amount of supervision for staff is 2.9 hours per week. Feedback given to staff also varies
greatly from daily to weekly as shown in Figure 6.
0 20 40 60 80 100 120 140 160 180 200 220 240 260 280 300
1
3
5
7
9
11
13
15
17
19
21
23
Hours
23
Figure 6. Percentage of Respondents that Provide Feedback Daily, Weekly and Varies
Figure 7. Comparison of Turnover in Select Industries that Include Results to National
Average
30%
35%
35%
Daily Weekly Varies
0.00%
5.00%
10.00%
15.00%
20.00%
25.00%
30.00%
35.00%
Education Health Care andSocial Assistance
ABA Providersin Sample
National Average
Per
centa
ge
of
Turn
over
Industry
245 respondents report 0% turnover from January 1, 2017 to December 31, 2017. In
comparing just those 5 providers, all the providers are small, employing from 6 to 25
staff. All 5 providers also employ a large number of Register Behavior Technicians with
3 of the providers employing all RBTs and one provider with 80% of direct support staff
holding this certificate.
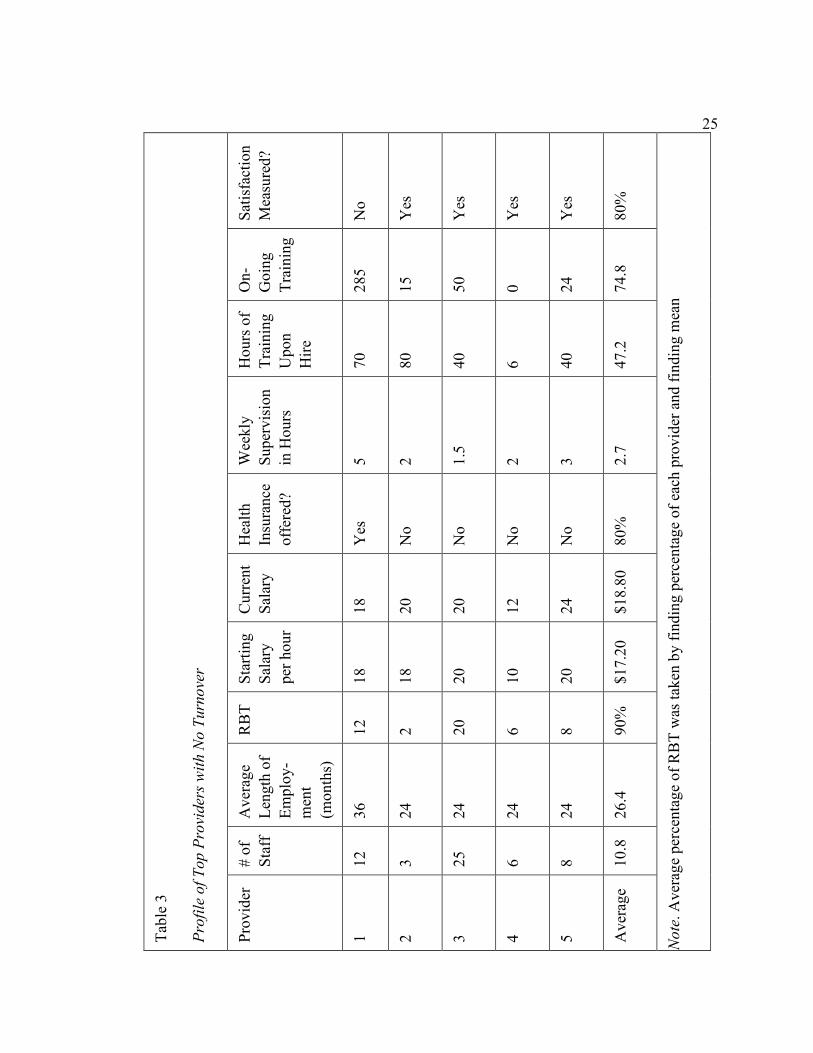
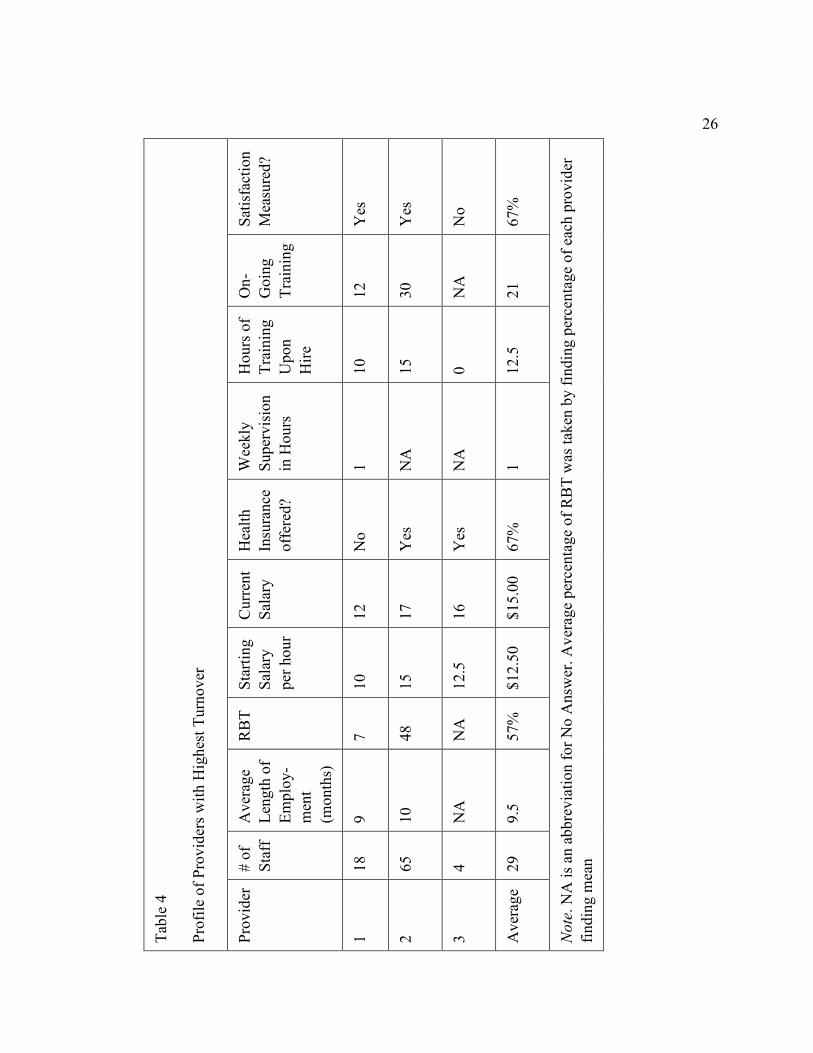
Key differences can be seen when comparing the data from the 5 providers who
reported 0% turnover to the 3 respondents with the highest turnover (≥44%). Most
noticeably, the providers with the highest turnover did not answer all the survey
questions. The length of employment for providers with no turnover reported employing
staff for 16.9 months longer when compared to those with the highest turnover rates.
Additionally, the providers with no turnover employed 33% more RBTs or BCaBAs and
pay an average of $6.30 more an hour. Additionally, providers with no turnover offer 1.7
hours more of weekly supervision and 34.7 hours more of training upon hire.
25
Tab
le 3
Pro
file
of
To
p P
rovi
der
s w
ith
No
Tu
rno
ver
Sat
isfa
ctio
n
Mea
sure
d?
No
Yes
Yes
Yes
Yes
80
%
No
te.
Av
erag
e p
erce
nta
ge
of
RB
T w
as t
aken
by
fin
din
g p
erce
nta
ge
of
each
pro
vid
er a
nd
fin
din
g m
ean
On
-
Go
ing
Tra
inin
g
28
5
15
50
0
24
74
.8
Ho
urs
of
Tra
inin
g
Up
on
Hir
e
70
80
40
6
40
47
.2
Wee
kly
Su
per
vis
ion
in H
ou
rs
5
2
1.5
2
3
2.7
Hea
lth
Insu
ran
ce
off
ered
?
Yes
No
No
No
No
80
%
Cu
rren
t
Sal
ary
18
20
20
12
24
$1
8.8
0
Sta
rtin
g
Sal
ary
per
ho
ur
18
18
20
10
20
$1
7.2
0
RB
T
12
2
20
6
8
90
%
Av
erag
e
Len
gth
of
Em
plo
y-
men
t
(mo
nth
s)
36
24
24
24
24
26
.4
# o
f
Sta
ff
12
3
25
6
8
10
.8
Pro
vid
er
1
2
3
4
5
Av
erag
e
26
T
able
4
Pro
file
of
Pro
vid
ers
wit
h H
igh
est
Tu
rno
ver
Sat
isfa
ctio
n
Mea
sure
d?
Yes
Yes
No
67
%
No
te.
NA
is
an a
bb
rev
iati
on
fo
r N
o A
nsw
er.
Av
erag
e p
erce
nta
ge
of
RB
T w
as t
aken
by
fin
din
g p
erce
nta
ge
of
each
pro
vid
er
fin
din
g m
ean
On
-
Go
ing
Tra
inin
g
12
30
NA
21
Ho
urs
of
Tra
inin
g
Up
on
Hir
e
10
15
0
12
.5
Wee
kly
Su
per
vis
ion
in H
ou
rs
1
NA
NA
1
Hea
lth
Insu
ran
ce
off
ered
?
No
Yes
Yes
67
%
Cu
rren
t
Sal
ary
12
17
16
$1
5.0
0
Sta
rtin
g
Sal
ary
per
ho
ur
10
15
12
.5
$1
2.5
0
RB
T
7
48
NA
57
%
Av
erag
e
Len
gth
of
Em
plo
y-
men
t
(mo
nth
s)
9
10
NA
9.5
# o
f
Sta
ff
18
65
4
29
Pro
vid
er
1
2
3
Av
erag
e
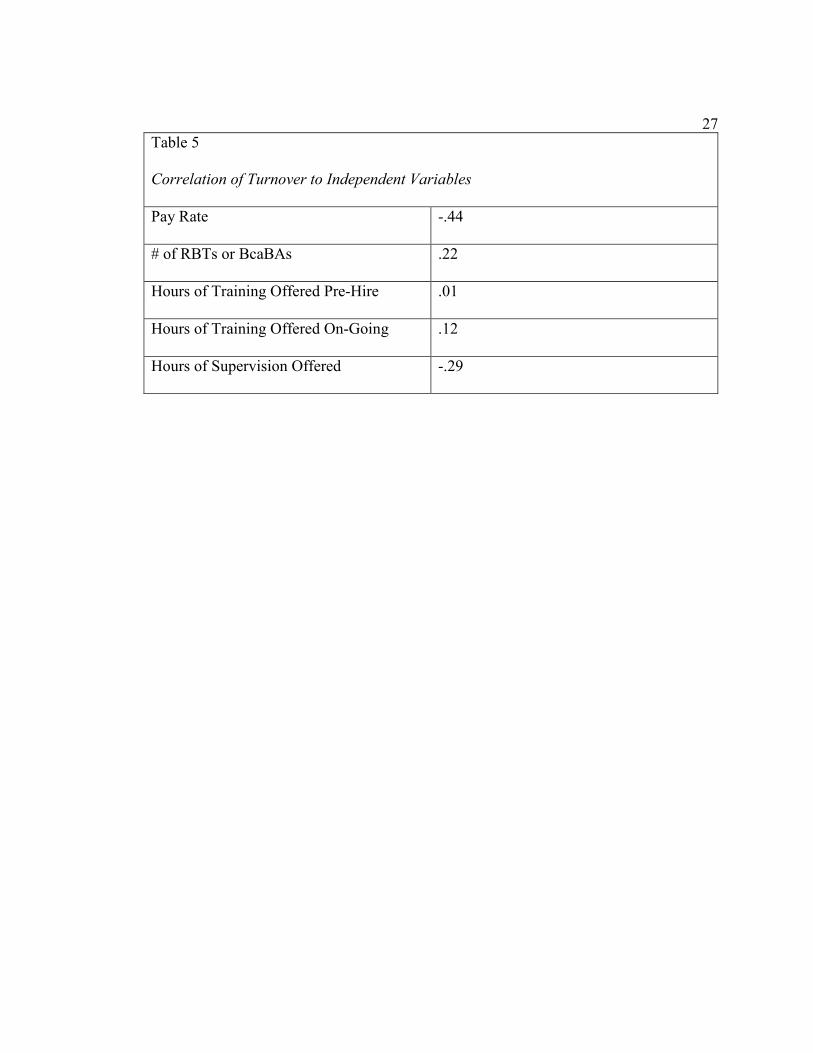
27Table 5
Correlation of Turnover to Independent Variables
Pay Rate -.44
# of RBTs or BcaBAs .22
Hours of Training Offered Pre-Hire .01
Hours of Training Offered On-Going .12
Hours of Supervision Offered -.29
28CHAPTER 4
DISCUSSION
There are few published studies aimed at exploring rates of turnover in direct
support professionals implementing applied behavior analysis (ABA). Therefore, this
survey was conducted with 23 ABA providers to determine not only rate of turnover, but
the variables that might support staff retention. We found that respondents report an
average of 19% turnover of direct support professionals compared to the NCI average of
45.5% (Hiersteiner, 2016). Overall, the data supports a lower rate of turnover of direct
support staff in this small sample than what is reported in the education and social
services industries and a greatly lower rate of turnover for those that work with
individuals with developmental disabilities.
Findings suggest that two variables, rate of pay and hours of supervision, correlate
to decreased turnover. It is not surprising that rate of pay is an influencer, so this study
considered various incentive models. For example, raises were broken down into three
categories: merit-based, annually or no raises given. 59.1% of respondents report
providing employees with merit based pay increases, 31.8% were issued annually and
9.1% provided no raises. Hours of supervision provided was the second strongest
variable. This supports previous research that indicates that supervision can improve
reported employee satisfaction, which in turn decreases staff turnover (Abernathy, 1996,
2011; Bucklin & Dickinson, 2001; Jenkins, Gupta, Mitra, & Shaw, 1998).
The data showed that the amount of Registered Behavior Technicians an agency
employs increases their staff turnover rates (Behavior Analyst Credentialing Board,
292018). This is likely influenced by the increased opportunities this credential allows.
Allowing for career advancement opportunities could mitigate RBTs leaving an agency.
Training shows the smallest effect on turnover, with .01% correlation to pre-hire
training hours. However, there is a sizeable body of research that focuses on training as
an important component of staff retention (Dillenburger, McKerr & Jordan, 2016;
Parsons, Rollyson, and Reid, 2012; Reid and Parsons, 2000).). This could be an
indication that the type and quality of training may be more important than the total
number of hours spent in training, (Harchik and Campbell, 1998; Alvero, Bucklin, &
Austin, 2001). This study did not requesting information regarding specific type of
training being offered.
The data collected on supervision supports a decrease in staff turnover with a
correlation of -.29. In this study, only the amount of supervision was measured whereas
previous research suggests that interventions such as task clarification, job aides, goal-
setting, feedback, and reinforcement are effective approaches to supervising others
(Brown, 1982; Daniels & Bailey, 2014; Daniels, 2000; Gilbert, 2007; Jacobs, 2013).
These findings indicated that supervision, along with training may have greatly influence
on decreasing staff turnover, if used effectively. Supervision may successfully increase
staff retention acting as an antecedent and consequences to meaningful work
performance. The author infers that if used effectively, supervision can serve as positive
reinforcement and serve as a setting event for future successful work performance.
While this research focuses on whether agencies measure employee satisfaction
and not how to agency responds to the results of their measures, it is worth noting that
3070% of respondents report measuring satisfaction. At a minimum, this may be an
indication that an agency has an awareness that employee satisfaction (self-report) is an
important indicator to turnover.
Limitations of this study include a small sample size. The survey was sent to 240
ABA agencies and only 23 responses were received. Additionally, the survey was sent to
general email accounts and not necessarily the appropriate human resource personnel at
the agency that has this information. There was also no way to corroborate responses
from agencies or measure the amount of satisfaction staff have with the agency regardless
of turnover rate. All responses being self-reported, so it is unknown how accurate the
data are. Furthermore, these data represents a moment in time where rates of
unemployment are relatively low. Changes in the overall economic status of the country
could greatly affect these findings. Although, how the questions were written and the
length of survey could have effected responses and willingness of agencies to complete
as well as variability in responses.
Future research areas should include a larger, more representative sample. A
larger sample would allow for a better sub analysis of different regions and settings that
could not be accomplished in this study. Future research could also include a policy
analysis by state/region and how pay rate is impacted. Indeed, future research should
proceed in a three prong fashion. First, a representative nationwide survey should be
conducted. From this survey, the organizations with the lowest and highest turnover rates
could be compared and studied more in depth to reveal best practices to implement and
worst practices to limit turnover. Finally, implementing best practices in high turnover
31agencies could be studied to determine if these correlates work well as interventions. All
turnover cannot and should not be eliminated, but it should be as limited as possible
given its deleterious effects on agencies, and their financial situation, but most of all
because of the potential short term and long term harm to its vulnerable clients.
32REFERENCES
Abbasi, S. M., & Hollman, K. W. (2000). Turnover: The real bottom line. Public
Personnel Management, 29(3), 333–342.
Abernathy, W. B. (1996). The sin of wages. Memphis, TN: PerfSys Press.
Abernathy, W. B. (2011). Pay for profit. Atlanta, GA: Performance Management
Publications.
Adler, S., & Golan, J. (1981). Lateness as a withdrawal behavior. Journal of Applied
Psychology, 66, 544–554.
Acker, G. M. (1999). The impact of clients’ mental illness on social workers’ job
satisfaction and burnout. Health & Social Work, 24, (2), 112–119.
Alarcon, G. (2011). A meta-analysis of burnout with job demands, resources, and
attitudes. Journal of Vocational Behavior, 79, 549–562.
doi:10.1016/j.jvb.2011.03.007
Alvero, A. M., Bucklin, B. R. & Austin, J. (2001) An objective review of the
effectiveness and essential characteristics of performance feedback in
organizational settings (1985–1998). Journal of Organizational Behavior
Management, 21, 3–29.
Annie E. Casey Foundation (2003). The unsolved challenge of system reform: The
condition of the frontline human services workforce. Baltimore, MD: Annie E.
Casey Foundation.
33Anseel, F., & Lievens, F. (2007). The long-term impact of the feedback environment
on job satisfaction: A field study in a Belgian context. Applied Psychology, 56(2),
254–266.
American Network of Community Options and Resources [ANCOR]. (2010). 2009 direct
support professionals wage study. Alexandria, VA: American Network of
Community Options and Resources.
Arches, J. L. (1997). Burnout and social action. Journal of Progressive Human Services,
8, (2), 51–61.
Arnold, E. (2005). Managing human resources to improve employee retention. The
Health Care Manager, 24(2), 132-140.
Behavior Analyst Credentialing Board (2018). Behavior Analyst Credentialing Board.
Retrieved from https://www.bacb.com
Barton, E. E., & Wolery, M. (2007). Evaluation of e-mail feedback on the verbal
behaviors of pre-service teachers. Journal of Early Intervention, 30(1), 55–72.
doi:10.1177/ 105381510703000105
Ben-Dror, R. (1994). Employee turnover in community mental health organization: A
developmental stages study. Community Mental Health Journal, 30(3), 243–257.
Bogenshutz, M. D., Hewitt, A., Nord, D., & Hepperlen, R. (2014). Direct support
workforce supporting individuals with IDD: Current wages, benefits, and
stability. Intellectual and Developmental Disabilities, 52, 317–329.
doi:10.1352/1934-9556-52.5.317
34Boushey, H., & Glynn, S. J. (2012). There are significant business costs to replacing
employees. Center for American Progress, 16.
Braddock, D., & Mitchell, D. (1992). Residential services and developmental disabilities
in the United States: A national survey of staff compensation, turnover and
related issues. Washington, DC: American Association on Mental Retardation.
Brown, P. L. (1982). Managing behavior on the job. New York: John Wiley & Sons, Inc.
Bucklin, B. R., & Dickinson, A. M. (2001). Individual monetary incentives: A review of
different types of arrangements between performance and pay. Journal of
Organizational Behavior Management, 21(3), 45–137.
http://doi.org/10.1300/J075v21n03_03
Bureau of Labor Statistics. (2017). Bureau of Labor Statistics. Retrieved from
www.bls.gov/jlt/data.htm.
Casey, A. M., & McWilliam, R. A. (2011). The characteristics and effectiveness of
feedback interventions applied in early childhood settings. Topics in Early
Childhood Special Education, 31(2), 68–77. doi:10.1177/0271121410368141
Cherniss, C., & Krantz, D. L. (1983). The ideological community as an antidote to
burnout in the human services. In B. A. Farber (Ed.), Stress and burnout in the
human service professions, pp. 88-97. New York: Pergamon Press.
Crawford, E. R., LePine, J. A., Rich, B. L. (2010). Linking job demands and resources to
employee engagement and burnout: A theoretical extension and meta-analytic
test. Journal of Applied Psychology, 95, 834–848. doi:10.1037/a0019364
35Cooper, J. O., Heron, T. E., & Heward, W. L. (2007). Applied behavior analysis (2nd
ed.). Columbus, OH: Merrill.
Daniels, A. C., & Bailey, J. S. (2014). Performance management: Changing behavior
that drives organizational effectiveness (5th ed.). Atlanta, GA: Performance
Management Publications.
Daniels, A. C. (2000). Bringing out the best in people: How to apply the astonishing
power of positive reinforcement. New York, NY: McGraw-Hill Companies.
Demerouti, E., Bakker, A., Nachreiner, F., & Schaufeli, W. (2001). The job demands-
resources model of burnout. Journal of Applied Psychology, 86(3), 499–512.
Drolen, C. S., & Harrison, W. D. (1990). State hospital social work staff: Role conflict
and ambiguity. Administration and Policy in Mental Health, 18, (2), 127–129.
Devereux J. M., Hastings R. P., Noone S. J., Firth A. & Totsika V. (2009) Social support
and coping as mediators or moderators of the impact of work stressors on burnout
in intellectual disability support staff. Research in Developmental Disabilities 30,
367–377.
Diener, L. H., McGee, H. M., & Miguel, C. F. (2009). An integrated approach for
conducting a behavioral systems analysis. Journal of Organizational Behavior
Management, 29(2), 108–135. http://doi.org/10.1080/01608060902874534
Dillenburger, K., McKerr, L., & Jordan, J. A. (2016). Staff training in autism: The one-
eyed wo/man….International Journal of Environmental Research and Public
Health, 13(7), 716–732.
36Dwyer, D. J., & Ganster, D. C. (1991). The effects of job demands and control on
employee attendance and satisfaction. Journal of Organizational Behavior, 12,
595–608.
Evers, W. J. G., Tomic, W., & Brouwers, A. (2004). Burnout among teachers: Students’
and teachers’ perceptions compared. School Psychology International, 25, 131–
148.
Freudenberger, H. J. (1974). Staff burn-out. Journal of Social Issues, 30, 159–165.
doi:10.1111/j.1540-4560.1974.tb00706.x
Freudenberger, H. J. & Richelson, G. (1980). Burnout: The high cost of achievement,
New York: Doubleday.
Gravina, N., Villacorta, J., Albert, K., Clark, R., Curry, S., & Wilder, D. (2018). A
literature review of organizational behavior management interventions in
human service settings from 1990 to 2016. Journal of Organizational Behavior
Management, 38(2-3), 191–224.
Green, C. W., Reid, D. D., Passante, S., & Canipe, V. (2008). Changing less-preferred
duties to more-preferred: A potential strategy for improving supervisor work
enjoyment. Journal of Organizational Behavior Management, 28(2), 90–109.
Gilbert, T. F. (2007). Human competence: Engineering worthy performance (Tribute Ed).
San Francisco, CA: Pfeiffer.
Glisson, C., Dukes, D., & Green, P. (2006). The effects of the ARC organizational
intervention on caseworker turnover, climate, and culture in children’s service
systems. Child Abuse & Neglect, 30(8), 855–880.
37Glisson, C., & James, L. R. (2002). The cross-level effects of culture and climate in
human service teams. Journal of Organizational Behavior, 23, 767–794.
Grindle, C. F., Kovshoff, H., Hastings, R. P., & Remington, B. (2009). Parents’
experiences of home-based applied behavior analysis programs for young
children with autism. Journal of Autism and Developmental Disorders, 39(1), 42–
56.
Halbesleben, J. R. B. (2006). Sources of social support and burnout: A meta-analytic test
of the conservation of resources model. Journal of Applied Psychology, 91, 1134–
1145.
Hanushek, E. A., Kain, J. F., & Rivkin, S. G. (1999). Do higher salaries buy better
teachers? (Working Paper No. 7082). Cambridge, MA: National Bureau of
Economic Research.
Harchik, A. E., & Campbell, A. R. (1998). Supporting people with developmental
disabilities in their home: The role of organizational behavioral management.
Journal of Organizational Behavior Management, ˆ, 83–101.
Harris, K. J., Kacmar, K. M., & Witt, L. A. (2005). An examination of the curvilinear
relationship between leader-member exchange and intent to turnover. Journal of
Organizational Behavior, 26(4), 363–378.
Hatton C., Rivers M., Mason H., Mason L., Emerson E., Kiernan C., Reeves D., &
Alborz, A. (1999). Organizational culture and staff outcomes in services for
people with intellectual disabilities. Journal of Intellectual Disability Research
43, 206–218.
38Hatton, C., Emerson, E., Rivers, M., Mason, H., Swarbrick, R., Mason, L.,…
Alborz, A. (2001). Factors associated with intended staff turnover and job search
behaviour in services for people with intellectual disability . Journal of
Intellectual Disability Research, 45, 258–270 . doi:10.1046/j.1365-2788.
2001.00321.x
Hewitt, A., Taylor, M., Kramme, J., Pettingel, S., & Sedlezky, L. (2015). Implementing
direct support professional credentialing in New York: Technical report.
Minneapolis, MN: University of Minnesota, Research and Training Center on
Community Living. Retrieved from
https://www.opwdd.ny.gov/opwdd_about/commissioners_page/DSP-
CredentialingReport
Hiersteiner, D. (2016). National core indicators: 2015 staff stability survey report.
Cambridge, MA: Human Services Research Institute and the National Association
of State Directors of Developmental Disabilities Services, Inc.
Howard, B., & Gould, K. E. (2000). Strategic planning for employee happiness: A
business goal for human service organizations. American Journal on Mental
Retardation, 105(5), 377–386.
Hurt, A. A., Grist, C. L., Malesky, L. A., & McCord, D. M. (2013). Personality traits
associated with occupational ‘Burnout’ in ABA therapists. Journal of Applied
Research in Intellectual Disabilities, 26(4), 299–308.
Ingersoll, R. (2001). Teacher turnover and teacher shortages: An organizational analysis.
American Educational Research Journal, 38, 499–534.
39Ingersoll, R. (2003). Is there really a teacher shortage? Washington, DC: Center for the
Study of Teaching and Policy.
Jacobs, S. (2013). The behavior breakthrough: Leading your organization to a new
competitive advantage. Austin, TX: Greenleaf Book Group LLC.
Jenkins, G. D., Gupta, N., Mitra, A., & Shaw, J. D. (1998). Are financial incentives
related to performance? A meta-analytic review of empirical research. Journal of
Applied Psychology, 83(5), 777–787. http://doi.org/10.1037//0021-9010.83.5.777
Kaff, M. S. (2004). Multitasking is multitaxing: Why special educators are leaving the
field. Preventing School Failure, 48(2), 10.
Kazemi, E., Shapiro, M., & Kavner, A. (2015). Predictors of intention to turnover in
behavior technicians working with individuals with autism spectrum disorder.
Research in Autism Spectrum Disorders, 17, 106–115.
Kiekbusch, R., Price, W., & Theis, J. (2003). Turnover predictors: Causes of employee
turnover in sheriff-operated jails. Criminal Justice Studies, 16(2), 67–76.
Kim, & Kao. (2014). A meta-analysis of turnover intention predictors among U.S. child
welfare workers. Children and Youth Services Review, 47, 214–223.
Kreitner, R., Reif, W. E., & Morris, M. (1977). Measuring the impact of feedback on the
performance of mental health technicians. Journal of Organizational Behavior
Management, 1(1), 105–109. doi:10.1300/J075v01n01_08
Lambert, E. G., Griffin, M. L., Hogan, N. L., & Kelley, T. (2015). The ties that bind:
Organizational commitment and its effect on correctional orientation,
absenteeism, and turnover intent. The Prison Journal, 95(1), 135–156.
40Larson, S. A., Doljanac, R., Nord, D. K., Salmi, P., Hewitt, A. S., & O ’Neil, S. (2007).
National validation study of competencies for frontline supervisors and
direct support professionals: Final report. Minneapolis, MN: University of
Minnesota, Research and Training Center on Community Integration.
Larson, S. A. & Lakin, K. C. (1992) Direct-care staff stability in a national sample of
small group homes. Mental Retardation 30, 13–22.
Larson, S. A., Lakin, K. C. & Bruininks, R. H. (1998) Staff recruitment and retention:
study results and intervention strategies. Washington, DC: American Association
on Mental Retardation.
Larson, S. A., & Hewitt, A. S. (2005). Staff recruitment, retention, and training
strategies for community human services organizations. Minneapolis, MN:
Brookes.
Lawson, D. A., & O’Brien, R. M. (1994). Behavioral and self-report measures of staff
burnout in developmental disabilities. Journal of Organizational Behavior
Management, 14(2), 37-54.
Maslach, C. (2003). Job burnout: New directions in research and intervention. Current
Directions in Psychological Science, 12, 189–192. doi:10.1111/1467-8721.01258
Maslach, C. (1978). The client role in staff burn-out. Journal of Social Issues, 34, 111–
124. doi:10.1111/j.1540-4560.1978.tb00778.x
41Mor Barak, M. E., Nissly, J. A., & Levin, A. (2001). Antecedents to retention and
turnover among child welfare, social work, and other human service employees:
What can we learn from past research? A review and metanalysis. Social Service
Review, 75, 625–661.
Palmer, M. G., & Johnson, C. M. (2013). The effects of task clarification and group
graphic feedback on early punch-in times. Journal of Organizational Behavior
Management, 33, 265–275.
Paris, M., & Hoge, M. A. (2010). Burnout in the mental health workforce: A review.
Journal of Behavioral Health Services & Research, 37(4), 519–528.
Parsons, M. B., Rollyson, J. H., & Reid, D. H. (2012). Evidence-based staff training: A
guide for practitioners. Behavior Analysis in Practice, 5(2), 2–11.
Park, T., Shaw, J., & Kozlowski, Steve W. J. (2013). Turnover rates and organizational
performance: A meta-analysis. Journal of Applied Psychology, 98(2), 268–309.
Pfefferle, S. G., & Weinberg, D. B. (2008). Certified nurse assistants making meaning
of direct care . Qualitative Health Research, 18, 952–961.
doi:10.1177/1049732308318031
Powell, M. J., & York, R. O. (1992). Turnover in county public welfare agencies.
Journal of Applied Social Sciences, 16(2), 111–127.
President’s Committee for People with Intellectual Disabilities (2017). Report to the
president 2017: America’s direct support workforce crisis: Effects on people with
intellectual disabilities, families, communities and the U.S. economy. Washington,
DC: President’s Committee for People with Intellectual Disabilities. Retrieved
42from https://acl.gov/sites/default/files/programs/2018-
02/2017%20PCPID%20Full%20Report_0.PDF
Ramlall, S. (2003). Managing employee retention as a strategy for increasing
organizational competitiveness. Journal of Applied Human Resource
Management Research, 8, 63–72.
Razza, N. J. (1993). Determinants of direct-care staff turnover in group homes for
individuals with mental retardation. Mental Retardation, 31(5), 284.
Reid, D. H., & Parsons, M. B. (2000). Organizational behavior management in human
service settings. In J. Austin & J. E. Carr (Eds.), Handbook of Applied Behavior
Analysis (pp. 275–294). Oakland, CA: Context Press.
Riley, A. W., & Frederiksen, L. W. (1984). Organizational behavior management in
human service setting: Problems and prospects. Journal of Organizational
Behavior Management, 6, 3–16. doi: 10.1300/J075v05n03_01
Rogers, S. K., and Vismara, L. A. (2008). Evidence-based comprehensive treatments for
early autism. Journal of Clinical Child and Adolescent Psychology, 37(1), 8–38.
Robertson, J., Hatton, C., Felce, D., Meek, A., Carr, D., Knapp, M.,…Lowe K. (2005).
Staff stress and morale in community based settings for people with intellectual
disabilities and challenging behaviour: A brief report. Journal of Applied
Research in Intellectual Disabilities, 18, 271–277.
Rummler, G. A., & Brache, A. P. (1995). Improving performance: How to manage the
white space on the organization chart (2nd ed.). San Francisco, CA: Jossey-Bass
Inc.
43Schaufeli, W. B., Leiter, M. P., & Maslach, C. (2009). Burnout: 35 years of research and
practice. Career Development International, 14, 204–220. doi:
10.1108/13620430910966406
Shirom, A., & Melamed, S. (2006). A comparison of the construct validity of two
burnout measures in two groups of professionals. International Journal of Stress
Management, 13, 176–200.
Society for Human Resource Management (2012). Challenges facing HR over the next
10 years. Society for Human Resource Management. Retrieved from
https://blog.shrm.org/sites/default/files/reports/Challenges%20Facing%20Orgs%2
0and% 20HR%20in%20the%20Next%2010%20Years.pdf
Skirrow, P., & Hatton, C. (2007). ‘Burnout’ among director care workers in services for
adults with intellectual disabilities: A systematic review of research findings and
initial normative data. Journal of Applied Research in Intellectual Disabilities,
20, 131–144.
Sommer, K. L., & Kulkarni, M. (2012). Does constructive performance feedback
improve citizenship intentions and job satisfaction? The roles of perceived
opportunities for advancement, respect, and mood. Human Resource
Development Quarterly, 23(2), 177–201.
44
Strouse, M. C., Carroll-Hernandez, T. A., Sherman, J. A., & Sheldon, J. B. (2004).
Turning over turnover: The evaluation of a staff scheduling system in a
community-based program for adults with developmental disabilities. Journal of
Organizational Behavior Management, 23(2–3), 45–63.
doi:10.1300/J075v23n02
Swider, B. W., & Zimmerman, R. D. (2014). Prior and future withdrawal and
performance: A meta-analysis of their relations in panel studies. Journal of
Vocational Behavior, 84(3), 225–236.
Symes, M. D., Remington, B., Brown, T., Hastings R. P. (2006). Early intensive
behavioral intervention for children with autism: Therapists’ perspectives on
achieving procedural fidelity. Research in Developmental Disabilities, 27(1), 30–
42.
Thomas, C., & Rose J. (2010). The relationship between reciprocity and the emotional
and behavioural responses of staff. Journal of Applied Research in Intellectual
Disabilities, 23, 167–178.
Van Iddekinge, C., Roth, P., Putka, D., Lanivich, S., & Kozlowski, Steve, W. J. (2011).
Are you interested? A meta-analysis of relations between vocational interests
and employee performance and turnover. Journal of Applied Psychology, 96(6),
1167–1194.
Waldman, J. D., Kelly, F., Arora, S., & Smith, H. L. (2004). The shocking cost of
turnover in health care. Health Care Management Review, 29(1), 2.
45APPENDIX A
SURVEY INTRODUCTION
The purpose of this research project is to gather data on employee turnover and
retention at ABA agencies. This is a research project by Corinne Thornton at Temple
University. You are invited to participate in this research project, because you are an
ABA provider agency.
Your participation in this research study is voluntary. You may choose not to
participate. If you decide to participate in this research survey, you may withdraw at any
time. If you decide not to participate in this study or if you withdraw from participating at
any time, you will not be penalized.
The procedure involves completing online survey that will take approximately 10
minutes. The survey questions ask about workplace conditions that affect direct support
staff at your agency. Your responses are confidential and we do not collect identifying
information such as your name, email address or IP address.
All data are stored in a password protected electronic format. The results of this
study will be used for scholarly purposes only, and may be presented at a regional or
national ABAI meeting.
If you have any questions about this research study, please contact Corinne
Thornton at [email protected] research has been reviewed according to Temple
University IRB procedures for research involving human subjects.
46By taking this survey, you indicate that:
• you have read the above information
• you voluntarily agree to participate
• you are at least 18 years of age
This survey will be available until Friday November 2, 2018
47APPENDIX B
SURVEY
1. List up to 5 primary zip codes where the primary office(s) or location(s) of
services are provided.
2. How many direct support staff did the agency employ during the period of
January 1, 2017 to December 31, 2017?
3. How many direct support staff that were terminated from the agency during the
period of January 1, 2017 to December 31, 2017.
4. How many direct support staff voluntarily separated from the agency during the
period of January 1, 2017 to December 31, 2017?
5. What is the average length of employment of direct support staff measured in
months?
6. How many direct support staff who hold the RBT or BCaBA designation?
7. What is the average starting hourly wage for direct support staff?
8. What is the average hourly wage for direct support staff?
9. Are direct support staff offered health insurance?
10. What types of benefits does the agency offer? Click all that apply. Paid Time Off,
Tuition Reimbursement, Dental Insurance, BCBA Supervision, health insurance
11. Does the agency offer individual and company-wide incentives, such as bonuses,
gym memberships?
12. Estimate the proportion of time where direct support staff provide non-residential
support such as home/ community, school.
4813. Estimate the proportion of services that are provided to children/adolescents
versus adults.
14. How many hours of training are offered before direct support staff start providing
services?
15. How many hours are offered through-out the year?
16. How many hours a week are direct support staff offered supervision?
17. How often is feedback provided to direct support staff?
18. Are pay raises merit based, annual or none at all?
19. What is the typical staff to client ratio?
20. Does the organization measure employee satisfaction?