Embed Size (px)
Citation preview

PHYSICAL REVIEW C 100, 034614 (2019)
Proton-induced reactions on molybdenum
E. Lamere,1,2,* M. Couder,1,† M. Beard,1,‡ A. Simon,1 A. Simonetti,3 M. Skulski,1 G. Seymour,1 P. Huestis,1
K. Manukyan,1 Z. Meisel,4 L. Morales,1 M. Moran,1 S. Moylan,1 C. Seymour,1 and E. Stech1
1Department of Physics, University of Notre Dame, Notre Dame, Indiana 46556, USA2Department of Physics and Applied Physics, University of Massachusetts Lowell, Lowell, Massachusetts 01854, USA
3Department of Civil & Environmental Engineering & Earth Sciences, University of Notre Dame, Notre Dame, Indiana 46556, USA4Institute of Nuclear & Particle Physics, Department of Physics & Astronomy, Ohio University, Athens, Ohio 45701, USA
(Received 17 March 2019; published 19 September 2019)
Cross sections for 34 proton-induced nuclear reactions on isotopically enriched molybdenum (92,94−98,100Mo)leading to production of 92Tc, 93mTc, 93gTc, 94mTc, 94gTc, 95mTc, 95gTc, 96m+gTc, 97mTc, 99mTc, 101Tc, 91(m+g)Mo,93mMo, 99Mo, 89mNb, 89gNb, 91mNb, 92mNb, 95mNb, 95gNb, 96Nb, and 97m+gNb were measured in the energyrange 8–19 MeV with the activation method using individual irradiations. The experimental data were comparedwith published data from natural abundance and isotopically enriched targets as well as with the predictions ofthe nuclear reaction code TALYS. Special attention was given to the medically relevant 100Mo(p, 2n)99mTc and100Mo(p, pn)99Mo as well as nine reaction cross sections that had not previously been measured in this energyrange.
DOI: 10.1103/PhysRevC.100.034614
I. INTRODUCTION
One of the most widely used radioisotopes for medicaldiagnostics is 99mTc [1–3]. The vast majority of 99mTc iscurrently obtained as a decay product of 99Mo produced by fis-sion of 235U enriched targets in nuclear reactors. Various alter-native methods of production of 99Mo and/or 99mTc have beenproposed over the past two decades [4–7] to replace agingproduction infrastructure and to minimize the use of highlyenriched uranium. One of the proposed methods for direct99mTc production, 100Mo(p, 2n)99mTc, has been identified as apromising approach for supplementing local supplies [8–11].While the cross section of this direct method of productionhas been measured in detail, and is summarized in Ref. [12],significant questions remain to be addressed [13]. As the pro-cess to extract 99mTc from the production target material is notisotopically selective, one of the most fundamental concerns isthe characterization of the coproduction of various technetiumisotopes from reactions on other stable molybdenum speciesinherently present in the 100Mo target [14–18].
Previous studies of p + Mo reactions employing naturalabundance targets have been limited by the multiple overlap-ping (p, xn) channels present. Without detailed experimentalexcitation curves for each isotope, feasibility studies havebeen restricted to extrapolating from theoretical tools. Thestudy of Hou et al. [18] evaluates the impact of molybdenumcontaminants in the target material on patient dose but reliesexclusively on cross section calculations. The prevailing sen-timent is that such calculations are within a factor of 3 for
*[email protected]†[email protected]‡Deceased.
Maxwellian averaged (n, γ ) cross sections on stable nuclei[19]. For charged particle reactions the variation betweendifferent reaction codes and the accuracy of predicted reactionrates is known to vary by even larger margins [20,21]. Suchuncertainty is too large for medical applications involvingpatient health.
In this work, production cross sections for (p, x) reactionsfrom all stable Mo species (92Mo,94−98Mo, 100Mo) weremeasured using the charged particle activation method in anenergy range relevant for medical isotope production. The useof isotopically enriched targets allowed cross sections leadingto the formation of each technetium species to be measuredindependently. This knowledge is critical for estimationof technetium production for the arbitrary enrichmentsavailable for commercial medical production as well aspredicting the impact from target recycling. Additionally,this comprehensive dataset in the midshell region can helpconstrain nuclear models.
The present paper reports the results for technetium andniobium production from a series of irradiations performedat the Nuclear Science Laboratory at the University of NotreDame. The following section will describe the setup of theexperiment as well as present a brief introduction to thenuclear reaction calculations used to guide this study. Thefocus of the discussion will be reserved for several previouslyunmeasured cross sections as well as those cross sectionswhich display significant deviations from the theoretical cal-culations.
II. EXPERIMENTAL SETUP
A. Targets and irradiations
In order to isolate individual reaction channels, highlyisotopically enriched targets (Microfoils, USA) were used
2469-9985/2019/100(3)/034614(13) 034614-1 ©2019 American Physical Society

E. LAMERE et al. PHYSICAL REVIEW C 100, 034614 (2019)
TABLE I. Isotopic composition of enriched molybdenum targets as measured by MC-ICP-MS. The provided isotopic composition ofnatural abundance molybdenum from [22] is also provided.
Target material
Composition Natural abundance 92Mo 94Mo 95Mo 96Mo 97Mo 98Mo 100Mo
92Mo (%) 14.5246(15) 97.51(1) 0.88(1) 0.263(3) 0.252(1) 0.217(1) 0.105(1) 0.560(3)94Mo (%) 9.1514(74) 0.701(2) 93.85(1) 0.831(2) 0.2625(6) 0.193(1) 0.0814(8) 0.186(1)95Mo (%) 15.8375(98) 0.535(1) 2.831(2) 96.184(4) 1.018(2) 0.4726(5) 0.159(2) 0.296(1)96Mo (%) 16.672(19) 0.3666(8) 1.051(1) 1.572(1) 96.24(1) 1.251(2) 0.245(2) 0.367(2)97Mo (%) 9.5991(73) 0.177(1) 0.3976(7) 0.4025(6) 1.033(3) 94.23(8) 0.361(4) 0.238(2)98Mo (%) 24.391(18) 0.414(1) 0.749(3) 0.586(2) 0.978(2) 3.326(7) 98.68(2) 0.920(5)100Mo (%) 9.824(50) 0.301(2) 0.2274(9) 0.1606(6) 0.2120(4) 0.3094(7) 0.370(4) 97.4(1)
in this study. The composition of the sample material wasmeasured with multicollector–inductively coupled plasmamass spectrometry (MC-ICP-MS) and is provided in Table I.The thickness of each foil was determined using the energyloss of alpha particles from a mixed alpha source (241Amand 152Gd). A Monte Carlo calculation based on the energyloss tables from the Stopping and Range of Ions in Matterprogram (SRIM) [23] was used to determine the effectivethickness. The targets employed in this study are in the rangeof 0.5–8.5 mg/cm2. Since molybdenum is known to oxidizereadily in air, the oxidation of the targets was determinedpostirradiation by focused ion-beam measurements on thecross-sectional surface of each foil. Due to the relativelydeep sampling depth and tilted sample stage, in situ energy-dispersive x-ray spectroscopy was not able to determine theoxide stoichiometry with precision. However, the measure-ments are in agreement with an amorphous compound of50:50 MoO2 and MoO3. This oxide-metal ratio was usedto correct the SRIM calculation of the alpha energy lossmeasured for each target to obtain a corrected Mo thickness.
The targets were irradiated in a specially designed activa-tion chamber located at the exit of the University of NotreDame’s FN tandem (10 MV) accelerator. Proton beam ener-gies in the range of 8–19 MeV were chosen. Individual irradi-ations were performed in a series of runs over a several monthperiod to allow for proper tracking of the numerous decaycurves of the activated species and to allow the duration andflux to be optimized to provide consistent statistics for eachproduced radioisotope. Additionally, by employing a chargedparticle activation method with thin, single foil irradiationsthe proton energy resolution was optimized and stragglingeffects, which have been proposed by Tárkányi et al. [24] as apotential source of discrepancy in the cross section measure-ments of 100Mo(p, 2n)99mTc, were minimized. The beam spotwas focused and collimated to a well-defined circular area(<2 mm) using a pair of quadrupoles and collimators. Typicalproton currents were 400–700 nA with bombardment timesranging from 5 min to 36 h. The beam intensity on target asa function of time was monitored by an electron-suppressedFaraday cup located 35 cm downstream of the target. The tar-get irradiation station was located prior to the accelerator ana-lyzing magnet, preventing the use of the standard electrostaticaccelerator energy stabilization mechanism. Rather, the accel-erator was stabilized with the generating voltmeter and theresulting proton energy profile was measured following each
activation by removing the Faraday cup and sending the beamthrough the analyzing dipole magnet immediately down-stream of the activation chamber. By varying the magneticfield in the analyzing magnet and monitoring the beam trans-mission, the absolute value and full width at half maximum(FWHM) of the beam energy was measured. The energy of thebeam at the center of the target was calculated using the SRIMenergy loss tables. The total uncertainty of the beam energywas taken as the FWHM of the incident beam added linearlyto one half of the total energy loss calculated from SRIM.
B. Activity measurement
Following each irradiation, the gamma ray spectra ofthe activated targets were measured using a HPGe detector(depending on setup, either Canberra GC13023 or GC3518,130% and 35% relative efficiency, respectively) which wasshielded using a large Pb castle. A rigid plastic stand witha number of slots at various detector-source distances (up to140 cm) was used to ensure reproducible measurement ge-ometries. Energy and efficiency calibrations were performedperiodically throughout the experiment at each of the fixedpositions using standard sources (60Co, 133Ba, 137Cs, 152Eu,and 241Am) in the energy range 60–2000 keV using 19 of thestrongest gamma ray lines. Detector efficiencies for measuredgamma ray lines from the activated targets were interpo-lated from a seventh-order polynomial fit of the logarithmof efficiency as a function of the logarithm of gamma rayenergy in keV. True-coincidence summing corrections weredetermined using a GEANT4 [25] simulation of the detectorsetup. Due to the relatively large source-detector distances,these corrections were small, typically on the order of a fewpercent for the closest geometries employed.
No chemistry was performed on the foils prior to assaying.The cooling time between end of bombardment (EOB) andthe start of counts (SOC) was generally less than 10 min,allowing short-lived isotopes (e.g., 92Tc, T1/2 = 4.25 ± 15 m)to be observed. The targets were monitored over the courseof several weeks to months depending on the half-lives of theactivated species. Corrections due to high count rates wereapplied. While the deadtime of the system was typically lessthan 10%, the data acquisition system was shown to be linearup to 60% deadtime using the moving source method outlinedin Ref. [26]. This was particularly important for short livedisotopes where the initial deadtime was briefly observed to beup to 50%.
034614-2

PROTON-INDUCED REACTIONS ON MOLYBDENUM PHYSICAL REVIEW C 100, 034614 (2019)
1. Interference corrections
The activation method is a well established technique [27]which relies on the solution to a modified set of Batemanequations. The production cross section for radioisotopes thatare long-lived relative to the irradiation time can be obtainedusing this method by quantifying the number of atoms presentat the end of bombardment through measurement of the in-duced activity. Proton bombardment of a molybdenum targetproduces a large number of radioisotopes, several of whichemit overlapping energy gamma rays as a signature of theirdecay (see Table II). Common decay products often result inmany of the most prominent gamma lines being shared, notjust for produced isomers but also for several other neighbor-ing species pairs (e.g., 96Tc and 96Nb, 95Tc and 95Nb, 93Tcand 93mMo). Additionally, the decay of independent nucleican produce gamma rays with energies which are not wellseparated in the detector (e.g., 96Tc and 94Tc, 95Tc and 94Tc,94Tc and 92Tc and 89Nb). In order to disentangle the variouscomponents of a particular gamma ray line, the count ratewas tracked over many half-lives and fit with constrained ex-ponential functions corresponding to each produced isotope.This allowed different contributions to be separated based ontheir isotopic origin. When possible, the consistency of thefitting procedure was investigated by comparing the evaluatedactivity for each species for multiple of the more intensegamma lines.
The presence of multiple decay chains with various branch-ing ratios necessitates an extension to the simple activationformula. While more cumbersome, see Table III, the generalsolution to the underlying differential equation is known [31].For this work, only decay chains with three or fewer nuclideswere included. Feeding from more complicated decay path-ways was not significant. The number of observed counts fora gamma line is given by the sum over all elements, i, of thedecay chain,
C[t] = ε[E ]∑
i
IiλiN[t]i, (1)
where ε[E ] is the detector photopeak efficiency at energy E ,Ii is the gamma intensity, λi is the decay constant, and N (t )i isthe number of nuclei. By expanding and regrouping in termsof e−λi , one can find, in the simple case of a two chain decaywith branching,
σ1 = 1
η�
D1
(1 − e−λ1tb )(
f Iγ2λ2
λ1−λ2+ Iγ1
) ,
σ2 = 1
η�
[D2
(1 − e−λ2tb )
1
Iγ2
+ D1
(1 − e−λ1tb )
f λ1
Iγ2 f λ2 + Iγ1 (λ2 − λ1)
], (2)
where D1 and D2 are the intercepts of the fitting equations att = EOB, with D1 + D2 = C[EOB], η is the number of targetatoms, � is the incident particle flux, and f is the branchingratio from 1 → 2. From Eq. (2), it is possible to extractthe cross section for both radioisotopes in the decay chainsimultaneously by fitting the decay curve. In practice, this
TABLE II. A summary of the nuclear data for the investigatedradioisotopes observed in the γ spectrum obtained from the NNDCNuDat 2.7 database [28]. The decay product, branching ratio, half-life, and the principal γ emissions used for quantification areprovided.
Product Daughter f (%) Half-life Eγ (keV) Iγ (%)
101Tc 101Ru 100 14.22(1) m 306.83(3) 89(4)99mTc 99Tc 99.9963(6) 6.0072(9) h 140.511(1) 89(4)
99Ru 0.0037(6)97mTc 97Tc 96.06(18) 91.0(6) d 96.5(1) 0.320(3)
97Mo 3.94(18)96mTc 96Tc 98.0(5) 51.5(10) m
96Mo 2.0(5)96Tc 96Mo 100 4.28(7) d 849.86(4) 98(4)
778.22(4) 99.76(1)812.54(4) 82(3)
1126.85(6) 15.2(12)434.71(5) 0.75(5)568.88(7) 0.92(6)
1091.30(4) 1.10(8)95mTc 95Tc 3.88(32) 61(2) d 204.117(2) 63.2(8)
95Mo 96.12(32) 582.082(3) 30.0(4)786.198(4) 8.65(12)820.624(5) 4.71(6)835.149(5) 26.6(4)
95Tc 95Mo 100 20.0(1) h 765.789(9) 93.8(3)869.60(3) 0.317(8)
1073.71(2) 3.74(4)204.12(1) 0.304(23)785.93(2) 0.145(8)947.67(2) 1.951(19)
94Tc 94Mo 100 293(1) m 871.05(7) 99.900(0)702.67(7) 99.6(18)849.74(7) 95.7(18)916.10(15) 7.6(4)449.2(3) 3.3(3)532.1(3) 2.35(25)
1592.1(3) 2.25(20)94mTc 94Mo 100 52.0(10) m 871.05(7) 94.2(5)
1522.1(2) 4.5(3)1868.68(8) 5.7(3)
993.19(9) 2.21(3)93Tc 93Mo 100 2.75(5) h 1362.94(7) 66.2(6)
1477.14(8) 8.7(5)1520.28(9) 24.4(8)
93mTc 93Tc 77.4(6) 43.5(10) m 391.83(8) 58.3(9)93Mo 22.6(6)
92Tc 92Mo 100 4.25(15) m 1509.6(3) 101(3)148.0(6) 71(4)329.3(3) 80(3)773.0(3) 99.857(0)
89mNb 89Zr 100 66(2) m 588.0(2) 95.57(13)89Nb 89Zr 100 2.03(7) h 1627.2(2) 3.5(7)
1833.4(2) 3.3(7)1511.4(3) 1.9(4)
91mNb 91Nb 96.6(5) 60.86(22) d 1204.67(8) 2.0(3)91Zr 3.4(5)
92mNb 92Zr 100 10.15(2) d 934.44(10) 99.15(4)
034614-3

E. LAMERE et al. PHYSICAL REVIEW C 100, 034614 (2019)
TABLE II. (Continued.)
Product Daughter f (%) Half-life Eγ (keV) Iγ (%)
95mNb 95Nb 94.4(6) 3.61(3) d 235.69(2) 24.8(8)95Mo 5.6(6)
95Nb 95Mo 100 34.991(6) d 765.803(6) 99.808(7)96Nb 96Mo 100 23.35(5) h 568.871(12) 58.0(3)
778.224(15) 96.45(22)97Nb 97Mo 100 72.1(7) m 657.94(9) 98.23(8)91Mo 91Nb 100 15.49(1) m 1637.3(1) 0.329(21)
1581.5(1) 0.226(14)93mMo 93Mo 99.88(1) 6.85(7) h 1477.138(3) 99.1(11)
93Nb 0.12(1) 684.693(21) 99.9(8)263.049(13) 57.4(11)
99Mo 99Tc 12.27 65.924(6) h 140.511(1) 5.1(2)a
99mTc 87.73 181.068(8) 6.05(12)739.500(17) 12.20(16)
aThis value refers to the gamma intensity of 99Mo directly rather thanthe gamma intensity of the 140.5 keV line in equilibrium with 99mTc.This value is taken from [29]. Other authors have used a slightlylower value from Be et al. [30]. The impact of this change on the99mTc production cross section in this proton energy range is minor.
expression was modified to include contributions from openreaction channels on trace Mo contamination in the target.This was accomplished by solving the differential equationsin Table III with additional production terms.
The need to separate contributions from decay chainshas been addressed explicitly in several recent works[11,24,29,32–34] specifically for the 99Mo→99mTc decaychain. This treatment of the growth/decay is a generalizationapplicable for all the cases in this work. From the solutionsprovided in Eq. (2), it is possible to express a cumulative crosssection for a long-lived daughter,
σ eff2 = σ2 + f λ1
λ1 − λ2σ1, (3)
where σ eff2 is the effective cross section for the production of
the daughter isotope following the decay of the feeding iso-tope. Equation (3) was used to provide calculated cumulativecross sections for comparison to published experimental datain the results section.
It has been suggested that many of the earlier worksmeasuring 100Mo(p, 2n)99mTc inadvertently reported the ef-fective cross section, from direct production and decay into99mTc [12]. Such an explanation could possibly account forthe discrepancies at higher proton energy (Ep > 20 MeV),where the 100Mo(p, pn)99Mo cross section becomes large. Thescatter in literature values below 13 MeV where the crosssection for 100Mo(p, pn)99Mo is relatively small remains notwell understood.
2. Uncertainties
The activity of each isotope was measured using betweenone and eight independent gamma ray lines. A weighted sumfor each isotope was used to determine the EOB activity.The correlation of the fitting parameters for the decay curveswas taken into account when determining the uncertainty inthe EOB activity. The typical uncertainty associated with theintercept from the decay curve fitting was 1–10%. To deter-mine the total uncertainty in the cross section, this uncertaintyin the activity was added in quadrature to the uncertaintyfrom the HPGe calibration (2–4%), the summing corrections(<1%), and the nuclear data (typically 2–5%). Additionally,the uncertainty in the target thickness from the MC SRIMcalculation and fitting (10%), the target composition fromMC-ICP-MS measurements (<0.5%), the oxide correctionsfrom focused ion beam measurements (10%), and the protonflux calibration (1%) were added linearly to the statisticalcross section uncertainty. An overview of typical uncertaintiesis provided in Table IV.
C. Nuclear model calculations
In the energy and mass range considered in this work,cross sections were evaluated using a statistical formalismfor nuclear reactions, developed by Wolfenstein, Hauser, andFeshbach [35,36]. This framework relies on the choice ofnumerous underlying theoretical models for various nuclearphysics inputs. Several nuclear reaction codes exist, the mostprevalent in medical isotope production studies are EMPIRE[37] and TALYS [38,39], which are meant to be general,flexible, and straightforward tools for researchers. Both codesallow the choice of nuclear input models to be varied while
TABLE III. The differential equations governing the production and decay of the produced radioisotopes of a two member decay chain(1 → 2) are provided. The solution to these equations, found in a similar form in Ref. [12], represents a simplified case of a more general classof problems [31]. In these equations, N is the number of nuclei, R is the production rate during bombardment, assumed constant (R = ση�),and tb is the duration of bombardment. Note that the solution is valid only for t > tb.
Differential equation Solution (for t > tb)
dN1 ={
(R1 − λ1N1)dt : 0 < t < tb
−λ1N1dt : tb < tN1[t] = R1(1 − e−λ1tb )e−λ1(t−tb )
λ1
dN2 ={
(R2 − λ2N2 + f λ1N1)dt : 0 < t < tb
(−λ2N2 + f λ1N1)dt : tb < tN2[t] = (1/λ2)(R2 + f λ1
λ1−λ2R1)(1 − e−λ2tb )e−λ2 (t−tb )
− fλ1−λ2
R1(1 − e−λ1tb )e−λ1(t−tb )
with Initial Conditions : N1(0) = N2(0) = 0
034614-4

PROTON-INDUCED REACTIONS ON MOLYBDENUM PHYSICAL REVIEW C 100, 034614 (2019)
TABLE IV. Typical uncertainty values (%) considered in thecross section calculation.
Typical uncertainty (%)
Decay curve fitting 1–10HPGe efficiency calibration 2–4Summing corrections <1Nuclear data 2–5Target thickness 10Target composition <0.5Oxide correction 10Proton flux calibration 1Total ∼15–25
also incorporating contributions from pre-equilibrium anddirect reactions.
Such attributes make these codes useful for investigat-ing the feasibility of producing medical quantities of 99mTcthrough proton bombardment. EMPIRE has been used tocalculate yields of coproduced radionuclidic impurities usingnatural abundance and enriched 100Mo targets [40]. Thesecalculations are being used to optimize irradiation condi-tions (duration, current, target composition and thickness,and incident energy) to quantify and minimize patient doseincrease. However, as Celler et al. [40] discuss, experimentalcross section measurements are critical to feasibility studiesof 99mTc production as different nuclear model inputs canproduce significant variation in statistical model predictedcross sections.
One of the goals of the nuclear calculation section of thiswork is to investigate how well the default parameters usedin such reaction codes reproduce our experimental data aswell as other data available in the literature. Additionally, byvarying the model input choice, the theoretical variation incross section in this mass region can be investigated.
Calculations were performed using the nuclear model codeTALYS 1.8. An example input file is provided in the Supple-mental Material [41]. Independent variation of all the avail-able parameters in TALYS is outside the scope of this study.To limit the number of calculations performed, the parameterssignificantly impacting the cross section estimate were variedin TALYS (i.e., the choice of level density, optical modelpotential, γ strength function, and deformation parameter).This variation was used to estimate the uncertainty that modelchoice has on cross section calculations. The first and thirdquartile (corresponding to the gray band in the cross sectionplots) as well as the maximum and minimum values (dashedlines) for each energy point are plotted with the experimentalmeasurements. Calculations which combined phenomenolog-ical and semimicroscopic models were excluded. Addition-ally, the results of the default TALYS calculations (black, solidline) are provided.1
1Note that the default calculation does not represent a me-dian value in the TALYS calculation band and occasionally [e.g.,97Mo(p, n)97mTc ] defines the extreme in certain energy ranges.
III. RESULTS AND DISCUSSION
The irradiation of molybdenum targets with a ∼20 MeVproton beam results in the production of various technetium,molybdenum, and niobium species through (p, γ ), (p, xn),(p, pn), (p, α), and (p, nα) reaction channels. For each molyb-denum target, we report on cross sections larger than >0.5 mbwhenever possible. Additionally, an effort was made to mea-sure the production cross section of isomeric and ground statesindependently. These results are summarized in Table V.Cumulative cross sections are provided when this separationwas not possible, for instance when the metastable state isshort lived or has weak intensity (e.g., 96(m+g)Tc) or whenmultiple production pathways are open on the same target[e.g., 100Mo(p, pn)99Mo and 100Mo(p, 2p)99Nb→99Mo].
For the sake of brevity, only cross section measure-ments which show disagreement with previous literature orfor which no previous literature exists will be discussedin detail. The measurements for 100Mo(p, 2n)99mTc and100Mo(p, pn)99Mo, despite being well measured previously,are included due to their importance for medical isotopeproduction. The cross sections for this subset of the dataare plotted in Figs. 1–9, along with TALYS calculations, andprevious measurements for comparison. A comprehensive setof figures for all our results is provided in the SupplementalMaterial [41]. In the discussion section, the default TALYS
cross section will be used for comparison with the data fromthis work. As discussed by Takács et al. [42], the adopted crosssection for the natMo (p, x)96(m+g)Tc used by Levkovski as amonitor reaction has to be revised. Therefore, in all the figuresa scaling factor of 0.75 has been applied to the results ofLevkovski as suggested by [12] for this reaction. Additionally,reported data sets from natural abundance targets have beenscaled, when appropriate, based on the isotopic compositionfrom Table I for direct comparison with this work. Thesedata sets are marked with a asterisks (∗) in the figure legend.The first author’s surname and final two digits of the year ofpublication for each data set are provided in the legend forcross reference between figures.
A. Technetium production
The measurement of cross sections for technetium produc-tion through (p, xn) reactions was the primary objective of thiswork. In total, 20 individual Tc excitation curves were mea-sured that, to a large degree, agree with available literature.However, five reactions, 92Mo(p, n)92Tc, 92Mo(p, γ )93m,gTc,97Mo(p, n)97mTc, and 98Mo(p, 2n)97mTc, had not previouslybeen measured.
1. 92Mo(p, n)92Tc reaction
The activity of 92Tc, produced exclusively from92Mo(p, n), was determined from four gamma decay lines(148.0, 329.3, 773.0, and 1509.6 keV). While displaying avery similar trend to the TALYS calculations, our measure-ments suggest that TALYS underpredicts this cross section by30% (see Fig. 1). Despite this larger than anticipated crosssection, 92Tc will not constitute a significant concern as aradiocontaminant in 99mTc production from proton irradiationdue to its short half-life and stable decay product.
034614-5

E. LAMERE et al. PHYSICAL REVIEW C 100, 034614 (2019)
TABLE V. Measured cross section data for the formation of Tc, Mo, and Nb radionuclides.a
Reactant Proton energy (MeV) Cross section (mb) for product
92Mo 89mNb 89Nb 91(m+g)Mo 91mNb cum 92Tc 93mTc 93Tc
10.52(6) 0.106(15) 0.17(4) 233(33) 1.77 (26) 3.4 (5)13.03(6) 1.07(16) 1.6(4) 0.82(22) 483(72) 0.55(8) 1.42(22)15.07(2) 2.5(5) 4.3(12) 10.4(29) 550(110) 0.56(12) 1.09(24)16.07(2) 3.3(6) 6.2(17) 28(11) 20(6) 467(90) 0.57(13) 1.04(21)17.05(4) 4.3(7) 8.4(21) 143(29) 40(10) 457(73) 0.45(11) 0.98(20)18.07(2) 5(1) 11(3) 246(54) 67(19) 331(65) 0.50(13) 1.13(26)
94Mo 91mNb 93mMo 93mTc 93Tc 94mTc 94Tc
9.04(4) 345(72) 74(15)10.06(4) 3.4(9) 445(63) 97(14)11.05(4) 5.1(14) 469(66) 123(17)12.05(4) 4.9(13) 481(70) 145(21)13.04(5) 4.3(12) 465(89) 172(33)14.04(5) 5.6(16) 7.7(15) 363(70) 156(30)15.04(5) 4.2(11) 20(3) 134(20) 262(39) 128(19)16.06(4) 4.9(15) 0.12(3) 65(14) 292(65) 175(39) 105(23)17.06(3) 6.0(16) 0.21(4) 111(18) 457(76) 118(20) 73(12)18.05(4) 4.8(16) 0.48(13) 103(27) 391(102) 59(15) 36(10)19.06(3) 5.3(17) 0.85(21) 121(30) 467(116) 45(11) 26(7)
95Mo 91mNb 92mNb 94mTc 94Tc 95mTc 95Tc
10.57(2) 2.0(5) 160(40) 373(92)12.01(8) 3.3(6) 159(31) 412(81)13.02(7) 0.07(4) 4.5(10) 21(5) 15(3) 154(34) 436(97)14.03(6) 0.27(12) 5.2(7) 150(21) 107(15) 100(14) 306(42)15.07(2) 4.5(10) 236(50) 179(38) 59(13) 181(39)16.03(6) 1.1(3) 5.1(10) 326(66) 238(48) 35(7) 118(24)17.99(6) 3.4(10) 3.5(7) 385(76) 324(64) 16(3) 50(10)19.03(6) 3.9(13) 2.8(6) 420(93) 310(69) 11.1(25) 35(8)
96Mo 92mNb 95mTc 95Tc 96(m+g)Tc
8.04(5) 489(68)10.06(3) 767(126)11.07(3) 778(187)11.55(4) 700(113)12.07(3) 8(2) 61(17) 652(160)12.55(4) 43(6) 94(13) 714(104)13.06(3) 86(12) 176(25) 543(80)14.05(4) 0.18(7) 190(36) 379(72) 399(76)15.05(3) 0.25(6) 250(59) 506(119) 244(57)16.05(4) 0.71(12) 273(45) 580(97) 149(25)17.05(4) 1.95(29) 270(40) 605(91) 97(15)18.05(4) 4.3(6) 285(39) 683(94) 74(10)19.06(3) 7.1(11) 281(45) 721(116) 61(10)
97Mo 96(m+g)Tc 97mTc
9.01(8) 134(29)10.05(4) 156(34)10.98(11) 13.0(30) 160(33)11.98(10) 238(51) 110(28)13.02(6) 473(73) 67(15)14.02(6) 690(110) 43(10)15.04(6) 769(125) 27(6)
034614-6
PROTON-INDUCED REACTIONS ON MOLYBDENUM PHYSICAL REVIEW C 100, 034614 (2019)
TABLE V. (Continued.)
Reactant Proton energy (MeV) Cross section (mb) for product
98Mo 95mNb 95Nb 97mTc 99mTc10.06(3) 1.01(15) 0.63(10) 6.4(15) 0.33(10)11.06(3) 1.23(21) 0.90(18) 71(15) 0.13(9)12.05(4) 1.9(4) 1.6(3) 158(36) 0.25(12)13.06(3) 2.0(3) 2.6(4) 209(44) 0.17(11)14.05(3) 2.8(4) 3.5(6) 256(52) 0.33(13)15.05(3) 2.9(4) 5.4(8) 290(60) 0.35(13)16.06(3) 3.0(5) 5.2(9) 268(56) 0.33(13)17.06(3) 2.6(4) 5.1(8) 262(54) 0.22(11)18.02(2) 2.0(5) 4.1(10) 202(54) 0.15(9)19.05(4) 1.80(29) 4.5(7) 213(45) 0.24(9)
100Mo 96Nb 97(m+g)Nb 99Mo 99mTc 101Tc
8.01(8) 0.19(3) 0.0033(11) 0.35(5) 0.43(7)9.01(7) 0.53(7) 0.035(5) 67(9) 0.45(7)
10.07(2) 1.05(22) 1.5(3) 145(31) 0.53(12)11.01(7) 1.80(29) 1.29(21) 195(31) 0.54(10)12.02(6) 2.6(4) 4.7(6) 224(30) 0.55(9)13.03(6) 3.6(5) 11.9(17) 254(37) 0.63(10)14.03(2) 0.23(3) 4.2(6) 21(3) 249(35) 0.60(10)15.07(2) 0.59(16) 4.3(12) 33(9) 239(64) 0.60(17)16.04(5) 1.38(19) 4.6(6) 48(7) 240(34) 0.48(8)17.03(5) 2.6(4) 4.7(7) 64(9) 241(34) 0.45(7)18.07(2) 3.7(9) 4.3(11) 79(19) 228(56) 0.44(11)19.07(2) 5.8(12) 4.5(10) 103(22) 226(48) 0.54(14)
aNote that cumulative cross sections are marked with “cum” in superscript for isotopes which have contributions from short-lived decayproducts. Isotopes that are fed directly by their isomer (which was not measured) are marked “(m + g)”.
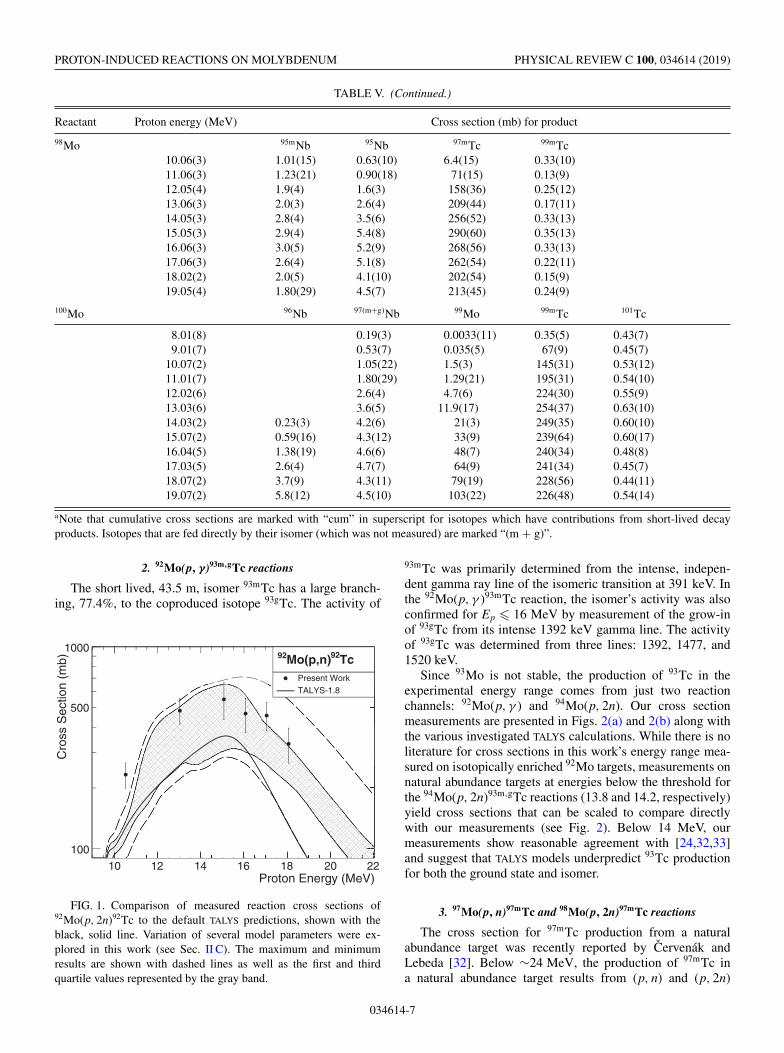
2. 92Mo(p, γ)93m,gTc reactions
The short lived, 43.5 m, isomer 93mTc has a large branch-ing, 77.4%, to the coproduced isotope 93gTc. The activity of
Proton Energy (MeV)10 12 14 16 18 20 22
Cro
ss S
ectio
n (m
b)
100
500
1000
Present WorkTALYS-1.8
Tc92Mo(p,n)92
FIG. 1. Comparison of measured reaction cross sections of92Mo(p, 2n)92Tc to the default TALYS predictions, shown with theblack, solid line. Variation of several model parameters were ex-plored in this work (see Sec. II C). The maximum and minimumresults are shown with dashed lines as well as the first and thirdquartile values represented by the gray band.
93mTc was primarily determined from the intense, indepen-dent gamma ray line of the isomeric transition at 391 keV. Inthe 92Mo(p, γ )93mTc reaction, the isomer’s activity was alsoconfirmed for Ep � 16 MeV by measurement of the grow-inof 93gTc from its intense 1392 keV gamma line. The activityof 93gTc was determined from three lines: 1392, 1477, and1520 keV.
Since 93Mo is not stable, the production of 93Tc in theexperimental energy range comes from just two reactionchannels: 92Mo(p, γ ) and 94Mo(p, 2n). Our cross sectionmeasurements are presented in Figs. 2(a) and 2(b) along withthe various investigated TALYS calculations. While there is noliterature for cross sections in this work’s energy range mea-sured on isotopically enriched 92Mo targets, measurements onnatural abundance targets at energies below the threshold forthe 94Mo(p, 2n)93m,gTc reactions (13.8 and 14.2, respectively)yield cross sections that can be scaled to compare directlywith our measurements (see Fig. 2). Below 14 MeV, ourmeasurements show reasonable agreement with [24,32,33]and suggest that TALYS models underpredict 93Tc productionfor both the ground state and isomer.
3. 97Mo(p, n)97mTc and 98Mo(p, 2n)97mTc reactions
The cross section for 97mTc production from a naturalabundance target was recently reported by Cervenák andLebeda [32]. Below ∼24 MeV, the production of 97mTc ina natural abundance target results from (p, n) and (p, 2n)
034614-7

E. LAMERE et al. PHYSICAL REVIEW C 100, 034614 (2019)
Proton Energy (MeV)8 10 12 14 16 18
Cro
ss S
ectio
n (m
b)
1
10Cervenak ('16)*
Lebeda ('10)*
Tarkanyi ('12)*
Present Work
TALYS-1.8
Tc93g)γMo(p,92
Proton Energy (MeV)8 10 12 14 16 18
Cro
ss S
ectio
n (m
b)
0.1
1
10 Cervenak ('16)*
Lebeda ('10)*
Tarkanyi ('12)*
Present Work
TALYS-1.8
Tc93m)γMo(p,92
FIG. 2. Comparison of measured reaction cross sections of92Mo(p, γ )93Tc to TALYS calculations (see Fig. 1 for description).The data are from this work and from [24,32,33]. Equation (3) wasused to calculate the values of 92Mo(p, γ )93gTc for [33].
Proton Energy (MeV)8 9 10 11 12 13 14 15 16
Cro
ss S
ectio
n (m
b)
20
100
300
Present WorkTALYS-1.8
Tc97mMo(p,n)97
FIG. 3. Comparison of measured reaction cross sections of97Mo(p, n)97mTc to TALYS calculations (see Fig. 1 for description).
Proton Energy (MeV)10 12 14 16 18 20
Cro
ss S
ectio
n (m
b)
10
100
Present WorkTALYS-1.8
Tc97mMo(p,2n)98
FIG. 4. Comparison of measured reaction cross sections of98Mo(p, 2n)97mTc to TALYS calculations (see Fig. 1 for description).
reactions on 97Mo and 98Mo, respectively. With the exceptionof a small proton energy range between 14 and 17 MeV, wherewe report a roughly 30% higher value, our results scaledfor natural abundance support this earlier work. Importantly,however, we are able to separate the two contributions. Ourresults show that theoretical models reproduce the shapeof the excitation curve for 97Mo(p, n), but underpredict theamplitude by roughly 20% (see Fig. 3). For 98Mo(p, 2n)97mTcthe agreement is worse, with a qualitatively different shapeand an underprediction of the magnitude of the cross sectionabove 13 MeV by nearly 70% (see Fig. 4). Since 98Mo isthe closest stable molybdenum isotope in mass to 100Mo,and has the highest natural abundance, it will be the primarycontaminant in an enriched 100Mo target. Therefore, un-derstanding the production of radionuclidic impurities from98Mo(p, xn) is critical for determination of the feasibility ofcyclotron produced 99mTc. Such deviations from statisticalmodel calculations could significantly impact dose increasecalculations. Uncertainty in the production of 97mTc is of par-ticular concern as the quality control test for the radionuclidicpurity of cyclotron-produced 99mTc proposed by Tanguayet al. [43] will be insensitive to this contaminant due to itslow energy (96 keV) gamma ray.
4. 100Mo(p, 2n)99mTc reaction
The majority of literature available on the production oftechnetium through proton bombardment reactions, (p, xn),concerns 99mTc at medical cyclotron energies (10–24 MeV).As 99Mo is unstable and the cross section of 98Mo(p, γ ) isminimal (<0.5 mb), 99mTc production stems mainly from justone channel, allowing results from natural abundance targetsto be extended to 100Mo(p, 2n).
The activity of 99mTc was measured from the 140.5-keVgamma ray line, which required removing the contribution of99Mo and also the small (p, γ ) contribution from contaminant98Mo in the target. At higher proton energies, attention mustalso be paid to the interfering gamma ray at 141.18 keVof 90Nb produced primarily (at energies below 28 MeV) by
034614-8

PROTON-INDUCED REACTIONS ON MOLYBDENUM PHYSICAL REVIEW C 100, 034614 (2019)
Proton Energy (MeV)6 8 10 12 14 16 18 20
Cro
ss S
ectio
n (m
b)
1
10
100
Alharbi ('11)
Challan ('07)*
Khandaker ('06)
Lag. Solar ('91)
Lebeda ('10)*
Manenti ('14)
Takacs ('15)
Present Work
Cervenak ('16)*
Gagnon ('11)
Khandaker ('07)
Lag. Solar ('99)
Levkovskij ('91)
Scholten ('99)
Tarkanyi ('12)
TALYS-1.8
Tc99mMo(p,2n)100
Proton Energy (MeV)6 8 10 12 14 16 18 20
Cro
ss S
ectio
n (m
b)
0
50
100
150
200
250
300
350
400
450Tc99mMo(p,2n)100
FIG. 5. Comparison of measured reaction cross sections of 100Mo(p, 2n)99mTc to TALYS calculations (see Fig. 1 for description) shown inboth logarithmic (left) and linear scale (right). The data are from this work and from [8,9,11,24,29,32–34,44–49]. Note that (1) the data ofTakács et al. [34] include their reevaluated values from Takács et al. [50]; (2) the measurements of Lagunas-Solar have not been corrected forproduction of 90Nb in the natural abundance target. Below 20 MeV, however, the cross section for production, primarily 94Mo(p, nα)90Nb, isnegligible.
reactions on 94Mo, although channels from 92Mo and 95Moare also open. Due to the high enrichment of the 100Mo targetand incident energies below 20 MeV, this correction wasinsignificant.
The results from this work are displayed in Fig. 5 togetherwith numerous previous measurements and the TALYS cal-culations. There appears to be a large amount of scatter inthe published values, especially above 11 MeV, the source ofwhich is uncertain. Several suggestions exist in the literatureregarding possible causes, with the most promising expla-nation being the improper treatment of grow-in from copro-duced 99Mo as mentioned previously. However, it appears thatmore than one issue may be involved as the cross section of100Mo(p, pn)99Mo below 12 MeV is <5 mb and from Fig. 5 itis clear that the literature data sets diverge significantly belowthis energy.
Our data support the work of [16,24,32,34] and the reevalu-ated work of [50], which collectively suggest an intermediate-to-low value for the cross section up to 19 MeV. The data from[8,11,29,45,48,49] are higher, with the measurements of [8]having the worst agreement with other data sets. Conversely,the measurements of [9,46,47], and to some extent—althoughthere is moderate scatter—[44], suggest a lower cross section.Our results, along with nearly all other data sets, disagree withthe TALYS results, which underpredict the cross section above10 MeV. This discrepancy is highly consequential for feasibil-ity studies that rely on nuclear models as variation in this crosssection directly impacts the expected radionuclidic purity.
B. Molybdenum production
Production of Mo both directly and indirectly [e.g.,95Mo(p, 2n)94Tc→94Mo] will cause evolution of the target’sisotopic composition, a factor known to significantly im-pact the efficacy and non-99mTc patient dose in producedradiopharmaceuticals [18,40]. While the present experimental
method does not allow for the measurements of cross sectionsleading to stable isotopes, the cross section measurements ofthe unstable Mo species, 91mgMo, 93mMo, and 99Mo, may helpguide more accurate statistical model predictions for reactionsproducing stable Mo. Together with our measurements, thesemodel constraints will allow more accurate determinationof the evolution of the target’s composition after multiplereprocessing cycles.
1. 92Mo(p, 2n)91(m+g)Mo reaction
The ground state of 91Mo is produced both directly via92Mo(p, pn)91gMo and also through the production and decayof its short-lived (65.0 s) isomer, 91mMo. Since the isomer’slifetime is too short to measure with the activation setup
Proton Energy (MeV)14 15 16 17 18 19
Cro
ss S
ectio
n (m
b)
0.1
1
10
100
1000
Present WorkTALYS-1.8
Mo91mg
Mo(p,pn)92
FIG. 6. Comparison of measured reaction cross sections of92Mo(p, pn)91(m+g)Mo to TALYS calculations (see Fig. 1 for descrip-tion). The data are from this work and from [24,32,46].
034614-9

E. LAMERE et al. PHYSICAL REVIEW C 100, 034614 (2019)
Proton Energy (MeV)16 16.5 17 17.5 18 18.5 19 19.5 20
Cro
ss S
ectio
n (m
b)
0.1
1
10
Cervenak ('16)*
Khandaker ('07)*
Tarkanyi ('12)*
Present Work
TALYS-1.8
Mo93mMo(p,pn)94
FIG. 7. Comparison of measured reaction cross sections of94Mo(p, pn)93mMo to TALYS calculations (see Fig. 1 for description).The data are from this work and from [24,32,46].
used in this work, a cumulative cross section is reported. Theactivity of 91gMo was quantified from its most intense gammaray line at 1637.3 keV (Iγ = 0.329%) after allowing sufficienttime for 91mMo to decay completely. To our knowledge, thisis the first cross section measurement for this reaction. Theresults, shown in Fig. 6, show good agreement with the TALYS
calculated values.
2. 94Mo(p, 2n)93mMo reaction
The activity of 93mMo was determined from its 1477-,684-, and 263-keV peaks. While it can be produced by both94Mo(p, pn) and 95Mo(p, p2n), the (p, p2n) reaction thresholdwas too high (∼19 MeV) to be observed during this experi-ment. As shown in Fig. 7, there is a large spread in the reporteddata for this reaction. Early measurements from Khandakeret al. [46] appear too large at Ep � 19 MeV. Tárkányi et al.[24] have three data points between 19 and 24 MeV which
seem to display some scatter making the trend difficult todetermine. The most recent paper from Cervenák and Lebeda[32] report a moderately larger (2×) cross section. Whilesignificantly lower than the rest of the measured work, ourpoints have smaller statistical error bars on this weak reactiondue to the use of an enriched target.
3. 100Mo(p, pn)99Mo reaction
At proton beam energies higher than Ep > 12 MeV 99Mo isproduced from 100Mo directly through 100Mo(p, pn)99Mo andindirectly through the decay of 99Nb, (i.e., 100Mo(p, 2p)99Nb→99Mo). Since the half-lives of 99mNb and 99gNb are just 15 sand 2.6 m, respectively, papers typically report a cumulativecross section for the production of 99Mo. Since our maximalenergy is above the threshold for 100Mo(p, 2p)99Nb of 11.3MeV, but below the energy where the reaction becomes appre-ciable (∼24 MeV), the reported cross sections have virtuallyno contribution from 99Nb, but can still be considered acumulative cross section.
The activity of 99Mo was determined from the independentgamma ray lines at 181 and 739 keV, as well as 140 keV,which is shared with the decay of 99mTc. Our cross sectionmeasurements for 100Mo(p, pn)99Mo, as well as the literaturevalues, are shown in Fig. 8. The general trend of all measure-ments agree with TALYS, but are shifted down in energy byroughly 2 MeV. The exceptions are the two measurements byLagunas-Solar et al. [8,48], which are scattered at much lowercross section values. Our measurements agree well with themeasurements of Cervenák and Lebeda [32], Alharbi et al.[44], and the reevaluated 2003 and 2015 measurements ofTakács et al. [34]. Good agreement with our results can alsobe found after excluding a few unusual points (the two lowestenergy points of Khandaker et al. [46] which appear high, andthe low values of Tárkányi et al. [24] and Scholten et al. [9] atEp � 18 MeV). Relative to our measurements, the excitationcurves of Levkovskij [49], Lebeda et al. [33], Zhao et al. [52],Gagnon et al. [11], and Manenti et al. [29] all appear to beslightly too high.
Proton Energy (MeV)6 8 10 12 14 16 18 20 22 24
Cro
ss S
ectio
n (m
b)
0.1
1
10
100Mo99Mo(p,pn)100
Proton Energy (MeV)6 8 10 12 14 16 18 20 22 24
Cro
ss S
ectio
n (m
b)
0
20
40
60
80
100
120
140
160
180
200
220 Alharbi ('11)Chodash ('11)Khandaker ('07)Lag. Solar ('99)Levkovskij ('91)Scholten ('99)Tarkanyi ('12)Present Work
Cervenak ('16)*Gagnon ('11)Lag. Solar ('91)Lebeda ('10)*Manenti ('14)Takacs ('15)Zhao ('98)TALYS-1.8
Mo99Mo(p,pn)100
FIG. 8. Comparison of measured reaction cross sections of 100Mo(p, pn)99Mo to TALYS calculations (see Fig. 1 for description) shown inboth logarithmic (left) and linear scale (right). The data are from this work and from [8,9,11,24,29,32–34,44,46,48,49,51,52].
034614-10

PROTON-INDUCED REACTIONS ON MOLYBDENUM PHYSICAL REVIEW C 100, 034614 (2019)
At energies above 19 MeV, which were not experimentallymeasured in this work, the default TALYS parameters continueto underpredict the 100Mo(p, pn)99Mo cross section relativeto the majority of experimental values. Above 22 MeV, thepublished experimental values show increased scatter and adirect comparison to TALYS or the TALYS-based evaluated nu-clear data library (TENDL) is more difficult to make [32,53].
C. Niobium production
While not the primary focus of the work, eight crosssections for Nb production through (p, 2pxn) were mea-sured in this study. Our measurements of 92Mo(p, α)89m,gNb,95Mo(p, α)92mNb, 96Mo(p, nα)92mNb, 98Mo(p, α)95m,gNb,100Mo(p, nα)96mNb, and 100Mo(p, x)97(m+g)Nb mostly agreewith the results of previous studies [32,49,54] and sowill not be discussed. However, cross section mea-surements of 92Mo(p, x)91mNb cum, 94Mo(p, α)91mNb, and95Mo(p, nα)91mNb have not previously been reported. Theseresults are discussed below.
92Mo,94Mo, and 95Mo(p, x)91Nb reactions
The activity of 91mNb was determined through the in-dependent gamma ray line at 1204 keV. The large numberof reaction pathways leading to the production of 91mNbcombined with the low overall cross section, weak gammaray intensities, and long half-life make accurate cross sectionmeasurements difficult. The literature values that are availablefor the natural abundance cross section [24,32] display largeuncertainties and significant scatter. In addition, it is not pos-sible to disentangle contributions of the various open channelsfeeding 91mNb and therefore the results of those measure-ments are not displayed in Fig. 9. The cross section reportedin Fig. 9(a) represents the cumulative cross section through91m2Nb (3.76 μs), 91gMo (15.49 m), and 91mMo (64.6 s).Above Ep = 19.9 MeV, the production of 91gTc and 91mTcfrom 92Mo(p, 2n), which decay into 91gMo and 91mMo, furthercomplicates the cumulative production of 91mNb. Since thiswork was restricted to energies less than 19 MeV, this feedingdecay did not need to be considered in our study, but maycontribute to the scatter seen in the available literature athigher energies. The cross sections for 91mNb production from94Mo and 95Mo, shown in Figs. 9(b) and 9(c), can be treateddirectly as there is no contribution from the production of91Mo.
The general trend of the excitation curve for 92Mo(p, 2p)shown in Fig. 9(a) appears consistent with the TALYS predic-tion for 92Mo(p, x)91Nb, however, the 94Mo(p, α) data plottedin Fig. 9(b) display significant scatter and do not seem to fol-low the positively sloped TALYS curve. The reason for this dis-parity is not clear, however, other authors have reported onlypartial success reproducing (p, nα) cross sections with TALYS
in this mass range [12]. The results for 95Mo(p, nα)91Nb,shown in Fig. 9(c), have an overall trend that is similar tothe TALYS estimate but don’t present the local maximum at∼13 MeV calculated by TALYS.
Proton Energy (MeV)10 12 14 16 18 20
Cro
ss S
ectio
n (m
b)
0.001
0.01
0.1
1
10
100
Present WorkTALYS-1.8
Nb91m)αMo(p,n95
Proton Energy (MeV)12 13 14 15 16 17 18 19
Cro
ss S
ectio
n (m
b)10
Present WorkTALYS-1.8
Nb91m)αMo(p,94
2
Proton Energy (MeV)13 14 15 16 17 18 19
Cro
ss S
ectio
n (m
b)
0.1
1
10
100 Present WorkTALYS-1.8
92Mo(p,x)91mNbcum
FIG. 9. Comparison of measured reaction cross sections for pro-ton induced reactions on 92Mo, 94Mo, and 95Mo leading to the pro-duction of 91mNb to TALYS calculations (see Fig. 1 for description).
IV. CONCLUSION
Production cross sections for 33 proton-induced reactionsresulting in the formation of radioactive technetium,
034614-11

E. LAMERE et al. PHYSICAL REVIEW C 100, 034614 (2019)
niobium, and molybdenum were measured in the protonenergy range of 8–19 MeV. Nine of the cross sectionsmeasured in this work, 92Mo(p, n)92Tc, 92Mo(p, g)93mTc,92Mo(p, g)93gTc, 97Mo(p, n)97mTc, 98Mo(p, 2n)97mTc, 92Mo(p, pn)91(m+g)Mo, 94Mo(p, pn)93mMo, 92Mo(p, 2p)91Nb,94Mo(p, α)91mNb, represent the first detailed investigationin this energy region. In all cases, the present measurementswere compared to the available literature as well as the resultsfrom the statistical model code TALYS-1.8.
Comparison between the experimental data and the pre-dictions of TALYS for the various (p, xn) reactions typicallyshows fair agreement both in shape and absolute value. Somediscrepancy appears in the predictions for isomer-ground statepairs (e.g., 94Tc). TALYS tends to have more variance in shapeand amplitude for reactions with charged particles in theexit channel, occasionally dramatically over- or underestimat-ing the experimental cross section [94Mo(p, pn)93mMo, and100Mo(p, pn)99Mo respectively].
One notable exception to the generally favorable resultsof TALYS is the well studied 100Mo(p, 2n)99mTc. In this caseTALYS significantly underproduces 99mTc above 11 MeV.The measured 99mTc cross section from this work confirmsthe divergence seen between literature and statistical modelcodes, and in particular supports the recent measurements of
Cervenák and Lebeda [32] suggesting that the measurementsof Gagnon et al. [11] and others may overestimate the produc-tion of this important medical radioisotope.
The results from this work are meaningful for the feasi-bility of cyclotron 99mTc production. Along with providingan updated estimate of the amplitude of the main crosssection forming 99mTc, the individual cross sections leadingto other technetium isotopes can be used to directly calculateincreased dose associated with a certain target irradiation.Cross sections which vary from statistical model calculatedvalues (e.g., 97mTc) represent reactions where the potentialimpact on patient health may be underestimated. Additionally,the production cross sections for molybdenum and niobiumfrom this study can be used to estimate the potential for targetrecycling postirradiation.
ACKNOWLEDGMENTS
This work was supported by NSF under Grants No.PHY-1713857 (Nuclear Science Laboratory) and No. PHY-1614442, and by the NRC under Grant No. NRC-HQ-12-G-38-0073. This work was also supported in part by theUniversity of Notre Dame Center for Research Computing(CRC).
[1] Nuclear Energy Agency Technical Report No. NEA/SEN/HLGMR(2018)3, OECD, Paris, 2018 (unpublished).
[2] H. Bonet, B. David, and B. Ponsard, Technical Report, 2005(unpublished).
[3] W. C. Eckelman, JACC: Cardiovascular Imaging 2, 364 (2009).[4] International Atomic Energy Agency, Production Technologies
for Molybdenum-99 and Technetium-99m, IAEA-TECDOC-1065 (IAEA, Vienna, 1999).
[5] M. R. A. Pillai, A. Dash, and F. F. R. Knapp, J. Nucl. Med. 54,313 (2013).
[6] R. Van Noorden, Nature (London) 504, 202 (2013).[7] A. Lokhov, Nuclear Energy Agency Technical Report, 2010
(unpublished).[8] M. C. Lagunas-Solar, P. M. Kiefer, O. F. Carvacho, C. A.
Lagunas, and Y. P. Cha, Int. J. Radiat. Appl. Instrum. Part A42, 643 (1991).
[9] B. Scholten, R. M. Lambrecht, M. Cogneau, H. V. Ruiz, andS. M. Qaim, Appl. Radiat. Isot. 51, 69 (1999).
[10] B. Guérin, S. Tremblay, S. Rodrigue, J. A. Rousseau, V.Dumulon-Perreault, R. Lecomte, J. E. van Lier, A. Zyuzin, andE. J. van Lier, J. Nucl. Med. 51, 13N (2010).
[11] K. Gagnon, F. Bénard, M. Kovacs, T. J. Ruth, P. Schaffer,J. S. Wilson, and S. A. McQuarrie, Nucl. Med. Biol. 38, 907(2011).
[12] S. M. Qaim, S. Sudár, B. Scholten, A. J. Koning,and H. H. Coenen, Appl. Radiat. Isot. 85, 101(2014).
[13] International Atomic Energy Agency, IAEA Radioisotopesand Radiopharmaceuticals Report No. 2, IAEA, Vienna, 2017(unpublished).
[14] S. V. Selivanova, E. Lavallee, H. Senta, L. Caouette, J. A. Sader,E. J. van Lier, A. Zyuzin, J. E. van Lier, B. Guerin, E. Turcotte,and R. Lecomte, J. Nucl. Med. 56, 1600 (2015).
[15] N. M. Uzunov, L. Melendez-Alafort, M. Bello, G. Cicoria, F.Zagni, L. De Nardo, A. Selva, L. Mou, C. Rossi-Alvarez, G.Pupillo, G. Di Domenico, L. Uccelli, A. Boschi, F. Groppi,A. Salvini, A. Taibi, A. Duatti, P. Martini, M. Pasquali, M.Loriggiola et al., Phys. Med. Biol. 63, 185021 (2018).
[16] O. Lebeda, E. J. van Lier, J. Štursa, J. Ráliš, and A. Zyuzin,Nucl. Med. Biol. 39, 1286 (2012).
[17] J. Esposito, G. Vecchi, G. Pupillo, A. Taibi, L. Uccelli, A.Boschi, and M. Gambaccini, Sci. Technol. Nucl. Install. 2013,972381 (2013).
[18] X. Hou, J. Tanguay, K. Buckley, P. Schaffer, F. Bénard, T. J.Ruth, and A. Celler, Phys. Med. Biol. 61, 542 (2016).
[19] M. Beard, E. Uberseder, R. Crowter, and M. Wiescher, Phys.Rev. C 90, 034619 (2014).
[20] T. Rauscher, R. D. Hoffman, S. E. Woosley, and F.-K.Thielemann, in Capture Gamma-Ray Spectroscopy and RelatedTopics: 10th International Symposium, edited by S. Wender andS. Kelley, AIP Conf. Proc. No. 529 (AIP, Melville, NY, 2000),pp. 331–338.
[21] J. Pereira and F. Montes, Phys. Rev. C 93, 034611 (2016).[22] M. E. Wieser and J. R. D. Laeter, Phys. Rev. C 75, 055802
(2007).[23] J. F. Ziegler, M. Ziegler, and J. Biersack, Nucl. Instrum.
Methods Phys. Res. B 268, 1818 (2010).[24] F. Tárkányi, F. Ditrói, A. Hermanne, S. Takács, and A. V.
Ignatyuk, Nucl. Instrum. Methods Phys. Res. B 280, 45(2012).
[25] S. Agostinelli, J. Allison, K. Amako, J. Apostolakis, H. Araujo,P. Arce, M. Asai, D. Axen, S. Banerjee, G. Barrand, F. Behner,L. Bellagamba, J. Boudreau, L. Broglia, A. Brunengo, H.Burkhardt, S. Chauvie, J. Chuma, R. Chytracek, G. Coopermanet al., Nucl. Instrum. Methods Phys. Res. A 506, 250(2003).
034614-12

PROTON-INDUCED REACTIONS ON MOLYBDENUM PHYSICAL REVIEW C 100, 034614 (2019)
[26] G. Gilmore, Practical Gamma-Ray Spectrometry, 2nd ed.(Wiley, West Sussex, England, 2008).
[27] R. S. Tilbury, Activation Analysis with Charged Particles(National Academy of Sciences, Tuxedo, NY, 1988).
[28] National Nuclear Data Center, Nuclear structure and decay Data(NuDat 2.7), Brookhaven National Laboratory, http://www.nndc.bnl.gov/nudat2/.
[29] S. Manenti, U. Holzwarth, M. Loriggiola, L. Gini, J. Esposito,F. Groppi, and F. Simonelli, Appl. Radiat. Isot. 94, 344 (2014).
[30] M.-M. Bé, V. Chisté, C. Dulieu, E. Browne, V. Chechev,N. Kuzmenco, R. Helmer, A. Nichols, E. Schönfeld, andR. Dersch, Table of Radionuclides, Monographie BIPM-5(Vol. 1-A= 1 to 150) (Bureau International des Poids etMesures, Sèvres, France, 2004), https://www.bipm.org/utils/common/pdf/monographieRI/Monographie_BIPM-5_Tables_Vol1.pdf.
[31] D. Yuan and W. Kernan, J. Appl. Phys. 101, 094907 (2007).[32] J. Cervenák and O. Lebeda, Nucl. Instrum. Methods Phys. Res.
B 380, 32 (2016).[33] O. Lebeda and M. Pruszynski, Appl. Radiat. Isot. 68, 2355
(2010).[34] S. Takács, A. Hermanne, F. Ditrói, F. Tárkányi, and M. Aikawa,
Nucl. Instrum. Methods Phys. Res. B 347, 26 (2015).[35] L. Wolfenstein, Phys. Rev. 82, 690 (1951).[36] W. Hauser and H. Feshbach, Phys. Rev. 87, 366 (1952).[37] M. Herman, R. Capote, B. Carlson, P. Obložinský, M. Sin, A.
Trkov, H. Wienke, and V. Zerkin, Nucl. Data Sheets 108, 2655(2007).
[38] A. J. Koning, S. Hilaire, and M. C. Duijvestijn, in ND2007(EDP Sciences, Nice, France, 2007).
[39] A. Koning, S. Hilaire, and S. Goriely, “TALYS-1.8 A nuclearreaction program: User Manual”, 2015.
[40] A. Celler, X. Hou, F. Bénard, and T. Ruth, Phys. Med. Biol. 56,5469 (2011).
[41] See Supplemental Material at http://link.aps.org/supplemental/10.1103/PhysRevC.100.034614 for a complete set of figuresfor all of the measured cross sections in this work as well asan example of a TALYS input file. The Supplemental Materialcontains Refs. [55–59].
[42] S. Takács, F. Tárkányi, M. Sonck, and A. Hermanne, Nucl.Instrum. Methods Phys. Res. B 198, 183 (2002).
[43] J. Tanguay, X. Hou, P. Esquinas, M. Vuckovic, K. Buckley, P.Schaffer, F. Bénard, T. J. Ruth, and A. Celler, Phys. Med. Biol.60, 8229 (2015).
[44] A. A. Alharbi, A. Azzam, A. Banu, A. Spiridon, B. Roeder,E. Simmons, L. Trache, M. McCleskey, R. E. Tribble, andV. Z. Goldberg, Medical Radioisotopes Production: A Compre-hensive Cross-Section Study for the Production of Mo and TcRadioisotopes via Proton Induced Nuclear Reactions on natMo(IntechOpen, Rijeka, 2011).
[45] M. B. Challan, M. N. H. Comsan, and M. A. Abou-Zeid,J. Nucl. Radiat. Phys 2, 1 (2007).
[46] M. U. Khandaker, M. S. Uddin, K. S. Kim, Y. S. Lee, andG. N. Kim, Nucl. Instrum. Methods Phys Res B 262, 171(2007).
[47] M. U. Khandaker, A. Meaze, K. Kim, D. Son, G. Kim, and Y. S.Lee, J. Korean Phys. Soc. 48, 821 (2006).
[48] M. Lagunas-Solar, Technical Report No. IAEA-TECDOC-1065, International Atomic Energy Agency, Vienna, 87-112,1999 (unpublished).
[49] V. N. Levkovskij, Middle Mass Nuclides (A= 40–100) Activa-tion Cross-sections by Medium Energy (E= 10–50 MeV) Protonsand Alpha Particles (Experiment and Systematics) (Inter-vesi,Moscow, 1991).
[50] S. Takács, Z. Szucs, F. Tárkányi, A. Hermanne, and M. Sonck,J. Radiol. Nucl. Chem. 257, 195 (2003).
[51] P. Chodash, C. T. Angell, J. Benitez, E. B. Norman, M. Pedretti,H. Shugart, E. Swanberg, and R. Yee, Appl. Radiat. Isot. 69,1447 (2011).
[52] W. Zhao, W. Yu, X. Han, and H. Lu, Communication of nucleardata progress (CN9901266) 19, 17 (1998).
[53] S. Takács, F. Ditrói, M. Aikawa, H. Haba, and N.Otuka, Nucl. Instrum. Methods Phys. Res. B 375, 60(2016).
[54] K. Gagnon, J. S. Wilson, C. M. B. Holt, D. N. Abrams, A. J. B.McEwan, D. Mitlin, and S. A. McQuarrie, Appl. Radiat. Isot.70, 1685 (2012).
[55] P. J. Daly, B. M. Seppelt, and P. F. D. Shaw, Nucl. Phys. A 119,673 (1968).
[56] M. Izumo, H. Matsuoka, T. Sorita, Y. Nagame, T. Sekine, K.Hata, and S. Baba, Int. J. Radiat. Appl. Instrum. Part A 42, 297(1991).
[57] E. Skakun, V. Batij, Y. Rakivnenko, and O. Rastrepin, Sov. J.Nucl. Phys. 46, 17 (1987).
[58] F. Rösch and S. M. Qaim, Radiochimica Acta 62, 115(1993).
[59] K. Gagnon, J. S. Wilson, and S. A. McQuarrie, Nucl. Med. Biol.39, 923 (2012).
034614-13