Embed Size (px)
Citation preview

March 28th, 2011 BRNSYMPOSIUM.COM
PROTOCOLS FOR ANALYSIS OF WHOLE SALIVA
GENE EXPRESSION
Andrew W Bergen, PhD
Molecular Genetics ProgramCenter for Health Sciences
SRI International333 Ravenswood Avenue
Menlo Park, CA 94025

March 28th, 2011 BRNSYMPOSIUM.COM
Context• Saliva is a convenient biospecimen source
– field, trial and population based studies– collected for protein, hormone and metabolic studies
• Salivary biomarkers have been identified– Oral squamous cell carcinoma– Sleep deprivation – Oral cavity metagenomics and disease
• Field has progressed through several approaches to collecting oral cavity biospecimens– Collection kits for saliva storage and future DNA and RNA
extraction are commercially available

March 28th, 2011 BRNSYMPOSIUM.COM
Chronic Stress and Gene Expression• Chronic stress a risk factor
– substance use/dependence and cancer progression• Cole & Miller identified a consistent gene expression
signature of chronic stress in lymphocytes:– Gene expression signature
• Decreased glucocorticoid receptor regulated gene expression• Increased NF-κB regulated gene expression
– Samples• 28 individuals from top and bottom 15% loneliness scale, 2007• 11 familial caregivers of brain cancer patients and 10 controls, 2008• 60 individuals stratified on early life SES, 2009
• Goal: validate stress gene expression signature in whole saliva from young adults stratified on chronic stress

March 28th, 2011 BRNSYMPOSIUM.COM
Oregon Youth Substance Use Project
• Fifteen-year ongoing longitudinal study examining the etiology of substance use, including nicotine dependence
• Participants were recruited from a single school district in a working class community in Western Oregon, using a stratified random sample
• Parental consent for 1075 students (50.7% response rate)• OYSUP sample similar to Oregon population
– 68.8% male, 91.7% white, 4.2% Native American and 4.2% were Hispanic
– 44% of the sample were eligible for free and reduced lunch– 17% of mothers and 30% of fathers did not attain an education past
high school
• Participants were on average 21.05 years of age (SD=0.38).

Life Events and Difficulty Schedule
• Contextually based assessment of participants’ episodic and chronic life events and difficulties
• Captures a multitude of developmental challenges encountered– entering or struggling with college, problems finding a job, having children,
moving out of their childhood homes, developing and maintaining romantic and platonic relationships, and achieving financial self-sufficiency.
• Semi-structured interview that identifies 1) discrete events and 2) chronic difficulties in 10 life domains
– finances, work, education, housing, health, reproduction, crime/legal, and relationships (partner and others).
• Immediate and long-term severities or threats were evaluated• Raters who were blind to the interviewee’s subjective responses
assign standardized ratings to events and difficulties from cases presented by the interviewer.
March 28th, 2011 BRNSYMPOSIUM.COM

Stratified by LEDS• 48 participants from the first 123 individuals available for
evaluation were selected• 24 (6 F, 18 M) of 123 individuals experienced the
“lowest” level of stressors and were chosen as the low stress stratum sample.
• 31 of 123 experienced the “highest” level of stressors –an ongoing (N=26) or recent (within the last four months, N=5) difficulty rated high in threat. We chose all available males (N=16) and randomly selected 8 of 15 available females to comprise the high stress stratum.
March 28th, 2011 BRNSYMPOSIUM.COM

Participant Characteristics
March 28th, 2011 BRNSYMPOSIUM.COM
Characteristic High Stress Low Stress Two-sided Fisher P
24 (50) 24 (50)Male Gender 16 (67) 18 (75) 0.75
Self-identified RaceWhite 23 (96) 24 (100)
Native American 1 (4) 0 (0) >0.99
Self-identified EthnicityHispanic 2 (8) 1 (4)
Not Hispanic 22 (92) 23 (96) >0.99SmokingCurrent 10 (42) 1 (4)Former 2 (8) 4 (17)Never 12 (50) 19 (79) 0.02

Total RNA Extraction• Total RNA (excluding small RNAs) was extracted from
48 participants – 1ml starting volume
• 500ul saliva + 500ul Oragene Stabilization Reagent (DNA Genotek)– Oragene•RNA extraction protocol with RNeasy Mini Kit and
RNase-Free DNase (Qiagen)• incubation at 90○C for 15 minutes• addition of a neutralizer solution• ethanol precipitation• on-column DNase digestion• column purification
– A second DNAse treatment was also performed using TURBO™
DNA-free (Ambion) to ensure digestion of contaminating DNA
March 28th, 2011 BRNSYMPOSIUM.COM

Saliva and Salivary RNA Metrics
March 28th, 2011 BRNSYMPOSIUM.COM
Saliva Nanodrop Agilent Analyzer
Volume Yield Conc 260/280 260/230 RIN AUC Conc 28S/18S
Low Stress
Stratum
Mean 4.6 4.26 177.48 1.99 1.63 7.50 145.01 83.50 1.28SD 0.6 2.39 99.65 0.05 0.46 1.96 101.67 59.75 1.08
Median 4.5 3.79 158.03 2.00 1.76 7.90 119.60 66.50 1.00
Minimum 3.5 1.07 44.42 1.80 0.16 2.10 21.40 20.00 0.00
Maximum 6.0 9.88 411.82 2.05 2.06 9.80 451.30 230.00 6.10
High Stress
Stratum
Mean 4.5 4.59 191.16 1.96 1.51 6.02 157.90 84.08 0.83SD 0.5 5.23 217.78 0.06 0.36 2.78 227.41 114.47 0.60
Median 4.5 2.44 101.56 1.99 1.55 7.00 53.15 34.00 1.00
Minimum 3.7 0.73 30.46 1.76 0.72 1.00 2.30 2.00 0.00
Maximum 6.0 19.69 820.23 2.02 2.03 9.60 823.10 412.00 2.20
P 0.81 0.78 0.78 0.10 0.25 0.04 0.80 0.98 0.09

Gene Selection
• 38 test genes previously defined as over (18 genes) and under (20 genes) expressed in high versus low stress individuals:– Miller et al, 2008 (PMID: 18440494)– Higher frequency of NFκB and GR TFBMs– Increased fold-change expression ratios for NFκB and GR
regulated genes
• Reference genes– 5 from Vandesompele et al, 2002 (PMID: 12184808)– 1 from Noutsias et al, 2008 (PMID: 18194512)
March 28th, 2011 BRNSYMPOSIUM.COM

Gene expression assay selection
• ABI TaqMan® gene expression assays were chosen based on the following criteria: – assays with probes that span an exon junction and that would
not detect genomic DNA– assay at or near the 3’ end of the gene– highest possible number of RefSeq or GeneBank entries– shortest possible amplicon length, and – inventoried
March 28th, 2011 BRNSYMPOSIUM.COM

RT, Pre-Amp and qPCR
• RT reactions were performed with – negative controls lacking reverse transcriptase (–RT)– with no template (NTC)
• Multiplex pre-amplification reaction of all TaqMan® gene expression assays
• qPCR performed on Fluidigm BioMark™ system– 6*2304 reaction well chips contained, in triplicate,– 4 high stress/4 low stress RNA samples, reference RNA sample,
-RT pooled saliva, NTC, and– a 5 point serial dilution curve in triplicate made from pooled
saliva cDNA was included on each chip to normalize Ct values across chips and perform a standard curve analysis
March 28th, 2011 BRNSYMPOSIUM.COM

Performance of Selected TaqMan®
Gene Expression Assays
March 28th, 2011 BRNSYMPOSIUM.COM
Gene Intercept Slope R2 Correlation Efficiency SD CV
GADD45B 17.14 -3.34 0.999 -1 0.993 0.015 0.016
GALC 24.47 -4.00 0.993 -0.996 0.778 0.042 0.053
GBP1 18.94 -3.56 0.999 -1 0.909 0.020 0.022
HSPA1B 16.55 -3.65 0.999 -1 0.879 0.012 0.014
IL8 14.34 -3.65 1 -1 0.881 0.005 0.006
NSF 23.60 -3.99 0.999 -0.999 0.780 0.048 0.062
RAB27A 21.68 -3.71 0.998 -0.999 0.86 0.044 0.051
SLC35A1 24.20 -3.54 0.998 -0.999 0.915 0.087 0.079
STX7 20.59 -3.39 1 -1 0.972 0.030 0.030
Differentially Expressed Assays
March 28th, 2011 BRNSYMPOSIUM.COM
CSC RSC
Assay M(SD) [H] M (SD) [L] t P M (SD) [H] M (SD) [L] t P
GADD45B 0.85 (0.04) 0.87 (0.04) 1.19 0.242 1.10 (0.85) 0.64 (0.33) -2.40 0.023
GALC 1.33 (0.09) 1.25 (0.06) -2.98 0.007 0.52 (0.41) 0.88 (0.48) 2.48 0.018
GBP1 1.05 (0.11) 0.98 (0.1) -2.22 0.032 0.45 (0.64) 0.78 (0.75) 1.43 0.161
HSPA1B 0.79 (0.06) 0.80 (0.05) 0.89 0.379 1.60 (1.59) 0.80 (0.44) -2.37 0.026
IL8 0.84 (0.18) 0.70 (0.11) -3.37 0.002 0.24 (0.24) 0.55 (0.36) 3.46 0.001
NSF 1.25 (0.06) 1.21 (0.04) -2.03 0.049 0.53 (0.27) 0.70 (0.23) 2.18 0.036
RAB27A 1.17 (0.06) 1.13 (0.03) -2.51 0.019 0.41 (0.24) 0.57 (0.21) 2.31 0.026
SLC35A1 1.31 (0.07) 1.27 (0.04) -1.98 0.060 0.56 (0.29) 0.77 (0.29) 2.21 0.034
STX7 1.11 (0.05) 1.08 (0.03) -2.15 0.038 0.41 (0.25) 0.57 (0.27) 2.11 0.041

Salivary RNA and Clinical Covariates
March 28th, 2011 BRNSYMPOSIUM.COM
CSC RSC
Gene Yield Gender Stress Smoking Yield Gender Stress Smoking
FGL2 4.22*** -0.9 0.23 0.37 -3.64*** 1.73 -0.25 -0.33
GADD45B 0.66 -1.17 -0.24 -1.35 0.51 0.82 1.39 2.26*
GALC 0.29 -0.2 1.98 0.8 -1.21 -0.01 -1.51 -0.17
GBP1 1.75 -0.28 0.91 0.49 -0.93 0.33 -0.6 -0.58
HSPA1B 0.95 -1.41 -0.12 0.11 1.51 0.47 1.14 2.05*
IL8 2.63* -2.88** 2.48** 2.97** -1.64 2.22* -2.61* -1.1
IL81 2.59* -2.63* 2.45* 2.93** -1.56 2.25* -2.55* -1.08
NSF -2.05* 0.62 0.24 0.76 1.13 0.36 -0.42 -0.49
RAB27A 2.33* 0.11 1.89 0.41 -1.54 -0.05 -1.42 -0.46
SLC35A1 -1.04 1.5 0.92 1.22 -0.91 0.38 -1.02 -0.74
STX7 1.2 -0.67 1.57 1.19 -2.66* 1.51 -1.26 -1.11

RNA extractions for genome-wide gene expression analyses
• We extracted total RNA and small RNA as follows:– Extraction Method for Expression Analysis
• Selected 8 Low Stress never smokers, 8 High Stress smokers, 8 High Stress never smokers
• Same extraction method used for previous qPCR from 1ml volume using RNEASY kit with added DNAse treatment
• Half the samples had ExpressArt® NucleoGuard, a nuclease inhibitor, added to the RLT buffer step
– Extraction Method for Wafergen• Selected 4 Low Stress and 4 High Stress never smokers• 500μl aliquot at 90°C for 15 min and let cool, then follow
mirVana™ miRNA Isolation Kit protocol starting with organic extraction.
March 28th, 2011 BRNSYMPOSIUM.COM

Illumina Direct Hyb HumanHT-12 v4
• 5μl total RNA (approx 200-500ng) converted into labeled target cRNA using the Illumina TotalPrep-96 RNA Amplification Kit
• 750 ng of purified biotinylated cRNA was added to Hybridization Cocktail Buffer (Illumina), applied to arrays, and incubated at 58°C for 16 hours
• Following hybridization, arrays were washed and stained using standard Illumina procedures for washing, staining and scanning
• Scanned images were processed by the Gene Expression module of GenomeStudio (v 1.6, Illumina) using default parameters without normalization
March 28th, 2011 BRNSYMPOSIUM.COM

Illumina Direct Hyb data analysis• Raw data was background corrected using “model-based background
correction" methodology [PMID: 18450815]. This methods utilizes negative control probes along with test probes to estimate the unobservable background intensities using the normal exponential deconvolution model.
• The log2-transformed background subtracted data was further normalized to correct for between sample variation using the quantile normalization method [PMID: 12538238].
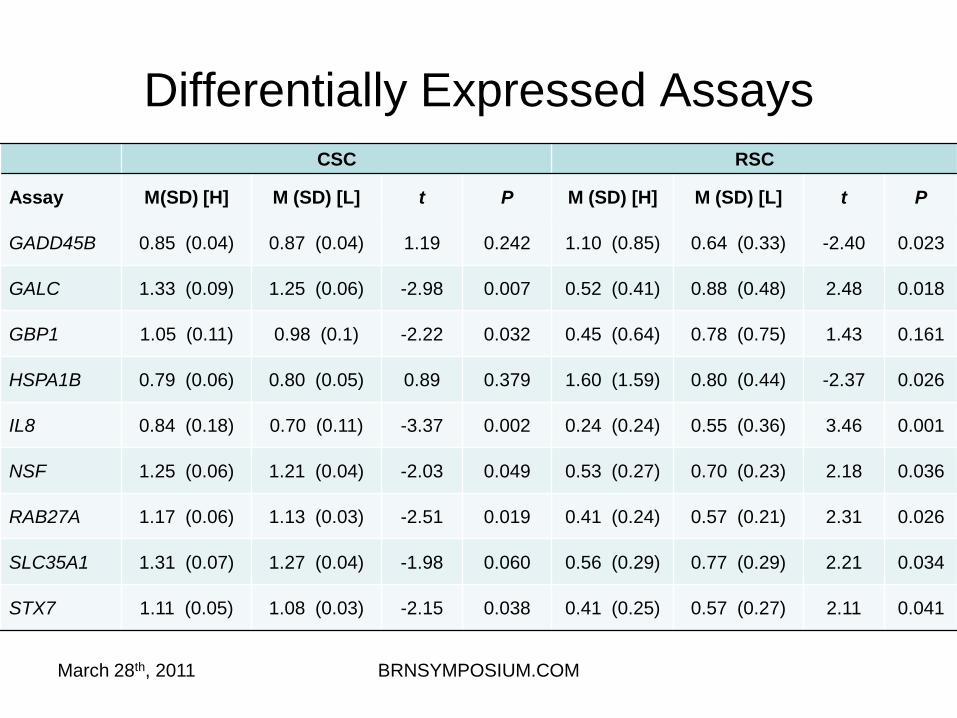
• We performed PCA on background corrected normalized data for all probes and all samples as implemented, and a one-way analysis of variance (ANOVA) implemented, including a cohort effect, where samples were divided in to three cohorts: (A) High-Stress-Smokers, (B) High-Stress-nonSmokers, and (C) Low-Stress-nonSmokers.
• We performed unsupervised hierarchical clustering of 38 probes with ANOVA P<0.001 from all 24 samples.
March 28th, 2011 BRNSYMPOSIUM.COM
PCA using all probes and all samples. Slight separation among smokers. No batch effects, no clustering by processing date, gender or ethnicity.
PCA of all 24 samples and 47K probes
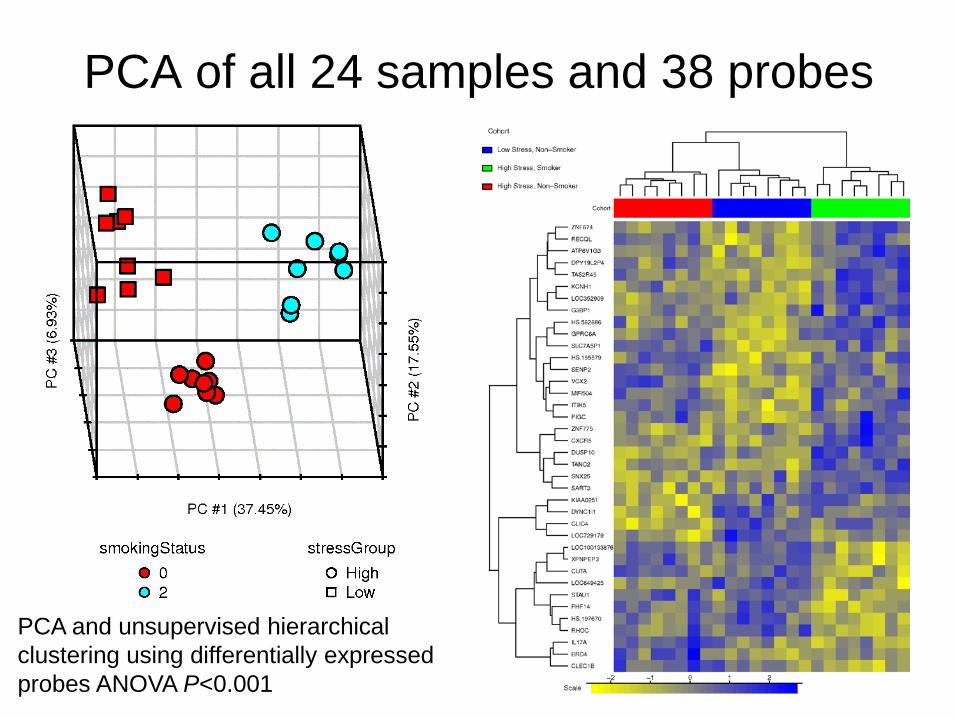
PCA and unsupervised hierarchical clustering using differentially expressed probes ANOVA P<0.001
PCA of all 24 samples and 38 probes

qPCR versus Illumina Results
Gene qPCRCSC t
qPCRCSC P
FCIllumina
P Value
GADD45B -2.40* 0.023 -1.55 0.076GALC -2.98 0.007 1.27 0.210GBP1 -2.22 0.032 1.06 0.504HSPA1B -2.37* 0.026 -1.16 0.450IL8 -3.37 0.002 -9.56 0.019NSF -2.03 0.049 -1.08 0.659RAB27A -2.51 0.019 1.06 0.723SLC35A1 -1.98 0.060 1.01 0.934STX7 -2.15 0.038 1.07 0.545
March 28th, 2011 BRNSYMPOSIUM.COM *RSC t and P

March 28th, 2011 BRNSYMPOSIUM.COM
Wafergen SmartChip miRNA panel
• 8 RNA samples (4 high and 4 low stress)• 1 μg RNA per chip• 1176 micro RNA assays in quadruplicate• Targets that pass the QC analysis are
designated “informative”• Samples with informative targets are analyzed
for differential expression with comparative Ct analysis
• Normalization uses all informative miR assays

5’
3’-OH 5’-rApp 3’-block
3’-block5’
RNA Ligase 2
1-Step Reverse Transcriptase to create cDNA
3’-block5’
miRNA 3’-Adapter
39 Cycles of PCR: 95° to 60°
Off-Chip Ligation: 60 Minutes @ 22⁰C
On-Chip RT: 5 Minutes @ 52°
On-Chip DNA Pol: 1 Min @ 52°
~22 nts
Outline of Protocol

March 28th, 2011 BRNSYMPOSIUM.COM
Preliminary miRome-wide data
Chip ID SampleInformative
miRs31851 SRI Sample 29353-310-6 miRNA V2 38531902 SRI Sample 29360-355-6 miRNA V2 37031818 SRI Sample 29352-309-6 miRNA V2 45331839 SRI Sample 29347-286-6 miRNA V2 50731814 SRI Sample 29349-289-6 miRNA V2 55731909 SRI Sample 29348-288-6 miRNA V2 83831911 SRI Sample 29343-262-6 miRNA V2 42433492 SRI Sample 29341-257-6 miRNA V2 45431892 Positive Blood 655

March 28th, 2011 BRNSYMPOSIUM.COM
Summary I
• We are using whole saliva as a biospecimen source of for both trait (germline DNA) and state (mRNA and miR gene expression) analyses related to stress and smoking status.
• We have extracted RNA using a variety of methods from whole saliva and observe significant differences in salivary metrics in:
– the RIN score between stress strata– the 28S/18S ratio between methods differing by the use of a RNase inhibitor, – multiple salivary RNA metrics between methods differing by the use of DNase
• We analyzed gene expression via qPCR in salivary RNA from 48 individuals and 37 selected candidate genes and observed:
– excellent assay performance from TaqMan® gene expression assays– validated a previously described gene expression signature– identified a differentially expressed gene robust to multiple covariate regression.

March 28th, 2011 BRNSYMPOSIUM.COM
Summary II
• We have analyzed genome-wide mRNA and miR expression using Ilumina Direct Hyb HumanHT12 v4 and Wafergen SmartChip miR panels
• Both gene expression collaborators observed lower expression than in “normal” tissues
• Both expression panels identified differentially expressed genes• We confirmed significant differential IL8 gene expression in the
Illumina panel

AcknowledgmentsDenise NishitaAditi MallickXin WeiMartha MichelSean P. DavidGary E. SwanRuchir ShahEmily NorrisPatrick HurbanKee WongNicole RobinsonMark W. ReidAnne SimonsJudy Andrews
• Institutions– SRI International– Stanford School of Medicine– Oregon Research Institute– Sciome– Expression Analysis – Wafergen
• Funding– 5RC2DA028793-02– SALIVARY BIOMARKERS (DNA,
RNA AND CORTISOL), LIFE STRESS AND NICOTINE DEPENDENCE
March 28th, 2011 BRNSYMPOSIUM.COM