Embed Size (px)
Citation preview

Subscriber access provided by HARVARD UNIV
Journal of Proteome Research is published by the American Chemical Society. 1155Sixteenth Street N.W., Washington, DC 20036Published by American Chemical Society. Copyright © American Chemical Society.However, no copyright claim is made to original U.S. Government works, or worksproduced by employees of any Commonwealth realm Crown government in the courseof their duties.
Article
Proteomic Analysis of Chinese Hamster Ovary (CHO) CellsDeniz Baycin Hizal, David Lee Tabb, Raghothama Chaerkady, Lily Chen, Nathan E. Lewis, Harish Nagarajan,
Vishaldeep Sarkaria, Amit Kumar, Daniel Wolozny, Joe Colao, Elena Jacobson, Yuan Tian, Robert NO'Meally, Sharon Krag, Robert N. Cole, Bernhard Ø. Palsson, Hui Zhang, and Michael Betenbaugh
J. Proteome Res., Just Accepted Manuscript • Publication Date (Web): 12 Sep 2012
Downloaded from http://pubs.acs.org on September 17, 2012
Just Accepted
“Just Accepted” manuscripts have been peer-reviewed and accepted for publication. They are postedonline prior to technical editing, formatting for publication and author proofing. The American ChemicalSociety provides “Just Accepted” as a free service to the research community to expedite thedissemination of scientific material as soon as possible after acceptance. “Just Accepted” manuscriptsappear in full in PDF format accompanied by an HTML abstract. “Just Accepted” manuscripts have beenfully peer reviewed, but should not be considered the official version of record. They are accessible to allreaders and citable by the Digital Object Identifier (DOI®). “Just Accepted” is an optional service offeredto authors. Therefore, the “Just Accepted” Web site may not include all articles that will be publishedin the journal. After a manuscript is technically edited and formatted, it will be removed from the “JustAccepted” Web site and published as an ASAP article. Note that technical editing may introduce minorchanges to the manuscript text and/or graphics which could affect content, and all legal disclaimersand ethical guidelines that apply to the journal pertain. ACS cannot be held responsible for errorsor consequences arising from the use of information contained in these “Just Accepted” manuscripts.

1
Proteomic Analysis of Chinese Hamster Ovary Cells
Deniz Baycin-Hizal*, David L. Tabb‡, Raghothama Chaerkady†, Lily Chen§, Nathan E. Lewisγ,
Harish Nagarajanγ, Vishaldeep Sarkaria§, Amit Kumar*, Daniel Wolozny*, Joe Colao*, Elena
Jacobson*, Yuan Tian§, Robert N. O’Meally†, Sharon S. Kragβ, Robert N. Cole†,
Bernhard O. Palsson#, Hui Zhang§, Michael Betenbaugh*£#
*Department of Chemical and Biomolecular Engineering, Johns Hopkins University,
‡Biomedical Informatics Vanderbilt University Medical Center, †Johns Hopkins University
School of Medicine, §Department of Pathology, Johns Hopkins University School of Medicine,
βDepartment of Biochemistry and Molecular Biology, Johns Hopkins University Bloomberg
School of Public Health, γDepartment of Bioengineering, University of California San Diego,
#Novo Nordisk Foundation Center for Biosustainability, Technical University of Denmark,
Hørsholm, Denmark
£Corresponding author: [email protected], phone: 410-446(9801)
Abstract
In order to complement the recent genomic sequencing of Chinese hamster ovary (CHO)
cells, proteomic analysis was performed on CHO including the cellular proteome, secretome, and
glycoproteome using tandem mass spectrometry (MS/MS) of multiple fractions obtained from
gel electrophoresis, multi-dimensional liquid chromatography, and solid phase extraction of
glycopeptides (SPEG). From the 120 different mass spectrometry analyses generating 682,097
MS/MS spectra, 93,548 unique peptide sequences were identified with at most a 0.02 false
discovery rate (FDR). A total of 6164 grouped proteins were identified from both glycoproteome
and proteome analysis, representing an 8-fold increase in the number of proteins currently
identified in the CHO proteome. Furthermore, this is the first proteomic study done using CHO
Page 1 of 39
ACS Paragon Plus Environment
Journal of Proteome Research
123456789101112131415161718192021222324252627282930313233343536373839404142434445464748495051525354555657585960
2
genome exclusively which provides for more accurate identification of proteins. From this
analysis, the CHO codon frequency was determined and found to be distinct from humans, which
will facilitate expression of human proteins in CHO cells. Analysis of the combined proteomic
and mRNA data sets indicated the enrichment of a number of pathways including protein
processing and apoptosis but depletion of proteins involved in steroid hormone and
glycosphingolipid metabolism. 504 of the detected proteins included N-acetylation modifications
and 1292 different proteins were observed to be N-glycosylated. This first large-scale proteomic
analysis will enhance the knowledge base about CHO capabilities for recombinant expression
and provide information useful in cell engineering efforts aimed at modifying CHO cellular
functions.
Introduction
Chinese Hamster Ovary (CHO) cells are the primary hosts for the production of a large
number of recombinant therapeutics and antibodies with over $99 billion in market value 1. The
CHO expression system is often preferred in bio-processing because of its manufacturing
adaptability and post-translational modification capabilities. CHO cells can be adapted to
suspension culture and scaled up to produce 5-10 g/L biologics 2. Furthermore, the presence of
post-translational modifications in CHO cells such as glycosylation compatible with humans
increases the quality of the therapeutics and the biological life-time of pharmaceuticals in the
circulatory system. For all these reasons, CHO cells are the most widely used hosts for industrial
production of biopharmaceuticals 2-3.
In order to enhance the production capabilities and efficiency of the host, an increased
understanding of cellular physiology is desirable. Unfortunately, over the past decade, advances
in CHO biology and biotechnology have been hampered by the lack of genomic and proteomic
Page 2 of 39
ACS Paragon Plus Environment
Journal of Proteome Research
123456789101112131415161718192021222324252627282930313233343536373839404142434445464748495051525354555657585960

3
data. CHO proteomic studies have relied on finding homologous peptides in other organisms or
using expressed sequence tags (ESTs), which have limited the proteome sizes to only a few
hundred proteins 4-5. However, the availability of high-throughput technologies has enabled more
studies at the genome, transcriptome and proteome levels 2, 6. With the recently published draft
genome sequence of CHO-K1, complementary proteomic and transcriptomic studies can be
deployed to provide further insights into its 24,383 genes 7 and 29,291 transcripts. Indeed,
transcriptome sequencing of this cell line has demonstrated the mRNA expression of 11,099
genes, almost half of the predicted genes 7.
Given that only a fraction of the CHO genes were expressed, information on the
translation of genomic information would be useful to complement the transcriptomic
information and enhance our knowledge concerning cellular activities in CHO at the protein
level. To accomplish this goal, a detailed proteomic study was undertaken here. Proteomics can
be used to directly monitor the thousands of proteins that can play key roles in a CHO production
host including those involved in growth, cell death, protein processing, glycosylation, and cell
metabolism. Identification of the proteome will enable users to better understand the
characteristics of this important production host as well as its capabilities for performing specific
protein processing functions such as glycosylation, which can alter the half-life activity of the
biologics in the circulatory system and impacts the protein function 8.
Together, the genomic, transcriptomic and proteomic data can elucidate key properties
about this important biotechnology system including amino acid utilization patterns, highly
expressed proteins, and depleted and enriched pathways 9. Indeed, since the correlation between
the transcriptome and proteome is not always one-to-one, a combined approach is often useful to
better understand the cellular physiology 10-11.
Page 3 of 39
ACS Paragon Plus Environment
Journal of Proteome Research
123456789101112131415161718192021222324252627282930313233343536373839404142434445464748495051525354555657585960
4
Recent improvements in mass spectrometry technologies have enabled qualitative and
quantitative identifications of proteins present in human, Drosophila melanogaster, Anopheles
gambiae, mouse and many other organisms 12-14. While there have been a few protein profiling
studies of CHO cell lines 15-17, the proteome of CHO cells has not been well characterized due to
the lack of genomic sequence information. With recent genomic and transcriptional studies in
CHO cells 7, it will be equally useful to identify the protein components of this production host.
In the current study, the proteome of CHO cells has been elucidated using multiple
proteomics technologies and using two different search engines, TagRecon and MyriMatch18-19.
In order to identify as many proteins as possible in the proteome, different fractionation
strategies and enrichment methods were used in combination with mass spectrometry (MS)
analysis. To increase the proteome coverage, cellular proteins (cell lysate) and secreted proteins
(media) were first separated using two dimensional liquid chromatography (2-D LC) techniques
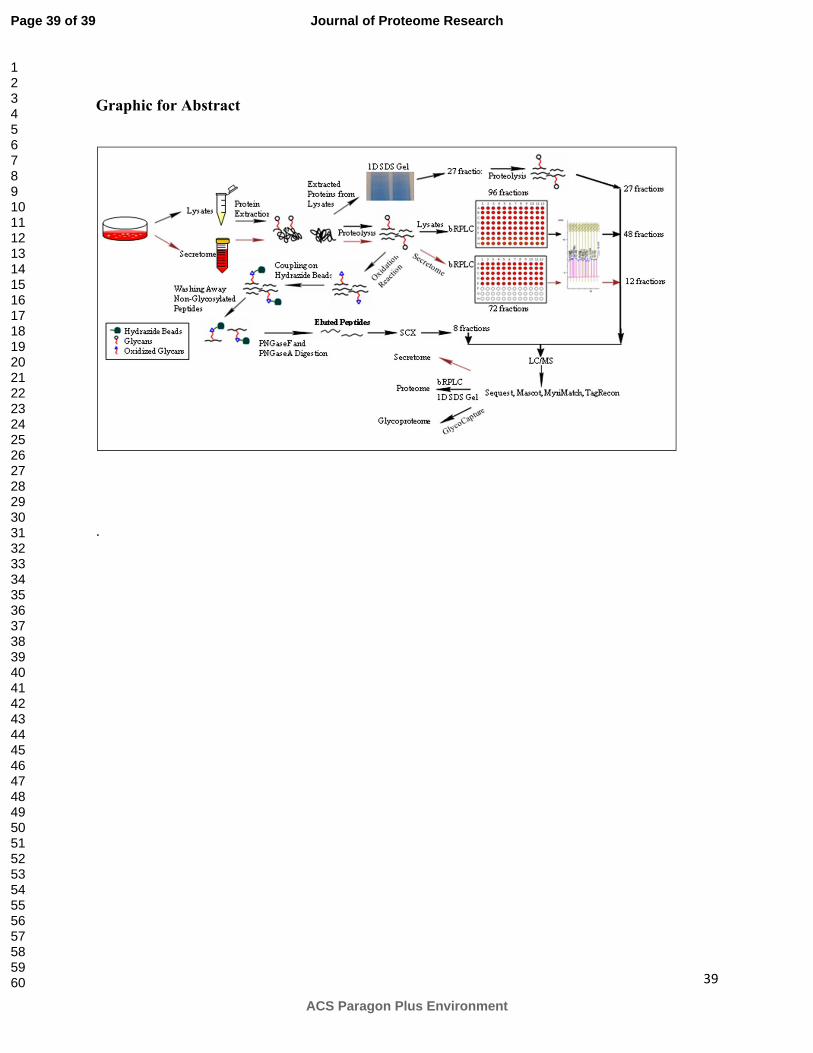
followed by MS/MS analysis of fractions as shown in Figure 1. Furthermore, the glycoproteome
of CHO cell lines were identified by coupling solid phase extraction of glycosylated peptides
with MS/MS 8.
The identification of expressed proteins has enabled assessment of the codon frequency
among expressed proteins, an examination of the abundance levels of different protein
categories, and an evaluation of the depleted and enriched pathways in CHO cells. While
increasing our knowledge about the general physiology of CHO in culture, we also anticipate
that this expanded proteomics information will be used to help understand CHO capabilities for
recombinant protein production and lay the groundwork for cell and metabolic engineering
efforts in CHO for years to come.
Page 4 of 39
ACS Paragon Plus Environment
Journal of Proteome Research
123456789101112131415161718192021222324252627282930313233343536373839404142434445464748495051525354555657585960
5
Experimental Procedures
Materials
The CHO-K1 (CCL-61) cell line was obtained from ATCC (Manassas, VA). Fetal bovine
serum (FBS), L-Glutamine, nonessential amino acids, DPBS, F-12K and DMEM media were
purchased from Gibco (Grand Island, NY). Sequencing grade trypsin was purchased from
Promega (Madison,WI). The BCA protein assay kit was bought from Thermo Scientific Pierce
(Rockford, IL). Affi-prep hydrazide resin beads and sodium periodate were from Bio-Rad
(Hercules, CA). The other reagents were Tris (2-carboxyethyl) phosphine (TCEP) (Pierce,
Rockford, IL), PNGaseF (New England Biolabs, Ipswich, MA), trifluoroethanol (TFE) (Sigma-
Aldrich, Milwaukee, WI), 1 mL C18 Sep-Pak cartridges (Millipore, Billerica, MA), 4%-12%
SDS-PAGE gel (Invitrogen, Grand Island, NY) and ultrafilters (Waters, Milford, MA). All other
chemicals used in this study were purchased from Sigma-Aldrich (St. Louis, MO).
Cell Culture and Preparation Protein Lysate
CHO-K1 was cultured in F-12K media, supplemented with 10 % FBS, 1% non-essential
amino acids and 2 mM L-glutamine. The cells at 70-80% confluence were used for proteomic
analysis. The cells were washed with ice-cold phosphate buffered saline six times prior to cell
lysis to obtain intracellular proteins. For the collection of secreted proteins, the cells were grown
up to 80 % confluence, then the media was decanted and cells were carefully washed six times
with DPBS. Subsequently, the cells were starved for 12 hours with serum free media. After 12
hours, media was collected and concentrated with 10 kDa molecular weight cut-offs to decrease
the volume.
Page 5 of 39
ACS Paragon Plus Environment
Journal of Proteome Research
123456789101112131415161718192021222324252627282930313233343536373839404142434445464748495051525354555657585960
6
In-gel Digestion
The cells were lysed with 2 % SDS and sonicated on ice for three times for 20 seconds
with a probe sonicator. The lysed sample was then heated at 90 ºC for 5 minute after mixing with
Laemmli Buffer. Approximately 400 µg of lysate was loaded into three different wells and
separated using 1D SDS-PAGE gel according to molecular weight differences. An Invitrogen 1D
gel runner was used with a Novex 4-12% gradient Bis-tris gel (1.5 mm thickness). The gel was
then stained with Coomassie blue and rinsed with distilled water for about 15 minutes. The
adjacent protein bands were merged and then cut into 27 pieces of 1×1mm2. These gel pieces
were cut into smaller pieces and put into an eppondorf tube followed by destaining, reduction
and alkylation as described before 20. Trypsin was added into each sample at a 1: 50 ratio and the
trypsin digestion was carried out at 37ºC overnight. Digestion efficiency was high as we
observed few undigested trypsin cleavage sites (<10%). The digested peptides were then dried
for mass spectrometry analysis 20.
In-solution digestion
The cells were lysed in 9 M urea containing 20 mM NaHEPES buffer pH 8.0 and
sonicated on ice for three times for 20 seconds with a probe sonicator. The protein concentration
of the lysate was determined with BCA assay. The lysate was then reduced with DTT and
alkylated with iodeacetamide using the filter aided sample preparation (FASP) method as
described previously 21. Ultracel 30 kDa Amicon filters were used and 95% ultrafiltration
efficiency was observed.
Page 6 of 39
ACS Paragon Plus Environment
Journal of Proteome Research
123456789101112131415161718192021222324252627282930313233343536373839404142434445464748495051525354555657585960
7
Trypsin was added into the solution at ratio of 1 to 50 and digestion was carried out
overnight at 37 ºC. After the removal of non-digested proteins with ultrafiltration, the sample
was dried and analyzed by LC/MS or fractionated with basic pH reversed-phase liquid
chromatography (bRPLC) into 96 fractions before injecting to the LC/MS.
The secreted proteins were also denatured, reduced and alkylated with FASP method as
previously explained 21. Then the proteins were digested by trypsin enzyme (1:50 ratio) at 37 ºC
overnight. The non-digested peptides were removed with ultrafiltration and the sample was
separated into 75 fractions with bRPLC. The fractions were combined into 12 fractions and
analyzed in LC/MS.
Glycopeptide capture with SPEG
Cells were lysed with RIPA buffer (5% Triton-X-100, 5% Sodium Deoxycholate, 0.05% SDS,
790mM NaCl, 50mM Tris) and sonicated. The lysates (800 µg) were denatured, reduced,
alkylated and digested as previously explained 22. Following tryptic digestion, the samples were
desalted through C18 columns and were oxidized with 10 mM sodium periodate at room
temperature in dark for 1 hour. The oxidized samples were mixed with 50 µL of (50% slurry)
hydrazide resins overnight at room temperature for coupling reaction. Then, the non-
glycosylated peptides were removed by washing the immobilized resins with 800 µL of 1.5 M
NaCl and water. In order to release the N-glycosylated peptides from the immobilized support,
the resins were suspended in 50 µL of G7 reaction buffer (50 mM sodium phosphate at pH 7.5)
with 2 µL PNGaseF at 37 ºC overnight shaking. The released formerly glycosylated peptides
were transferred into a glass vial and the resins were washed twice with 100 µL of water. The
washes and the supernatant were then combined in a glass vial and applied to a C18 SepPak
Page 7 of 39
ACS Paragon Plus Environment
Journal of Proteome Research
123456789101112131415161718192021222324252627282930313233343536373839404142434445464748495051525354555657585960

8
column and the eluted samples were dried 23. The samples were separated in strong cation
exchange (SCX) column into 8 fractions and each fraction was analyzed in LC/MS.
Fractionation of peptides using basic pH reversed-phase liquid chromatography (bRPLC)
A bRPLC method was adapted from a protocol described by Wang et al. (2011) 24 with minor
modifications. The bRPLC fractionation of peptides was carried out using an XBridge C18
analytical column (4.6 mm x 250 mm) and a guard column (4.6 x 20 mm), with a 5µm particle
size from Waters (Milford, MA). The binding and equilibrating mobile phase (Solvent A)
consisted of 10 mM triethyl ammonium bicarbonate and the elution mobile phase (Solvent B)
consisted of 10 mM triethyl ammonium bicarbonate in 90% acetonitrile (ACN) with the flow
rate of 1 mL per minute. The digested peptides were loaded on to the column after diluting (3-
fold) in Solvent A. The gradient of acetonitrile used for separation of peptides was as follows:
10% gradient was reached in 10 minutes and 35% gradient was achieved between 10-50 minutes
eluting majority of the peptides. This was followed by a sharp increase to 70% between 50-60
minutes and to 100% B between 60-70 minutes. Ninety six fractions were collected and
concatenated into 48 fractions by merging 1, 48; 2, 49; 3, 50 and so on (Figure 1). On basic
RPLC, peak width was less than 30 sec which allowed us to collect more fractions with the
expectation of identifying unique peptides in each fraction. This also minimized co-isolation of
peptides, so the MS/MS spectrum will be more unbiased. The samples were dried in a Speed Vac
(Farmingdale, NY) equipped with refrigerated condensation trap.
LC-MS/MS Analysis
We carried out a total of 120 LC-MS/MS analyses of different fractions from CHO cell
protein digests on an LTQ-Orbitrap Velos (Thermo Electron, Bremen, Germany) mass
Page 8 of 39
ACS Paragon Plus Environment
Journal of Proteome Research
123456789101112131415161718192021222324252627282930313233343536373839404142434445464748495051525354555657585960
9
spectrometer interfaced with an Eksigent 2D nanoflow LC system. The reversed phase-LC
system consisted of a peptide trap column (75 µm x 2 cm) and an analytical column (75 µm x 10
cm) both packed with Magic AQ C18 material (5 µm, 120Å, www.michrom.com). Eluting
peptides were sprayed directly into an LTQ Orbitrap Velos at 2.0 kV using an electrospray (i.d. 8
µm) emitter tip (New Objective, Woburn, MA) at a flow rate of 300 nl / min and the capillary
temperature was set at 200°C. The entire data dependent tandem MS analysis was carried out in
orbitrap in which precursor and the fragment ions were analyzed at 60,000 and 7,500 resolution
(measured at m/z 400), respectively. FTMS full MS and MSn AGC target were set to 1 million
and 50,000 ions respectively. Survey scans (full ms) were acquired from m/z 350-1,800 with up
to 15 peptide masses (precursor ions) individually isolated with a 1.9 Da window and fragmented
(MS/MS) using a collision energy of 35% in a HCD (higher collision dissociation) cell and 30 s
dynamic exclusion. Minimum signal requirement for triggering an MS2 scan was set to 2,000
and the first mass value was fixed at m/z 140. An ambient air lock mass was set at m/z
371.10123 for real time calibration (ref: PMID: 16249172). For MS/MS analysis, monoisotopic
precursor mass selection and rejection of singly charged ion criteria were enabled.
MS/MS Data Analysis
The MS/MS data were searched against the RefSeq annotation (downloaded October 28,
2011) from the newly established CHO genomic sequence, with each sequence appearing in both
normal and reversed orientation. Searches described in this manuscript include MyriMatch
2.1.103 and TagRecon 1.4.57 19, search engines that use the same final scoring system but that
differ in their selection of candidate peptides for each spectrum (precursor mass versus sequence
tag-based). Both tools were configured for semi-tryptic enzyme specificity allowing maximum 2
Page 9 of 39
ACS Paragon Plus Environment
Journal of Proteome Research
123456789101112131415161718192021222324252627282930313233343536373839404142434445464748495051525354555657585960
10
missed cleavages, with precursor ions required to fall within 10ppm of projected m/z values and
the mass tolerance for fragments ions was 0.5 m/z. The variable modifications for proteome
inventories included both oxidation (M +15.996) and pyroglutamine (N-terminal Q -17.027),
while glycoproteome searches added deamidation (N +0.984). In all cases,
carbamidomethylation (C +57.021) was set as a fixed modification. Identifications in pepXML
format were processed in IDPicker 2.6 for organization and viewing. The majority of the
fractions showed a similar number of peptide spectrum matches (~10,000 PSMs in each
fraction). A 2% FDR was applied to peptide-spectrum matches, computing FDR by doubling the
count of reversed hits above a threshold and dividing by the total number of passing IDs. At the
protein level, parsimony filtering was applied, reporting only the proteins that were supported by
two distinct peptide sequences and requiring at least six spectra to be observed for each protein
with 4.2 % FDR.
KEGG pathway analysis
For all identified proteins, KEGG ortholog identifiers were obtained from the CHO-K1
genome annotation, and their associated KEGG pathway assignments were obtained from the
KEGG database. Enrichment and depletion of expressed proteins and mRNAs were assessed
using the hypergeometric test.
Results
Identification of the whole cell CHO proteome is a key step in the detailed
characterization of this important production host. Obtaining proteins from diverse sources using
multiple separation and analytical methodologies will expand the number of peptides analyzed
Page 10 of 39
ACS Paragon Plus Environment
Journal of Proteome Research
123456789101112131415161718192021222324252627282930313233343536373839404142434445464748495051525354555657585960
11
and proteins identified. For this reason, proteins from whole cell lysate and media and also
enriched glycosylated proteins were separated using multiple chromatographic techniques.
Strong cation exchange chromatography (SCX), reversed phase liquid chromatography (RPLC)
and 1-D SDS gel electrophoresis were used as a first dimension fractionation method followed
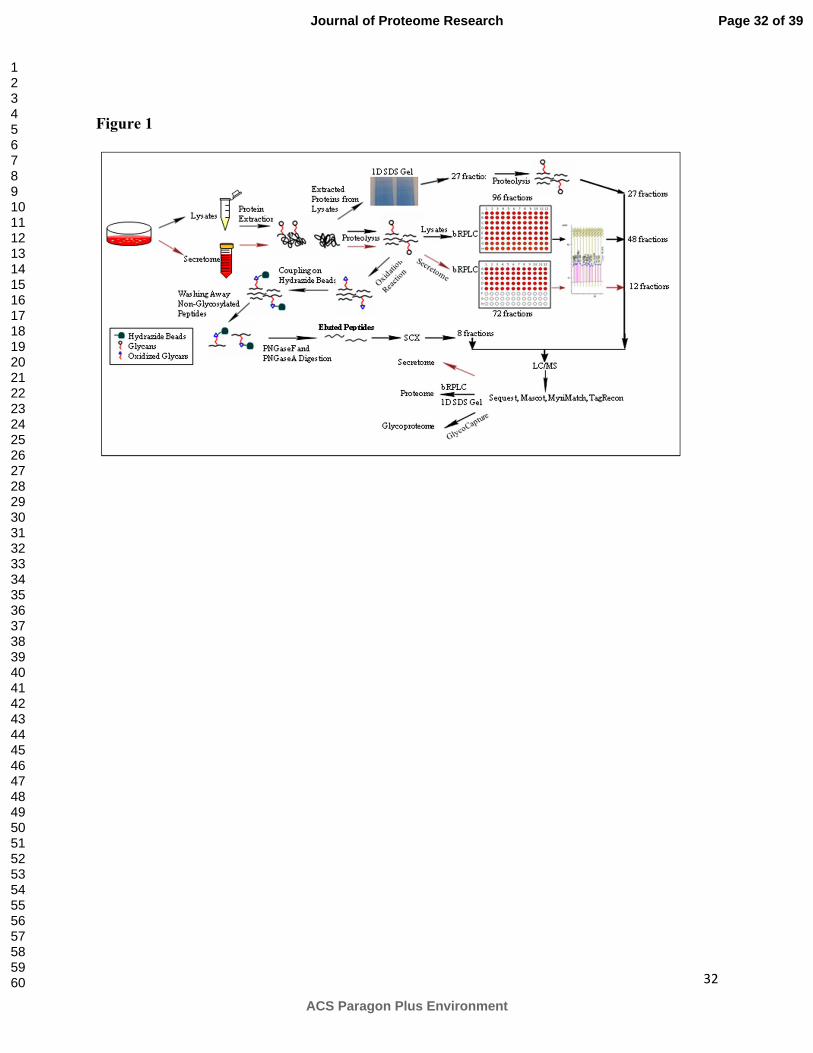
by RPLC as a second dimension because of its compatibility with MS 24-25 as shown in Figure 1.
Fractionation prior to LC/MS/MS increased the identification of the proteins since there were a
reduced number of proteins in each fraction.
For analysis of proteins in the cell lysate, both protein and peptide separation techniques
were used to increase the number of identified intracellular proteins. 400 µg of cell lysate was
run on an SDS gel to separate proteins, after which the gel was cut into 27 pieces and subjected
to in-gel digestion prior to LC/MS/MS analysis. For peptide fractionation, 1 mg of protein was
proteolyzed in solution and then the digested peptides were separated into 96 fractions using
bRPLC and pairs of fractions were then pooled to yield 48 fractions for LC/MS/MS analysis. For
the secretome, the serum free media was collected and concentrated prior to trypsin digestion.
The digested peptides were separated into 72 fractions using bRPLC and fractions were
combined into 12 pools to be analyzed by LC/MS/MS. Since glycosylated proteins are in low
abundance and often localized to the membrane, they may be difficult to analyze using the
traditional proteomic strategies. For this reason, the glycosylated proteins were enriched with
solid phase extraction of glycosylated peptides (SPEG) and then separated into 8 fractions with
SCX before LC/MS/MS analysis. Coupling SPEG to mass spectrometry enabled both
identification of the N-glycosylated proteins and their N-glycosylation sites. Including replicates,
a total of 120 separate mass spectrometry analyses were performed on the CHO lysate, spent
media and glycoproteome.
Page 11 of 39
ACS Paragon Plus Environment
Journal of Proteome Research
123456789101112131415161718192021222324252627282930313233343536373839404142434445464748495051525354555657585960

12
To map the identified spectra to the correct peptides and proteins, TagRecon 19 and
MyriMatch 18 software were used. These algorithms both enabled identification of individual
proteins to increase proteome coverage and confirmed the positive identifications obtained with
different programs. The results obtained using TagRecon and MyriMatch software are discussed
in more detail in the following sections and the proteins and the glycoproteins identified are
listed in Supplementary Table 1 and Supplementary Table 2 with their accession IDs. These two
search engines use the same final scoring system but differ in their selection of candidate
peptides for each spectrum (precursor mass versus sequence tag-based).
The secretome and proteome experiments spanned 94 LC-MS/MS experiments from
which 682,097 MS/MS spectra were identified, corresponding to 93,548 peptide sequences.
Peptide-spectrum matches were required to meet thresholds producing a 2% FDR based on
reversed sequence decoys. A parsimonious protein list was produced from the cell lysaste and
secretome analysis, where two distinct peptides and at least six MS/MS scans were required to
support each protein identified. These peptides enabled identification of 6084 proteins, forming
5782 discernible protein groups, with an empirical 4.2% FDR based on reversed hits. The
experiments from the glycoproteome yielded an additional 29,525 identified MS/MS scans,
matching to 5690 distinct peptide sequences. Filtering in this set applied thresholds to yield a
2% FDR at the peptide-spectrum match level and required two spectra to be identified to each
protein, with a resulting empirical FDR of 0.6% for protein sequences distributed across 1292
discernible protein groups.
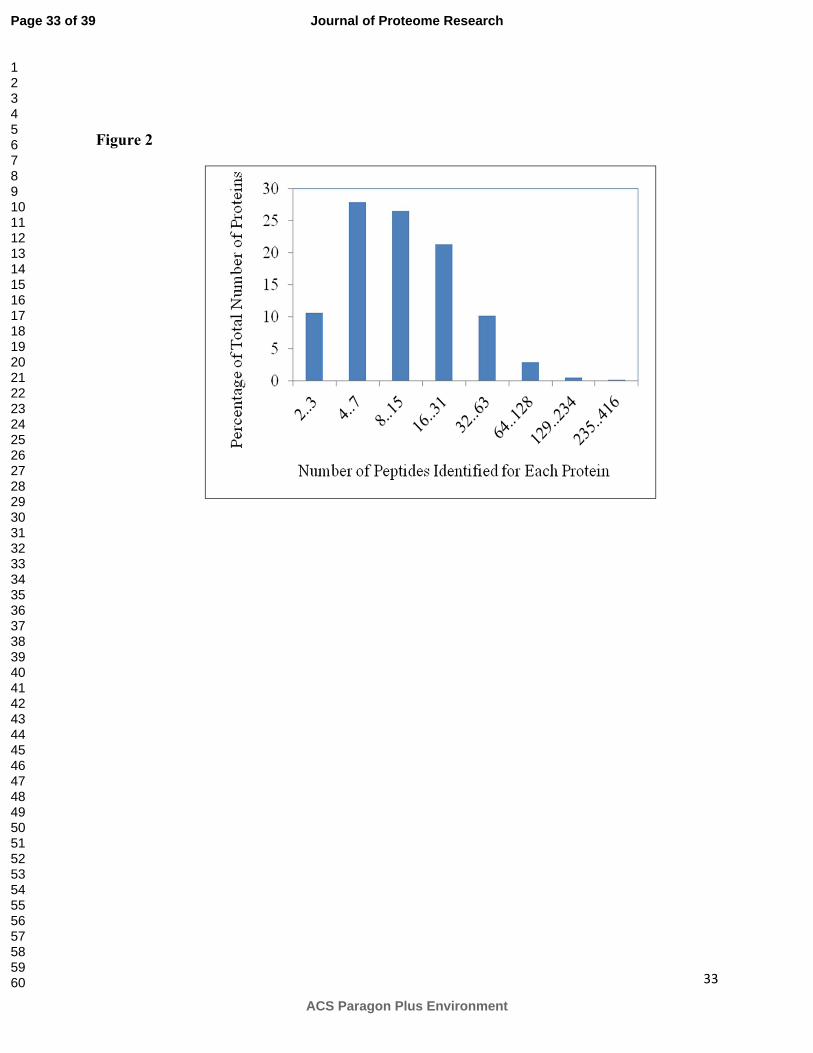
The number of distinct peptides used to identify the proteins is shown in Figure 2, in
which a median value of 10 peptides were used to identify a unique protein. All catalogued
proteins contained at least 2 distinct peptides while some of them, such as actin, included a
Page 12 of 39
ACS Paragon Plus Environment
Journal of Proteome Research
123456789101112131415161718192021222324252627282930313233343536373839404142434445464748495051525354555657585960
13
sufficient number of unique peptides to cover 97% of their sequence. Out of the 682,097
identified tandem mass spectra from the proteome inventories, 345,140 were produced with
bRPLC, 231,045 were produced using Gel/LC/MS, and the rest were split between single-
dimension RPLC chromatographic runs and the secretome. 5,694 out of 5,782 total proteins were
identified from bRPLC runs and 5006 were identified with Gel/LC/MS. Applying gel separation
and chromatographic fractionation separately to the cell lysate proteins increased the number of
proteins identified and helped to confirm identifications. Separate secretome analysis identified
1977 proteins. In addition to the global proteomic analysis of the cell lysate and media proteins,
SPEG coupled SCX and LC/MS identified 5690 N-glycosylated peptides belonging to 1292
unique glycosylated proteins. All together with the glycoproteome and proteome analysis, 6164
unique proteins were identified as listed in Supplementary Table 1. Supplementary Table 1
includes all the accession IDs of identified proteins together with their FDR values, sequence
coverage, identified peptides for each proteins, number of peptides and spectra belonging to each
protein, GO annotations, KEGG pathway annotations and swiss-protein annotations. In addition,
known proteins with the greatest homology at the genetic level were also noted in this Table.
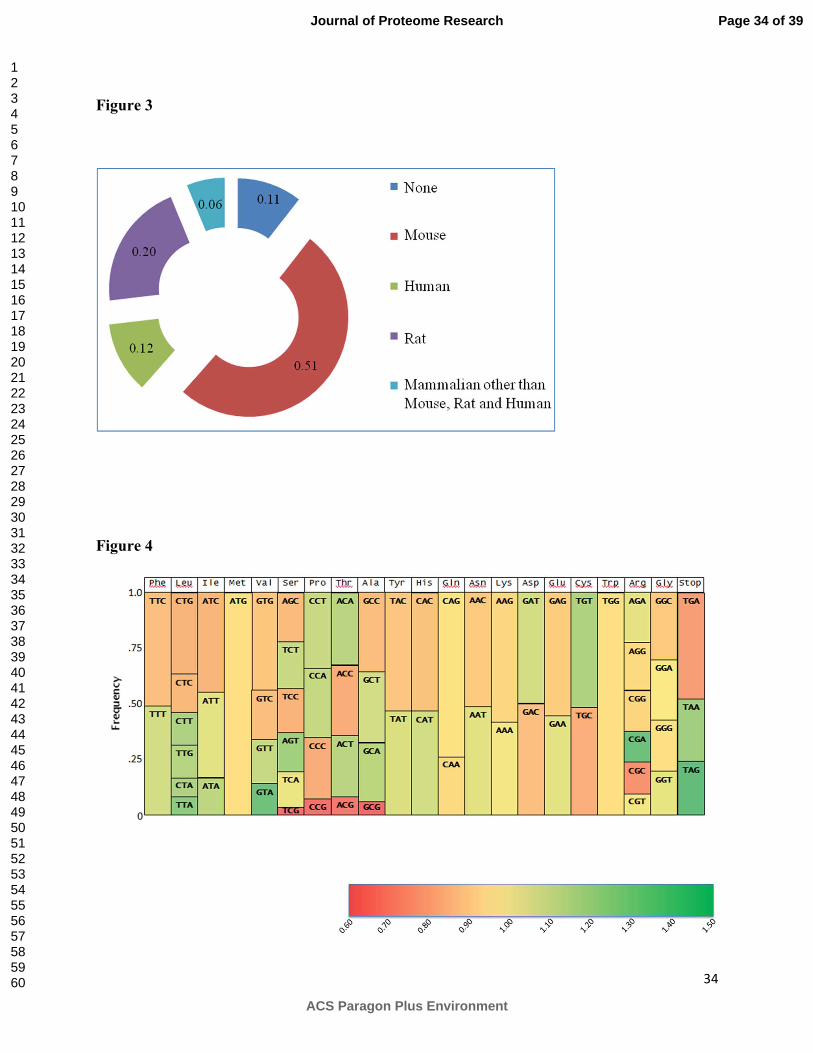
The CHO proteins were then grouped according to the species with greatest homology including
mouse, rat, human or other mammalian such as sheep, orangutan or bovine. As shown in Figure
3, 51 % of the identified proteins were found with closest homologs in mouse followed by 20%
having closest homologs in rat and 12 % close homologs in human. In addition, eleven percent of
the proteins identified did not show homology to any mammalian species.
The raw mass spectrometry data is deposited to Tranche and can be reached at
ProteomeCommons.org26 Tranche using the hash
“O0m+rpvfYIBhq6GI36JaAzaOclnXlGjPZ45tmEEiaUK+q4999kI43JM6Kmg9vTMhDTfN13D
Page 13 of 39
ACS Paragon Plus Environment
Journal of Proteome Research
123456789101112131415161718192021222324252627282930313233343536373839404142434445464748495051525354555657585960
14
FXbnZStS5kOzCCIq+LqYAAAAAAAACYg==.” The identified proteins will also be available
at the CHO genome website (www.chogenome.org)27.
Two different search engines TagRecon and MyriMatch were used to assign spectra
emerging from mass spectrometry using the recently accessible genomic sequence of CHO 7, 28.
IDPicker 2.6 software filtered the identifications and organized the TagRecon and Myrimatch
results in a hierarchy 29. In our study, 93% of the proteins from Gel/LC/MS and 95% of the
proteins from RPLC/LC/MS were identified with both TagRecon and MyriMatch search engines.
While TagRecon and MyriMatch share the same PSM scoring and database sequence processing
functions, they differ in the strategies by which they determine which peptide sequences get
compared to spectra. TagRecon required database peptides to match the sequence and both
flanking masses of at least one of the 30 sequence tags inferred from each spectrum as described
in detail by Dasari et al30. MyriMatch required database peptides to match the mass of the
precursor for a spectrum within 10 ppm as described in detail by Tabb et al31. As a result,
TagRecon compared far fewer sequences to each spectrum, potentially achieving better
sensitivity for spectra that contained reasonable ladders of fragments.
Codon Frequency
All amino acids other than methionine and tryptophan are encoded by at least 2 different
synonymous codons. The usage frequency of these codons is different for each organism which
is due to the characteristics of organism-specific isoaccepting tRNAs 32. The most frequently
used codon for each amino acid is generally read by the most abundant isoaccepting tRNAs
which facilitates rapid and high protein expression 33. Since the population of isoaccepting
tRNAs positively correlates with the codon choice, this leads to a codon frequency for each
genome. In addition to the tRNAs, other factors also contribute to codon bias in mammals 34. For
Page 14 of 39
ACS Paragon Plus Environment
Journal of Proteome Research
123456789101112131415161718192021222324252627282930313233343536373839404142434445464748495051525354555657585960

15
instance, expression of GC rich genes is relatively higher due to efficient transcription and
mRNA processing in mammals 35 whereas AU richness facilitates degradation 36.
In order to increase the expression of human proteins of interest in CHO cell lines, the
codons of human proteins should be optimized to the proper codon frequency for CHO cells.
Thus, the codon frequency of all experimentally detected proteins in CHO was found for each
amino acid and compared to the human proteome. Shown in Figure 4 is the relative frequency
for each codon together with a heat map showing the ratio of each codon’s frequency in CHO
cells to human. Although there are similarities in the codon frequency for CHO and human for
some amino acids such as glutamine and lysine, the codon usage is also quite different for many
others such as proline, threonine, alanine, aspartate, and cysteine. When generating human
recombinant proteins, it may be preferable to replace codons that are sub-optimal for these amino
acids in order to increase efficiency of expression.
Gene Ontology Analysis
Gene ontology (GO) annotation represents one way to standardize the biological
functions of the genes 37. As a result, both predicted genes from CHO genome annotations and
proteins experimentally identified by mass spectrometry were functionally annotated with GO-
slim terms. Statistical analysis of the experimentally identified proteins was performed based on
all the predicted gene models and p-values for each GO-slim term calculated using Fisher’s exact
test 38. These p-values are listed in Supplementary Table 3 for each GO-slim term.
Supplementary Table 3 also includes the list of proteins categorized by their GO annotation
terms as a table.
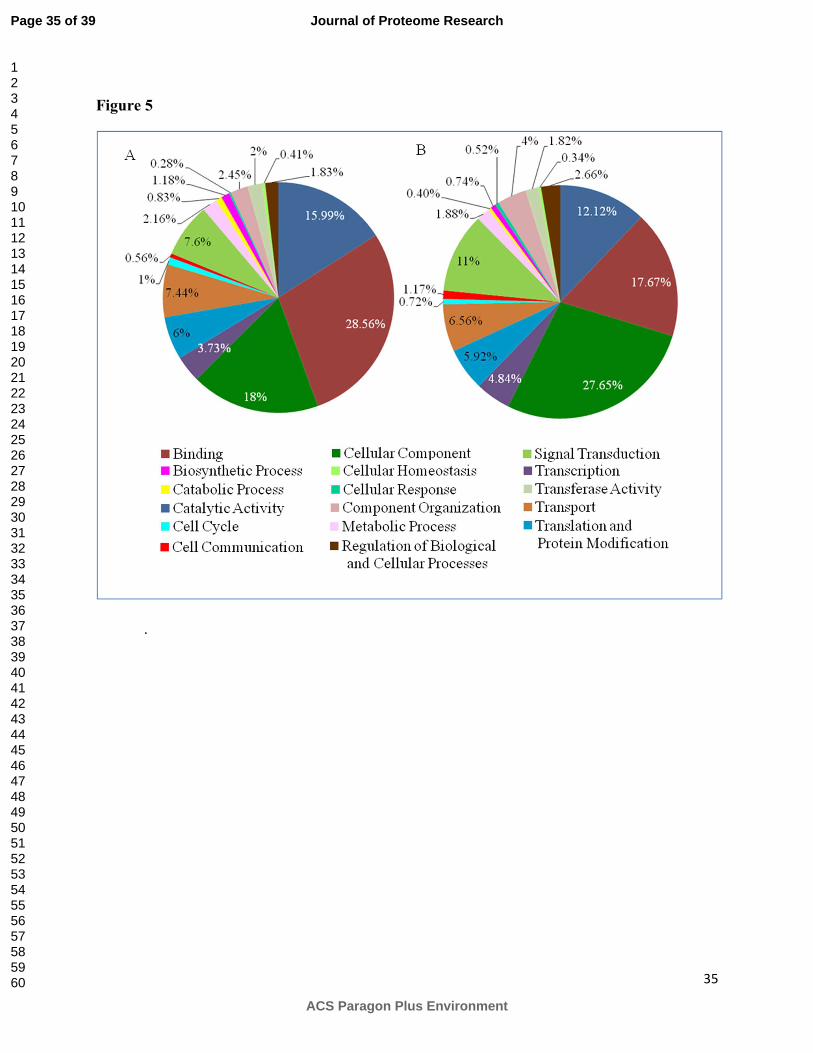
The significantly enriched groups were categorized into 17 main GO groups as shown in
Figure 5. In addition to the whole proteome, the glycoproteome was also statistically analyzed
Page 15 of 39
ACS Paragon Plus Environment
Journal of Proteome Research
123456789101112131415161718192021222324252627282930313233343536373839404142434445464748495051525354555657585960

16
and categorized into the functional GO groups. While the largest percentage of proteins are
allocated to binding category in the proteome such as protein, RNA, DNA and chaperone
binding molecules, the highest percentage of proteins in the glycoproteome are allocated to the
cellular components such as N-acetylglucosaminyltransferases in the secretory compartment of
the endoplasmic reticulum and golgi apparatus. Also, the glycoproteome has a larger percentage
of proteins dedicated to functions such as signal transduction and cell signaling, and cell
communication while the proteome has a greater percentage of proteins devoted to catalytic
activity, and metabolic or biosynthetic processes.
Correlation between protein and mRNA abundance
Very little analysis has been performed concerning the relationship between the mRNA
and protein abundance in CHO cells due to the lack of corresponding data sets. Mass
spectrometry profiling provides information on the relative levels of proteins by providing the
number of spectra assigned to each protein (spectral count) 39. The abundance of the identified
proteins is then estimated by normalizing the total spectral count for each protein with the length
of the protein in order to define the spectral abundance factor (SAF). In order to normalize the
variability between sample runs, each SAF value is divided by total SAF values in order to
determine the normalized spectral abundance factor (NSAF) 40. Using this approach, a
relationship between the mRNA levels obtained by previous transcriptomic analysis and protein
abundance was estimated for each gene 7. The used mRNA expression levels are standard
normalized FPKM values which are fragments of reads mapped per kilobase of exon model,
given in Supplementary Table 4. From a biological standpoint, less abundant mRNAs are
expected to encode less abundant proteins 41. Therefore one may expect to have a linear
correlation between the mRNA and protein levels. However this is often not the case because
Page 16 of 39
ACS Paragon Plus Environment
Journal of Proteome Research
123456789101112131415161718192021222324252627282930313233343536373839404142434445464748495051525354555657585960
17
modifications and degradation rates of mRNA and proteins can be regulated at the post-
transcriptional or post-translational level, respectively 41-42. For example, host cells may shut off
transcription of some genes and degrade the mRNAs while maintaining a stable protein to
function for extended periods 41. In order to identify the stable and unstable proteins in CHO cell
lines, the relative protein abundance (or intensity) of each protein identified was plotted against
its corresponding mRNA intensity level as shown in the log2-log2 plot of Figure 6.
The relation between mRNA and protein intensities was fitted using a least-square
regression and the p-value was calculated based on a fitting error 43. Statistical analysis of
mRNA and protein intensities showed a high degree of correlation of 0.48 (p-value <1e-16) with
a linear slope of 0.4.
Although the majority of the protein intensities exhibited a linear correlation with the
mRNA levels on a log2-log2 scale, a significant number of proteins were also detected with high
protein intensity and low mRNA levels, representing stable proteins. Conversely, unstable
proteins showed relatively high mRNA and low protein intensity. In order to determine the
significance of stability for each protein, the p-value of each protein based on its relative mRNA
and protein levels was examined. Stable and unstable proteins with p-value <0.05 are listed in
Supplementary Table 5.
Annotating the stable and unstable proteins with GO terms indicated which functional
categories of proteins are more stable or unstable in CHO cells. Transport, signal transduction
and cell signaling molecules such as protein kinases, and transcription related proteins including
transcription factors, zinc fingers and cell cycle checkpoint control proteins were enriched in the
unstable group; whereas, tubulin, myosin and binding proteins such as interleukin binding factors
Page 17 of 39
ACS Paragon Plus Environment
Journal of Proteome Research
123456789101112131415161718192021222324252627282930313233343536373839404142434445464748495051525354555657585960
18
and ribonuclear proteins were enriched in the stable protein category and depleted in the unstable
protein group.
KEGG Pathway Analysis
The identified proteins were annotated with the KEGG ids and these are tabulated
Supplementary Table 1. When this data was combined with previous mRNA analysis, many
metabolic pathways accounted for in the CHO genome were observed according to proteome,
transcriptome, or both sources. However, this analysis showed significant enrichment or
depletion in protein or mRNAs relative to the genome for various pathways. Particular pathways
significantly depleted in the proteome and transciptome include glycosphingolipid biosynthesis,
steroid hormone biosynthesis and primary bile acid biosynthesis.
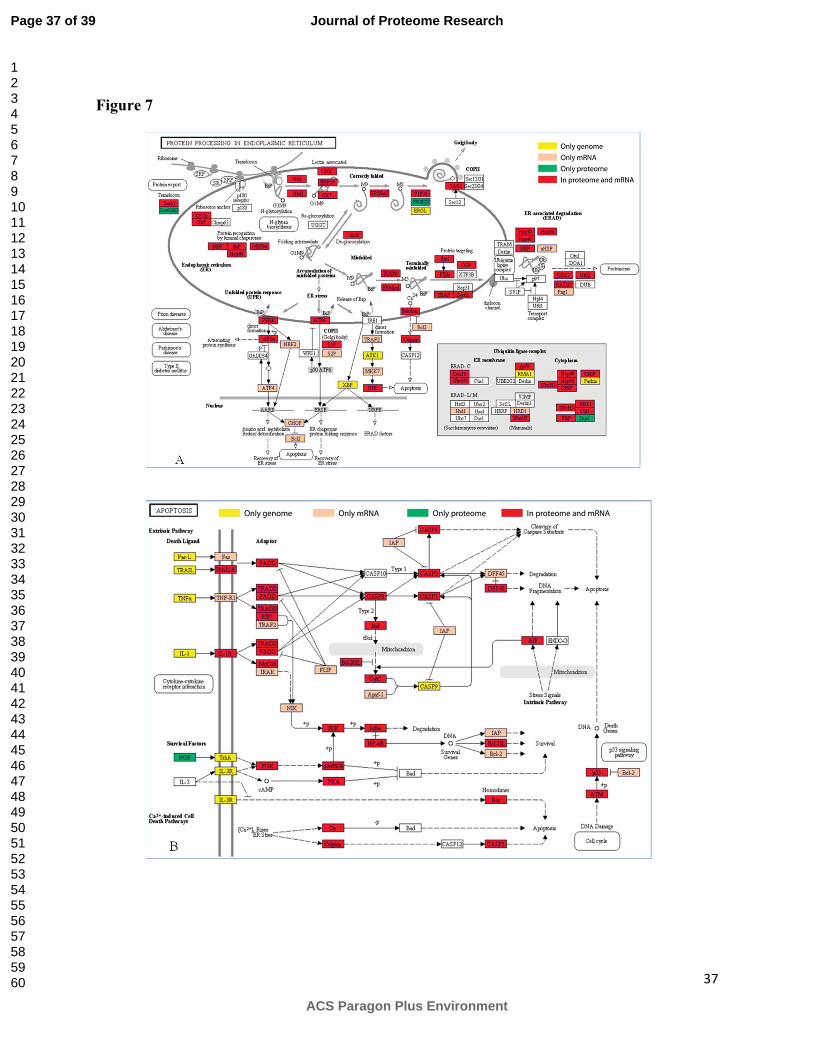
Other pathways including protein processing and apoptosis shown in Figure 7 were
enriched in proteins identified in the current proteome study. These pathways are of particular
relevance to viability of CHO and its use as a host for the production of complex secreted
recombinant proteins.
Some of the genes such as Sec6263 and ERGIC53 in the protein processing pathway
were detected at the protein level whereas they did not show any expression at the mRNA level.
On the other hand, genes such as IAP, Bcl2 and FLIP in the apoptosis pathway were not
observed at the proteome level but expression was detected at the mRNA level. Some additional
genes such as CASP9, ASK1 and ERGL were also found to be silenced at both mRNA and
protein levels.
Post translational Modifications: N-Glycosylation and N-acetylation
The glycopeptide capture technique provided further enrichment of N-linked
glycosylated proteins and identification of 1292 glycoproteins. In particular,
Page 18 of 39
ACS Paragon Plus Environment
Journal of Proteome Research
123456789101112131415161718192021222324252627282930313233343536373839404142434445464748495051525354555657585960
19
glycosyltransferases, membrane proteins, growth factors and apoptosis related proteins were
found to be glycosylated as listed in Supplementary Table 2.
Another abundant post-translational modifications in eukaryotes is N-terminal acetylation
which is carried out by N-acetyl transferases 44. The N-terminal acetylation was set as a variable
modification while searching the mass spectrometry data within the CHO database. 736 of the
1010 peptides identified with N-termini were found to be N-acetylated as listed in
Supplementary Table 6. Alanine (38%) and methionine (38%) were the two major amino acids
including the N-terminal acetylation modifications whereas 15% of the peptides had an
acetylated serine residue.
Discussion
CHO cells are the most widely used hosts for expression of commercial proteins since
they can perform post-translational modifications compatible with human patients and are
readily adapted to suspension and fed-batch cultures for scale-up 45. Although well-
characterized technologies such as transfection, clone selection, media formulation and
bioprocess optimization have been used to improve productivity, the cellular machinery itself is
poorly characterized 46. Cellular processes including gene transcription, translation, post-
translational modifications, transport, metabolism, degradation, signaling, apoptosis, and many
other cellular events all play important roles in cell growth and protein synthesis, processing, and
secretion. Knowledge concerning cellular processes at the molecular level will increase our
understanding of CHO as an important production host and enhance our potential capabilities for
improving cell specific productivity of recombinant proteins 46. This knowledge will also be
helpful in future targeted cell engineering strategies aimed at altering functions involving protein
processing, cell growth, glycosylation, apoptosis, and metabolic pathways.
Page 19 of 39
ACS Paragon Plus Environment
Journal of Proteome Research
123456789101112131415161718192021222324252627282930313233343536373839404142434445464748495051525354555657585960
20
Previously, Xu et al. (2011) identified 24,383 predicted genes and 11,099 transcripts in
their genomic and transcriptomic studies of a CHO-K1 cell line 7. In the current study, multiple
fractionation and enrichment methods were used to generate over 682,097 mass spectra that were
mapped to the genome and transcriptome of CHO cell lines in order to identify a total of 6,164
grouped proteins. Integration of the proteome with the transcriptome and genome confirmed
many of the sequences of predicted genes. For instance, 3689 of the predicted genes were shown
to be expressed at both mRNA and protein levels. However, the method also identified genes
currently detected at the protein level only. Indeed, 2,475 of the proteins identified in the mass
spectrometry analysis were not detected at the mRNA level in the previous study 7. Furthermore,
the average number of spectra used in the assignment of these 2,475 proteins was 6 and all of
these proteins were identified using at least 2 unique peptides with a protein false discovery rate
of 4.2%. These undetected mRNAs might be present in low abundance due to regulation of
transcription or mRNA stability. Thus, this study represents the most comprehensive proteome
study of CHO cell lines to date since it extends the number of identified proteins by more than a
factor of 8 times compared to the previous studies 47-49. Furthermore, this study represents the
first large-scale high-throughput proteomics study to use the CHO genome to identify these
6,164 proteins. Previous efforts typically used rodent or mammalian databases to match the
CHO mass spectra due to the lack of CHO genome data.
Three important protein groups from the cellular domain, secretome and glycoproteome
were characterized in this study. Due to its complexity, two different fractionation techniques,
1D gel and bRPLC were used to separate cellular proteins and peptides, respectively. These two
methods were able to identify 5006 and 5694 proteins, respectively. For the current study, in-
solution digestion of proteins and peptides separation together with the bRPLC technique
Page 20 of 39
ACS Paragon Plus Environment
Journal of Proteome Research
123456789101112131415161718192021222324252627282930313233343536373839404142434445464748495051525354555657585960
21
appears to be more efficient for protein identification as compared to separating proteins using a
1D gel followed by in-gel digestion 24.
One of the biggest challenges in proteomics is the data analysis, which can be a limiting
step for protein identification. For this reason, 2 different search engines, Myrimatch and
TagRecon, were used here. In a previous study, MyriMatch was observed to be highly
discriminative compared to other search engines 31. Nonetheless, more than 90% of the proteins
were identified with both of the search engines. Together, MyriMatch and TagRecon algorithms
were able to increase the proteome coverage and provide confirmation and consistency for the
catalogued proteins.
Annotating the proteins with GO terms and statistical analysis provided information on
which functional groups are enriched in the CHO proteome. In the CHO proteome, binding
proteins such as protein binding, RNA binding, ion binding, DNA binding proteins and proteins
involved in catalytic activity dominated over the other functional groups. Enrichment of
glycosylated proteins provided for the identification of other functional groups including cell
communication, signal transduction, cell signaling, and response to biotic stimulus. Many of the
proteins in these secreted and glycosylated groups are cell adhesion molecules, receptors, ion
transporters and other proteins often localized in membrane or extracellular matrix. Thus, the
inclusion of the SPEG method has provided for the enrichment of these glycoproteins of the
proteome 50.
This study also allowed us to categorize proteins and mRNA according to abundance by
tracking the number of mass spectra associated with a particular peptide and protein. There are
multiple factors affecting mRNA and protein abundance. In additional to transcriptional control
of gene expression by promoter, transcriptional regulatory elements, and transcriptional factors, a
Page 21 of 39
ACS Paragon Plus Environment
Journal of Proteome Research
123456789101112131415161718192021222324252627282930313233343536373839404142434445464748495051525354555657585960
22
number of factors also regulate the stability of the mRNA. The factors that affect the level of the
mRNA can be grouped into structural and sequential determinants. The structural determinants
include the 3’ terminal stem loop 51, iron responsive elements 52, and the long range stem loop in
the 3’ untranslated region 53. Sequential determinants such as a Poly-A-tail 54 stabilize the
mRNA whereas an AU rich sequence in 3’ region 55 causes degradation of mRNA. As a result,
the half-life of mRNA can change from 20 minutes to over 100 hours 56. On the other hand,
protein intensity is affected by translational control and the stability of mRNA, folding,
localization, post-translational modifications and other cellular processes 57. Due to these
reasons, it is difficult to provide a direct correlation between the selected mRNAs and the protein
levels for a small set of data 58. Nonetheless, Greenbaum et al. (2003) observed correlations
between the mRNA and protein abundances in yeast although the significance of the correlations
depended on the function and location of the proteins 42. In this study, we have also found a
significant correlation between mRNA and protein levels with a p-value of <1e-16.
Some proteins such as binding and structural proteins including tubulin were found to
have high protein abundance with low mRNA levels whereas others such as transcription factors
were found have relatively high mRNA levels and low protein abundance. Certain classes of
proteins are functionally and structurally important and should not be turned over rapidly for
cellular processes. Furthermore, autoregulation mechanisms can help to destabilize of some of
the RNAs. For example, when tubulin is synthesized above a threshold level, it triggers ribosome
associated RNase to degrade its own mRNA. On the other hand, transcription factors have been
found to be unstable 56 and were also found in low quantities in our study. Although their mRNA
levels were high, their protein levels were significantly lower. Indeed, previous studies have
found that transcription factors are unstable due to the need for the cell to turnover these factors
Page 22 of 39
ACS Paragon Plus Environment
Journal of Proteome Research
123456789101112131415161718192021222324252627282930313233343536373839404142434445464748495051525354555657585960
23
rapidly 56. These proteins also contain relatively higher amounts of proline, aspartate, glutamate,
threonine and serine which tend to be less stable 56.
Previous studies have shown that codon bias is another important feature affecting
protein expression levels in humans 34, 59. Given that it is desirable to obtain the highest possible
expression levels of human genes in CHO cells for biopharmaceutical applications, factors such
as codon bias that can have a negative effect on the protein expression must be considered. 34.
Having the largest known collection of CHO proteins and their gene sequences available enabled
a comprehensive assessment of CHO codon usage along with a comparison between the CHO
and human codon frequency. This comparison did indeed indicate differences especially in the
codon usage of proline, threonine, aspartate and cysteine. Furthermore, since aspartate, threonine
and proline containing proteins are relatively unstable 56, the codons for these amino acids should
be changed for optimal synthesis of human proteins in CHO.
Codon bias is thought to arise from ancient evolutionary mutations, in which some
tRNAs for individual codons in an organism became overexpressed. This overexpression led to a
greater abundance of proteins made from mRNA with these preferred codons. Over time
evolution favored these codons more than others, until they became the codon bias of the
organism 32. Recent studies have also shown that other factors affecting mRNA stability such as
GC content also play a major role in the codon bias of mammals 34. Codon bias can also have
adverse effects on heterelogous expression such as ribosomal frameshifting or pausing and
cleavage of mRNA during co-translation 34. Since human proteins are often being expressed in
CHO cells, codon optimization of the genes before transfection into CHO cell lines will be
highly relevant to enhancing its translational efficiency 60.
Page 23 of 39
ACS Paragon Plus Environment
Journal of Proteome Research
123456789101112131415161718192021222324252627282930313233343536373839404142434445464748495051525354555657585960
24
KEGG pathway analysis indicated that mucin type or other types of glycosphingolipid
biosynthesis, steroid hormone biosynthesis and primary bile acid biosynthesis steps were
depleted in CHO cell lines relative to some other pathways. Although most of the genes
responsible for these metabolic pathways were identified in the genome, their expression was not
validated with mRNA or mass spectrometry analysis to suggest that some of these genes may be
silenced in CHO cells. On the other hand, statistical analysis indicated that some pathways such
as fatty acid metabolism, amino sugar and nucleotide sugar metabolism, which provide important
precursors to recombinant protein synthesis, as well as protein processing and apoptosis, were
enriched in CHO cell lines. Even for these enriched pathways, some important proteins were not
detected. For example, Bcl-2 was not evident at the protein level to suggest its protein expression
may be low in CHO-K1 cells. Interestingly, previous studies have shown that transfection of
heterologous Bcl-2 can help to prevent apoptosis in CHO cells 61-63, perhaps by overcoming
limitations in the endogenous levels of this anti-apoptotic protein.
One major reason for using CHO cells as hosts for the recombinant protein expression is
their capability to perform N-glycosylation. Indeed 1292 glycosylated proteins including neural
cell adhesion molecules, growth factors, GPCRs, interleukin and transferrin receptors and
glycosyltransferases were identified using the SPEG method. The glycoproteomic technique also
identified highly abundant sialidases and glycosidases which can lead to glycan heterogeneity.
These glycosidases and sialidases genes represent potential targets of opportunity for cell
engineering in order to alter the glycan content of expressed glycoproteins from CHO cells.
Examining our proteomic data also revealed that 87% of these N-terminally identified peptides
contained N-acetylation. Previous studies have also shown that 80 to 90% of proteins are N-
acetylated in mammals supporting our results 44.
Page 24 of 39
ACS Paragon Plus Environment
Journal of Proteome Research
123456789101112131415161718192021222324252627282930313233343536373839404142434445464748495051525354555657585960
25
Conclusion
High-throughput proteomic analysis has been successfully applied to CHO cells using
two dimensional fractionation coupled with RPLC-MS/MS. From more than 682,097 MS/MS
spectra, 93,548 unique peptides were identified representing 5782 grouped proteins. Together
with the glycoproteomic analysis, a total of 6164 proteins were identified. In addition, the codon
frequency of CHO cells and its comparison to human were specified. Furthermore, statistical
analysis on the mRNA and protein intensity levels identified proteins both over and under
expressed in CHO cells relative to their mRNA level. Analysis on this proteomic data revealed
enriched and depleted functional gene categories in CHO expression systems. The analysis of
the pathways associated with these protein categories such as protein processing and apoptosis
that were enriched or depleted in the proteome also indicated overexpressed or underexpressed
genes which represent targets of opportunity for future cell engineering efforts aimed at altering
CHO cell growth, metabolism, protein expression, glycosylation or other protein modifications
for improving production of biopharmaceuticals of interest.
Acknowledgement
This work was supported by National Scientific Foundation by Grant NSF-EFRI:
0736000. It was also supported by two federal funds from the National Cancer Institute, National
Institutes of Health, by Early Detection Research Network (NIH/NCI/EDRN) grant
U01CA152813 and also U01 CA152647. We also thank Johns Hopkins University School of
Medicine (JHUSOM) Mass Spectrometry and Proteomics Facility for their effort in this study.
Nomenclature
CHO Chinese Hamster Ovary
MS Mass Spectrometry
Page 25 of 39
ACS Paragon Plus Environment
Journal of Proteome Research
123456789101112131415161718192021222324252627282930313233343536373839404142434445464748495051525354555657585960
26
SPEG Solid Phase Extraction of Glycopeptides
FDR False Discovery Rate
EST Expressed Sequence Tag
FASP Filter Aided Sample Preparation
bRPLC Basic Reversed-Phase Liquid Chromatography
LTQ Linear Trap Quadrupole
FT Fourier Transform
SCX Strong Cation Exchange
GO Gene Ontology
SAF Spectral Abundance Factor
NSAF Normalized Spectral Abundance Factor
References
1. Walsh, G., Biopharmaceutical benchmarks 2010. Nat Biotechnol 2010, 28, (9), 917-24. 2. Lim, Y.; Wong, N. S.; Lee, Y. Y.; Ku, S. C.; Wong, D. C.; Yap, M. G., Engineering mammalian cells in bioprocessing - current achievements and future perspectives. Biotechnol Appl Biochem 2010, 55, (4), 175-89. 3. Mohan, C.; Kim, Y. G.; Koo, J.; Lee, G. M., Assessment of cell engineering strategies for improved therapeutic protein production in CHO cells. Biotechnol J 2008, 3, (5), 624-30. 4. Wei, Y. Y.; Naderi, S.; Meshram, M.; Budman, H.; Scharer, J. M.; Ingalls, B. P.; McConkey, B. J., Proteomics analysis of chinese hamster ovary cells undergoing apoptosis during prolonged cultivation. Cytotechnology 2011, 63, (6), 663-77. 5. Kim, J. Y.; Kim, Y. G.; Han, Y. K.; Choi, H. S.; Kim, Y. H.; Lee, G. M., Proteomic understanding of intracellular responses of recombinant Chinese hamster ovary cells cultivated in serum-free medium supplemented with hydrolysates. Appl Microbiol Biotechnol 2011, 89, (6), 1917-28. 6. Gupta, P.; Lee, K. H., Genomics and proteomics in process development: opportunities and challenges. Trends Biotechnol 2007, 25, (7), 324-30. 7. Xu, X.; Nagarajan, H.; Lewis, N. E.; Pan, S.; Cai, Z.; Liu, X.; Chen, W.; Xie, M.; Wang, W.; Hammond, S.; Andersen, M. R.; Neff, N.; Passarelli, B.; Koh, W.; Fan, H. C.; Wang, J.; Gui, Y.; Lee, K. H.; Betenbaugh, M. J.; Quake, S. R.; Famili, I.; Palsson, B. O., The genomic sequence of the Chinese hamster ovary (CHO)-K1 cell line. Nat Biotechnol 2011, 29, (8), 735-41.
Page 26 of 39
ACS Paragon Plus Environment
Journal of Proteome Research
123456789101112131415161718192021222324252627282930313233343536373839404142434445464748495051525354555657585960

27
8. Baycin-Hizal, D.; Tian, Y.; Akan, I.; Jacobson, E.; Clark, D.; Chu, J.; Palter, K.; Zhang, H.; Betenbaugh, M. J., GlycoFly: a database of Drosophila N-linked glycoproteins identified using SPEG--MS techniques. J Proteome Res 2011, 10, (6), 2777-84. 9. Kuystermans, D.; Krampe, B.; Swiderek, H.; Al-Rubeai, M., Using cell engineering and omic tools for the improvement of cell culture processes. Cytotechnology 2007, 53, (1-3), 3-22. 10. Yoshida, K.; Kobayashi, K.; Miwa, Y.; Kang, C. M.; Matsunaga, M.; Yamaguchi, H.; Tojo, S.; Yamamoto, M.; Nishi, R.; Ogasawara, N.; Nakayama, T.; Fujita, Y., Combined transcriptome and proteome analysis as a powerful approach to study genes under glucose repression in Bacillus subtilis. Nucleic Acids Res 2001, 29, (3), 683-92. 11. Doolan, P.; Meleady, P.; Barron, N.; Henry, M.; Gallagher, R.; Gammell, P.; Melville, M.; Sinacore, M.; McCarthy, K.; Leonard, M.; Charlebois, T.; Clynes, M., Microarray and proteomics expression profiling identifies several candidates, including the valosin-containing protein (VCP), involved in regulating high cellular growth rate in production CHO cell lines. Biotechnol Bioeng 2010, 106, (1), 42-56. 12. Chaerkady, R.; Kelkar, D. S.; Muthusamy, B.; Kandasamy, K.; Dwivedi, S. B.; Sahasrabuddhe, N. A.; Kim, M. S.; Renuse, S.; Pinto, S. M.; Sharma, R.; Pawar, H.; Sekhar, N. R.; Mohanty, A. K.; Getnet, D.; Yang, Y.; Zhong, J.; Dash, A. P.; Maccallum, R. M.; Delanghe, B.; Mlambo, G.; Kumar, A.; Prasad, K. T.; Okulate, M.; Kumar, N.; Pandey, A., A proteogenomic analysis of Anopheles gambiae using high-resolution Fourier transform mass spectrometry. Genome Res 2011. 13. Brunner, E.; Ahrens, C. H.; Mohanty, S.; Baetschmann, H.; Loevenich, S.; Potthast, F.; Deutsch, E. W.; Panse, C.; de Lichtenberg, U.; Rinner, O.; Lee, H.; Pedrioli, P. G.; Malmstrom, J.; Koehler, K.; Schrimpf, S.; Krijgsveld, J.; Kregenow, F.; Heck, A. J.; Hafen, E.; Schlapbach, R.; Aebersold, R., A high-quality catalog of the Drosophila melanogaster proteome. Nat Biotechnol 2007, 25, (5), 576-83. 14. Desiere, F.; Deutsch, E. W.; Nesvizhskii, A. I.; Mallick, P.; King, N. L.; Eng, J. K.; Aderem, A.; Boyle, R.; Brunner, E.; Donohoe, S.; Fausto, N.; Hafen, E.; Hood, L.; Katze, M. G.; Kennedy, K. A.; Kregenow, F.; Lee, H.; Lin, B.; Martin, D.; Ranish, J. A.; Rawlings, D. J.; Samelson, L. E.; Shiio, Y.; Watts, J. D.; Wollscheid, B.; Wright, M. E.; Yan, W.; Yang, L.; Yi, E. C.; Zhang, H.; Aebersold, R., Integration with the human genome of peptide sequences obtained by high-throughput mass spectrometry. Genome Biol 2005, 6, (1), R9. 15. Yee, J. C.; de Leon Gatti, M.; Philp, R. J.; Yap, M.; Hu, W. S., Genomic and proteomic exploration of CHO and hybridoma cells under sodium butyrate treatment. Biotechnol Bioeng 2008, 99, (5), 1186-204. 16. Lee, J. S.; Park, H. J.; Kim, Y. H.; Lee, G. M., Protein reference mapping of dihydrofolate reductase-deficient CHO DG44 cell lines using 2-dimensional electrophoresis. Proteomics 2010, 10, (12), 2292-302. 17. Baik, J. Y.; Joo, E. J.; Kim, Y. H.; Lee, G. M., Limitations to the comparative proteomic analysis of thrombopoietin producing Chinese hamster ovary cells treated with sodium butyrate. J Biotechnol 2008, 133, (4), 461-8. 18. MyriMatch, http://forge.fenchurch.mc.vanderbilt.edu/scm/viewvc.php/*checkout*/trunk/doc/index.html?root=myrimatch. 19. TagRecon, http://forge.fenchurch.mc.vanderbilt.edu/scm/viewvc.php/*checkout*/trunk/doc/index.html?root=tagrecon.
Page 27 of 39
ACS Paragon Plus Environment
Journal of Proteome Research
123456789101112131415161718192021222324252627282930313233343536373839404142434445464748495051525354555657585960
28
20. Harsha, H. C.; Molina, H.; Pandey, A., Quantitative proteomics using stable isotope labeling with amino acids in cell culture. Nat Protoc 2008, 3, (3), 505-16. 21. Wisniewski, J. R.; Zougman, A.; Nagaraj, N.; Mann, M., Universal sample preparation method for proteome analysis. Nat Methods 2009, 6, (5), 359-62. 22. Baycin-Hizal, D.; Tian, Y.; Akan, I.; Jacobson, E.; Clark, D.; Wu, A.; Jampol, R.; Palter, K.; Betenbaugh, M.; Zhang, H., GlycoFish: a database of zebrafish N-linked glycoproteins identified using SPEG method coupled with LC/MS. Anal Chem 2011, 83, (13), 5296-303. 23. Tian, Y.; Zhou, Y.; Elliott, S.; Aebersold, R.; Zhang, H., Solid-phase extraction of N-linked glycopeptides. Nat Protoc 2007, 2, (2), 334-9. 24. Wang, Y.; Yang, F.; Gritsenko, M. A.; Clauss, T.; Liu, T.; Shen, Y.; Monroe, M. E.; Lopez-Ferrer, D.; Reno, T.; Moore, R. J.; Klemke, R. L.; Camp, D. G., 2nd; Smith, R. D., Reversed-phase chromatography with multiple fraction concatenation strategy for proteome profiling of human MCF10A cells. Proteomics 2011, 11, (10), 2019-26. 25. Tao, D.; Qiao, X.; Sun, L.; Hou, C.; Gao, L.; Zhang, L.; Shan, Y.; Liang, Z.; Zhang, Y., Development of a highly efficient 2-D system with a serially coupled long column and its application in identification of rat brain integral membrane proteins with ionic liquids-assisted solubilization and digestion. J Proteome Res 2011, 10, (2), 732-8. 26. https://proteomecommons.org/tranche/, Tranche. 27. http://www.chogenome.org/, CHO Genome. 28. Hammond, S.; Swanberg, J. C.; Kaplarevic, M.; Lee, K. H., Genomic sequencing and analysis of a Chinese hamster ovary cell line using Illumina sequencing technology. BMC Genomics 2011, 12, 67. 29. Holman, J. D.; Ma, Z. Q.; Tabb, D. L., Identifying Proteomic LC-MS/MS Data Sets with Bumbershoot and IDPicker. Curr Protoc Bioinformatics 2012, Chapter 13, Unit13 17. 30. Dasari, S.; Chambers, M. C.; Slebos, R. J.; Zimmerman, L. J.; Ham, A. J.; Tabb, D. L., TagRecon: high-throughput mutation identification through sequence tagging. J Proteome Res 2010, 9, (4), 1716-26. 31. Tabb, D. L.; Fernando, C. G.; Chambers, M. C., MyriMatch: highly accurate tandem mass spectral peptide identification by multivariate hypergeometric analysis. J Proteome Res 2007, 6, (2), 654-61. 32. Ikemura, T., Codon usage and tRNA content in unicellular and multicellular organisms. Mol Biol Evol 1985, 2, (1), 13-34. 33. Elf, J.; Nilsson, D.; Tenson, T.; Ehrenberg, M., Selective charging of tRNA isoacceptors explains patterns of codon usage. Science 2003, 300, (5626), 1718-22. 34. Plotkin, J. B.; Kudla, G., Synonymous but not the same: the causes and consequences of codon bias. Nat Rev Genet 2011, 12, (1), 32-42. 35. Kudla, G.; Lipinski, L.; Caffin, F.; Helwak, A.; Zylicz, M., High guanine and cytosine content increases mRNA levels in mammalian cells. PLoS Biol 2006, 4, (6), e180. 36. Chamary, J. V.; Hurst, L. D., Evidence for selection on synonymous mutations affecting stability of mRNA secondary structure in mammals. Genome Biol 2005, 6, (9), R75. 37. Giot, L.; Bader, J. S.; Brouwer, C.; Chaudhuri, A.; Kuang, B.; Li, Y.; Hao, Y. L.; Ooi, C. E.; Godwin, B.; Vitols, E.; Vijayadamodar, G.; Pochart, P.; Machineni, H.; Welsh, M.; Kong, Y.; Zerhusen, B.; Malcolm, R.; Varrone, Z.; Collis, A.; Minto, M.; Burgess, S.; McDaniel, L.; Stimpson, E.; Spriggs, F.; Williams, J.; Neurath, K.; Ioime, N.; Agee, M.; Voss, E.; Furtak, K.; Renzulli, R.; Aanensen, N.; Carrolla, S.; Bickelhaupt, E.; Lazovatsky, Y.; DaSilva, A.; Zhong, J.; Stanyon, C. A.; Finley, R. L., Jr.; White, K. P.; Braverman, M.; Jarvie, T.; Gold, S.; Leach, M.;
Page 28 of 39
ACS Paragon Plus Environment
Journal of Proteome Research
123456789101112131415161718192021222324252627282930313233343536373839404142434445464748495051525354555657585960
29
Knight, J.; Shimkets, R. A.; McKenna, M. P.; Chant, J.; Rothberg, J. M., A protein interaction map of Drosophila melanogaster. Science 2003, 302, (5651), 1727-36. 38. Agresti, A., A Survey of Exact Inference for Contingency Tables. Statistical Science 1992, 7, 131-153. 39. Liu, H.; Sadygov, R. G.; Yates, J. R., 3rd, A model for random sampling and estimation of relative protein abundance in shotgun proteomics. Anal Chem 2004, 76, (14), 4193-201. 40. Paoletti, A. C.; Parmely, T. J.; Tomomori-Sato, C.; Sato, S.; Zhu, D.; Conaway, R. C.; Conaway, J. W.; Florens, L.; Washburn, M. P., Quantitative proteomic analysis of distinct mammalian Mediator complexes using normalized spectral abundance factors. Proc Natl Acad Sci U S A 2006, 103, (50), 18928-33. 41. Ross, J., mRNA stability in mammalian cells. Microbiol Rev 1995, 59, (3), 423-50. 42. Greenbaum, D.; Colangelo, C.; Williams, K.; Gerstein, M., Comparing protein abundance and mRNA expression levels on a genomic scale. Genome Biol 2003, 4, (9), 117. 43. Björck, A., Numerical Methods for least squares problems. SIAM: 1996. 44. Kiemer, L.; Bendtsen, J. D.; Blom, N., NetAcet: prediction of N-terminal acetylation sites. Bioinformatics 2005, 21, (7), 1269-70. 45. Nolan, R. P.; Lee, K., Dynamic model of CHO cell metabolism. Metab Eng 2011, 13, (1), 108-24. 46. Meleady, P.; Doolan, P.; Henry, M.; Barron, N.; Keenan, J.; O'Sullivan, F.; Clarke, C.; Gammell, P.; Melville, M. W.; Leonard, M.; Clynes, M., Sustained productivity in recombinant Chinese Hamster Ovary (CHO) cell lines: proteome analysis of the molecular basis for a process-related phenotype. BMC Biotechnol 2011, 11, 78. 47. Krawitz, D. C.; Forrest, W.; Moreno, G. T.; Kittleson, J.; Champion, K. M., Proteomic studies support the use of multi-product immunoassays to monitor host cell protein impurities. Proteomics 2006, 6, (1), 94-110. 48. Ahram, M.; Strittmatter, E. F.; Monroe, M. E.; Adkins, J. N.; Hunter, J. C.; Miller, J. H.; Springer, D. L., Identification of shed proteins from Chinese hamster ovary cells: application of statistical confidence using human and mouse protein databases. Proteomics 2005, 5, (7), 1815-26. 49. Carlage, T.; Hincapie, M.; Zang, L.; Lyubarskaya, Y.; Madden, H.; Mhatre, R.; Hancock, W. S., Proteomic profiling of a high-producing Chinese hamster ovary cell culture. Anal Chem 2009, 81, (17), 7357-62. 50. Zhang, H.; Li, X. J.; Martin, D. B.; Aebersold, R., Identification and quantification of N-linked glycoproteins using hydrazide chemistry, stable isotope labeling and mass spectrometry. Nat Biotechnol 2003, 21, (6), 660-6. 51. Levine, B. J.; Chodchoy, N.; Marzluff, W. F.; Skoultchi, A. I., Coupling of replication type histone mRNA levels to DNA synthesis requires the stem-loop sequence at the 3' end of the mRNA. Proc Natl Acad Sci U S A 1987, 84, (17), 6189-93. 52. Casey, J. L.; Koeller, D. M.; Ramin, V. C.; Klausner, R. D.; Harford, J. B., Iron regulation of transferrin receptor mRNA levels requires iron-responsive elements and a rapid turnover determinant in the 3' untranslated region of the mRNA. EMBO J 1989, 8, (12), 3693-9. 53. Scheper, W.; Meinsma, D.; Holthuizen, P. E.; Sussenbach, J. S., Long-range RNA interaction of two sequence elements required for endonucleolytic cleavage of human insulin-like growth factor II mRNAs. Mol Cell Biol 1995, 15, (1), 235-45. 54. Bernstein, P.; Peltz, S. W.; Ross, J., The poly(A)-poly(A)-binding protein complex is a major determinant of mRNA stability in vitro. Mol Cell Biol 1989, 9, (2), 659-70.
Page 29 of 39
ACS Paragon Plus Environment
Journal of Proteome Research
123456789101112131415161718192021222324252627282930313233343536373839404142434445464748495051525354555657585960
30
55. Caput, D.; Beutler, B.; Hartog, K.; Thayer, R.; Brown-Shimer, S.; Cerami, A., Identification of a common nucleotide sequence in the 3'-untranslated region of mRNA molecules specifying inflammatory mediators. Proc Natl Acad Sci U S A 1986, 83, (6), 1670-4. 56. Hargrove, J. L.; Schmidt, F. H., The role of mRNA and protein stability in gene expression. FASEB J 1989, 3, (12), 2360-70. 57. Anderson, L.; Seilhamer, J., A comparison of selected mRNA and protein abundances in human liver. Electrophoresis 1997, 18, (3-4), 533-7. 58. Lichtinghagen, R.; Musholt, P. B.; Lein, M.; Romer, A.; Rudolph, B.; Kristiansen, G.; Hauptmann, S.; Schnorr, D.; Loening, S. A.; Jung, K., Different mRNA and protein expression of matrix metalloproteinases 2 and 9 and tissue inhibitor of metalloproteinases 1 in benign and malignant prostate tissue. Eur Urol 2002, 42, (4), 398-406. 59. Lavner, Y.; Kotlar, D., Codon bias as a factor in regulating expression via translation rate in the human genome. Gene 2005, 345, (1), 127-38. 60. Carlini, D. B., Context-dependent codon bias and messenger RNA longevity in the yeast transcriptome. Mol Biol Evol 2005, 22, (6), 1403-11. 61. Figueroa, B., Jr.; Sauerwald, T. M.; Mastrangelo, A. J.; Hardwick, J. M.; Betenbaugh, M. J., Comparison of Bcl-2 to a Bcl-2 deletion mutant for mammalian cells exposed to culture insults. Biotechnol Bioeng 2001, 73, (3), 211-22. 62. Figueroa, B., Jr.; Chen, S.; Oyler, G. A.; Hardwick, J. M.; Betenbaugh, M. J., Aven and Bcl-xL enhance protection against apoptosis for mammalian cells exposed to various culture conditions. Biotechnol Bioeng 2004, 85, (6), 589-600. 63. Figueroa, B., Jr.; Sauerwald, T. M.; Oyler, G. A.; Hardwick, J. M.; Betenbaugh, M. J., A comparison of the properties of a Bcl-xL variant to the wild-type anti-apoptosis inhibitor in mammalian cell cultures. Metab Eng 2003, 5, (4), 230-45.
Page 30 of 39
ACS Paragon Plus Environment
Journal of Proteome Research
123456789101112131415161718192021222324252627282930313233343536373839404142434445464748495051525354555657585960
31
Figure Legends
Figure 1. Flow diagram of the CHO proteome sample preparation and analysis. Spent media and
cells were separated followed by cell lysis. Proteins were extracted from both sources and
subjected to gel separation and in gel proteolysis (lysates) or in-solution digestion and bRPLC
separation (lysates and secretome). These fractions were then subjected to LC/MS/MS and
bioinformatics analysis. The glycosylated peptides were also analyzed by using SPEG coupled
LC/MS/MS analysis.
Figure 2. Number of peptides identified for each protein.
Figure 3. Percentage of identified CHO protein with greatest genetic sequence homology to
Mouse, Rat, Human, None (do not have any homology) and other Mammalian such as Sheep,
Orangutan or Bovine.
Figure 4. Codon frequency for CHO cells. The ratio of codon frequency in CHO cells to humans
is indicated by the color of the codon boxes using the heat map scale.
Figure 5. Significantly enriched functional groups of a) proteome, and b) glycoproteome.
Identified proteins both in proteome and glycoproteome were functionally annotated with GO-
slim terms and statistically enriched GO functions were categorized into 17 main groups.
Figure 6. A) mRNA and protein intensities for each identified protein. The normalized mRNA
values, FPKM values versus normalized protein values NSAF values are plotted to figure out the
significantly unstable and stable proteins.
Figure 7. Detailed mapping of A) Protein processing in endoplasmic reticulum B) Apoptosis
pathways (Yellow: Genome, Red: mRNA and Protein, Orange : mRNA, Green: Protein).
Page 31 of 39
ACS Paragon Plus Environment
Journal of Proteome Research
123456789101112131415161718192021222324252627282930313233343536373839404142434445464748495051525354555657585960
32
Figure 1
Page 32 of 39
ACS Paragon Plus Environment
Journal of Proteome Research
123456789101112131415161718192021222324252627282930313233343536373839404142434445464748495051525354555657585960
33
Figure 2
Page 33 of 39
ACS Paragon Plus Environment
Journal of Proteome Research
123456789101112131415161718192021222324252627282930313233343536373839404142434445464748495051525354555657585960
34
Figure 3
Figure 4
Page 34 of 39
ACS Paragon Plus Environment
Journal of Proteome Research
123456789101112131415161718192021222324252627282930313233343536373839404142434445464748495051525354555657585960
35
Figure 5
.
Page 35 of 39
ACS Paragon Plus Environment
Journal of Proteome Research
123456789101112131415161718192021222324252627282930313233343536373839404142434445464748495051525354555657585960

36
Figure 6
Page 36 of 39
ACS Paragon Plus Environment
Journal of Proteome Research
123456789101112131415161718192021222324252627282930313233343536373839404142434445464748495051525354555657585960
37
Figure 7
Page 37 of 39
ACS Paragon Plus Environment
Journal of Proteome Research
123456789101112131415161718192021222324252627282930313233343536373839404142434445464748495051525354555657585960
38
List of Supplementary Tables
Supplementary Table 1: Identified proteins with their accession IDs, descriptive names, swiss-
prot, GO and KEGG pathway annotations, FDR values, number of identified peptides, number of
spectra belonging to the identified protein, coverage of the protein, cluster and group ID. Cluster
and group IDs provide to find the protein of interest in the raw data deposited to Tranche.
Supplementary Table 2: Listing of glycosylated proteins together with their accession IDs and
descriptive names.
Supplementary Table 3: GO analysis of all proteins and GO analysis of glycosylated proteins
together with the proteins list according to their GO annotation terms.
Supplementary Table 4: Identified proteins with their descriptive names and their FPKM
values.
Supplementary Table 5: Proteins specified as unstable and stable according to correlation
between mRNA and protein intensities. The protein accession IDs together with their descriptive
names and their SAF, NSAF and FPKM values are listed. A table showing the unstable and
stable proteins is also included.
Supplementary Table 6: Listing of N-acetylated proteins and specific N-acetylation sites on
these specific proteins.
Page 38 of 39
ACS Paragon Plus Environment
Journal of Proteome Research
123456789101112131415161718192021222324252627282930313233343536373839404142434445464748495051525354555657585960
39
Graphic for Abstract
.
Page 39 of 39
ACS Paragon Plus Environment
Journal of Proteome Research
123456789101112131415161718192021222324252627282930313233343536373839404142434445464748495051525354555657585960


![[Product Monograph Template - Standard] - Roche Canada … · December 24, 1993 Manufactured by: Date of Revision: March 12, 2015 ... dornase alfa, Chinese Hamster Ovary cell products](https://img.pdfslide.us/doc/110x75/5c042b7609d3f24d258b4a47/product-monograph-template-standard-roche-canada-december-24-1993-manufactured.jpg)