Embed Size (px)
Citation preview
Protein structure validation by generalizedlinear model root-mean-square deviationprediction
Anurag Bagaria,1 Victor Jaravine,1 Yuanpeng J. Huang,2
Gaetano T. Montelione,2 and Peter Guntert1,3*
1Institute of Biophysical Chemistry, Center for Biomolecular Magnetic Resonance, and Frankfurt Institute of Advanced Studies,Goethe University Frankfurt, 60438 Frankfurt am Main, Germany2Department of Molecular Biology and Biochemistry, Center for Advanced Biotechnology and Medicine,and Northeast Structural Genomics Consortium, Rutgers University, and Robert Wood Johnson Medical School,Piscataway, New Jersey 088543Graduate School of Science and Technology, Tokyo Metropolitan University, Hachioji, Tokyo 192-0397, Japan
Received 19 October 2011; Revised 17 November 2011; Accepted 19 November 2011
DOI: 10.1002/pro.2007Published online 23 November 2011 proteinscience.org
Abstract: Large-scale initiatives for obtaining spatial protein structures by experimental or
computational means have accentuated the need for the critical assessment of protein structuredetermination and prediction methods. These include blind test projects such as the critical
assessment of protein structure prediction (CASP) and the critical assessment of protein structure
determination by nuclear magnetic resonance (CASD-NMR). An important aim is to establishstructure validation criteria that can reliably assess the accuracy of a new protein structure.
Various quality measures derived from the coordinates have been proposed. A universal structural
quality assessment method should combine multiple individual scores in a meaningful way, whichis challenging because of their different measurement units. Here, we present a method based on
a generalized linear model (GLM) that combines diverse protein structure quality scores into a
single quantity with intuitive meaning, namely the predicted coordinate root-mean-square deviation(RMSD) value between the present structure and the (unavailable) ‘‘true’’ structure (GLM-RMSD).
For two sets of structural models from the CASD-NMR and CASP projects, this GLM-RMSD value
was compared with the actual accuracy given by the RMSD value to the corresponding,experimentally determined reference structure from the Protein Data Bank (PDB). The correlation
coefficients between actual (model vs. reference from PDB) and predicted (model vs. ‘‘true’’)
heavy-atom RMSDs were 0.69 and 0.76, for the two datasets from CASD-NMR and CASP,respectively, which is considerably higher than those for the individual scores (20.24 to 0.68).
The GLM-RMSD can thus predict the accuracy of protein structures more reliably than individual
coordinate-based quality scores.
Keywords: NMR; protein structure validation; CASD-NMR; CASP; structure quality; Gaussian
network model; RMSD; GLM-RMSD
Abbreviations: CASD-NMR, critical assessment of protein structure determination by NMR; CASP, critical assessment of proteinstructure prediction; GNM, Gaussian network model; GLM, generalized linear model; MLR, multiple linear regression; NMR, nuclearmagnetic resonance; PDB, Protein Data Bank; RMSD, root-mean-square deviation.
Additional Supporting Information may be found in the online version of this article.
Grant sponsors: Volkswagen Foundation; Deutsche Forschungsgemeinschaft; Grant number: DFG grant JA1952/1-1 (to V.J. and P.G.);Grant sponsors: e-NMR and WeNMR projects of the European Commission and Japan Society for the Promotion of Science (JSPS);National Institutes of Health Protein Structure Initiative; Grant number: U54 GM094597 (to G.T.M.).
*Correspondence to: Peter Guntert, Institute of Biophysical Chemistry, Goethe University Frankfurt, Max-von-Laue-Str. 9, 60438Frankfurt am Main, Germany. E-mail: [email protected]
Published by Wiley-Blackwell. VC 2011 The Protein Society PROTEIN SCIENCE 2012 VOL 21:229—238 229
IntroductionObtaining three-dimensional structures of proteins
is a priority for the biological research community
since several decades. Accurate protein structures
are crucial, for example, for drug design or screening
applications. Protein structures can be obtained by
experimental techniques such as X-ray crystallogra-
phy and nuclear magnetic resonance (NMR) spec-
troscopy, or predicted by computational methods
such as homology modeling, threading, fold recogni-
tion, molecular dynamics simulation, and so forth.1
Generally, the accuracy of a structural model deter-
mines the range of its potential applications. For
example, it would be nearly meaningless to use a
protein structure for structure-based drug design if
we are unsure about the quality of the target protein
model. Many measures have been proposed for the
assessment of structural quality,2 including torsion
angle distributions, steric clashes, three-dimensional
profiles, residue environments, fold prediction, eval-
uations of experimental restraints, and so forth,
which have been implemented in popular structure
validation software packages including Procheck,3
Molprobity,4 WHAT IF,5 Verify3D,6 ProsaII,7 Protein
Structure Validation Software suite (PSVS),8 and so
forth. There have been discussions as to why an
individual assessment score should directly correlate
with a coordinate accuracy metric,9 as well as
attempts to obtain composite quality assessment
scores.10–12 These methods can address global and/or
local accuracy13 and can express these in terms of
root-mean-square deviation (RMSD) values.14 Alter-
natively, a model-specific scoring function can be
constructed by a support vector machine.15
Structural genomics projects aim at experimen-
tally determining three-dimensional structures of
representative members of as many different fold
families as possible, whereas comparative modeling
tries to complement this by providing structural
models of homologues of the representative proteins.
However, for successful predictions it is essential that
the quality of the experimentally determined struc-
tures is adequate. Evaluating NMR protein structure
determination methods is the aim of the critical
assessment project critical assessment of protein
structure determination by nuclear magnetic reso-
nance (CASD-NMR) for NMR solution structures.16 A
similar, large-scale project for the critical assessment
of structure prediction is CASP.17 Evaluating the
quality of NMR structures has always been a
challenging task, and several erroneous structures
were found.18,19 These investigations have shown the
difficulty to evaluate reliably the accuracy of NMR
structures using only traditional quality indicators
based on coordinates or conformational restraint data
and highlighted the need for a tight integration of
more sophisticated structure validation tools in NMR
structure determination projects.
Results
Here, we present the generalized linear model-RMSD
(GLM-RMSD) method to evaluate the quality of pro-
tein models by predicting their RMSDs relative to the
native structure. Originally a simple multiple linear
regression (MLR) method was tested, using several
quality scores2,3,5,6,19 provided by the PSVS server.7
After performing a statistical model selection and sig-
nificance study (as described in ‘‘Model Selection sec-
tion’’) on the initially included scores, a GLM-RMSD
using only four out of the initial eight scores was
found to perform better. We applied the GLM-RMSD
method to two sets of protein structure models from
the CASD-NMR and CASP8 projects, respectively.
The resulting GLM-RMSD values were correlated
with the actual accuracy of the protein structure mod-
els in terms of the RMSD of the coordinates between
the model and the corresponding reference structure
from the Protein Data Bank (PDB).
MLR predicted RMSD
MLR is a multivariate statistical technique for
examining the linear correlations between two or
more independent variables and a single dependent
variable. Here, we consider a linear model by which
the predicted RMSD values yLMi (LM-RMSD)
between the i-th model structure from the training
set and the corresponding native protein structure
depend linearly on m (normalized) validation scores
(xi1, . . ., xim)
yLMi ¼Xmj¼1
bjxij þ a
for proteins i ¼ 1, . . ., n. The LM-RMSD thus repre-
sents an approximation of the (known) accuracy of
the model structure. The value of the j-th validation
score for the model structure i is denoted by xij.
Each score describes a particular aspect of structure
quality. The constants a and bj are determined by a
linear least-squares fit to the actual RMSDi values
from a training set of n known structures that mini-
mizes the v2 value
v2 ¼Xni¼1
RMSDi �Xmj¼1
bjxij þ a
!2
Generalized linear modelA GLM20 is a generalization of the above model,
where the values yGLMi are assumed to belong to a
distribution from the exponential family with a
mean l > 0 and E(yGLMi ) ¼ l. In our case the gamma
distribution is chosen from the family as it is non-
negative (like the RMSD values) and showed the
closest similarity in shape to the histogram of the
RMSDi values. The validity of this assumption was
evaluated by fitting a gamma distribution to the
230 PROTEINSCIENCE.ORG Protein Structure Validation by GLM-RMSD
histograms of RMSD values from the CASD-NMR,
CASP, and Combined datasets by maximum likeli-
hood fitting using the function fitdist() from the R
software environment for statistical computing
(http://www.r-project.org/) package ‘‘fitdistrplus’’
(Supporting Information Fig. S1). A low Kolmo-
gorov–Smirnov statistic value �0.1 in all three cases
quantified the good correspondence between the em-
pirical distribution function of the sample and the
fitted gamma distribution. It is again assumed that
the dependent variables yi depend linearly on the
scores. In addition, a GLM comprises a ‘‘link func-
tion’’ g than connects the linear predictor to the
quantity predicted:
yGLMi ¼ g
Xmj¼1
bjxij þ a
!
We chose the link function g of the GLM model
as the identity operator g(x) ¼ xþ1. The vector of
regression coefficients bj is determined by the func-
tion glm() of the R package, which uses maximum
likelihood estimation by the Fisher-scoring method
or iterative reweighted least squares.
Data sets and validation scores
Two structural datasets were used. The first one
consisted of 65 NMR protein structure bundles
obtained from the CASD-NMR project.16 They are
the results of NMR structure calculations for 16 sin-
gle-domain proteins (65 structures) with 50–172
amino acid residues using different methods and
programs. The second data set comprised 85 protein
structures (all 85 unique sequences) selected from
the CASP8 results as described in ‘‘Methods section.’’
Eight validation scores were calculated for each
of these structures: (i) the Discrimination Power
(DP) score that estimates the ability of NOESY data
to distinguish the structure from a freely rotating
chain.22 (ii) The Verify3D score based on 3D–1D-pro-
files.6,23 (iii) The ProsaII score based on the data-
base-derived probability for two residues to be at a
specific distance from each other.7 (iv) The Procheck-
u/w score (P-u/w) that takes into account the number
of residues in different regions of the Ramachandran
plot.3 (v) The Procheck-All score (P-All) that takes
into account unusual features of the local conforma-
tion.3 (vi) The Molprobity score (MolProb) combining
Ramachandran plot analysis, rotamer analysis, and
all-atom clash analysis.24 (vii) The Gaussian net-
work model (GNM) score obtained by a minimalist,
coarse-grained approach to estimate the average
coordinate fluctuation. GNM scores were reported to
be correlated to protein stability (DG) and to the
RMSD itself.25,26 (viii) The protein size given by the
number of residues (Size), which was included
because NMR structures of larger proteins tend to
have higher RMSD values.27 In addition, we calcu-
lated for each model the heavy-atom RMSD to the
corresponding experimentally determined native
structure in the PDB. We refer to this measure of
true accuracy (provided that the reference structures
are correct) as the RMSD bias.
The resulting 65 � 8 and 85 � 8 matrices of
validation score values xij and the RMSD bias values
yi constituted the basis for this study (Supporting
Information Tables S1 and S2). The mean values
and standard deviations of the quality scores are
given in Table I.
Cross-correlations between individual
validation scores
The individual quality measures contribute by
varying degrees to the predicted RMSD value. The
complementary behavior of different scores was
investigated by calculating the correlation coefficient
between the quality scores and the RMSD and the
cross-correlation coefficients among the quality
scores (Table II). The first column of Table II shows
the correlation with the RMSD bias. Other columns
show cross-correlations among the scores that indi-
cate the degree of complementarity among the
scores. Some scores correlate highly with each other
in both data sets, for example Procheck-//w and Pro-
check-All, and, in particular, Verify3D and ProsaII.
The latter are highly correlated with each other but
show little correlation with the RMSD bias.
Multilinear correlations and jackknifing
For each dataset of n structures the MLR analysis
was performed n times by removing one row at a
time and performing the regression analysis to
determine the constants a and bj on the remaining
n � 1 rows. This ensured that the prediction for a
given model did not include its actual RMSD. Thus,
for each of the datasets, N sets of weights were
obtained and averaged. The sets of average weights
and their standard deviations obtained after this
jackknifing procedure are given in Table III and
were used to compute the LM-RMSD values for the
two dataset separately and in combination.
Table I. Mean Values (Standard Deviation) of the (Unnormalized) Quality Scores
DatasetSequences/structures DP Verify3D ProsaII P-u/w P-All MolProb GNM Size
CASD-NMR 16/65 0.75 (0.09) �1.42 (2.07) �2.58 (3.06) �1.84 (1.18) �0.62 (0.97) �3.55 (8.18) 0.81 (0.03) 106.15 (29.71)
CASP 85/85 0.39 (0.09) 0.74 (1.33) 0.50 (1.27) �2.19 (1.47) �1.11 (1.12) �18.77 (5.43) 0.51 (0.06) 133.75 (56.77)
Combined 101/150 0.55 (0.20) �0.20 (2.00) �0.83 (2.70) �2.04 (1.37) �0.90 (1.08) �12.17 (10.13) 0.64 (0.16) 121.79 (48.95)
Bagaria et al. PROTEIN SCIENCE VOL 21:229—238 231
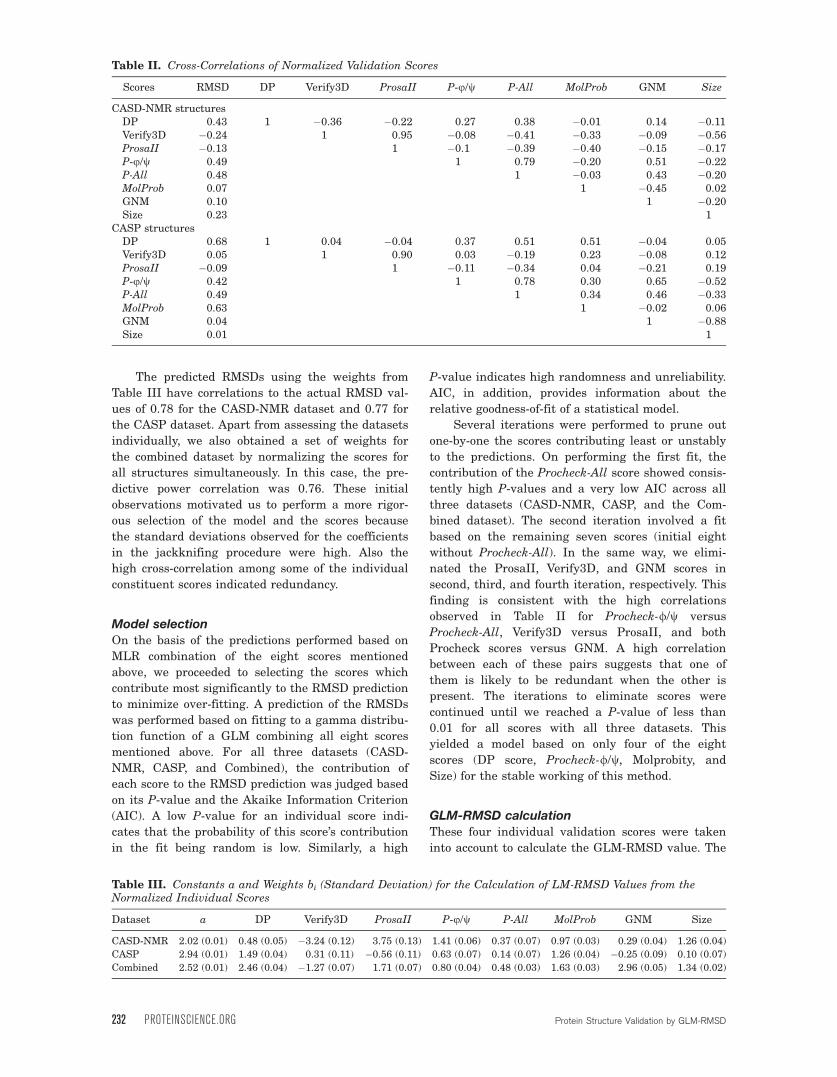
The predicted RMSDs using the weights from
Table III have correlations to the actual RMSD val-
ues of 0.78 for the CASD-NMR dataset and 0.77 for
the CASP dataset. Apart from assessing the datasets
individually, we also obtained a set of weights for
the combined dataset by normalizing the scores for
all structures simultaneously. In this case, the pre-
dictive power correlation was 0.76. These initial
observations motivated us to perform a more rigor-
ous selection of the model and the scores because
the standard deviations observed for the coefficients
in the jackknifing procedure were high. Also the
high cross-correlation among some of the individual
constituent scores indicated redundancy.
Model selectionOn the basis of the predictions performed based on
MLR combination of the eight scores mentioned
above, we proceeded to selecting the scores which
contribute most significantly to the RMSD prediction
to minimize over-fitting. A prediction of the RMSDs
was performed based on fitting to a gamma distribu-
tion function of a GLM combining all eight scores
mentioned above. For all three datasets (CASD-
NMR, CASP, and Combined), the contribution of
each score to the RMSD prediction was judged based
on its P-value and the Akaike Information Criterion
(AIC). A low P-value for an individual score indi-
cates that the probability of this score’s contribution
in the fit being random is low. Similarly, a high
P-value indicates high randomness and unreliability.
AIC, in addition, provides information about the
relative goodness-of-fit of a statistical model.
Several iterations were performed to prune out
one-by-one the scores contributing least or unstably
to the predictions. On performing the first fit, the
contribution of the Procheck-All score showed consis-
tently high P-values and a very low AIC across all
three datasets (CASD-NMR, CASP, and the Com-
bined dataset). The second iteration involved a fit
based on the remaining seven scores (initial eight
without Procheck-All). In the same way, we elimi-
nated the ProsaII, Verify3D, and GNM scores in
second, third, and fourth iteration, respectively. This
finding is consistent with the high correlations
observed in Table II for Procheck-//w versus
Procheck-All, Verify3D versus ProsaII, and both
Procheck scores versus GNM. A high correlation
between each of these pairs suggests that one of
them is likely to be redundant when the other is
present. The iterations to eliminate scores were
continued until we reached a P-value of less than
0.01 for all scores with all three datasets. This
yielded a model based on only four of the eight
scores (DP score, Procheck-//w, Molprobity, and
Size) for the stable working of this method.
GLM-RMSD calculationThese four individual validation scores were taken
into account to calculate the GLM-RMSD value. The
Table II. Cross-Correlations of Normalized Validation Scores
Scores RMSD DP Verify3D ProsaII P-u/w P-All MolProb GNM Size
CASD-NMR structuresDP 0.43 1 �0.36 �0.22 0.27 0.38 �0.01 0.14 �0.11Verify3D �0.24 1 0.95 �0.08 �0.41 �0.33 �0.09 �0.56ProsaII �0.13 1 �0.1 �0.39 �0.40 �0.15 �0.17P-u/w 0.49 1 0.79 �0.20 0.51 �0.22P-All 0.48 1 �0.03 0.43 �0.20MolProb 0.07 1 �0.45 0.02GNM 0.10 1 �0.20Size 0.23 1
CASP structuresDP 0.68 1 0.04 �0.04 0.37 0.51 0.51 �0.04 0.05Verify3D 0.05 1 0.90 0.03 �0.19 0.23 �0.08 0.12ProsaII �0.09 1 �0.11 �0.34 0.04 �0.21 0.19P-u/w 0.42 1 0.78 0.30 0.65 �0.52P-All 0.49 1 0.34 0.46 �0.33MolProb 0.63 1 �0.02 0.06GNM 0.04 1 �0.88Size 0.01 1
Table III. Constants a and Weights bi (Standard Deviation) for the Calculation of LM-RMSD Values from theNormalized Individual Scores
Dataset a DP Verify3D ProsaII P-u/w P-All MolProb GNM Size
CASD-NMR 2.02 (0.01) 0.48 (0.05) �3.24 (0.12) 3.75 (0.13) 1.41 (0.06) 0.37 (0.07) 0.97 (0.03) 0.29 (0.04) 1.26 (0.04)
CASP 2.94 (0.01) 1.49 (0.04) 0.31 (0.11) �0.56 (0.11) 0.63 (0.07) 0.14 (0.07) 1.26 (0.04) �0.25 (0.09) 0.10 (0.07)
Combined 2.52 (0.01) 2.46 (0.04) �1.27 (0.07) 1.71 (0.07) 0.80 (0.04) 0.48 (0.03) 1.63 (0.03) 2.96 (0.05) 1.34 (0.02)
232 PROTEINSCIENCE.ORG Protein Structure Validation by GLM-RMSD
GLM coefficients were determined for both sets of
structures, separately and combined, and analyzed
by jackknifing (Table IV). GLM-RMSDs are calcu-
lated from the coefficients and the normalized score
values by the same multilinear relationship as for
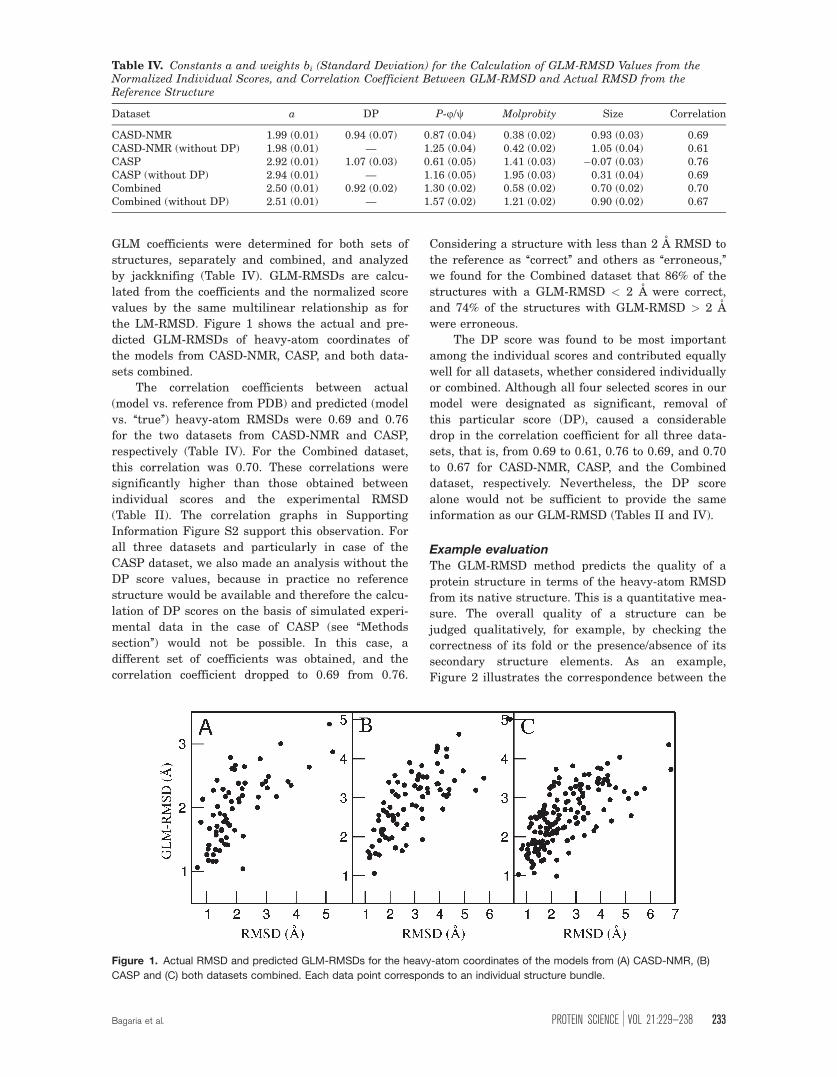
the LM-RMSD. Figure 1 shows the actual and pre-
dicted GLM-RMSDs of heavy-atom coordinates of
the models from CASD-NMR, CASP, and both data-
sets combined.
The correlation coefficients between actual
(model vs. reference from PDB) and predicted (model
vs. ‘‘true’’) heavy-atom RMSDs were 0.69 and 0.76
for the two datasets from CASD-NMR and CASP,
respectively (Table IV). For the Combined dataset,
this correlation was 0.70. These correlations were
significantly higher than those obtained between
individual scores and the experimental RMSD
(Table II). The correlation graphs in Supporting
Information Figure S2 support this observation. For
all three datasets and particularly in case of the
CASP dataset, we also made an analysis without the
DP score values, because in practice no reference
structure would be available and therefore the calcu-
lation of DP scores on the basis of simulated experi-
mental data in the case of CASP (see ‘‘Methods
section’’) would not be possible. In this case, a
different set of coefficients was obtained, and the
correlation coefficient dropped to 0.69 from 0.76.
Considering a structure with less than 2 A RMSD to
the reference as ‘‘correct’’ and others as ‘‘erroneous,’’
we found for the Combined dataset that 86% of the
structures with a GLM-RMSD < 2 A were correct,
and 74% of the structures with GLM-RMSD > 2 A
were erroneous.
The DP score was found to be most important
among the individual scores and contributed equally
well for all datasets, whether considered individually
or combined. Although all four selected scores in our
model were designated as significant, removal of
this particular score (DP), caused a considerable
drop in the correlation coefficient for all three data-
sets, that is, from 0.69 to 0.61, 0.76 to 0.69, and 0.70
to 0.67 for CASD-NMR, CASP, and the Combined
dataset, respectively. Nevertheless, the DP score
alone would not be sufficient to provide the same
information as our GLM-RMSD (Tables II and IV).
Example evaluationThe GLM-RMSD method predicts the quality of a
protein structure in terms of the heavy-atom RMSD
from its native structure. This is a quantitative mea-
sure. The overall quality of a structure can be
judged qualitatively, for example, by checking the
correctness of its fold or the presence/absence of its
secondary structure elements. As an example,
Figure 2 illustrates the correspondence between the
Table IV. Constants a and weights bi (Standard Deviation) for the Calculation of GLM-RMSD Values from theNormalized Individual Scores, and Correlation Coefficient Between GLM-RMSD and Actual RMSD from theReference Structure
Dataset a DP P-u/w Molprobity Size Correlation
CASD-NMR 1.99 (0.01) 0.94 (0.07) 0.87 (0.04) 0.38 (0.02) 0.93 (0.03) 0.69CASD-NMR (without DP) 1.98 (0.01) — 1.25 (0.04) 0.42 (0.02) 1.05 (0.04) 0.61CASP 2.92 (0.01) 1.07 (0.03) 0.61 (0.05) 1.41 (0.03) �0.07 (0.03) 0.76CASP (without DP) 2.94 (0.01) — 1.16 (0.05) 1.95 (0.03) 0.31 (0.04) 0.69Combined 2.50 (0.01) 0.92 (0.02) 1.30 (0.02) 0.58 (0.02) 0.70 (0.02) 0.70Combined (without DP) 2.51 (0.01) — 1.57 (0.02) 1.21 (0.02) 0.90 (0.02) 0.67
Figure 1. Actual RMSD and predicted GLM-RMSDs for the heavy-atom coordinates of the models from (A) CASD-NMR, (B)
CASP and (C) both datasets combined. Each data point corresponds to an individual structure bundle.
Bagaria et al. PROTEIN SCIENCE VOL 21:229—238 233
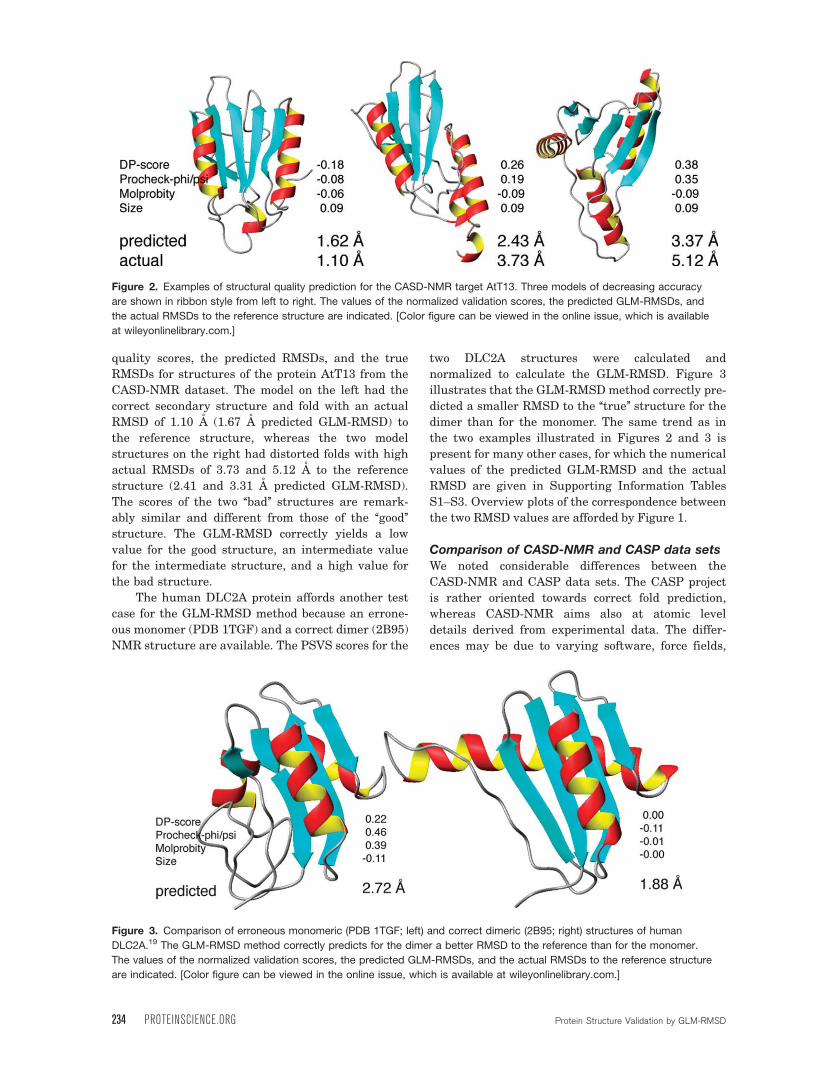
quality scores, the predicted RMSDs, and the true
RMSDs for structures of the protein AtT13 from the
CASD-NMR dataset. The model on the left had the
correct secondary structure and fold with an actual
RMSD of 1.10 A (1.67 A predicted GLM-RMSD) to
the reference structure, whereas the two model
structures on the right had distorted folds with high
actual RMSDs of 3.73 and 5.12 A to the reference
structure (2.41 and 3.31 A predicted GLM-RMSD).
The scores of the two ‘‘bad’’ structures are remark-
ably similar and different from those of the ‘‘good’’
structure. The GLM-RMSD correctly yields a low
value for the good structure, an intermediate value
for the intermediate structure, and a high value for
the bad structure.
The human DLC2A protein affords another test
case for the GLM-RMSD method because an errone-
ous monomer (PDB 1TGF) and a correct dimer (2B95)
NMR structure are available. The PSVS scores for the
two DLC2A structures were calculated and
normalized to calculate the GLM-RMSD. Figure 3
illustrates that the GLM-RMSDmethod correctly pre-
dicted a smaller RMSD to the ‘‘true’’ structure for the
dimer than for the monomer. The same trend as in
the two examples illustrated in Figures 2 and 3 is
present for many other cases, for which the numerical
values of the predicted GLM-RMSD and the actual
RMSD are given in Supporting Information Tables
S1–S3. Overview plots of the correspondence between
the two RMSD values are afforded by Figure 1.
Comparison of CASD-NMR and CASP data setsWe noted considerable differences between the
CASD-NMR and CASP data sets. The CASP project
is rather oriented towards correct fold prediction,
whereas CASD-NMR aims also at atomic level
details derived from experimental data. The differ-
ences may be due to varying software, force fields,
Figure 2. Examples of structural quality prediction for the CASD-NMR target AtT13. Three models of decreasing accuracy
are shown in ribbon style from left to right. The values of the normalized validation scores, the predicted GLM-RMSDs, and
the actual RMSDs to the reference structure are indicated. [Color figure can be viewed in the online issue, which is available
at wileyonlinelibrary.com.]
Figure 3. Comparison of erroneous monomeric (PDB 1TGF; left) and correct dimeric (2B95; right) structures of human
DLC2A.19 The GLM-RMSD method correctly predicts for the dimer a better RMSD to the reference than for the monomer.
The values of the normalized validation scores, the predicted GLM-RMSDs, and the actual RMSDs to the reference structure
are indicated. [Color figure can be viewed in the online issue, which is available at wileyonlinelibrary.com.]
234 PROTEINSCIENCE.ORG Protein Structure Validation by GLM-RMSD
or simulation protocols (with or without explicit sol-
vent, etc.), and could also be due to differences in
protein structures measured experimentally in
liquids (fluctuating ensemble) or crystals (tight pack-
ing).28 The differences are apparent from the score
values of both datasets, especially for the Molprobity
and GNM score values. In general, a higher value of
the GNM score for the CASD-NMR dataset indicates
a higher degree of fluctuation of the atomic coordi-
nates. The difference is also apparent in the DP
scores (Table I). The DP scores for the CASP struc-
tures were calculated based on simulated NOEs (see
‘‘Methods section’’), and exhibited lower values than
the DP scores for CASD-NMR calculated from the
experimental NMR data. This behavior was previ-
ously noted in the distribution graphs of PSVS
Z-scores of X-ray and NMR protein datasets,8 where
it was also argued that NMR structures have on
average lower quality scores because of different
conformational preferences in crystalline and solu-
tion environments. The difference in the scores may
in part be attributable to protein dynamics in solu-
tion, as well as to differences in the mathematical
treatment of experimental results for the two meth-
ods.28 These observations may explain differences
between the set of weights obtained for the CASD-
NMR and CASP datasets by the simple LM-RMSD
method (Table III). These differences are strongly
reduced for the GLM-RMSD model (Table IV), as
expected. Notably, the protein size is a significant
parameter for the CASD-NMR data set but not for
CASP. This may reflect the fact that larger protein
structures are more difficult to solve by NMR, espe-
cially by the chemical shift-based methods29,30 that
were included in CASD-NMR.
Discussion
Most structure validation methods aim at evaluating
structural quality objectively and are designed to be
applicable to any (folded) protein structure. How-
ever, in practice a bias is often unavoidable and less
general validation methods that are adapted to par-
ticular types of structures can be powerful. For
example, for structures obtained using NMR, it is
important to evaluate how well they fit to the exper-
imental data.22 Nonetheless, many structural
aspects used in validations are general and can be
analyzed both for predicted and experimental struc-
tures: core packing, stereochemistry, bond lengths,
steric clashes, and so forth. Obviously, to have effec-
tive predictions it is necessary but not sufficient to
have good scores for packing, stereochemistry, and
so forth. Thus, it is logical to use many scores, espe-
cially those having noticeable correlation with struc-
tural accuracy. Ideally, these parameters would
cover all complementary aspects of structural qual-
ity. The optimal combination of such scores was our
aim in this study.
A typical study of this kind might lead into
results which are prone to an over-fit. This was a
major concern in the case of CASD-NMR dataset.
However, here, the protein folds are very different
across the targets and it would be difficult to fit them
to one common parameter. Further, inclusion of jack-
knifing (leave one out, train on the rest and test on
the one excluded) considerably reduces the possibility
of an over-fit. We admit that the presence of an over-
fit cannot be excluded completely and because we
introduce this work as a proof of concept, the model
would get better as more datasets are made available.
When compared with the structure validation
methods reviewed in ‘‘Introduction section’’, the
GLM-RMSD method provides a quality assessment
in terms of the RMSD, which makes it easier to com-
prehend how good or bad a model actually is than
by interpreting individual scores of varying magni-
tude and signs. Additionally, we used a quality mea-
sure that accounts for the agreement with experi-
mental data (DP score) which is clearly useful for
NMR models. We also attempted to use this score
for the predicted models for a more meaningful com-
parison of the two datasets and their combination.
For much less than 1% of the millions of known
protein sequences has the corresponding structure
been solved experimentally. Thus, it is easy to
understand the need to fill the void at least with
predicted models. Predicting accurate protein struc-
tures is a challenging task. Approaches have been
improving over time and so are the methods for vali-
dating these predictions.18,19 Due to the enormity of
the conformational space search problem, prediction
methods often suffer from insufficient data for sta-
tistical parameter estimation. Our method, too, has
a scope of improvement by inclusion of more diverse
protein structure datasets and by adding new qual-
ity scores that are complementary and cover better
all aspects of protein structure quality. Here, we
used the RMSD of a model from its native structure
as the accuracy measure because the RMSD contin-
ues to be the most basic and widely used criterion to
assess protein structure quality when comparing to
a known ‘‘correct’’ structure.
Our method is not limited to the quality assess-
ment of protein structures. It may, in principle, also
be applied as a structure selection filter in protein
structure modeling. For example, the approach could
support CS-Rosetta,30,31 a structure calculation tool
based on NMR chemical shift data, to filter out
potentially wrong structure leads at early stages
and thereby reduce its large computational time
requirements. Good success has been reported using
the DP score to direct a CS-Rosetta trajectory,32 and
this performance could potentially be improved
using the GLM-RMSD measure.
The accurate selection of homologues is crucial
for the template-based modeling of protein structures.
Bagaria et al. PROTEIN SCIENCE VOL 21:229—238 235
Many homology-modeling applications rely on fold
prediction. Estimating the accuracy of homology
based models directly from the sequence alignment
has been attempted using multivariate regression
using only primary structure information.9,33 Experi-
mental information has been used to generate tem-
plate protein structures for homology modeling of pro-
teins.34 Our method could be used as an alternative to
evaluate and rank the accuracy and quality of homol-
ogy models.
Materials and Methods
Preparation of the CASD-NMR and CASP
datasets
The CASD-NMR dataset consisted of structures for
16 different single-domain proteins targets (http://
www.wenmr.eu/wenmr/casd-nmr). Ten of the 16
experimental NMR data sets were provided by the
Northeast Structural Genomics consortium (www.
nesg.org), which also determined the reference struc-
tures. For each target protein structures were calcu-
lated separately by different NMR research groups in
a ‘‘blind test,’’ meaning that the ‘‘correct’’ structure
was released by the PDB only after the models were
computed. The remaining six experimental NMR
data sets were provided by various groups as ‘‘non-
blind’’ data sets.16 The CASD-NMR data set com-
prised a total of 65 protein NMR structure bundles
for the 16 proteins. Each bundle comprised 10–30
conformers (Supporting Information Table S1).
Similarly, in the CASP project, participating
groups performed a ‘‘blind’’ prediction of the tertiary
structure of target proteins whose experimentally
determined structures were released after the predic-
tions were completed. The CASP dataset used in this
study consists of proteins ranging from 45 to 275
amino acid residues. We selected only those proteins
for which a minimum of 50 models had atom types
and numbers consistent with its respective target
structure. The 20 model structures with the lowest
RMSD to the target structure were selected to form a
structure bundle, similar to an NMR structure bun-
dle. Models with more than 10 A RMSD to the refer-
ence structure were excluded. This cutoff was intro-
duced because the PSVS server (see below) required a
minimal amount of ordered residues for proper opera-
tion. Excluding models with residue type or number
mismatch errors and several other coordinate file
parsing inconsistencies reduced the CASP dataset to
85 protein structure bundles, each with a unique
sequence (Supporting Information Table S2).
Heavy-atom RMSD to the target structure
The RMSDs to the reference structure were calcu-
lated with CYANA between the heavy-atom coordi-
nates of the mean structure of the model bundle and
the respective reference structure deposited in the
PDB. The ranges of well-structured residues for the
RMSD calculations were determined from the
ensemble of coordinates with the CYRANGE algo-
rithm35 for the CASD-NMR structures. For the
CASP dataset, those residues were chosen for the
RMSD calculation for which the B-factor of the Ca
atoms in the target X-ray structure was within three
standard deviations from its mean value.
Calculation of validation scores
The datasets were submitted, protein by protein, to
the PSVS server,8 to obtain the values of each of the
validation scores described below. Residues that are
not well defined in the NMR ensembles are filtered
from these coordinate sets using the dihedral angle
order parameter36, with a cutoff S(/) þ S(w) < 1.8.
The DP score was obtained via the web-services
hosted at the RPF (Recall, Precision, and F-measure)
scores server (http://nmr.cabm.rut gers.edu/rpf/). In-
house software was used to obtain the GNM score.
The size of the protein was determined by counting
the number of residues in the PDB file. Details of
the scores are described in the following.
DP score
The DP score22 estimates the difference in F-mea-
sure scores between the query structure and random
coil structures as an indicator of the correctness of
the overall fold. This is based on a rapid approach to
calculate RPF scores between experimentally deter-
mined unassigned NOESY peak lists and simulated
NOESY peaks lists predicted from the query struc-
ture and experimental resonance assignment lists,
based on true/false negative and true/false positive
metrics. The DP score measures the ability of
NOESY data to distinguish the structure from a
freely rotating chain model by normalizing the data
for its completeness. The experimental data were
available for the CASD-NMR models but not for the
CASP data set. However, it is important for the cali-
bration of our method to have a sufficiently large set
of wrong structures that deviate severely from the
correct native conformation of the protein but no
large set of wrong NMR protein structures with the
corresponding experimental NOESY peak lists was
available. Therefore, we created NOESY data for the
structures in the CASP data set. For each of the
CASP targets, 13C- and 15N-resolved NOESY peak
lists and chemical shift lists were simulated with
CYANA36 on the basis of reference structures using
an interatomic distance cutoff of 4.0 A for the gener-
ation of NOESY cross peaks, and assuming complete
resonance assignments.
Verify3D
Verify3D6,23 is based on 3D–1D-profiles and assigns
an environmental class to each residue in a protein.
The environments are divided into 18 classes based
236 PROTEINSCIENCE.ORG Protein Structure Validation by GLM-RMSD
on the secondary structure, buried area, and the
fraction of polar contacts. Next, the probability for
each amino acid type to be assigned to each type of
environment is calculated. During evaluation of a
model, the sum of probabilities over a window, or
over the entire protein, is calculated. If the probabil-
ity is low, it is likely that the model is incorrect.
ProsaIIThe ProsaII score7 is based on the probability for
two residues to be at a specific distance from each
other. In this the amino acid types, the distance, as
well as the sequence separations are used.
Procheck
The Procheck software3 takes into account the num-
ber of residues in allowed/disallowed areas of Rama-
chandran plot, the number of unusual bond lengths
or bond angles, and so forth. Correlations between
the accuracy of a protein structure and these criteria
were found for experimentally determined struc-
tures. However, these criteria are less useful to eval-
uate theoretically constructed models because nowa-
days many modeling programs are able to build
models with very good stereochemistry even when
the resulting tertiary structure is wrong.
Molprobity
The Molprobity program24 calculates a score based
on a number of validations including all-residue
Ramachandran analysis, rotamer analysis, and all-
atom clash analysis.
Gaussian network model
The GNM25,26 is a minimalist, coarse-grained
approach to study biological macromolecules. The
protein is represented by nodes corresponding to the
a-carbons of the amino acid residues, and the spatial
interactions between nodes (amino acids) are mod-
eled with a uniform harmonic spring. The GNM
algorithm outputs the average fluctuation range for
each Ca atom, which is averaged over the whole pro-
tein to obtain an average protein fluctuation. Mobile
residues with GNM fluctuations that exceeded the
average fluctuation by more than two standard
deviations were excluded from the calculation of the
average fluctuation of the protein.
Normalization of validation scores
All validation scores were normalized separately for
the two data sets and simultaneously for both data
sets such that for each column in Supporting Informa-
tion Tables S1–S3 the average value was zero, and
the standard deviation 1/3. The latter was chosen to
keep almost all normalized score values in the range
[�1, þ1]. In addition, the sign was changed for all
scores that are expected to anti-correlate with the
RMSD, that is, DP, Procheck-//w, Procheck-All, andMolProb.
Multiple linear regressionLinear least-squares fits were made by singular
value decomposition of the matrix xij using the modi-
fied Golub–Reinsch SVD algorithm with column
scaling to improve the accuracy of the singular
values. Any components with a zero singular value
(to machine precision) were discarded from the fit.
We used the MLR routines from the GSL version
1.14 free numerical library for Cþþ programming.
GLM calculations
GLM calculations were performed with the R soft-
ware environment for statistical computing and
graphics (http://www.r-project.org/).
References
1. Tramontano A (2006) Protein Structure Prediction.Weinheim: Wiley-VCH.
2. Snyder DA, Bhattacharya A, Huang YPJ, MontelioneGT (2005) Assessing precision and accuracy of proteinstructures derived from NMR data. Proteins 59:655–661.
3. Laskowski RA, Macarthur MW, Moss DS, Thornton JM(1993) PROCHECK: a program to check the stereo-chemical quality of protein structures. J Appl Crystal-logr 26:283–291.
4. Chen VB, Arendall WB, Headd JJ, Keedy DA, Immor-mino RM, Kapral GJ, Murray LW, Richardson JS,Richardson DC (2010) MolProbity: all-atom structurevalidation for macromolecular crystallography. ActaCrystallogr D 66:12–21.
5. Vriend G (1990) WHAT IF: a molecular modeling anddrug design program. J Mol Graphics 8:52–56.
6. Eisenberg D, Luthy R, Bowie JU (1997) VERIFY3D:assessment of protein models with three-dimensionalprofiles. Methods Enzymol 277:396–404.
7. Sippl MJ (1993) Recognition of errors in 3-dimensionalstructures of proteins. Proteins 17:355–362.
8. Bhattacharya A, Tejero R, Montelione GT (2007) Evalu-ating protein structures determined by structuralgenomics consortia. Proteins 66:778–795.
9. Fiser A, Do RKG, Sali A (2000) Modeling of loops inprotein structures. Protein Sci 9:1753–1773.
10. Linge JP, Nilges M (1999) Influence of non-bonded pa-rameters on the quality of NMR structures: a new forcefield for NMR structure calculation. J Biomol NMR 13:51–59.
11. McGuffin LJ (2007) Benchmarking consensus modelquality assessment for protein fold recognition. BMCBioinformatics 8.
12. Ikeya T, Takeda M, Yoshida H, Terauchi T, Jee J, Kai-nosho M, Guntert P (2009) Automated NMR structuredetermination of stereo-array isotope labeled ubiquitinfrom minimal sets of spectra using the SAIL-FLYA sys-tem. J Biomol NMR 44:261–272.
13. Kihara D, Chen H, Yang YFD (2009) Quality assess-ment of protein structure models. Curr Protein PeptideSci 10:216–228.
14. Yang YD, Spratt P, Chen H, Park C, Kihara D (2010)Sub-AQUA: real-value quality assessment of proteinstructure models. Protein Eng Desig Sel 23:617–632.
Bagaria et al. PROTEIN SCIENCE VOL 21:229—238 237
15. Eramian D, Eswar N, Shen MY, Sali A (2008) Howwell can the accuracy of comparative protein structuremodels be predicted? Protein Sci 17:1881–1893.
16. Rosato A, Bagaria A, Baker D, Bardiaux B, Cavalli A,Doreleijers JF, Giachetti A, Guerry P, Guntert P, Herr-mann T, Huang YJ, Jonker HRA, Mao B, MalliavinTE, Montelione GT, Nilges M, Raman S, van der SchotG, Vranken WF, Vuister GW, Bonvin AMJJ (2009)CASD-NMR: critical assessment of automated struc-ture determination by NMR. Nat Methods 6:625–626.
17. Moult J, Fidelis K, Kryshtafovych A, Rost B, Tramon-tano A (2009) Critical assessment of methods of proteinstructure prediction-Round VIII. Proteins 77:1–4.
18. Doreleijers JF, Rullmann JAC, Kaptein R (1998) Qual-ity assessment of NMR structures: a statistical survey.J Mol Biol 281:149–164.
19. Nabuurs SB, Spronk CAEM, Vuister GW, Vriend G(2006) Traditional biomolecular structure determina-tion by NMR spectroscopy allows for major errors.PLoS Comp Biol 2:71–79.
20. Nelder JA, Wedderbu. Rw (1972) Generalized linearmodels. J R Stat Soc Ser A Gen 135:370–384.
21. Huang YJ, Powers R, Montelione GT (2005) Protein NMRrecall, precision, and F-measure scores (RPF scores): struc-ture quality assessment measures based on informationretrieval statistics. J Am Chem Soc 127:1665–1674.
22. Luthy R, Bowie JU, Eisenberg D (1992) Assessment ofprotein models with 3-dimensional profiles. Nature356:83–85.
23. Lovell SC, Davis IW, Adrendall WB, de Bakker PIW,Word JM, Prisant MG, Richardson JS, Richardson DC(2003) Structure validation by Ca geometry: /, w andCb deviation. Proteins 50:437–450.
24. Bahar I, Atilgan AR, Demirel MC, Erman B (1998)Vibrational dynamics of folded proteins: significance ofslow and fast motions in relation to function and stabil-ity. Phys Rev Lett 80:2733–2736.
25. Jaravine VA, Rathgeb-Szabo K, Alexandrescu AT(2000) Microscopic stability of cold shock protein Aexamined by NMR native state hydrogen exchange asa function of urea and trimethylamine N-oxide. ProteinSci 9:290–301.
26. Irving JA, Whisstock JC, Lesk AM (2001) Proteinstructural alignments and functional genomics.Proteins 42:378–382.
27. Garbuzynskiy SO, Melnik BS, Lobanov MY, FinkelsteinAV, Galzitskaya OV (2005) Comparison of X-ray andNMR structures: is there a systematic difference in res-idue contacts between X-ray and NMR-resolved proteinstructures? Proteins 60:139–147.
28. Cavalli A, Salvatella X, Dobson CM, Vendruscolo M(2007) Protein structure determination from NMR chemi-cal shifts. Proc Natl Acad Sci U S A 104:9615–9620.
29. Shen Y, Lange O, Delaglio F, Rossi P, Aramini JM, LiuG, Eletsky A, Wu Y, Singarapu KK, Lemak A, Ignatch-enko A, Arrowsmith CH, Szyperski T, Montelione GT,Baker D, Bax A (2008) Consistent blind protein struc-ture generation from NMR chemical shift data. ProcNatl Acad Sci U S A 105:4685–4690.
30. Shen Y, Vernon R, Baker D, Bax A (2009) De novo pro-tein structure generation from incomplete chemicalshift assignments. J Biomol NMR 43:63–78.
31. Raman S, Huang YJ, Mao B, Rossi P, Aramini JM,Liu G, Montelione GT, Baker D (2010) Accurate auto-mated protein NMR structure determination using unas-signed NOESY data. J Am Chem Soc 132:202–207.
32. Tøndel K (2004) Prediction of homology model qualitywith multivariate regression. J Chem Inf Comput Sci44:1540–1551.
33. Bhattacharya A, Wunderlich Z, Monleon D, Tejero R,Montelione GT (2008) Assessing model accuracy usingthe homology modeling automatically (HOMA) soft-ware. Proteins 70:105–118.
34. Kirchner DK, Guntert P (2011) Objective identificationof residue ranges for the superposition of protein struc-tures. BMC Bioinformatics 12:170.
35. Guntert P, Mumenthaler C, Wuthrich K (1997) Torsionangle dynamics for NMR structure calculation with thenew program DYANA. J Mol Biol 273:283–298.
36. Hyberts SG, Goldberg MS, Havel TF, Wagner G (1992)The solution structure of eglin c based on measure-ments of many NOEs and coupling constants and itscomparison with X-ray structures. Protein Sci 1:736–751.
238 PROTEINSCIENCE.ORG Protein Structure Validation by GLM-RMSD


![Research Article A New Weak Chelator in …downloads.hindawi.com/journals/ijd/2013/743018.pdfof occurrence of root canal deviation during biomechanical preparation [ ], because they](https://img.pdfslide.us/doc/110x75/5ed57e3b276f240580269292/research-article-a-new-weak-chelator-in-of-occurrence-of-root-canal-deviation-during.jpg)