Embed Size (px)
Citation preview

Protein-Phenolic Interactions in Food
By
Haroon Ali
Department of Food Science and Agricultural ChemistryMacdonald campus, McGill University
Montreal, Québec
A Thesis submitted to the Faculty of Graduate Studies and Research inpartial Fulfillment for the requirement for the degree of Masters of Science
March,2002
©Haroon Ali

National Ubraryof Canada
Acquisitions andBibliographie Services
3~5 Wellington StreetOttawa ON K1A ON4canada
Bibliothèque nationaledu Canada
Acquisitions etservices bibliographiques
395. rue WellingtonOttawa ON K1A ON4canada
You, file Vol.... téfé_
The author bas granted a nonexclusive licence alloWÙ1g theNational LibraryofCanada toreproduce, loan., distnbute or sellcopies of this thesis in microform,paper or.·electronic formats.
The author retains ownership of thecopyright inthisthesis.Neither thetheSisn.orsubstantialextracts from itmay be printed orotherwisereproduced without the auth.or' spenmSSlon.
L'auteur a accordé une licence n.onexclusive permettant à.laBibliothèque nationale du Canada dereproduire, prêter, distribuer ouvendre des copi~s. de cette thèse sousla forme de microfiche/film, dereproduction sur papier.ou sur formatélectronique.
L'auteur conserve la propriété dudroit d'auteuriquiprotègecette. thèse.Ni la thèse.nides extraits substantielsde celle-ci ne doivent être imprimésou autrement reproduits sans sonautorisation.
0-612-78820-2

Suggested short tUle:
PROTEIN-PHENOLIC INTERACTIONS
ii
•
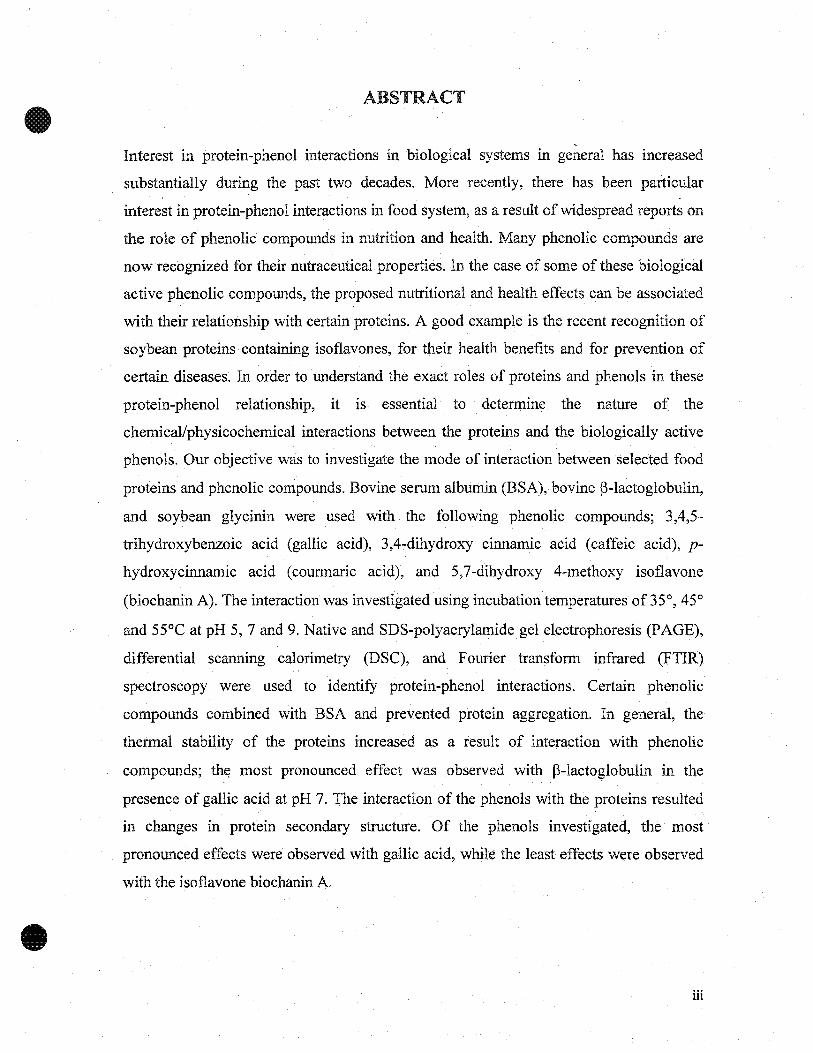
ABSTRACT
Interest in protein-phenol interactions in biological systems in general has increased
substantially during the past two decades. More recently, there has been particular
interest in protein-phenol interactions in food system, as a result of widespread reports on
the role of phenolic compounds in nutrition and health. Many phenolic compounds are
now recognized for their nutraceutical properties. In the case of sorne of these biological
active phenolic compounds, the proposed nutritional and health effects can be associated
with their relationship with certain proteins. A good example is the recent recognition of
soybean proteins containing isofiavones, for their health benefits and for prevention of
certain diseases. In order to understand the exact roles of proteins and phenols in these
protein-phenol relationship, it is essential to determine the nature of the
chemical!physicochemical interactions between the proteins and the biologically active
phenols. Our objective was to investigate the mode of interaction between selected food
proteins and phenolic compounds. Bovine serum albumin (BSA), bovine p-Iactoglobulin,
and soybean glycinin were used with the following phenolic compounds; 3,4,5
trihydroxybenzoic acid (gallic acid), 3,4-dihydroxy cinnamic acid (caffeic acid), p
hydroxycinnamic acid (courmaric acid), and 5,7-dihydroxy 4-methoxy isof1avone
(biochanin A). The interaction was investigated using incubation temperatures of 35°,45°
and 55°C at pH 5, 7 and 9. Native and SDS-polyacrylamide gel electrophoresis (PAGE),
differential scanning calorimetry (DSC), and Fourier transform infrared (FTIR)
spectroscopy were used to identify protein-phenol interactions. Certain phenolic
compounds combined with BSA and prevented protein aggregation. In general, the
thermal stability of the proteins increased as a result of interaction with phenolic
compounds; th~ most pronounced effect was observed with p-Iactoglobulin in the
presence of gallic acid at pH 7. The interaction of the phenols with the proteins resulted
in changes in protein secondary structure. Of the phenols investigated, the most
pronounced effects were observed with gallic acid, while the least effects were observed
with the isofiavone biochanin A.
Hi

•
RÉSUMÉ
L'intérêt pour les interactions protéines-phénols dans les systèmes biologiques en
général a augmenté considérablement durant les deux dernières décennies. Plus. .
récemment, un intérêt tout particulier a été porté sur les interactions protéines- phénols
dans les systèmes alimentaires, résultant d'une augmentation de l'information sur les
rôles des composés phénoliques dans les domaines de la nutrition et de la santé. Plusieurs
composés phénoliques sont aujourd'hui reconnus pour leurs propriétés nutraceutiques.
Dans le cas de certains composés phénoliques biologiquement actifs, les effets présentés
dans cette étude sur la nutrition et la santé peuvent être reliés à leur relations avec
certaines protéines. Par exemple, il a été reconnu récemment que les protéines de soya
contenant des isoflavones présentaient des bénéfices pour la santé, comme la prévention
de certaines maladies. Il est essentiel de déterminer la nature des interactions entre les
protéines et les phénols biologiquement actifs afin d'estimer les rôles exacts des protéines
et des phénols dans ces relations. Notre objectif a été d'étudier le mode d'interaction
entre certaines protéines alimentaires et les composés phénoliques. L'albumine de serum
de bovin (ASB), la -lactoglobuline bovine, et la glycinine de soya furent utilisées avec
les composés phénoliques suivant; l'acide 3,4,5-trihydroxybenzoique (acide gallique),
l'acide 3,4-dihydroxycinnamique (acide caffeique), l'acide p-hydroxycinnamique (acide
coumarique), et la 5,7-dihydroxy 4-methoxy isoflavone (biochanine A). Les interactions
furent étudiées sous des températures d'incubation de 35°, 45° et 55Co et à pH 5, 7 et 9.
Gel sur polyacrylamide electrophoretic (natal et SDS) (PAGE), calorimétrie à scanner
différentiel (DSC), et la transformée infrarouge de Fourier (FTIR), ont été utilisés pour
identifier les interactions protéines-phénols. Certains composés phénoliques se sont liés à
l'ASB .et ainsi empêché l'aggregation protéique. En général, la stabilité thermique des
protéines a augmenté résultant de l'interaction avec les composés phénoliques; l'effet le
plus marqué fut observé avec la -1 actoglobuline en présence de l'acide gallique à pH 7.
Les interactions des phénols avec les protéines ont induit des changements dans la
structure protéique secondaire. Parmi les phénols étudiés, les effets les plus prononcés
furent observés avec l'acide gallique, en revanche, les plus moindres effets furent
constatés avec l'isoflavone biochanine A.
iv

ACKNOWLEDGEMENTS
1 would Iike to express my sincere gratitude to my supervisor, Dr Inteàz Alli for hisguidance and encouragement throughout this course of work. Extended thanks to Dr.Alli' s family .for their support and kindness.
1 would also Iike to thank Dr. Ashraf Ismail for his valuable advises and for allowing meto use his laboratory facilities.
1 am sincerely thankful to my father and family for their continuoussupport, love andcare without which this program would have not been possible.
1 would also like to appreciate my friends (Partick, Sarra, Sahal and Sadia) and mycolleagues (Husam, Ahmada, Firoozeh, Razan and Mohammad) for making my staycomfortable and joyful.
Above aIl 1 would Iike to thank almighty Allah for giving me an opportunity to work formy Masters and for paving the way for me when 1found it difficult.
v

TABLE OF CONTENT
TITLE
ABSTRACT
RÉSUMÉ
ACKNOWLEDGEMENTS
TABLE OF CONTENT
LIST OF FIGURES
LIST OF TABLES
11
m
IV
V
VI
x
xm
1. CHAPTER NO. 1 INTRODUCTION 1
2.1A Protein-phenolic interactions
2.3A Tannin-protein interaction and its importance
2.5A Interaction of low molecular weight phenolics
2.4A Interaction of tannins with salivary-rich proteins
3
3
4
5
6
7
9
9
10
LITERATURE REVIEW
2.2A Formation of protein-phenolic complexes
2.2.1A Characteristics ofproteins and peptides
2.2.2A Characteristics of phenols
2.6A Interaction of phenolic compounds with canola protein
2. CHAPTER NO. 2
2.1B Interaction between phenolic compounds and soybean proteins Il
2.2B Chemical structure of soybean isoflavones Il
2.3B Importance of isof1avones in soybean protein foods 19
2.3..1B Coronary heart diseases and isoflavones
. 2.3.2B Isoflavones and cancer
20
20
VI

2.4B Adverse effects of isoflavones
2.5B Distribution and origin of isoflavones
2.6B Analysis of isoflavones
2.7B Analysis ofprotein-phenolic interactions
3. CHAPTER NO. 3
21
22
23
23 -
24
DETECTING PROTEIN-PHENOLIC INTERACTIONUSING POLYACRYLAMIDEGEL ELECTROPHORESIS~~~ ~
3.1 MATERIALS AND METHODS 24
•
3.1.1 Materials 24
3.1.2 Preliminary experiment 24
3.1.3 Preparation of solutions for preliminary experiment 25
3.1.4 Preparation of solutions for protein-phenolic interactions 25
3.1.5 Electrophoresis 27
3.1.6 Sample preparation for SDS-PAGE 27
3.1.7 Concentration of gels and their preparation 27
3.1.8 Sample loading 28
3.1.9 Running conditions 28
3.1.10 Protein fixing, staining and destaining solutions 29
3.1.11 Native-PAGE electrophoresis 29
3.1.12 Sample preparation 29
3.1.13 Gel concentration and preparation 29
3.1.14 Electrophoresis conditions 30
3.1. 15 Protein fixing, staining and destaining solutions 30
vii

3.2 RESULTS AND DISCUSSIONS
3.2.1 Effect ofpH on color changes ofphenolic compounds
3.2.2 Preliminary experiment with BSA-gallic acid
30
30
31
3.3
3.2.3 Native-PAGE ofproteins with phenolic compounds
3.2.3.1 BSA-Phenolic compounds
3.2.3.2 ~-Lg with gallic acid and biochanin A
3.2.3.3 Soybean glycinin with gallic acid and biochanin A
Conclusion
31 .
31
43
45
45
4. CHAPTERNO. 4 47
STUDYING PROTEIN-PHENOLIC INTERACTIONUSING DIFFERENTIAL SCANNING CALORIMETRY (DSC)AND FOURIER TRANSFORM INFRARED SPECTROSCOPY~~ ~
4.1 MATERIALS AND METHODS
4.1.1 Materials
4.1.2 Sample preparation for DSC
4.1.3 DifferentiaI Scanning Calorimetry
4.1.4 Sample preparation for FTIR
4.1.5 Fourier Transform Infrared Spectroscopy
4.2 RESULTS AND DISCUSSIONS
4.2.1 Effect of gallic acid and biochanin A on thermalcharacteristics
ofBSA
4.2.2 Effect gallic acid and biochanin A on thermal characteristics
47
47
47
47
48
48
49
51
of~-Lg 55
4.2.3 Effectof gallic acidand biochanin A on thermal characteristics
of soybean glycinin 61
4.2.4 Fourier Transform Infrared Spectroscopy (FTIR) 66
viii

4.2.4.1 Effect of gallic acid and biochanin A on secondary
Structure ofBSA and soybean glycinin 65
5. GENERAL CONCLUSION 73
6. REFERENCES CITED 74
ix

LIST OF FIGURES
Figure 1. Reversible and irreversible protein-polyphenol complexation 5
Figure 2. Principal aromatic sites in natural phenols for the complexation
with proteins 7
Figure 3. Comparative illustration between fiavone and isofiavone 12
Figure 4. General structure of soybean isofiavones 14
Figure 5. Chemical structures of twelve isofiavones isomers 15
Figure 6. Schematic design of preliminary experiment 26
Figure 7. Molecular Structure of: a) gallic acid b) caffeic acidand
c) p-coumaric acid 32
Figure 8. Electropherograrn (SnS-PAGE) ofBSA at pH 3, 5, 7 and 9
incubated at 35°C, 45°C and 55°C. A', B' and C': BSA-gallic
acid, A, Band C: BSA alone 33
Figure 9. Electropherogram (native-PAGE) ofBSA atpH 5,7 and 9
incubated at 35°C, 45°C and 55°C. A', B' and C': BSA-gallic
acid, A, B and C: BSA alone 35
Figure 10. Electropherogram (native-PAGE) ofBSÀ at pH 5, 7 and 9
incubated at 35°C, 45°C and 55°C. A', B' and C': BSA-caffeic
acid, A, B and C: BSA alone 37
Figure 12. Electropherograrn (native-PAGE) ofBSA at pH 5, 7 and 9
incubated at 35°C, 45°C and 55°C. A', B' and C': BSA-
p-coumaric acid, A, B and C: BSA alone 39
Figure 13. Electropherogram (native-PAGE) of BSA at pH 5, 7 and 9
incubated at 35°C, 45°C and 55°C. A', B' and C': BSA-
biochanin A, A, B and C: BSA alone 41
Figure 14. Electropherograrn (native-PAGE) of ~-Lg at pH 5, 7 and 9
with gallic acid (I) and biochanin A (II), incubated at55°C.
A', B' and C': ~-Lg-gallic add, biochanin A and A, B and C:
• ~-Lg alone 44
x
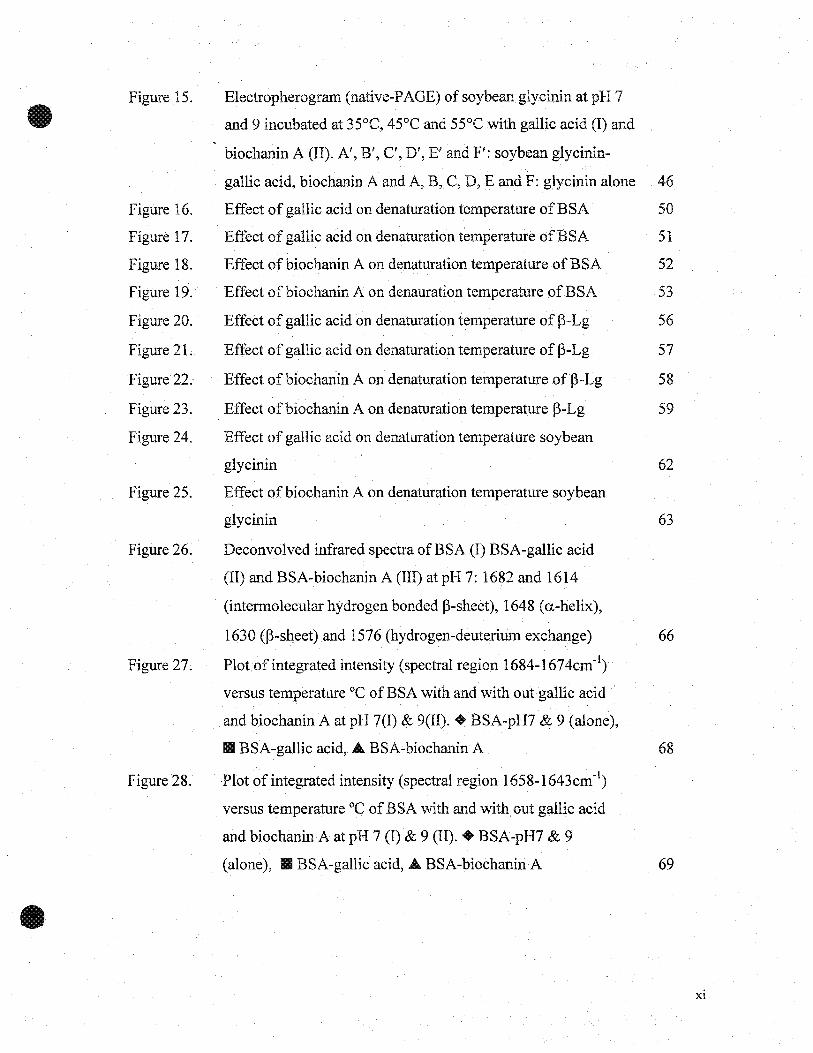
Figure 15.
Figure 16.
Figure 17.
Figure 18.
Figure 19.
Figure 20.
Figure 2I.
Figure 22.
Figure 23.
Figure 24.
Figure 25.
Figure 26.
Figure 27.
Figure 28.
Eleetropherogram (native-PAGE) of soybean glycinin at pH 7
and 9 incubated at 35°C, 45°C and 55°C with gallic acid (1) and
bioehanin A (II). A', B', C', D', E' and F': soybean glycinin-
gallic acid, biochanin A and A, B, C, D, E and F: glycinin alone 46
Effeet of gallic acid on denaturation temperature ofBSA 50
Effeet of gallie acid on denaturation temperature ofBSA 51
Effeet ofbioehanin A on denaturation temperature ofBSA 52
Effeet ofbioehanin A on denauration temperature ofBSA 53
Effeet of gallie acid on denaturation temperature of p-Lg 56
Effeet of gallie aeid on denaturation temperature of p-Lg 57
Effeet ofbioehanin A on denaturation temperature of p-Lg 58
Effeet ofbioehanin A on denaturation temperature p-Lg 59
Effeet of gallie acid on denaturation temperature soybean
~~ ~
Effeet ofbioehanin A on denaturationtemperature soybean
glyeinin 63
Deeonvolved infrared spectra ofBSA (1) BSA-gaUie acid
(II) and BSA-bioehanin A (III) at pH 7: 1682 and 1614
(interrnoleeular hydrogen bonded p-sheet), 1648 (d-helix),
1630 (p-sheet) and 1576 (hydrogen-deuterium exchange) 66
Plotofintegrated intensity (spectral region 1684-1674em-1)
versus temperature oC ofBSA with and with out gallîc acid
and biochanin A at pH 7(1) & 9(II).• BSA-pH7 & 9 (alone),
III BSA-gallie aeid, A. BSA-bioehanin A 68
Plot of integrated intensity (spectral region 1658-1643em-1)
versus temperature oC of BSA with and with out gallic acid
and biochanin A at pH 7 (1) & 9 (II).• BSA-pH7 & 9
(alone), BSA-gallie aeid, . BSA-bioehanin A 69
xi

Figure 29.
Figure 30.
Plot ofintegrated intensity (spectral region 1621-1608cm-1)
versus temperature oc of BSA with and with out gallic acid
and biochanin A at pH 7 (1) & 9 (II).• BSA-pH7 & 9 (alone),
Il BSA-gallic acid, Â BSA-biochanin A
Plot ofintegrated intensity (spectralregion 1551-1539cm-1)
versus temperature oc ofBSA with and without gallic acid
and biochanin A at pH 7 (1) & 9 (II).• BSA-pH7 & 9 (alone),
Il BSA-gallic acid, Â BSA-biochanin A
.,.
70
71
xii

Table 1.
Table 2.
Table 3.
Table 4.
Table 5.
Table 6.
Table 7.
Table 8.
Table 9.
LIST OF TABLES
Soybean isoflavone structural fonnula 14
Nonessential but bioactive phenolic compounds from plant sources 22
Relative mobility (Rf, native-PAGE) of BSA incubated with
gallic acid at 35°C, 45°C and 55°C 36
Relative mobility (Rf, native-PAGE) ofBSA incubated with
caffeic aeid at 35°C, 45°C and 55°C 38
Relative mobility (Rf, native-PAGE) ofBSA ineubated with
p-eoumarie acid at 35°C, 45°C and 55°C 40
Relative mobility (Rf, native-PAGE) ofBSA ineubated with
biochanin A at 35°C, 45°C and 55°C 42
Effeet of gallic acid and bioehanin A on denaturation
tem.perature (Td) and enthalpy (AH) ofBSA 54
Effeet of gallie acid and bioehanin A on denaturation
temperature (Td) and enthalpy (AH) of p-Lg 60
Effect of gallie acid and biochanin A on denaturation
temperature (Td) and enthalpy (AH) of soybean glyeinin 64
xiii

CHAPTER NO. 1
INTRODUCTION
Protein-phenolic interactions have received considerable attention in recent years.
The importance of food. proteins as a part of staple diet is well documented. Phenolic
compounds are constituents of plants, including many that are consumed widely by
humans. Data from human, and animal studies suggests that dietary phenolic compounds
play importantroles in protection against a wide range of human diseases including,
cardiovascular diseases, certain types of cancers, and prevention of osteoporosis.
Protein-phenolic interactions can be categorized as. either, reversible or
irreversible. Reversible protein-phenolic interactions lead to the formation of insoluble
complexes in solution; however, entirely new product can result from irreversible
reactions. Tightly coiled, globular proteins show less affinity for phenolic compounds as
compared to proteins that have random coil or lose conformation. Both the aromatic
nuclei and the hydroxyl groups of the aromatic ring of phenolic compounds provide the
principle binding sites for protein-phenol complexation. Hydrogen bonding and
hydrophobie interaction have been found the primary attractive forces between protein
molecules and phenolic groups.
Soybean is a recognized source of certain complex phenolic compounds in Asian
diet. Soybean, besides being excellent source of protein (35-40%) and fat/oil (15-20%),
also contains several isoflavones as a group of phenolic compounds (Messina, 1999).
Soybean isof1avones have been reported to confer significant health. benefits. The interest
insoybean isof1avones has become intense to an extent that recently two international
conferences have been convened to report the state ofknowledge in the field.

•
Soybeans and soy products contain three isoflavones (genistein,daidzein, and
glycitein) which occur in four possible forms, the aglycon, the glucoside, the
malonylglucoside and the acetylglucoside (Wang and Murphy, 1994). Isoflavones are
present in soy food as ~-glucosides (Barnes et al, 1994) which, are hydrolyzed by thegut
bacteria to release the highly absorbed aglucones. In October 1999 Food and Drug
Administration (FDA) of United States responded to a petition by Protein Technologies
International, by authorizing daims that soybean protein is good for heart function.
According to FDA, in take of 25g soy protein a day can reduce the risk of heart diseases
when used with low fat diet, the 25g soy protein recommended by FDA contains
approximately 25mg of isoflavones. The isofiavones in soybean can be strongly attached
with the proteins in the seed (Palevitz, 2000).
Though isoflavones show a strong interaction with soybean proteins, this protein
isoflavone relationship has not yet been fully investigated. The overall objective of our
study is to use model system to investigate the interaction between proteins and phenolic
compounds. Whereas, specifie objectives are: 1) use PAGE to detect protein-phenolic
interactions and 2) use DSC and FTIR to study effect of phenolic compounds on thermal
characteristics of proteins.
2

•
CHAPTER NO. 2
LITERATURE REVIEW
2.1A Protein-phenolic interactions
The role of food proteins in nutrition and health has long been well established.
More recently, the roles of phenolic cOl11pounds in human nutrition and health have
become known. Consequently, investigations on protein-phenolic interactions have
become the study of interest in many areas of food, nutrition and health. Polyphenols
have been known to confer beneficial effects by acting as antioxidants, however they can
also be harmful (Haslam, 1998). The nutritional effects of polyphenols are considered to
be related to their capacity to bind and precipitate proteins (Jansman, 1993). The ability
of polyphenols to form insoluble complexes with proteins, interferes with utilization of
dietary proteins; these effects can be manifested in decrease in growth rate and/or feed
conversion, as well as lower egg production (Myer and Gorbet, 1985). Polyphenols are
known to bind proteins in beer, wine and fruit juices, resulting in undesirable turbidity
and colloidal haze (Seibert, 1999). The complexation of polyphenols, as weIl as their
enzymaticand non enzymatic oxidation products, with protein in seed, meals or f10urs
has been reputed to reduce nutritional value of proteins from these sources (Haslam,
1998). Oxidized phenols can react with amino acids and proteins and inhibit the activity
ofproteolytic enzymes such as trypsin and lipases (Milic et al, 1968).
Tannins, which are polymers of phenolic compounds, have been investigated for
their interactions with proteins; numerous studies on factors affecting tannin-protein
interactions, such as pH, temperature, phenolic structure, protein size, and amino acid
3

composition and solvent characteristics in the medium have been reported (Serafini et al,
1997).
2.2A Formation of protein-phenolic complexes
Hagerman (1989) reported that the presence of bovine serum albumin (BSA)
affected the relative antioxidant potency of low molecular weight phenolics, ferulic acid,
caffeic acid, (+)- catechin, and this was partly attributed to the binding of phenols to the
protein matrix. It has been suggested (Haslam et al, 1999) that hydrogen bonding
between the phenolic hydroxyl groups, and the NH- and CO- groups of protein are
involved in protein-phenolic interactions. In addition, hydrogen bonding and covalent
linkages between oxidized phenols and nucleophilic amino-acid side chains, such as
lysine or cysteine, are reported to be involved in binding of chlorogenic acid to sunflower
proteins (Sastry and Rao, 1990). It has been reported (Siebert, 1999) that oxidized
polyphenols leads to compounds that interact more strongly with proteins. The interaction
between phenolic compounds and peptides can also involve formation of a-bonded
complexes (Bianco et al, 1997). Hydrophobie interaction between nonpolar regions of the
phenolic molecules and nonpolar domains of the protein may be responsible for weak
interactions between phenolic compounds and proteins (Bartolome et al, 2000).
The interaction between polyphenols and proteins may be either reversible or
irreversible (FigUre 2.1) (Haslam et al, 1999). Irreversible complexes usually are formed
autocatalytically in the presence of oxygen, or in the presence of polyphenoloxidases
(enzymes) (Mole and Waterman, 1987), and can lead to the formation of clearly defined
new products, as apparent in the case of black tea processing. Conversely, reversible
complexation can take place via various non-covalent forces, such as hydrophobie
4

interactions, hydrogen bonding, solvation, and desolvation forces (Haslam et al, 1999).
Figure 2.1: Reversible and irreversible protein-polyphenol complexation (Haslamet al, J 999).
Protein +
1POLYPHENOL
Protein Polyphenol
[Soluble complexes]
(Irreversible) (Reversible)
1New Products
\[Protein:Polyphenol] (H20)[Insoluble complexes]
2.2.1A Characteristics of proteins and peptides
Proteins with high affinity for phenols usually have relatively higher molecular
weight, open and lose conformational structure and are rich in proline (Hagerman, 1989).
Glycosylated proteins also have enhanced affinity and selectivity towards binding
phenols; this may be due to the ability of oligosaccharide portion of the glycoproteins to
maintain the protein structure in a relative open conformation (Haslam et al, 1999).
Phenols can readily precipitate proteins at or near their isoelectric points; however tightly
5

coiled globular proteins or those which have random coil conformation and in particular,
which were rich in the amino acids proline (proline rich proteins- PRP) did notshow the
same characteristics. It was also shown that the relative affinities of polypeptides and
proteins for the polymerie proanthocyanidin were influenced by their size (Siebert, 1999).
The low affinity of small peptides and low molecular weight oligomers of proline for
tannin, and the non-linearilty of the increase in affinity which was observed with higher
oligomers of proline, suggest that the complexation involved the deployment of multiple
binding sites on both substrates (Haslam et al, 1999).
2.2.2A Characteristics ofphenols
It has been shown (Haslam et al, 1999) that molecular size, the number and
disposition of phenolic nuclei, conformational flexibility, and water solubility are the
dominant features in the determination of the strength of binding of a particular phenolic
compound to the protein. High resolution NMR· studies generally confirm that the
aromatic nuclei of polyphenols provide the principal site for association with proteins
(Figure 2.2) (Murray et al, 1994). The data obtained from equilibrium dialysis studies
with bovine serum albumin (BSA) and a range of simple phenols (resorcinol, catechol,
pyrogallol) .gave scattered plots which revealed that the affinity of both catechol and
pyrogallol for BSA was three times the order of magnitude greater than that of resorcinol;
resorcinol, at 20°C had twice the solubility in water of catechol and pyrogallol. This
observation supports earlier reports (Haslam et al, 1999) that the O-dihydroxy and 0
trihydroxy aromaticnuclei of the neutral phenols represents the principal sites for
complexation with proteins.
6

Figure 2.2. Principal aromatic sites in natural phenols for the complexation withproteins (Memanus et al, 1981).
L1
•1
OH
Galloyl esters Flavan-3-ols
•
2.3A Tannin-protein interaction and its importance
Tannins are a major constituent of plants, including many plants that are
consumed widely by humans (Murray et al, 1994). Tannins have been classified into two
groups: the hydrolysable tannins, which are esters usually with D-glucose of gallic acid
and its derivatives, and the condensed tannins (proanthocyanidins) which are oligomers
of the flavan-3-o1 skeleton, e.g. epicatechin. Their biological effects are wide-ranging and
include inhibition of gut· enzymes, inhibition of non-heme hon absorption, influencing
the taste and reducing the nutrition value of food, esophageal cancer, and effects of
astringency (Haslam, 1989).
7

Binding of tannin to protein molecules can bring about conformational changes in
both !he protein and the tannin molecules, thus lowering their solubility (Asguith and
Butler, 1986). The lowest solubility of tannin-protein complex occurs at a pH near the
isoelectric point of the protein (Hagerman and Butler, 1981). The tannin-protèin
interaction is also dependent on the initial concentration of both the tannins and proteins.
Proteins are completely precipitated in the presence of excess tannins, however, excess of
proteins led to the formation of soluble protein-tannin complex (Hagerman and Robins,
1987).
The formation of tannin-protein complexes is not only affected by the
composition and structure of proteins but also by the size, length and flexibility of tannin
molecules. It has been determined that tannin should have at least three flavanols subunits
to be an effective protein precipitating agent; dimers precipitated proteins, but were much
less effective, whereas simple flavanols did not precipitate proteins at aH (Artz et al,
1987).
The binding of protein to tannin may be due to the formation of multiple
hydrogen bonds between the hydroxyl groups of the tannins and the carbonyl group of
the proteins (Haslam, 1974). The tannin-protein complex may also be stabilized by other
types of molecular interactions such as ionic bonds between the phenolate anion and
cationic sites on the protein molecule, and/or covalent links formed as a result of
condensation of oxidizedphenolic groups of tannins with nucleophilic groups (SH, OH,
NH2) of proteins (Loomis, 1974), hydrophobie interaction between the aromatic ring of
tannins and hydrophobie region of proteins may also be involved. The 1, 2-di- (or 1,2,3
tri-) hydroxyphenyl residue is cOJ.1sidered as the prime oinding site of tannins, it is
8

believed that tannin-protein eomplexation is usually the result of formation of hydrogen
bonds and hydrophobie interactions (Oh et al, 1980).
2.4A Interaction of tannins with salivary proline-rich proteins
The salivary proline rich proteins (PRPs) comprise about 70% of the protein
content of saliva, and have been divided into glycosylated, acidic and basic classes
(Kauffman and Keller, 1979). Salivary PRPs consist of between 70-80% proline,
glutamine and glycine, arranged as 5-15 almost identicaLrepeats of an approximate 18
residue sequence (Wang and Bennick, 1980). It has been suggested that the main
function of proline-rich repeats is to bind to polyphenols present in the diet, thus
improving the bioavailability of the dietary proteins by protecting them from interactions
withtannins (Wamer and Azen, 1998). Feeding tannin-rieh dietto rats and mice led to an
initial weight loss; a normal weight gain resumed after about three days and was
eorrelated with the induction of salivary PRPs synthesis (Mehansho et al, 1987). The high
affinity of salivary PRPs for polyphenols has not only been attributed to their open
random conformation, but also to prolyl groups which provide "stick patches" on the
protein for the phenolic nuclei of the polyphenolic substrate (Murray and Williamson,
1994).
2.5A Interaction of low molecular weight phenolics
There have been relatively few studies dealing. with the interaction of low
molecular weight phenols and proteins. It has been demonstrated that additives interact
with food proteins, leading to a decrease in the perceived intensity of the flavor (Hansen
and Heinis, 1991). Certain protein concentrates from sunflower seeds, develop an
9

undesirable brown color because of protein binding with oxidation products of low
molecul~ weight phenols such as chlorogenic acid (Sastry and Rao, 1990).
More recently, BSA was investigated for its interaction with low molecular
weight phenols (Bartolomé et al, 2000). Protocatechuic and caffeic acid exhibited "the
highest binding for the protein, whereas p-hydroxybenzoic acid exhibited the lowest
binding capaeity; whereas, p-coumaric acid and (+)- catechin exhibited a negligible value
for protein-retained phenols. Similar work with myoglobin and various plant phenols has
shown that phenloic compounds effeets the chemical and in vitro enzymatic degradation
of proteins; the protein-phenol reaction was shown to occur at the lysine side chains and
at the indole rings of the tryptophan residues of the myoglobin (Kroll et al, 2001).
2.6A Interaction of phenolic compounds with canola protein
Canola contains relatively high quantities of phenolic compounds. In spite of the
nutritional potential of these proteins, their objeetionable color and taste limits the use of
these proteins in foods. They contain phenolie eompounds with bittemess intensity
similar to eaffeine and readily undergo enzymatic and non-enzymatie oxidation to
produce quinones which can then react with protein, causing a dark color in the final
product (Gheysuddin et al, 1970). These organoleptic problems were believed to be
caused by the presence of phenolic cornpounds (Sosulski, 1979). Phenolic compounds
bind to canola protein products through a meehanism such as hydrogen bonding (Loomis
and Battaile, 1966), hydrophobie interaction (Hagerman and Butler, 1978) and Ionie
bonding in aqueous media.
10

2.IB Interaction between phenolic compounds and soybean proteins
Soybeans are an important source· of protein and fat, their composition in
tenus ofmoisture, oil, protein and carbohydrates being 8-10, 17-20,38-40 and 26
29%, respectively. In addition, soybeans eontain a variety of phytoehemieals, and in
particular, isoflavone, a class .of phenolie compounds. Soybeans and soyproducts
eontain ::::::1-3 mg isoflavones (Wang and Murphy, 1994). Isoflavones have reeeived
considerable attention in recent years for their potential role in the prevention and
treatment. of a number of chronic diseases including heartdisease, certain fonus of
cancers, osteoporosis and also for their ability to relieve menopausalsymptoms
(Kennedy, 1998). Isoflavones are heterocyclic phenolic compounds belonging to a
subclass of flavonoids. They are Isomerie with flavonoids and differ only in the
position of attachment of the aryl-B-ring to the central pyran nucleus, the second
benzene ring is attached to 3 instead of 2 position (Figure 2.3). Common isofiavones
have the usual 5,7,4' -or 5,7,3', 4'- hydroxylation patterns, but thereare many rarer
isoflavones that have no known eounterpart in the flavone series (Harbome, 1967).
As of 1994, chemists recognized more than 334 different kinds of isoflavones (Dixon,
1999). Isoflavones are considered to be non-nutritive, as they neither yield any energy
nor function as vitamins.
2.2B Chemical structures of soybean isoflavones
Soybeans contain twelve major isomers of naturally occurring isoflavones. They
exist in soybeans either as aglucones or free fonus. (Tekel et al, 1999). The aglucone
isoflavones include daidzein, genistein and glycitein; the glucosides of daidzein, genistein
11

Figure 2.3: Comparative illustration between flavone and isoflavone.
2' 3'
7
6
4'
Flavone
7
6 4'
Isoflavone
12

and glycitein are called as daidzin, genistin and glycitin, respectivdy (Wang and Murphy,
1994). Genistein and its glucoside, genistin, have been recognized for many decades, and
it was believed that the primary form ofthis isoflavone in unprocessed soybeans was the
glycoside form, genistin; similarly, daidzein and its aglucone daidzein have long been
known as soy constituents. Relative proportion ·of glycitein and its glucoside, glycitin, are
rather low in soy products (Wang and Murphy, 1994). Recent research shows that the
predominant fraction of the isoflavone found in soybean and soybean extracts, especially
in unprocessed or mildly processed soybean products, occur net as the glucoside form but
rather as their 6"-0-malonyl esters (Shen et al, 2000). Chemically, these compounds
consists of the glucoside form esterified with a single malonate half-ester, located at the
primary (6"-) hydroxyl group of the sugar moiety. The malonyl esters are thermally and
chemically unstable and are easily converted during soy products processin.g, especially
via heating, toasting and/or at high pH, to either the free glucoside form or ta yet another
type of isof1avone derivative, 6/-O-acetyl esters, which are somewhat more stable than
the malonyl forms (Wang and Murphy, 1994). The six derivatives· of the glocusides
which exist in soybean are 6"-0 Ac daidzin, 6"-0 Mal daidzin, 6"-0 Ac genistin, 6"-0
Mal genistin, 6"-0 Ac glycitin and 6"-0 Mal glycitin, "Ac" represents "acetly" and
"Mal" represents malonyl (Shen et al, 2000). The general formula of the soybean
isof1avones is shown in Figure 2.4. RI, R2, R3 and R4 may be selected from the group
consisting ofH, OH and OCH3 (Table 2.1) (Figure 2.5) (Wang and Murphy, 1994).
13

Figure 2.4: General structure of soybean isoflavones.
R1
R2
R4
Table 2.1: Soybean isoflavones structural formula table.
Compound RI R2 R3 R4
Daidzein OH H H OHDaidzin H H H OH6"-0 Mal Daidzin COCH.CO H H OH6"-0 Ac Daidzin COCH H H OHGenistein OH H OH OHGenistin H H OH OH6"-0 Mal Genistin COCH.CO H OH OH6"-0 Ac Genistin COCH H OH OHGlycitein OH OCH3 H OHGlycitin H OCH3 H OH6"-0 Mal Glycitin COCH.CO OCH3 H OH6"-0 Ac Glycitin COCH OCH3 H OH
*Source: Wang and Murphy, 1994
14
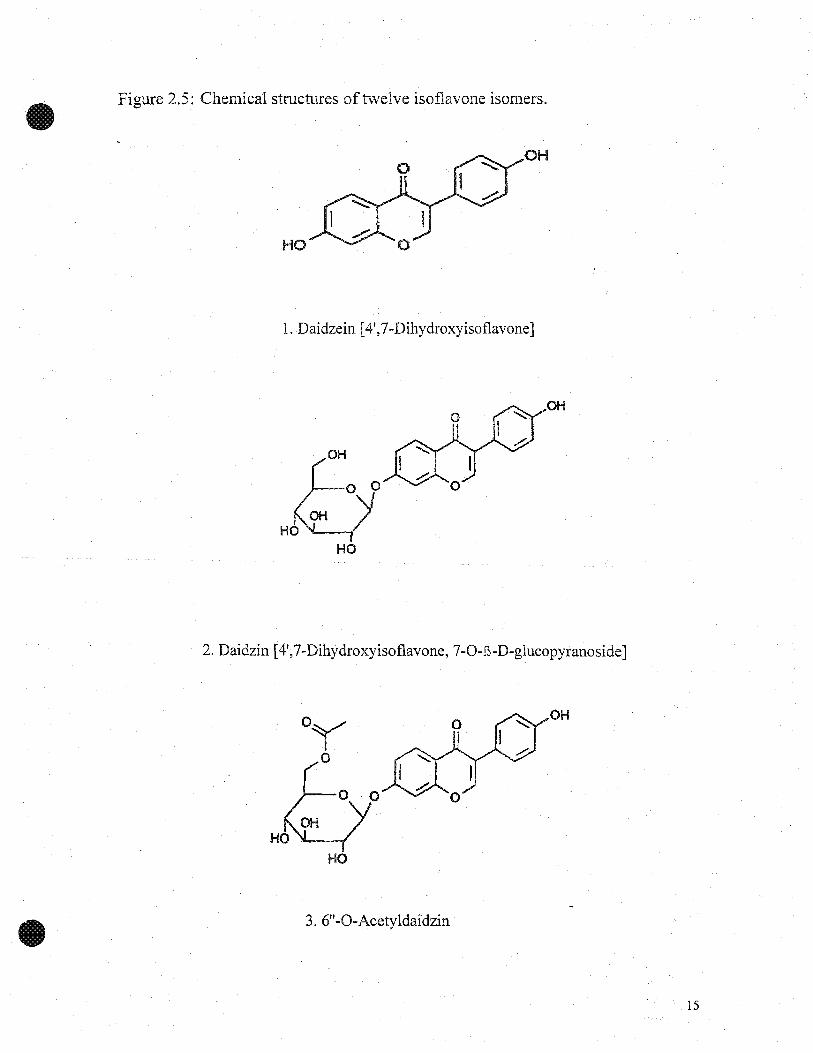
Figure 2.5: Chemical structures oftwelve isoflavone isomers.
HO
OH
1. Daidzein [4',7-Dihydroxyisoflavone]
HO
OH
2. Daidzin [4',7-Dihydroxyisoflavone, 7-0-E-D-glucopyranoside]
HO
3.6"-O-Acetyldaidzin
OH
15

O~COOHo
HO
4.6'-O-Malonyldaidzin
OH
HO
OH
5. Genistein [4',5,7-Trihydroxyisoflavone]
HO
6. Genistin [Genistein, 7-0-B-D-glucopyranoside]
OH
16

HO
7. 6"-O-Acetylgenistin
O~COOHo
HO
8.6"-O-Malonylgenistin
OH
OH
OH
9. Glycitein[4',7-dihydroxy-6-methoxyisoflavème]
17

HO
OH
10. Glycitill [Glycitein, 7-O-~-D-glucopyranoside]
HO
Il. 6"-O-Acetylglycitin
OH
coti
0y MeOo
L o a(OH-yH6~·
HO
12. 6"-0-Malonylglycitin
OH
18

2.3B Importance ofisoflavones insoybean protein foods
- In October 1999, the Food and Drug Administration (FDA) of United States
responded to a petition by Protein Technologies International, (Du Pont Company), by
authorizing health claims for foods containing soybean protein products. The FDA has
tentatively acknowledged that daily intake of 25g, soybean protein included in a diet low
in saturated fat and cholesterol, may reduce the risk of coronary heart diseases (CHD).
The 25g of soybean protein recommended by FDA contain approximate1y 45mg of
isoflavones, mostly genistein and daidzein (Palevitz, 2000).
Isoflavones have received considerable attention in recent years. It has been
hypothesized that isoflavones, which closely resemble estrogenic steroids in structure,
bind to Er-p receptor, bloeking more potent endogenous steroid, and presumably reduce
the risk of hormone dependent tumors (Messina et al, 1994). Isoflavones had stronger
binding affinity for Er-p than for Er-a reeeptor; Er-p is mainly in the brain, vascular
tissues and bone, whereas Er-a is found mainly in breast, ovary and endometrium. Due to
their similarity to estradiol-17B, isoflavones are also known as phytoestrogens (Priee and
Fenwiek, 1985), however, they are weak estrogens with both oestrogenie and anti
oestrogenic activity with between 111,000 and 1/100,000 the activity of estradiol
(Messina et al, 1994). Soybean isoflavones have also been reported to influence growth
factors that regulate cell proliferation (Akiyarnma, 1991), may reduce the risk of
cardiovascular risk factors (Potter, 1998), osteoporosis, and may relieve menopausal
symptoms (Messina, 1999).
19

2.3.IB Coronary heart diseases and isoflavones
Coronary heart diseases (CHD) is a leading cause of morbidity and mortality in
the United State (Greaves et al, 1999). The dietary intake of soybean protein and soy
based food products has been linked to a reduction of CHD. The lower rates of mortality
and morbidity due to CHD in Asian countries, compared with Westem countries (Thom
et al, 1992), may be due to considerably higher intake of soybean protein products in
Asian countries (Adlercreutz, 1990).
Setchell (1985) was the first to suggest that isofiavones contained in soy-protein
foods could contribute to the cholesterol-Iowering effect, since they have weak estrogenic
activity. Evidence supporting this hypothesis has come for several animaIs studies.
Anthony et al, (1997) reported that diets containing intact soy protein isolates (SP+) and
soy protein isolates from which isofiavone phytoestrogens had been removed by ethanol
extraction (SP-) were fed to non-human primates. Estrogen-like effects were observed in
serum lipoproteins in (SP+) fed animaIs showing reduced cholesterol and elevated HDL
levels compared to (SP-) animaIs. In addition, the mean atherosclerotic plaque size was
reduced in (SP+) animaIs suggesting the possibility of antiatherogenic effects caused by
alteration in serum lipoprotein profile.
2.3.2B Isoflavones and cancer
Soybean foods and soybean components have received considerable attention
lately for their potential role in reducing cancer risk. In 1990, a National Cancer Institute
workshop identified severalanti-carcinogens in soybean and recommended thàt the
relationship between soy intake and cancer risk be investigated (Messina and Bames,
1991), with particular interest on anti-cancer effect of soybeans isofiavones (Kennedy,
20

1998). Ingram, (1997) assessed the association between intake of isoflavones and breast
cancer risk and concluded that increased excretion of sorne isoflavones is associated with
a substantial reduction in breast cancer risk. On the contrary Lee et al, (1991) found a
negative association between soy products in premenopausal, but not postmenopausal
women in Singapore.
2AB Adverse effects of isoflavo:nes
In 1940's, several reproductive problems were observed in sheep in Western
Australia, including ovarian cysts, irreversible endometriosis and a failure to conceive
(Bennetts et al, 1946). The condition was named clover disease and was found to be
caused by ingestion of subterranean clover (Trifolium subterraneum) which contains high
levels of isoflavones (Bradbury and White, 1954). Dietary isoflavones have also been
implicated as playing a role in the reproductive failure and liver disease of captive
cheetahs in North America (Setchell et al, 1987).
Sheehan (1999) has indicated that soy isoflavone genistein causes estrogenic
responses in developing and adult animaIs including adult humans, his Research suggest
that during pregnancy in humans, soy isoflavones could be a risk factor for abnormal
brain and reproductive tract development, and that isoflavones may cause thyroid
abnormalities, including goiter and autoimmune thyroiditis. In the same way children
who received soy formulas as infant were twice as likely to develop autoimmune
thyroiditis compared to children who received other types forms of milk (Sheehan, 1999).
The reproductive capacity of Asian women, who have consumed large amount of soy
products as part of their staple diet for generations, does not ap.pear to be affected by the
high levels of isoflavones present in their food (Petrakis et al, 1996).
21
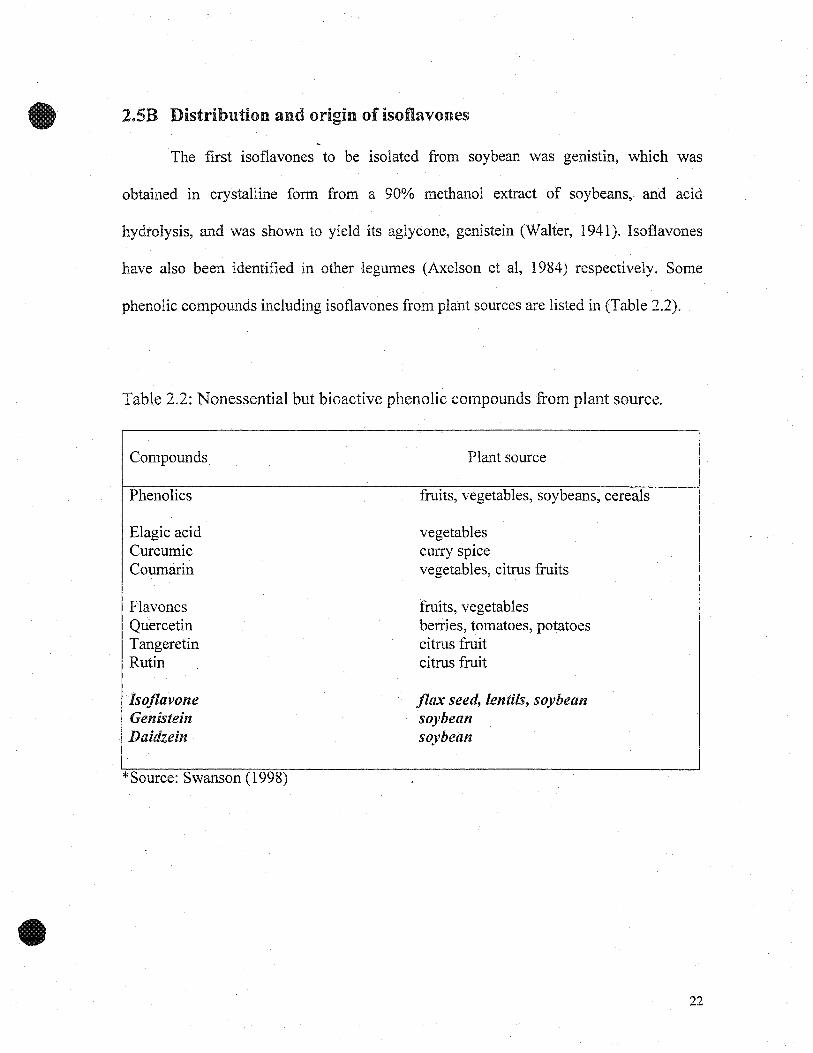
2.5B Distribution and origin of isoflavones
The first isoflavones to be isolated from soybean was genistin, which was
obtained in crystalline form from a 90% methanol extract of soybeans, and acid
hydrolysis, and was shown to yield its aglycone, genistein (Walter, 1941). Isoflavones
have also been identified in other legumes (Axelson et al, 1984) respectively. Sorne
phenolic compounds including isoflavones from plaht sources are listed in (Table 2.2).
Table 2.2: Nonessential but bioactive phenolic compounds from plant source.
Compounds
Phenolics
Elagic acidCurcumicCoumarin
FlavonesQuercetinTangeretinRutin
IsoflavoneGenisteùtDaidzein
*Source: Swanson (1998)
Plant source
fruits, vegetables, soybeans, cereals
vegetablescurry Splcevegetables, citrus fruits
fruits, vegetablesberries, tomatoes, potatoescitrus fruitcitrus fruit
flax seed, lentils, soybeansoybeansoybean
22

2.6B Analysis of isoflavones
Various chromatographie techniques have been employed for the quantitative and
qualitative analysis of soybean isoflavones. However, High Performance Liquid
Chromatography (HPLC) is the method of choice for the analysis of most natural
products. This form of chromatography is fast, most important reproducible, requires
little sample and can be used for both qualitative and quantitative analysis as weIl as
preparative work. A number of HPLC methods have been developed during the past
decade for the determination of isoflavones (Mullner and Sontag, 1999). HPLC with
reversed phase (CI8) column can be directly used for the analysis of isoflavones in free
or conjugated forms without anY derivatization step. This method has been used for the
analysis of isoflavone content in soybean foods (Wang and Murphy, 1994), legumes
(Franke et al, 1994), and soybean infant formula (Murphy et al, 1998).
2.7B Analysis of protein-phenolic interactions
Sorne of the methods used to investigate interactions, for a range of proteins and
phenolic compounds are; a) IH and l3C NMR spectroscopy b) microcalorimetry c)
equilibriurn dialysis d) enzyme kinetics and inhibition (Haslam et al, 1999). However,
examining these effects, we have selected three different analytical techniques:
polyacrylamide gel electrophoresis (PAGE), differentical scanning calorimetry (DSC)
and Fourier transform infrared spectroscopy (FTIR). These techniques have been found
useful for studying various parameters on proteins in aqueous solutions. The objective is
to evaluate the potential of mentioned techniques in studying protein-phenol interactions
and to conclude regarding the mode of interaction between these compounds.
23

CHAPTER NO. 3
DETECTING PROTEIN-PHENOLIC INTERACTION USINGPOLYACRYLAMIDE GEL ELECTROPHORESIS (PAGE)
3.1 MATERIALS AND METHODS
3.1.1 Materials
Bovine serum albumin (BSA) (product A-2153) and p-Lactoglobulin (f}-Lg)
(product L-0130) were obtained from Sigma Chemical Co (St. Louis, MO, USA) and
used as received. Cryoprecipitated soybean glycinin previously prepared in our
laboratory (Ramadan, 2000) and stored at -20°C, were used. 3,4,5-trihydroxybenzoic acid
(gallic acid, product G-7384) and 5,7-dihydroxy 4'-methoxy isoflavone (biochanin A,
product D-2016) were purchased from Sigma Chemical Co (St. Louis, MO, USA). 3,4-
dihydroxy cinnamic acid (caffeic acid, productlI493-0050) and p-hydroxycinnamic acid
(p-coumaric acid, product 12109-0250) were purchased from Acros Organics (New
Jersey, USA). The phenolic standards were stored at room temperature.
3.1.2 Preliminary experiment
The BSA solution (0.05%) was incubated at 35°C, 45°C and 55°C in a 15ml
centrifuge tube with the gallic acid (0.05%) at a ratio of 1:1 in a water bath, for 2h. The
solutions were prepared in phosphate buffer pH 3, 5, 7 and 9, ionic strength (O.OIM),
dilute acid and base were used to adjust the solutions to the desired. BSA with buffer
only at pH 3, 5, 7 and 9 were used as controls in the experiment.
24

3.1.3 Preparation of sol,:dions for preliminary experiment
Solutions were prepared from BSA in phosphate buffer at pH 3, 5, 7 and 9 by
dissolving 6mg BSA in 6ml of each buffer in 15ml centrifuge tube. The gallic acid
solutions were prepared by dissolving 3mg in 3ml of the respective buffer. Gallic acid
was added to heated (100°C) buffer solution for 5min to facilitate solubility and then
cooledto room temperature before incubating with BSA. BSA only was used as controls
with the corresponding buffer. From each solution of BSA and gallic acid, Iml was
mixed at 1:1 ratio in a 15ml centrifuge tube. The final concentration for each reactant in
the solution was (0.05% W/V). For the control, each centrifuge tube contained Iml BSA
and lml of corresponding buffer. The samples were incubated in a water bath at the
desired temperatures (35°C, 45°C and 55°C) for 2h, then cooled to room temperature. A
summary of the preliminary experiment is presented in Figure 3.1.
3.1.4 Preparation of solu.tions for protein-phenolic interactions
The solutions of proteins (BSA, p-Lg and soy glycinin) and phenolic standard
(gallic acid, caffeic acid, p-coumaric acid and biochanin A)were prepared as described in
Section 3.1.3. BSA was incubated with the four phenolic compounds; f3-Lg andsoybean
glycinin was incubated with gallic acid and biochanin A. Compared. to the preliminary
experiment with ,BSA, the concentration was increased three times for P-Lg, and eight
times for soy glycinin, compared to the concentration of BSA, and pH 3 was eliminated.
Due to high concentration of soybean glycinin used, it was not possible to completely
solubilize this protein in the buffer solution. The temperature and time of incubation were
similar to those described in Section 3.1.3.
25
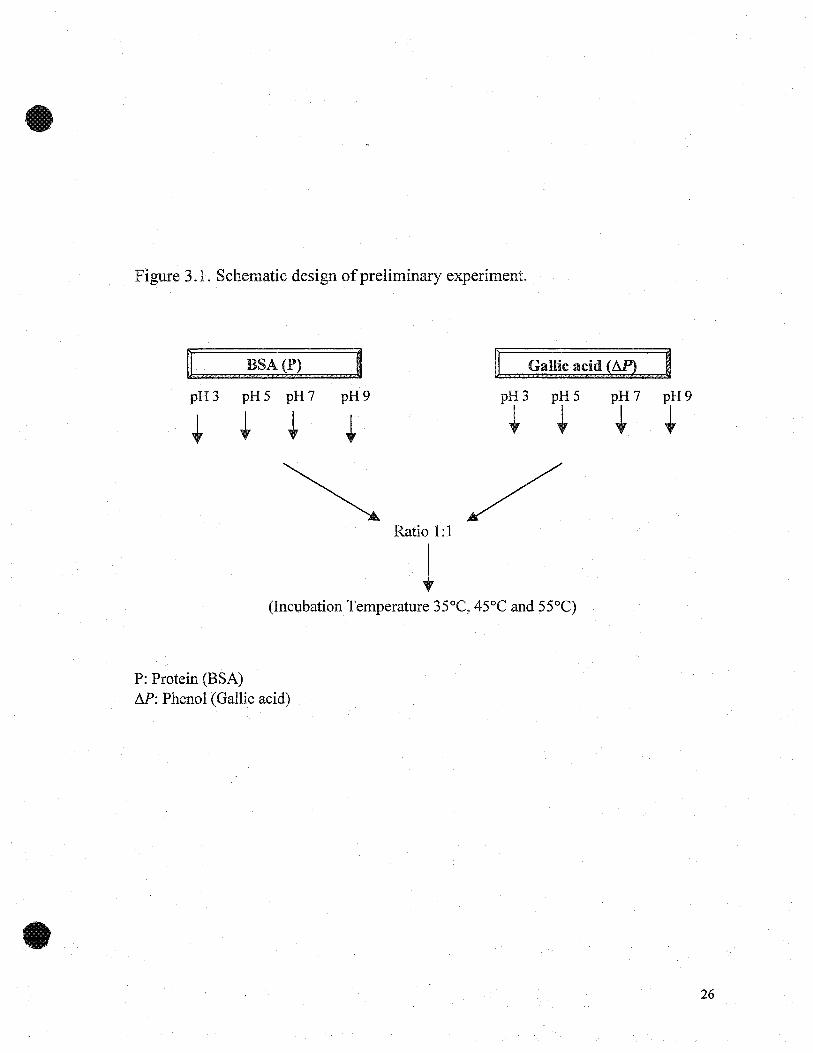
Figure 3.1. Schematic design ofpreliminary experiment.
BSA (P) GaUic acid
pH3 pHS pH7 pH9 pH3 pHS pH7 pH9
+ + + + + + + +
~ /Ratio 1:1
l(Incubation Temperature 35°C, 45°C and 55°C)
P: Protein (BSA)M: Phenol (Gallic acid)
26

3.1.5 Electrophoresis
Sodium Dodecyl Sulphate Polyactylamide Gel Electrophoresis(SDS-PAGE)
SDS-PAGE was performed according to the method of Laemmli (1970) using a
Mini-Protein II electrophoresis cell unit. AIl chemicals were purchased from Bio-Rad
(Mississauga, Ontario, Canada, electrophoresis grade).
3.1.6 SampIe preparation for SDS-PAGE
From the incubated solutions 262~L (containing 0.131 mg BSA) was diluted with
300~L of sarnple buffer (3% SDS, 0.7 M 2-mercaptoethanol, 25 mM Tris-HCI pH 6.8,
1% glycerol and 0.05% bromophenol blue) in a microcentrifuge tube. Samples were
heated at 95°C for 5min in a water bath. The final concentration of the protein was
reached 0.23mg/ml (0.023%).
3.1.7 Concentration of gels and their preparation
Separating gels of 10% concentration and 6.5% concentration stacking gels were
used. Separating gels contained 0.1% (WN) SDS, 16% (VN) glycerol and 0.375 M Tris-
Hel (pH8.8); polymerization was initiated by the addition of 0.25% (WN) ammonium
persulphate (APS) and 0.05% N, N, N', N' tetamethylethylene diamine (TEMED). The
6.5% stacking gel included 0.1 % sns and 0.25 M Tris-HCl (pH 6.8). Polymerization was
catalyzed by the addition of 0.1% APS and 0.1% (VN) TEMED. After mixing the
appropriate amounts of the reagents, the gel solutions were poured between 7 x 8 mm
glass sandwich plates for polymerization. Before pouring the stacking gel, combs were
mounted on the top of the gels to form 10 sample wells. The holding capacitiesof
27

•
individual sample wells were approximately 25~L. After polymerization, the combs were
removed and the sample (lS~L) was applied to the gels. The upper buffer chamber was
then immediately filled with approximately l1Sml of running buffer (SO mM Tris Hel,
pH 8.3, SDS 0.1% and 1.384 M Glycine), until the buffer reached a level halfway
between the short and long plates. The remainder of the buffer was poured into the lower
buffer chamber so that, at least, the bottom 1cm of the gels was covered.
3.1.8 Sample loading
BSA solutions and BSA-gallic acid and solutions for Section 3.1.3 (Figure 3.1)
(lS~L) were loaded into the sample wells using a Hamilton syringe. The following broad
range molecular weight protein standards were also loaded on the gels (lO~L): myosin
(Mw 200kDa), p-galactosidase (Mw 116.SkDa), phosphorylase B (Mw 97.4kDa), serum
albumin (Mw 66.2kDa), ovalbumin (Mw 45kDa), carbonic an1ydrase (Mw 31kDa),
trypsin inhibitor (Mw 21.5kDa), lysozyme (Mw 14.4kDa) and aprotinin (Mw 6.5kDa).
3.1.9 Running conditions
The electrophorectic ron was performed at a constant current of 15milliamps
(mA) per gel. The voltage and power limits were 350V and 15W respectively. To
maintain the temperature at 20°C, the bottom part of the electrophoresis unit was
immersed in a water tub. The power supply was terminated when the tracking dye front
(Bromophenolblue) reached the end of the gel; this took 1h and 17min.
28

3.1.10Protein fixing, staining and destaining solutions
At the completion of the run, the gels were removed from the glass plates and
immersed in a fixing solution (20% VN methanol, 10% VN acetic acid, and 70%
distilled water) for 2h.. The fixing solution was discarded and the protein bands were
stained with 10% (VN) acetic acid, 20% methanol (VN) and 0.1% (WN) Coomassie
Brilliant Blue R250 for 10h. Destaining was accomplished by placing the gels in the
fixing solution repeatedly until the background color was completely removed. The gels
were stored in 7% acetic acid in a refrigerator until they were photographed.
3.1.11Native-PAGE e1edrophoresis
Native electrophoresis was carried out according to the method described by
Davis (1964) with sorne modifications. Electrophoresis was carried out on Mini Protein II
electrophoresis cell unit (Bio"'Rad, Hercules, CA).
3.1.12Sample preparation
A total of 612J.!L from the incubated stock solution, containing 0.306mg of
protein was mixed with 300J.!L ofsample buffer (0.3 M Tris-HCl, pH 8.8, 10% glycerol
and 25mg/ml bromophenol blue) to give a final protein concentration of 0.33mg/ml
approximately 0.033%.
3.1.13Gel concentration and preparation
A 10% separating and 6.5% stacking gel were used. Polymerization was initiated
by the addition of 0.25% (WN) ammonium persulphate (APS) and 0.05% TEMED for
29

separating gel and 0.1% (WN) APS and 0.1% TEMED respectively. Gel preparation and
sample loading were similar as described in the previous Section 3.1.7.
3.1.14Electrophoresis conditions
The running conditions were similar to those described for SDS-PAGE, except
that SDS was not the part of running buffer. A constant CUITent of 7.5 mA per gel was
applied. The time of the electrophorctic run was 2hand 45min for BSA and ~-Lg, and 3h
and 30min for soybean glycinin. The power limits and temperature was similar to that
described in Section 3.1.9.
3.1.15Protein fixing, staining and destaining solutions
Proteins fixing, staining and destaining was performed as described in Section
3.1.10.
3.2 RESULTS AND DISCUSSIONS
3.2.1 Effect of pH on color changes of phenolic compounds
Visual color changes were observed for the protein-phenol solutions at the
different pH and incubation temperatures; no such changes were observed with the
solution containing protein alone, suggesting that the color changes were due to the
phenolic compounds. At 45°C, the proteins-gallic acid solutions changed to light green at
pH 7.0 and dark green at pH 9.0; the color was intense at incubation temperature of 55°C.
Friedman and Juergens (2000) reported that resonance, hydrogen-bonding, hydrated
structure and colors of phenolic compounds are strongly influenced by pH. Our
observation suggest that gallic acid was unstable at pH 9, based on visual color changes.
30
Protein-caffeic add solutions incubated for 2h, at 45°C also changed color to reddish pink
at pH 7 and 9.0, the change in the color was more intense at 55°C. The stability of caffeic
add is strongly influenced by pH in the range of7-11 (Friedman and Juergens, 2000). No
changes in color were observed for the solutions of proteins-p-coumaric add at any
incubation temperature and pH. P-coumaric acid, with a single hydroxyl group (Figure
3.2), was found to be more stable at high pH (Friedman and Juergens, 2000). No color
changes were observed for the proteins-biochanin A solution. Biochanin A has a complex
multiring aromatic structure (Figure 2.3) and is more stabV~ to pH changes than the
monoring phenolic compounds (Friedman and Juergens, 2000); this explains the
observation that no coler changes were observed for biochanin A at any pH range and
incubation temperatures.
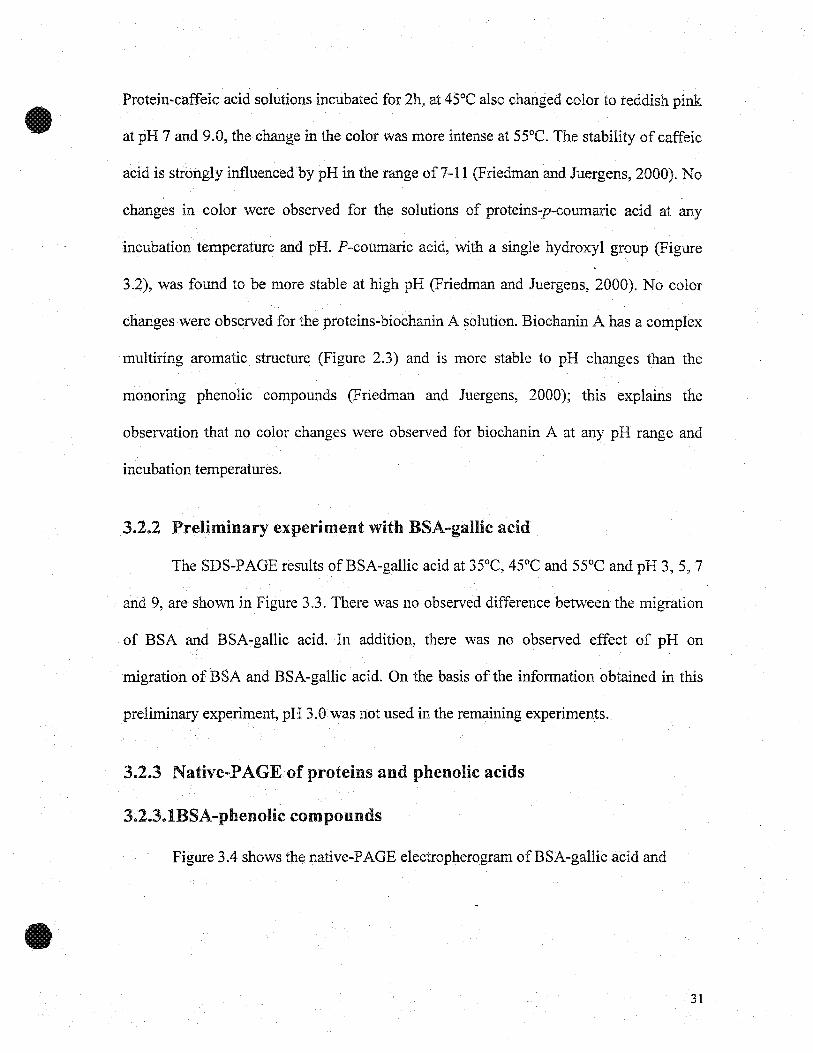
3.2.2 Preliminary experiment with BSA-galIic acid
The SDS-PAGE results of BSA-gallic acid at 35°C, 45°C and 55°C and pH 3,5, 7
and 9, are shown in.Figure 3.3. There was no observed difference betweenthe migration
of BSA and BSA-gallic acid. In addition, there was no observed effect of pH on
migration of BSA and BSA-gallic add. On the basis of the information obtained in this
preliminary experiment, pH 3.0 was not used in the remaining experiments.
3.2.3 Native-PAGE of proteins and phenolic acids
3.2.3.1BSA-phenolic compounds
Figure 3.4 shows the native-PAGE electropherogram of BSA-gallic acid and
31

Figure 3.2: Molecular structure of: a) gallic acid b) caffeic acid and c) p-coumaricacid.
COOH
HO
___-.~ a) Gallic acid
OH
OH
CH. CHCCDH
----.~ b) Caffeic acid
OH
OH
CH CHCCDH
----.~ c) P-coumaric acid
OH
32

Figure 3.3: Electropherogram (SDS-PAGE) ofBSA at pH 3,5,7 and 9 incubated at35°C, 45°C and 55°C. A', B' and C': BSA-gallic add and A, Band C: BSA alone.
BSA55°C
Standard
Myosin~-galatosidase
phosphorylase BSerum albuminOvalbumin
Carbonic anlydraseTrypsin inhinitor
LysozymeAprotinin
33

BSA. BSA-gallic acid showed relatively higher migration than BSA alone at an pHs and
aU temperatures (Table 3.1). The maximum difference in relative mobility (Rf) was
between BSA and BSA-gallic acid incubated at 45°C and 55°C at pH 7 and 9. The only
difference in migration at pH 5 was observed at incubation temperature of 45°C; the Rf
shifted fromO.35 to 0.36. The difference in relative mobilities can explain the increase in
net negative (-) charge on the native BSA molecule, as a result of gallic acid, as the
migration of the protein in native-PAGE is dependent on the charge of the protein
molecule. BSA alone incubated at 55°C, at pH 7 and 9 (Figure 3.4, B and C) showed
loss of band intensities with the corresponding appearance of slower migration bands;
these bands are very likely aggregation bands of BSA. BSA-gallic acid did not show the
slower migration bands (Figure 3.4, B' and C), suggesting that the gallic acid inhibited
the aggregation of BSA. BSA starts unfolding with subsequent denaturation and
aggregation; these changes are affected by the pH of the medium. Some proteins are
known to be relatively stable with in a narrow pH range (4-7), however, exposure to pH
outside this ranges often cause denaturation and subsequently aggregation of the proteins
(Boye et al, 1996). The absence of aggregation bands of BSA-gallic acid is the indication
of the protective effect against aggregation by the gallic acid. It shouldbe mentioned that
the unlcnown protein bands in Figure 3.4 is a protein impurity in the BSA standard and
not an aggregatïon band. Inhibition of aggregation suggests that the hydroxyl groups of
gallic acid can bind simultaneously at more than one site on the BSA molecule, this can
prevent the unfolding of the BSA molecule.
Figures 3.5 shows BSA and BSA-caffeic acid incubated at 34°C, 45°C and 55°C.
There were differences in mobility between BSA and BSA-caffeic acid (Table 3.2), for
34

Figure 3.4: Electropherogram (native-PAGE) ofBSA at pH 5, 7 and 9 incubatedat 35°C, 45°C and 55°C. A', B' and C': BSA-gallic acid and A, Band C: BSA alone.
Std
Unknownprotein band
BSA55°C
Aggregation
BSA
35

Table 3.1: Relative mobility (Rf, native-PAGE) of BSA incubated with gallic acidat 35°C, 45°C and 55°C.
RfpH Compounds
35°C 45°C 55°C
BSA-gallic acid (A') 0.41 0.36 0.41pH 5.0
BSA (A) 0.41 0.35 0.41
BSA-gallic acid (B') 0.43 0.38 0.43pH 7.0
BSA (B) 0.40 0.35 0.40
BSA-gallic acid (C') 0.44 0.38 0.44pH 9.0
BSA (C) 0.41 0.35 0.41
36

Figure 3.5: Electropherogram-(native-PAGE) ofBSA at pH 5, 7 and 9 incubated at35°C, 45°C and 55°C. A', B' and C': BSA-caffeic acid and A, Band C: BSA alone.
pH
Temp 35
C c' B B' A A'
7 5
cc' B S'A,A'
C C· B B' A A'
BSA45°C
BSA55°C
I!I'
pH
pH 9 7
7 5
5
AggregationBSA
Temp 55
37

Table 3.2: Relative mobility (Rf, native-PAGE) of BSA incubated with caffeicacid at 35°C, 45°C and 55°C.
RfpH Compounds
35°C 45°C 55°C
BSA-caffeic acid (A') 0.42 0.47 0.48pH 5.0
BSA (A) 0.42 0.47 0.48
BSA-caffeic acid (B') 0.44 0.49 0.51pH 7.0
BSA (B) 0.42 0.46 0.48
BSA-caffeic acid (C') 0.45 0.5 0.52pH 9.0
BSA (C) 0.42 0.46 0.48
38

Figure 3.6: Electropherogram (native-PAGE) ofBSA at pH 5, 7 and 9 incubated at35°C, 45°C and 55°C. A', B' and C': BSA-p-coumaric acid and A, Band C: BSAalone. .
C C' B B' A A'BSA55°C
•pH 9Temp 55
7 6
39

•
Table 3.3: Relative mobility (Rf, native-PAGE) of BSA incubated with pcoumaric acid at 35°C, 45°C and 55°C.
RfpH Compounds
35°C 45°C 55°C
BSA- p-coumaric acid (A') 0.44 0.41 0.44pH 5.0
BSA (A) 0.44 0.41 0.44
BSA- p-coumaric acid (B') 0.44 0.41 0.45pH 7.0
BSA (B) 0.44 0.41 0.44
BSA- p-coumaric acid (C') 0.44 0.42 0.44pH 9.0
BSA (C) 0.44 0.41 0.46
40

Figure 3.7: Electropherogram (native-PAGE) ofBSA at pH 5, 7 and 9 incubated at35°C, 45°C and 55°C. A', B' and C':.BSA-biochanin A and A, Band C: BSA alone.
• B B'A A'
BSA55°C
..-
55
_________-+..- AggregationC c' B B' A A'
41
•
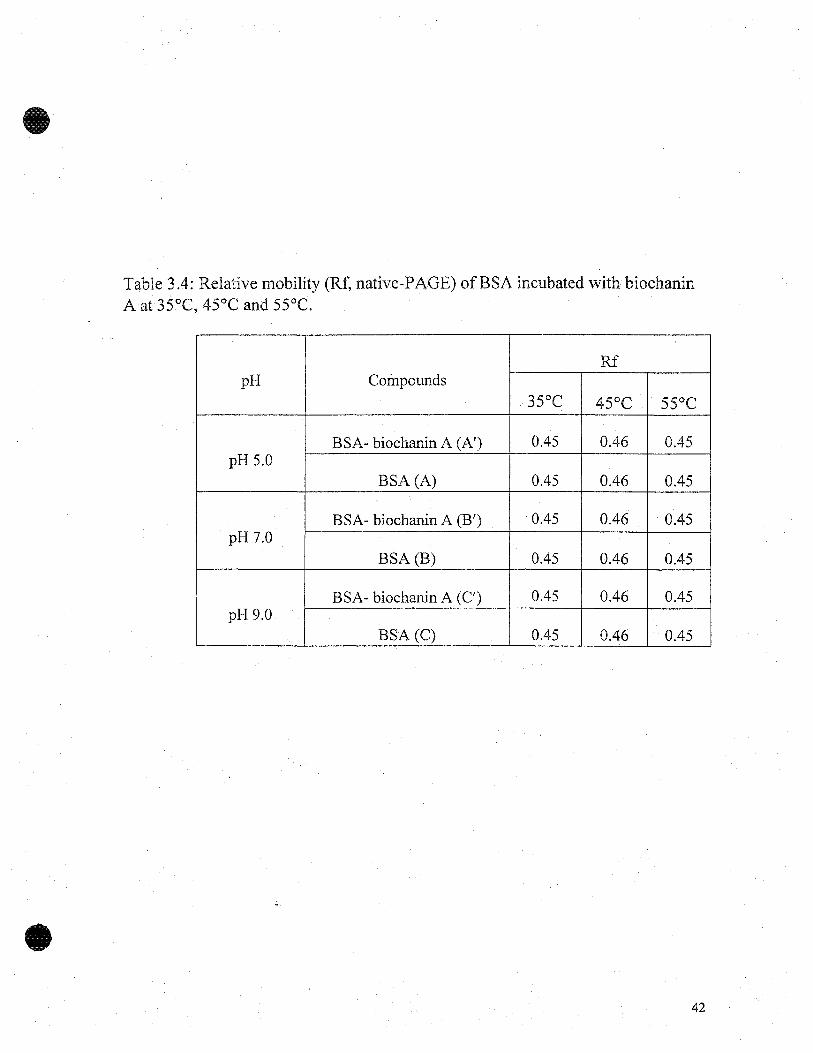
Table 3.4: Relative mobility (Rf, native-PAGE) ofBSA incubated with biochaninA at 35°C, 45°C and 55°C.
RfpH Compounds
35°C 45°C 55°C
BSA- biochanin A (A') 0.45 0.46 0.45pH 5.0
BSA (A) 0.45 0.46 0.45
BSA- biochanin A (B') 0.45 0.46 0.45pH 7.0
BSA (B) 0.45 0.46 0.45
BSA- biochanin A (C') 0.45 0.46 0.45pH 9.0
BSA (C) 0.45 0.46 0.45
42

pH 7 and 9 and an incubation temperatures. The Rf for BSA, at pH 9 in the presence.of
gallic acid, increased from 0.42 to 0.45 at 35°C; from 0.46 to 0.5 at 45°C, and from 0.48
to 0.52 at 55°C temperature. The effect of caffeic acid on the aggregation bands of BSA
at 55°C were similar to gallic acid. Table 3.3 shows the relative mobility of BSA and
BSA-p-coumaric acid. The Rf for BSA, at incubation temperature of ?5°C, increased
from 0.44 to 0.45 at pH 7 and 0.44 to 0.46 at pH 9, respectively. P-coumaric acid also
showed inhibition of aggregation bands at 55°C, however, overall difference was not as
significant compared to both gallic and caffeic acid (Figure 3.6).
Figure 3.7 shows the electropherogram of BSA and BSA-biochanin A; there was
no marked difference between their relative mobilities (Table 3.4). The Rf calculated for
both BSA and BSA-biochanin A incubated at 45°C, was slightly higher than at 35°C and
55°C. Though, aggregation ofBSA at 55°C was inhibited in the presence ofbiochanin A.
3.2.3.2~-Lg with gallic acid and biochanin A
Figure 3.8 shows the electropherograms of ~-Lg-gallic acid and ~-Lg alone at
55°C. ~-Lg show two bands; designated as variant A and variant B. ~-Lg-gallic acid
showed substantial differences in migration than the ones alone. For ~-Lg-gallic acid
migration was greater to an extent that the bands diffused and the two variants could not
be distinguished. No difference was observed between ~-Lg and ~-Lg-biochaninA. The
slower migration band appearing above the two variants is attributed to dimer of ~-Lg;
not the aggregation band since ~-Lg has a denaturation temperature above 67°C (Boye
and Alli, 2000).
43

Figure 3.8: Electropherogram (native-PAGE) of B-Lg at pH 5, 7 and 9 incubatedat and 55°C with gallic acid (1) and biochanin A (II). A', B' and C': B-Ig-gallicadd and A, B and C: B-Lg alone.
Dimer
Variant AVariant B
p-Lg55°C
pH
cc
II
Dimer
"-----"-!Ill> Variant A
Variant B
44

Figure 3.9: Electropherogram (native-PAGE) of soybean glycinin at pH 7 and 9incubated at 35°C, 45°C and 55°C with gallic acid (1) and biochanin A (II). A',B',C', D', E' and F': soybean glycinin-gallic acid and A, B, C, D, E and F: soybeanglycinin.
Soybeanglycinin35°C, 45°Cand 55°C
Soybeanglycinin35°C, 45°Cand 55°C
~
1
II
45
Aggregati01Glycinin

3.2.3.3Soybean glycinin with gallic acid and biochanin A
The electropherogram of soybean glycinin, glycinin-gallic açid and glycinin
biochanin A is shown in Figure 3.9. The results show two discrete bands; one
representing glycinin and the other aggregate of glycinin. There was no noticeable
difference in the relative migration between glycinin, glycinin-gallic acid and glycinin
biochanin A. The intensities of glycinin treated with gallic acid was less compared to
glycinin band alone. The difference in the intensities can be a result of glycinin-gallic
acid complexation, which can have resulted in precipitation of the glycinin. However, no
difference was observed for the glycinin treated with biochanin A.
3.3 Conclusion
Potein-phenol binding was measured for a range of phenols and proteins. Native
PAGE was used successfully to identify effect of phenolic compounds on protein
characteristics. Protein aggregation at 55°C was found to be inhibited by the presence of
phenolic compounds. This protective effect was obtained with the four phenolic
compounds investigated. On the basis of the observation on the effect of migration of
BSA, it appears that inhibition can occur without changes on the charge properties of the
BSA.
46

CHAPTER NO. 4
STUDYING PROTEIN-PHENOLIC "INTERACTION USINGDIFFERENTIAL SCANNING CALORIMETRY (DSC) ANDFOURIER TRANSFORM INFRARED SPECTROSCOPY (FTIR)
4.1 MATERIALS AND METHODS
4.1.1 Materials
Bovine serum albumin (BSA), p-lactoglobulin (P-Lg), and cryoprecipitated soy
glycinin, 3,4,5 trihydroxybenzoic acid (gallic acid) and 5,7-dihydroxy4'-methoxy
isoflavone (biochanin A) used in Section 3.1.1 of Chapter 3 were used.
4.1.2 Sampie preparation for DSC
Untreated proteins (BSA and P-Lg, 20%, without gallic acid and biochanin A)
were dissolved in phosphate buffer (pH 5, 7 and 9) ionic strength (O.OlM). Soybean
glycinin was dissolved in pH 7 and 9 buffer only. Proteins (20mg/50f..l.l buffer) and gallic
acid and biochanin A (lmg/50f..l.l buffer) solutions were mixed to give final protein
concentration of 20% containing 1% gallic and biochanin A. The gallic acid and
biochanin A solutions were heated (100°C) in water bath for 7min for solubilization then
cooled toroom temperature, before reacting with protein solutions.
4.1.3 Differèntial Scanning Calorimetry
A DifferentiaI scanning calorimeter equipped with TC Il processor (Mittler TA
3000, Mettler Instrument Corporation, Greitensee, Switzerland) was used to study the
effect of gallic acid and biochanin A on the denaturation charaeteristics of BSA, p-Lg
and soybean glycinin. Bach 12jll of solution were placed in preweighed DSC pans, wIDch
47

was same for both BSA, p-Lg and for soybean glycinin 70111 (medium pressure Dse
pans). The samples were placed in the Dse and scanned from 300 e to 900 e for BSA and
p-Lg and 400 e to 1200 e for soy glycinin at a programmed heating rate of IOoe/min. For
each run, a sample pan containing the buffer used for dissolving the protein, was used as
reference. After heating, the samples were allowed to cool to room temperature in the
DSC and the heating cycle was repeated under the same experimental conditions. The
DSC was calibrated by using indium standards. AlI DSe experiments was done in
duplicate.
4.1.4 Sample preparation for FTIR
BSA and soybean glycinin (10% WN) samples were dissolved in deuterium
oxide containing O.OlM phosphate buffer at pH 7 and 9. Gallic acid and biochanin A
were dissolved in phosphate buffer pH 7 and 9 (1mg/SOJ.ll); the phosphate buffer was
initially freeze dried and water replaced with deuterium oxide. Proteins (10mg/SOJ.lI
buffer) and gallic acid and biochanin A (1mgllJ.lm buffer) solutions were mixed together
to have a final protein concentration of 10% containing 1% gallic acid and biochanin A.
4.1.5 Fourier Transform Infrared Spectroscopy
FTIR analysis was performed on BSA and soybean glycinin to investigate the
effect of gallic acid and biochanin A on the secondary structure of the proteins. An
infrared spectrum was recorded with a 821 OE Nicolet FTIR spectrometer equipped with a
deuterated triglycine sulfate detector. A total of 512 scans were averaged at 4 cm- l
resolution. Wavelength accuracy was with in ±1 O.Olcm-'. The spectrometer was purged
with dry air from a Balston dryer (Balston, Haverhill, MA, USA) the samples were held
48

in an IR cell with a 50llm path length and CaP windows. The temperature of the sample
was regulated by placing the cell in a holder employing an Omega temperature controller
(Omega Engineering, Laval, QC, Canada). The temperature was increased in 5°C
increments, and the cell allowed to equilibrate for 3min prior to data acquisition.
Deeonvolution of the observed infrared speetra was performed using the Nieolet FTIR
software, Omnie l.2a. AIl FTIR experiments were done in duplicate.
4.2 RESULTS AND DISCUSSIONS
4.2.1 Effect gallic acid and biochanin A on thermal characteristics ofBSA
The effects of pH on DSC eharaeteristics of BSA withand without gallic acid are
shown in Figures 4.1 and 4.2 and Table 4.1. At pH 5 the denaturation temperature (Td)
peak ofBSA was at 61.8±Ü.2°C, which was inereased to 62.ü±ü.l°C for BSA-gallic acid.
At pH 7, Td for BSA was at 58.2±O.loC and 62.7±ü.1 OC for BSA-gallic acid. At pH 9,
Td for BSAwas at 57.8±ü.3°C and 62.6±0.2°C for BSA-gaIlie aeid. The enthalpies (L\H)
for BSA alone were 1.6±ü.ü2 J/g, 1.1±ü.ü4 J/g and 1.4±ü.ü2 J/g at pH 5, 7 and 9,
respectively, however, enthalpies for BSA-gallie acid increased to 1.7±ü.ü2 J/g, 1.8±Ü.03
J/g, and 1.6±O.Ü2 J/g at pH 5, 7 and 9, respectively. This data suggest that BSA-gallic
acid showed greater thermal stability, than BSA at pH 7 and 9, but not at pH 5. The
transition temperature of eaeh domain in the order in which the domains unfold within a
protein, has been reported to change with environment sueh as pH (Boye et al, 1999). The
higher thermal denaturation temperature of BSA-gallic acid indicates higher thermal
stability. This is consistent with the electrophoresis results, which demonstrated that
49
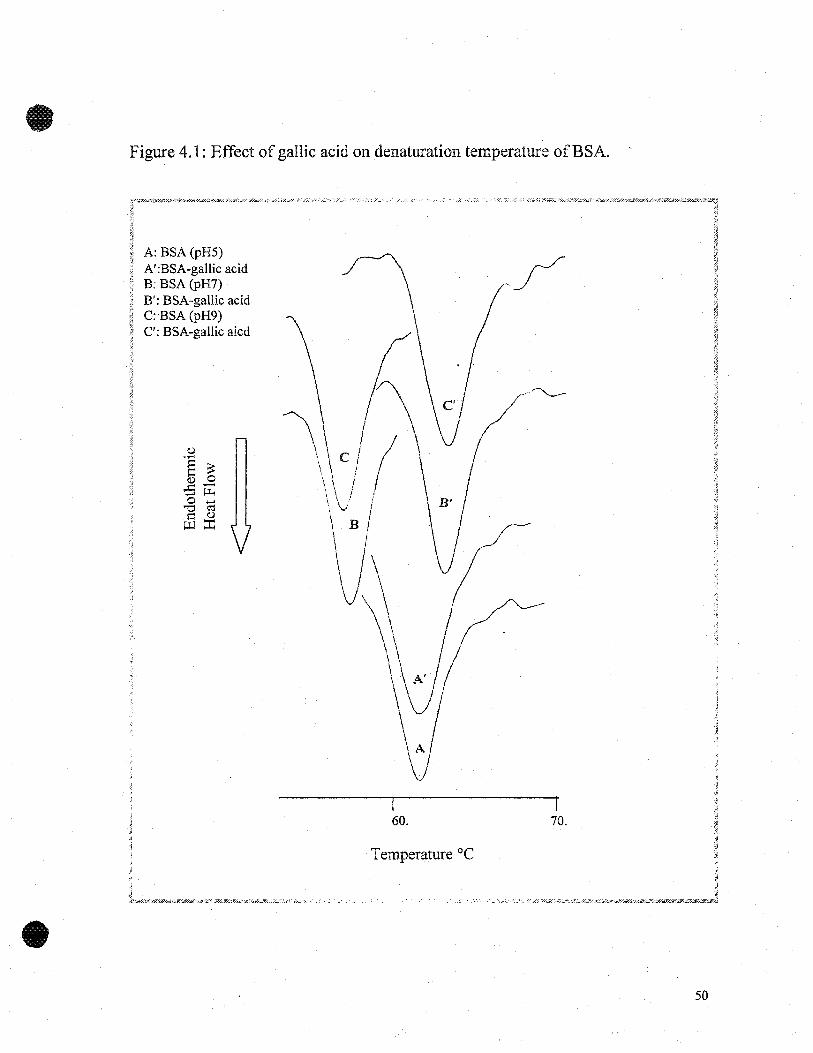
Figure 4.1: Effeet of gallie acid on denaturation temperature ofBSA. -
A: BSA (pHS)A':BSA-gaUic acidB:BSA (PH7)B': BSA-gaUic acidC: BSA (PH9)C': BSA-gallic aicd
•
1
60.
Temperature oC
1
70.
50

Figure 4.2: Effect of gallic acid on the denaturation temperature ofBSA.
1197
".",.,." ... , M"·'·",,,,· "!Il!
5
.. B5A
, , .:.IiIl ' , B5A-gallic Acid
61 ~
1
59 ~1
1
57 ~1
155 7:_~__--,--_-'c--_---;~~ ~~_-,--__
3
"'C.......
pH
51

Figure 4.3: Effect ofbiochanin A on denaturation ternperature ofBSA.
A: BSA(PH5)A':BSA-biochanin AB: BSA(pH7)B': BSA-biochanin AC: BSA(pH9)C': BSA-biochanin A
60.
Temperature oC
1
70.
52

Figure 4.4: Effeet ofbioehanin A on denaturation temperature ofBSA.
11
... BSA
•• -Ji •• BSA-biochanin A
975
1= .• • - • - • -•••••••• - - •••• i!I!
"Â
65 l64 l
63 J1
62 ~!
61 ~1
~ 60 l:: j57 1
1
56 ~
55 +i-----;--~----------,---------_____r--3
pH
53

Table 4.1: Effect of gallic acid and biochanin A on denaturation temperature (Td)and enthalpy (Lill:) ofBSA.
Treatment Denaturation Temperature Enthalpy(PH) (Td OC) (L1H)
BSA
pH5 61.8 ±0.2°C 1.6±0.02 J/g
pH7 58.2±0.1°C 1.1±0.04 J/g
pH9 57.8±0.3°C 1.4±0.02 J/g
BSA-gallic acid
pH5 62.0±0.1°C 1.7±0.02 J/g
pH7 62.7±0.1°C 1.8±0.03 J/g
pH9 62.6±0.2°C 1.6±0.02 J/g
BSA-biochanin A
pH5 60.3±0.1°C 1.3±0.02 J/g
pH7 59.8±0.1°C 1.1±0.03 J/g
pH9 59.8±0.2°C 1.2±0.02 J/g
54
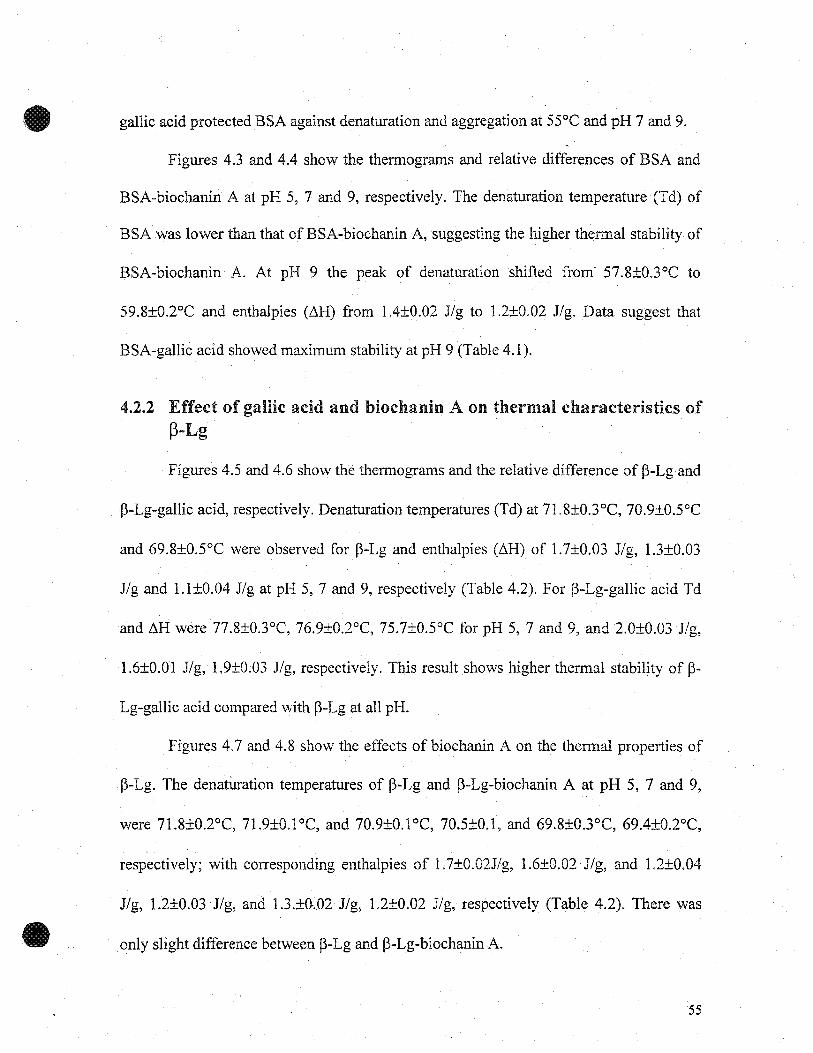
gallic acid protected BSA against denaturation and aggregation at 55°C and pH 7 and 9.
Figures 4.3 and 4.4 show the thermograrns and relative differences of BSA and
BSA-biochanin A at pH 5, 7 and 9, respectively. The denaturation temperature (Td) of
BSA was lower than that of BSA-biochanin A, suggesting the higher thermal stability of
BSA-biochanin A. At pH 9 the peak of denaturation shifted from' 57.8±O.3°C to
59.8±O.2°C and enthalpies (ôH) from 1.4±O.02 J/g to 1.2±O.02 J/g. Data suggest that
BSA-gallic acid showed maximum stability at pH 9 (Table 4.1).
4.2.2 Effect of gallic acid and biochanin A on thermal characteristics of~-Lg
Figures 4.5 and 4.6 show the thermograms and the relative difference of ~-Lg and
~-Lg-gallic acid, respectively. Denaturation temperatures (Td) at 71.8±O.3°C, 70.9±O.5°C
and 69.8±O.5°C were observed for ~-Lg and enthalpies (ôH) of 1.7±O.03 J/g, 1.3±O.03
J/g and 1.1±O.04 J/g at pH 5, 7 and 9, respectively (Table 4.2). For ~-Lg-gaIlic acid Td
and ôH were 77.8±0.3°C, 76.9±O.2°C, 75.7±Ü.5°C for pH 5, 7 and 9, and 2.0±O.Ü3 J/g,
1.6±O.Ol J/g, 1.9±O.03 J/g, respectively. This result shows higher thermal stability of ~-
Lg-gallic acid compared viîth ~-Lg at aIl pH.
Figures 4.7 and 4.8 show the effects of biochanin A on the thermal properties of
~-Lg. The denatirration temperatures of ~-Lg and ~-Lg-biochanin A at pH 5, 7 and 9,
were 71.8±O.2°C, 71.9±Ü.1°C, and 7ü.9±O.loC, 70.5±O.l, and 69.8±Ü.3°C, 69.4±O.2°C,
respectively; with corresponding enthalpies of 1.7±ü.02J/g, 1.6±O.02 J/g, and 1.2±Ü.04
J/g, 1.2±Ü.03 J/g, and 1.3.±O.02 J/g, 1.2±ü.02 J/g, respectively (Table 4.2). There was
.only slight difference between ~-Lg and ~-Lg-biochanin A.
55

Figure 4.5: Effect of gallic acid on denaturation temperature of P-Lg.
1
80.1
70.
A: ~-lg (pHS)A':~-lg-gallic acidB: ~-lg (pH7)B': ~-lg-gallic acidc: ~-lg (pH9)C': ~-lg-gallic acid
Temperature oC
56

Figure 4.6: Effeet of gallie acid on denaturation temperature of ~-Lg.
, 11
'" b-Ig
. - Il .. b-Ig-gallic acid
975
A--__-....-__
• -----..
III· •.. _. _.... __ . _III_ ......... .--.. - - -III
79
77
75
73
71
69
67
65 -'-----------,-~~-------:-----~------_,____-------------
3
pH
57

Figure 4.7: Effect ofhiochanin A on denaturation temperature of ~-Lg.
1
80.1
70.
A: ~-lg (pH5)A':~-lg-biochanin AB: ~-lg (pH7)B': ~-lg-biochanin Ac: ~-lg (pH9)C': ~-lg-biochanin A
Temperature oC
58
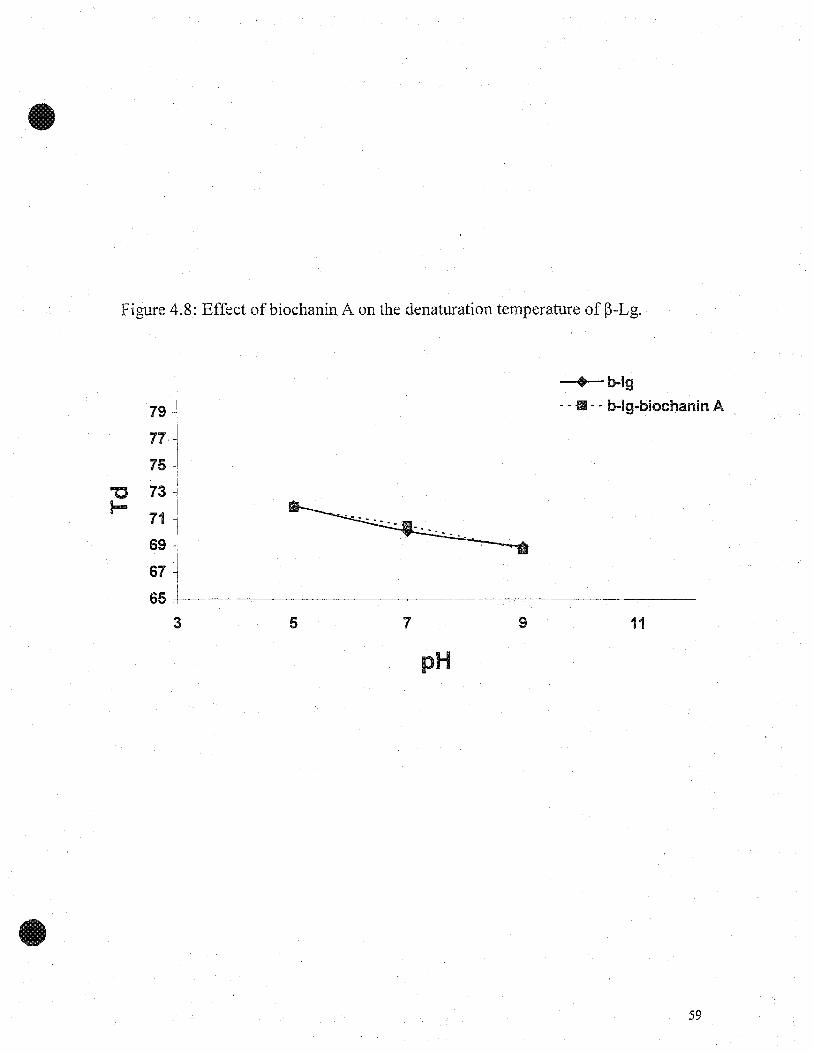
Figure 4.8: Effect ofhiochanin A on the denaturation temperature of ~-Lg.
• b-Ig
79 j .. Il, . b-Ig-biochanin A
77
75 J1
"C 73 J,1- 71 J
1 ...69 ~
67 ~1
65 1
3 5 7 9 11
pH
59

Table 4.2: Effeet of gallie acid and bioehanin A on denaturation temperature (Td)and enthalpy MI of ~-Lg.
Treatment(PH)
Denaturation Temperature(Td OC)
Enthalpy(~H)
~-Lg
pH 5 71.8 ±O.2°C 1.7±O.02 J/g
pH7 70.9±O.loC 1.2±O.04 J/g
pH9 69.8±O.3°C 1.3±O.02 J/g
~-Lg-gallic acid
pH5 77.8±O.PC 1.8±O.02 J/g
pH7 76.9±O.loC 1.6±O.03 J/g
pH9 75.7±O.2°C 1.9±O.02 J/g
~-Lg-biochanin A
pH5 71.9±O.loC 1.6±O.02 J/g
pH7 70.5±O.loC 1.2±O.03 J/g
pH9 69.4±O.2°C 1.2±O.02 J/g
60

4.2.3 Effect of gaUic add and biochanin A on thermal properties ofsoybean glydnin
The thennal properties of soybean glycinin and glycinin-gallic acid at pH 7 and 9
are shown in the DSC thermogram (Figures 4.9). Soybean glycinin exhibited only one
endothermic transition peak confirming the homogeneity of the protein. The denaturation
temperatute (Td) for glycinin-gallic acid was higher by 3°C (92.5±0. PC to 96.0±0.I°C)
at pH 7, and by 2.7°C (92.4±0.3°C to 95.1±0.2°C) at pH 9, respectively, compared to
glycinin alone (Table 4.3). The enthalplies (~H) for glycinin and glycinin-gallic acid
were 2.1±0.04 J/g and 3.1±0.03 J/g at pH7, and 2.4±0.02 J/g and 3.0±0.02 J/g at pH 9"
respectively. The higher denaturation temperature reflects higher thermal stability of
glycinin-gallic acid, compared to glycinin alone.·
Figure 4.10 shows the denaturation temperatures (Td) of glycinin and glycinin-
biochanin A; the Td values were similar (92.5±0.I°C and 92.7±0.I°C at pH 7, and
92.4±0.2°C to 93±0.I°C at pH 9, respectively). The ~H for glycinin and glycinin-
biochanin A were 2.1 ±0.04 J/g and 2.2±0.03 J/g at pH 7, and 2.4±0.02 J/g and 2.2±0.02
J/g at pH 9 (Table 4.3).
Both Td and ~H of soybean glycinin increased in the presence of gallic acid
indicating conformational structural changes of soybean glycinin, possibly result in the
formation of protein-phenolic complexes through hydrogen bonding and hydrophobie
interaction, these conformational changes were notobserved in the presence ofbiochanin
A.'
61

Figure 4.9: Effeet of gallie acid on thermal denaturation of soybean glycinin.
A: Glycinin (pH5)A': Glycinin-gallicacidB: Glycinin (pH7)B': Glycinin-gallicacid
1
90.1
100.
Temperature oC
-
62
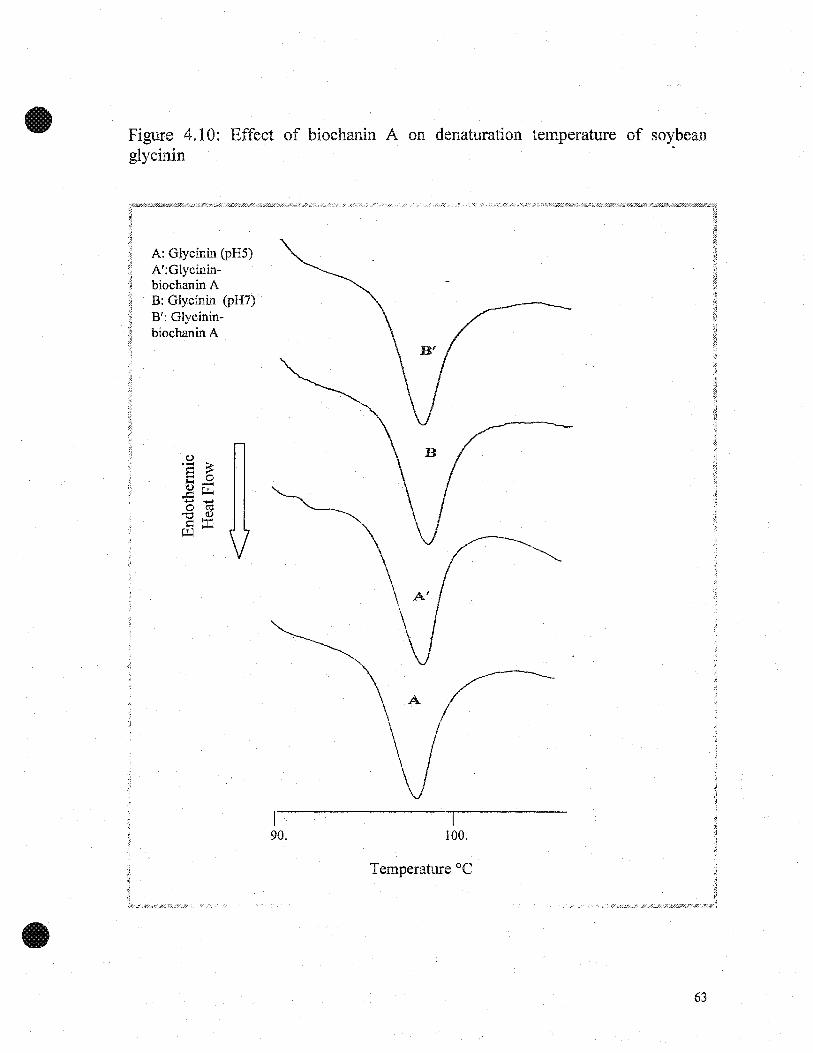
Figure 4.10: Effect of biochanin A on denaturation temperature of soybeanglycinin
1
100.
Ar--V
Temperature oC
1
90.
A: Glycinin (pH5)A':Glycininbiochanin AB: Glycinin (pH7)Br: Glycininbiochanin A
63
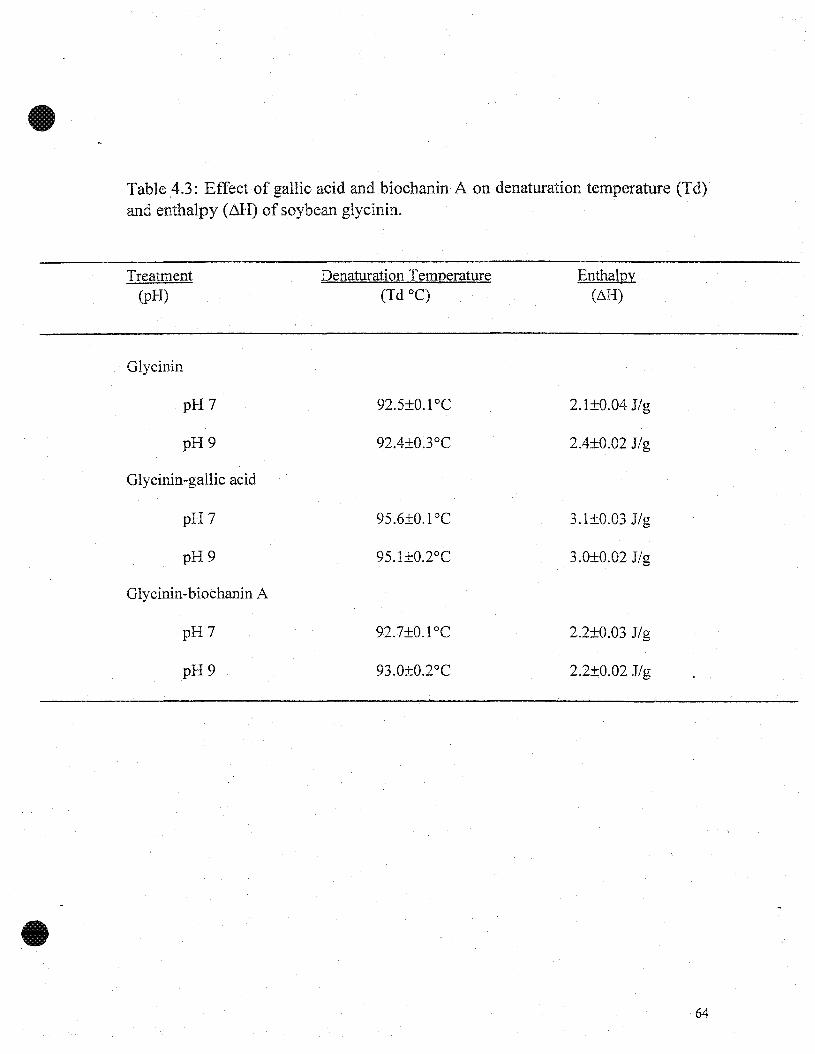
Table 4.3: Effect of gallic acid and biochanin A on denaturation temperature (Td)·and enthalpy (MI) of soybean glycinin.
Treatment(PH)
Denaturation Temperature(Td OC)
Enthalpy(ilH)
Glycinin
pH? 92.5±ü.l oc 2.1±Ü.Ü4 J/g
pH9 92.4±Ü.3°C 2.4±O.02 J/g
Glycinin-gallic acid
pH? 95.6±O.lOC 3.1±O.03 J/g
pH9 95.1±O.2°C 3.0±O.02 J/g
Glycinin-biochanin A
pH7 92.7±0.1 oC 2.2±O.03 J/g
pH9 93.0±O.2°C 2.2±O.02 J/g
64
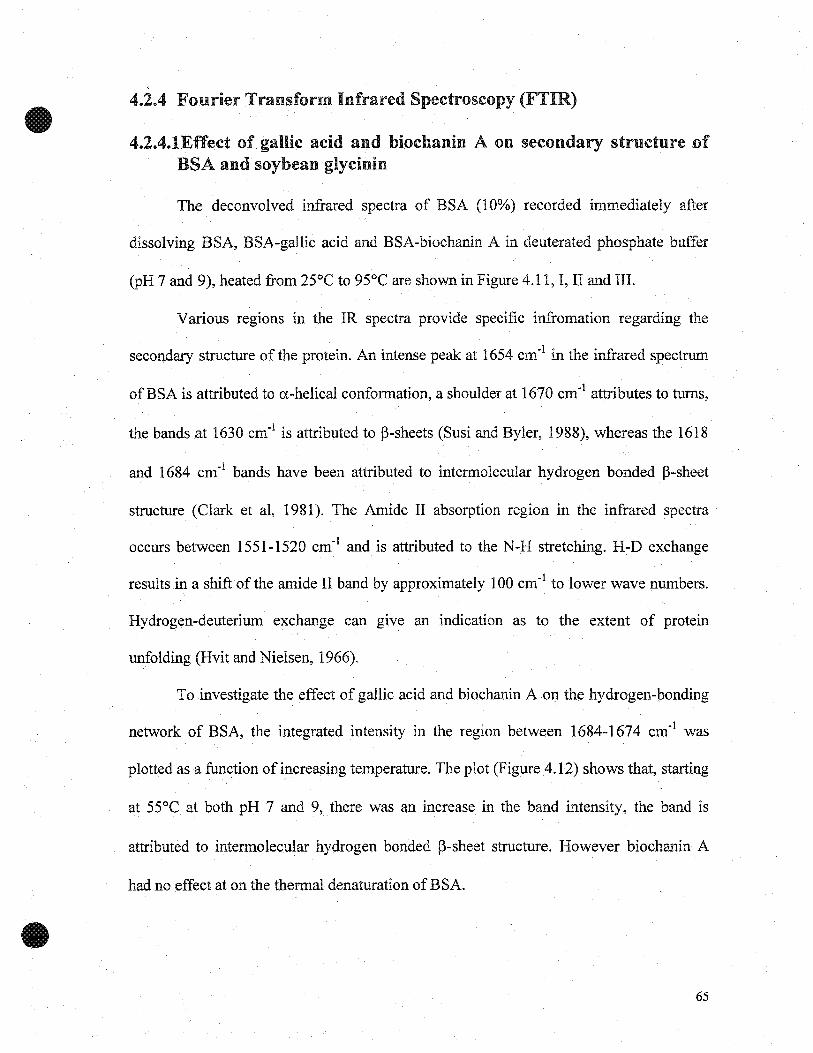
4.2.4 Fourier Transform Infrared Spectroscopy (FTIR)
4.2.4.1Effect of gallic acid and biochanin A on secondary structure .ofBSA and soybean glycinin
The deconvoived infrared spectra of BSA (10%) recorded immediately aJter
dissolving BSA, BSA-gallic acid and BSA-biochanin A in deuterated phosphate buffer
(pH 7 and 9), heated from 25°C to 95°C are shown in Figure 4.11, l, II and III.
Various regions in the IR spectra provide specifie infromation regarding the
secondary structure of the protein. An intense peak at 1654 cm-! in the infrared spectrum
ofBSA is attributed to a-helicai conformation, a shouider at 1670 cm- l attributes to tums,
the bands at 1630 cm-! is attributed to p-sheets (Susi and ByIer, 1988), whereas the 1618
and 1684 cm-! bands have been attributed to intermolecular hydrogen bonded p-sheet
structure (Clark et al, 1981). The Amide II absorption region in the infrared spectra
oœurs between 1551-1520 cm-! and is attributed to the N-H stretching. H-D exchange
results in a shiftofthe amide II band by approximately 100 cm-! to lower wave numbers.
Hydrogen-deuterium exchange can give an indication as to the extent of protein
unfolding (Hvit and Nielsen, 1966).
To investigate the effect of gallic acid and biochanin A on the hydrogen-bonding
network of BSA, the integrated intensity in the region between 1684-1674 cm-! was
plotted as a fun~tion of increasing temperature. The plot (Figure 4.12) shows that, starting
at 55°C at both pH 7 and 9, there was an increase in the band intensity, the band is
attributed to intermolecular hydrogen bonded p-sheet structure. However biochanin A
had no effect at on the thermal denaturation of BSA.
65

Figure 4.11: Deconvolved infrared spectra of BSA (1) BSA-gallic acid (Il), andBSA-biochanin A (III) at pH 7: 1682 and 1614 (intermolecular hydrogen bonded
- ~-sheet), 1648 (a-helix), 1630 (~-sheet) and 1576 (hydrogen-deuteriumexchange).
2.6
2.2
0.6
0.2
-0.2
1648
1682
1630 1: B8A pH 7
1576
1600 1Ero 1640 1620 1ax> 1500
Wavenumbers (cm-i)
1ffi:l 1540 1520
2.6
2.2
Cl)1.8
(.)1682c 1.4cu
.c...0 1.0fi).c« 0.6
0.2
-0.2
-0.6
II: B8A/gallic acid pH 71614
1576
•1680 1ffi:l 1640 1620 1ax> 1500 1530 1540 1520
66
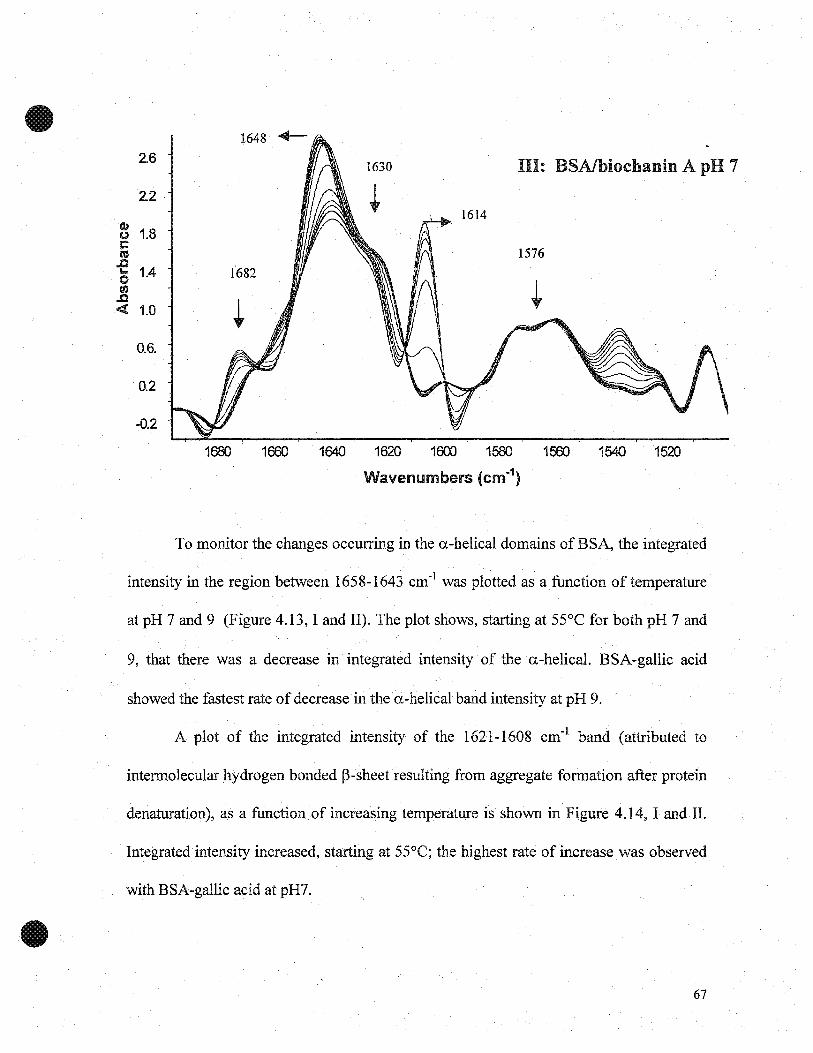
2.6
2.2
(l)1.8CJ
c~.0
1.4... 16820en.0
~oc:( 1.0
0.6.
0.2
-0.2
1630
1614
III: BSAIbiocbanin A pH 7
1576
1680 1660 1640 1620 1600 1580 1560
Wavenumbers (cm-1)
154D 1520
To monitor the changes occurring in the a-helical domains of BSA, the integrated
intensity in the region between 1658-1643 cm- l was plotted as a function oftemperature
at pH 7 and 9 (Figure 4.13, l and II). The plot shows, starting at 55°C for both pH 7 and
9, that there was a decrease in integrated intensity of the a-helical. BSA-gallic acid
showed the fastest rate ofdecrease in thea-helical band intensity at pH 9.
A plot of the integrated intensity of the 1621-1608 cm- l band (attributed to
intermolecular hydrogen bonded p-sheet resulting from aggregate formation after protein
denaturation), as a function of increasing temperature is shown in Figure 4.14, l and II.
Integrated intensity increased, starting at 55°C; the highest rate of increase was observed
with BSA"gal1ic acid at pH7.
67

Figure 4.12: Plot of integrated intensity (spectral region 1684-1674cm-1) versus
tèmperature oC of BSA with and with out gallic acid and biochanin A at pH 7 (1)& 9 (II).• BSA-pH 7 & 9 (alone), Il BSA-gallic acid, Â. BSA-biochanin A.
(1)
llII
llII llII llII
(II)
1059585755535
o~'----,-------25
12
10595857565554535
i i
1
10 ~
1
~ aic: 1
oS 1c: 1
"C 6 ~
oS l'~Cl)
~ :r1o+-~---,----..,--------,--------,-----,--------;---------,
25
Tarpercn.rE
68

Figure 4.13: Plot of integrated intensity (spectral region 1658-1643cm-1) versus
temperature. oc of BSA with and with out gallic acid and biochanin A at pH 7 (1)& 9 (II).• BSA-pH 7 & 9 (alone), il BSA-gallic acid, À BSA-biochanin A.
69

Figure 4.14: Plot of integrated intensity (spectral region 1621-l608cm-1) versus
temperature oc of BSA with and with out gallic acid and biochanin A at pH 7 (1)& 9 (II).• BSA-pH 7 & 9 (alone), Il BSA-gallic acid, .Il. BSA-biochanin A.
(1)25 l1li l1lil1li
II1'II
li.li. li.
20 li.R li. • • • •1/1 •c:
~.2l 15.= l1li"C.2lra 10 II1'II...
!CIII1'II II1'II l1li II1'II
CIl.....E
5~ ~ ~ ~ ~ t ~ b!
i
oJ25 35 45 55 65 75 85 95 105
Temperature
(II)
25
fi fi fifi
20 fi llIlIil llIlI il
.è:' Il • • •'lii ~ •ai 15 •.... Il
.= •"CCIl Il....E 10- 1\CI 1
~ 1 15~ ~ ~ ~ i ~ ~
~
il 1 1 1
01
25 35 45 55 65 75 85 95 105
Terrperatue
70

Figure 4.15: Plot of integrated intensity (spectral region 1551-1539cm-1) versus
temperature oC of BSA with and with out gallic acid and biochanin A at pH 7 (1)& 9 (II): • BSA-pH 7 & 9 (alone), Il BSA-gallic acid, Â BSA-biochanin A.
(1)
12 l,
10 jII1II II1II II1IIA II1II
II1II
~1 Ô8. Ô Il
fil Ar::1
•CIl • Ô II1II....•E: 1 • Ô Il
"6 ~ •CIl i
Ô l!lI....1 • II1II II1II IlE II1II Il II1II
t:l'l4
1 • ACIl.....E • ô ô ô ô ô ô ô• • • • • • •
71

To observe the effect of gallic acid and biochanin A at pH 7 and 9 on the rate of
H-D exéhange in BSA, the integrated intensity of the amide II band was plotted as a
function of increasing temperature (Figure 4.15, l and II). BSA-gallic acid at pH 7
showed the highest band intensity, the band intensity remained constant after 65°C
suggesting completion of H-D exchange. BSA-biochanin A showed a similar pattern of
H-D exchange as BSA at pH 9, suggesting thatbiochanin A had little effect on the
unfolding of BSA.
72

5. GENERAL CONCLUSION
Results from this research indicate that phenolic compounds can bind to proteins, and
this can be demonstrated by native polyacrylamide gel electrophoresis. The pH and the
temperature of the protein-phenolic compound have considerable effect on the
interaction. phenolicacids with single aromatic ring showed much greater interaction
than multi-aromatic ring isoflavone. BSA-phenolic acid showed considerable difference
in electrophoretic migration, and prevented protein aggregation when compared to BSA.
Similar effects were not found with BSA-isoflavone.
Thermal analysis using differential scanning calorimetry demonstrated the higher
thermal stability of the protein-phenolic compounds, compared with the proteins alone.
Fourier Transform Infrared spectroscopy showed differences in the secondary structure of
the protein-phenolic compounds when compared with the protein; in addition FTIR
confirmed the higher thermal stability and the inhibition of aggregation as a result of
interactions of phenols to the proteins.
73

6. REFERENCES CITED
Adlercreutz H. Western diet and western diseases: sorne hormonal and biochemicalmechanisms and associations. Scand J Lab Clin. Invest. 1990,50 (201S), 3.
Akiyamma T. Use and specificity of genistein as inhibitor of protein tyrosin kinase. MethEnzymoL 1991,201,362.
Anthony MS, Clarkson TB, Bullock BC and Wanger ID. Soy protein versus soyphytoestrogens in prevention of diet induced coronary artery atherosclerosis of malecynomolgus monkey. Arterioscller Thromb Vasc BioL 1997, 17,2524.
Artz WE, Bishop PD, Dunker AK, Schanus, EG and Swanson BG. Interaction ofsynthetic proanthocyanidin dimers and tdmers with bovine serum albumin and purifiedbean globulin fraction G-1. J Agdc Food Chem. 1987,35,417.
Asguith IN and Butler LG. Interactions of condensed tannins with selected proteins.Phytochemistry. 1986,25, 1591.
Axelson M, Sjovall J, Gustafsson Band Setchell KDR. Soya- a dietary source of the nonsteroidal oestrogen equol in humans and animaIs. J EndocrinoL 1998, 102,49.
Bames S, Kirk M and Coward L. Isoflavones and their conjugates in soy foods:extraction conditions and analysis by HPLC-mass spectrometry. J Agdc Food Chem.1994, 42(11), 2466.
Bartolome B, Estrella l and Hernandez MT. Interaction of low molecular weightPhenolics with protein (BSA). J Food Sci. 2000, 65(4) 617.
Bennetts HW, Underwood EJ and Shier PL. A specific breeding problem of sheep onsubterranean clover pastures in Western Australia. Aust vet J. 1946,22,2.
Bianco A, Chiacchio U, Rescifina A, Romeo G and Uccella N. Biomimeticsupramolecular biophenol-carbohydrate and biophenol-protein models by NMRexperiments. J Agri Food Chem. 1997,45,4281.
74

•
Boye JI and Alli 1. Thermal denaturation of mixtures of. a-lactalbumin and ~
lactoglobulin. A differential scanning calorimetrie study. Food Res Int. 2000, 33(8), 673.
Boye JI, Alli 1 and Ismail AA. Interactions involved in the gelation of bovine serumalb~in. J Agne Food Chem. 1996,44(4),996.
Bradbury RB and White BE. Estrogens and related substances in plants. VitaminsHormones. 1954, 12,207.
Clark AH, Saunderson DHP and Suggeti A. Infrared and laser raman spectroscopiestudies ofthermally-induced globular protein gels. Int J Pept Prot Res. 1981, 17,353.
Dixon RA. Isoflavonoids: biochemistry, molecular biology, and biological functions. In:Comprehensive natural products chemistry. (Ed: Barton D et al). Amsterdam, Elsevier,1999, Vol l, pp 773.
Franke AA, Custer LJ, Cerna CM and Narala KK. Quantitation of Phytoestrogens inlegumes by HPLC. J Agne Food Chem. 1994, 42(9), 1905.
Friedman Mand Juergens HS. Effect ofpH on the stability of plant phenolic compounds.J Agne Food Chem. 2000, 48(6), 2101.
Gheysuddin S, Cater CM and Matiil KF. Preparation of a colorless sunf10wer proteinisolate. Food Technology. 1970,24,242.
Greaves KA, Wilson MD, Rudel LL, Williams JK and Wagner JD. Consumption of soyprotein reducescholesterol absorption compared to casein protein alone or supplementedwith an isoflavone extract or conjugated equine estrogen in ovariectomized cynomolgusmonkey. Am Soc Nutr Sei. 1999, 820.
Hagerman AB and Butler LG. Protein precipitation method for the quantification oftannins. J Agn Food Chem. 1978, 26, 809.
Hagerman AE and Butler LG. The specificity of proanthocyanidin-protein interaction. JBiol Chem. 1981, 256, 4494.
75

•
Hagerman AE and Robbins CT. Implications of soluble-tannins protein complexes fortannin analysis and plant defense mechanism. J Chem Ecol. 1987, 12, 1243.
Hagerman AE. Chemistry of tannin-protein complexation. In: Chemistry and significanceof condensed tannins. (Ed: Hemingway RW and Karchesy JJ). New York, Plenum press.1989~ PP 323. .
Hansen AP and Heinis n. Decrease ofvanillin flavor perception in the presence of caseinand whey protein. J Dairy Sei. 1991, 74, 2936.
Harbome JB. The minor flavonoids. In: comparative biochemistry of flavonoids.Academie press. 1967, PP 91.
Haslam E, Williamson MP, Baxter NJ and Charlton AJ. Astringency and polyphenolprotein interactions. Recent Advances in Phytochemistry. 1999,33,289.
Haslam E. Plant polyphenols. Practical polyphenolic. From structure to molecularrecognition and physiological action. Cambridge University Press. 1989, PP 178.
Haslam E. Polyphenol-protein interactions. Biochem J. 1974, 139.
Hvidt A and Nielsen SO. Hydrogen exchange in proteins. Adv Prot Chem. 1966,21,287.
Ingram D, Sanders K, Kolybaba M and Lopez D. Case control study of phyto-estrogensand breast cancer. Lancet. 1997,350,990.
Jansman AJM. Tannins in feedstuffs for simple stomached animals. Nutr Res Rev. 1993,6,209.
Kauffman DL and Keller PJ. The basic proline-rich proteins in human parotid saliva froma single subject. Arch Oral Bio. 1979,24,249.
Kennedy AR. The Bowman-Birk. Inhibitor from soy bean as an anticarcinogenic agentAm J Clin Nutr. 1998, 68(S), 1406.
76

KroH J, Rawel HM, Rohn Sand Czajka D. Interactions of glycinin with plant phenolsinfluence on chemical properties and proteolytic degradation of the proteins. Nahrung2001,45(6),388.
Laemmli UK. Cleavage of structural proteins during the assembly of the head ofbacteriophage T4. Nature. 1970, 277, 680.
Lee HP, Gourley L, Duffy SW, Esteve J, Lee J and Day NE. Dietary effects on breastcancer risk in Singapore. Lancet. 1991, 337, 1197.
Loomis WD and Battaile J. Plant phenolic compounds and the isolation of plant enzymes.Phytochemistry. 1966, 5,423.
Loomis WD. Overcoming problems of phenolics and quinones in the isolation of plantenzymes and organelles. Methods Enzymol. 1974,31,528.
Mehansho H, Butler LG and Carlson DM. Dietary tannins and salivary proline-richproteins: interactions, induction and defense mechanism. Annu Rev Nutr. 1987, 7, 423.
Memanus JP, Davis K, Lilley TH, Haslam E. The association of proteins with phenols. JChem Soc. Chemical Communications. 1981,309.
Messina MJ, Persky V, SetcheH KDR and Bamer S. Soy intake and cancer risk: a reviewofthe in vitro and in vivo data. Nutr Cancer. 1994, 21, 113.
Messina MJ and Bames S. The role of soy products in reducing risk of cancer. JNCL1991,83,541.
Messina Ml Legumes and soybeans: overview of their nutritional profiles and healtheffects. Am J Clin Nutr. 1999, 70(3S), 439.
Milic B, Stojanovic S, Vucureuic N and Turcic M. Chlorogenic and quinic acids insunfiower meal. J Sci Food Agric. 1968, 19, 108.
77

Mole S and Waterman PG. Tannic acid and proteolytic enzymes: enzyme inhibition orsubstrate deprivation? Phytochemistry. 1987,26,99.
Mullner C and Sontag G. Determination of sorne phytoestrogens in soybeans and theirprocessed products with HPLC and colometric electrode array detection. Fresenius' JAnal Chem. 1999,364(3),261. .
Murphy PA. Rebuttal on isoflavones in Soy-Based Infant Formulas. J Agric Food Chem.1998, 46(8), 3398.
Murray NJ, Williamson MP, Lilley TH and Haslam E. Study of the interaction betweenproline-rich proteins and a polyphenol by IH NMR Spectroscopy. Eur J Biochem. 1994,219,923.
Murray NJ and Williamson MP. Conformational study of a salivary proline-rich proteinrepeat sequence. Eur J Bio Chem. 1994,219,915.
Myer RO and Gorbet DW. Waxy and normal grain sorghums with varying tannincontents in diet for young pigs. Anim Feed Sci Technol. 1985, 12, 179.
Oh HI, Hoff JE, Armstrong GS and Haff LA. Hydrophobic interactions in tannin-proteincomplexes. J Agri Food Chem. 1980, 28, 394.
Palevitz BA. News: soy and isoflavones remain under study for health benefits. Scientistthe News paper for the science professional. 2000, 14(6), PP 8.
Petrakis NL, Barnes S, King Eb, Lowenstein J, Wiencke J, Lee MM, Mike R, Kirk M andCoward L. Stimulatory influence of soy protein isolate on breast secretion in pre- andpostmenopausla women. Cancer Epidemiol Biomark Prey. 1996,5, 785.
Potter SM, Jo AB, Hongyu T, Rachel JS, Neil FS and John WEJ. Soy protein andisoflavones: their affects on blood lipids and bone density in postmenopausal women.AmJ Clin Nutr. 1998, 68S, 1375.
Price KR and Fenwick GR. Naturally occurring estrogens in foods: a review. Food AdditContam. 1985,2, 73.
78

Ramadan EA. Isolation and characterization of a high gelling protein from soybean. Mscthesis. Dept of Food Sei and Agric Chem. Macdonald campus, McGill University. 2000,Chapter 3, pp 48.
Sastry MCS and Rao MSN. Binding of chlorogenic acid by the isolated polyphenol-freeIls protein ofsunflower (Helianthus annuus) seed. J Agri Food Chem. 1990,38,2103.
Serafini M, Maiani G and Ferro-Luzzi A. Effect of ethanol on red wine tannin-protein(BSA) interaction. J Agri Food Chem. 1997,45,3148.
Setchell KDR, Gosselin SJ, Welsh MB, JoOOston JO, Balistreri WF, Karamer Lw,Dresser BL and Tarr Ml Dietary estrogens-a probable cause of infertility and liverdisease in captive cheetahs. Gastroent. 1987, 93, 225.
Setchell KDR. Naturally occurring non-sterodial estrogens of dietary ongm. In:Estrogens in the Environment II: Influences on Development (Ed: McLachlan JA).Elsevier, New York, 1985. pp 69.
Sheehan D. Food Labeling and Nutrition News: Soy protein/CHD health daim critieizedby FDA's National Center for Toxicological Research; says evidence shows sorne soy,isoflavones may be toxic, cause demen. Food labeling and nutrition news, 1999, 7(22),p.l0, IP.
Shen JL, Guevara BF, Spadafora FE and Bryan BA. Isoflavone rich protein isolate andprocess for producing. United States Patent. 2000.
Siebert KJ. Reviews- Effect of protein-polyphenol interactions on beverage haze,stabilization and Ana1ysis. J Agric Food Chem. 1999,47(2),353.
Sosulski FW. Organoleptic and nutritional effects of phenolic compounds on oilseedproteinproducts: a review. J Am ail Chem Soc. 1979,56, 711.
Susi H and Byler DM. Fourier transform infrared spectroscopy in protein conformationstudies. In: Methods for protein analysis (Ed: JP Cherry and RA Barford). Champaign,IL, PP 235.
79

Swanson CA. Vegetables, Fruits and Cancer Risk: The Role of phytochemicals. InPhytochemicals-A New Paradigm. (Ed: Bidlack WR, Omaye ST, Meskin MS and JahnerD). Technomic Publication. 1998.
Tekel J, Daeseleire E, Heeremans AN, Van P and Carlos. Development of a simplemethod for the determination of genistein, daidzein, biochanin A, and formononetin(biochanin B) in human urine. J Agdc Food Chem. 1999,47(9),3489.
Thom TJ, Epstein PH, Feldman JJ, Leaverton PE and Wolz M. Total mortality andmorbidity from heart diseases, cancer and stroke from 1950 to 1987 in 27 countfÏes.National institute of health publication No. 02-3088. 1992.
Walter ED. Genistein (an isoflavone glucoside) and its aglucone, genistin from soybean.lArn Oil Chem Soc. 1941,63,3273.
Wang Huei-ju and Murphy PA. Isoflavone Composition of American and JapaneseSoybeans in Lowa: Effect ofvariety, Crop year, and Location. J Agri Food Chem. 1994,42, 1674.
Warner TF and Azen EA. Tannins, salivary proline-rich proteins and esophageal cancer,Med Hypoth. 1998, 26, 99.
Wong RSC and Bennick A. The primary structure of a salivary calcium-binding prolinerich phosphoprotein (protein C) a. possible precursor of a related salivary protein. Arn JBiol Chem. 1980,255,5943.
80