Embed Size (px)
DESCRIPTION
Protein Function Prediction from Protein Interactions. Limsoon Wong. Rule-based system for processing free texts in scientific abstracts Specialized in extracting protein names extracting protein-protein interactions. PPI Extraction: The Dream. Jak1. PIP Extraction: Challenges. - PowerPoint PPT Presentation
Citation preview
NUS-KI Symp @ IMS 28 Nov 2005
Protein Function Predictionfrom Protein Interactions
Limsoon Wong
NUS-KI Symp @ IMS, 28 Nov 2005
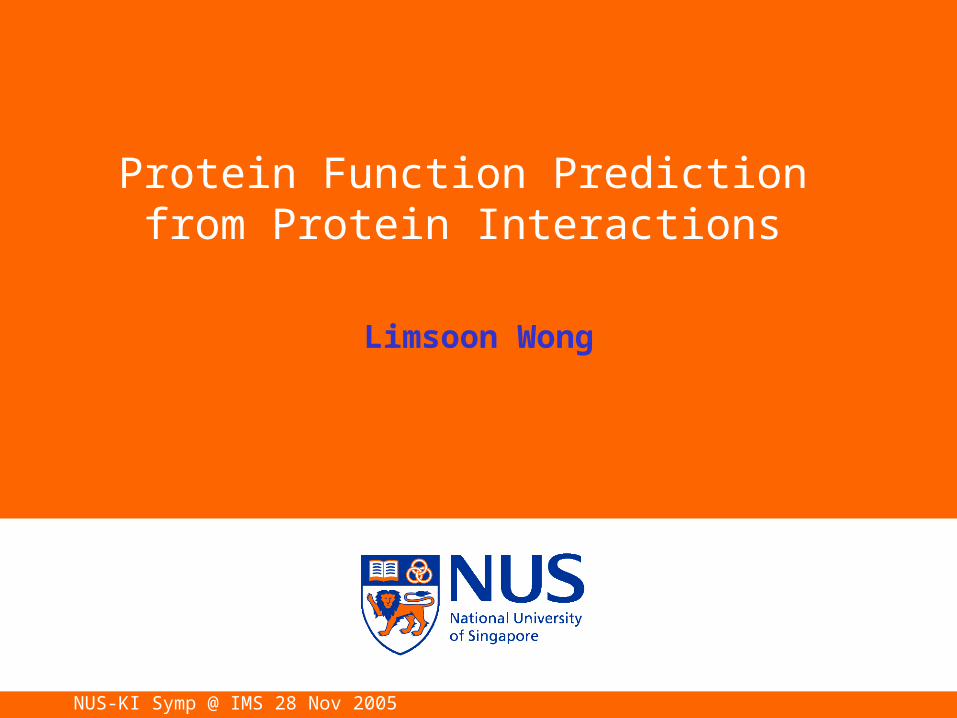
PPI Extraction: The Dream
• Rule-based system for processing free texts in scientific abstracts
• Specialized in– extracting protein
names– extracting
protein-protein interactions
NUS-KI Symp @ IMS, 28 Nov 2005
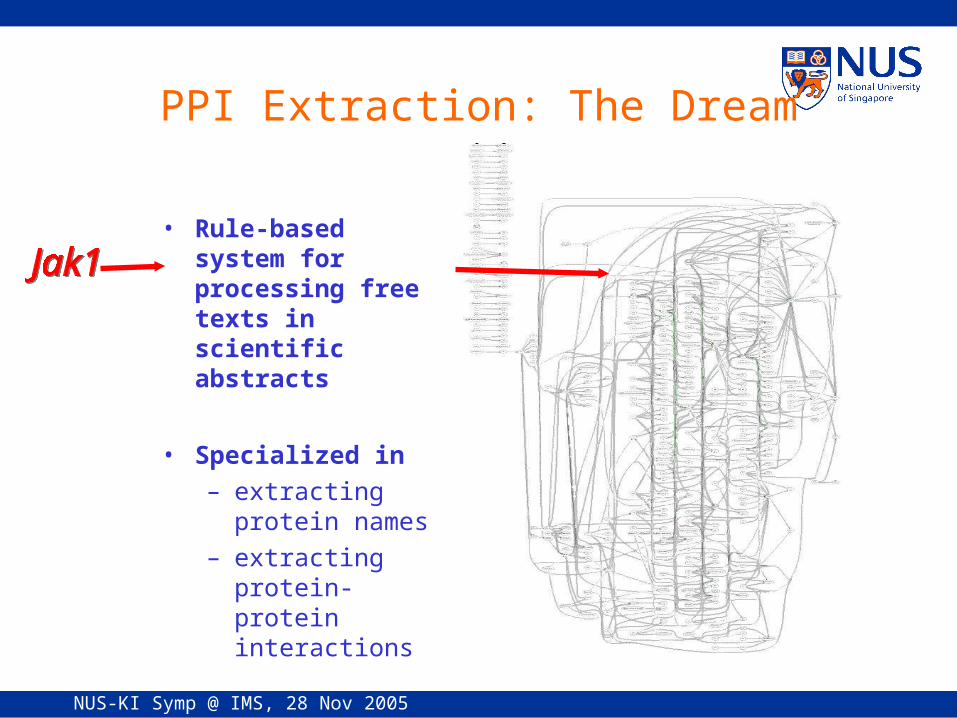
PIP Extraction: Challenges
NUS-KI Symp @ IMS, 28 Nov 2005
Question: After we have spent
so much effort dealing with this monster,
what can we use the resulting interaction
networks for?
NUS-KI Symp @ IMS, 28 Nov 2005
Some Answers
• Someone else’s work:– Guide engineering of bacteria strains to optimize
production of specific metabolites– Detect common regulators or targets of
differentially expressed genes, even when these are not on the microarray
– And many more …
• Our own work:– Improve inference of protein function even when
homology information is not available
NUS-KI Symp @ IMS, 28 Nov 2005
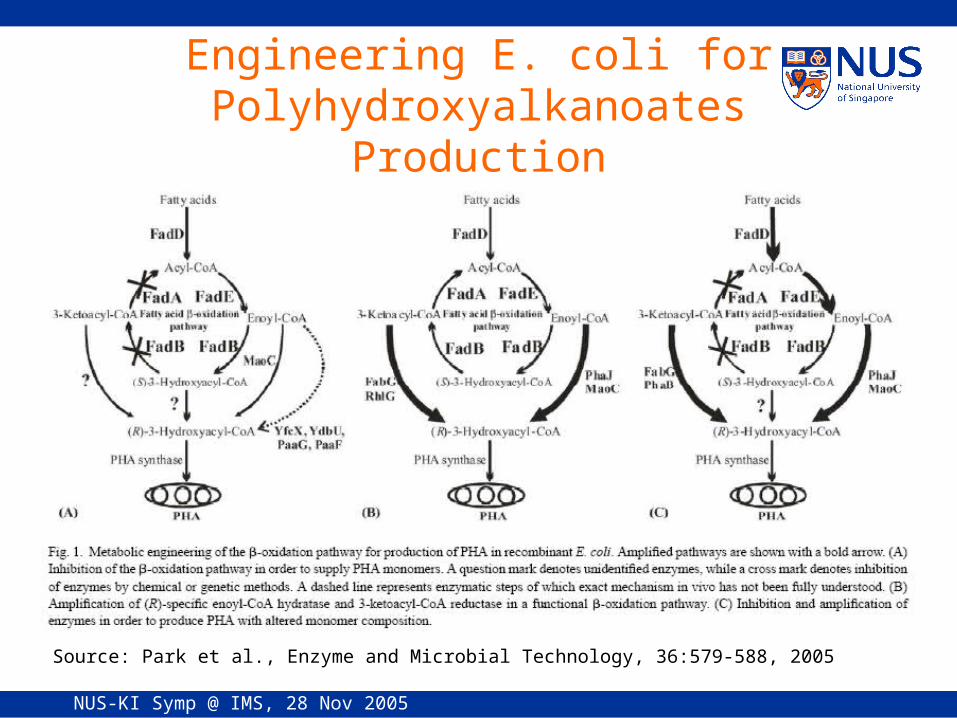
Engineering E. coli for Polyhydroxyalkanoates Production
Source: Park et al., Enzyme and Microbial Technology, 36:579-588, 2005
NUS-KI Symp @ IMS, 28 Nov 2005
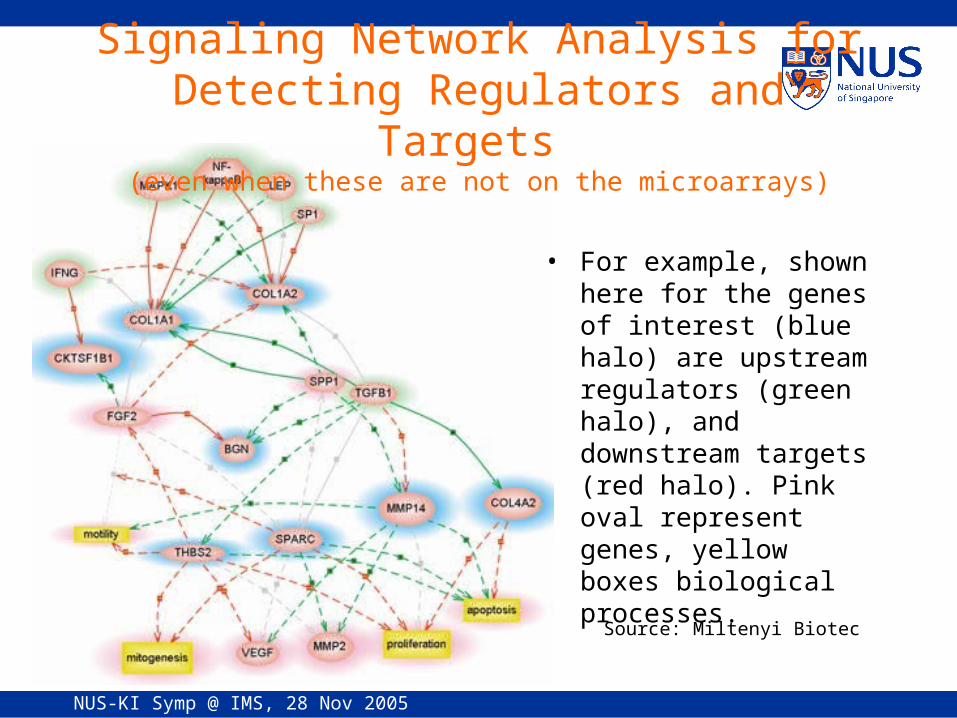
Signaling Network Analysis for Detecting Regulators and Targets
(even when these are not on the microarrays)
• For example, shown here for the genes of interest (blue halo) are upstream regulators (green halo), and downstream targets (red halo). Pink oval represent genes, yellow boxes biological processes.
Source: Miltenyi Biotec
NUS-KI Symp @ IMS 28 Nov 2005
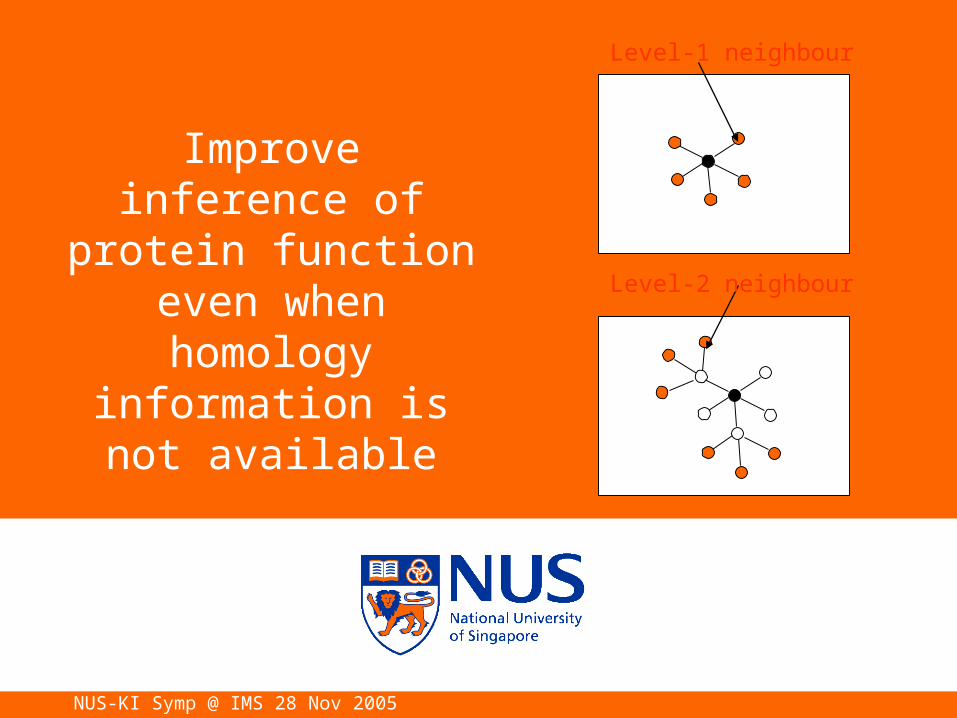
Improve inference of protein function even
when homology information is not
available
Level-1 neighbour
Level-2 neighbour
NUS-KI Symp @ IMS, 28 Nov 2005
Protein Function Prediction Approaches
• Sequence alignment (e.g., BLAST)• Generative domain modeling (e.g., HMMPFAM)• Discriminative approaches (e.g., SVM-PAIRWISE)• Phylogenetic profiling• Subcellular co-localization (e.g., PROTFUN)• Gene expression co-relation• Protein-protein interaction• …
NUS-KI Symp @ IMS, 28 Nov 2005
Protein Interaction Based Approaches
• Neighbour counting (Schwikowski et al, 2000)
• Rank function based on freq in interaction partners
• Chi-square (Hishigaki et al, 2001)
• Chi square statistics using expected freq of functions in interaction partners
• Markov Random Fields (Deng et al, 2003; Letovsky et al, 2003)
• Belief propagation exploit unannotated proteins for prediction
• Simulated Annealing (Vazquez et al, 2003)
• Global optimization by simulated annealing
• Exploit unannotated proteins for prediction
• Clustering (Brun et al, 2003; Samanta et al, 2003)
• Functional distance derived from shared interaction partners
• Clusters based on functional distance represent proteins with similar functions
• Functional Flow (Nabieva et al, 2004)
• Assign reliability to various expt sources
• Function “flows” to neighbour based on reliability of interaction and “potential”
NUS-KI Symp @ IMS, 28 Nov 2005
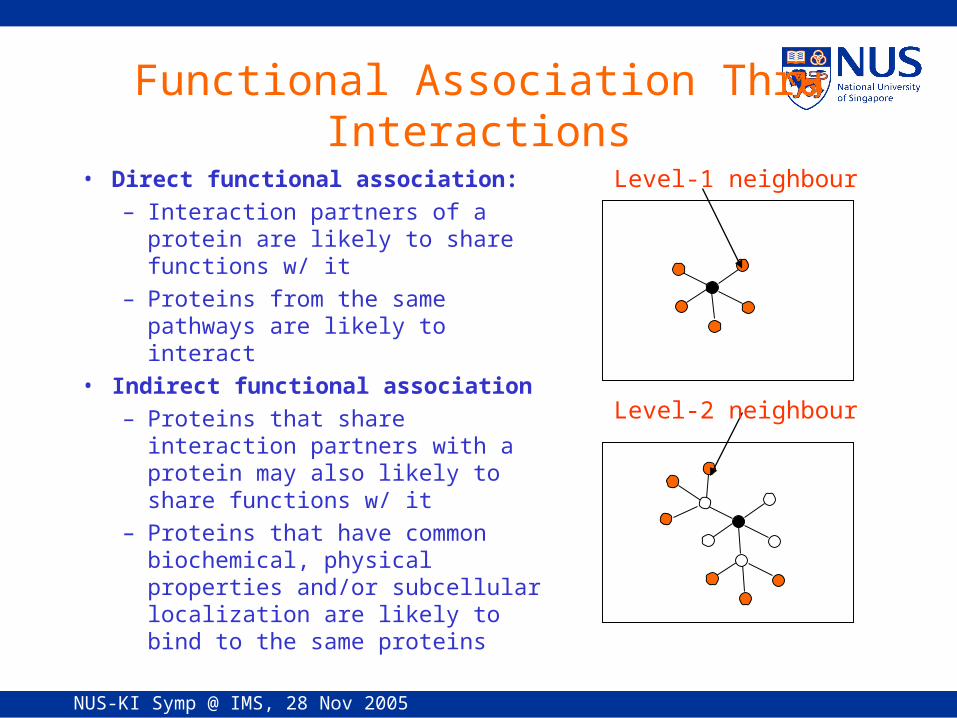
Functional Association Thru Interactions
• Direct functional association:– Interaction partners of a protein
are likely to share functions w/ it– Proteins from the same
pathways are likely to interact• Indirect functional association
– Proteins that share interaction partners with a protein may also likely to share functions w/ it
– Proteins that have common biochemical, physical properties and/or subcellular localization are likely to bind to the same proteins
Level-1 neighbour
Level-2 neighbour
NUS-KI Symp @ IMS, 28 Nov 2005
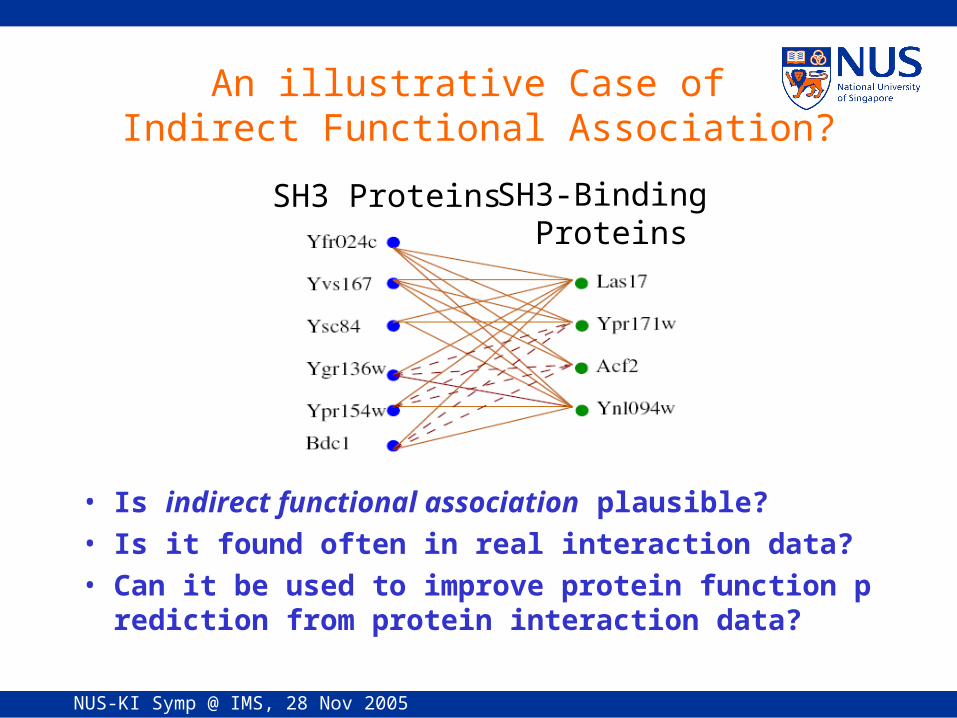
An illustrative Case of Indirect Functional Association?
• Is indirect functional association plausible?• Is it found often in real interaction data?• Can it be used to improve protein function predict
ion from protein interaction data?
SH3 Proteins SH3-Binding Proteins
NUS-KI Symp @ IMS, 28 Nov 2005
Materials
• Protein interaction data from General Repository for Interaction Datasets (GRID)– Data from published large-scale interaction datase
ts and curated interactions from literature – 13,830 unique and 21,839 total interactions– Includes most interactions from the Biomolecular I
nteraction Network (BIND) and the Munich Information Center for Protein Sequences (MIPS)
• Functional annotation (FunCat 2.0) from Compre-hensive Yeast Genome Database (CYGD) at MIPS– 473 Functional Classes in hierarchical order
NUS-KI Symp @ IMS, 28 Nov 2005
Validation Methods
• Informative Functional Classes– Adopted from Zhou et al, 1999– Select functional classes w/
• at least 30 members• no child functional class w/ at least 30 members
• Leave-One-Out Cross Validation– Each protein with annotated function is predicted
using all other proteins in the dataset
NUS-KI Symp @ IMS, 28 Nov 2005
YBR055C|11.4.3.1
YDR158W|1.1.6.5|1.1.9
YJR091C|1.3.16.1|16.3.3
YMR101C|42.1
YPL149W|14.4|20.9.13|42.25|14.7.11
YPL088W|2.16|1.1.9
YMR300C|1.3.1
YBL072C|12.1.1
YOR312C|12.1.1
YBL061C|1.5.4|10.3.3|18.2.1.1|32.1.3|42.1|43.1.3.5|1.5.1.3.2
YBR023C|10.3.3|32.1.3|34.11.3.7|42.1|43.1.3.5|43.1.3.9|1.5.1.3.2
YKL006W|12.1.1|16.3.3 YPL193W
|12.1.1
YAL012W|1.1.6.5|1.1.9
YBR293W|16.19.3|42.25|1.1.3|1.1.9
YLR330W|1.5.4|34.11.3.7|41.1.1|43.1.3.5|43.1.3.9
YLR140W
YDL081C|12.1.1
YDR091C|1.4.1|12.1.1|12.4.1|16.19.3
YPL013C|12.1.1|42.16
YMR047C|11.4.2|14.4|16.7|20.1.10|20.1.21|20.9.1
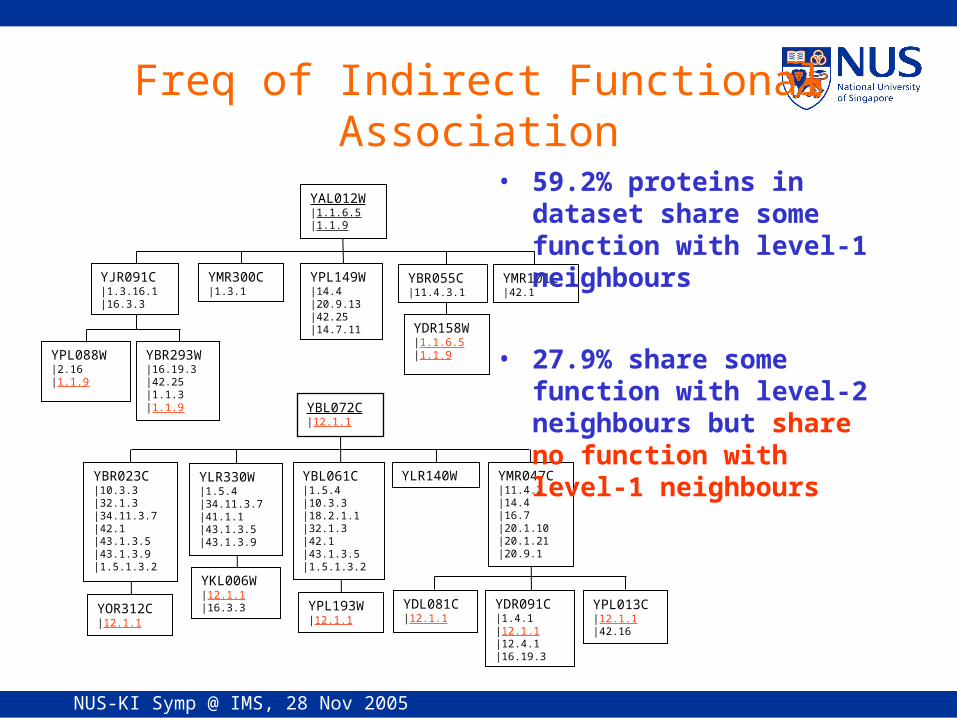
Freq of Indirect Functional Association
• 59.2% proteins in dataset share some function with level-1 neighbours
• 27.9% share some function with level-2 neighbours but share no function with level-1 neighbours
NUS-KI Symp @ IMS, 28 Nov 2005
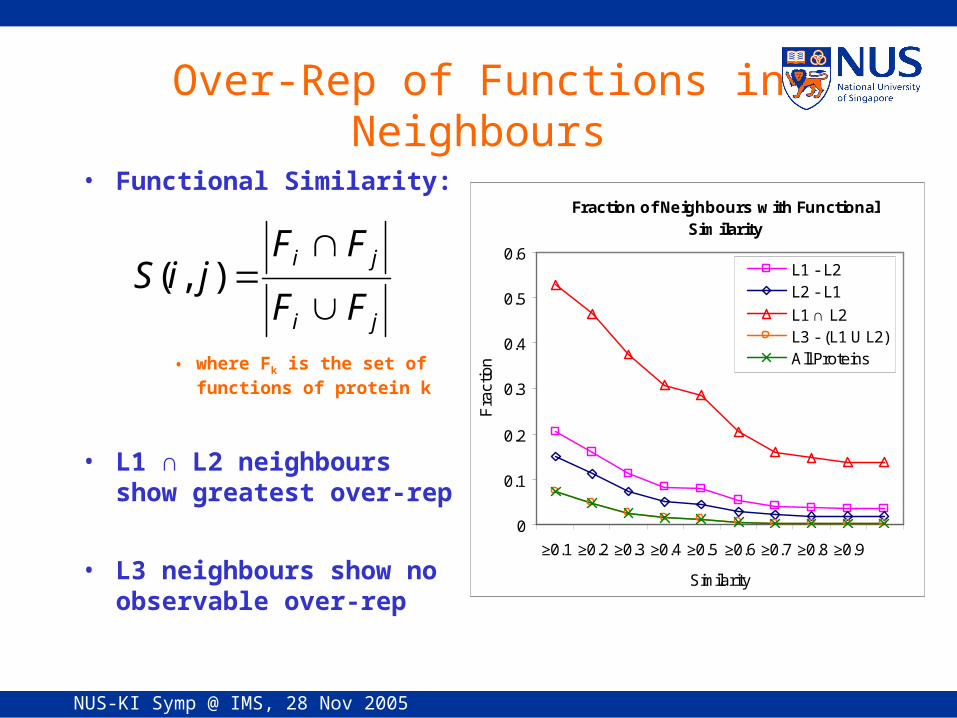
Over-Rep of Functions in Neighbours
• Functional Similarity:
• where Fk is the set of functions of protein k
• L1 ∩ L2 neighbours show greatest over-rep
• L3 neighbours show no observable over-rep
ji
ji
FF
FFjiS
),(
Fraction of Neighbours with Functional Similarity
0
0.1
0.2
0.3
0.4
0.5
0.6
≥0.1 ≥0.2 ≥0.3 ≥0.4 ≥0.5 ≥0.6 ≥0.7 ≥0.8 ≥0.9
Similarity
Fra
ctio
n
L1 - L2L2 - L1
L1 ∩ L2L3 - (L1 U L2)All Proteins
ji
ji
FF
FFjiS
),(
NUS-KI Symp @ IMS, 28 Nov 2005
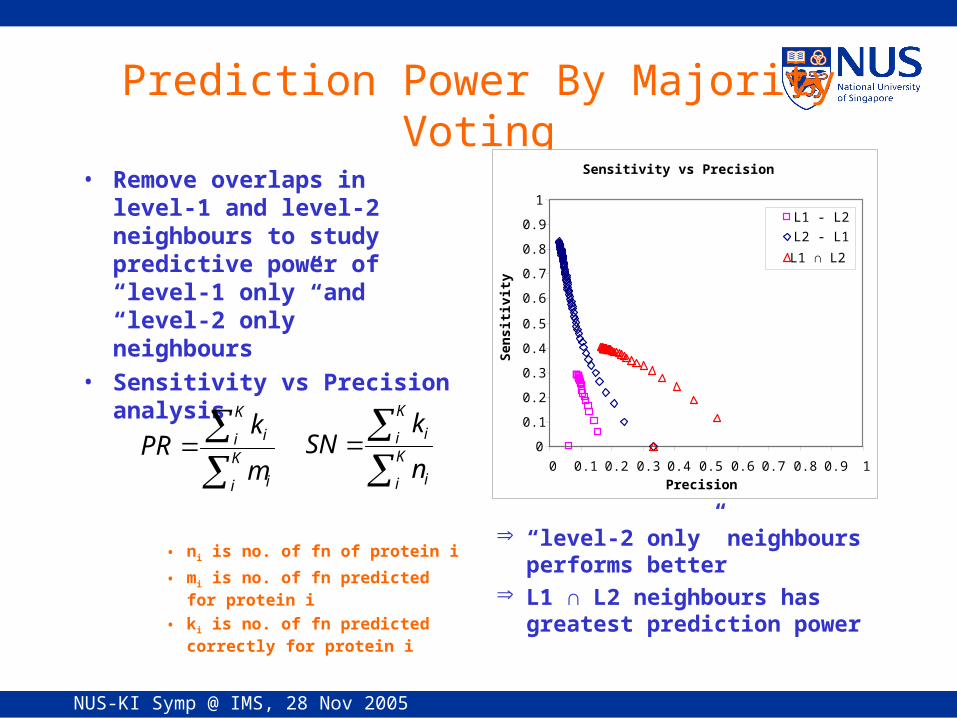
Prediction Power By Majority Voting
• Remove overlaps in level-1 and level-2 neighbours to study predictive power of “level-1 only” and “level-2 only” neighbours
• Sensitivity vs Precision analysis
• ni is no. of fn of protein i
• mi is no. of fn predicted for protein i
• ki is no. of fn predicted correctly for protein i
“level-2 only” neighbours performs better
L1 ∩ L2 neighbours has greatest prediction power
K
i i
K
i i
n
kSN
K
i i
K
i i
m
kPR
Sensitivity vs Precision
0
0.1
0.2
0.3
0.4
0.5
0.6
0.7
0.8
0.9
1
0 0.1 0.2 0.3 0.4 0.5 0.6 0.7 0.8 0.9 1Precision
Sen
siti
vity
L1 - L2
L2 - L1
L1 ∩ L2
NUS-KI Symp @ IMS, 28 Nov 2005
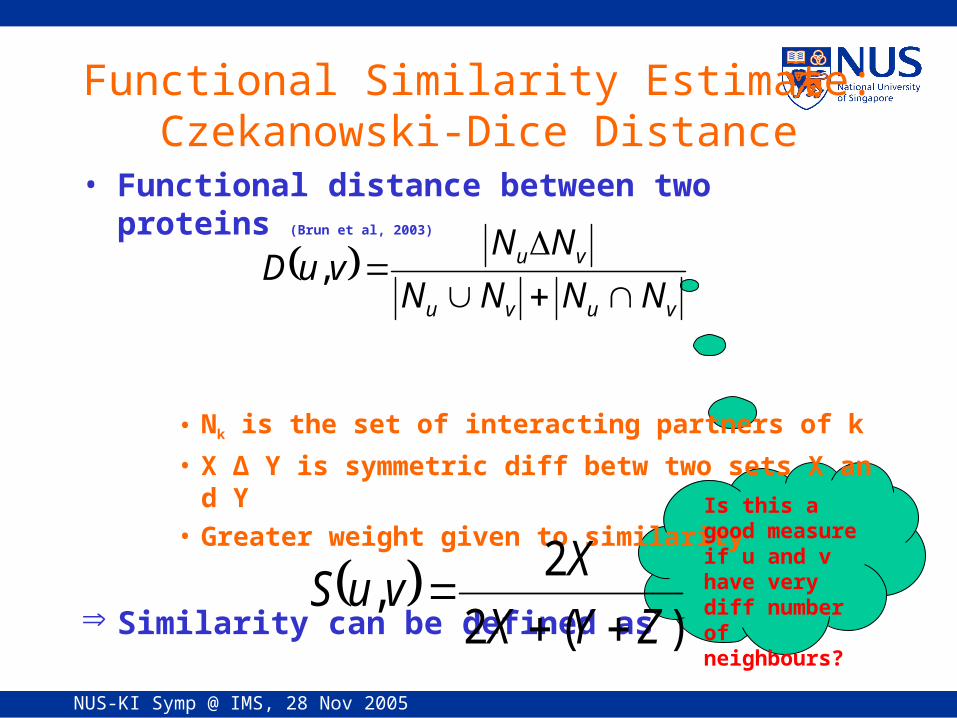
Functional Similarity Estimate:Czekanowski-Dice Distance
• Functional distance between two proteins (Brun et al, 2003)
• Nk is the set of interacting partners of k
• X Δ Y is symmetric diff betw two sets X and Y • Greater weight given to similarity
Similarity can be defined as
vuvu
vu
NNNN
NNvuD
,
)(2
2,
ZYX
XvuS
Is this a good measure if u and v have very diff number of neighbours?
NUS-KI Symp @ IMS, 28 Nov 2005
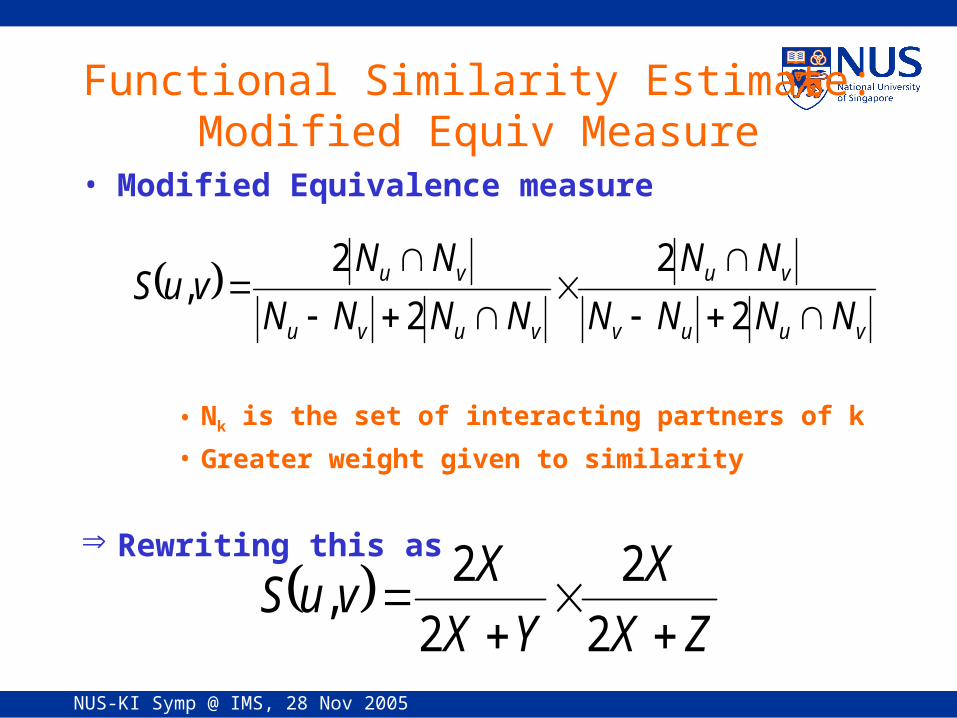
Functional Similarity Estimate:Modified Equiv Measure
• Modified Equivalence measure
• Nk is the set of interacting partners of k
• Greater weight given to similarity
Rewriting this as
vuuv
vu
vuvu
vu
NNNN
NN
NNNN
NNvuS
2
2
2
2,
ZX
X
YX
XvuS
2
2
2
2,
NUS-KI Symp @ IMS, 28 Nov 2005
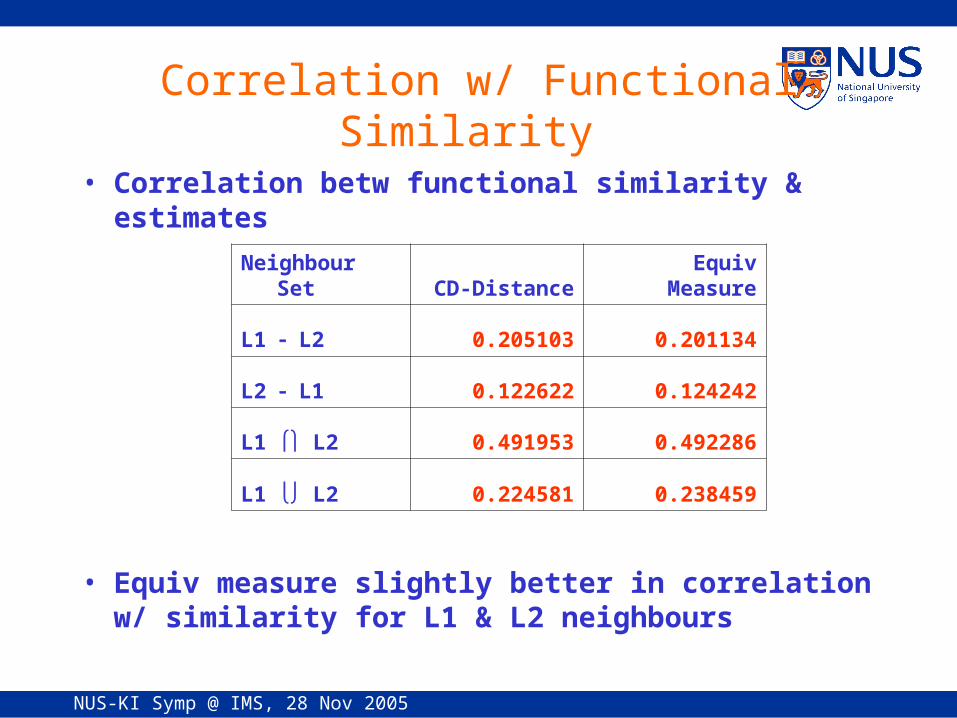
Correlation w/ Functional Similarity
• Correlation betw functional similarity & estimates
• Equiv measure slightly better in correlation w/ similarity for L1 & L2 neighbours
Neighbour Set CD-Distance Equiv Measure
L1 L2 0.205103 0.201134
L2 L1 0.122622 0.124242
L1 L2 0.491953 0.492286
L1 L2 0.224581 0.238459
NUS-KI Symp @ IMS, 28 Nov 2005
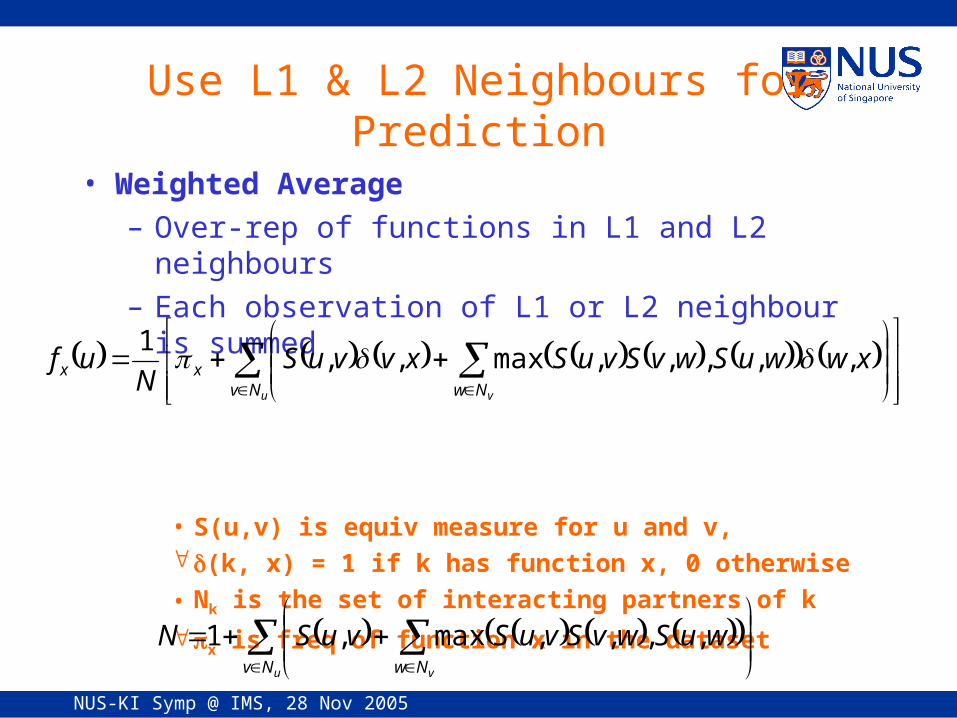
Use L1 & L2 Neighbours for Prediction
• Weighted Average– Over-rep of functions in L1 and L2 neighbours– Each observation of L1 or L2 neighbour is summed
• S(u,v) is equiv measure for u and v, (k, x) = 1 if k has function x, 0 otherwise
• Nk is the set of interacting partners of k
x is freq of function x in the dataset
u vNv Nwxx xwwuSwvSvuSxvvuS
Nuf ,,,,,max,,
1
u vNv Nw
wuSwvSvuSvuSN ,,,,max,1
NUS-KI Symp @ IMS, 28 Nov 2005
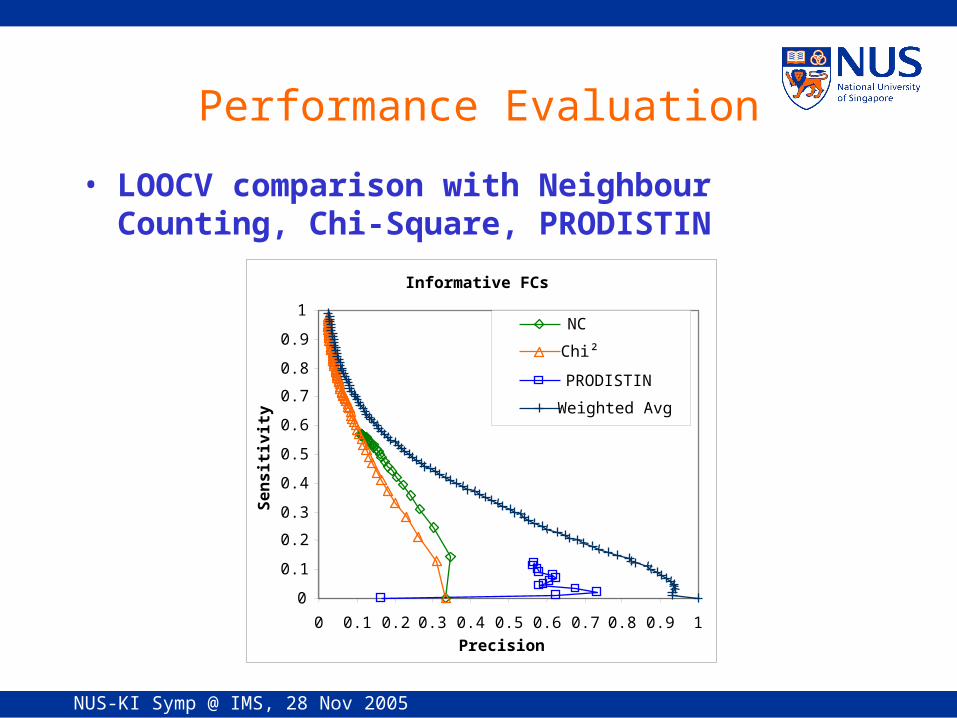
Performance Evaluation
• LOOCV comparison with Neighbour Counting, Chi-Square, PRODISTIN
Informative FCs
0
0.1
0.2
0.3
0.4
0.5
0.6
0.7
0.8
0.9
1
0 0.1 0.2 0.3 0.4 0.5 0.6 0.7 0.8 0.9 1
Precision
Se
ns
itiv
ity
NC
Chi²
PRODISTIN
Weighted Avg
NUS-KI Symp @ IMS, 28 Nov 2005
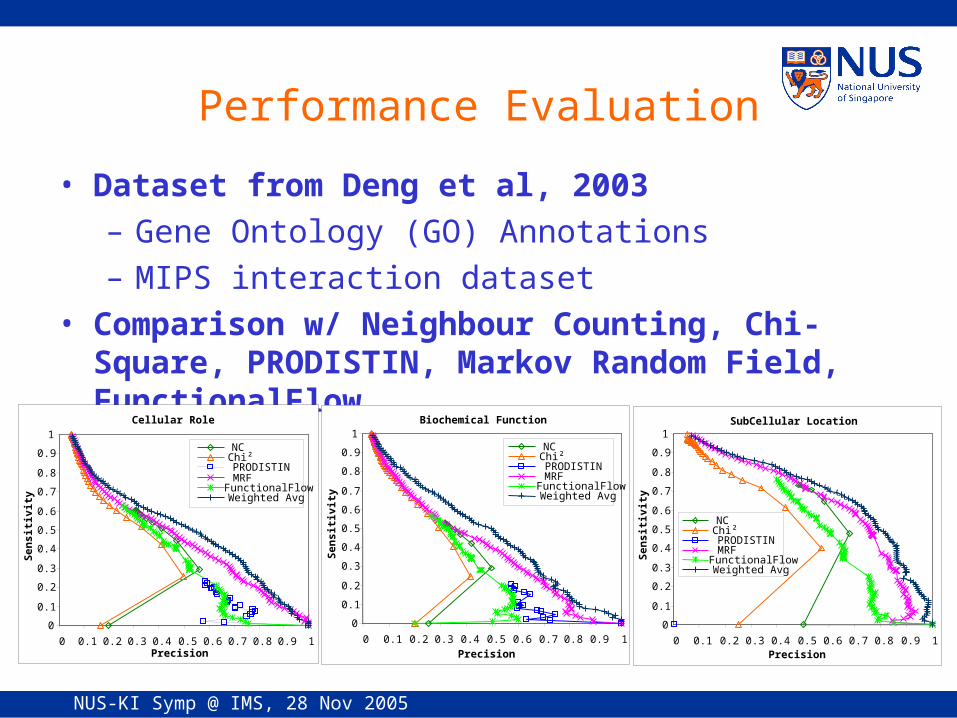
Performance Evaluation
• Dataset from Deng et al, 2003– Gene Ontology (GO) Annotations– MIPS interaction dataset
• Comparison w/ Neighbour Counting, Chi-Square, PRODISTIN, Markov Random Field, FunctionalFlow
Cellular Role
0
0.1
0.2
0.3
0.4
0.5
0.6
0.7
0.8
0.9
1
0 0.1 0.2 0.3 0.4 0.5 0.6 0.7 0.8 0.9 1Precision
Sen
siti
vity
NCChi²PRODISTINMRFFunctionalFlowWeighted Avg
Biochemical Function
0
0.1
0.2
0.3
0.4
0.5
0.6
0.7
0.8
0.9
1
0 0.1 0.2 0.3 0.4 0.5 0.6 0.7 0.8 0.9 1Precision
Sen
siti
vity
NCChi²PRODISTINMRFFunctionalFlowWeighted Avg
SubCellular Location
0
0.1
0.2
0.3
0.4
0.5
0.6
0.7
0.8
0.9
1
0 0.1 0.2 0.3 0.4 0.5 0.6 0.7 0.8 0.9 1Precision
Sen
siti
vity
NCChi²PRODISTINMRFFunctionalFlowWeighted Avg
NUS-KI Symp @ IMS, 28 Nov 2005
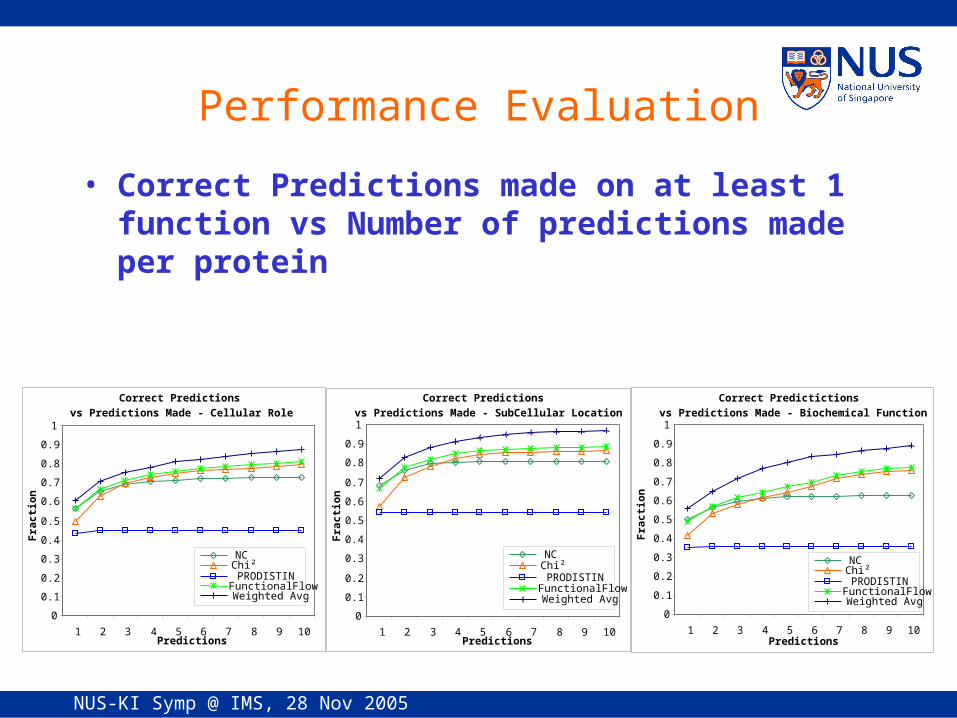
Performance Evaluation
• Correct Predictions made on at least 1 function vs Number of predictions made per protein
Correct Predictions
vs Predictions Made - Cellular Role
0
0.1
0.2
0.3
0.4
0.5
0.6
0.7
0.8
0.9
1
1 2 3 4 5 6 7 8 9 10Predictions
Fra
ctio
n
NCChi²PRODISTINFunctionalFlowWeighted Avg
Correct Predictions
vs Predictions Made - SubCellular Location
0
0.1
0.2
0.3
0.4
0.5
0.6
0.7
0.8
0.9
1
1 2 3 4 5 6 7 8 9 10Predictions
Fra
ctio
n
NCChi²PRODISTINFunctionalFlowWeighted Avg
Correct Predictictions
vs Predictions Made - Biochemical Function
0
0.1
0.2
0.3
0.4
0.5
0.6
0.7
0.8
0.9
1
1 2 3 4 5 6 7 8 9 10Predictions
Fra
ctio
n
NCChi²PRODISTINFunctionalFlowWeighted Avg
NUS-KI Symp @ IMS, 28 Nov 2005
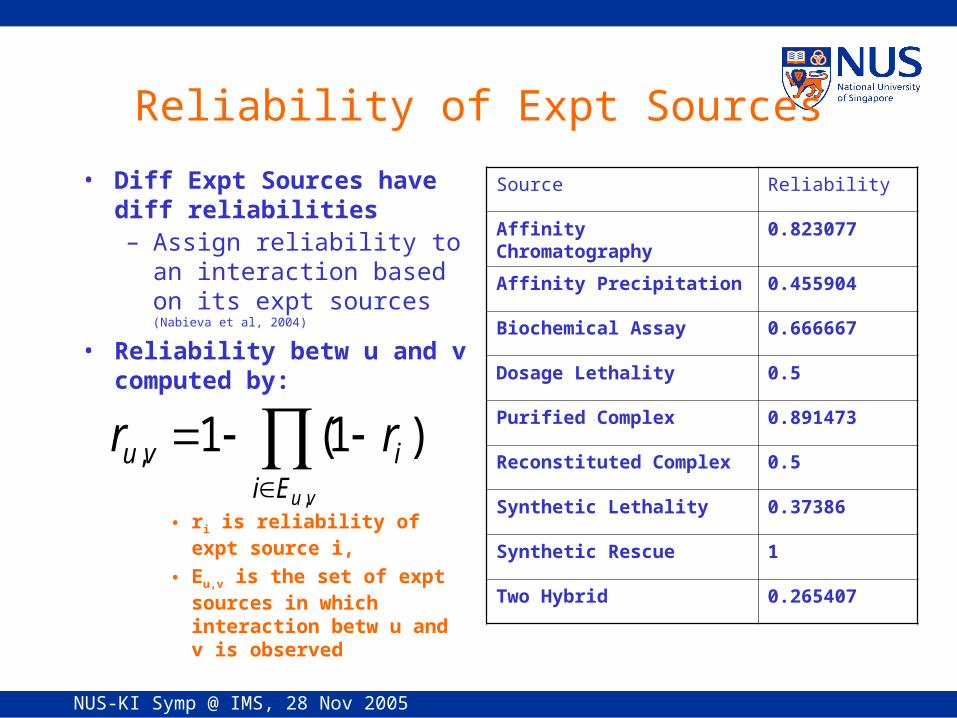
Reliability of Expt Sources
• Diff Expt Sources have diff reliabilities– Assign reliability to an
interaction based on its expt sources (Nabieva et al, 2004)
• Reliability betw u and v computed by:
• ri is reliability of expt source i,
• Eu,v is the set of expt sources in which interaction betw u and v is observed
Source Reliability
Affinity Chromatography 0.823077
Affinity Precipitation 0.455904
Biochemical Assay 0.666667
Dosage Lethality 0.5
Purified Complex 0.891473
Reconstituted Complex 0.5
Synthetic Lethality 0.37386
Synthetic Rescue 1
Two Hybrid 0.265407
vuEi
ivu rr,
)1(1,
NUS-KI Symp @ IMS, 28 Nov 2005
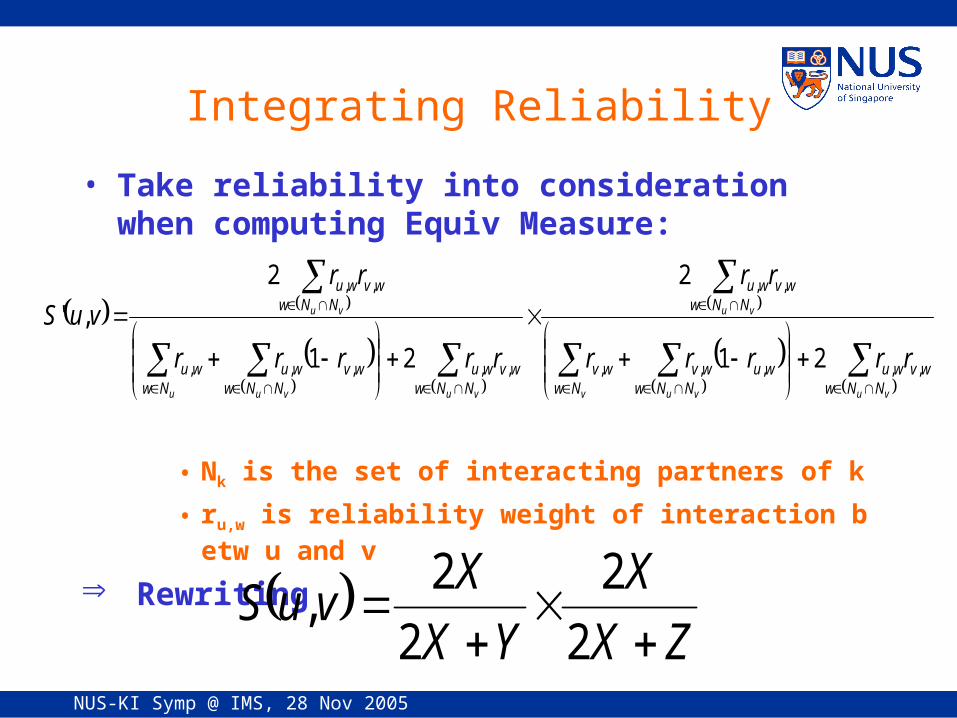
Integrating Reliability
• Take reliability into consideration when computing Equiv Measure:
• Nk is the set of interacting partners of k
• ru,w is reliability weight of interaction betw u and v
Rewriting
vuvuv
vu
vuvuu
vu
NNwwvwu
NNwwuwv
Nwwv
NNwwvwu
NNwwvwu
NNwwvwu
Nwwu
NNwwvwu
rrrrr
rr
rrrrr
rr
vuS
,,,,,
,,
,,,,,
,,
21
2
21
2
,'
ZX
X
YX
XvuS
2
2
2
2,
NUS-KI Symp @ IMS, 28 Nov 2005
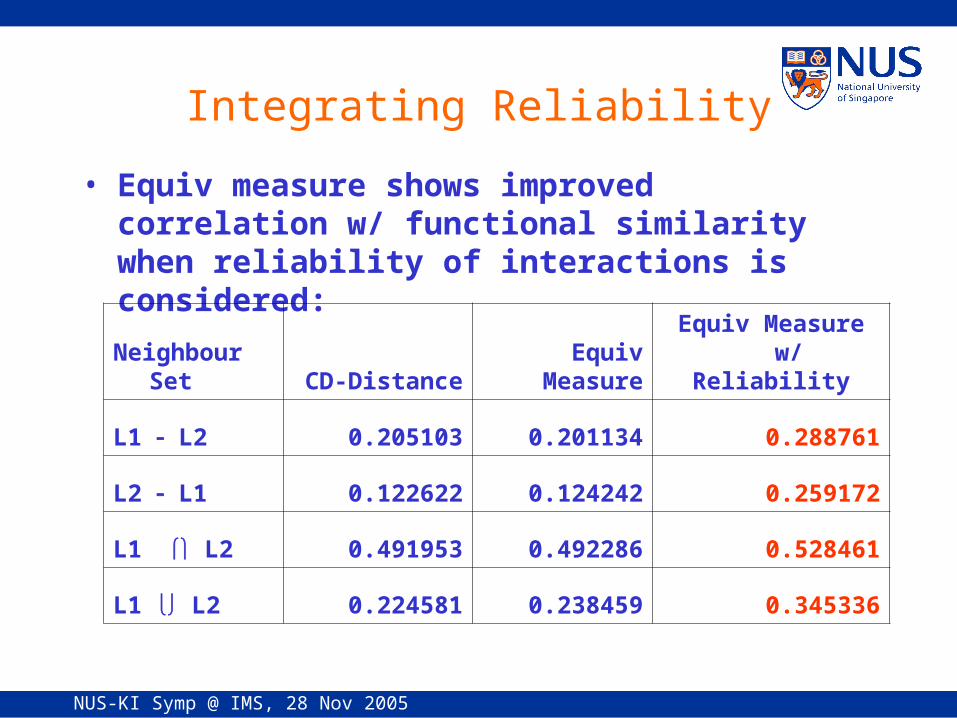
Integrating Reliability
• Equiv measure shows improved correlation w/ functional similarity when reliability of interactions is considered:
Neighbour Set CD-Distance
Equiv Measure
Equiv Measure w/Reliability
L1 L2 0.205103 0.201134 0.288761
L2 L1 0.122622 0.124242 0.259172
L1 L2 0.491953 0.492286 0.528461
L1 L2 0.224581 0.238459 0.345336
NUS-KI Symp @ IMS, 28 Nov 2005
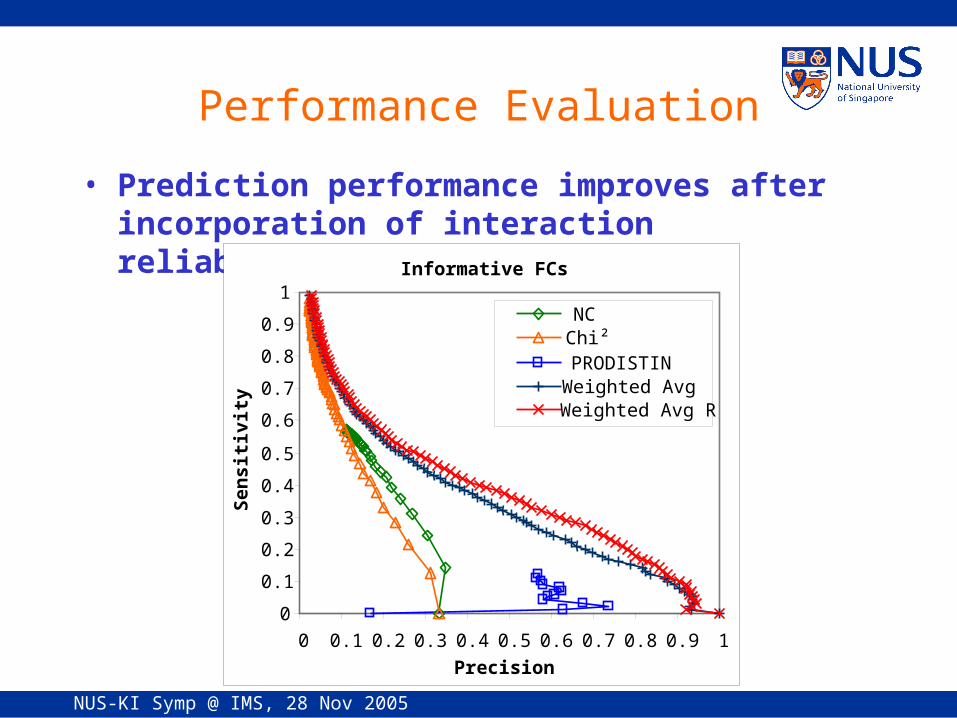
Performance Evaluation
• Prediction performance improves after incorporation of interaction reliability
Informative FCs
0
0.1
0.2
0.3
0.4
0.5
0.6
0.7
0.8
0.9
1
0 0.1 0.2 0.3 0.4 0.5 0.6 0.7 0.8 0.9 1
Precision
Sen
siti
vity
NCChi²PRODISTINWeighted AvgWeighted Avg R
NUS-KI Symp @ IMS, 28 Nov 2005
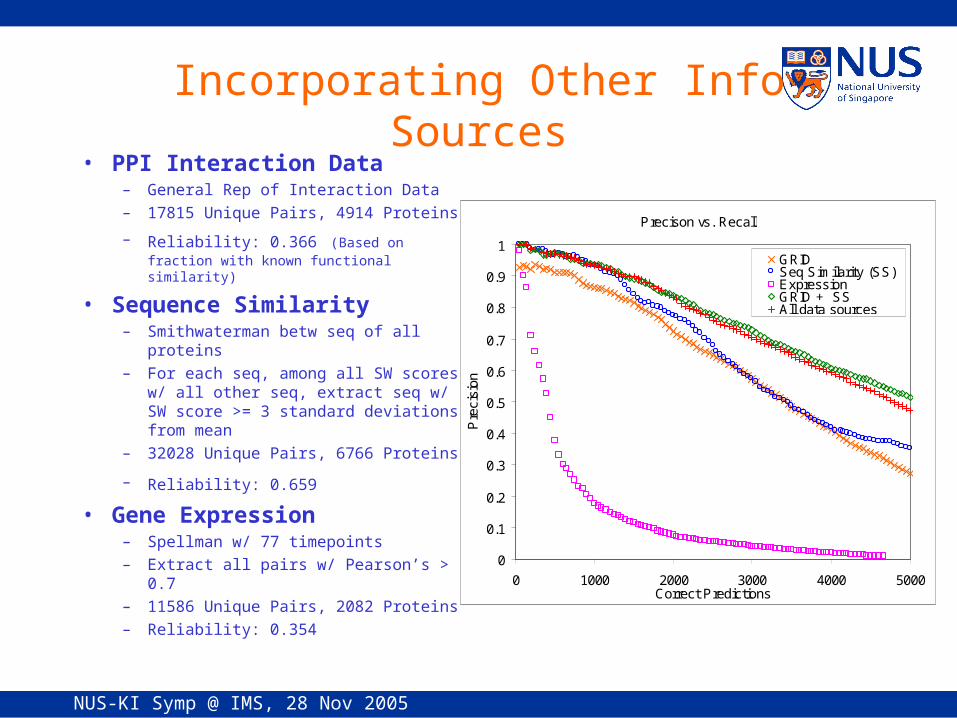
Precison vs. Recall
0
0.1
0.2
0.3
0.4
0.5
0.6
0.7
0.8
0.9
1
0 1000 2000 3000 4000 5000Correct Predictions
Pre
cisi
on
GRIDSeq Similarity (SS)ExpressionGRID + SSAll data sources
Incorporating Other Info Sources• PPI Interaction Data
– General Rep of Interaction Data– 17815 Unique Pairs, 4914 Proteins
– Reliability: 0.366 (Based on fraction with known functional similarity)
• Sequence Similarity– Smithwaterman betw seq of all
proteins– For each seq, among all SW scores
w/ all other seq, extract seq w/ SW score >= 3 standard deviations from mean
– 32028 Unique Pairs, 6766 Proteins
– Reliability: 0.659 • Gene Expression
– Spellman w/ 77 timepoints– Extract all pairs w/ Pearson’s > 0.7– 11586 Unique Pairs, 2082 Proteins– Reliability: 0.354
NUS-KI Symp @ IMS, 28 Nov 2005
Conclusions
• Indirect functional association is plausible
• It is found often in real interaction data
• It can be used to improve protein function prediction from protein interaction data
• It should be possible to incorporate interaction networks extracted by literature in the inference process within our framework for good benefit
NUS-KI Symp @ IMS, 28 Nov 2005
Acknowledgements
• Hon Nian Chua• Wing Kin Sung
NUS-KI Symp @ IMS, 28 Nov 2005
References
• Breitkreutz, B. J., Stark, C. and Tyers, N. (2003) The GRID: The General Repository for Interaction Datasets. Genome Biology, 4:R23
• Brun, C., Chevenet, F., Martin, D., Wojcik, J., Guenoche, A., Jacq, B. (2003) Functional classification of proteins for the prediction of cellular function from a protein-protein interaction network. Genome Biol. 5(1):R6
• Deng, M., Zhang, K., Mehta, S.Chen, T. and Sun, F. Z. (2003) Prediction of protein function using protein-protein interaction data. J. Comp. Biol. 10(6):947-960
• Hishigaki, H., Nakai, K., Ono, T., Tanigami, A., and Takagi, T. (2001) Assessment of prediction accuracy of protein function from protein-protein interaction data, Yeast, 18(6):523-531
• Lanckriet, G. R. G., Deng, M., Cristianini,, N., Jordan, M. I. and Noble, W. S. (2004) Kernel-based data fusion and its application to protein function prediction in yeast. Proc. Pacific Symposium on Biocomputing 2004. pp.300-311.
• Letovsky, S. and Kasif, S. (2003) Predicting protein function from protein/protein interaction data: a probabilistic approach. Bioinformatics. 19(Suppl.1):i197–i204
NUS-KI Symp @ IMS, 28 Nov 2005
References
• Ruepp A., Zollner A., Maier D., Albermann K., Hani J., Mokrejs M., Tetko I., Guldener U., Mannhaupt G., Munsterkotter M., Mewes H.W. (2004) The FunCat, a functional annotation scheme for systematic classification of proteins from whole genomes. Nucleic Acids Res. 14:32(18):5539-45
• Samanta, M. P., Liang, S. (2003) Predicting protein functions from redundancies in large-scale protein interaction networks. Proc Natl. Acad. Sci. U S A. 100(22):12579-83
• Schwikowski, B., Uetz, P. and Fields, S. (2000) A network of interacting proteins in yeast. Nature Biotechnology 18(12):1257-1261
• Titz B., Schlesner M. and Uetz P. (2004) What do we learn from high-throughput protein interaction data? Expert Rev.Proteomics 1(1):111–121
• Vazquez, A., Flammi, A., Maritan, A. and Vespignani, A. (2003) Global protein function prediction from protein-protein interaction networks. Nature Biotechnology. 21(6):697-670
• Zhou, X., Kao, M. C., Wong, W. H. (2002) Transitive functional annotation by shortest-path analysis of gene expression data. Proc. Natl. Acad. Sci. U S A. 99(20):12783-88