Embed Size (px)
Citation preview
Protein in Critical illnessEvidence and Current Practices
Rupinder Dhaliwal, RDManager, Research & NetworkingClinical Evaluation Research UnitQueens University, Kingston ON

Learning ObjectivesYou will become familiar with the
Latest evidence behind optimizing nutrition and protein intake in critical illness
Current protein intakes in ICU patients: results of the International Nutrition Survey 2013
Recent efforts at improving the delivery of protein in ICUs • The PEP UP Protocol • use of supplemental parenteral nutrition in high risk patients

Review of Evidence

Guidelines: SCCM/ASPEN 2009
Protein Energy assess adequacy protein provision regularly
BMI <30: 1.2-2.0 g/kg actual body wt/d Higher in burn/ multi-trauma (Grade: E)
provide >50%-65% of goal calories over the first week of hospitalization (Grade: C)
Add refs or papers

Guidelines: ESPEN 2009Protein Energy
PN1.3–1.5 g/kgideal body weight plus adequate energy
ENacute and initial phase: avoid excess of 20–25 kcal/kg BW/day During recovery: 25–30 total kcal/kgBW/day (C))PN acute illness: meet measured energyexpenditure in order to decrease negative energy balance (Grade B). If no indirect calorimetry: 25 kcal/kg/day increasing to target over the next 2–3 days(Grade C).
Add refs or papers
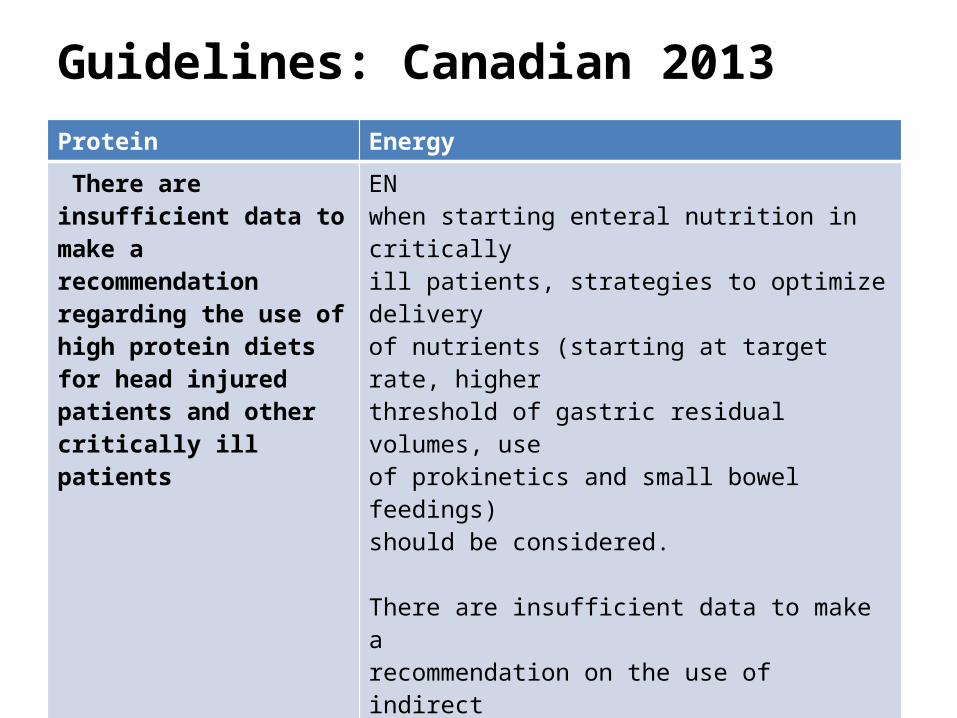
Guidelines: Canadian 2013Protein Energy
There are insufficient data to make a recommendation regarding the use of high protein diets for head injured patients and other critically ill patients
EN when starting enteral nutrition in critically ill patients, strategies to optimize delivery of nutrients (starting at target rate, higher threshold of gastric residual volumes, use of prokinetics and small bowel feedings) should be considered.
There are insufficient data to make a recommendation on the use of indirect calorimetry vs. predictive equations for determining energy needs for nutrition or to guide when nutrition is to be supplemented in critically ill patients.
There are insufficient data to make a recommendation on the use of hypocaloric enteral nutrition in critically ill patients.PNBased on 4 level 2 studies, in critically ill patients who are not malnourished, are tolerating some EN, or when parenteral nutrition is indicated for short term use (< 10 days), low dose parenteral nutrition should be considered. There are insufficient data to make recommendations about the use of low dose parenteral nutrition in the following patients: those requiring PN for long term (> 10 days); obese critically ill patients and malnourished critically ill patients. Practitioners will have to weigh the safety and benefits of low dose PN on an individual case-by-case basis in these latter patient populations.

Conflicting evidenceSurviving Sepsis Campaign Guidelines CCM Feb 2013
Topic Key points of SSC guidelines on EN Key points of Canadian guidelines on EN
Early vs. Delayed Nutrient Intake
Administer oral or enteral (if necessary) feedings, as tolerated, rather than either complete fasting or provision of only intravenous glucose within the first 48 hours after a diagnosis of severe sepsis/septic shock (grade 2C).
Early EN (within 24-48 hours following admission to ICU) is recommended in critically ill patients.
When starting EN in critically ill patients, strategies to optimize delivery of nutrients (starting at target rate, higher threshold of gastric residual volumes, use of prokinetics and small bowel feedings) should be considered.
Trophic vs. Full Feeds
Avoid mandatory full caloric feeding in the first week but rather suggest low dose feeding (e.g., up to 500 calories per day), advancing only as tolerated (grade 2B).
In patients with Acute Lung Injury, an initial strategy of trophic feeds for 5 days should not be considered.
Conflicting evidence
– EDEN study results– Rice results– Arabi
Conclude that need to focus on “high risk patients”..Charlene to discuss this in detail

Recent review on protein
Hoffer et al – Meta-analysis of 13 RCTs – Show results– Conclusions: 2.5 g/kg/day is safe and effective

• Point prevalence survey of nutrition practices in ICU’s around the world conducted Jan. 27, 2007
• Enrolled 2772 patients from 158 ICU’s over 5 continents
• Included ventilated adult patients who remained in ICU >72 hours

0 500 1000 1500 20000
10
20
30
40
50
60
All Patients< 2020-2525-3030-3535-40>40
Protein/Calories Delivered
Mo
rtal
ity
(%)
Relationship of Protein/Caloric Intake, 60 day Mortality and BMI
BMI
25%25% 50% 75% 100%

• 113 select ICU patients with sepsis or burns
• On average, receiving 1900 kcal/day and 84 grams of protein
• No significant relationship with energy intake but……
Clinical Nutrition 2012

Observational studies: protein results in better outcomes
• Elke Critical Care 2013:
• Only briefly mention this but Charlene to talk about results in more detail?

Current Practices
INS 2013

International Nutrition Survey (INS) 2013
Purposeilluminate gaps between current practice & guidelinesidentify practice areas to target for change
Historystarted in Canada in 20015th International audit (2007, 2008, 2009, 2011 & 2013)
MethodsObservational, point prevalence study

Methods
• Each ICU enrolled 20 consecutive patients• ICU LOS> 72 hrs• vented within first 48 hrs
• Data abstracted from chart• Hospital and ICU characteristics– Patient information– Baseline Nutrition Assessment– Daily Nutrition data – Patient outcomes (e.g. mortality, length of stay)
• Benchmarking Report provided
• Best of the Best Competition if n ≥ 20 patients

www.criticalcarenutrition.com
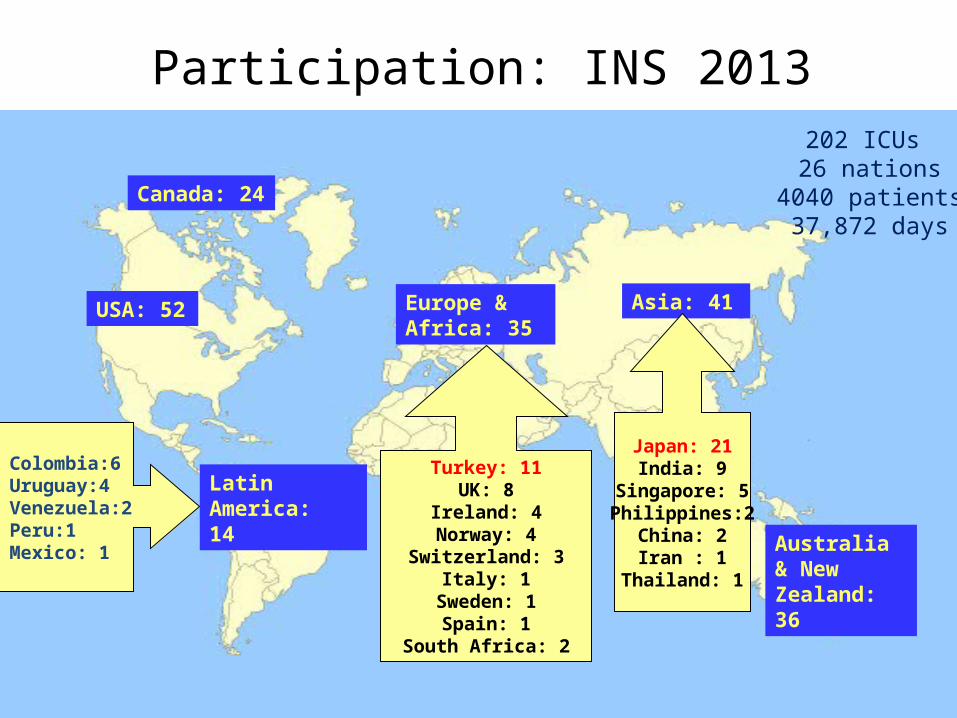
Canada: 24
USA: 52
Australia & New Zealand: 36
Europe & Africa: 35
Latin America: 14
Asia: 41
Colombia:6Uruguay:4Venezuela:2Peru:1Mexico: 1
Turkey: 11UK: 8
Ireland: 4Norway: 4
Switzerland: 3Italy: 1
Sweden: 1Spain: 1
South Africa: 2
Japan: 21India: 9
Singapore: 5Philippines:2
China: 2Iran : 1
Thailand: 1
Participation: INS 2013202 ICUs 26 nations
4040 patients37,872 days

ICU Characteristics
Characteristics Total (n =202)Hospital Type
Teaching 170 (84.2%)
Non-teaching 32( 15.8%)
Size of Hospital (beds)
Mean (Range) 581 (50-2500)
ICU Structure
Open 51 (25.2%)
Closed 148 (73.3%)
Other 3 (1.5%)
Size of ICU (beds)
Mean (Range) 17(4-86)
Designated Medical Director 185 (91.6%)
Presence of Dietitian(s) 164 (81.2%)
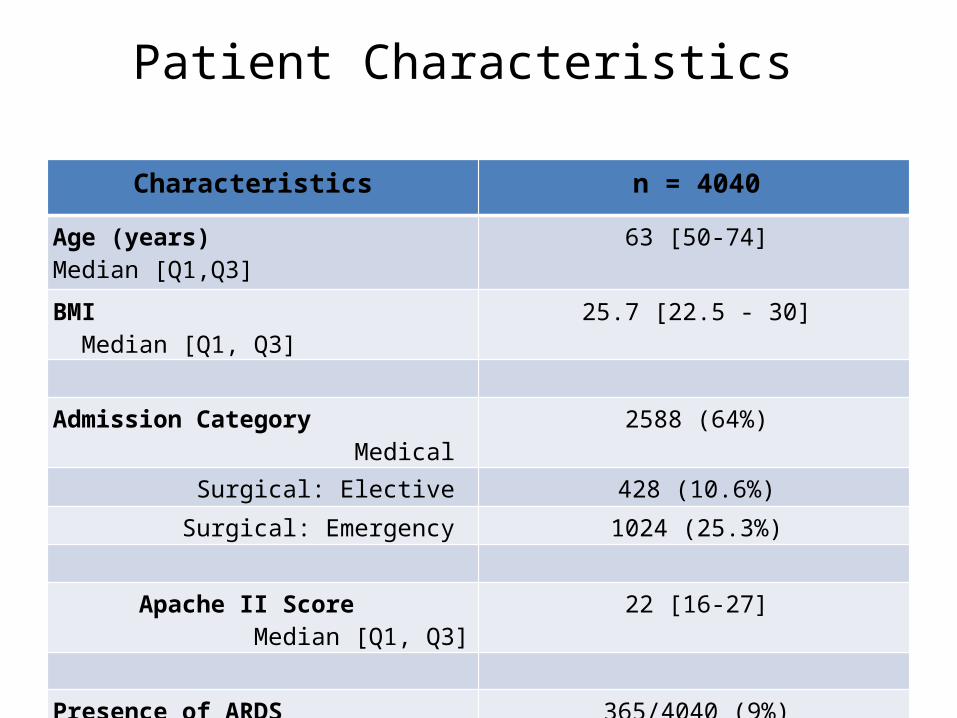
Patient Characteristics
Characteristics n = 4040
Age (years) Median [Q1,Q3] 63 [50-74]
BMI Median [Q1, Q3] 25.7 [22.5 - 30]
Admission Category Medical 2588 (64%)
Surgical: Elective 428 (10.6%)
Surgical: Emergency 1024 (25.3%)
Apache II Score Median [Q1, Q3] 22 [16-27]
Presence of ARDS 365/4040 (9%)

Clinical Outcomes
Outcomes n=4040
Length of Mechanical Ventilation (days)
Median [Q1, Q3] 6.6 [3.1, 13.6]
Length of ICU Stay (days)
Median [Q1, Q3] 10 [5.8, 18.9]
Length of Hospital Stay (days)
Median [Q1,Q3] 21 [10.8, 44.9.]
Patient Died (within 60 days)
Yes 991 (24.5%)


INS 2013


Barriers: innovative approaches to overcome these
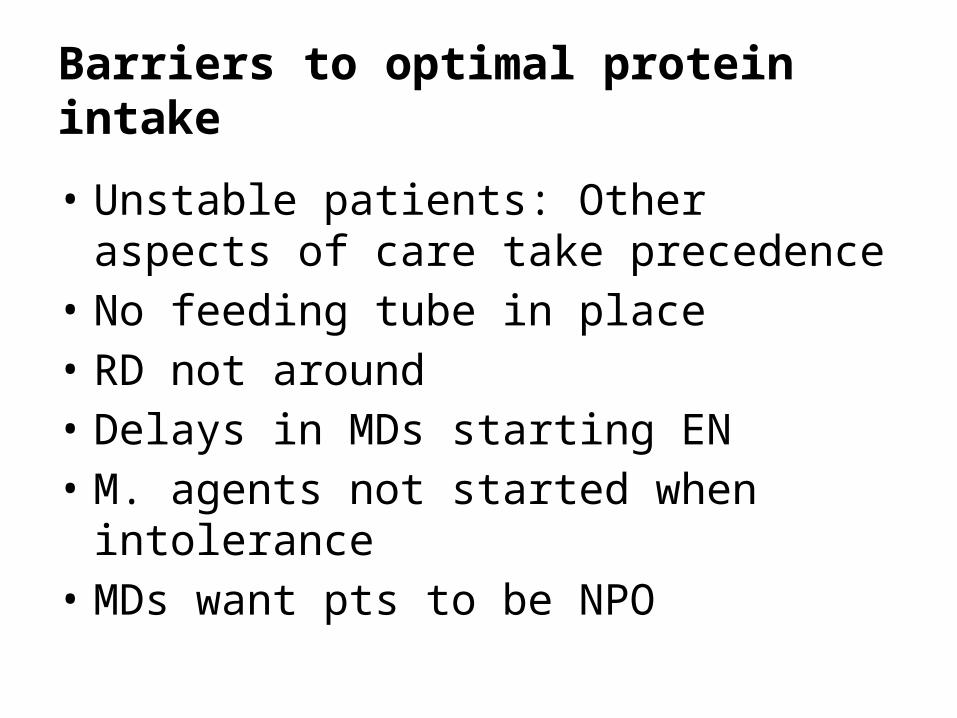
Barriers to optimal protein intake
• Unstable patients: Other aspects of care take precedence
• No feeding tube in place• RD not around• Delays in MDs starting EN• M. agents not started when intolerance• MDs want pts to be NPO
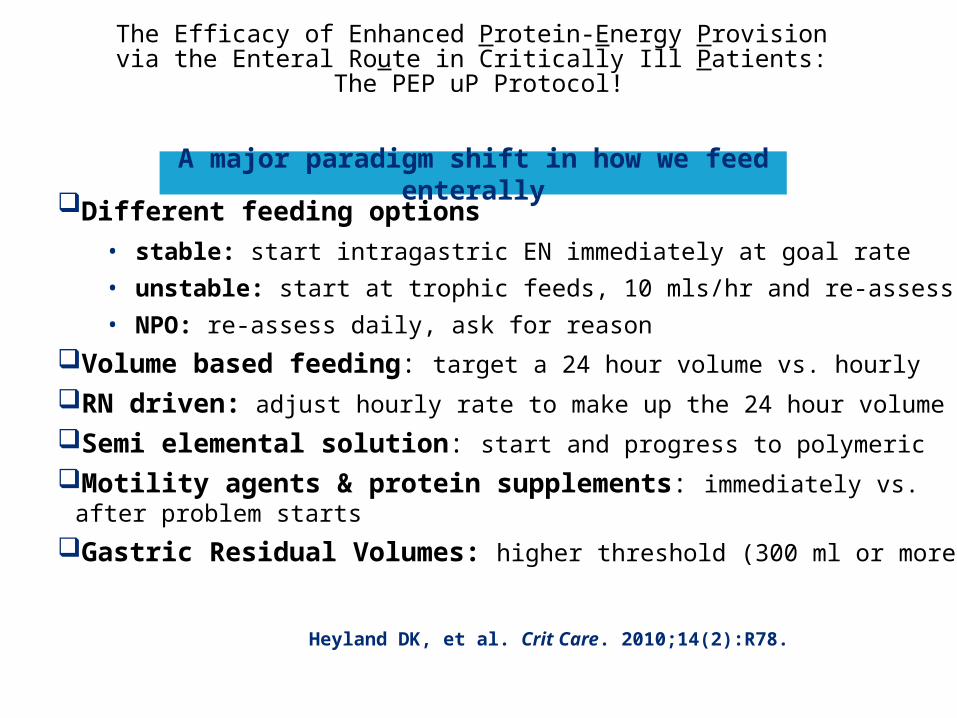
Different feeding options • stable: start intragastric EN immediately at goal rate• unstable: start at trophic feeds, 10 mls/hr and re-assess• NPO: re-assess daily, ask for reason
Volume based feeding: target a 24 hour volume vs. hourly RN driven: adjust hourly rate to make up the 24 hour volumeSemi elemental solution: start and progress to polymericMotility agents & protein supplements: immediately vs. after problem startsGastric Residual Volumes: higher threshold (300 ml or more).
The Efficacy of Enhanced Protein-Energy Provision via the Enteral Route in Critically Ill Patients:
The PEP uP Protocol!
A major paradigm shift in how we feed enterally
Heyland DK, et al. Crit Care. 2010;14(2):R78.

A multi-center cluster randomized trial
Critical Care Medicine Aug 2013

Research Questions
Primary: What is the effect of the new innovative feeding protocol, the PEP uP protocol, combined with a nursing educational intervention on EN intake compared to usual care?
Secondary: What is the safety, feasibility and acceptability of the new PEP uP protocol?
Hypothesis : this feeding protocol combined with a nurse-directed nutrition educational intervention will be safe, acceptable, and effectively increase protein and energy delivery to critically ill patients

Design
Protocol utilized in all patient mechanically intubated within the first 6 hours after ICU admission
Focus on those who remained mechanically ventilated > 72 hours
18 sites
Control
Intervention
Baseline Follow-up6-9 months later
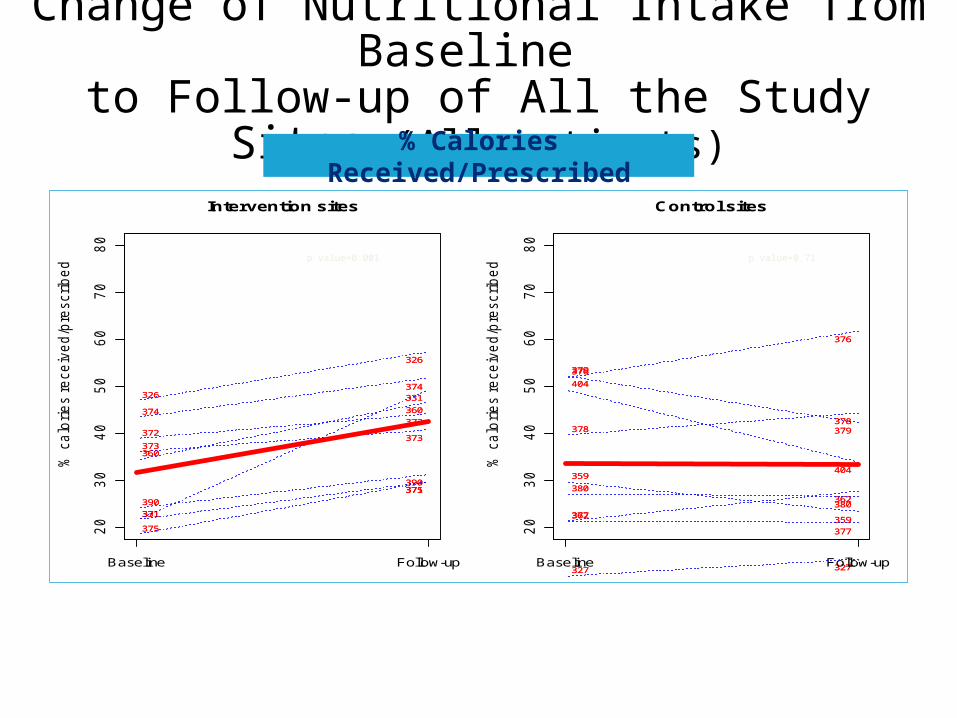
Change of Nutritional Intake from Baseline to Follow-up of All the Study Sites (All patients)
% Calories Received/Prescribed
% c
alo
rie
s r
ece
ive
d/p
rescri
be
d
326326
326326
331331
331331
360360
360360
371371
371371
372372372372
373373373373
374374
374374
375375
375375
390390
390390
Baseline Follow-up
20
30
40
50
60
70
80
p value <0.0001
Intervention sites
% c
alo
rie
s r
ece
ive
d/p
rescri
be
d
p value=0.65
327327 327327
p value=0.65p value=0.65
359359
359359
p value=0.65p value=0.65
362362
362362
p value=0.65p value=0.65p value=0.65p value=0.65p value=0.65p value=0.65
376376
376376
p value=0.65
377377
377377
p value=0.65
378378378378
p value=0.65
379379
379379
p value=0.65
380380
380380
p value=0.65p value=0.65
404404
404404
p value=0.65p value=0.65
Baseline Follow-up
20
30
40
50
60
70
80
Control sites
p value=0.001 p value=0.71

% p
rote
in r
ece
ive
d/p
rescri
be
d
326326
326326
331331
331331
360360
360360
371371
371371
372372
372372
373373 373373
374374
374374
375375
375375390390
390390
Baseline Follow-up
20
30
40
50
60
70
80
p value <0.0001
Intervention sites
% p
rote
in r
ece
ive
d/p
rescri
be
d
p value=0.78
327327 327327
p value=0.78p value=0.78
359359
359359
p value=0.78p value=0.78
362362 362362
p value=0.78p value=0.78p value=0.78p value=0.78p value=0.78p value=0.78
376376
376376
p value=0.78
377377
377377
p value=0.78
378378
378378
p value=0.78
379379
379379
p value=0.78
380380
380380
p value=0.78p value=0.78
404404
404404
p value=0.78p value=0.78
Baseline Follow-up
20
30
40
50
60
70
80
Control sites
% Protein Received/Prescribed
Change of Nutritional Intake from Baseline to Follow-up of All the Study Sites (All patients)
p value=0.005 p value=0.81

-1
1
3
5
7
9
11
13
15
Vomiting Regurgitation Macro Aspiration Pneumonia
Intervention - Baseline Intervention - Follow-up
Control - Baseline Control - Follow-up
Complications (All patients – n = 1,059)
p > 0.05
Per
cen
t
Vomiting Regurgitation Macro Aspiration Pneumonia

What we provided access to an educational DVD presentation to train the multidisciplinary teamsupporting tools such as visual aids and protocol templates (website)access to a member of the Critical Care Nutrition team for supportaccess to an online discussion group around questions unique to PEP uPa detailed site report, showing nutrition performance in INS Survey 2013online access to a novel nutrition monitoring tool
Canadian PEP uP CollaborativeNational Quality improvement collaborative in conjunction with Nestle Health
Science

Results of the Canadian PEP uP Collaborative
Fall of 2012-Spring 2013
8 ICUs implemented PEP uP protocol
Compared to 16 ICUs (concurrent control group)
All evaluated their nutrition performance (INS 2013)
Heyland JPEN 2014 (in press)
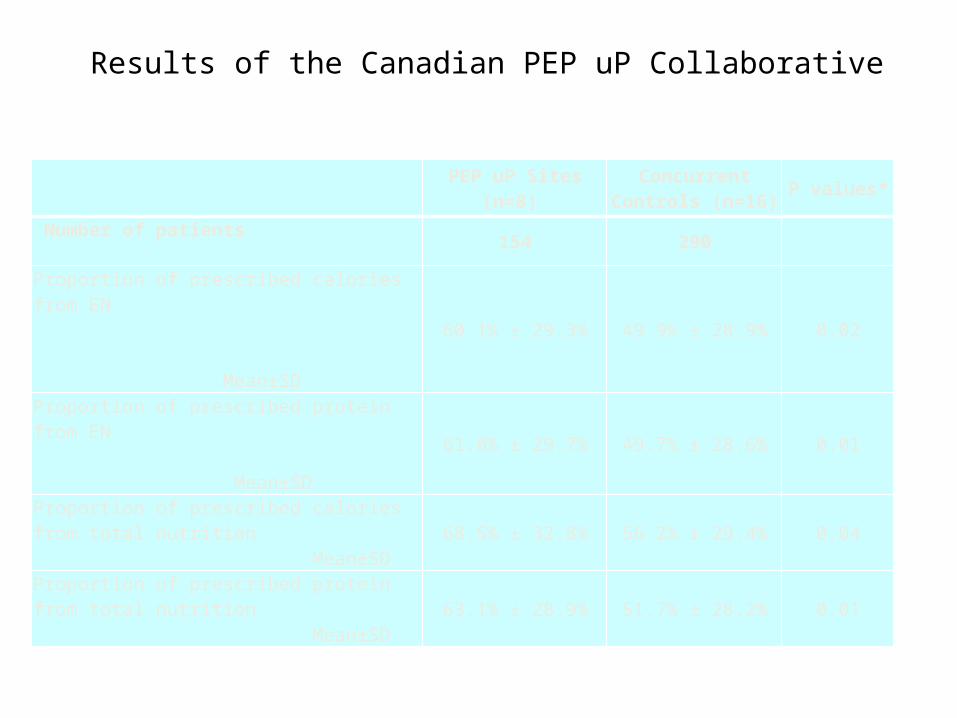
Results of the Canadian PEP uP Collaborative
PEP uP Sites (n=8) Concurrent
Controls (n=16)P values*
Number of patients154 290
Proportion of prescribed calories from EN Mean±SD
60.1% ± 29.3% 49.9% ± 28.9% 0.02
Proportion of prescribed protein from EN Mean±SD
61.0% ± 29.7% 49.7% ± 28.6% 0.01
Proportion of prescribed calories from total nutrition Mean±SD 68.5% ± 32.8% 56.2% ± 29.4% 0.04
Proportion of prescribed protein from total nutrition Mean±SD 63.1% ± 28.9% 51.7% ± 28.2% 0.01

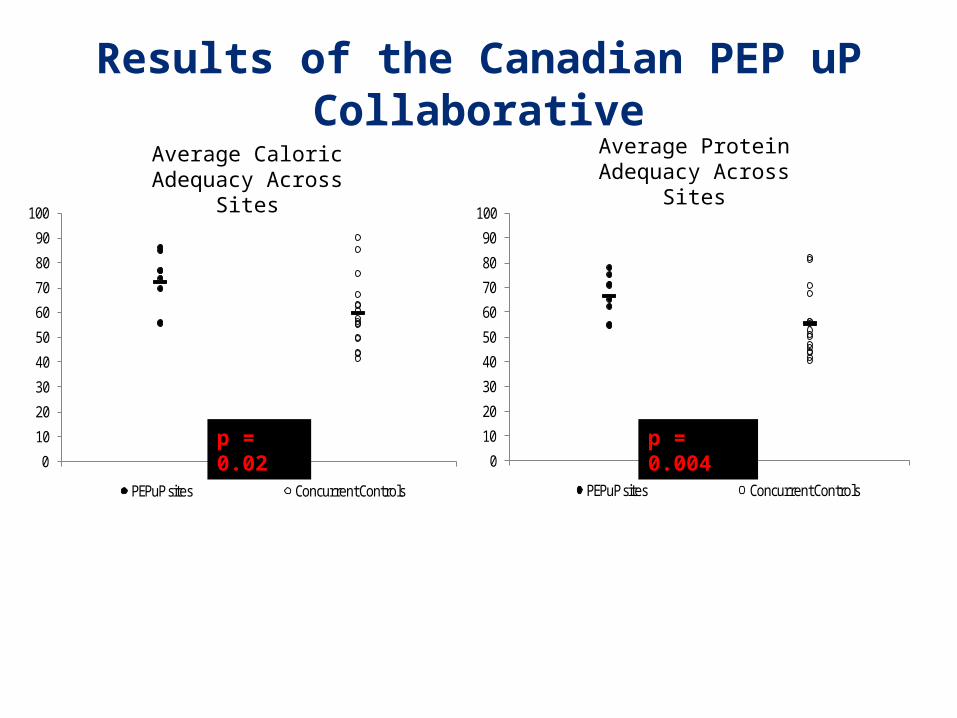
Results of the Canadian PEP uP Collaborative
Results of the Canadian PEP uP Collaborative
0
10
20
30
40
50
60
70
80
90
100
PEPuP sites Concurrent Controls
p=0.020
10
20
30
40
50
60
70
80
90
100
PEPuP sites Concurrent Controls
p=0.004
Average Caloric Adequacy Across Sites
Average Protein Adequacy Across Sites
p = 0.02 p = 0.004
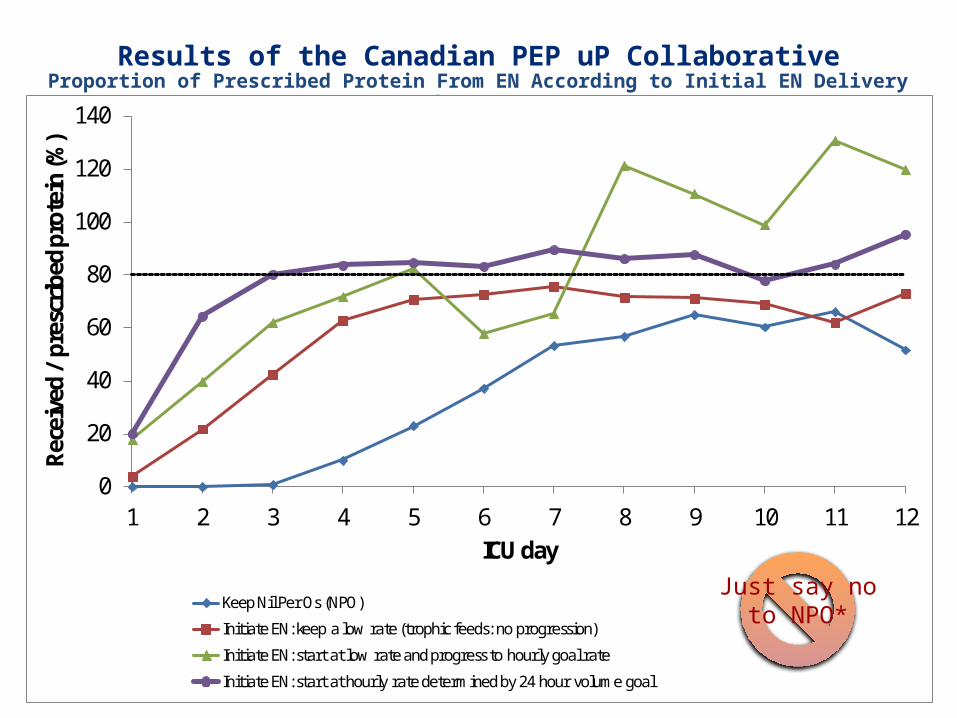
Results of the Canadian PEP uP CollaborativeProportion of Prescribed Protein From EN According to Initial EN Delivery Strategy
0
20
40
60
80
100
120
140
1 2 3 4 5 6 7 8 9 10 11 12
Rece
ived
/ pr
escr
ibed
pro
tein
(%)
ICU day
Keep Nil Per Os (NPO)
Initiate EN: keep a low rate (trophic feeds: no progression)
Initiate EN: start at low rate and progress to hourly goal rate
Initiate EN: start at hourly rate determined by 24 hour volume goal
Just say noto NPO*

Results of the Canadian PEP uP Collaborative
Patients in PEP uP Sites were much more likely to*: receive protein supplements (72% vs. 48%) receive 80 % of protein requirements by day 3 (46% vs. 29%) receive Semi- or elemental solution within first 2 days of admission (45% vs. 7%) receive a motility agent within first 2 days of admission (55% vs10%)
No difference in glycemic control
*All comparisons are statistically significant p<0.05

Next StepsUS PEP uP Collaborative Started April 2014 9 sites as either Tier 1 or Tier 2Using higher protein semi elemental formulaSupported by Nestle Health Science US
Latin American PEP uP CollaborativeStarting soon!Aimed at Spanish speaking ICUsTranslation and Implementation: to be led by
Willy Manzanares, MD, Uruguay

When limited via EN route?
• Use of supplemental PN
• TOP UP Trial in BMI ≥35 and <25

Summary