Embed Size (px)
Citation preview
PROCEEDINGS Open Access
Prediction of protein-protein interactions fromamino acid sequences with ensemble extremelearning machines and principalcomponent analysisZhu-Hong You1*†, Ying-Ke Lei2†, Lin Zhu3, Junfeng Xia4, Bing Wang5
From The 2012 International Conference on Intelligent Computing (ICIC 2012)Huangshan, China. 25-29 July 2012
Abstract
Background: Protein-protein interactions (PPIs) play crucial roles in the execution of various cellular processes andform the basis of biological mechanisms. Although large amount of PPIs data for different species has beengenerated by high-throughput experimental techniques, current PPI pairs obtained with experimental methodscover only a fraction of the complete PPI networks, and further, the experimental methods for identifying PPIs areboth time-consuming and expensive. Hence, it is urgent and challenging to develop automated computationalmethods to efficiently and accurately predict PPIs.
Results: We present here a novel hierarchical PCA-EELM (principal component analysis-ensemble extreme learningmachine) model to predict protein-protein interactions only using the information of protein sequences. In the proposedmethod, 11188 protein pairs retrieved from the DIP database were encoded into feature vectors by using four kinds ofprotein sequences information. Focusing on dimension reduction, an effective feature extraction method PCA was thenemployed to construct the most discriminative new feature set. Finally, multiple extreme learning machines were trainedand then aggregated into a consensus classifier by majority voting. The ensembling of extreme learning machineremoves the dependence of results on initial random weights and improves the prediction performance.
Conclusions: When performed on the PPI data of Saccharomyces cerevisiae, the proposed method achieved87.00% prediction accuracy with 86.15% sensitivity at the precision of 87.59%. Extensive experiments are performedto compare our method with state-of-the-art techniques Support Vector Machine (SVM). Experimental resultsdemonstrate that proposed PCA-EELM outperforms the SVM method by 5-fold cross-validation. Besides, PCA-EELMperforms faster than PCA-SVM based method. Consequently, the proposed approach can be considered as a newpromising and powerful tools for predicting PPI with excellent performance and less time.
BackgroundProteins are crucial for almost all of functions in the cell,including metabolic cycles, DNA transcription and replica-tion, and signalling cascades. Usually, proteins rarely per-form their functions alone; instead they cooperate with
other proteins by forming a huge network of protein-protein interactions (PPIs) [1]. PPIs are responsible for themajority of cellular functions. In the past decades, manyinnovative techniques for detecting PPIs have been devel-oped [1-3]. Due to the progress in large-scale experimentaltechnologies such as yeast two-hybrid (Y2H) screens [2,4],tandem affinity purification (TAP) [1], mass spectrometricprotein complex identification (MS-PCI) [3] and otherhigh-throughput biological techniques for PPIs detection,a large amount of PPIs data for different species has been
* Correspondence: [email protected]† Contributed equally1College of Computer Science and Software Engineering, ShenzhenUniversity, Shenzhen, Guangdong 518060, ChinaFull list of author information is available at the end of the article
You et al. BMC Bioinformatics 2013, 14(Suppl 8):S10http://www.biomedcentral.com/1471-2105/14/S8/S10
© 2013 You et al.; licensee BioMed Central Ltd. This is an open access article distributed under the terms of the Creative CommonsAttribution License (http://creativecommons.org/licenses/by/2.0), which permits unrestricted use, distribution, and reproduction inany medium, provided the original work is properly cited.
accumulated [1-5]. However, the experimental methodsare costly and time consuming, therefore current PPI pairsobtained from experiments only covers a small fraction ofthe complete PPI networks [6]. In addition, large-scaleexperimental methods usually suffer from high rates ofboth false positive and false negative predictions [6-8].Hence, it is of great practical significance to develop thereliable computational methods to facilitate the identifica-tion of PPIs [9-11].A number of computational methods have been pro-
posed for the prediction of PPIs based on different datatypes, including phylogenetic profiles, gene neighbor-hood, gene fusion, literature mining knowledge, andsequence conservation between interacting proteins[6-9,12-15]. There are also methods that combine inter-action information from several different data sources[16]. However, these methods cannot be implemented ifsuch pre-knowledge about the proteins is not available.Recently, a couple of methods which derive informationdirectly from amino acid sequence are of particularinterest [7-9,11]. Many researchers have engaged in thedevelopment of sequences-based method for discoveringnew PPIs, and the experiment results showed that theinformation of amino acid sequences alone is sufficientto predict PPIs[7,9,11]. Among them, one of the excel-lent works is a SVM-based method developed by Shenet al [11]. In the study, the 20 amino acids were clus-tered into seven classes according to their dipoles andvolumes of the side chains, and then the conjoint triadmethod abstracts the features of protein pairs based onthe classification of amino acids. When applied to pre-dict human PPIs, this method yields a high predictionaccuracy of 83.9%. Because the conjoint triad methodcannot takes neighboring effect into account and theinteractions usually occur in the discontinuous aminoacids segments in the sequence, on the other work Guoet al. developed a method based on SVM and auto cov-ariance to extract the interactions information in thediscontinuous amino acids segments in the sequence[9]. Their method yielded a prediction accuracy of86.55%, when applied to predicting saccharomyces cere-visiae PPIs. In our previous works, we also obtainedgood prediction performance by using autocorrelationdescriptors and correlation coefficient, respectively[8,17].The general trend in current study for predicting PPIs
has focused on high accuracy but has not consideredthe time taken to train the classification models, whichshould be an important factor of developing a sequence-based method for predicting PPIs because the totalnumber of possible PPIs is very large. Therefore somecomputational models with high classification accuracymay not be satisfactory when considering the trade-offbetween the classification accuracy and the time for
training the models. Recently, Huang et al. proposed anew learning algorithm called extreme learning machine(ELM), which randomly assigns all the hidden nodeparameters of generalized single-hidden layer feed-for-ward networks (SLFNs) and analytically determines theoutput weights of SLFNs[18-21]. Previous works shownthat ELM provides efficient unified solutions to general-ized feed-forward networks including kernel learning.Consequently, ELM offers significant advantages such asfast learning speed, ease of implementation, and leasthuman intervention. ELM has good potential as a viablealternative technique for large-scale computing and arti-ficial intelligence. On the other hand, single ELM modelis sometime difficult to achieve a satisfactory perfor-mance for the complex processes with strong nonlinear-ity, time variant and highly uncertainty. Ensemble ELMmethods have received special attentions because it canimprove the accuracy of predictor and achieve betterstability through training a set of models and then com-bining them for final predictions [22-24]. For example,Lan et al. proposed an ensemble of online sequentialELM with more stable and accurate results [25]. Zhao etal. proposed an ensemble ELM soft sensing model foreffluent quality prediction based on kernel principalcomponent analysis (KPCA), whose reliability and accu-racy outperforms other models [24]. In this study, anensemble ELM model was built to predict the proteininteractions.Previous works have pointed out that using feature
selection or feature extraction before conducting the clas-sification tasks can improve the classification accuracy[26].Here, we attempt to examine the effectiveness of thedimensionality reduction technique before constructingthe ELM classifier for the PPI prediction. Principal compo-nent analysis (PCA) is utilized to do the feature extractionwhich projects the original feature space into a new space,on which the ELM is used to perform the prediction task.The effectiveness of the proposed PCA-ELM is examinedin terms of classification accuracy on the PPI dataset.Promisingly, as can be seen that the developed PCA-ELMPPI prediction system has achieved high accuracy andruns very fast as well.In this study, we report a new sequence-based method
for the prediction of protein-protein interactions fromamino acid sequences with ensemble ELM and PCA aim-ing at improving the efficiency and effectiveness of theclassification accuracy. Firstly, four kinds of usefulsequence-based features such as Auto Covariance (AC),Conjoint triad (CT), Local descriptor (LD) and Moranautocorrelation (MAC) are extracted from each proteinsequence to mine the interaction information in thesequence. Secondly, in order to reduce the computationalcomplexity and enhance the overall accuracy of the pre-dictor, an effective feature reduction method PCA is
You et al. BMC Bioinformatics 2013, 14(Suppl 8):S10http://www.biomedcentral.com/1471-2105/14/S8/S10
Page 2 of 11

employed to extract the most discriminative new featuresubset. Finally, ELM is chosen as the weak learningmachine and the ensemble ELM classifier is constructedusing the vectors of resulting feature subset as input. Toevaluate the performance, the proposed method wasapplied to Saccharomyces cerevisiae PPI data. The experi-ment results show that our method achieved 87% predic-tion accuracy with 86.15% sensitivity at the precision of87.59%. The prediction model was also assessed using theindependent dataset of the Escherichia coli PPIs andyielded 87.5% prediction accuracy, which further demon-strates the effectiveness of our method.
ResultsIn this section, we first discuss the biological datasetsand evaluation strategies used in performance compari-sons. Next we present results for comparing the PCA-EELM method to state-of-the-art classifier for predictingprotein interaction pairs in yeast.
Generation of the data setWe evaluated the proposed method with the dataset ofphysical protein interactions from yeast used in the studyof Guo et al. [9]. The PPI dataset was collected fromSaccharomyces cerevisiae core subset of database of inter-acting proteins (DIP), version DIP 20070219. After theredundant protein pairs which contain a protein withfewer than 50 residues or have ≥40% sequence identitywere remove, the remaining 5594 protein pairs comprisethe final positive dataset. The 5594 non-interacting proteinpairs were generated from pairs of proteins whose sub-cel-lular localizations are different. The whole dataset consistsof 11188 protein pairs, where half are from the positivedataset and half are from the negative dataset.
Evaluation measuresTo measure the performance of the proposed method,we adopted 5-fold cross validation and four parameters,the overall prediction accuracy (Accu.), sensitivity(Sens.), precision (Prec.) and Matthews correlation coef-ficient (MCC). They are defined as follows:
ACC =TP + TN
TP + FP + TN + FN(1)
SN =TP
TP + FN(2)
PE =TP
TP + FP(3)
MCC =TP × TN − FP × FN√
(TP + FN) × (TN + FP) × (TP + FP) × (TN + FN)(4)
where true positive (TP) is the number of true PPIsthat are predicted correctly; false negative (FN) is thenumber of true PPIs that are predicted to be non-inter-acting pairs; false positive (FP) is the number of truenon-interacting pairs that are predicted to be PPIs, andtrue negative (TN) is the number of true non-interactingpairs that are predicted correctly. MCC denotes Math-ews correlation coefficient.
Experimental settingThe proposed PCA-EELM protein interaction predictionmethod was implemented using MATLAB platform. ForELM, the implementation by Zhu and Huang availablefrom http://www.ntu.edu.sg/home/egbhuang was used.Regarding SVM, LIBSVM implementation availablefrom http://www.csie.ntu.edu.tw/~cjlin/libsvm was uti-lized, which was originally developed by Chang and Lin.All the simulations were carried out on a computer with3.1 GHz 2-core CPU, 6 GB memory and Windows oper-ating system.All ELM in the ensemble classifier had the same num-
ber of hidden layer neurons but different random hid-den layer weights and output layer weights. EnsembleELM models were built via the stratified 5-fold cross-validation procedure through increasing gradually thenumber of hidden neurons from 20 to 300 in interval of10. The best number of neurons was adapted to createthe training model. The sigmoid activation function wasused to compute the hidden layer output matrix. Thefinal model was an ensemble of 15 extreme learningmachines, and the outputs of ensemble ELM modelwere determined by combining the outputs of the eachindividual ELM by majority voting. For SVM, the RadialBasis Function was chosen as the kernel function andthe optimized parameters (C, γ ) were obtained with agrid search approach.
Prediction performance of PCA-EELM modelWe evaluated the performance of the proposed PCA-EELM model using the DIP PPIs data as investigated inGuo et al. [9]. In order to evaluate the prediction abilityof our ELM classifiers, we also implemented a SupportVector Machine (SVM) learning algorithm which isthought of as the state-of-the-art classifier. We havecompared our ensemble ELM based recognition schemeagainst methods utilizing SVM with C = 8, g = 0.5, l =30. For the ensemble ELM and SVM classifiers, all ofthe input values were normalized in the range of [-1,1].To reduce the bias of training and testing data, a 5-foldcross-validation technique is adopted. More specifically,the dataset is divided into 5 subsets, and the holdoutmethod is reiterated 5 times. Each time four of the fivesubsets are put together as the training dataset, and the
You et al. BMC Bioinformatics 2013, 14(Suppl 8):S10http://www.biomedcentral.com/1471-2105/14/S8/S10
Page 3 of 11
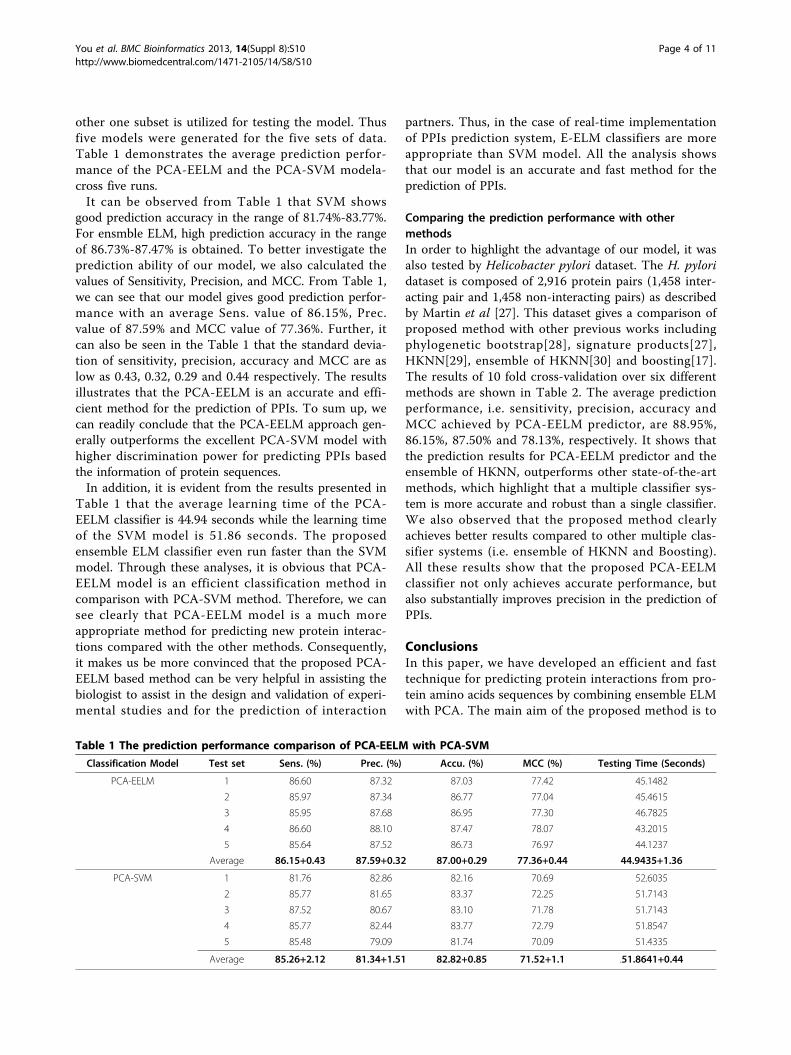
other one subset is utilized for testing the model. Thusfive models were generated for the five sets of data.Table 1 demonstrates the average prediction perfor-mance of the PCA-EELM and the PCA-SVM modela-cross five runs.It can be observed from Table 1 that SVM shows
good prediction accuracy in the range of 81.74%-83.77%.For ensmble ELM, high prediction accuracy in the rangeof 86.73%-87.47% is obtained. To better investigate theprediction ability of our model, we also calculated thevalues of Sensitivity, Precision, and MCC. From Table 1,we can see that our model gives good prediction perfor-mance with an average Sens. value of 86.15%, Prec.value of 87.59% and MCC value of 77.36%. Further, itcan also be seen in the Table 1 that the standard devia-tion of sensitivity, precision, accuracy and MCC are aslow as 0.43, 0.32, 0.29 and 0.44 respectively. The resultsillustrates that the PCA-EELM is an accurate and effi-cient method for the prediction of PPIs. To sum up, wecan readily conclude that the PCA-EELM approach gen-erally outperforms the excellent PCA-SVM model withhigher discrimination power for predicting PPIs basedthe information of protein sequences.In addition, it is evident from the results presented in
Table 1 that the average learning time of the PCA-EELM classifier is 44.94 seconds while the learning timeof the SVM model is 51.86 seconds. The proposedensemble ELM classifier even run faster than the SVMmodel. Through these analyses, it is obvious that PCA-EELM model is an efficient classification method incomparison with PCA-SVM method. Therefore, we cansee clearly that PCA-EELM model is a much moreappropriate method for predicting new protein interac-tions compared with the other methods. Consequently,it makes us be more convinced that the proposed PCA-EELM based method can be very helpful in assisting thebiologist to assist in the design and validation of experi-mental studies and for the prediction of interaction
partners. Thus, in the case of real-time implementationof PPIs prediction system, E-ELM classifiers are moreappropriate than SVM model. All the analysis showsthat our model is an accurate and fast method for theprediction of PPIs.
Comparing the prediction performance with othermethodsIn order to highlight the advantage of our model, it wasalso tested by Helicobacter pylori dataset. The H. pyloridataset is composed of 2,916 protein pairs (1,458 inter-acting pair and 1,458 non-interacting pairs) as describedby Martin et al [27]. This dataset gives a comparison ofproposed method with other previous works includingphylogenetic bootstrap[28], signature products[27],HKNN[29], ensemble of HKNN[30] and boosting[17].The results of 10 fold cross-validation over six differentmethods are shown in Table 2. The average predictionperformance, i.e. sensitivity, precision, accuracy andMCC achieved by PCA-EELM predictor, are 88.95%,86.15%, 87.50% and 78.13%, respectively. It shows thatthe prediction results for PCA-EELM predictor and theensemble of HKNN, outperforms other state-of-the-artmethods, which highlight that a multiple classifier sys-tem is more accurate and robust than a single classifier.We also observed that the proposed method clearlyachieves better results compared to other multiple clas-sifier systems (i.e. ensemble of HKNN and Boosting).All these results show that the proposed PCA-EELMclassifier not only achieves accurate performance, butalso substantially improves precision in the prediction ofPPIs.
ConclusionsIn this paper, we have developed an efficient and fasttechnique for predicting protein interactions from pro-tein amino acids sequences by combining ensemble ELMwith PCA. The main aim of the proposed method is to
Table 1 The prediction performance comparison of PCA-EELM with PCA-SVM
Classification Model Test set Sens. (%) Prec. (%) Accu. (%) MCC (%) Testing Time (Seconds)
PCA-EELM 1 86.60 87.32 87.03 77.42 45.1482
2 85.97 87.34 86.77 77.04 45.4615
3 85.95 87.68 86.95 77.30 46.7825
4 86.60 88.10 87.47 78.07 43.2015
5 85.64 87.52 86.73 76.97 44.1237
Average 86.15+0.43 87.59+0.32 87.00+0.29 77.36+0.44 44.9435+1.36
PCA-SVM 1 81.76 82.86 82.16 70.69 52.6035
2 85.77 81.65 83.37 72.25 51.7143
3 87.52 80.67 83.10 71.78 51.7143
4 85.77 82.44 83.77 72.79 51.8547
5 85.48 79.09 81.74 70.09 51.4335
Average 85.26+2.12 81.34+1.51 82.82+0.85 71.52+1.1 .51.8641+0.44
You et al. BMC Bioinformatics 2013, 14(Suppl 8):S10http://www.biomedcentral.com/1471-2105/14/S8/S10
Page 4 of 11

employ the unique features of ELM classifier includingbetter generalization performance, fast learning speed,simpler and without tedious and time-consuming para-meter tuning to predict new protein interactions. Inorder to remove the noise and irrelevant features whichaffect the protein prediction performance, the PCA wasutilized for feature reduction before conducting theensemble ELM classifier. Experimental results demon-strated that the proposed method performed significantlywell in distinguishing interacting and non-interactingprotein pairs. It was observed that PCA-EELM achievedthe highest classification accuracy of 89% and mean clas-sification accuracy of 88% using 5-fold cross-validation.Meanwhile, comparative study was conducted on themethods of PCA-SVM and PCA-EELM. The experimen-tal results showed that our method significantly outper-formed PCA-SVM in terms of classification accuracywith shorter run time.
MethodsIn this section, we describe the proposed PCA-EELMapproach for predicting protein interactions from proteinsequences. The architecture is shown in Figure 1. Ourmethod to predict the PPIs depends on three steps: (1)Represent protein pairs as a vector by using the proposedfour kinds of protein sequence descriptors; (2) Principalcomponent analysis is utilized to do the feature reduction;(3) Ensemble ELM is used to perform the protein interac-tion prediction tasks. In the second stage, dimensionreduction is obtained using PCA to project the originalfeature space into a new space. In the third stage, new fea-ture sets are fed into the ensemble ELM classifier for train-ing an optimal model, meanwhile the number of hiddenneurons is chosen which can obtain the most accurateresults. Finally, the predict model conducts the proteininteraction prediction tasks using the most discriminativenew feature set and the optimal parameters.
Protein sequence representationTo use machine learning methods to predict PPIs fromprotein sequences, one of the most important computa-tional challenges is to extract feature vectors from proteinsequences in which the important information content of
proteins is fully encoded. In this study, four kinds of fea-ture representation methods including Auto Covariance(AC), Conjoint triad (CT), Local descriptor (LD) andMoran autocorrelation are employed to transform the pro-tein sequences into feature vectors.
Auto covariance (AC) scoresGiven a protein sequence, auto covariance (AC) accountsfor the interactions between amino acids with a certainnumber of amino acids apart in the sequence, so thismethod takes neighbouring effect into account and makesit possible to discover patterns that run through entiresequences[9]. Here, six sequence-based physicochemicalproperties of amino acid were chosen to reflect the aminoacids characteristics. These physicochemical propertiesinclude hydrophobicity (H), volumes of side chains ofamino acids (VSC), polarity (P1), polarizability (P2), sol-vent-accessible surface area (SASA) and net charge indexof side chains (NCISC) of amino acids respectively, whichare employed as basis for PPI prediction. Table 3 showedthe values of the six physicochemical properties for eachamino acid.By this means, the amino acid residues were first
translated into numerical values representing physico-chemical properties. Then they were normalized to zeromean and unit standard deviation (SD) according toEquation (5):
P′ij =
Pij − PjSj
(i = 1, 2, ..., 6; j = 1, 2, ..., 20.) (5)
where Pij is the jth descriptor value for ith amino acid,Pj is the mean of jth descriptor over the 20 amino acidsand Sj is the corresponding standard deviation. Theneach protein sequence was translated into six vectorswith each amino acid represented by the normalizedvalues.Then auto covariance was used to transform these
numerical sequences into uniform matrices. To repre-sent a protein sample P with length L, the AC variablesare calculated according to Equation (6):
AC(l ag, j) =L−lag∑i=1
(Pi,j − 1L
L∑i=1
Pi,j) × (P(i+lag),j − 1L
L∑i=1
Pi,j)
/L − lag (6)
where lag is the distance between residues, j is the jthphysicochemical property of nature amino acids men-tioned above, i is the position in the sequence P.In this way, the number of AC variables, D can be
calculated as D = lg×q, where q is the number ofdescriptors and lg is the maximum lag(lag = 1, 2, ..., lg).After each protein sequence was represented as a vectorof AC variables, a protein pair was characterized byconcatenating the vectors of two proteins in this proteinpair.
Table 2 Performance comparison of different methods onthe H.pylori dataset. Here, N/A means not available.
Methods SN (%) PE (%) ACC (%) MCC (%)
Phylogenetic bootstrap 69.8 80.2 75.8 N/A
HKNN 86 84 84 N/A
Signature products 79.9 85.7 83.4 N/A
Ensemble of HKNN 86.7 85 86.6 N/A
Boosting 80.37 81.69 79.52 70.64
Proposed method 88.95 86.15 87.50 78.13
You et al. BMC Bioinformatics 2013, 14(Suppl 8):S10http://www.biomedcentral.com/1471-2105/14/S8/S10
Page 5 of 11

Conjoint triad (CT) scoresConjoint triad (CT) considers the properties of one aminoacid and its vicinal amino acids and regards any three con-tinuous amino acids as a unit [11]. Thus, the triad can bedifferentiated according to the classes of amino acid. The
PPI information of protein sequence can be projected intoa homogeneous vector space by counting the frequency ofeach triad type. It should be noted that before using suchfeature representation method, the 20 amino acids hasbeen clustered into seven classes according to the dipoles
Figure 1 The architecture of the proposed PCA-EELM protein interaction prediction method.
You et al. BMC Bioinformatics 2013, 14(Suppl 8):S10http://www.biomedcentral.com/1471-2105/14/S8/S10
Page 6 of 11

and volumes of the side chains. The classification of aminoacids is listed in Table 4. And thus the dimensions ofa protein sequence were dramatically reduced to7×7×7 =343. Finally, the descriptors of two proteins wereconcatenated and a total 686-dimensional vector has beenbuilt to represent each protein pair.
Local descriptor (LD) scoresLocal descriptor (LD) is an alignment-free approach andits effectiveness depends largely on the underlying aminoacid groups [31]. To reduce the complexity inherent in therepresentation of the 20 standard amino acids, we firstlyclustered it into seven functional groups based on thedipoles and volumes of the side chains (see Table 4 fordetails). Then three local descriptors, Composition (C),
Transition (T) and Distribution (D) which is based on thevariation of occurrence of functional groups of aminoacids within the primary sequence of the protein are calcu-lated. C stands for the composition of each amino acidgroup along a local region. T represents the percentagefrequency with which amino acid in one group is followedby amino acid in another group. D characterizes the distri-bution pattern along the entire region by measuring thelocation of the first, 25, 50, 75 and 100% of residues of agiven group.In total there would be 63 features (7 composition, 21
transition, 35 distribution) if they were computed from thewhole amino acid sequence. However, in order to bettercapture continuous and discontinuous PPI informationfrom the sequence, we split each protein into 10 localregions(A-J) of varying length and composition as follows:Regions A, B, C and D are obtained by dividing the entireprotein sequence into four equal-length regions. Regions Eand F are obtained by dividing the protein sequence intwo equal-length regions. Region G represents the middlewith 50% of the sequence. Region H represents the first75% of the sequence, Region I the final 75% of thesequence and Region J the middle with 75% of thesequence. These regions are illustrated in Figure 2. Foreach region the 63 local descriptors are extracted, resultingin a 630 feature vector. Then the PPI pair is characterizedby concatenating the two vector spaces of two individualproteins. Thus, a 1260-dimentional vector has been con-structed to represent each protein pair and used as a fea-ture vector for input into ELM classifier.
Autocorrelation scoresAutocorrelation features describe the level of correlationbetween two protein sequences in terms of their specificphysicochemical property, which are defined based onthe distribution of amino acid properties along thesequence [8]. There are six amino acid properties usedfor deriving autocorrelation descriptors as the ACmethod. Here we use the commonly-used Moran auto-correlation (MAC) to infer PPIs, which can be calcu-lated as:
MAC(d) =1
N − d
N−d∑j=1
(Pj − P̄) × (Pj+d − P̄)
/1N
N∑j=1
(Pj − P̄)2
(7)
where N is the length of the sequence, d = 1, 2, ..., 30is the distance between on residue and its neighbours, Pjand Pj+d are the properties of the amino acid at posi-tions j and j + d respectively. P̄ =
N∑j=1
Pj/N is the average
value of P.Therefore, Moran autocorrelation descriptor consists
of a total of 30*6 = 180 descriptor values, i.e., a 180-dimensional vector has been built to represent the pro-tein sequence. A representation of an interaction pair is
Table 3 The original values of the six physicochemicalproperties for each amino acid
Amino acid H VSC P1 P2 SASA NCISC
A 0.62 27.5 8.1 0.046 1.181 0.007187
C 0.29 44.6 5.5 0.128 1.461 -0.03661
D -0.9 40 13 0.105 1.587 -0.02382
E -0.74 62 12.3 0.151 1.862 0.006802
F 1.19 115.5 5.2 0.29 2.228 0.037552
G 0.48 0 9 0 0.881 0.179052
H -0.4 79 10.4 0.23 2.025 -0.01069
I 1.38 93.5 5.2 0.186 1.81 0.021631
K -1.5 100 11.3 0.219 2.258 0.017708
L 1.06 93.5 4.9 0.186 1.931 0.051672
M 0.64 94.1 5.7 0.221 2.034 0.002683
N -0.78 58.7 11.6 0.134 1.655 0.005392
P 0.12 41.9 8 0.131 1.468 0.239531
Q -0.85 80.7 10.5 0.18 1.932 0.049211
R -2.53 105 10.5 0.291 2.56 0.043587
S -0.18 29.3 9.2 0.062 1.298 0.004627
T -0.05 51.3 8.6 0.108 1.525 0.003352
V 1.08 71.5 5.9 0.14 1.645 0.057004
W 0.81 145.5 5.4 0.409 2.663 0.037977
Y 0.26 117.3 6.2 0.298 2.368 0.023599
H, hydrophobicity; VSC, volume of side chains; P1, polarity; P2, polarizability;
SASA, solvent accessible surface area; NCISC, net charge index of side chains
Table 4 Division of amino acids based on the dipoles andvolumes of the side chains
No. Group
1 A, G, V
2 C
3 D, E
4 F, I, L, P
5 H, N, Q, W
6 K, R
7 M, S, T, Y
You et al. BMC Bioinformatics 2013, 14(Suppl 8):S10http://www.biomedcentral.com/1471-2105/14/S8/S10
Page 7 of 11

formed by concatenating Moran autocorrelation descrip-tors of two protein sequences in this protein pairs.
The feature spaceFor each protein pair in the dataset, its feature space iscomposed of the features of Auto Covariance (AC), Con-joint triad (CT), Local descriptor (LD) and Moran auto-correlation (MAC). Totally, there are 2666 features to beencoded in each sample, including 360 MAC features,1260 LD features, 686 CT features and 360 AC features.
Principal component analysis (PCA)PCA is a technique used to reduce multidimensional datasets to lower dimensions for analysis. It is a widely useddata analysis technique that allows reducing the dimen-sionality of the system while preserving information onthe variable interactions [26,32]. The basic idea of PCA isto reduce the dimensionality of a dataset in which thereare a large number of interrelated variables, while the cur-rent variation in the dataset is maintained as much as pos-sible. More specifically, PCA method transforms theoriginal variables into a set of linear combinations, theprincipal components (PC), which capture the data varia-bility, are linearly independent and weighted in decreasingorder of variance coverage. This allows a straightforwardreduction of the data dimensionality by discarding the fea-ture elements with low variability. Thus, all originalM-dimensional data patterns can be optimally trans-formed to data patterns in a feature space with lowerdimensionality.The PCA approach is conceptually and computationally
quite simple. Given matrix G = (xij), where xij denotesthe feature value of sample j for feature i, such thati = 1, 2, ...,M and j = 1, 2, ...,N. Firstly, the M-dimensionalmeans vector uj and M × M covariance matrix� are com-puted for the full dataset. Next, the eigenvectors and eigen-values are computed, and sorted according to decreasingeigenvalue. Call these eigenvectors e1with eigenvalue λ1, e2
with eigenvalue λ2, and so on. Next, the largest k eigenvec-tors are chosen. In practice, this is done by looking at aspectrum of eigenvectors. The largest eigenvalues corre-spond to the dimensions that explain larger amounts ofvariance of the dataset. Form a M × k matrix A whose col-umns consist of the k eigenvectors. Then the k-dimen-sional feature space (k<M) can be transformed by:Y = ATG(x). It has been proved that this representationminimizes a squared error criterion.
Extreme learning machine (ELM)Feed-forward neural networks (FNN) are ideal classifiersdue to their approximation capabilities for nonlinearmappings. However, the slow learning speed of FNNhas been a major bottleneck in different applications.The input weights and hidden layer biases of FNN hadto be adjusted using some parameter tuning approachsuch as gradient descent based methods, which are gen-erally time-consuming due to inappropriate learningsteps with significantly large latency to converge to alocal maxima. In previous works [18,33,34], Huang et al.proved that the single hidden layer feed-forward neuralnetworks (SLFNN) could exactly learn N distinct obser-vations for almost any non-linear activation functionwith almost N hidden nods [18].Extreme Learning Machine (ELM) was originally devel-
oped for the SLFNN and then extended to the generalizedSLFNN where the hidden layer need not be neuron alike[18,33]. Its architecture is similar to that of a SLFNN.Recently ELM has been increasingly popular in classifica-tion tasks due to its high generalization ability and fastlearning speed. Unlike the popular thinking that networkparameters need to be tuned, the input weights and firsthidden layer biases need not be adjusted but they are ran-domly assigned in ELM. The ELM algorithm has beenproven to perform learning at an extremely fast speed, andobtains good generalization performance for activationfunctions that are infinitely differentiable in hidden layers.
Figure 2 The 10 regions (A-J) used by the Local Descriptor technique for a theoretical protein sequence. The regions A-D and E-F areobtained by dividing the entire sequence into four equal regions and into two equal regions respectively. Region G represents the central 50%of the sequence. Regions H, I and J are the first, final and central 75% of the sequence.
You et al. BMC Bioinformatics 2013, 14(Suppl 8):S10http://www.biomedcentral.com/1471-2105/14/S8/S10
Page 8 of 11
ELM transforms the learning problem into a simplelinear system whose output weights can be analyticallydetermined through a generalized inverse operation ofthe hidden layer weight matrices. Such a learningscheme can operate at extremely faster speed thanlearning methods of traditional learning frameworks.Improved generalization performance of ELM with thesmallest training error and the norm of weights demon-strate its superior classification capability for real-timeapplications at an exceptionally fast pace without anylearning bottleneck [35].The idea behind ELM is presented as follows: suppose
learning N arbitrary different instances (xi, ti), whereti = [ti1, ti2, ..., tim]T ⊆ Rm, ti = [ti1, ti2, ..., tim]T ⊆ Rm, astandard ELM with L hidden neurons and activation func-tion g(x) are mathematically modeled by:
L∑i=1
βig(xj
)=
L∑i=1
βig(wi · xj + bi
)= oj,j = 1, ...,N (8)
where wi = [wi1,wi2, ...,win]T represents the weight vec-
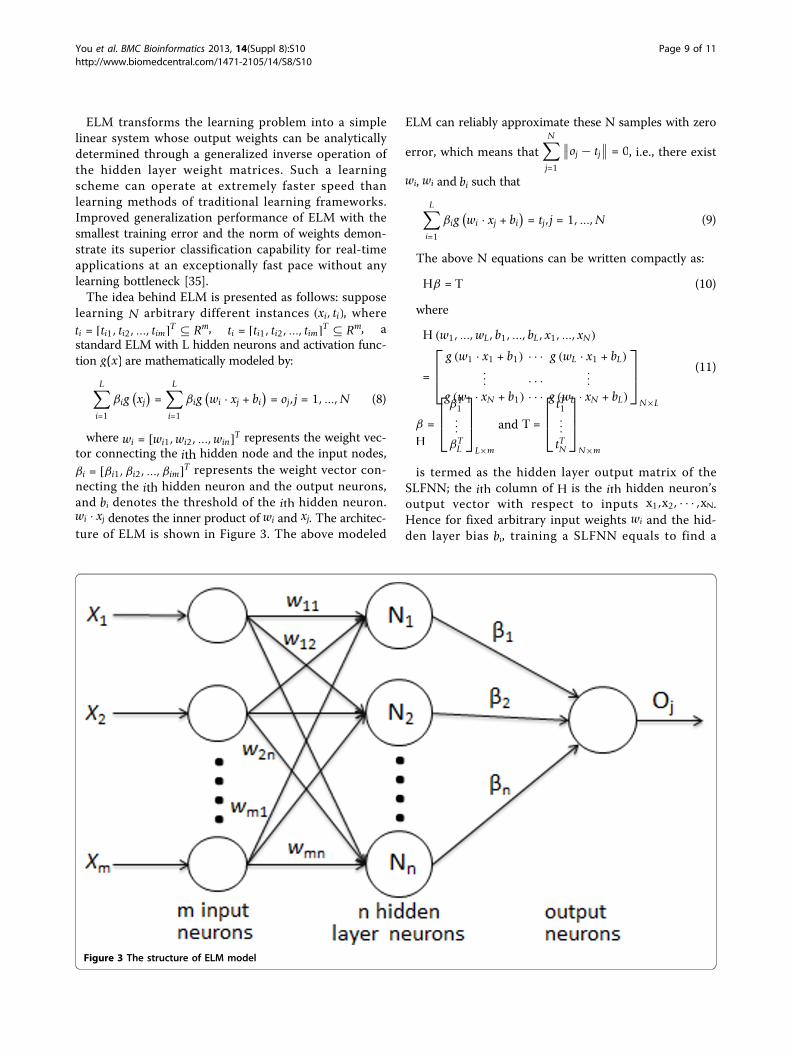
tor connecting the ith hidden node and the input nodes,βi = [βi1,βi2, ...,βim]T represents the weight vector con-necting the ith hidden neuron and the output neurons,and bi denotes the threshold of the ith hidden neuron.wi · xj denotes the inner product of wi and xj. The architec-ture of ELM is shown in Figure 3. The above modeled
ELM can reliably approximate these N samples with zero
error, which means thatN∑j=1
∥∥oj − tj∥∥ = 0, i.e., there exist
wi, wi and bi such that
L∑i=1
βig(wi · xj + bi
)= tj,j = 1, ...,N (9)
The above N equations can be written compactly as:
Hβ = T (10)
where
H (w1, ...,wL, b1, ..., bL, x1, ..., xN)
=
⎡⎢⎣g (w1 · x1 + b1) · · · g (wL · x1 + bL)
... · · · ...g (w1 · xN + b1) · · · g (wL · xN + bL)
⎤⎥⎦
N×L
(11)
β =
⎡⎢⎣
βT1...
βTL
⎤⎥⎦
L×m
and T =
⎡⎢⎣tT1...tTN
⎤⎥⎦
N×mH
is termed as the hidden layer output matrix of theSLFNN; the ith column of H is the ith hidden neuron’soutput vector with respect to inputs x1,x2, · · · ,xN.Hence for fixed arbitrary input weights wi and the hid-den layer bias bi, training a SLFNN equals to find a
Figure 3 The structure of ELM model
You et al. BMC Bioinformatics 2013, 14(Suppl 8):S10http://www.biomedcentral.com/1471-2105/14/S8/S10
Page 9 of 11
least-squares solution β̂ of the linear system Hβ = T.β̂ = H†T is the best solution, where H† is the Moore-Penrose inverse method for obtaining good generaliza-tion performance with extremely fast learning speed.The procedure of ELM for single-layer feed-forward
networks can be summarized as follows: Given a train-ing dataset ℵ =
{(xi, ti)
∣∣xi ∈ Rn, ti ∈ Rm, i = 1, · · · ,N},
activation function g(x), and hidden neuron number L.Step 1: Assign arbitrary input weight wi and bias bi,
i = 1, · · · , L.Step 2: Calculate the hidden layer output matrix H.Step 3: Calculate the output weight bi:
β̂ = H†T (12)
where β̂ and T are defined as formula above.The learning speed of ELM can be thousands of times
faster than traditional feed-forward network learningalgorithms like back-propagation (BP) algorithm whileobtaining better generalization performance.The ELM employs a completely different algorithm for
calculating weights and biases, unlike the back-propaga-tion or conjugate gradient descent training algorithm.The ELM algorithm is a learning algorithm for singlehidden-layer fed-forward networks. The input weights wi,and the hidden layer bias are randomly chosen and theoutput weights βi are analytically determined based onthe Moore-Penrose generalized inverse of the hidden-layer output matrix. The algorithm is implemented easilyand tends to produce a small training error. It also pro-duces the smallest weights norm, performs well and isextremely fast.
Ensemble of extreme learning machines (E-ELM)The extreme learning machine training algorithmdescribed above indicates that the randomly initializedhidden layer weights for model accuracy are very impor-tant. Therefore, to make results independent of randomweights, we train multiple ELMs on the same trainingdataset, with each having the same number of hiddenlayer neurons but different randomly assigned weights.Once trained separately, the final output for each sampleis determined by combining the outputs of each individualELM using majority voting strategy. This procedure isusually known as ensembling and the network is called asEnsemble Extreme Learning Machines (EELM). Comparedwith traditional methods, ensemble classifier can effec-tively improve classification performance, reliability andstability of individual classifier [36].
Authors’ contributionsZY & YL conceived the algorithm, carried out analyses, prepared the datasets, carried out experiments, and wrote the manuscript. LZ & JX & BNdesigned, performed and analyzed experiments and wrote the manuscript.All authors read and approved the final manuscript.
Competing interestsThe authors declare that they have no competing interests.
AcknowledgementsThis work is supported in part by the National Science Foundation of China,under Grants 61102119, 61133010, 31071168, 61272333, 61170077, 61272339,71001072, 61272269, in part by the China Postdoctoral Science Foundation,under Grant 2012M520929. The authors would like to thank all the guesteditors and anonymous reviewers for their constructive advices.
DeclarationsThe publication costs for this article were funded by the correspondingauthor’s institution.This article has been published as part of BMC Bioinformatics Volume 14Supplement 8, 2013: Proceedings of the 2012 International Conference onIntelligent Computing (ICIC 2012). The full contents of the supplement areavailable online at http://www.biomedcentral.com/bmcbioinformatics/supplements/14/S8.
Author details1College of Computer Science and Software Engineering, ShenzhenUniversity, Shenzhen, Guangdong 518060, China. 2Department ofInformation, Electronic Engineering Institute, Hefei, Anhui 230601, China.3Department of Automation, Un iversity of Science and Technology ofChina, Hefei, Anhui 230601, China. 4Institute of Health Sciences, AnhuiUniversity, Hefei, Anhui 230601, China. 5The Advanced Research Institute ofIntelligent Sensing Network, Tongji University, shanghai, 201804, China.
Published: 9 May 2013
References1. Gavin AC, Bosche M, Krause R, Grandi P, Marzioch M, Bauer A, Schultz J,
Rick JM, Michon AM, Cruciat CM, et al: Functional organization of theyeast proteome by systematic analysis of protein complexes. Nature2002, 415(6868):141-147.
2. Ito T, Chiba T, Ozawa R, Yoshida M, Hattori M, Sakaki Y: A comprehensivetwo-hybrid analysis to explore the yeast protein interactome. Proc NatlAcad Sci USA 2001, 98(8):4569-4574.
3. Ho Y, Gruhler A, Heilbut A, Bader GD, Moore L, Adams SL, Millar A, Taylor P,Bennett K, Boutilier K, et al: Systematic identification of protein complexesin Saccharomyces cerevisiae by mass spectrometry. Nature 2002,415(6868):180-183.
4. Krogan NJ, Cagney G, Yu HY, Zhong GQ, Guo XH, Ignatchenko A, Li J,Pu SY, Datta N, Tikuisis AP, et al: Global landscape of protein complexesin the yeast Saccharomyces cerevisiae. Nature 2006, 440(7084):637-643.
5. Wang B, Chen P, Huang DS, Li JJ, Lok TM, Lyu MR: Predicting proteininteraction sites from residue spatial sequence profile and evolutionrate. Febs Letters 2006, 580(2):380-384.
6. You ZH, Lei YK, Gui J, Huang DS, Zhou XB: Using manifold embedding forassessing and predicting protein interactions from high-throughputexperimental data. Bioinformatics 2010, 26(21):2744-2751.
7. Xia JF, Zhao XM, Huang DS: Predicting protein-protein interactions fromprotein sequences using meta predictor. Amino Acids 2010, 39(5):1595-1599.
8. Xia JF, Han K, Huang DS: Sequence-Based Prediction of Protein-ProteinInteractions by Means of Rotation Forest and Autocorrelation Descriptor.Protein Pept Lett 2010, 17(1):137-145.
9. Guo YZ, Yu LZ, Wen ZN, Li ML: Using support vector machine combinedwith auto covariance to predict proteinprotein interactions from proteinsequences. Nucleic Acids Res 2008, 36(9):3025-3030.
10. You Z-H, Yin Z, Han K, Huang D-S, Zhou X: A semi-supervised learningapproach to predict synthetic genetic interactions by combiningfunctional and topological properties of functional gene network. BMCBioinformatics 2010, 11(343).
11. Shen JW, Zhang J, Luo XM, Zhu WL, Yu KQ, Chen KX, Li YX, Jiang HL:Predicting protein-protein interactions based only on sequencesinformation. Proc Natl Acad Sci USA 2007, 104(11):4337-4341.
12. Lei Y-K, You Z-H, Ji Z, Zhu L, Huang D-S: Assessing and predicting proteininteractions by combining manifold embedding with multipleinformation integration. BMC Bioinformatics 2012, 13(Suppl 7):S3.
13. You Z, Zhang S, Li L: Integration of Genomic and Proteomic Data toPredict Synthetic Genetic Interactions Using Semi-supervised Learning.
You et al. BMC Bioinformatics 2013, 14(Suppl 8):S10http://www.biomedcentral.com/1471-2105/14/S8/S10
Page 10 of 11
In Emerging Intelligent Computing Technology and Applications: With Aspectsof Artificial Intelligence. Volume 5755. Huang DS, Jo KH, Lee HH, Bevilacqua V,Kang HJ; 2009:635-644.
14. Zheng CH, Zhang L, Ng VTY, Shiu SCK, Huang DS: Molecular PatternDiscovery Based on Penalized Matrix Decomposition. IEEE-ACM TransComput Biol Bioinform 2011, 8(6):1592-1603.
15. Zheng CH, Zhang L, Ng TY, Shiu SCK, Huang DS: Metasample-BasedSparse Representation for Tumor Classification. IEEE-ACM Trans ComputBiol Bioinform 2011, 8(5):1273-1282.
16. Qi YJ, Klein-Seetharaman J, Bar-Joseph Z: Random forest similarity forprotein-protein interaction prediction from multiple sources. Singapore:World Scientific Publ Co Pte Ltd; 2005.
17. Shi M-G, Xia J-F, Li X-L, Huang D-S: Predicting protein-protein interactionsfrom sequence using correlation coefficient and high-quality interactiondataset. Amino Acids 2010, 38(3):891-899.
18. Huang G-B, Zhu Q-Y, Siew C-K: Extreme learning machine: Theory andapplications. Neurocomputing 2006, 70(1-3):489-501.
19. Cao J, Lin Z, Huang G-B, Liu N: Voting based extreme learning machine.Information Sciences 2012, 185(1):66-77.
20. Huang DS, Du JX: A Constructive Hybrid Structure OptimizationMethodology for Radial Basis Probabilistic Neural Networks. IeeeTransactions on Neural Networks 2008, 19(12):2099-2115.
21. Huang DS: Radial basis probabilistic neural networks: Model andapplication. Int J Pattern Recognit Artif Intell 1999, 13(7):1083-1101.
22. Lan Y, Soh YC, Huang G-B: Ensemble of online sequential extremelearning machine. Neurocomputing 2009, 72(13-15):3391-3395.
23. Liu N, Wang H: Ensemble Based Extreme Learning Machine. Ieee SignalProcessing Letters 2010, 17(8):754-757.
24. Zhao L-J, Chai T-Y, Yuan D-C: Selective ensemble extreme learningmachine modeling of effluent quality in wastewater treatment plants.International Journal of Automation and Computing 2012, 9(6):627-633.
25. Lan YA, Soh YC, Huang GB, Ieee: A Constructive Enhancement for OnlineSequential Extreme Learning Machine. In Ijcnn: 2009 International JointConference on Neural Networks. Volume 1-6. New York: Ieee; 2009:208-213.
26. Zhang SL, Ye F, Yuan XG: Using principal component analysis andsupport vector machine to predict protein structural class for low-similarity sequences via PSSM. J Biomol Struct Dyn 2012, 29(6):634-642.
27. Martin S, Roe D, Faulon JL: Predicting protein-protein interactions usingsignature products. Bioinformatics 2005, 21(2):218-226.
28. Bock JR, Gough DA: Whole-proteome interaction mining. Bioinformatics2003, 19(1):125-134.
29. Nanni L: Hyperplanes for predicting protein-protein interactions.Neurocomputing 2005, 69(1):257-263.
30. Nanni L, Lumini A: An ensemble of K-local hyperplanes for predictingprotein-protein interactions. Bioinformatics 2006, 22(10):1207-1210.
31. Davies MN, Secker A, Freitas AA, Clark E, Timmis J, Flower DR: Optimizingamino acid groupings for GPCR classification. Bioinformatics 2008,24(18):1980-1986.
32. You Z, Wang S, Gui J, Zhang S: A Novel Hybrid Method of Gene Selectionand Its Application on Tumor Classification. In Advanced IntelligentComputing Theories and Applications, Proceedings: With Aspects of ArtificialIntelligence Huang DS, Wunsch DC, Levine DS, Jo KH 2008, 5227:1055-1068.
33. Huang G-B, Zhou H, Ding X, Zhang R: Extreme Learning Machine forRegression and Multiclass Classification. Ieee Transactions on Systems Manand Cybernetics Part B-Cybernetics 2012, 42(2):513-529.
34. Huang GB, Zhu QY, Siew CK, ieee: Extreme learning machine: A newlearning scheme of feedforward neural networks. 2004 Ieee InternationalJoint Conference on Neural Networks, Vols 1-4, Proceedings 2004, 985-990.
35. Minhas R, Mohammed AA, Wu QMJ: A fast recognition framework basedon extreme learning machine using hybrid object information.Neurocomputing 2010, 73(10-12):1831-1839.
36. Zong W, Huang G-B, Chen Y: Weighted extreme learning machine forimbalance learning. Neurocomputing 2013, 101:229-242.
doi:10.1186/1471-2105-14-S8-S10Cite this article as: You et al.: Prediction of protein-protein interactionsfrom amino acid sequences with ensemble extreme learning machinesand principal component analysis. BMC Bioinformatics 2013 14(Suppl 8):S10.
Submit your next manuscript to BioMed Centraland take full advantage of:
• Convenient online submission
• Thorough peer review
• No space constraints or color figure charges
• Immediate publication on acceptance
• Inclusion in PubMed, CAS, Scopus and Google Scholar
• Research which is freely available for redistribution
Submit your manuscript at www.biomedcentral.com/submit
You et al. BMC Bioinformatics 2013, 14(Suppl 8):S10http://www.biomedcentral.com/1471-2105/14/S8/S10
Page 11 of 11


![Determining protein structure by tyrosine bioconjugation · INTRODUCTION Protein structure is driven by the interactions of the 20 amino acids with solvent and other amino acids[1]](https://img.pdfslide.us/doc/110x75/5f2af327b5a59d74a66e7b0a/determining-protein-structure-by-tyrosine-bioconjugation-introduction-protein-structure.jpg)