Embed Size (px)
Citation preview
Page 1 of 35
Protective Associations of HDL with Blood Brain Barrier Injury in
Multiple Sclerosis Patients
Kelly Fellows 1, Tomas Uher 2, Richard W. Browne 3, Bianca Weinstock-Guttman 4, Dana Horakova 2,
Helena Posova 5, Manuela Vaneckova 6, Zdenek Seidl 6, Jan Krasensky 6, Michaela Tyblova 2, Eva
Havrdova 2, Robert Zivadinov 4, 7, Murali Ramanathan 1, 4
1 Department of Pharmaceutical Sciences, State University of New York, Buffalo, NY, USA. 2 Department of Neurology and Center of Clinical Neuroscience, Charles University in Prague, First
Faculty of Medicine and General University Hospital, Prague, Czech Republic.
3 Department of Biotechnical and Clinical Laboratory Sciences, State University of New York, Buffalo, NY, USA.
4 Department of Neurology, State University of New York, Buffalo, NY, USA 5 Institute of Immunology and Microbiology, 1st Faculty of Medicine, Charles University, Prague,
Czech Republic. 6 Department of Radiology, 1st Faculty of Medicine and General University Hospital, Charles
University, Prague, Czech Republic. 7 Buffalo Neuroimaging Analysis Center, Department of Neurology, State University of New York,
Buffalo, NY, USA.
CORRESPONDING AUTHOR: Murali Ramanathan
355 Kapoor Hall, Department of Pharmaceutical Sciences
State University of New York, Buffalo, Buffalo, NY 14214-8033.
(716)-645-4846 and FAX 716-829-6569. E-mail [email protected]
Running Head: Lipids and Blood Brain Barrier Breakdown in MS
Word Count: Title: 93 Characters, Running Head: 46 characters, Abstract: 189 words, Introduction to
Discussion: 3945 words. References: 38. Tables: 2. Figures: 4.
Financial Conflicts: See disclosure statement.
Confidentiality: Use of the information in this manuscript for commercial, non-commercial, research or
purposes other than peer review not permitted prior to publication without expressed written permission
of the author.
by guest, on May 13, 2019
ww
w.jlr.org
Dow
nloaded from
Page 2 of 35
DISCLOSURE
Kelly Fellows has nothing to disclose.
Tomas Uher has received speaker honoraria from Novartis and compensation for conference travel from
Biogen Idec and Genzyme.
Dr. Dana Horakova received speaker honoraria and consultant fees from Biogen Idec, Novartis, Merck
Serono, Teva and Bayer Schering and financial support for research activities from Biogen Idec.
Dr. Eva Havrdova received honoraria and consulting fees from Genzyme, Biogen Idec, Sanofi-Aventis,
Merck Serono, Roche, Teva and Novartis for consulting services, speaking and serving on a scientific
advisory boards
Dr. Robert Zivadinov has received speaker honoraria and consultant fees from Teva Pharmaceuticals,
Biogen Idec, Genzyme-Sanofi, Novartis, Claret Medical and EMD Serono. He has received research
support from the National Multiple Sclerosis Society, Department of Defense, Biogen Idec, Teva
Neuroscience, Teva Pharmaceuticals, EMD Serono, Genzyme-Sanofi, Claret Medical and Novartis.
Dr. Michaela Tyblova has received compensation for conference travel from Biogen Idec, Teva, Novartis
and Genzyme. She received financial support for research activities from Biogen Idec.
Drs. Zdenek Seidl and Jan Krasensky received financial support for research activities from Biogen Idec.
Dr. Helena Posova received speaker honoraria from Novartis.
Dr. Manuela Vaneckova received speaker honoraria and consultant fees from Biogen Idec, Novartis,
Merck Serono, and Teva, as well as support for research activities from Biogen Idec.
Dr. Bianca Weinstock-Guttman received honoraria for serving in advisory boards and educational
programs from Teva Pharmaceuticals, Biogen Idec, Novartis, Accorda EMD Serono, Pfizer, Novartis,
Genzyme and Sanofi. She also received support for research activities from the National Institutes of
by guest, on May 13, 2019
ww
w.jlr.org
Dow
nloaded from
Page 3 of 35
Health, National Multiple Sclerosis Society, National Science Foundation, Department of Defense, EMD
Serono, Biogen Idec, Teva Neuroscience, Cyberonics, Novartis, Acorda and the Jog for the Jake
Foundation.
Dr. Murali Ramanathan received research funding from the National Multiple Sclerosis Society and the
Department of Defense. He received compensation for serving as an Editor from the American
Association of Pharmaceutical Scientists. These are unrelated to the research presented in this report.
by guest, on May 13, 2019
ww
w.jlr.org
Dow
nloaded from
Page 4 of 35
ABSTRACT
Purpose: To investigate the associations of serum cholesterol and apolipoproteins with measures of blood
brain barrier (BBB) permeability and central nervous system (CNS) inflammation following the first
clinical demyelinating event.
Methods: This study included 154 patients (67% female, age: 29.5 ± SD 8.2 years) enrolled in a multi-
center study of interferon beta-1a (IFN) treatment following the first demyelinating event. Blood and
cerebrospinal fluid (CSF) were obtained at screening prior to treatment. A comprehensive serum lipid
profile and multiple surrogate markers of BBB breakdown and CNS immune activity were obtained.
Results: Higher levels of serum high-density lipoprotein cholesterol (HDL-C) and apolipoprotein A-1
(ApoA-I) were associated with lower CSF total protein level, CSF albumin level, albumin quotient and
CSF IgG level (all p ≤ 0.001 for HDL-C and all p < 0.01 for ApoA-I). HDL-C was also associated with
CSF CD80+ (p <0.001) and with CSF CD80+CD19+ (p = 0.007) cell frequencies.
Conclusions: Higher serum HDL is associated with lower levels of BBB injury and decreased CD80+
and CD80+CD19+ cell extravasation into the CSF. HDL may potentially inhibit the initiation and/or
maintenance of pathogenic BBB injury following the first demyelinating event.
by guest, on May 13, 2019
ww
w.jlr.org
Dow
nloaded from
Page 5 of 35
INTRODUCTION
Blood brain barrier (BBB) injury creates a permissive environment for inflammation and the
extravasation of immune cells (1) in multiple sclerosis (MS), a chronic inflammatory and
neurodegenerative disease of the CNS (2). Compromised BBB structural integrity is necessary for the
formation of contrast-enhancing lesions (CEL), which are frequently found on brain MRI from MS
patients even in the absence of clinical relapses. CEL represent focal areas with compromised BBB
structural integrity and are associated with parenchymal and meningeal inflammation (3). Increased BBB
water permeability precedes the appearance of CEL and is pervasive in normal-appearing white matter
(4).
In CNS regions with loss of BBB structural integrity, there is increased permeability to macromolecules
such as proteins, albumin and immunoglobulins that are normally excluded by the BBB. These
macromolecules enter more readily into the CNS and can be detected in CSF. CSF levels of proteins
produced exclusively outside the CNS, such as albumin, provide useful surrogate measures of the
pathological injury to BBB structural integrity. The presence of T and B cells and immunoglobulins in
CSF resulting from extravasation through the BBB provides surrogate measures of immune activity in the
CNS. The presence of immunoglobulin oligoclonal bands (OCB) in CSF is used as a paraclinical
diagnostic criterion in MS (5).
Chronic hypercholesterolemia can promote exaggerated immune responses, stronger leukocyte-vascular
endothelial cell adhesion and immune cell extravasation in the microvasculature (6, 7). In this research,
we leverage a range of CSF measures to understand the contributions of lipid profile variables to
pathophysiological increases in BBB permeability and to immune activity in CSF. We focused on serum
cholesterol profiles because there is an emerging body of data suggesting associations between serum
cholesterol profiles and MRI measures of lesional and neurodegenerative injury in MS patients (8-13). In
our previous work we found an adverse association between greater serum cholesterol and MS disease
progression. Higher low-density lipoprotein cholesterol (LDL-C) and total cholesterol (TC) levels were
by guest, on May 13, 2019
ww
w.jlr.org
Dow
nloaded from
Page 6 of 35
positively associated with worsening disability measured on the Expanded Disability Status Scale (EDSS)
and MS Severity Scale (MSSS) (10, 13). Higher HDL levels were associated with fewer CEL (9, 13). We
also investigated the role of cholesterol profiles in patients following the first demyelinating event, prior
to disease-modifying treatment, and found that greater LDL-C, TC and ApoB levels were associated with
greater number of T2 lesions after 2-years (12, 14). The main goals of this study are to investigate the
associations of cholesterol and apolipoprotein levels with CSF-derived measures of increased BBB
permeability and cellular and humoral immune activity.
by guest, on May 13, 2019
ww
w.jlr.org
Dow
nloaded from
Page 7 of 35
METHODS
Study Population
Study Setting: Multi-center, prospective, longitudinal observational study.
Informed Consent: The Medical Ethics Committees of the General University Hospital and 1st Faculty
of Medicine of Charles University, Prague, Czech Republic, approved the study protocol and the
informed consent procedure. Additionally, approvals were obtained from local medical ethics committees
of all other participating centers. Written informed consent was obtained from all patients at enrollment.
Clinical Study Design: The Observational Study of Early Interferon beta 1-a Treatment in High Risk
Subjects after Clinically Isolated Syndrome (CIS) (SET study, clin.gov # NCT01592474) and its design
have been previously described (15, 16). The study was coordinated by Charles University in Prague,
Czech Republic. The study screened 259 patients and enrolled 220 patients from 8 Czech Republic MS
centers.
Inclusion Criteria: Patients with the following characteristics: 18-55 years of age, enrolled within 4
months from the clinical event, presence of ≥ 2 T2-hyperintense lesions on diagnostic MRI, and presence
of ≥ 2 OCB in CSF obtained prior to corticosteroid treatment and Expanded Disability Status Scale
(EDSS) ≤ 3.5.
This sub-study included 154 patients for whom lipid profiles and CSF-derived measures of increased
BBB permeability were available.
Treatments: All patients were treated with 3-5 g of methylprednisolone for the first symptom and
baseline MRI was performed ≥ 30 days after steroid administration.
All patients were started on 30 µg, once-weekly, intramuscular interferon beta 1-a (AVONEX®) treatment
at baseline.
by guest, on May 13, 2019
ww
w.jlr.org
Dow
nloaded from
Page 8 of 35
MRI Acquisition and Analysis
This sub-study was limited to MRI measures obtained at baseline. MRI methods are summarized in
Supplementary Methods. We investigated the associations of the number of CEL and T2 lesion volume
(LV) at baseline with CSF measures of BBB permeability in statistical analyses.
Serum Lipids and Apolipoproteins
Serum for lipid and apolipoprotein analyses was obtained in the non-fasted state at the screening visit
prior to the start of corticosteroid or interferon. The methods for lipid profile and apolipoprotein analyses
have been previously described (14) but are succinctly recapitulated here.
Immunoturbidometric diagnostic kits (Kamiya Biomedical, Thousand Oaks, CA) were used for the
apolipoprotein (AI, AII, B and E), Lpa and high sensitivity C-reactive protein (CRP) assays. Diagnostic
reagent kits (Sekisui Diagnostics, Lexington, MA) were used to measure serum total cholesterol, HDL-C,
phospholipids and triglycerides. These assays were conducted on an automated chemistry analyzer (ABX
Pentra 400, Horiba Instruments, Irvine, CA). The coefficient of variation of these assays is < 5%. LDL-C
was obtained from the Friedewalde equation (17).
Specific probes for both single nucleotide polymorphisms rs7412 and rs429358 (OpenArray, Applied
Biosystems, Life Technologies, Foster City, California, USA) were used to genotype APOE gene variants
ε2, ε3 and ε4.
The arylesterase and paraoxonase activities of the human serum paraoxonase-1 (PON1) enzyme were
measured using phenyl acetate (arylesterase activity) and paraoxon (paraoxonase activity) as substrates,
respectively. The assay CV is 0.6 to 1.4%. The PON1 Q192R polymorphism was obtained from the
paraoxonase and arylesterase activities as previously described (18).
Clinical data collected included height and weight for body mass index (BMI) calculations, and history of
statin use.
by guest, on May 13, 2019
ww
w.jlr.org
Dow
nloaded from
Page 9 of 35
Cerebrospinal Fluid Assays
Lumbar Punctures: All lumbar punctures were performed prior to treatment with corticosteroids at the
study-coordinating center during the morning hours. CSF was drawn from L5-S1, L4-5 or L3-4 inter-
space with the patient sitting upright using a standard sterile preparation and 20G Sprotte atraumatic
needle. A total of 20-25 ml of CSF and 5-ml volume of blood were obtained.
Biochemical, Immunological and Cellular Assays: Total protein in CSF was determined
photometrically using the pyrogallol red-molybdate reaction method (Synchron LX 20, Beckman Coulter
analyzer). Albumin, immunoglobulin G (IgG) and immunoglobulin M (IgM) concentrations were
quantified in serum and CSF by immunonephelometry (IMMAGE Immunohistochemistry system,
Beckman Coulter).
The albumin quotient (QAlb) was defined as the ratio of the CSF albumin concentration to the serum
albumin concentration (19, 20):
!!"# =!"#!!"#$%&'!(!"/!)!"#$%!!"#$%&'!(!/!)
The IgG Quotient (QIgG) and IgM Quotient (QIgM) were analogously defined as the ratio of CSF IgG or
CSF IgM concentration to their corresponding serum IgG or IgM concentrations:
!!"# =!"#!!"#!(!"/!)!"#$%!!"#!(!/!)
!!"# = !"#!!"#!(!"/!)!"#$%!!"#!(!/!)
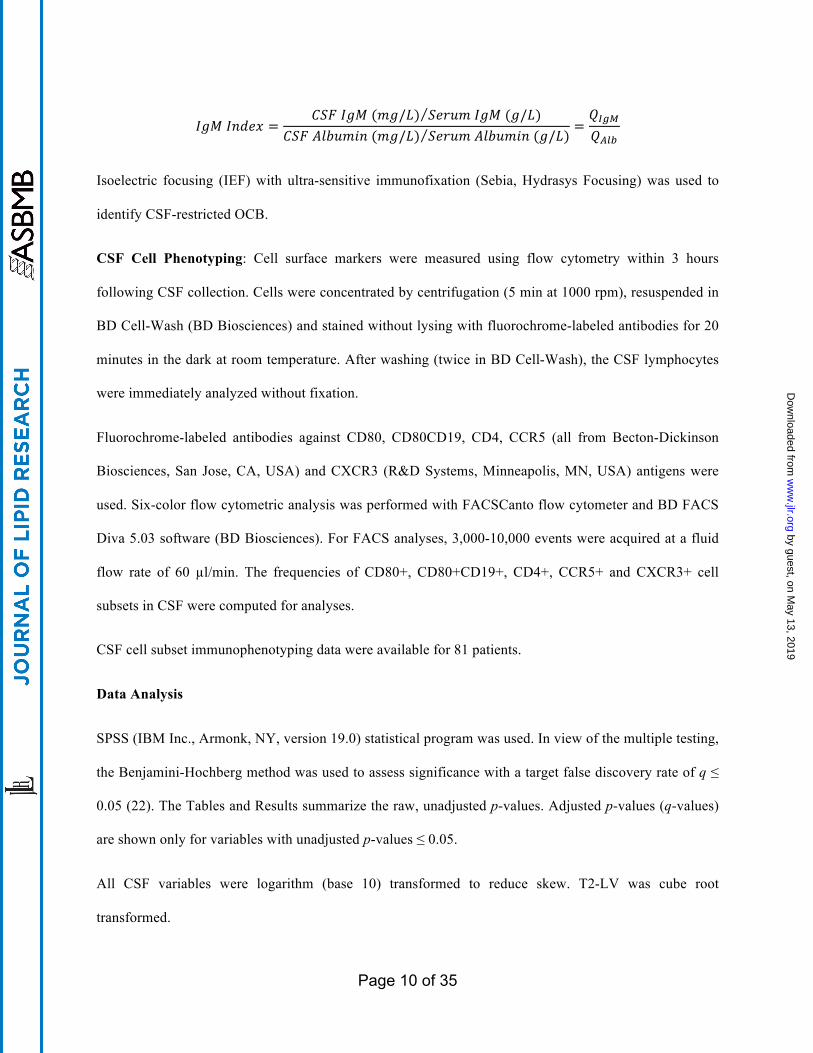
The IgG index and IgM index, which can be used to assess CSF IgG and IgM synthesis (21), were
obtained using the following:
!"#!!"#$% = !"#!!"#!(!"/!) !"#$%!!"#!(!/!)!"#!!"#$%&'!(!"/!) !"#$%!!"#$%&'!(!/!) =
!!"#!!"#
by guest, on May 13, 2019
ww
w.jlr.org
Dow
nloaded from
Page 10 of 35
!"#!!"#$% = !"#!!"#!(!"/!) !"#$%!!"#!(!/!)!"#!!"#$%&'!(!"/!) !"#$%!!"#$%&'!(!/!) =
!!"#!!"#
Isoelectric focusing (IEF) with ultra-sensitive immunofixation (Sebia, Hydrasys Focusing) was used to
identify CSF-restricted OCB.
CSF Cell Phenotyping: Cell surface markers were measured using flow cytometry within 3 hours
following CSF collection. Cells were concentrated by centrifugation (5 min at 1000 rpm), resuspended in
BD Cell-Wash (BD Biosciences) and stained without lysing with fluorochrome-labeled antibodies for 20
minutes in the dark at room temperature. After washing (twice in BD Cell-Wash), the CSF lymphocytes
were immediately analyzed without fixation.
Fluorochrome-labeled antibodies against CD80, CD80CD19, CD4, CCR5 (all from Becton-Dickinson
Biosciences, San Jose, CA, USA) and CXCR3 (R&D Systems, Minneapolis, MN, USA) antigens were
used. Six-color flow cytometric analysis was performed with FACSCanto flow cytometer and BD FACS
Diva 5.03 software (BD Biosciences). For FACS analyses, 3,000-10,000 events were acquired at a fluid
flow rate of 60 µl/min. The frequencies of CD80+, CD80+CD19+, CD4+, CCR5+ and CXCR3+ cell
subsets in CSF were computed for analyses.
CSF cell subset immunophenotyping data were available for 81 patients.
Data Analysis
SPSS (IBM Inc., Armonk, NY, version 19.0) statistical program was used. In view of the multiple testing,
the Benjamini-Hochberg method was used to assess significance with a target false discovery rate of q ≤
0.05 (22). The Tables and Results summarize the raw, unadjusted p-values. Adjusted p-values (q-values)
are shown only for variables with unadjusted p-values ≤ 0.05.
All CSF variables were logarithm (base 10) transformed to reduce skew. T2-LV was cube root
transformed.
by guest, on May 13, 2019
ww
w.jlr.org
Dow
nloaded from
Page 11 of 35
The associations of CSF variables with lipid profile variables (HDL-C, LDL-C, TC, ApoA-I, ApoA-II,
ApoB, ApoE, CRP or PON1 arylesterase activity) were assessed in linear regression analyses. The CSF
variable of interest was the dependent variable whereas the individual lipid profile variable of interest,
age, gender and BMI were treated as predictor variables in these analyses.
Negative binomial regression was used to assess associations of lipid profile variables with CSF cell
frequency variables (CD80+, CD80+CD19+, CD4+, CCR5+ and CXCR3+). Individual CSF cell
frequency variables were treated as the dependent variable with the individual lipid profile variable of
interest, age, gender, and BMI as predictors.
The associations of CEL number and T2-LV were individually assessed as dependent variables in
negative binomial regression and linear regression, respectively. The CSF variable of interest, age and
gender were treated as predictor variables.
by guest, on May 13, 2019
ww
w.jlr.org
Dow
nloaded from
Page 12 of 35
RESULTS
Demographic and Clinical Characteristics: The clinical, demographic and MRI characteristics of the
study sample at baseline and the CSF measures and lipid profile variables at screening are summarized in
Table 1.
The mean time ± SD between disease onset and lumbar puncture was 28.2 ± 23.2 days (median = 20.0,
inter-quartile range = 34 days). None of the subjects were on statins.
The clinical and demographic characteristics of subjects with lipid profile and CSF measures who were
included in the study were similar to the SET study sample that was not included (data not shown).
Associations of CSF Variables with Lipid Profile Variables: Table 2 summarizes the associations of
CSF variables with the serum cholesterol variables (HDL-C, LDL-C, TC), serum apolipoprotein variables
(ApoA-I, ApoA-II, ApoB, ApoE) and CRP.
Greater HDL-C and TC levels were associated with lower CSF total protein level, CSF albumin level,
albumin quotient and CSF IgG level (Table 2). Additionally, TC was negatively associated with alkaline
OCB (23) (p = 0.003, q = 0.007). The CSF variables that were negatively associated with increased TC
were also negatively associated with LDL-C with the exception of albumin quotient (q = 0.053).
ApoA-I was associated with the same CSF variables as HDL-C. This provides corroborative support for
the HDL-C findings. ApoA-II was associated with CSF IgG levels (p = 0.003, q = 0.036) but no other
CSF measures. ApoB and CRP were not associated with any of the CSF variables.
The associations of albumin quotient, IgG Index, IgM Index and CSF leukocytes with HDL-C and ApoA-
I are summarized in Figure 1 and Figure 2, respectively.
Human serum Paraoxonase-1 (PON-1), a hydrolytic enzyme exclusively associated with HDL-C, exhibits
a genotype-independent arylesterase activity and a paraoxonase activity that depends on its Q192R
genotype. To further confirm that HDL was associated with protective associations on CSF measures of
by guest, on May 13, 2019
ww
w.jlr.org
Dow
nloaded from
Page 13 of 35
BBB permeability, we examined the corresponding associations of PON1 arylesterase activity. Higher
PON1 arylesterase activity was associated with lower albumin quotient (p = 0.015), CSF total protein
level (p = 0.014), CSF albumin level (p = 0.015) and CSF IgG level (p = 0.001). The results from this
analysis provide additional evidence for the associations between HDL-C and CSF variables.
To assess the relative importance of HDL-C and LDL-C to the associations with CSF variables, we
conducted additional regression analyses that included both HDL-C and LDL-C as predictors. In these
analyses, the associations of HDL-C with BBB variables remained significant but LDL-C was no longer
significant.
Based on the corroborating evidence from the additional regression analyses and the ApoA-I, PONI
arylesterase activity and ApoB results, we surmise that the negative associations of TC with albumin
quotient, CSF total protein and CSF albumin levels are the result of a salient contribution from HDL-C
and that the contributions from LDL-C are potentially secondary in comparison. The negative
associations of alkaline OCB with TC are mediated primarily by LDL-C. Both HDL-C and LDL-C
appear to contribute to the negative associations of TC with CSF IgG (Table 2).
ApoE levels (Table 2) were negatively associated with CSF total protein level (p = 0.003, q = 0.012), CSF
albumin (p = 0.002, q = 0.012) level, albumin quotient (p = 0.001, q = 0.012) and CSF IgG level (p =
0.027, q = 0.065). The APOE4 allele was present in 21.8% of the patient group. However, there were no
significant associations of APOE4 genotype status with any of the CSF variables.
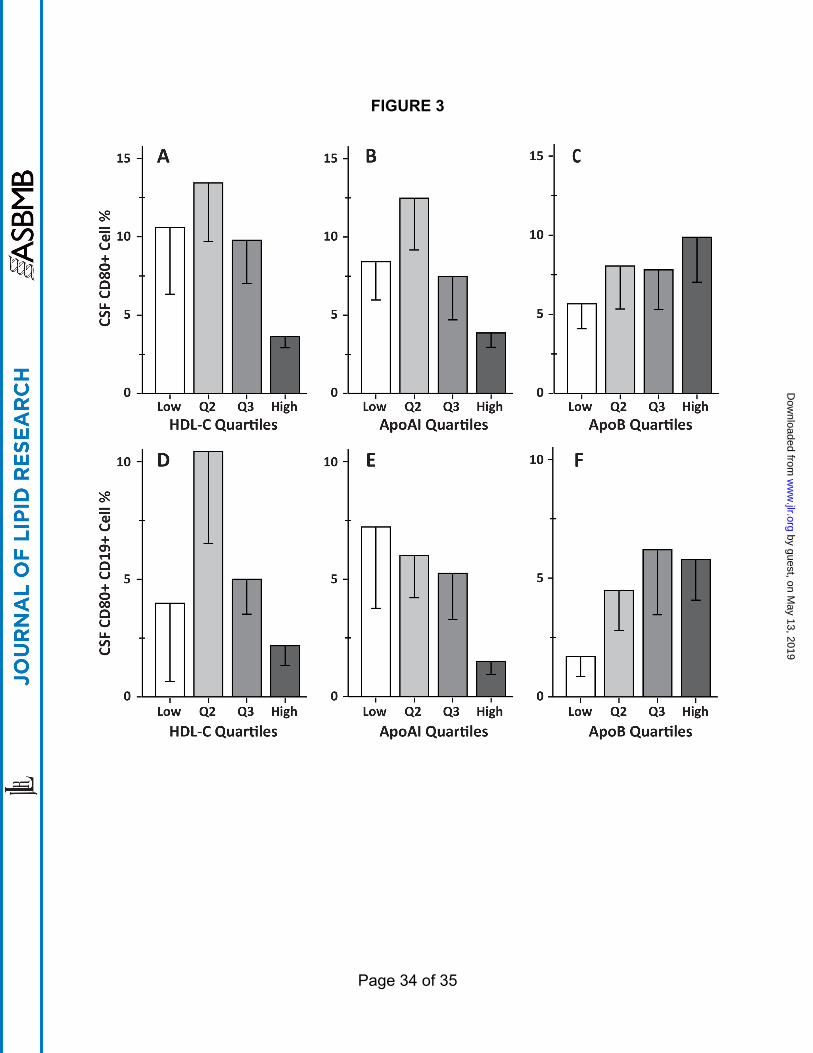
Associations of Lipid Profile Variables with Cell Variables: The associations of cell variables
(CD80+, CD80+CD19+, CD4+, CCR5+ and CXCR3+) with the serum cholesterol variables (HDL-C,
LDL-C, TC), serum apolipoprotein variables (ApoA-I, ApoA-II, ApoB, ApoE) and CRP were assessed.
The Wald χ2 and p-values from the regressions are shown in Table 2.
HDL-C was associated with CSF CD80+ cell frequencies (p <0.001, q = 0.002) and with CSF
CD80+CD19+ cells (p = 0.007, q = 0.028). HDL-C was not associated with CSF CD4+, CCR5+ or
by guest, on May 13, 2019
ww
w.jlr.org
Dow
nloaded from
Page 14 of 35
CXCR3+ cells frequencies. Similarly, ApoA-I was associated with CSF CD80+ (p = 0.001, q = 0.004)
and CD80+CD19+ (p = 0.015, q = 0.04) frequencies. ApoA-I levels were not associated with CSF CD4+,
CCR5+ and CXCR3+ cell frequencies. ApoA-II levels were not associated with any of the immune cell
subset frequencies.
Interestingly, only CD80+CD19+ cell frequencies were associated with ApoB (p < 0.001, q < 0.001).
None of the immune cell subset frequency variables were associated with LDL-C, TC, ApoE or CRP. The
associations of CD80+ and CD80+CD19+ cells frequencies and lipid variables HDL-C, ApoA-I and
ApoB are summarized in Figure 3.
The regression results for the cell frequency and lipid profile variables suggest that higher HDL-C levels
results in less extravasation of CD80+ and CD80+CD19+ cells into the CSF. There was no evidence for
associations of HDL-C levels with CD4+, CCR5+ or CXCR3+ frequencies in CSF.
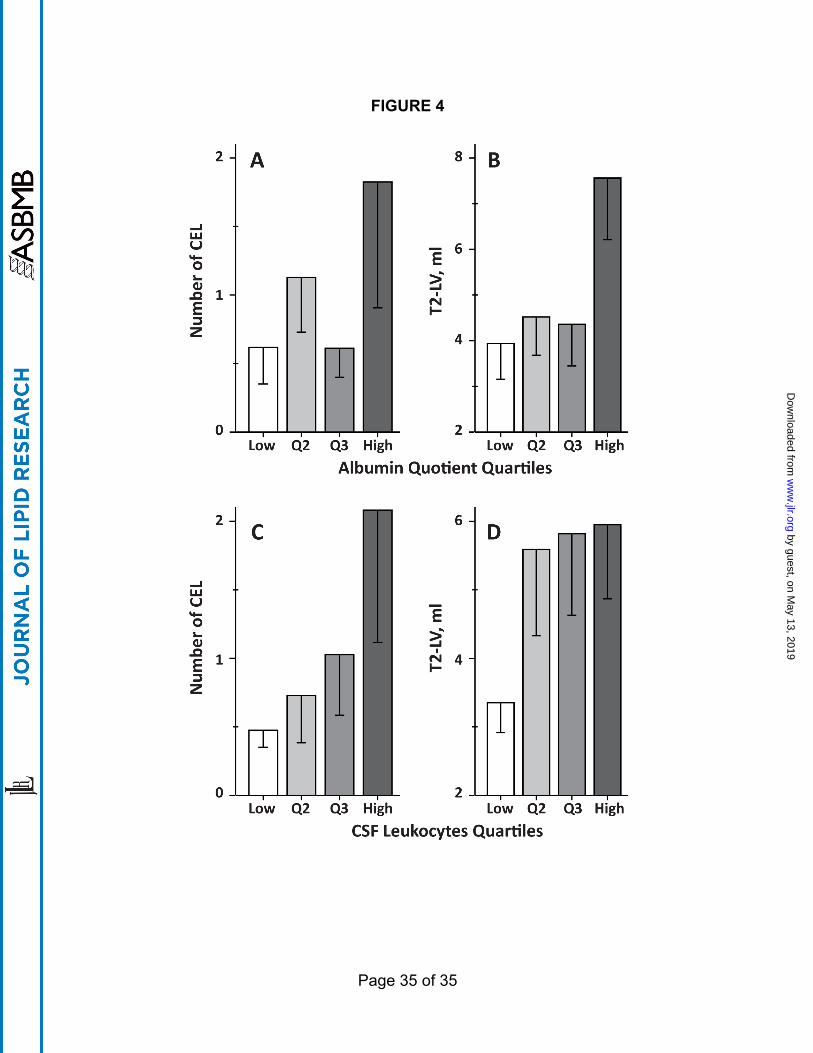
Associations of CSF Variables with MRI: We investigated whether CSF measures were associated with
baseline CEL number and T2-LV to assess the potential clinical relevance of altered BBB permeability
and immune activity. The regression analyses are summarized in supplementary Table 1.
The mean time ± SD between disease onset and baseline MRI was 82.5 ± 23.6 days (median = 79.0, inter-
quartile range = 37.5 days).
CEL number was associated with all but one of the CSF variables: total protein level, albumin level,
albumin quotient, IgG level, IgM level, IgM quotient and IgM index (all p <0.001, q <0.001), as well as
IgG quotient (p = 0.007, q = 0.008), total OCB (p = 0.004, q = 0.005), alkaline OCB (p = 0.003, q =
0.005) and leukocytes (p = 0.017, q = 0.019). CEL number was not associated with IgG index. The
associations of albumin quotient and CSF leukocytes with CEL number and T2-LV are summarized in
Figures 4A and 4C, respectively.
Only a subset of the CSF variables associated with CEL number were associated with T2-LV. CSF total
protein level (p = 0.016, q = 0.048), albumin level (p = 0.014, q = 0.056), albumin quotient (p = 0.006, q
by guest, on May 13, 2019
ww
w.jlr.org
Dow
nloaded from
Page 15 of 35
= 0.072), CSF IgG level (p = 0.017, q = 0.041) and IgG quotient (p = 0.012, q = 0.072) were associated
with T2-LV. The associations of albumin quotient and CSF leukocytes with T2-LV are summarized in
Figures 4B and 4D, respectively. We did not find evidence for associations for CSF IgM level, IgM
quotient, IgM index, total OCB, alkaline OCB and leukocytes with T2-LV
These results are consistent with a role for increased BBB permeability (as assessed by albumin quotient)
and CSF humoral immunity (as assessed by OCB and IgG) in CEL formation following the first
demyelinating event.
by guest, on May 13, 2019
ww
w.jlr.org
Dow
nloaded from
Page 16 of 35
DISCUSSION
We investigated the role of cholesterol and apolipoproteins in BBB breakdown following the first
demyelinating event suggestive of MS. Greater HDL-C was associated with less BBB permeability as
assessed by several CSF measures including CSF albumin quotient. High levels of HDL-C and ApoA-I
were associated with lower CSF frequencies of CD80+ and CD80+CD19+ cells. To our knowledge, the
associations of cholesterol and cholesterol biomarkers with BBB breakdown have not been extensively
investigated.
Although our results demonstrate protective associations between greater HDL-C levels and lower BBB
permeability, the strengths and limitations of our study design merit discussion. The SET study was a
well-controlled longitudinal, treatment study that accrued a wealth of clinical MRI and blood biomarkers
over a four-year period. However, a potential criticism of the study design is the lack of a placebo-
controlled group. A four-year placebo-controlled trial would clearly be ethically infeasible given that
proven disease-modifying therapies are now available for MS. However, it would have been useful to
compare interferon treatment in the SET trial to a different treatment such as glatiramer acetate to
establish whether our results were generalizable to other MS disease-modifying treatments. Our study was
also limited because the lipid profile and CSF measures were obtained only at screening making this
analysis cross-sectional in nature. Although our statistical results are consistent with a protective role for
high HDL levels against BBB injury after the first demyelinating event these associations are not proof of
causation.
Our study would be further strengthened if we had also obtained cholesterol and lipoprotein profiles in
the CSF. The CSF from SET study patients at the screening visit was primarily used to assess oligoclonal
band status of patients for meeting inclusion criteria. Additionally, measures of BBB breakdown and
immune cell extravasation were also obtained. Although the CNS and peripheral cholesterol
compartments are relatively segregated by the BBB, there is evidence for regulatory interactions and
by guest, on May 13, 2019
ww
w.jlr.org
Dow
nloaded from
Page 17 of 35
homeostatic mechanisms. Glial cells play a critical role in cholesterol production and homeostasis in the
brain where an HDL-like particle containing ApoE mediates cholesterol transport. The ApoE that
comprises this HDL-like particle is secreted by astrocytes and microglia. Although ApoA-I is not
produced in the brain, recent evidence suggests that circulating ApoA-I can enter the CSF through the
choroid plexus (24). The ApoA-I entering the brain is likely derived from SR-BI-mediated uptake of
circulating discoidal HDL particles into CSF at the choroid plexus (24, 25). ApoA-I and ApoE
measurements in CSF would have yielded information regarding these interactions between the CNS and
blood compartments. It would also be interesting to know if HDL particle size, particularly small,
discoidal, pre-β-HDL HDL, are more predictive of BBB integrity than total HDL-C alone.
MS is associated with significant cerebral vascular endothelial cell dysfunction (26-29). In
atherosclerosis, HDL-C plays an important protective role in the immune cell-vascular endothelial
interactions that mediate lesion formation. HDL can modulate immune cell phenotype by altering cellular
cholesterol because it stimulates cholesterol removal from macrophages and down-regulates foam cell
production. Plasma HDL-C has been found to be negatively associated with baseline monocyte counts
(30). HDL-C mediated cholesterol transport also preserves active endothelial nitric oxide synthase
(eNOS) dimer levels that maintain endothelial cell function (31).
The mechanisms by which these protective processes occur in MS remain unknown. Meyers et al,
reported that ApoA-I levels were lower in the MS patients compared to healthy controls and the primary
progressive MS group had lower levels than relapsing-remitting and secondary-progressive MS groups
(32). Interestingly, in a small study of 36 Alzheimer’s disease patients, low HDL was associated with
increased BBB breakdown as assessed by albumin quotient (33). This provides independent evidence,
albeit from a different neurological disease, that HDL and lipid profiles can modulate BBB breakdown.
However, Alzheimer’s disease is prevalent in the elderly, and 47% of the study group in (33) had
metabolic dyslipidemia and 22% were on statins. In contrast, our patient group was younger and none
were on statins. Results in the induced experimental allergic encephalomyelitis (EAE) animal model also
by guest, on May 13, 2019
ww
w.jlr.org
Dow
nloaded from
Page 18 of 35
provide supporting evidence. In EAE-induced ApoA-I-deficient mice, there was increased T cell
penetration into the CSF that led to an increase in demyelination (32).
We used a diverse range of CSF-derived measures of altered BBB permeability and immune activity. For
example, we used the albumin quotient (QAlb), a calculated measure that normalizes CSF albumin levels
to serum albumin. Because serum albumin is synthesized in the liver, any albumin present in CSF enters
via CNS regions of increased BBB permeability. In contrast, immunoglobulins can be synthesized in the
CSF by extravasating B cells in addition to entering the CSF from blood at regions where BBB integrity
is compromised. CD80+ is a co-stimulatory molecule for T cell activation that is expressed on activated B
cells and monocytes, whereas CD19+ is found on B cells; CCR5 and CXCR3 are chemokine receptors
that are expressed on T cells, particularly pro-inflammatory Th1 cells. Studies have demonstrated that
CD80+ cells and CD19+ cells are increased in peripheral blood mononuclear cells (PBMC) in MS (34,
35). CXCR3 and CCR5 expressing T cells are found in MS lesions and are higher in PBMC of
progressive MS patients (36).
Interestingly, increased HDL-C and ApoA-I were associated with lower IgG quotient; no associations
were found for IgG index, IgM quotient or IgM index. We attribute the differences between IgG and IgM
to the approximately 5-fold higher molecular weight of IgM (approximately 970 kD vs. 150 kD for IgG)
and lower prevalence of intrathecal synthesis of IgM in MS patients.
Weinstock-Guttman et al. (13) found that higher HDL-C levels were associated with decreased CEL
activity in a large group of MS patients whereas Giubilei et al. (8) found a similar association in clinically
isolated syndrome patients. The protective associations of the serum HDL compartment with CSF
measures of BBB integrity were confirmed via three different HDL biomarkers, viz., HDL-C, ApoA-I and
PON1 arylesterase activity. ApoA-I is the characteristic protein of HDL-C that mediates its important
interactions with other lipoproteins and cells. ApoA-I was associated with all of the same BBB
permeability measures and CSF immune cell subset frequencies as HDL-C. In contrast to ApoA-I, ApoA-
II has only secondary supporting roles in HDL functionality (37). ApoA-II is not as anti-atherogenic as
by guest, on May 13, 2019
ww
w.jlr.org
Dow
nloaded from
Page 19 of 35
ApoA-I and its associations with the risk of cardiovascular disease are considered weaker and more
controversial than ApoA-I (38). These physiological and clinical findings related to ApoA-II provide the
context for understanding the lack of ApoA-II associations with CSF measures. Taken together, the
concordance of our HDL-C and ApoA-I results provides support for potentially protective roles for the
HDL compartment on the CSF measures of altered BBB permeability (e.g. albumin quotient) and
immune activity (e.g., CD80+ and CD80+CD19+ cell frequencies in the CSF). The TC associations with
CSF measures are the result of key contributions from HDL.
In additional analyses (data not shown), we found that QAlb was associated with clinical disability
progression and with brain MRI measures of lesional injury and neurodegeneration. Higher baseline QAlb
was associated with increased EDSS over the 4 years following the initial demyelinating event. These
findings suggest that CSF measures may have prognostic importance in MS.
Multiple groups have independently reported that high LDL-C and TC levels are associated with
increased disability and T2 lesion burden (8, 10-13). ApoB, the characteristic protein of LDL-C, was
associated with greater CSF CD80+CD19+ cell frequency suggesting a possible role for the LDL
compartment in promoting extravasation, proliferation or survival of CD80+CD19+ cells in the CSF
milieu. We surmise that while the HDL compartment is important for protecting against increased BBB
permeability at the earliest stages of MS, the LDL-C and TC compartments are more important to the
subsequent processes that promote T2 lesion burden.
Our results indicate a protective role for HDL-C in the pathophysiological BBB injury that precedes the
formation of MS lesions. The findings are consistent with the intriguing possibility that loss of BBB
structural integrity is nucleated in membrane sub-domains actively involved in cholesterol homeostasis or
at pathophysiologically dyslipidemic tissue regions.
by guest, on May 13, 2019
ww
w.jlr.org
Dow
nloaded from
Page 20 of 35
ACKNOWLEDGEMENTS
The authors thank the patients who participated in this study.
FUNDING INFORMATION
Support from the National Multiple Sclerosis Society (RG4836-A-5) to the Ramanathan laboratory is
gratefully acknowledged. The SET study was supported by projects PRVOUK-P26/LF1/4 and RVO-
VFN64165/2012, and grants NT13237-4/2012 and NT13108-4/2012 from the Czech Ministries of
Education and Health.
AUTHOR CONTRIBUTIONS
Kelly Fellows – Data acquisition and analysis, manuscript drafting.
Tomas Uher – Data acquisition and analysis, manuscript drafting.
Richard W. Browne – Data acquisition.
Bianca Weinstock-Guttman,– Data interpretation, manuscript preparation
Robert Zivadinov – MRI data analysis, manuscript preparation
Dana Horakova – Clinical study design, data acquisition and interpretation, manuscript preparation.
Helena Posova – Flow cytometry and immunological data acquisition
Manuela Vaneckova – Data acquisition
Zdenek Seidl – Data acquisition
Jan Krasensky – Data acquisition
Michaela Tyblova – Data acquisition
Eva Havrdova – Clinical study design, manuscript preparation.
Murali Ramanathan – Study concept and design, data analysis, manuscript preparation.
by guest, on May 13, 2019
ww
w.jlr.org
Dow
nloaded from
Page 21 of 35
REFERENCES
1. Minagar A, Alexander JS. Blood-brain barrier disruption in multiple sclerosis. Multiple sclerosis.
2003;9(6):540-9.
2. Ortiz GG, Pacheco-Moises FP, Macias-Islas MA, Flores-Alvarado LJ, Mireles-Ramirez MA,
Gonzalez-Renovato ED, Hernandez-Navarro VE, Sanchez-Lopez AL, Alatorre-Jimenez MA.
Role of the Blood-Brain Barrier in Multiple Sclerosis. Archives of medical research.
2014;45(8):687-97.
3. Lucchinetti CF, Popescu BF, Bunyan RF, Moll NM, Roemer SF, Lassmann H, Bruck W, Parisi
JE, Scheithauer BW, Giannini C, Weigand SD, Mandrekar J, Ransohoff RM. Inflammatory
cortical demyelination in early multiple sclerosis. The New England journal of medicine.
2011;365(23):2188-97.
4. Werring DJ, Brassat D, Droogan AG, Clark CA, Symms MR, Barker GJ, MacManus DG,
Thompson AJ, Miller DH. The pathogenesis of lesions and normal-appearing white matter
changes in multiple sclerosis: a serial diffusion MRI study. Brain : a journal of neurology.
2000;123 ( Pt 8):1667-76.
5. Holmoy T. The discovery of oligoclonal bands: a 50-year anniversary. European neurology.
2009;62(5):311-5.
6. Henninger DD, Gerritsen ME, Granger DN. Low-density lipoprotein receptor knockout mice
exhibit exaggerated microvascular responses to inflammatory stimuli. Circ Res. 1997;81(2):274-
81.
7. Hansson GK, Hermansson A. The immune system in atherosclerosis. Nat Immunol.
2011;12(3):204-12.
by guest, on May 13, 2019
ww
w.jlr.org
Dow
nloaded from
Page 22 of 35
8. Giubilei F, Antonini G, Di Legge S, Sormani MP, Pantano P, Antonini R, Sepe-Monti M,
Caramia F, Pozzilli C. Blood cholesterol and MRI activity in first clinical episode suggestive of
multiple sclerosis. Acta neurologica Scandinavica. 2002;106(2):109-12.
9. Kardys A, Weinstock-Guttman B, Dillon M, Masud MW, Weinstock N, Mahfooz N, Lang JK,
Weinstock A, Lincoff N, Zivadinov R, Ramanathan M. Cholesterol affects retinal nerve fiber
layer thickness in patients with multiple sclerosis with optic neuritis. European journal of
neurology : the official journal of the European Federation of Neurological Societies.
2013;20(9):1264-71.
10. Tettey P, Simpson S, Jr., Taylor B, Blizzard L, Ponsonby AL, Dwyer T, Kostner K, van der Mei
I. An adverse lipid profile is associated with disability and progression in disability, in people
with MS. Multiple sclerosis. 2014;20(13):1737-44.
11. Tettey P, Simpson S, Jr., Taylor BV, van der Mei IA. Vascular comorbidities in the onset and
progression of multiple sclerosis. Journal of the neurological sciences. 2014;347(1-2):23-33.
12. Weinstock-Guttman B, Zivadinov R, Horakova D, Havrdova E, Qu J, Shyh G, Lakota E,
O'Connor K, Badgett D, Tamano-Blanco M, Tyblova M, Hussein S, Bergsland N, Willis L,
Krasensky J, Vaneckova M, Seidl Z, Ramanathan M. Lipid profiles are associated with lesion
formation over 24 months in interferon-beta treated patients following the first demyelinating
event. Journal of neurology, neurosurgery, and psychiatry. 2013;84(11):1186-91.
13. Weinstock-Guttman B, Zivadinov R, Mahfooz N, Carl E, Drake A, Schneider J, Teter B, Hussein
S, Mehta B, Weiskopf M, Durfee J, Bergsland N, Ramanathan M. Serum lipid profiles are
associated with disability and MRI outcomes in multiple sclerosis. Journal of neuroinflammation.
2011;8:127.
14. Browne RW, Weinstock-Guttman B, Horakova D, Zivadinov R, Bodziak ML, Tamano-Blanco
M, Badgett D, Tyblova M, Vaneckova M, Seidl Z, Krasensky J, Bergsland N, Ramasamy DP,
by guest, on May 13, 2019
ww
w.jlr.org
Dow
nloaded from
Page 23 of 35
Hagemeier J, Havrdova E, Ramanathan M. Apolipoproteins are associated with new MRI lesions
and deep grey matter atrophy in clinically isolated syndromes. Journal of neurology,
neurosurgery, and psychiatry. 2014;85(8):859-64.
15. Zivadinov R, Havrdova E, Bergsland N, Tyblova M, Hagemeier J, Seidl Z, Dwyer MG,
Vaneckova M, Krasensky J, Carl E, Kalincik T, Horakova D. Thalamic atrophy is associated with
development of clinically definite multiple sclerosis. Radiology. 2013;268(3):831-41.
16. Kalincik T, Vaneckova M, Tyblova M, Krasensky J, Seidl Z, Havrdova E, Horakova D.
Volumetric MRI markers and predictors of disease activity in early multiple sclerosis: a
longitudinal cohort study. PLoS One. 2012;7(11):e50101.
17. Friedewald WT, Levy RI, Fredrickson DS. Estimation of the concentration of low-density
lipoprotein cholesterol in plasma, without use of the preparative ultracentrifuge. Clinical
chemistry. 1972;18(6):499-502.
18. Browne RW, Koury ST, Marion S, Wilding G, Muti P, Trevisan M. Accuracy and Biological
Variation of Human Serum Paraoxonase 1 Activity and Polymorphism (Q192R) by Kinetic
Enzyme Assay. Clinical chemistry. 2007;53(2):310-7.
19. Freedman MS, Thompson EJ, Deisenhammer F, Giovannoni G, Grimsley G, Keir G, Ohman S,
Racke MK, Sharief M, Sindic CJ, Sellebjerg F, Tourtellotte WW. Recommended standard of
cerebrospinal fluid analysis in the diagnosis of multiple sclerosis: a consensus statement.
Archives of neurology. 2005;62(6):865-70.
20. Wada H. Blood-brain barrier permeability of the demented elderly as studied by cerebrospinal
fluid-serum albumin ratio. Internal medicine. 1998;37(6):509-13.
by guest, on May 13, 2019
ww
w.jlr.org
Dow
nloaded from
Page 24 of 35
21. Reiber H, Teut M, Pohl D, Rostasy KM, Hanefeld F. Paediatric and adult multiple sclerosis: age-
related differences and time course of the neuroimmunological response in cerebrospinal fluid.
Multiple sclerosis. 2009;15(12):1466-80.
22. Benjamini Y, Hochberg Y. Controlling the false discovery rate: a practical and powerful
approach to multiple testing. J Roy Stat Soc B 1995;57:289-300.
23. Cowdrey GN, Tasker PJ, Gould BJ, Rice-Oxley M, Firth GB. Isoelectric focusing in an
immobilized pH gradient for the detection of intrathecal IgG in cerebrospinal fluid: sensitivity
and specificity for the diagnosis of multiple sclerosis. Annals of clinical biochemistry. 1993;30 (
Pt 5):463-8.
24. Stukas S, Robert J, Lee M, Kulic I, Carr M, Tourigny K, Fan J, Namjoshi D, Lemke K, DeValle
N, Chan J, Wilson T, Wilkinson A, Chapanian R, Kizhakkedathu JN, Cirrito JR, Oda MN,
Wellington CL. Intravenously injected human apolipoprotein A-I rapidly enters the central
nervous system via the choroid plexus. Journal of the American Heart Association.
2014;3(6):e001156.
25. Vitali C, Wellington CL, Calabresi L. HDL and cholesterol handling in the brain. Cardiovascular
research. 2014;103(3):405-13.
26. Alexander JS, Harris MK, Wells SR, Mills G, Chalamidas K, Ganta VC, McGee J, Jennings MH,
Gonzalez-Toledo E, Minagar A. Alterations in serum MMP-8, MMP-9, IL-12p40 and IL-23 in
multiple sclerosis patients treated with interferon-beta1b. Mult Scler. 2010;16(7):801-9.
27. Alexander JS, Zivadinov R, Maghzi AH, Ganta VC, Harris MK, Minagar A. Multiple sclerosis
and cerebral endothelial dysfunction: Mechanisms. Pathophysiology. 2010.
by guest, on May 13, 2019
ww
w.jlr.org
Dow
nloaded from
Page 25 of 35
28. Minagar A, Carpenter A, Alexander JS. The destructive alliance: interactions of leukocytes,
cerebral endothelial cells, and the immune cascade in pathogenesis of multiple sclerosis. Int Rev
Neurobiol. 2007;79:1-11.
29. Minagar A, Jy W, Jimenez JJ, Alexander JS. Multiple sclerosis as a vascular disease. Neurol Res.
2006;28(3):230-5.
30. Ganda A, Magnusson M, Yvan-Charvet L, Hedblad B, Engstrom G, Ai D, Wang TJ, Gerszten
RE, Melander O, Tall AR. Mild renal dysfunction and metabolites tied to low HDL cholesterol
are associated with monocytosis and atherosclerosis. Circulation. 2013;127(9):988-96.
31. Terasaka N, Yu S, Yvan-Charvet L, Wang N, Mzhavia N, Langlois R, Pagler T, Li R, Welch CL,
Goldberg IJ, Tall AR. ABCG1 and HDL protect against endothelial dysfunction in mice fed a
high-cholesterol diet. The Journal of clinical investigation. 2008;118(11):3701-13.
32. Meyers L, Groover CJ, Douglas J, Lee S, Brand D, Levin MC, Gardner LA. A role for
Apolipoprotein A-I in the pathogenesis of multiple sclerosis. Journal of neuroimmunology.
2014;277(1-2):176-85.
33. Bowman GL, Kaye JA, Quinn JF. Dyslipidemia and blood-brain barrier integrity in Alzheimer's
disease. Current gerontology and geriatrics research. 2012;2012:184042.
34. Genc K, Dona DL, Reder AT. Increased CD80(+) B cells in active multiple sclerosis and reversal
by interferon beta-1b therapy. The Journal of clinical investigation. 1997;99(11):2664-71.
35. Trabattoni D, Saresella M, Pacei M, Marventano I, Mendozzi L, Rovaris M, Caputo D, Borelli M,
Clerici M. Costimulatory pathways in multiple sclerosis: distinctive expression of PD-1 and PD-
L1 in patients with different patterns of disease. Journal of immunology. 2009;183(8):4984-93.
36. Balashov KE, Rottman JB, Weiner HL, Hancock WW. CCR5(+) and CXCR3(+) T cells are
increased in multiple sclerosis and their ligands MIP-1alpha and IP-10 are expressed in
by guest, on May 13, 2019
ww
w.jlr.org
Dow
nloaded from
Page 26 of 35
demyelinating brain lesions. Proceedings of the National Academy of Sciences of the United
States of America. 1999;96(12):6873-8.
37. Remaley AT. Apolipoprotein A-II: still second fiddle in high-density lipoprotein metabolism?
Arteriosclerosis, thrombosis, and vascular biology. 2013;33(2):166-7.
38. Chan DC, Ng TW, Watts GF. Apolipoprotein A-II: evaluating its significance in dyslipidaemia,
insulin resistance, and atherosclerosis. Annals of medicine. 2012;44(4):313-24.
by guest, on May 13, 2019
ww
w.jlr.org
Dow
nloaded from
Page 27 of 35
FIGURE LEGENDS
Figure 1. Associations of HDL cholesterol quartiles with albumin quotient (Figure 1A), IgG Index
(Figure 1B), IgM Index (Figure 1C) and CSF leukocytes (Figure 1D). The quartile boundaries were: the
lowest quartile corresponds to HDL-C ≤ 56.27 mg/dl, 56.27 mg/dl < Quartile 2 ≤ 66.25 mg/dl, 66.25
mg/dl < Quartile 3 ≤ 80.69 mg/dl, Highest quartile > 80.69 mg/dl. The bars compare mean values of the
CSF measures shown on the y-axis for the quartiles of HDL cholesterol shown on the x-axis. The error
bars indicate the standard error of the mean.
Figure 2. Associations of apolipoprotein A-I quartiles with albumin quotient (Figure 2A), IgG Index
(Figure 2B), IgM Index (Figure 2C) and CSF leukocytes (Figure 2D). The ApoA-I quartile boundaries
were: the lowest quartile corresponds to ApoA-I ≤ 128.3 mg/dl, 128.3 mg/dl < Quartile 2 ≤ 151.1 mg/dl,
151.1 mg/dl < Quartile 3 ≤ 175.8 mg/dl, and the highest quartile > 175.8 mg/dl. The bars compare mean
values of the CSF measures shown on the y-axis to the quartiles of ApoA-I shown on the x-axis. The error
bars indicate the standard error of the mean.
Figure 3. Associations of mean CSF CD80+ (top row) and CSF CD80+ CD19+ (bottom row) cell
frequencies in percent with HDL-C quartiles, ApoA-I quartiles and ApoB quartiles. The HDL-C quartile
boundaries were: the lowest quartile corresponds to HDL-C ≤ 56.27 mg/dl, 56.27 mg/dl < Quartile 2 ≤
66.25 mg/dl, 66.25 mg/dl < Quartile 3 ≤ 80.69 mg/dl, Highest quartile > 80.69 mg/dl. The ApoA-I
quartile boundaries were: the lowest quartile corresponds to ApoA-I ≤ 128.3 mg/dl, 128.3 mg/dl <
Quartile 2 ≤ 151.1 mg/dl, 151.1 mg/dl < Quartile 3 ≤ 175.8 mg/dl, and the highest quartile > 175.8 mg/dl.
The ApoB quartile boundaries were: the lowest quartile corresponds to ApoB ≤ 54.0 mg/dl, 54.0 mg/dl <
Quartile 2 ≤ 70.75 mg/dl, 70.75 mg/dl < Quartile 3 ≤ 87.0 mg/dl, and the highest quartile > 87.0 mg/dl.
The bars compare mean values of the CSF cell frequencies in percent shown on the y-axis to the quartiles
of HDL-C, ApoA-I or ApoB on the x-axis. The error bars indicate the standard error of the mean.
Figure 4. Associations of albumin quotient and CSF leukocytes with CEL number and T2-LV MRI
measures. The bars compare mean values of the MRI measures shown on the y-axis for the quartiles of
by guest, on May 13, 2019
ww
w.jlr.org
Dow
nloaded from
Page 28 of 35
the CSF variable shown on the x-axis. The albumin quotient quartile boundaries were: the lowest quartile
corresponds to albumin quotient ≤ 3.36 mg/g, 3.36 mg/g < Quartile 2 ≤ 4.25 mg/g, 4.25 mg/g < Quartile 3
≤ 5.58 mg/g, Highest quartile > 5.58 mg/g. The CSF leukocytes quartile boundaries were: the lowest
quartile corresponds to CSF leukocytes ≤ 9.0/3 µl, 10.0/3 µl ≤ Quartile 2 ≤ 17.0/3 µl, 18.0/3 µl ≤ Quartile
3 ≤ 33.5/3 µl, Highest quartile > 33.5/3 µl. The error bars indicate the standard error of the mean.
by guest, on May 13, 2019
ww
w.jlr.org
Dow
nloaded from
Page 29 of 35
TABLES
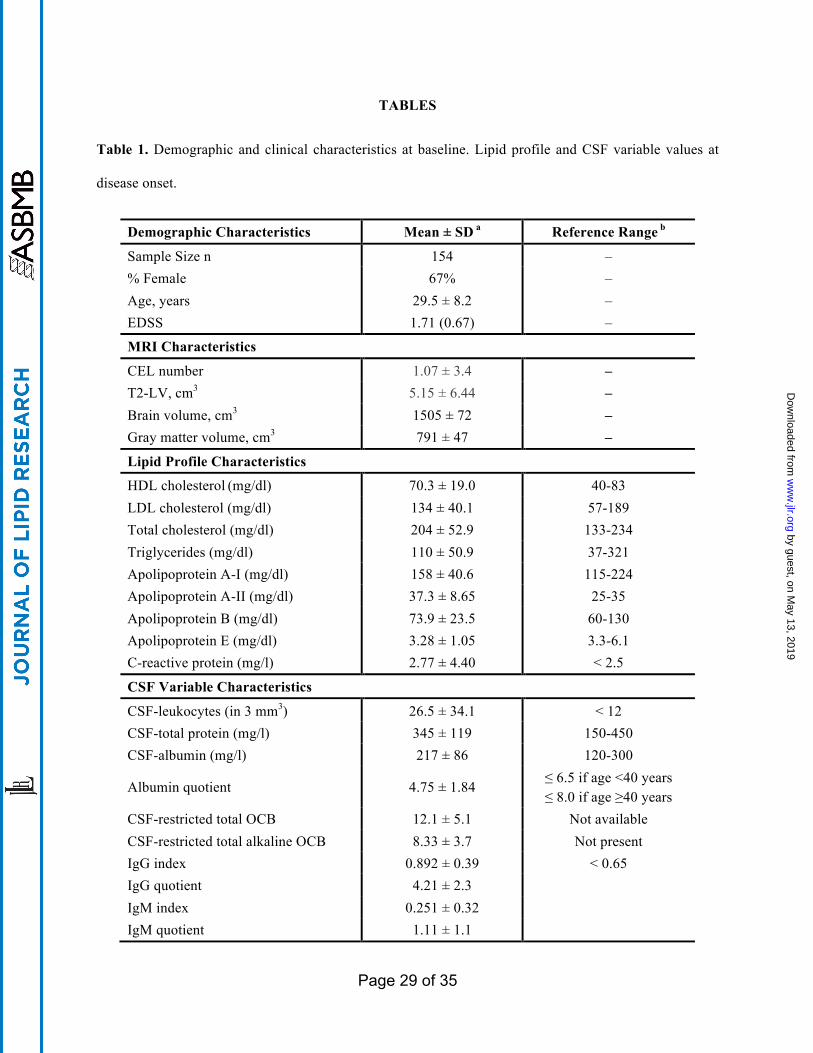
Table 1. Demographic and clinical characteristics at baseline. Lipid profile and CSF variable values at
disease onset.
Demographic Characteristics Mean ± SD a Reference Range b
Sample Size n 154 – % Female 67% – Age, years 29.5 ± 8.2 – EDSS 1.71 (0.67) –
MRI Characteristics
CEL number 1.07 ± 3.4 – T2-LV, cm3 5.15 ± 6.44 – Brain volume, cm3 1505 ± 72 – Gray matter volume, cm3 791 ± 47 –
Lipid Profile Characteristics HDL cholesterol (mg/dl) 70.3 ± 19.0 40-83 LDL cholesterol (mg/dl) 134 ± 40.1 57-189 Total cholesterol (mg/dl) 204 ± 52.9 133-234 Triglycerides (mg/dl) 110 ± 50.9 37-321 Apolipoprotein A-I (mg/dl) 158 ± 40.6 115-224 Apolipoprotein A-II (mg/dl) 37.3 ± 8.65 25-35 Apolipoprotein B (mg/dl) 73.9 ± 23.5 60-130 Apolipoprotein E (mg/dl) 3.28 ± 1.05 3.3-6.1 C-reactive protein (mg/l) 2.77 ± 4.40 < 2.5
CSF Variable Characteristics
CSF-leukocytes (in 3 mm3) 26.5 ± 34.1 < 12 CSF-total protein (mg/l) 345 ± 119 150-450 CSF-albumin (mg/l) 217 ± 86 120-300
Albumin quotient 4.75 ± 1.84 ≤ 6.5 if age <40 years ≤ 8.0 if age ≥40 years
CSF-restricted total OCB 12.1 ± 5.1 Not available CSF-restricted total alkaline OCB 8.33 ± 3.7 Not present IgG index 0.892 ± 0.39 < 0.65 IgG quotient 4.21 ± 2.3 IgM index 0.251 ± 0.32 IgM quotient 1.11 ± 1.1
by guest, on May 13, 2019
ww
w.jlr.org
Dow
nloaded from
Page 30 of 35
a All continuous variables (age, disease duration, T2-LV, T1-LV) are mean ± standard deviation. For the
ordinal EDSS, the median (inter-quartile range) is given.
b Reference range provided by diagnostic reagent kit manufacturers or clinical laboratory.
by guest, on May 13, 2019
ww
w.jlr.org
Dow
nloaded from
Page 31 of 35
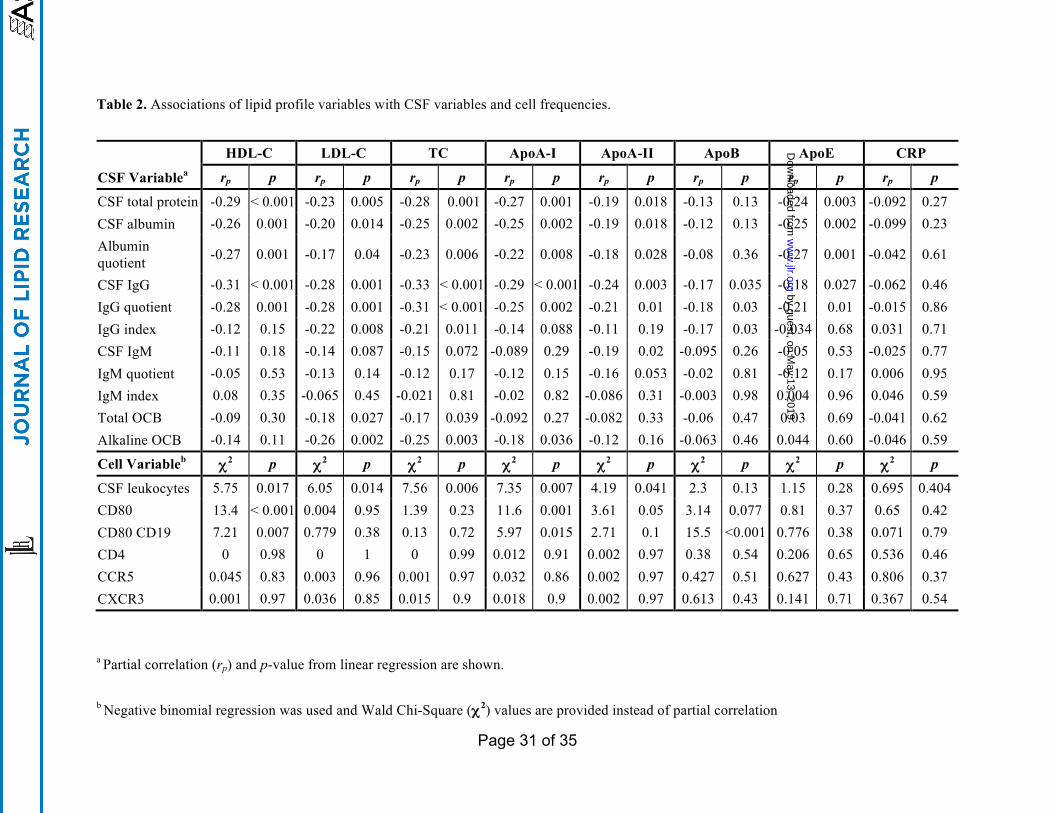
Table 2. Associations of lipid profile variables with CSF variables and cell frequencies.
HDL-C LDL-C TC ApoA-I ApoA-II ApoB ApoE CRP
CSF Variablea rp p rp p rp p rp p rp p rp p rp p rp p
CSF total protein -0.29 < 0.001 -0.23 0.005 -0.28 0.001 -0.27 0.001 -0.19 0.018 -0.13 0.13 -0.24 0.003 -0.092 0.27 CSF albumin -0.26 0.001 -0.20 0.014 -0.25 0.002 -0.25 0.002 -0.19 0.018 -0.12 0.13 -0.25 0.002 -0.099 0.23 Albumin quotient -0.27 0.001 -0.17 0.04 -0.23 0.006 -0.22 0.008 -0.18 0.028 -0.08 0.36 -0.27 0.001 -0.042 0.61
CSF IgG -0.31 < 0.001 -0.28 0.001 -0.33 < 0.001 -0.29 < 0.001 -0.24 0.003 -0.17 0.035 -0.18 0.027 -0.062 0.46 IgG quotient -0.28 0.001 -0.28 0.001 -0.31 < 0.001 -0.25 0.002 -0.21 0.01 -0.18 0.03 -0.21 0.01 -0.015 0.86 IgG index -0.12 0.15 -0.22 0.008 -0.21 0.011 -0.14 0.088 -0.11 0.19 -0.17 0.03 -0.034 0.68 0.031 0.71 CSF IgM -0.11 0.18 -0.14 0.087 -0.15 0.072 -0.089 0.29 -0.19 0.02 -0.095 0.26 -0.05 0.53 -0.025 0.77 IgM quotient -0.05 0.53 -0.13 0.14 -0.12 0.17 -0.12 0.15 -0.16 0.053 -0.02 0.81 -0.12 0.17 0.006 0.95 IgM index 0.08 0.35 -0.065 0.45 -0.021 0.81 -0.02 0.82 -0.086 0.31 -0.003 0.98 0.004 0.96 0.046 0.59 Total OCB -0.09 0.30 -0.18 0.027 -0.17 0.039 -0.092 0.27 -0.082 0.33 -0.06 0.47 0.03 0.69 -0.041 0.62 Alkaline OCB -0.14 0.11 -0.26 0.002 -0.25 0.003 -0.18 0.036 -0.12 0.16 -0.063 0.46 0.044 0.60 -0.046 0.59
Cell Variableb χ2 p χ2 p χ2 p χ2 p χ2 p χ2 p χ2 p χ2 p
CSF leukocytes 5.75 0.017 6.05 0.014 7.56 0.006 7.35 0.007 4.19 0.041 2.3 0.13 1.15 0.28 0.695 0.404 CD80 13.4 < 0.001 0.004 0.95 1.39 0.23 11.6 0.001 3.61 0.05 3.14 0.077 0.81 0.37 0.65 0.42 CD80 CD19 7.21 0.007 0.779 0.38 0.13 0.72 5.97 0.015 2.71 0.1 15.5 <0.001 0.776 0.38 0.071 0.79 CD4 0 0.98 0 1 0 0.99 0.012 0.91 0.002 0.97 0.38 0.54 0.206 0.65 0.536 0.46 CCR5 0.045 0.83 0.003 0.96 0.001 0.97 0.032 0.86 0.002 0.97 0.427 0.51 0.627 0.43 0.806 0.37 CXCR3 0.001 0.97 0.036 0.85 0.015 0.9 0.018 0.9 0.002 0.97 0.613 0.43 0.141 0.71 0.367 0.54
a Partial correlation (rp) and p-value from linear regression are shown.
b Negative binomial regression was used and Wald Chi-Square (χ2) values are provided instead of partial correlation
by guest, on May 13, 2019
ww
w.jlr.org
Dow
nloaded from