Embed Size (px)
Citation preview
Protection of VSC-HVDC systems with mixed usage of power cables and overhead lines
Von der Fakultät für Elektrotechnik und Informationstechnik der Rheinisch-Westfälischen Technischen Hochschule Aachen
zur Erlangung des akademischen Grades eines Doktors der Ingenieurwissenschaften
genehmigte Dissertation
vorgelegt von
Philipp Tünnerhoff, M.Sc. aus Dortmund
Berichter: Univ.-Prof. Dr.-Ing. Armin Schnettler Univ.-Prof. Dr.-Ing. Stefan Tenbohlen
Tag der mündlichen Prüfung: 11. Mai 2020
Diese Dissertation ist auf den Internetseiten der Universitätsbibliothek online verfügbar.

Bibliografische Information der Deutschen BibliothekDie Deutsche Bibliothek verzeichnet diese Publikation in der Deut-schen Nationalbibliografie; detaillierte bibliografische Daten sind imInternet über http://dnb.ddb.de abrufbar.
Herstellung & Vertrieb:
1. Auflage 2020© Verlagshaus Mainz GmbH AachenSüsterfeldstr. 83, 52072 AachenTel. 0241/87 34 34 00www.Verlag-Mainz.dewww.DruckereiMainz.de
Satz: nach Druckvorlage des AutorsUmschlaggestaltung: Verlagshaus Mainz
printed in Germany
D 82 (Diss. RWTH Aachen University, 2020)
Das Werk einschließlich seiner Teile ist urheberrechtlich geschützt. Jede Verwendung ist ohne die Zustimmungdes Herausgebers außerhalb der engen Grenzen des Urhebergesetzes unzulässig und strafbar. Das giltinsbesondere für Vervielfältigungen, Übersetzungen, Mikroverfilmungen und die Einspeicherung und Verarbei-tung in elektronischen Systemen.
Aachener Beiträge zur HOCHSPANNUNGSTECHNIKHerausgeber: Univ.-Prof. Dr.-Ing. A. Schnettler
Phillip TünnerhoffProtection of VSC-HVDC systems with mixed usage of power cables and overhead lines
ISBN: 978-3-95886-359-0

Preface iii
Preface
This dissertation was written during my time as research assistant at the Institute for High Voltage Technology at RWTH Aachen University.
I would like to express my sincere gratitude to Prof. Armin Schnettler for his mentorship, guidance and continuous support over the years, which helped propel my research and this thesis. I would also like to thank Prof. Stefan Tenbohlen for his supervision and valuable input into this work as well as Prof. Steffen Leonhardt and Prof. Janina Fels for their interest in this thesis and their support.
During my time at the Institute for High Voltage Technology, I was fortunate to be surrounded by exceptional colleagues and friends, which provided guidance whenever needed, gave valuable feedback and helped develop me into the person I am today – thank you very much to all of you. In addition, my research work was continuously supported by student assistants and their theses, for which I am very grateful.
In particular, I would like to thank my family and friends for their unconditional support and patience during this entire time. This work is dedicated to you.
Dortmund, June 2020
Philipp Tünnerhoff

Abstract v
Abstract
The integration of VSC-HVDC transmission systems into existing AC grid structures is identified as a key solution to increase the accessibility of remotely located renewable generation. At the same time, realising new transmission corridors is often confronted by public objection. In an effort to reduce planning and commissioning processes, transmission systems with mixed usage of power cables and overhead lines are expected to assume an increasingly important role in the future transmission grid. However, several technical challenges still have to be addressed, in particular the reliable, fast and selective handling of line faults. Since line protection concepts proposed for VSC-HVDC systems today typically only account for either pure cable or pure overhead line transmission, a comprehensive investigation of the transient fault behaviour in mixed systems is needed to be able to assess and further develop the existing methods.
In this work, topological impact factors on the voltage and current characteristics are analysed based on electromagnetic transient simulations in the time domain. As a result of travelling wave reflection and transmission effects, which occur at every transition point between a cable and an overhead line section, the initial fault impacts at the transmission line ends and segment interfaces can vary significantly depending on the line topology and the fault location. On the one hand, amplified wave fronts can cause increased voltage and current stresses compared to pure cable or overhead line systems. On the other hand, the initial fault effects at the line terminations can be attenuated significantly without a clear indication of travelling wave fronts. Since most of the proposed fault detection and localisation methods rely on an identification of steep voltage and current changes, comprehensive line protection is no longer guaranteed.
To address these challenges, distributed voltage and current measurements are introduced at the line transition points as well as end-to-end and interface-to-end communication channels to transmit the measurement data to the line ends. On this foundation, additional voltage-based detection criteria and a rate-of-change-of-current-based localisation algorithm are incorporated into the protection concept, along with further enhancements, e.g. for applications in multi-terminal DC systems. The functionality and flexible applicability of the developed methods is validated in exemplary test systems pointing out the successful detection, separation and localisation of faults in all of the investigated scenarios.

Table of Contents vii
Table of Contents
Preface .............................................................................................................. iii Abstract .............................................................................................................. v Table of Contents ............................................................................................. vii
1 Introduction ............................................................................................. 1
1.1 Motivation of the topic ..................................................................... 2 1.2 State of research and application ...................................................... 3
1.2.1 HVDC system topologies and technologies ................................. 3 1.2.2 Protection of VSC-HVDC systems .............................................. 6 1.2.3 Mixed usage of cables and overhead lines ................................. 11 1.2.4 Starting point for the investigations ........................................... 12
1.3 Objectives and investigation approach ........................................... 14
2 Physical and technological basics ......................................................... 17
2.1 Propagation of travelling waves on transmission lines ................... 17 2.1.1 Travelling wave distortion ......................................................... 18 2.1.2 Transmission line characteristics ................................................ 20 2.1.3 Analysis of propagation phenomena .......................................... 20
2.2 Electrical field stress in polarised XLPE insulations ...................... 22 2.2.1 Accumulation of space charges .................................................. 22 2.2.2 Voltage polarity reversal ............................................................ 24
3 Investigation method and boundary conditions.................................. 27
3.1 EMTP model and simulation framework........................................ 28 3.2 Structure and methodical approach of the investigations ............... 34
viii Table of Contents
4 Analysis of topological impacts on the transient behaviour .............. 39
4.1 Point-to-point DC systems .............................................................. 40 4.2 Multi-terminal DC systems ............................................................ 48 4.3 Hybrid AC-DC systems .................................................................. 53
5 Assessment of existing protection concepts ......................................... 55
5.1 Component protection .................................................................... 56 5.2 Detection of line faults ................................................................... 60 5.3 Fault separation .............................................................................. 65 5.4 Discrimination of UGC and OHL faults ......................................... 66
6 Development of enhanced protection methods ................................... 71
6.1 Fast and selective detection of line faults ....................................... 72 6.2 Identification of faulted line segments............................................ 78
7 Validation in exemplary test cases ....................................................... 81
7.1 Bipolar point-to-point interconnection ........................................... 81 7.2 Symmetrical monopole multi-terminal system ............................... 88
8 Summary and outlook ........................................................................... 95
References ........................................................................................................ 99 List of abbreviations....................................................................................... 109 List of publications......................................................................................... 111 Appendix ........................................................................................................ 115
Introduction 1
1 Introduction
In an effort to reduce greenhouse gas emissions, integrating renewable energy sources into the existing portfolios is part of many nations’ energy and climate policies [EC14, IEA11, NRE17]. Due to the renewables’ volatile nature and distributed locations, this change in power generation requires a change in power transmission and distribution as well. Thus, enhanced electrical infrastructures are required with respect to their transmission capacity and flexible operation capability [ENT16a]. For this purpose, high voltage direct current transmission based on Voltage Source Converter technology (VSC-HVDC) has been identified worldwide as a key technology. Latest developments, in particular the introduction of Modular Multilevel Converters (MMCs), enable bulk power transmission while providing ancillary services to nearby AC grids, such as reactive power compensation, grid support during AC faults etc. [Jov15, Sha16].
Overhead lines (OHLs) are typically used for long-distance power transmission onshore. In recent years, however, the realisation of new OHL corridors in densely populated areas has become a challenging task due to increasing public objection to the lines’ visual and environmental impacts. Extended planning and ratification processes are the consequences causing delays of intended grid extensions [Bui11, Men14, Ten13]. In Germany, the government therefore has given precedence to underground cable (UGC) transmission for the realisation of new HVDC corridors [Amp17, BmW16]. Other recent examples for the use of UGCs instead of OHLs to facilitate grid extension are found both for HVAC and for HVDC applications [Eli17, Lab12, Nor10, Swi18].
While from a techno-economical standpoint, OHLs are the preferred option for onshore transmission in most cases, it is expected that the majority of new VSC-HVDC systems in Western Europe and other densely populated regions worldwide will be realised primarily based on UGC transmission for socio-political reasons. In certain areas, however, OHL transmission can still be the preferred option, e.g. in lower population density districts, on agricultural land, inaccessible terrain etc. Moreover, UGC systems still have significantly higher projected investment costs compared to respective OHLs depending on, amongst others, the transmission line length, environmental aspects, power ratings etc. [ENT11, Eur11, Nat15]. For this reason, HVDC corridors incorporating both UGC and OHL transmission segments may become a standard solution to reduce
2 Introduction
planning and ratification processes [Ten13]. At the same time, these systems represent diverse and more complex topologies than today’s pure UGC or pure OHL links and may therefore require more sophisticated operational strategies and elaborate protection concepts to ensure reliable grid operation.
1.1 Motivation of the topic
Regardless of the transmission technology, the design of protection strategies is a key concern in any form of transmission grid. VSC-HVDC systems impose additional requirements due to the limited overload capacity of semiconductor switches, as well as steeper voltage and current gradients during faults compared to HVAC or thyristor-based HVDC systems. Typically, only a few milliseconds are available to detect line faults and initiate current limiting measures [Cha14, Sha16]. In critical situations, a protection decision may have to be made based on the first travelling wave reaching a line end. Even though limited to this information, comprehensive fault handling has to incorporate not only the detection of the fault, but also its subsequent separation as well as concepts for fast system recovery.
In case of mixed transmission topologies, a further degree of complexity is added to the protection task by the UGC-OHL interfaces. Due to travelling wave reflection and transmission effects caused by different line characteristics, the shapes of voltage and current transients are distorted at every interface [Rüd14]. As a result, the wave shapes and amplitudes appearing at the respective line ends are altered as well, which has to be accounted for during fault detection. Moreover, impermissible stresses may result from interfering travelling waves along the transmission line. As an example, voltage polarity changes on cross-linked polyethylene (XLPE) cables may cause severe local electrical field stresses and subsequent insulation failure [Maz13].
If both fault detection and fault separation are performed successfully, a decision has to be made to either re-start operation on the faulted line quickly or to permanently disconnect the line. In mixed transmission systems, this decision can only be made, if the faulted line segment is known, i.e. whether the fault occurred on an UGC or an OHL section. OHL faults often result from atmospheric impacts allowing fast recovery due to the self-healing nature of the air insulation after arc quenching [CIG17, Küc18]. On the other hand, UGC faults are typically permanent and should be isolated without re-connection attempts. Mixed transmission corridors therefore require accurate and fast fault localisation
Introduction 3
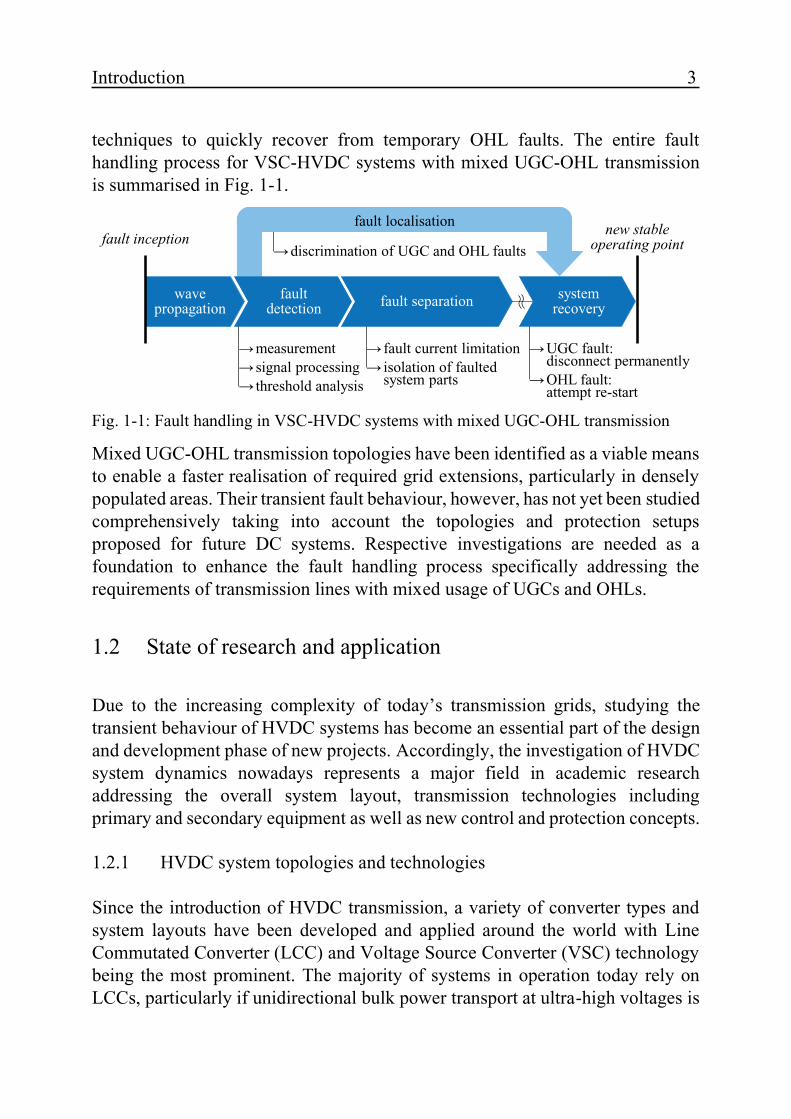
techniques to quickly recover from temporary OHL faults. The entire fault handling process for VSC-HVDC systems with mixed UGC-OHL transmission is summarised in Fig. 1-1.
Mixed UGC-OHL transmission topologies have been identified as a viable means to enable a faster realisation of required grid extensions, particularly in densely populated areas. Their transient fault behaviour, however, has not yet been studied comprehensively taking into account the topologies and protection setups proposed for future DC systems. Respective investigations are needed as a foundation to enhance the fault handling process specifically addressing the requirements of transmission lines with mixed usage of UGCs and OHLs.
1.2 State of research and application
Due to the increasing complexity of today’s transmission grids, studying the transient behaviour of HVDC systems has become an essential part of the design and development phase of new projects. Accordingly, the investigation of HVDC system dynamics nowadays represents a major field in academic research addressing the overall system layout, transmission technologies including primary and secondary equipment as well as new control and protection concepts.
1.2.1 HVDC system topologies and technologies
Since the introduction of HVDC transmission, a variety of converter types and system layouts have been developed and applied around the world with Line Commutated Converter (LCC) and Voltage Source Converter (VSC) technology being the most prominent. The majority of systems in operation today rely on LCCs, particularly if unidirectional bulk power transport at ultra-high voltages is
Fig. 1-1: Fault handling in VSC-HVDC systems with mixed UGC-OHL transmission
→ discrimination of UGC and OHL faultsfault inception
wave propagation
fault detection
→ measurement→ signal processing→ threshold analysis
fault separation
→ fault current limitation→ isolation of faulted
system parts
systemrecovery
new stableoperating point
→ UGC fault:disconnect permanently
→ OHL fault: attempt re-start
fault localisation
4 Introduction
required [Arr07, Jov15, Zho18]. In recent years, however, an increasing number of VSC systems have been commissioned at continuously higher ratings due to their more flexible operation regarding active and reactive power flow and AC system support capabilities [Ere16, Sha16]. MMCs represent the latest development stage of the VSC technology. Since their introduction in the Trans Bay Cable project, almost all VSC-HVDC systems commissioned and planned are based on this converter type due to its modular setup and scalability, low switching losses and the absence of extensive filter equipment [Dor12, Mar10, Sha16].
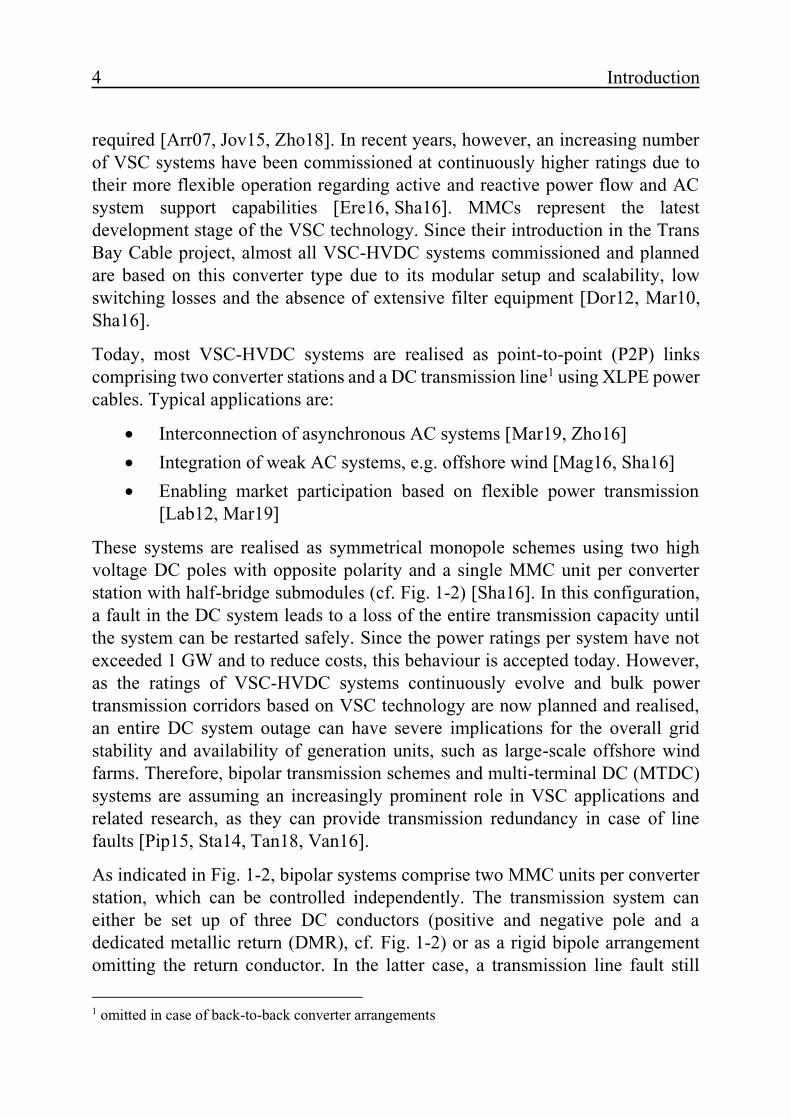
Today, most VSC-HVDC systems are realised as point-to-point (P2P) links comprising two converter stations and a DC transmission line1 using XLPE power cables. Typical applications are:
Interconnection of asynchronous AC systems [Mar19, Zho16]
Integration of weak AC systems, e.g. offshore wind [Mag16, Sha16]
Enabling market participation based on flexible power transmission [Lab12, Mar19]
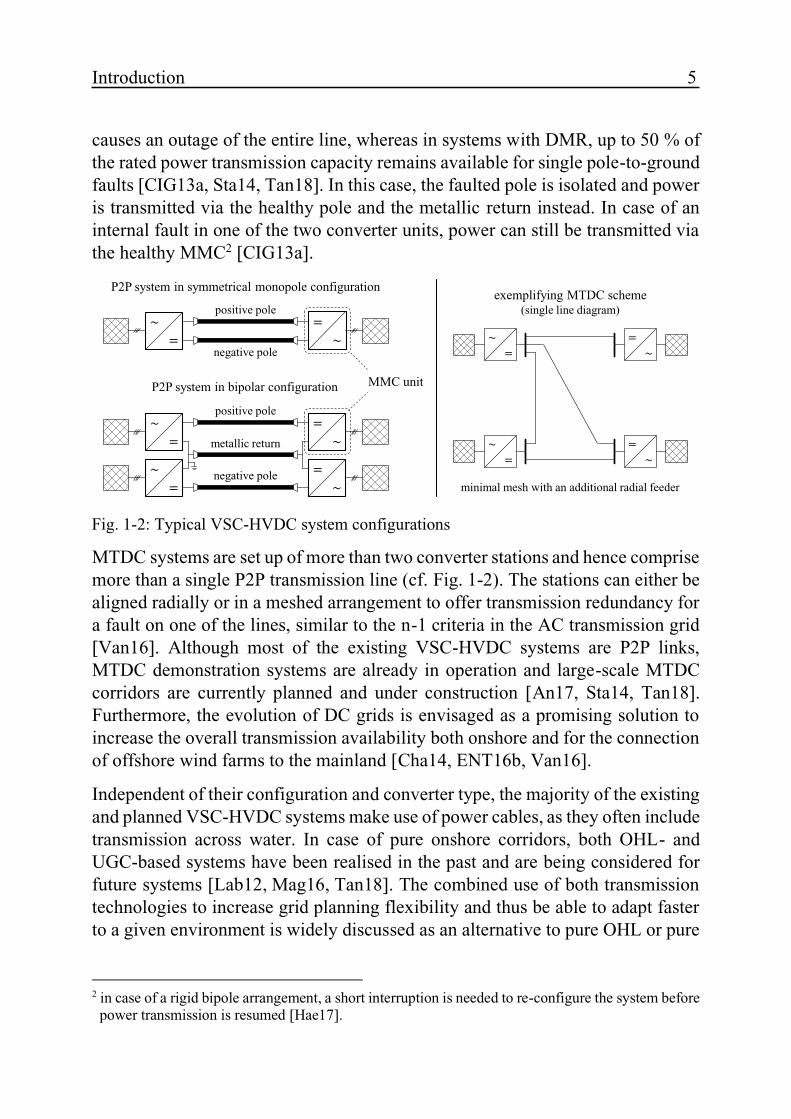
These systems are realised as symmetrical monopole schemes using two high voltage DC poles with opposite polarity and a single MMC unit per converter station with half-bridge submodules (cf. Fig. 1-2) [Sha16]. In this configuration, a fault in the DC system leads to a loss of the entire transmission capacity until the system can be restarted safely. Since the power ratings per system have not exceeded 1 GW and to reduce costs, this behaviour is accepted today. However, as the ratings of VSC-HVDC systems continuously evolve and bulk power transmission corridors based on VSC technology are now planned and realised, an entire DC system outage can have severe implications for the overall grid stability and availability of generation units, such as large-scale offshore wind farms. Therefore, bipolar transmission schemes and multi-terminal DC (MTDC) systems are assuming an increasingly prominent role in VSC applications and related research, as they can provide transmission redundancy in case of line faults [Pip15, Sta14, Tan18, Van16].
As indicated in Fig. 1-2, bipolar systems comprise two MMC units per converter station, which can be controlled independently. The transmission system can either be set up of three DC conductors (positive and negative pole and a dedicated metallic return (DMR), cf. Fig. 1-2) or as a rigid bipole arrangement omitting the return conductor. In the latter case, a transmission line fault still
1 omitted in case of back-to-back converter arrangements
Introduction 5
causes an outage of the entire line, whereas in systems with DMR, up to 50 % of the rated power transmission capacity remains available for single pole-to-ground faults [CIG13a, Sta14, Tan18]. In this case, the faulted pole is isolated and power is transmitted via the healthy pole and the metallic return instead. In case of an internal fault in one of the two converter units, power can still be transmitted via the healthy MMC2 [CIG13a].
MTDC systems are set up of more than two converter stations and hence comprise more than a single P2P transmission line (cf. Fig. 1-2). The stations can either be aligned radially or in a meshed arrangement to offer transmission redundancy for a fault on one of the lines, similar to the n-1 criteria in the AC transmission grid [Van16]. Although most of the existing VSC-HVDC systems are P2P links, MTDC demonstration systems are already in operation and large-scale MTDC corridors are currently planned and under construction [An17, Sta14, Tan18]. Furthermore, the evolution of DC grids is envisaged as a promising solution to increase the overall transmission availability both onshore and for the connection of offshore wind farms to the mainland [Cha14, ENT16b, Van16].
Independent of their configuration and converter type, the majority of the existing and planned VSC-HVDC systems make use of power cables, as they often include transmission across water. In case of pure onshore corridors, both OHL- and UGC-based systems have been realised in the past and are being considered for future systems [Lab12, Mag16, Tan18]. The combined use of both transmission technologies to increase grid planning flexibility and thus be able to adapt faster to a given environment is widely discussed as an alternative to pure OHL or pure
2 in case of a rigid bipole arrangement, a short interruption is needed to re-configure the system before power transmission is resumed [Hae17].
Fig. 1-2: Typical VSC-HVDC system configurations
P2P system in symmetrical monopole configuration
positive pole
negative pole
positive pole
negative pole
metallic return
P2P system in bipolar configuration MMC unit
exemplifying MTDC scheme (single line diagram)
minimal mesh with an additional radial feeder
6 Introduction
UGC transmission [Amp17, Ten13]. So far, however, only limited operational experience has been made in this regard.
1.2.2 Protection of VSC-HVDC systems
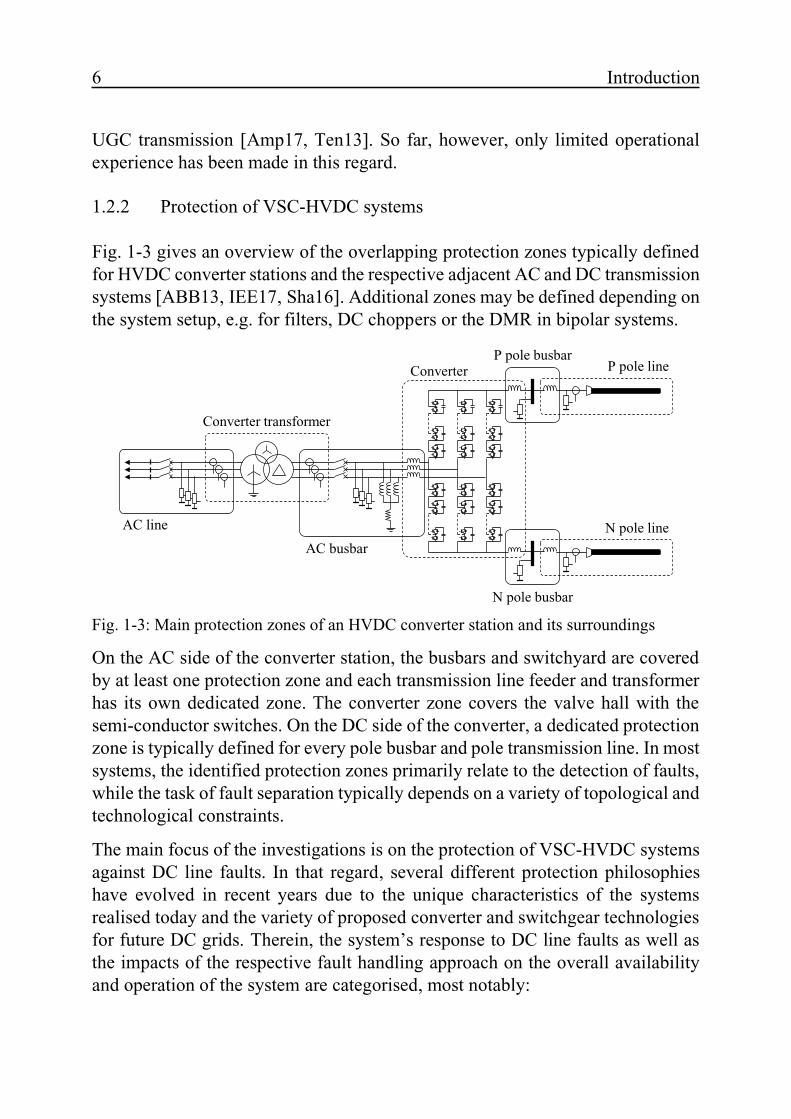
Fig. 1-3 gives an overview of the overlapping protection zones typically defined for HVDC converter stations and the respective adjacent AC and DC transmission systems [ABB13, IEE17, Sha16]. Additional zones may be defined depending on the system setup, e.g. for filters, DC choppers or the DMR in bipolar systems.
On the AC side of the converter station, the busbars and switchyard are covered by at least one protection zone and each transmission line feeder and transformer has its own dedicated zone. The converter zone covers the valve hall with the semi-conductor switches. On the DC side of the converter, a dedicated protection zone is typically defined for every pole busbar and pole transmission line. In most systems, the identified protection zones primarily relate to the detection of faults, while the task of fault separation typically depends on a variety of topological and technological constraints.
The main focus of the investigations is on the protection of VSC-HVDC systems against DC line faults. In that regard, several different protection philosophies have evolved in recent years due to the unique characteristics of the systems realised today and the variety of proposed converter and switchgear technologies for future DC grids. Therein, the system’s response to DC line faults as well as the impacts of the respective fault handling approach on the overall availability and operation of the system are categorised, most notably:
Fig. 1-3: Main protection zones of an HVDC converter station and its surroundings
P pole busbarP pole line
N pole line
N pole busbar
Converter
Converter transformer
AC line
AC busbar
Introduction 7
Focusing on the separation of faulted parts identifying non-selective, partially selective and fully selective concepts [CIG18]
Focusing on the system behaviour on the AC side of the converter station identifying concepts with continued operation, concepts with temporary stop of active/reactive power flow and concepts with permanent stop of active/reactive power flow [CEN18]
All of the above philosophies and concepts comprise at least three main tasks of the DC line protection, which are described in the following, i.e. the detection, separation and localisation of line faults.
Detection of line faults
As for any other primary line fault detection concept, faults in VSC-HVDC systems have to be detected reliably and selectively3, i.e. the detection equipment assigned to a specified zone has to identify any type of fault occurring within this zone and must not react to external faults [CEN18, CIG18]. Note that the selectivity of fault detection methods is a requirement independent of the overall protection philosophy – faults may still be separated non-selectively. Typically, DC line faults have to be detected within a few milliseconds after fault occurrence due to the fast-rising fault currents and the limited overload capability of power electronic devices in the converter stations and DC switchgear [Cha14, CIG18, Sha16]. Moreover, in MTDC systems, the propagation of fault effects in the system has to be limited emphasising the need for fast fault detection. In most cases, a detection decision has to be made based on the first travelling wave impact at the measurement equipment [Bra19, Let16, Tün19a]. Thus, finding a balance between detection sensitivity and detection robustness towards external faults is one of the key challenges.
In point-to-point VSC-HVDC systems, DC overcurrent and current differential relays as well as DC over- and undervoltage relays are typically used for line fault detection; voltage unbalance functions may be added for symmetrical monopole systems [CIG18]. In most applications, these methods allow reliable fault detection, but are limited in terms of selectivity [CIG18, Nai04, Psa18]. Future MTDC systems therefore require additional methods to be able to identify line faults even faster. Most primary detection concepts proposed for such applications are based on the analysis of rapid pole voltage and current changes caused by the impact of travelling waves. For this purpose, wave fronts are
3 cf. IEC 60050 – International Electrotechnical Vocabulary, references 448-11-06 and 448-12-05
8 Introduction
identified in a sequence of measurement samples or based on the rate of change of voltage (ROCOV) or current (ROCOC) in a defined time frame [CIG18, Nai04, Let16, Psa18, Sne16]. In a different approach, detection relays using more sophisticated travelling wave analysis methods such as short-time Fourier transformation or wavelet analysis have been developed to detect and localise line faults based on the time-dependent frequency content of travelling waves [DeK11, Psa18]. Their high requirements on the measurement accuracy and sampling frequencies as well as their susceptibility to noise impact the methods’ reliability and so far limit their applicability for primary line fault detection [Cha14, CIG18].
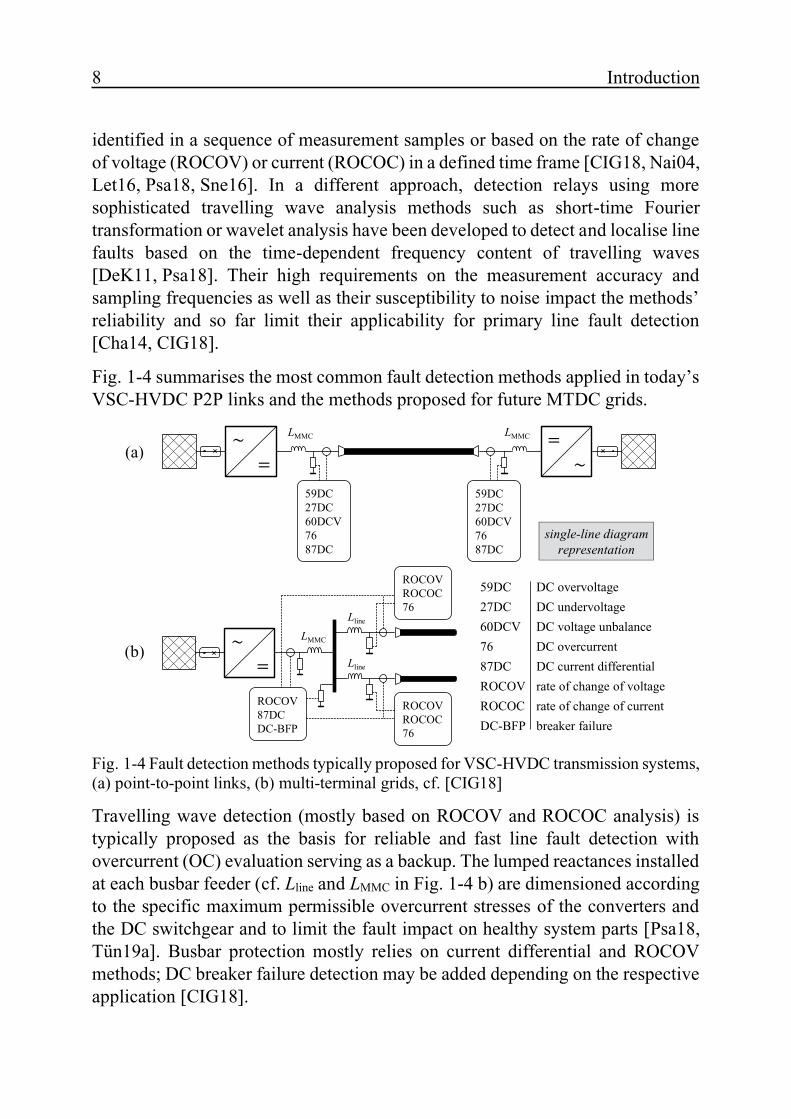
Fig. 1-4 summarises the most common fault detection methods applied in today’s VSC-HVDC P2P links and the methods proposed for future MTDC grids.
(a)
(b)
Fig. 1-4 Fault detection methods typically proposed for VSC-HVDC transmission systems, (a) point-to-point links, (b) multi-terminal grids, cf. [CIG18]
Travelling wave detection (mostly based on ROCOV and ROCOC analysis) is typically proposed as the basis for reliable and fast line fault detection with overcurrent (OC) evaluation serving as a backup. The lumped reactances installed at each busbar feeder (cf. Lline and LMMC in Fig. 1-4 b) are dimensioned according to the specific maximum permissible overcurrent stresses of the converters and the DC switchgear and to limit the fault impact on healthy system parts [Psa18, Tün19a]. Busbar protection mostly relies on current differential and ROCOV methods; DC breaker failure detection may be added depending on the respective application [CIG18].
LMMC LMMC
59DC27DC60DCV7687DC
59DC27DC60DCV7687DC
single-line diagramrepresentation
LMMC
Lline
Lline
ROCOVROCOC76
ROCOV87DCDC-BFP
ROCOVROCOC76
DC overvoltage
DC undervoltage
DC voltage unbalance
DC overcurrent
DC current differential
rate of change of voltage
rate of change of current
breaker failure
59DC
27DC
60DCV
76
87DC
ROCOV
ROCOC
DC-BFP
Introduction 9
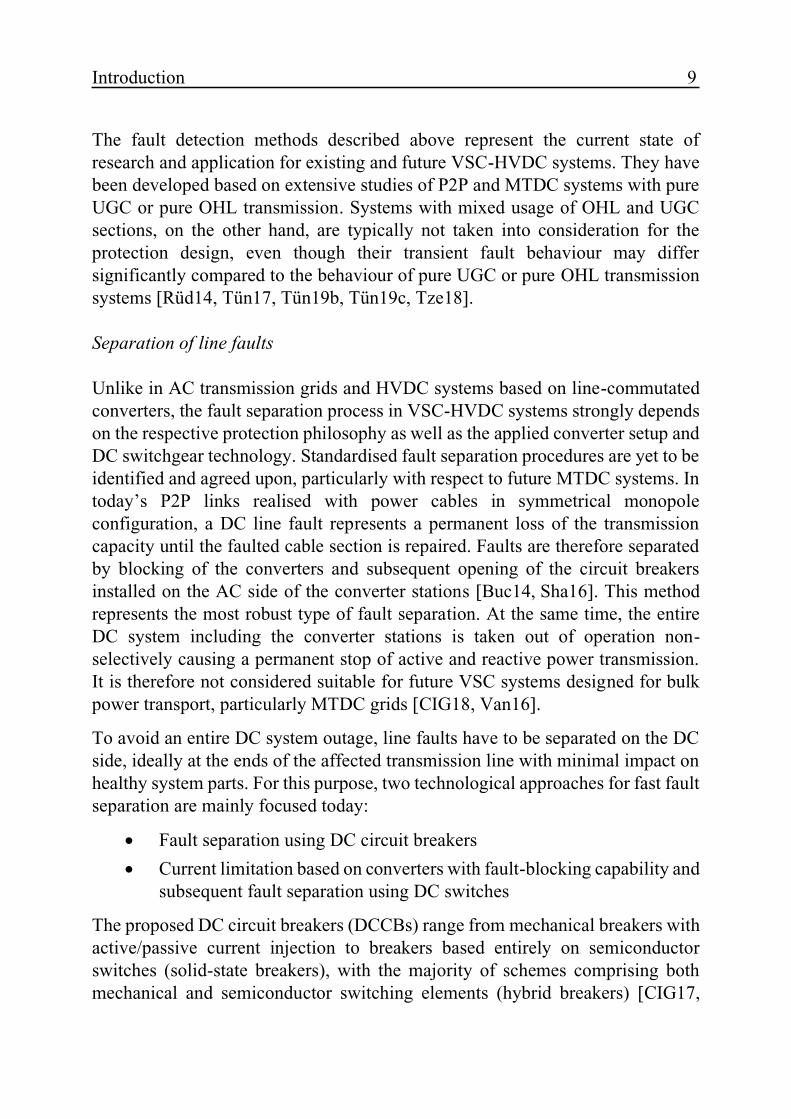
The fault detection methods described above represent the current state of research and application for existing and future VSC-HVDC systems. They have been developed based on extensive studies of P2P and MTDC systems with pure UGC or pure OHL transmission. Systems with mixed usage of OHL and UGC sections, on the other hand, are typically not taken into consideration for the protection design, even though their transient fault behaviour may differ significantly compared to the behaviour of pure UGC or pure OHL transmission systems [Rüd14, Tün17, Tün19b, Tün19c, Tze18].
Separation of line faults
Unlike in AC transmission grids and HVDC systems based on line-commutated converters, the fault separation process in VSC-HVDC systems strongly depends on the respective protection philosophy as well as the applied converter setup and DC switchgear technology. Standardised fault separation procedures are yet to be identified and agreed upon, particularly with respect to future MTDC systems. In today’s P2P links realised with power cables in symmetrical monopole configuration, a DC line fault represents a permanent loss of the transmission capacity until the faulted cable section is repaired. Faults are therefore separated by blocking of the converters and subsequent opening of the circuit breakers installed on the AC side of the converter stations [Buc14, Sha16]. This method represents the most robust type of fault separation. At the same time, the entire DC system including the converter stations is taken out of operation non-selectively causing a permanent stop of active and reactive power transmission. It is therefore not considered suitable for future VSC systems designed for bulk power transport, particularly MTDC grids [CIG18, Van16].
To avoid an entire DC system outage, line faults have to be separated on the DC side, ideally at the ends of the affected transmission line with minimal impact on healthy system parts. For this purpose, two technological approaches for fast fault separation are mainly focused today:
Fault separation using DC circuit breakers
Current limitation based on converters with fault-blocking capability and subsequent fault separation using DC switches
The proposed DC circuit breakers (DCCBs) range from mechanical breakers with active/passive current injection to breakers based entirely on semiconductor switches (solid-state breakers), with the majority of schemes comprising both mechanical and semiconductor switching elements (hybrid breakers) [CIG17,
10 Introduction
Fra11, Jov15]. Hybrid DCCBs intend to combine the advantages of low on-state losses during normal operation with fast current interruption capability in the order of a few milliseconds [Häf11, Tan18]. They are therefore often envisaged as a key technology for the realisation of meshed DC grids. Depending on the system setup, component ratings etc., fault separation with temporary stop or continuous system operation may be conceivable with this technology [Tün19a].
An alternative to fault separation concepts based on DCCBs is the use of fault-blocking converters, e.g. MMCs based on full-bridge submodules (FB-MMC). This type of converter is capable of inserting submodule capacitors with negative polarity by switching of additional IGBT-diode pairs to limit rising fault currents and thus drive the DC pole current to a designated stationary value [Kar15, Sha16]. Afterwards, faulted transmission lines are separated using fast-acting DC switches with comparatively small current breaking capability, often referred to as high-speed switches, before normal system operation is restored [Ruf18b]. A temporary stop of active power transmission is required for this concept.
Localisation of line faults
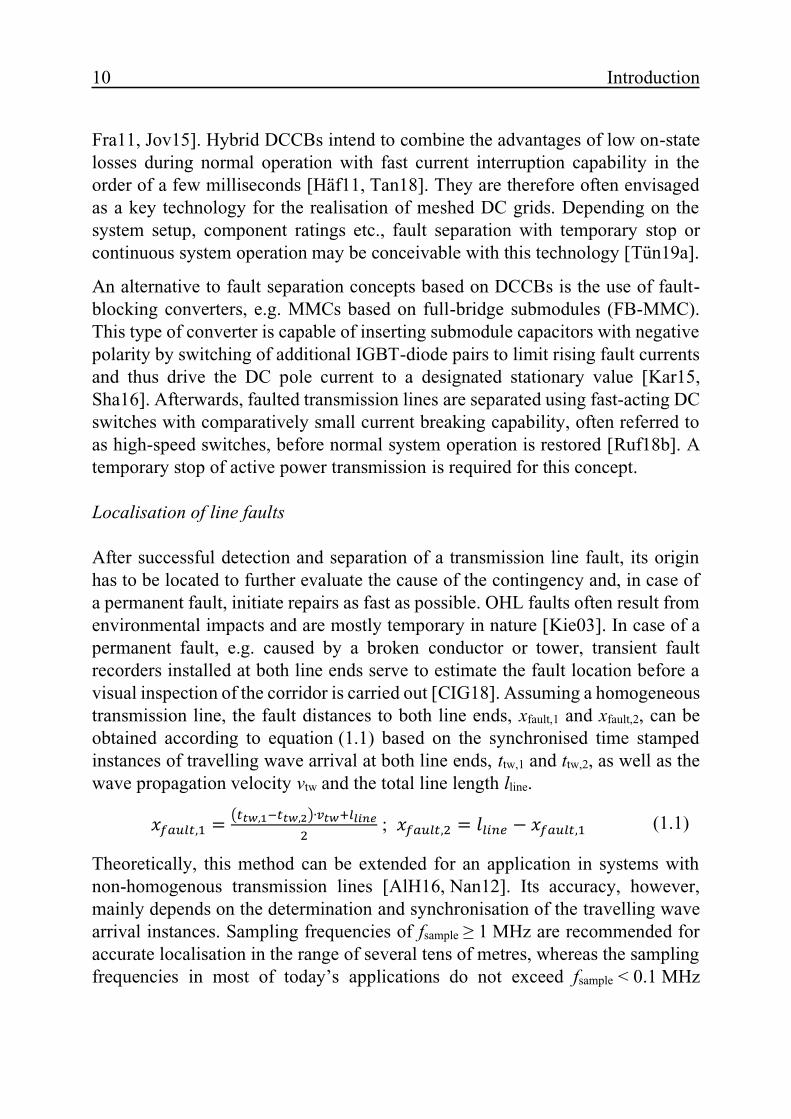
After successful detection and separation of a transmission line fault, its origin has to be located to further evaluate the cause of the contingency and, in case of a permanent fault, initiate repairs as fast as possible. OHL faults often result from environmental impacts and are mostly temporary in nature [Kie03]. In case of a permanent fault, e.g. caused by a broken conductor or tower, transient fault recorders installed at both line ends serve to estimate the fault location before a visual inspection of the corridor is carried out [CIG18]. Assuming a homogeneous transmission line, the fault distances to both line ends, xfault,1 and xfault,2, can be obtained according to equation (1.1) based on the synchronised time stamped instances of travelling wave arrival at both line ends, ttw,1 and ttw,2, as well as the wave propagation velocity vtw and the total line length lline.
; (1.1)
Theoretically, this method can be extended for an application in systems with non-homogenous transmission lines [AlH16, Nan12]. Its accuracy, however, mainly depends on the determination and synchronisation of the travelling wave arrival instances. Sampling frequencies of fsample ≥ 1 MHz are recommended for accurate localisation in the range of several tens of metres, whereas the sampling frequencies in most of today’s applications do not exceed fsample < 0.1 MHz

Introduction 11
[CIG18, IEC16, Tze18]. Evaluating transient recordings for fault localisation is therefore mostly limited to narrow down the fault location area.
UGC faults are typically caused by a breakdown of the cable insulation and are therefore considered permanent [Baw16, PRO16]. Due to the immense time and monetary efforts of retrieving buried cable sections, particularly in case of undersea cables, accurate fault localisation is of utmost importance to minimise outage times and repair costs [CIG09, Kwo17]. Moreover, visual inspections, as performed for OHL transmission corridors, are typically not feasible for UGC systems. Therefore, in most applications, faults are pre-located first using a variety of post-mortem test methods before additional high-precision techniques are applied to pinpoint the fault location as accurately as possible. This includes the evaluation of transient fault recorders, time-domain reflectometry, bridge measurements etc. followed by, amongst others, acoustic location and magnetic field measurements [Baw16, CIG18, Kwo17]. The entire fault localisation and maintenance process may thus take several days up to several months, particularly in case of undersea cable faults [Kwo17].
In systems with mixed usage of UGCs and OHLs, additional requirements for fault localisation apply, as UGC and OHL faults have to be discriminated immediately after fault detection. Faults on an OHL section are often caused by atmospheric impacts and are therefore temporary in nature. Limiting the DC current will often extinguish the fault arc and the transmissions system can be re-started quickly due to the self-healing nature of air [Küc18, Stu18]. On the other hand, automatic re-start attempts are not desired after UGC faults due to their permanent nature. The established localisation techniques are designed to pinpoint the location of permanent line faults in a certain amount of time after fault separation, but typically cannot provide information of the faulted section immediately after fault appearance. Only a handful of methods have been proposed for this purpose, either based on the comparison of travelling wave arrival times using wavelet analysis or based on the use of distributed current measurements for differential comparisons [AlH16, Nan12, Tze18].
1.2.3 Mixed usage of cables and overhead lines
Extra high voltage (EHV) AC and DC transmission lines are traditionally set up of a single transmission type, i.e. OHL or UGC, unless dictated otherwise by the environmental conditions of the corridor or the socio-political situation. In AC systems, OHLs are the standard choice due to their various operational benefits and lower capital expenditure compared to the installation of UGCs
12 Introduction
[Amp17, Nat15]. Moreover, using only a single line type is preferable to avoid resonance phenomena at grid frequency and its harmonics, which can be caused by mixed capacitive and inductive circuits resulting from UGC and OHL arrangements [Rah08]. The phenomena have to be accounted for during steady-state and dynamic operation for every switching state of the mixed transmission line and nearby circuits including electromagnetic couplings to parallel lines. Ensuring reliable operation therefore becomes increasingly complex for mixed UGC-OHL arrangements in the AC transmission grid. Nonetheless, the increasing public objection to the construction of new OHL towers has led to several mixed transmission pilot projects, which have been commissioned and put in operation in recent years to increase flexibilities in AC power system planning and realisation [Amp17, Eli17, Swi18].
Due to the absence of a grid frequency and the related harmonics, resonance phenomena only play a minor role in DC transmission systems. More importantly, mixed transmission arrangements are challenging for the DC line protection due to travelling wave reflection and transmission effects at every UGC-OHL transition distorting the initial wave shape [Tün19b]. Fast and selective fault detection methods evaluating transient voltage and current changes may thus be affected in their functionality. In addition, undesired transient stresses may be caused in certain fault scenarios including opposite polarity voltages applied to the polarised insulation of XLPE cables [Maz13, Tün19c].
Until today, only a handful of HVDC systems with mixed usage of UGC and OHL transmission exist [Ara19, Lun17, Rao15, Shi02]. These systems only apply rudimentary protection concepts disconnecting the entire DC circuit in case of a line fault. Topology-specific fault detection methods and concepts allowing fast discrimination of UGC and OHL faults to increase the overall availability of such systems are yet to be developed.
1.2.4 Starting point for the investigations
VSC-HVDC transmission systems have evolved as a cornerstone of worldwide grid development plans for the large-scale integration of renewable generation assuming an increasing role in bulk power transport and AC grid support. Outages of these systems can have severe impacts on the overall grid stability and supply reliability. Hence, reliable, fast and selective protection concepts are required. Disconnecting an entire DC circuit in case of a single line fault is no longer acceptable in future applications, particularly in MTDC grids with several gigawatts of power transmission capability. For this purpose, a variety of fault

Introduction 13
detection, separation and localisation methods have been introduced in recent years and are continuously developed further.
While most of today’s VSC-HVDC systems rely on either UGC or OHL transmission, the mixed usage of both line types has become increasingly relevant to allow faster project realisation, particularly in densely populated areas where public objection to new corridors is becoming an important determining factor. In these areas, the use of transmission lines comprising several UGC and OHL sections may become a standard solution. So far, however, only very limited operational experience is available. Moreover, protection concepts proposed for future DC systems have been developed under the assumption of pure UGC or pure OHL transmission. Their applicability to mixed UGC-OHL systems has yet to be investigated comprehensively. Hence, the following fundamental research needs are identified:
Characterisation of the transient system behaviour:
The effects of mixed UGC-OHL transmission on transient voltages and currents during line faults need to be analysed taking into account relevant parameter impacts. Potentially hazardous component stresses and challenges for the protection have to be identified.
Evaluation and enhancement of fault detection methods:
The detection algorithms proposed for future VSC-HVDC systems have to be re-evaluated for systems with mixed transmission lines. Their feasibility and limitations have to be assessed and, if required, suitable enhancements have to be developed.
Analysis of fault separation concepts:
Hybrid DCCBs and FB-MMCs are identified as the most promising concepts for fast fault separation in future DC systems. Both methods need to be accounted for when investigating mixed topologies.
Assessment of fast fault localisation techniques:
OHL and UGC faults have to be discriminated reliably and within short time after fault occurrence. The localisation algorithms proposed for this purpose have to be evaluated taking into account different topological constraints and, if needed, have to be enhanced to allow fast restoration of the power flow for temporary OHL faults.
14 Introduction
1.3 Objectives and investigation approach
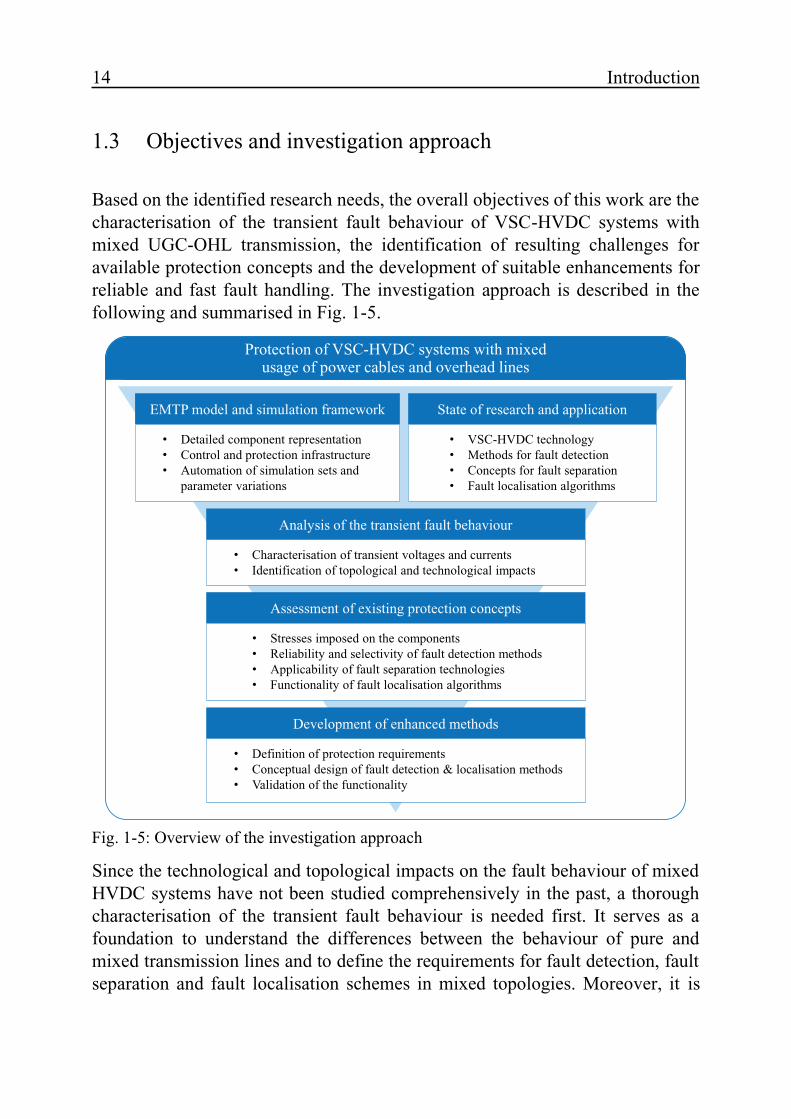
Based on the identified research needs, the overall objectives of this work are the characterisation of the transient fault behaviour of VSC-HVDC systems with mixed UGC-OHL transmission, the identification of resulting challenges for available protection concepts and the development of suitable enhancements for reliable and fast fault handling. The investigation approach is described in the following and summarised in Fig. 1-5.
Since the technological and topological impacts on the fault behaviour of mixed HVDC systems have not been studied comprehensively in the past, a thorough characterisation of the transient fault behaviour is needed first. It serves as a foundation to understand the differences between the behaviour of pure and mixed transmission lines and to define the requirements for fault detection, fault separation and fault localisation schemes in mixed topologies. Moreover, it is
Fig. 1-5: Overview of the investigation approach
Protection of VSC-HVDC systems with mixed usage of power cables and overhead lines
EMTP model and simulation framework
• Detailed component representation• Control and protection infrastructure• Automation of simulation sets and
parameter variations
State of research and application
• VSC-HVDC technology• Methods for fault detection• Concepts for fault separation• Fault localisation algorithms
Analysis of the transient fault behaviour
• Characterisation of transient voltages and currents• Identification of topological and technological impacts
Development of enhanced methods
• Definition of protection requirements• Conceptual design of fault detection & localisation methods• Validation of the functionality
Assessment of existing protection concepts
• Stresses imposed on the components• Reliability and selectivity of fault detection methods• Applicability of fault separation technologies• Functionality of fault localisation algorithms

Introduction 15
used to identify potentially hazardous stresses imposed on the components, specifically the XLPE cable insulation.
In a second step, the applicability of the protection concepts developed for pure UGC and pure OHL systems is evaluated in mixed arrangements. Algorithms for selective fault detection and methods to discriminate UGC and OHL faults within a few milliseconds after fault appearance are particularly focussed. The objective is to point out challenges and functional limitations of the existing methods with respect to the defined protection requirements. Based on these results, enhanced fault detection and localisation concepts are developed. Due to the variety of conceivable UCG-OHL arrangements in future VSC-HVDC systems, the aim is to design methods, which can be adapted flexibly to any given circumstances. In a final step, the developed protection system is validated for two exemplary test cases: a bipolar P2P link with full-bridge MMCs and a symmetrical monopole MTDC system with DCCBs for fault separation.
The investigations are based on electromagnetic transient (EMT) simulations, which are carried out in PSCADTM/EMTDCTM. This requires detailed models of the electrical components as well as an accurate representation of measurements and signal processing units for protection purposes. Moreover, a variety of different topologies, UGC-OHL arrangements, technological setups and fault scenarios have to be accounted for. Hence, a simulation framework is created in the EMT program (EMTP) to be able to analyse and compare the fault behaviour of different VSC-HVDC schemes comprehensively and to test the application of protection methods. Prospective voltages and currents are considered first to describe the transient fault behaviour, evaluate the applicability of existing concepts and develop suitable enhancements for fault detection and localisation algorithms. The enhanced methods are then tested and verified in exemplary cases taking into account the entire fault handling process.

16 Introduction
Physical and technological basics 17
2 Physical and technological basics
Due to the different transmission characteristics of power cables and overhead lines, interfaces between the two transmission technologies can have a significant impact on propagating current and voltage travelling waves. The resulting transients can affect the functionality of protection methods and lead to increased stresses on the system’s components. To evaluate the transient behaviour during line faults, the fundamentals of travelling wave propagation on transmission lines are laid out and an overview of the resulting electrical field stresses in XLPE cables caused by space charge accumulation is given.
2.1 Propagation of travelling waves on transmission lines
The dynamic behaviour of transmission systems can be described by quasi-stationary field approximations of Maxwell’s Equations, if the displacement current in conductors is negligible compared to the conduction current and if the vortex field induced in the surrounding insulation is negligible compared to the electrostatic field [Küc18]. In this case, field changes are assumed to appear nearly synchronously along the transmission lines under consideration. This condition is fulfilled, if the propagation time of an electro-magnetic travelling wave τ is significantly smaller than the equivalent time of sinusoidal field change, i.e. a quarter of the respective period T. Equation (2.1) describes the condition based on the propagation distance x, wavelength λ and wave propagation speed u. For accurate calculation, quasi-stationary fields should only be assumed for x < λ/60 [Küc18].
(2.1)
For rapidly changing electro-magnetic fields, e.g. switching actions, atmospheric discharges, short-circuits etc., field synchrony along the transmission line is no longer given and Maxwell’s Equations have to be considered without quasi-stationary approximations. In this case, electro-magnetic travelling wave propagation theory is used to describe the transient balancing processes on transmission lines [Bew63, Rüd14].
Based on an infinitesimal small transmission line section with quasi-static field conditions, the telegrapher’s equations are obtained describing the differential
18 Physical and technological basics
voltages and currents at the section terminals. Based on these equations, the d’Alembert solution yields voltage and current equations (2.2) and (2.3) with time and space dependencies, in which the two summands f and g can be interpreted as a forward and a backward travelling wave, respectively. Z is the characteristic line impedance [Küc18, Van01].
(2.2)
(2.3)
The propagation velocity u of the two travelling waves depends on the dielectric properties of the surrounding insulation. It can be calculated according to equation (2.4) based on the material’s permittivity ε and permeability µ [Küc18].
(2.4)
2.1.1 Travelling wave distortion
On a homogeneous transmission line, forward and backward travelling waves propagate from their origin (e.g. a line fault) across the line without distortion until reaching a line inhomogeneity, i.e. a change in characteristic impedance Z. Before that, their characteristics are only altered by transmission losses caused by the line’s resistivity R’ and insulation conductivity G’. Equations (2.5) and (2.6) describe the attenuated voltage and current wave amplitudes ∆vx and ∆ix at the distance x resulting from the initial waves ∆v0 and ∆i0 [Rüd14, Van01].
(2.5)
(2.6)
In contrast to that, the shape of voltage and current waves is abruptly distorted whenever the characteristic impedance Z of the transmission line changes. As indicated in equation (2.7), this is the case, if at least one of the line parameters (resistivity R’, inductance L’, conductivity G’ and capacitance C’) changes, typically due to a change in line geometry, short- or open circuit, or the transition to another insulation material [Kin15].
(2.7)
At the interface of two transmission segments with different characteristic impedances Z1 (initial line) and Z2 (subsequent line), voltage and current waves
Physical and technological basics 19
are partly reflected resulting in superimposed forward and backward travelling waves on the initial line. At the same time, parts of the waves are transmitted onto the subsequent line, where they continue propagating in forward direction. This behaviour is described by equations (2.8)-(2.11), in which the reflection coefficient Γ and the transmission coefficient ρ express the respective ratios between the incoming and the reflected/transmitted wave amplitudes (indices v for voltage waves and i for current waves) [Rüd14].
Γ = Z2 Z1
Z Z2 (2.8)
Γ = Z1 Z2
Z Z2Γ (2.9)
(2.10)
(2.11)
Lumped reactances and capacitors installed at an interface of two transmission segments cause further distortion of travelling waves due to the respective current and voltage boundary conditions. As described by equations (2.12) and (2.13), the voltages behind lumped inductances v2L(t) or capacitors v2C(t) change according to the transmitted part of the incoming wave (ρv∙∆v1L and ρv∙∆v1C) and based on an exponential characteristic depending on the surge impedances and the respective inductance L or capacitance C in the immediate time after travelling wave arrival [Rüd14].
(2.12)
(2.13)
At the moment of wave impact (t = 0), incoming waves are reflected onto the initial line with positive reflection coefficient Γv > 0 in case of a reactance (open circuit characteristic) and negative reflection coefficient Γv < 0 in case of a capacitor (short-circuit characteristic) resulting in superimposed forward and backward travelling waves. On the subsequent line, i.e. behind the lumped reactance or capacitance, distorted waves with flattened wave fronts proceed in forward direction.
Converter stations have an open circuit characteristic with respect to travelling waves distortion due to the reactances installed at the terminals, within the converter arms and on the AC side of the station (cf. Fig. 1-3). Incoming voltage waves are therefore initially reflected with Γv ≈ 1. On the other hand, short-
20 Physical and technological basics
circuits on a transmission line have a characteristic impedance near zero resulting in a reflection coefficient of Γv ≈ -1.
2.1.2 Transmission line characteristics
The travelling wave propagation characteristics in power cables and overhead lines differ significantly due to, amongst others, their geometry and insulation materials. In EHV transmission systems, waves on OHLs propagate with velocities close to the speed of light, whereas the propagation speed is reduced in UGC systems depending on the relative permittivity of the insulation material. For XLPE cables, velocities in the range of uUGC = 0.6…0.7∙uOHL can typically be found resulting from a relative permittivity around εr ≈ 2.3 compared to εr = 1 for OHLs (cf. equation (2.4)) [Küc18]. While OHLs have dominant inductive characteristics, the behaviour of UGCs is dictated by their capacitive nature. Accordingly, OHLs typically have higher characteristic impedances of several hundred ohms compared to several ten ohms for comparable UGCs with polymeric insulation [Kie03, Kin15, Küc18]. As indicated by equations (2.5) and (2.6), this has a major impact on the damping of travelling waves. Even though waves propagating on OHLs are damped by corona discharges, which are not present in cable systems, the effect is outweighed by dielectric dispersion of the XLPE insulation. As a result, propagating wave fronts are typically damped faster on UGCs compared to OHLs [Rüd14].
2.1.3 Analysis of propagation phenomena
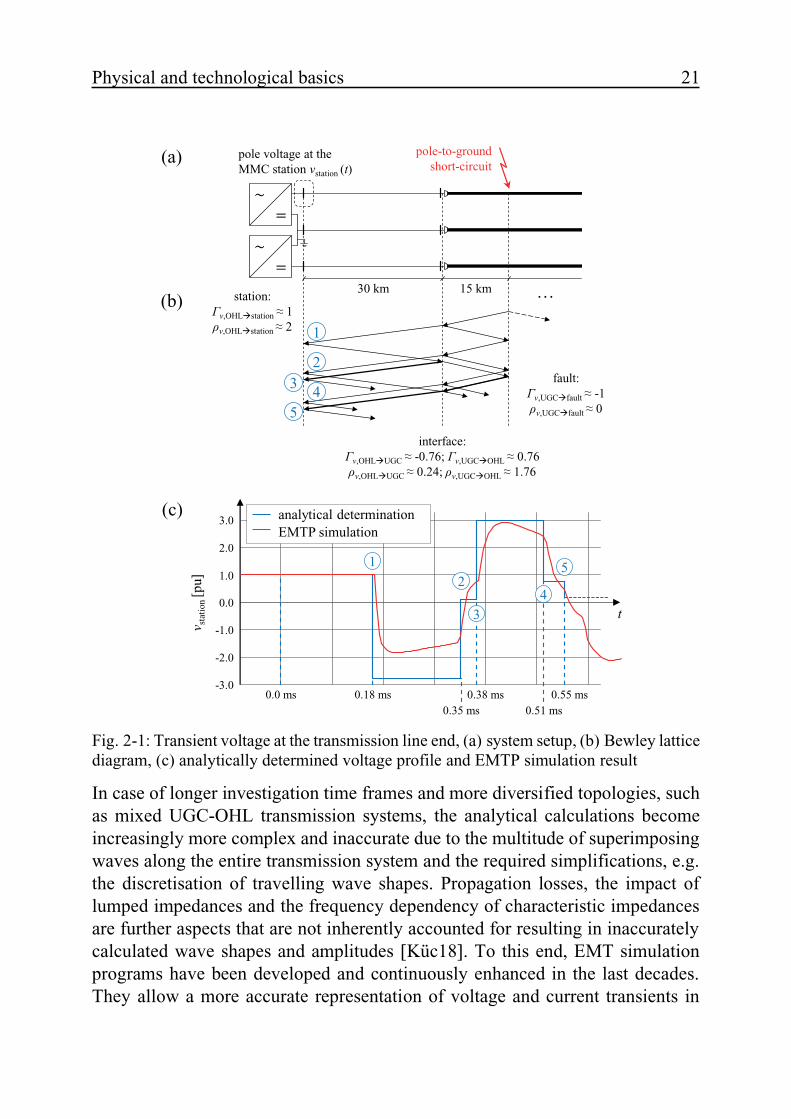
The propagation of travelling waves and the resulting transients within a transmission system can be visualised with the help of analytical approximation methods, such as Bewley’s lattice diagram or the Bergeron representation [Bew63, Tex96]. Based on travelling wave propagation theory, these methods provide a graphical representation of the position, amplitude and shape of every forward and backward travelling wave at every instant of time in the investigated time frame. Thus, an estimation of the initially expected transient impacts is provided for a specific topology and a given scenario. As an example, Fig. 2-1 illustrates the determination of a transient voltage profile during several hundred microseconds for a pole-to-ground short-circuit. The voltage reflection and transmission coefficients at the UGC-OHL interface are calculated based on an exemplifying characteristic impedance ratio of ZOHL/ZUGC = 7.5. At the boundaries of the investigated line section, i.e. the converter station and the fault location, idealised wave reflection is assumed with Γv,station ≈ 1 and Γv,fault ≈ -1.
Physical and technological basics 21
(a)
i
(b)
(c)
Fig. 2-1: Transient voltage at the transmission line end, (a) system setup, (b) Bewley lattice diagram, (c) analytically determined voltage profile and EMTP simulation result
In case of longer investigation time frames and more diversified topologies, such as mixed UGC-OHL transmission systems, the analytical calculations become increasingly more complex and inaccurate due to the multitude of superimposing waves along the entire transmission system and the required simplifications, e.g. the discretisation of travelling wave shapes. Propagation losses, the impact of lumped impedances and the frequency dependency of characteristic impedances are further aspects that are not inherently accounted for resulting in inaccurately calculated wave shapes and amplitudes [Küc18]. To this end, EMT simulation programs have been developed and continuously enhanced in the last decades. They allow a more accurate representation of voltage and current transients in
30 km …15 km
1
23
45
pole voltage at the MMC station vstation (t)
pole-to-ground short-circuit
station:Γv,OHL station ≈ 1ρv,OHL station ≈ 2
interface:Γv,OHL UGC ≈ -0.76; Γv,UGC OHL ≈ 0.76ρv,OHL UGC ≈ 0.24; ρv,UGC OHL ≈ 1.76
fault:Γv,UGC fault ≈ -1ρv,UGC fault ≈ 0
0.0
1.0
v sta
tion
[pu]
t-1.0
-2.0
2.0
3.0
-3.00.0 ms 0.18 ms
1
0.35 ms
2
0.38 ms
3
0.51 ms
4
0.55 ms
5
analytical determinationEMTP simulation
22 Physical and technological basics
multi-phase systems by using frequency-dependent transmission line models with distributed parameters based on the telegrapher’s equations [DeS07, Dom69, Man05, Mor99]. Fig. 2-1 c also illustrates the transient voltage profile obtained in an EMTP simulation4 for the exemplifying fault scenario in Fig. 2-1 a. In comparison to the analytical approach, the instances of travelling wave arrival and the overall wave characteristics are similar. However, noticeable differences with regard to the accuracy of wave rise times and maximum/minimum amplitudes are apparent, even within the short time frame of just a few hundred microseconds. Due to the limitations of graphical analysis methods, comprehensive transient system analyses based on EMTP are nowadays established as a cornerstone of HVDC project design and development phases [CIG13b, Sha16, Van01].
2.2 Electrical field stress in polarised XLPE insulations
The electrical field distribution across the insulation of XLPE cables under DC stress is determined by the dielectric’s volume resistivity, which in turn strongly depends on the temperature and local field strength [Maz13, Sal97]. Due to the accumulation of space charges, which may become trapped inside the insulation material, the electric field strength is locally altered resulting in areas of increased and areas of decreased field stresses instead of a uniformly distributed field between the two electrodes [Fab08, Küc18, Zha96]. As a result, the interference of trapped charges and transient fields can result in stresses exceeding the dielectric strength of the XLPE insulation. In these weak spots, the insulation material is damaged and partial discharges are triggered resulting in faster ageing and degradation of the cable insulation. Space charge accumulation therefore has to be accounted for when evaluating the criticality of transient stresses, particularly transient field reversals caused by opposite polarity voltages applied to the cable conductor.
2.2.1 Accumulation of space charges
Space charges describe the retention of electrical charges in the XLPE insulation as a consequence of the conduction mechanisms and polarisation effects under DC field stress, in particular the non-uniform dependence of the XLPE’s conductivity on the temperature and electrical field strength, as well as
4 For better comparability, surge arresters limiting the DC voltage oscillations are omitted.
Physical and technological basics 23
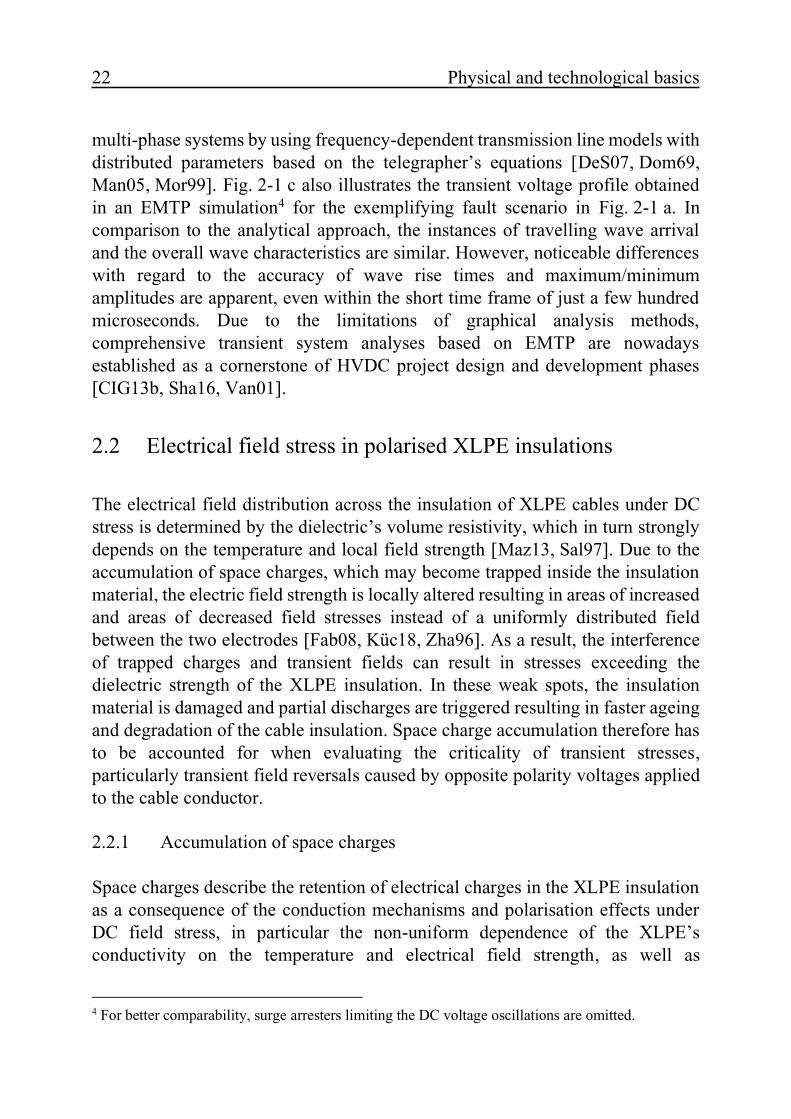
inhomogeneities in the chemical structure of the material [Küc18, Maz13]. They are created by charge carrier injection from the cable electrodes or from existing charges resulting from ionic dissociable additives and impurities within the material [Sal97]. Depending on the magnitude of the applied field strength, E = E0, charge injection or charge transportation effects dominate resulting in homocharge or heterocharge accumulations and respective local conductivity and electrical field modifications, ρ(x) and E(x), as indicated in Fig. 2-2 [Küc18].
(a)
(b)
Fig. 2-2: Accumulation of space charges in XLPE, (a) heterocharges: accumulation of existing charge carriers at lower field strengths, (b) homocharges: accumulation of injected charge carriers at higher field strengths (cf. [Küc18])
Due to the non-homogeneous structure and insulating properties of XLPE, the accumulated charges depicted in Fig. 2-2 can be permanently trapped in microscopic material inhomogeneities, even at room temperature [Maz13, Sal97]. As a result, the electrical field is locally modified. In some areas of the insulation, the electrical stress is reduced while increased stresses occur in other areas, ultimately leading to an accelerated ageing of the material [Zha96]. In a planar XLPE insulation arrangement, a space charge density of 1 µC/cm³ modifies the electrical field strength by 50 kV/mm over a distance of 1 mm [Han03].
ρ ρ(x)
x
E
x
E(x)
E0
ρ
x
ρ(x)
E
x
E(x)
E0
24 Physical and technological basics
2.2.2 Voltage polarity reversal
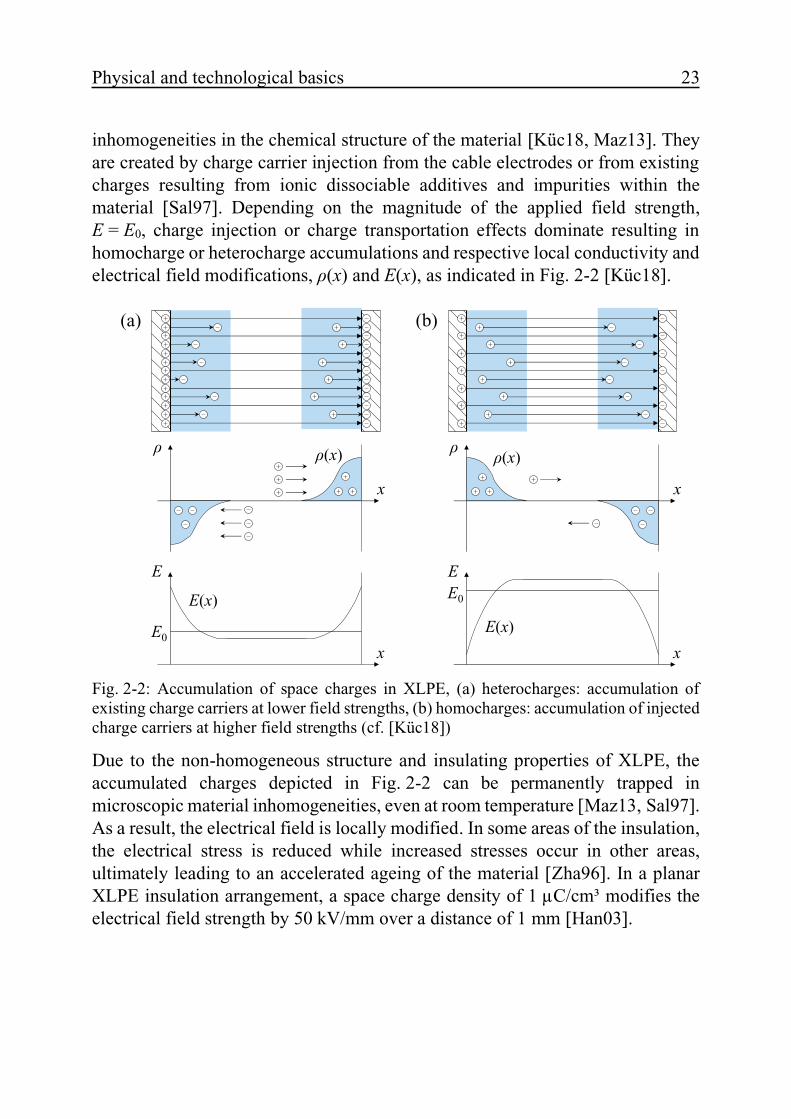
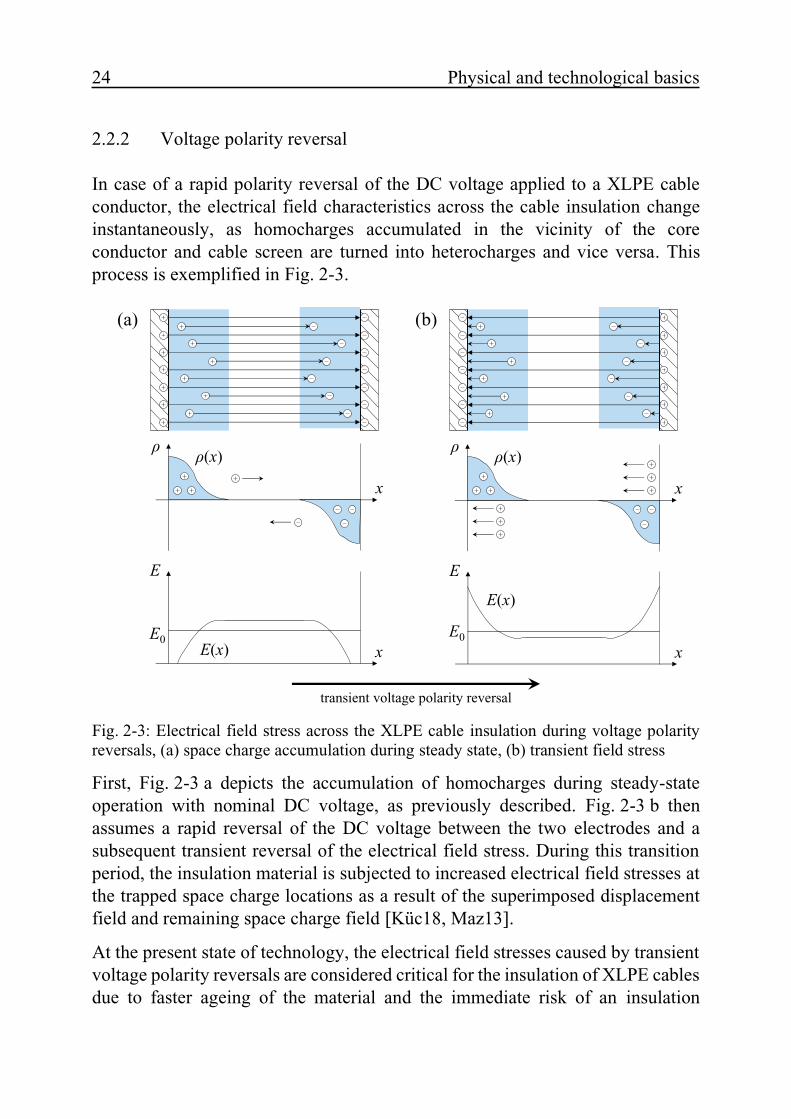
In case of a rapid polarity reversal of the DC voltage applied to a XLPE cable conductor, the electrical field characteristics across the cable insulation change instantaneously, as homocharges accumulated in the vicinity of the core conductor and cable screen are turned into heterocharges and vice versa. This process is exemplified in Fig. 2-3.
(a)
(b)
Fig. 2-3: Electrical field stress across the XLPE cable insulation during voltage polarity reversals, (a) space charge accumulation during steady state, (b) transient field stress
First, Fig. 2-3 a depicts the accumulation of homocharges during steady-state operation with nominal DC voltage, as previously described. Fig. 2-3 b then assumes a rapid reversal of the DC voltage between the two electrodes and a subsequent transient reversal of the electrical field stress. During this transition period, the insulation material is subjected to increased electrical field stresses at the trapped space charge locations as a result of the superimposed displacement field and remaining space charge field [Küc18, Maz13].
At the present state of technology, the electrical field stresses caused by transient voltage polarity reversals are considered critical for the insulation of XLPE cables due to faster ageing of the material and the immediate risk of an insulation
ρ
x
ρ(x)
E
xE(x)E0
ρ
x
ρ(x)
E
x
E(x)
E0
transient voltage polarity reversal
Physical and technological basics 25
breakdown [Fab08, Han03]. For this reason, the use of XLPE cables in HVDC applications is almost exclusively limited to VSC schemes, where voltage polarity reversals only occur during transient states, such as DC line faults. Since in LCC systems each power flow reversal requires a reversal of the DC voltage, mass-impregnated cables are the standard solution for UGC transmission [Sha16].
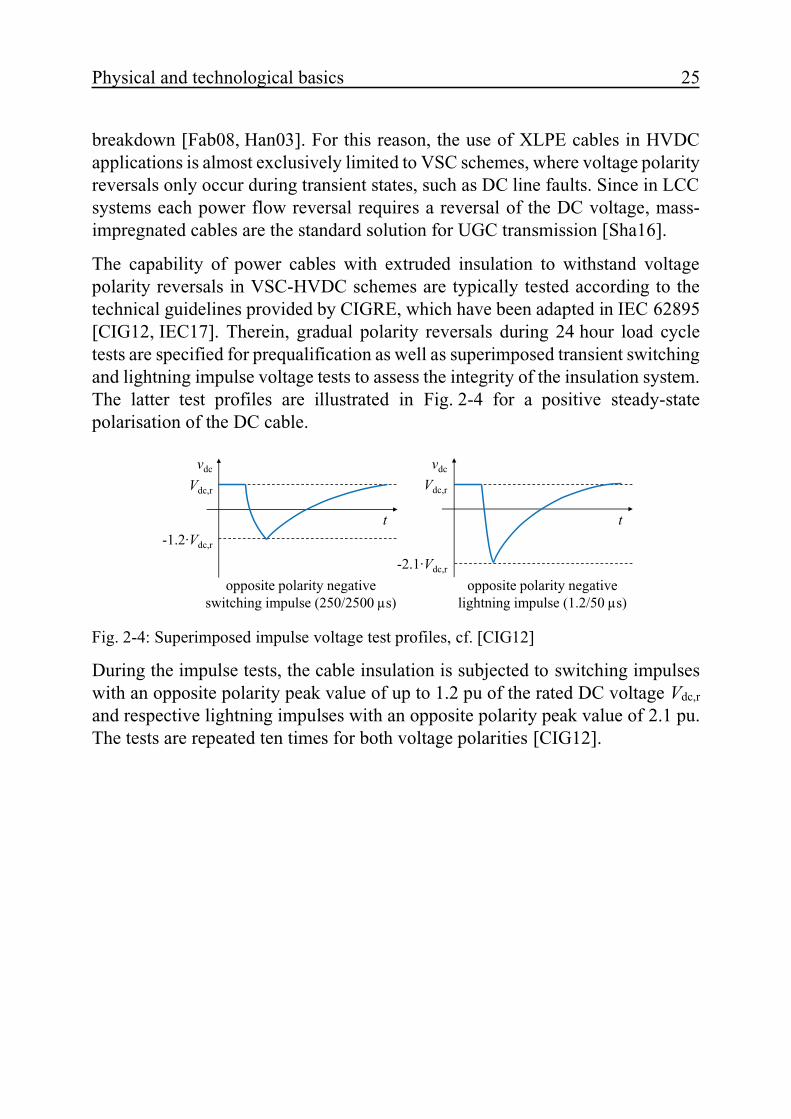
The capability of power cables with extruded insulation to withstand voltage polarity reversals in VSC-HVDC schemes are typically tested according to the technical guidelines provided by CIGRE, which have been adapted in IEC 62895 [CIG12, IEC17]. Therein, gradual polarity reversals during 24 hour load cycle tests are specified for prequalification as well as superimposed transient switching and lightning impulse voltage tests to assess the integrity of the insulation system. The latter test profiles are illustrated in Fig. 2-4 for a positive steady-state polarisation of the DC cable.
During the impulse tests, the cable insulation is subjected to switching impulses with an opposite polarity peak value of up to 1.2 pu of the rated DC voltage Vdc,r and respective lightning impulses with an opposite polarity peak value of 2.1 pu. The tests are repeated ten times for both voltage polarities [CIG12].
Fig. 2-4: Superimposed impulse voltage test profiles, cf. [CIG12]
vdc
t
Vdc,r
-2.1∙Vdc,r
vdc
t
Vdc,r
-1.2∙Vdc,r
opposite polarity negative switching impulse (250/2500 µs)
opposite polarity negative lightning impulse (1.2/50 µs)

26 Physical and technological basics
Investigation method and boundary conditions 27
3 Investigation method and boundary conditions
To assess the applicability of VSC-HVDC protection concepts in systems with mixed usage of UGC and OHL transmission and to validate the functionality of enhanced concepts, the investigations rely on comprehensive EMT simulations in the time domain. For this purpose, a model framework is set up in the graphical user interface Power Systems Computer Aided Design (PSCAD) and computed based on the Electromagnetic Transients including DC (EMTDC) simulation engine [Man18]. In addition, a control structure is implemented based on a Python interface to allow the automated execution of large simulation sets and parameter variations. Thus, a systematic investigation of line fault scenarios to characterise the transient voltage and current stresses is carried out identifying relevant topological and technological impacts.
Based on this foundation, the identified research needs are addressed in four consecutive steps:
1) Description of the transient fault behaviour at the transmission line ends and UGC-OHL interfaces identifying relevant impacts on the voltage and current characteristics
2) Evaluation of the protection concepts proposed for future VSC-HVDC systems with regard to the transient stresses imposed on the components, the selective detection of line faults, the reliable fault separation and the accurate discrimination of UGC and OHL faults
3) Identification of requirements for line protection concepts in systems with mixed UGC-OHL transmission systems and development of new and enhanced protection methods
4) Validation of the developed protection methods in exemplifying test cases demonstrating their flexible applicability in different VSC-HVDC configurations
As a starting point, the EMTP model framework is laid out and the simulation method is explained in detail pointing out the evaluation parameters used to quantify the impacts on the transient system behaviour as well as the indicators to assess the protection performance in the subsequent investigations.
28 Investigation method and boundary conditions
3.1 EMTP model and simulation framework
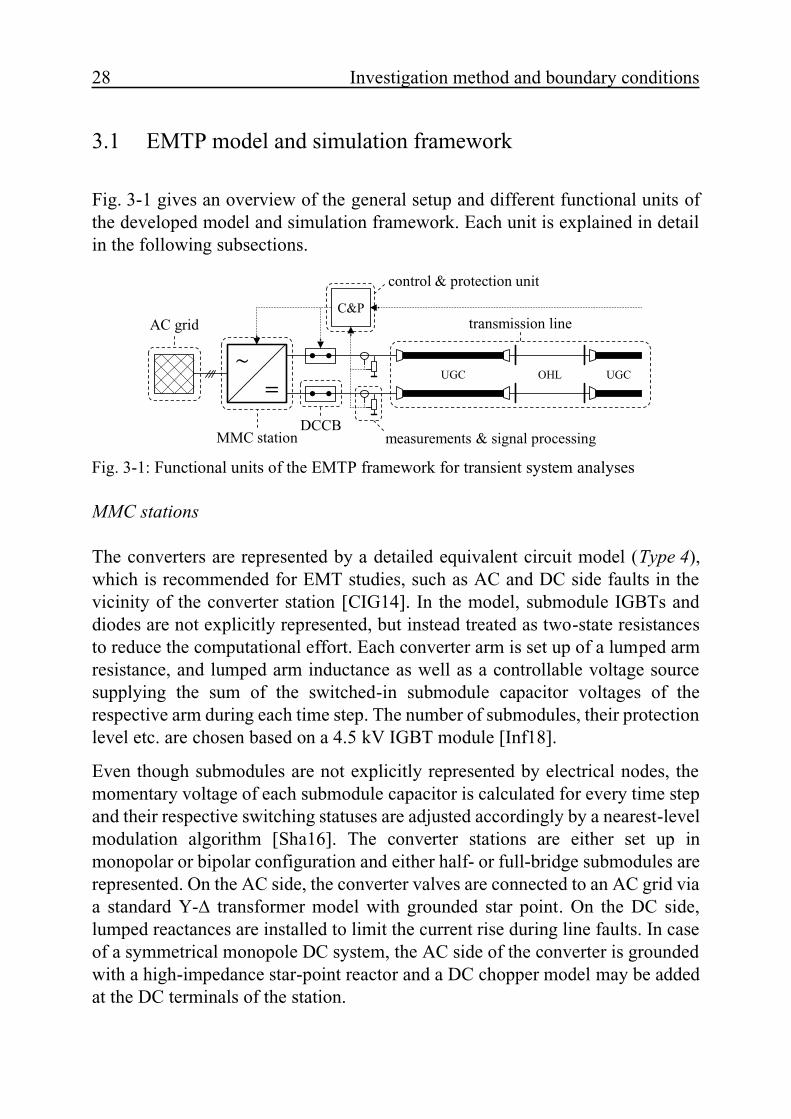
Fig. 3-1 gives an overview of the general setup and different functional units of the developed model and simulation framework. Each unit is explained in detail in the following subsections.
MMC stations
The converters are represented by a detailed equivalent circuit model (Type 4), which is recommended for EMT studies, such as AC and DC side faults in the vicinity of the converter station [CIG14]. In the model, submodule IGBTs and diodes are not explicitly represented, but instead treated as two-state resistances to reduce the computational effort. Each converter arm is set up of a lumped arm resistance, and lumped arm inductance as well as a controllable voltage source supplying the sum of the switched-in submodule capacitor voltages of the respective arm during each time step. The number of submodules, their protection level etc. are chosen based on a 4.5 kV IGBT module [Inf18].
Even though submodules are not explicitly represented by electrical nodes, the momentary voltage of each submodule capacitor is calculated for every time step and their respective switching statuses are adjusted accordingly by a nearest-level modulation algorithm [Sha16]. The converter stations are either set up in monopolar or bipolar configuration and either half- or full-bridge submodules are represented. On the AC side, the converter valves are connected to an AC grid via a standard Y-∆ transformer model with grounded star point. On the DC side, lumped reactances are installed to limit the current rise during line faults. In case of a symmetrical monopole DC system, the AC side of the converter is grounded with a high-impedance star-point reactor and a DC chopper model may be added at the DC terminals of the station.
Fig. 3-1: Functional units of the EMTP framework for transient system analyses
MMC stationDCCB
measurements & signal processing
transmission lineC&P
control & protection unit
UGC OHL UGC
AC grid
Investigation method and boundary conditions 29
The MMC is operated by a cascaded state vector control scheme to accurately represent the converter behaviour during steady and transient states. The control scheme comprises:
Outer control loop:
Calculation of target values for the subsequent control loops based on dispatch centre setpoints (voltage, power) and droop characteristics
Inner control loop:
Calculation of arm reference voltages based on outer loop target values, AC current control, energy balancing controls and protection functions
Submodule control loop:
IGBT switching signal generation based on arm reference voltages, momentary arm currents and capacitor voltages
The converters are protected at both terminals and within the station by 20 kA surge arresters with a 8/20 µs characteristic at a rated voltage of 1.25 times the respective maximum continuous operating voltage [Ste03]. Moreover, an internal arm overcurrent protection is used to immediately block the submodules’ IGBTs, if the recorded arm current in the MMCs exceeds a threshold of Iarm,threshold = 3 kA. In case of full-bridge MMCs, an active fault current control is added to the inner control loop to limit the DC pole current in case of a contingency by reducing the DC pole voltage without protective submodule blocking. Hence, reactive power is continuously supplied to the connected AC systems during fault handling.
AC grids
Since the focus of the investigations is on DC line faults, AC grids connected to the converter stations are modelled as simplified three-phase AC voltage sources with concentrated source impedances to specify their short-circuit power. During steady state, the sources exchange active and reactive power with the DC system. In case of a DC line fault, a fault current is fed via the converter stations and into the fault location until the contingency is successfully separated.
All of the AC sources supply a RMS line-to-line voltage of Vac,s = 420 kV at a frequency of f = 50 Hz. The source impedances are specified as a resistance of Rs = 0.1 Ω in series with a parallel circuit of an inductance of Lp = 12 mH and a resistance of Rp = 40 Ω. As a result, a maximum short-circuit current of Ik ≈ 63 kA is provided by the AC grids.
30 Investigation method and boundary conditions
Transmission lines and faults
To accurately represent the propagation characteristics of travelling waves during DC line faults, the Frequency Dependent (Phase) model, also known as Universal Line Model, is used for the representation of both UGCs and OHLs [Gus99, Mor99]. The distributed line parameter model is based on the telegrapher’s equation, cf. equations (2.2) and (2.3), from which the frequency-dependent propagation function and characteristic admittance matrices are derived. The resulting equations are solved in the frequency domain at a set range of discrete frequencies before being approximated by curve fitting techniques and convoluted to the time domain. Curve fitting is applied at several hundred increments within a frequency range of f = 10-3…106 Hz and with a maximum allowed fitting error of 0.01 %. At f = 0 Hz, a correction term is introduced to eliminate calculation errors, as the fitting process becomes increasingly time-consuming and inaccurate near the lower frequency boundary [DeS07].
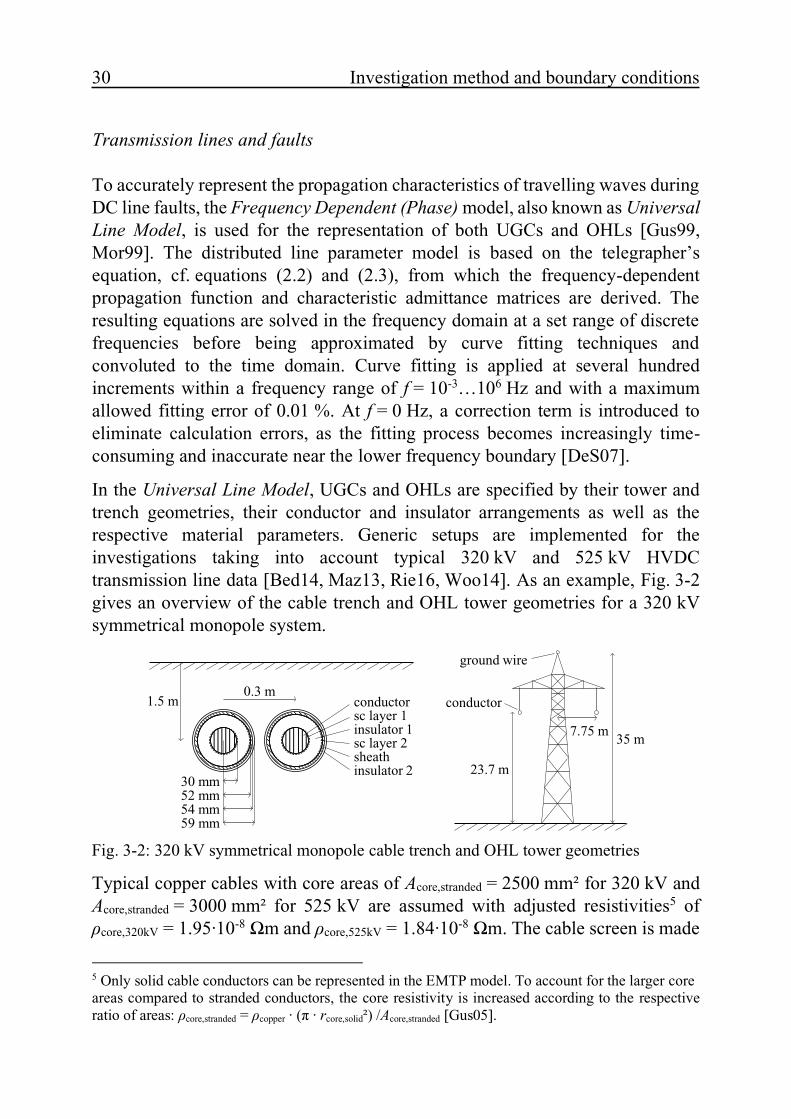
In the Universal Line Model, UGCs and OHLs are specified by their tower and trench geometries, their conductor and insulator arrangements as well as the respective material parameters. Generic setups are implemented for the investigations taking into account typical 320 kV and 525 kV HVDC transmission line data [Bed14, Maz13, Rie16, Woo14]. As an example, Fig. 3-2 gives an overview of the cable trench and OHL tower geometries for a 320 kV symmetrical monopole system.
Typical copper cables with core areas of Acore,stranded = 2500 mm² for 320 kV and Acore,stranded = 3000 mm² for 525 kV are assumed with adjusted resistivities5 of ρcore,320kV = 1.95∙10-8 Ωm and ρcore,525kV = 1.84∙10-8 Ωm. The cable screen is made
5 Only solid cable conductors can be represented in the EMTP model. To account for the larger core areas compared to stranded conductors, the core resistivity is increased according to the respective ratio of areas: ρcore,stranded = ρcopper ∙ (π ∙ rcore,solid²) /Acore,stranded [Gus05].
Fig. 3-2: 320 kV symmetrical monopole cable trench and OHL tower geometries
30 mm52 mm54 mm59 mm
1.5 m
insulator 1sc layer 2sheathinsulator 2
conductorsc layer 1
0.3 m
23.7 m
35 m7.75 m
conductor
ground wire
Investigation method and boundary conditions 31
of aluminium with ρscreen = 2.65∙10-8 Ωm. For the XLPE and PE insulation as well as the semi-conducting layers, a relative permittivity of εr = 2.5 is assumed and the relative permeability is µ = 1 for all inner layers according to typical material data [Bed14, Gus05]. In case of offshore applications, a steel armouring with ρarmour = 1.8∙10-7 Ωm and µ = 10 as well as another insulating layer are added. Since the voltages and currents on the outer metallic layers are not of particular interest in the investigations, they are eliminated mathematically assuming ideal grounding of the cable screen.
The OHLs are equipped with 4-bundle steel-reinforced aluminium conductors, Al/St 265/35 for 320 kV and Al/St 550/70 for 525 kV, with respective strand numbers, diameters and electrical properties. Ground wires are configured as Al/St 240/40 conductors.
The ground plane, which is needed to calculate the return path in the Universal Line Model, is represented with frequency-dependent conductivity and the complex ground impedance integral is solved using direct numerical integration for UGCs and the Deri-Semlyen approximation for OHLs [Der81].
Faults on the transmission lines are represented as an electrical connection between the affected pole conductor and ground or between multiple DC poles with a constant fault transition resistance Rf in between the connected nodes. At the fault location, the transmission line model is split up into two separate sections to apply the short-circuit between the respective nodes. Hence, to investigate a variety of fault locations in different topological setups, extensive modelling efforts and control logic implementations are required. To address this challenge, a Python interface is used to access the EMTP model configurations from a developed external control script. It allows the flexible adaption of model parameters including the transmission line section lengths and fault characteristics based on predefined sequences. Thus, simulation sets with an automated variation of the fault type, location and resistance as well as the pre-fault conditions are made feasible.
In any simulation setup, the time step has to be chosen according to the smallest time constant of the investigated system. While the converter station models operate with a specified execution time step of ∆tMMC = 20 µs for IGBT switching signal generation, the smallest time constant in the DC transmission system is determined by the smallest travelling wave propagation distance between two sections with different characteristic impedances. This has to be accounted for when varying the fault location along the transmission lines. To allow an accurate representation of transients caused by travelling waves during DC line faults, the
32 Investigation method and boundary conditions
shortest investigated line segment has a length of l = 10 km and the simulation time step is set to ∆tstep = 5 µs. Accordingly, faults are simulated at the line terminations as well as in 10 km intervals along the respective lines.
Measurements & signal processing
Momentary DC pole voltage and current values are recorded ideally in the EMT model at every line termination as well as every UGC-OHL transition for each simulation time step. If not indicated otherwise, the currents at the line ends are measured in direction of the line and currents at segment interfaces are measured from left to right according to the given schematic. To account for the low-pass characteristics of the physical measurement equipment as well as digital filters, which are typically used to avoid protective actions for single transients, third order Butterworth low-pass filters are added to the EMT model. The recorded pole voltages and currents are filtered with cut-off frequencies of fc,v = 1 kHz and fc,I = 10 kHz respectively before being processed to the control and protection units [CIG18].
In case of long-distance signal transmission, e.g. communication between the converter stations, digital delay functions are used in the EMT model to emulate the communication infrastructure. Based on available optical fiber technology, a communication velocity of ucom = 200 km/ms is assumed with an additional delay of ∆tcom,proc = 500 µs to account for signal processing [CEN18].
Fault detection and localisation methods often include an evaluation of voltage and current changes, which can be determined several ways. The fastest method, but, at the same time, the method with the most volatile outcome, is the calculation of voltage and current derivatives according to equation (3.1), i.e. the differential voltage, ∆v, and differential current, ∆i, between two subsequent samples divided by the sample time step ∆tsample.
; (3.1)
Due to the short time frame of just a single sample step, even minor voltage and current deviations can result in significant ROCOV and ROCOC inducing undesired protective actions. Hence, a more robust approach is chosen, in which the changes of the recorded and filtered measurements are continuously calculated for a time frame of ∆t = 100 µs according to equation (3.2).
; (3.2)
Investigation method and boundary conditions 33
Control & protection unit
In the EMT model, a control and protection unit is assigned to every line end, which is responsible for the detection of line faults in this zone as well as the initiation of the fault separation process. Each unit contains the enhanced and newly developed protection methods. As input parameters, the units receive the locally recorded and processed measurements, local protection statuses, e.g. from the MMC and DCCBs, as well as remote signals and measurements with the respective communication time delays.
Inside the units, the developed primary and backup fault detection logics as well as the fault localisation algorithm are implemented according to the flow chart descriptions in chapter 6.1 and chapter 6.2. Each of the detection methods comprise a comparison with a respective threshold, which has to be exceeded for a specified amount of time, as well as several other trip conditions, which have to be fulfilled simultaneously for fault identification. The threshold and time parametrisations of the implemented methods are indicated in appendix A1.
After the detection and localisation of line faults, the control and protection units provide trip and control signals to the respective DCCBs and/or the converter station depending on the given system setup and fault separation method. In case of a temporary fault on an OHL segment, a re-start command is issued after a specified arc de-ionisation time.
DC circuit breakers (DCCBs)
Since the investigations do not focus on a comparison of different DC breaker types and their specific components, a generic DCCB representation is developed and implemented in the EMT model to emulate the current interrupting behaviour of DC breakers and the resulting voltage stresses across the DCCB terminals. The model is based on the fundamental building blocks of HVDC circuit breakers and can be adapted to the characteristic behaviour of power electronic breakers, mechanical breakers with current injection or hybrid breakers [CIG17]. Fig. 3-3 gives an overview of the model setup as well as the current and voltage characteristics during the fault separation process. In the model, the main breaker path and commutation path are summarised by an ideal switch with parallel snubber circuit and stray inductances. A surge arrester bank is connected in parallel serving as energy dissipation path.
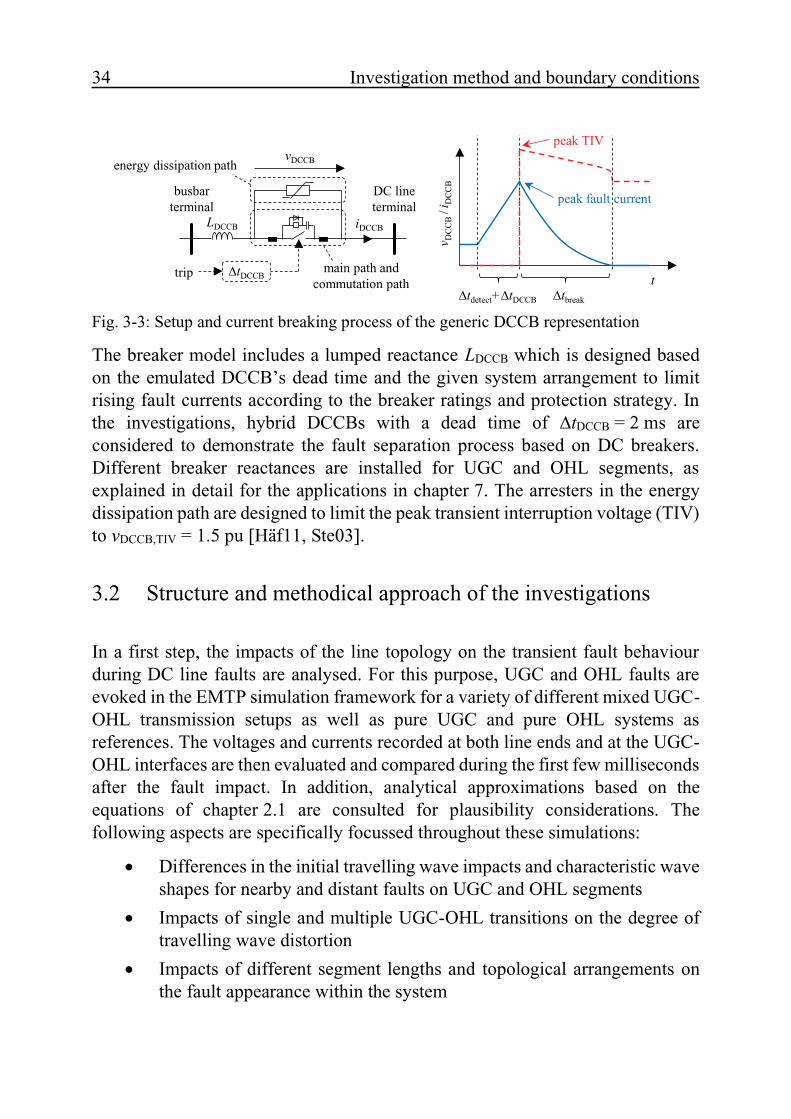
34 Investigation method and boundary conditions
The breaker model includes a lumped reactance LDCCB which is designed based on the emulated DCCB’s dead time and the given system arrangement to limit rising fault currents according to the breaker ratings and protection strategy. In the investigations, hybrid DCCBs with a dead time of ∆tDCCB = 2 ms are considered to demonstrate the fault separation process based on DC breakers. Different breaker reactances are installed for UGC and OHL segments, as explained in detail for the applications in chapter 7. The arresters in the energy dissipation path are designed to limit the peak transient interruption voltage (TIV) to vDCCB,TIV = 1.5 pu [Häf11, Ste03].
3.2 Structure and methodical approach of the investigations
In a first step, the impacts of the line topology on the transient fault behaviour during DC line faults are analysed. For this purpose, UGC and OHL faults are evoked in the EMTP simulation framework for a variety of different mixed UGC-OHL transmission setups as well as pure UGC and pure OHL systems as references. The voltages and currents recorded at both line ends and at the UGC-OHL interfaces are then evaluated and compared during the first few milliseconds after the fault impact. In addition, analytical approximations based on the equations of chapter 2.1 are consulted for plausibility considerations. The following aspects are specifically focussed throughout these simulations:
Differences in the initial travelling wave impacts and characteristic wave shapes for nearby and distant faults on UGC and OHL segments
Impacts of single and multiple UGC-OHL transitions on the degree of travelling wave distortion
Impacts of different segment lengths and topological arrangements on the fault appearance within the system
Fig. 3-3: Setup and current breaking process of the generic DCCB representation
t
v DC
CB
/iD
CC
B
∆tbreak∆tdetect+∆tDCCB
peak TIV
peak fault current
main path and commutation path
busbarterminal
energy dissipation path
DC line terminal
vDCCB
iDCCB
trip ∆tDCCB
LDCCB
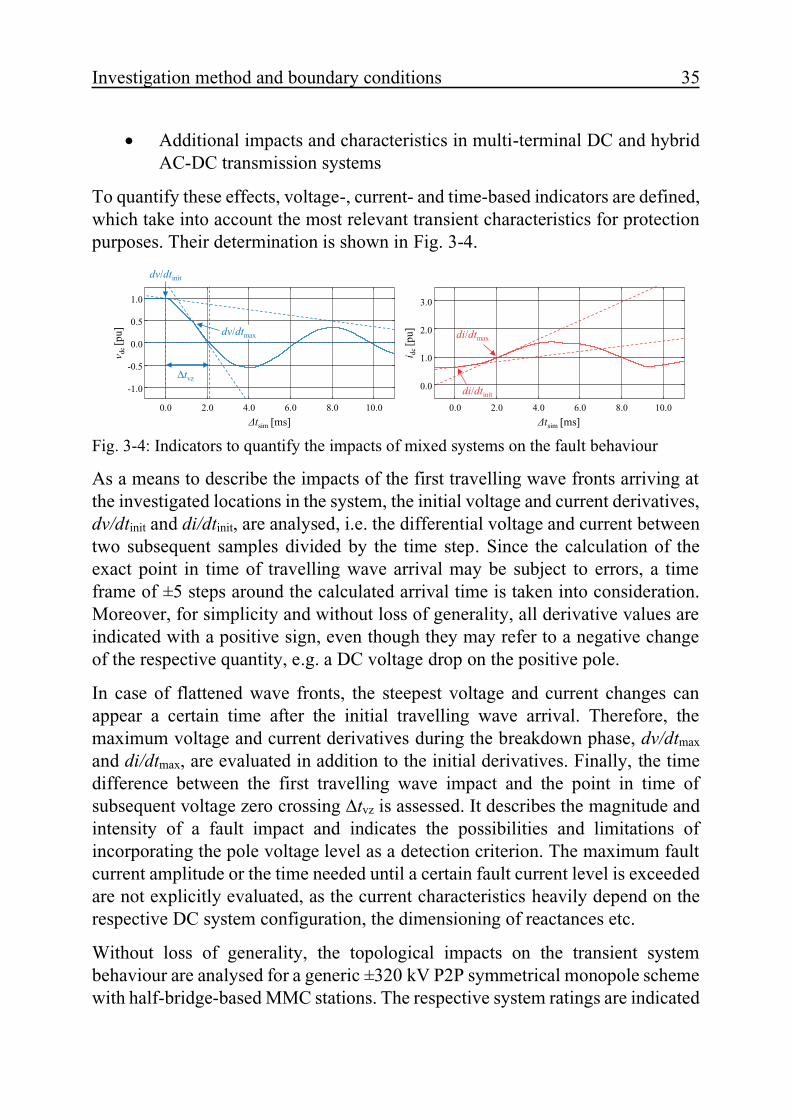
Investigation method and boundary conditions 35
Additional impacts and characteristics in multi-terminal DC and hybrid AC-DC transmission systems
To quantify these effects, voltage-, current- and time-based indicators are defined, which take into account the most relevant transient characteristics for protection purposes. Their determination is shown in Fig. 3-4.
Fig. 3-4: Indicators to quantify the impacts of mixed systems on the fault behaviour
As a means to describe the impacts of the first travelling wave fronts arriving at the investigated locations in the system, the initial voltage and current derivatives, dv/dtinit and di/dtinit, are analysed, i.e. the differential voltage and current between two subsequent samples divided by the time step. Since the calculation of the exact point in time of travelling wave arrival may be subject to errors, a time frame of ±5 steps around the calculated arrival time is taken into consideration. Moreover, for simplicity and without loss of generality, all derivative values are indicated with a positive sign, even though they may refer to a negative change of the respective quantity, e.g. a DC voltage drop on the positive pole.
In case of flattened wave fronts, the steepest voltage and current changes can appear a certain time after the initial travelling wave arrival. Therefore, the maximum voltage and current derivatives during the breakdown phase, dv/dtmax and di/dtmax, are evaluated in addition to the initial derivatives. Finally, the time difference between the first travelling wave impact and the point in time of subsequent voltage zero crossing ∆tvz is assessed. It describes the magnitude and intensity of a fault impact and indicates the possibilities and limitations of incorporating the pole voltage level as a detection criterion. The maximum fault current amplitude or the time needed until a certain fault current level is exceeded are not explicitly evaluated, as the current characteristics heavily depend on the respective DC system configuration, the dimensioning of reactances etc.
Without loss of generality, the topological impacts on the transient system behaviour are analysed for a generic ±320 kV P2P symmetrical monopole scheme with half-bridge-based MMC stations. The respective system ratings are indicated
0.0 2.0 4.0 6.0 8.0 10.0
0.0
1.0
2.0
3.0
0.0 2.0 4.0 6.0 8.0 10.0
-1.0
-0.5
0.0
0.5
1.0
dv/dtinit
dv/dtmax
∆tvz
di/dtinit
di/dtmax
Δtsim [ms]Δtsim [ms]i d
c[p
u]
v dc[p
u]

36 Investigation method and boundary conditions
in Table 3-1. While the DC line topology and fault locations are varied throughout the simulations, the other components and functional units of the EMTP simulation framework are not changed. Nonetheless, the results and conclusions obtained in the given system are applicable to other setups as well, as the initial fault impacts are mainly determined by travelling wave propagation effects. During this time, the influence of different converter types and the monopolar or bipolar system configurations is comparatively small [Bra19, Buc14].
Table 3-1: System ratings for the investigation of topological impacts
Parameter Rating Active / reactive station power 900 MW / 300 Mvar Rated DC pole voltage / current ±320 kV / 1.41 kA Rated AC voltage at the MMCs (RMS, L-L) 355 kV Submodules per arm / capacitance / capacitor voltage 250 / 5.2 mF / 2.7 kV Arm resistance / arm inductance 0.1 Ω / 50 mH DC terminal inductance 50 mH
Permanent pole-to-ground line faults are evoked in the systems with a fault transition of Rf = 0.01 Ω and the prospective voltages and currents are analysed, i.e. the characteristic fault behaviour without interferences caused by protective measures. At this point, detection methods and DCCBs for fault separation are not included in the simulations to specifically address the topological impacts. The effects caused by higher fault resistances and other fault types, e.g. pole-to-pole short-circuits, generally apply to any kind of transmission system and are not specifically related to mixed UGC-OHL setups. These fault types are, however, taken into account for the assessment and enhancement of protection systems.
The topological impacts identified in the investigated P2P system setup apply to any DC line, whether it is part of a P2P transmission link, a MTDC system or a meshed DC grid. However, additional topological aspects have to be considered in MTDC and hybrid AC-DC transmission schemes with respect to the protection system design and the transient electrical field stress imposed on the polarised XLPE cables. These impacts are therefore pointed out separately as a complement to the general characteristics observed in the P2P systems.
A four-terminal symmetrical monopole scheme with half-bridge-based MMC stations is investigated, which is reminiscent of a configuration often studied for future offshore wind power integration via MTDC [PRO17]. The stations are rated according to Table 3-1. To investigate the topological impacts specific to MTDC systems, a pure UGC-based transmission system is compared to a setup, in which one of the lines is replaced by an OHL. Hence, UGC-OHL transitions are created via the MTDC busbars resulting in travelling wave reflection and
Investigation method and boundary conditions 37
transmission effects at the direct interface of two line protection zones. To analyse the transient behaviour specific to hybrid AC-DC transmission systems, an intersystem fault between a DC pole and an AC phase is investigated in a bipolar P2P scheme with full-bridge-based MMC stations and dedicated metallic return conductor, similar to previously conducted studies of the intersystem fault behaviour [Pet17, Sta14]. A pure OHL arrangement is analysed as well as a mixed UGC-OHL DC system with the intersystem fault occurring on the OHL section.
Based on the comprehensive analysis of the fault behaviour in mixed transmission systems and the identification of topological impacts, the protection methods proposed for future VSC-HVDC systems are assessed regarding their applicability in mixed line topologies. For this purpose, pole-to-ground faults are evoked in 10 km intervals along an UGC line (reference case) as well as four representative mixed transmission systems with different numbers, lengths and arrangements of UGC and OHL segments, which specifically take into account the previously identified topological impacts. This way, a statistical evaluation of the transient fault behaviour is obtained, which serves as a foundation to categorise different groups of fault scenarios and to identify specific challenges and functional limitations of the existing protection methods. The subsequent assessment is carried out separately for the stresses imposed on the components, the selective detection of line faults, their reliable separation and the accurate discrimination of faults on UGC and OHL segments. The following indicators are used for this purpose:
Stresses imposed on the components:
‒ Maximum DC pole current amplitude per unit at the fault location, the UGC-OHL interfaces and the line ends
‒ Transient overvoltage amplitude on the DC pole per unit
‒ Amplitude and duration of impact of opposite polarity DC pole voltages per unit / in milliseconds
Selective detection of line faults:
‒ Voltage drop and current rise per unit within the first two milliseconds after travelling wave arrival at the line ends
‒ Maximum ROCOV and ROCOC per unit per millisecond within the first two milliseconds after travelling wave arrival at the line ends
Reliable separation of line faults:
‒ Maximum DC pole current amplitude per unit at the line ends
‒ Peak current amplitude in the converter arms in kiloampere
38 Investigation method and boundary conditions
Accurate discrimination of line faults:
‒ DC pole voltage shape at the line ends to estimate the travelling wave arrival identification error in microseconds
‒ DC pole current patterns at every transmission segment end
Based on the assessment of the proposed protection concepts, additional requirements for comprehensive line protection in VSC-HVDC systems with mixed UGC-OHL transmission are specified. Taking these requirements into account, the known methods are enhanced and newly developed approaches are included into the overall fault detection and localisation strategy.
In a final step, the flexible applicability of the new protection concept is validated based on two exemplary test systems: A ±525 kV bipolar P2P interconnection with full-bridge-based MMCs and a ±320 kV symmetrical monopole MTDC system based on half-bridge MMCs and hybrid DCCBs. The selective detection of line faults, reliable fault separation and accurate identification of the faulted segment is shown taking into account the following investigation constraints:
Fault locations in 10 km intervals along the P2P system and every line in the MTDC system
Temporary and permanent OHL faults as well as permanent UGC faults
Pole-to-ground, pole-to-pole6 and pole-to-pole-to-ground faults
In addition, a statistical evaluation of the protection performance is carried out for both test systems addressing the required detection time, the share of detection methods in the initial fault identification as well as the maximum impacts on healthy system parts during the entire fault handling process.
6 Typically, UGC faults always involve a ground connection due to the grounded cable screen. Nonetheless, pole-to-pole faults are taken into account as worst case scenario.
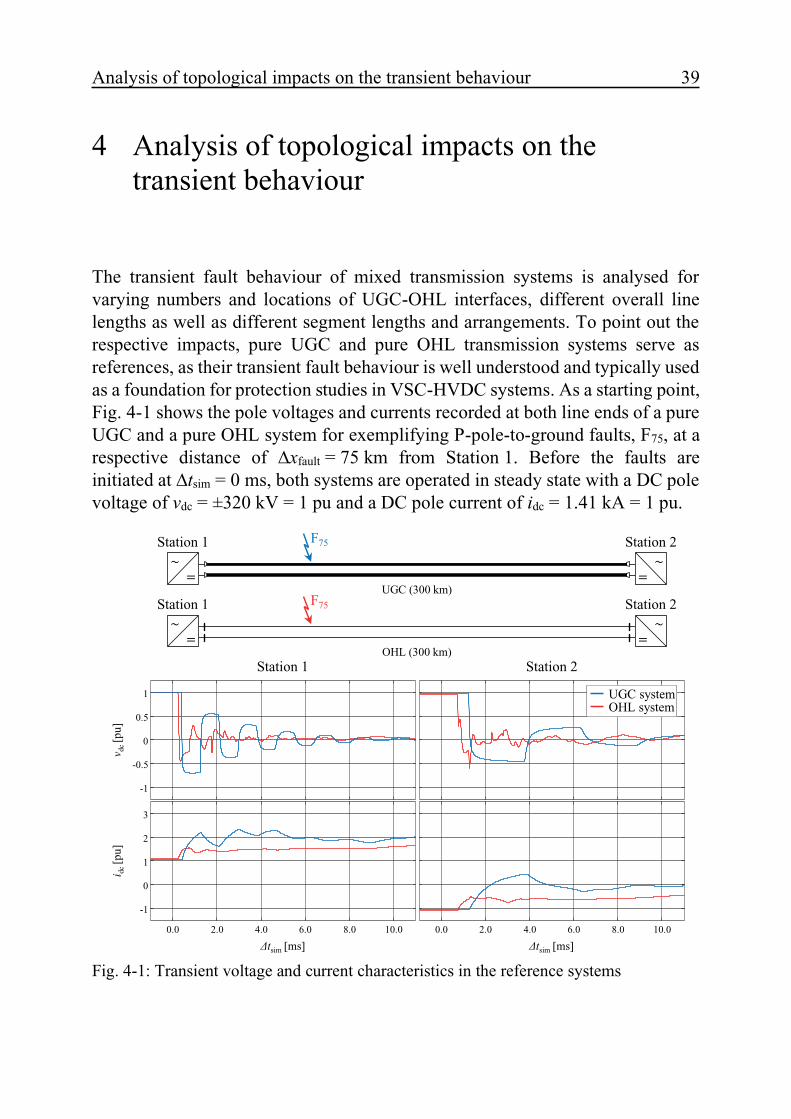
Analysis of topological impacts on the transient behaviour 39
4 Analysis of topological impacts on the transient behaviour
The transient fault behaviour of mixed transmission systems is analysed for varying numbers and locations of UGC-OHL interfaces, different overall line lengths as well as different segment lengths and arrangements. To point out the respective impacts, pure UGC and pure OHL transmission systems serve as references, as their transient fault behaviour is well understood and typically used as a foundation for protection studies in VSC-HVDC systems. As a starting point, Fig. 4-1 shows the pole voltages and currents recorded at both line ends of a pure UGC and a pure OHL system for exemplifying P-pole-to-ground faults, F75, at a respective distance of ∆xfault = 75 km from Station 1. Before the faults are initiated at ∆tsim = 0 ms, both systems are operated in steady state with a DC pole voltage of vdc = ±320 kV = 1 pu and a DC pole current of idc = 1.41 kA = 1 pu.
Fig. 4-1: Transient voltage and current characteristics in the reference systems
0.0 2.0 4.0 6.0 8.0 10.0
-1
0
1
2
3
-1
-0.5
0
0.5
1
OHL (300 km)
Station 2Station 1 F75
Station 2Station 1
UGC (300 km)
Station 2Station 1 F75
UGC systemOHL system
0.0 2.0 4.0 6.0 8.0 10.0
Δtsim [ms]Δtsim [ms]
v dc[p
u]i d
c[p
u]
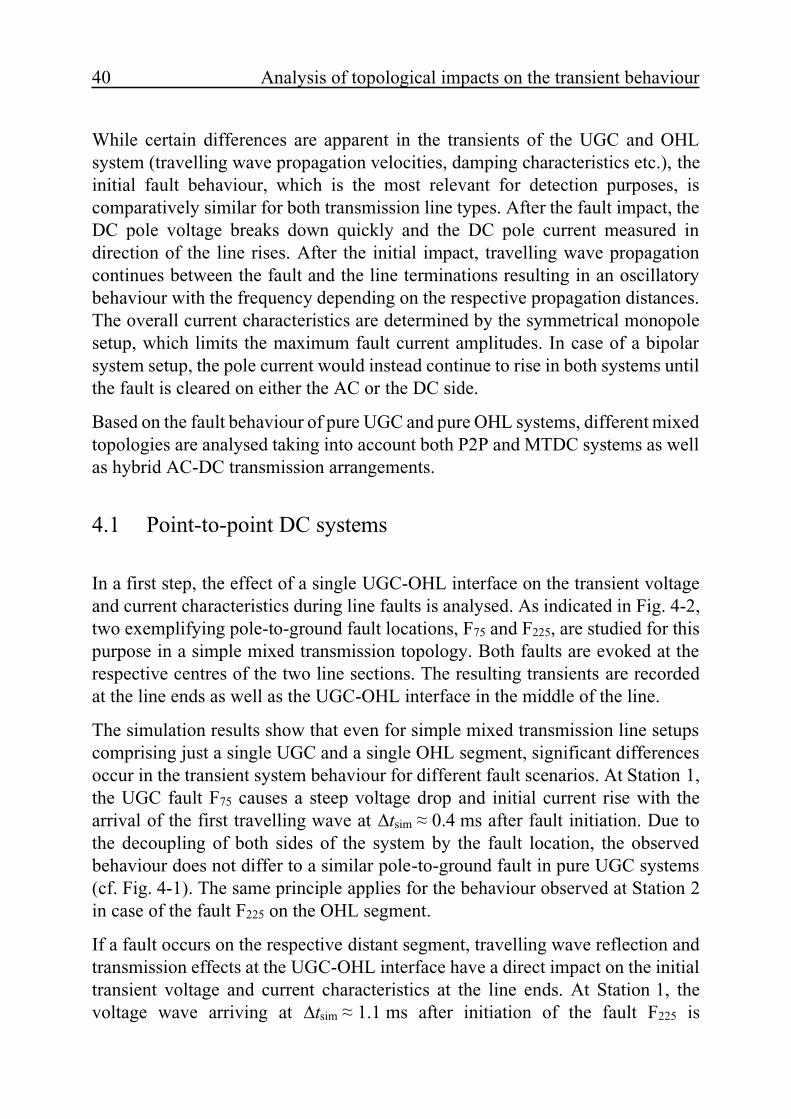
40 Analysis of topological impacts on the transient behaviour
While certain differences are apparent in the transients of the UGC and OHL system (travelling wave propagation velocities, damping characteristics etc.), the initial fault behaviour, which is the most relevant for detection purposes, is comparatively similar for both transmission line types. After the fault impact, the DC pole voltage breaks down quickly and the DC pole current measured in direction of the line rises. After the initial impact, travelling wave propagation continues between the fault and the line terminations resulting in an oscillatory behaviour with the frequency depending on the respective propagation distances. The overall current characteristics are determined by the symmetrical monopole setup, which limits the maximum fault current amplitudes. In case of a bipolar system setup, the pole current would instead continue to rise in both systems until the fault is cleared on either the AC or the DC side.
Based on the fault behaviour of pure UGC and pure OHL systems, different mixed topologies are analysed taking into account both P2P and MTDC systems as well as hybrid AC-DC transmission arrangements.
4.1 Point-to-point DC systems
In a first step, the effect of a single UGC-OHL interface on the transient voltage and current characteristics during line faults is analysed. As indicated in Fig. 4-2, two exemplifying pole-to-ground fault locations, F75 and F225, are studied for this purpose in a simple mixed transmission topology. Both faults are evoked at the respective centres of the two line sections. The resulting transients are recorded at the line ends as well as the UGC-OHL interface in the middle of the line.
The simulation results show that even for simple mixed transmission line setups comprising just a single UGC and a single OHL segment, significant differences occur in the transient system behaviour for different fault scenarios. At Station 1, the UGC fault F75 causes a steep voltage drop and initial current rise with the arrival of the first travelling wave at ∆tsim ≈ 0.4 ms after fault initiation. Due to the decoupling of both sides of the system by the fault location, the observed behaviour does not differ to a similar pole-to-ground fault in pure UGC systems (cf. Fig. 4-1). The same principle applies for the behaviour observed at Station 2 in case of the fault F225 on the OHL segment.
If a fault occurs on the respective distant segment, travelling wave reflection and transmission effects at the UGC-OHL interface have a direct impact on the initial transient voltage and current characteristics at the line ends. At Station 1, the voltage wave arriving at ∆tsim ≈ 1.1 ms after initiation of the fault F225 is
Analysis of topological impacts on the transient behaviour 41
noticeably distorted and reduced in amplitude, as the wave propagating from the fault location towards Station 1 is in part reflected negatively at the UGC-OHL interface. In the given example, the characteristic impedance ratio of the two line segments, ZOHL/ZUGC ≈ 6.2, results in voltage reflection and transmission coefficients of Γv,OHL UGC ≈ -0.72 and ρv,OHL UGC ≈ 0.28 at the transition (cf. equations (2.8) and (2.10)). At the UGC termination at Station 1, the initial voltage derivative, which is also the maximum derivative, varies between dv/dtinit ≈ 123.2 pu/ms for F75 and dv/dtinit ≈ 2.5 pu/ms for F225. While an immediate voltage drop to vdc ≤ 0 pu occurs for the UGC fault, the voltage decays to zero over the course of ∆tvz ≈ 3.0 ms for the OHL fault. As a result, the current fed in from the converter station increases significantly slower for F225 compared to F75 (di/dtinit ≈ 2.9 pu/ms for F75, di/dtinit ≈ 0.3 pu/ms for F225).
Opposite effects are observed at the OHL termination at Station 2. In case of a voltage wave propagating from F75 towards the line end, the UGC-to-OHL interface yields a positive reflection coefficient of Γv,UGC OHL ≈ 0.72 and a transmission coefficient of ρv,UGC OHL ≈ 1.72 resulting in an amplification of the voltage wave front. Hence, in case of the UGC fault at F75, an even deeper and similarly steep voltage drop to vdc < -1 pu occurs at Station 2 compared to the F225 fault or a similar fault scenario in a pure OHL system (cf. Fig. 4-1). Accordingly,
Fig. 4-2: Transient voltage and current characteristics during UGC and OHL pole-to-ground faults in an exemplifying mixed transmission topology
0.0 2.0 4.0 6.0 8.0 10.00.0 2.0 4.0 6.0 8.0 10.0
-1
-0.5
0
0.5
1
0.0 2.0 4.0 6.0 8.0 10.0
-1
0
1
2
3
4
Station 2UGC-OHL interfaceStation 1
OHL (150 km)UGC (150 km)
Station 2Station 1 F75 F225
F75F225
Δtsim [ms]Δtsim [ms]Δtsim [ms]
v dc[p
u]i d
c[p
u]
42 Analysis of topological impacts on the transient behaviour
the pole current rises faster than for the fault F225 on the OHL segment (di/dtinit ≈ 4.1 pu/ms for F75, di/dtinit ≈ 2.4 pu/ms for F225).
At the UGC-OHL interface, both transitional effects are apparent in the voltage characteristic. In addition, a significantly higher fault current is recorded at the transition point compared to the line ends due to the transient discharge of distributed line capacitances7. For the OHL fault F225, a peak current of idc ≈ 4.8 pu occurs, as the energy stored inside the cable capacitances discharges into the fault location. It is to be noted though that the actual current rise at the line terminations not only depends on the line topology and fault location, but also on the type of HVDC scheme and the size of the lumped inductances installed in the converter stations, which in turn are designed based on specific component ratings, the fault clearing strategy etc. The extent of the impact of UGC-OHL interfaces on the transient current characteristics may change depending on the given system setup. In most cases, analysing the terminal voltages gives a clearer impression of the topological impacts than analysing the current profiles. Terminal voltages are therefore emphasised in the following investigations.
To investigate the impact of multiple UGC-OHL transitions on the transient fault behaviour, the mixed transmission topology depicted in Fig. 4-3 comprising six line segments is analysed and compared to a pure UGC system. Pole-to-ground faults are evoked at both line terminations and in 10-km-intervals along the entire transmission system (fault locations F0 to F300).
In the pure UGC system (upper figures), the amplitude and rate of change of the voltage drop after fault occurrence are determined by the distance between the fault location and the line ends. Nearby faults cause an almost immediate voltage drop below zero, whereas a more attenuated characteristic is observed for distant faults due to wave propagation losses (cf. equation (2.5)). Nonetheless, even in case of a fault at the very end of the transmission line, i.e. at a distance of ∆xfault = 300 km to the opposite line end, the DC pole voltage breaks down to vdc ≤ 0 pu in less than ∆tvz ≤ 0.1 ms after travelling wave arrival with an initial and maximum voltage derivative of dv/dtinit = dv/dtmax ≈ 14.1 pu/ms.
The mixed topology (bottom figures) offers a wider range of transient voltage characteristics. At both line ends, the behaviour observed for faults on the nearest segment is equivalent to the behaviour for pure UGC or pure OHL systems, respectively. On the other hand, any fault occurring on one of the transmission segments located behind the outer segments results in a distorted voltage profile,
7 current recorded with positive sign in direction from the UCG segment towards the OHL segment

Analysis of topological impacts on the transient behaviour 43
most noticeably characterised by a flattened wave front and a subsequent attenuated decay of the pole voltage. In case of a fault at the opposite line termination, F300, up to ∆tvz ≈ 3.1 ms elapse until the DC pole voltage drops below zero. Accordingly, the range of initial and maximum voltage derivatives is significantly wider compared to the pure UGC system with values as low as dv/dtinit ≈ 0.1 pu/ms and dv/dtmax ≈ 0.7 pu/ms.
For the OHL termination at Station 2, the different fault locations can be categorised into three groups. Faults on the outer OHL segment, F250 to F300, cause a behaviour similar to a pure OHL system resulting in an immediate steep voltage drop. In case of a fault located on the subsequent UGC segment, an even steeper breakdown characteristic is recorded due to the amplification of voltage waves propagating from the faulted UGC segment onto the outer OHL segment. Any fault occurring on one of the farther located segments results in a similarly attenuated characteristic as observed for Station 1. In this case, the attenuating effect of multiple interfaces outweighs the amplification of the final UGC-to-OHL transition. This principle is illustrated in Fig. 4-4 for the overall voltage transmission coefficient, ρv,overall = ρv,1 ∙ ρv,2 ∙ … ∙ ρv,n, taking into account different
Fig. 4-3: Impact of multiple UGC-OHL interfaces on the transient DC voltage profile
0.0 2.0 4.0 6.0 8.0 10.0
-1.5
-1
-0.5
0
0.5
1
1.5
0.0 2.0 4.0 6.0 8.0 10.0
-1.5
-1
-0.5
0
0.5
1
1.5
Station 1
UGC (50 km)
OHL (50 km)
UGC (50 km)
OHL (50 km)
OHL (50 km)
UGC (50 km)
F0 F10
Station 1
UGC (300 km)
F0 F10
Station 2F300
Station 2F300
Station 2Station 1
F0
F300
F300
F0
F0
F300
F300
F0
Δtsim [ms]Δtsim [ms]
v dc[p
u], m
ixed
v dc[p
u], U
GC
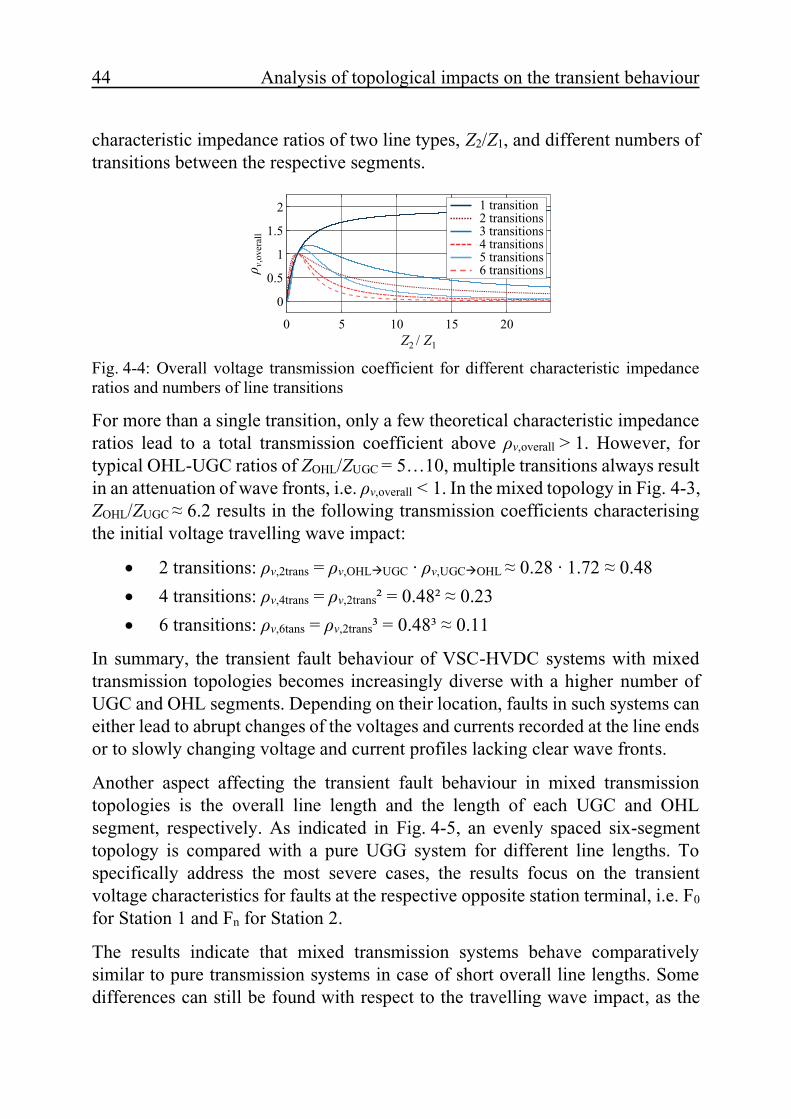
44 Analysis of topological impacts on the transient behaviour
characteristic impedance ratios of two line types, Z2/Z1, and different numbers of transitions between the respective segments.
For more than a single transition, only a few theoretical characteristic impedance ratios lead to a total transmission coefficient above ρv,overall > 1. However, for typical OHL-UGC ratios of ZOHL/ZUGC = 5…10, multiple transitions always result in an attenuation of wave fronts, i.e. ρv,overall < 1. In the mixed topology in Fig. 4-3, ZOHL/ZUGC ≈ 6.2 results in the following transmission coefficients characterising the initial voltage travelling wave impact:
2 transitions: ρv,2trans = ρv,OHL UGC ∙ ρv,UGC OHL ≈ 0.28 ∙ 1.72 ≈ 0.48
4 transitions: ρv,4trans = ρv,2trans² = 0.48² ≈ 0.23
6 transitions: ρv,6tans = ρv,2trans³ = 0.48³ ≈ 0.11
In summary, the transient fault behaviour of VSC-HVDC systems with mixed transmission topologies becomes increasingly diverse with a higher number of UGC and OHL segments. Depending on their location, faults in such systems can either lead to abrupt changes of the voltages and currents recorded at the line ends or to slowly changing voltage and current profiles lacking clear wave fronts.
Another aspect affecting the transient fault behaviour in mixed transmission topologies is the overall line length and the length of each UGC and OHL segment, respectively. As indicated in Fig. 4-5, an evenly spaced six-segment topology is compared with a pure UGG system for different line lengths. To specifically address the most severe cases, the results focus on the transient voltage characteristics for faults at the respective opposite station terminal, i.e. F0 for Station 1 and Fn for Station 2.
The results indicate that mixed transmission systems behave comparatively similar to pure transmission systems in case of short overall line lengths. Some differences can still be found with respect to the travelling wave impact, as the
Fig. 4-4: Overall voltage transmission coefficient for different characteristic impedance ratios and numbers of line transitions
0 5 10 15 20
0
0.5
1
1.5
2 1 transition2 transitions3 transitions4 transitions5 transitions6 transitions
Z2 / Z1
ρ v,o
vera
ll
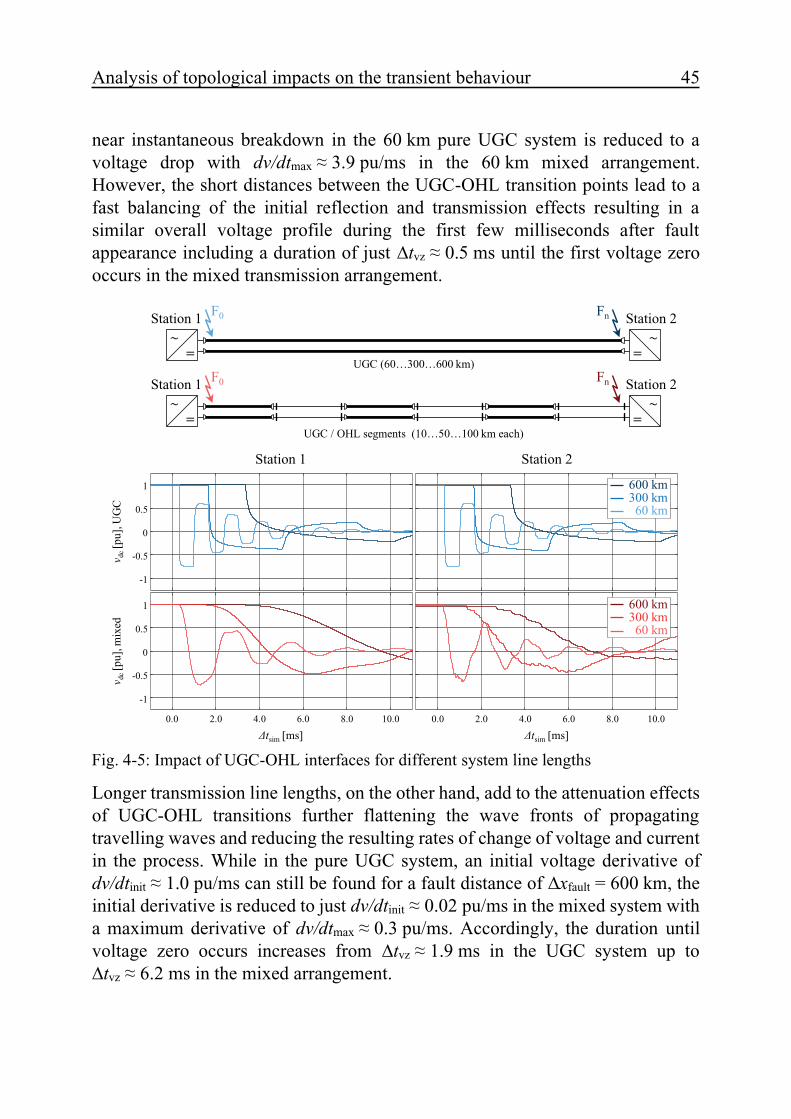
Analysis of topological impacts on the transient behaviour 45
near instantaneous breakdown in the 60 km pure UGC system is reduced to a voltage drop with dv/dtmax ≈ 3.9 pu/ms in the 60 km mixed arrangement. However, the short distances between the UGC-OHL transition points lead to a fast balancing of the initial reflection and transmission effects resulting in a similar overall voltage profile during the first few milliseconds after fault appearance including a duration of just ∆tvz ≈ 0.5 ms until the first voltage zero occurs in the mixed transmission arrangement.
Longer transmission line lengths, on the other hand, add to the attenuation effects of UGC-OHL transitions further flattening the wave fronts of propagating travelling waves and reducing the resulting rates of change of voltage and current in the process. While in the pure UGC system, an initial voltage derivative of dv/dtinit ≈ 1.0 pu/ms can still be found for a fault distance of ∆xfault = 600 km, the initial derivative is reduced to just dv/dtinit ≈ 0.02 pu/ms in the mixed system with a maximum derivative of dv/dtmax ≈ 0.3 pu/ms. Accordingly, the duration until voltage zero occurs increases from ∆tvz ≈ 1.9 ms in the UGC system up to ∆tvz ≈ 6.2 ms in the mixed arrangement.
Fig. 4-5: Impact of UGC-OHL interfaces for different system line lengths
0.0 2.0 4.0 6.0 8.0 10.00.0 2.0 4.0 6.0 8.0 10.0
-1
-0.5
0
0.5
1
-1
-0.5
0
0.5
1
Station 1
UGC / OHL segments (10…50…100 km each)
F0
Station 1
UGC (60…300…600 km)
F0
Station 2Fn
Station 2Fn
Station 2Station 1
600 km300 km60 km
Δtsim [ms]Δtsim [ms]
v dc[p
u], m
ixed
v dc[p
u], U
GC
600 km300 km60 km
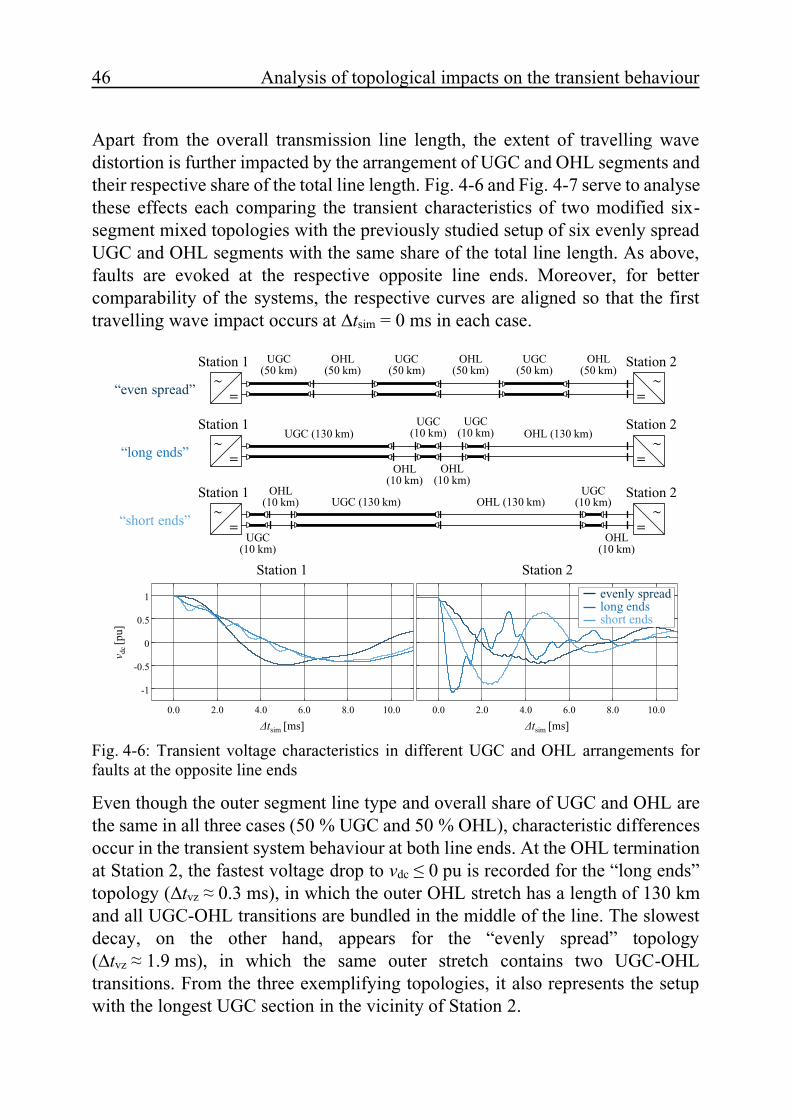
46 Analysis of topological impacts on the transient behaviour
Apart from the overall transmission line length, the extent of travelling wave distortion is further impacted by the arrangement of UGC and OHL segments and their respective share of the total line length. Fig. 4-6 and Fig. 4-7 serve to analyse these effects each comparing the transient characteristics of two modified six-segment mixed topologies with the previously studied setup of six evenly spread UGC and OHL segments with the same share of the total line length. As above, faults are evoked at the respective opposite line ends. Moreover, for better comparability of the systems, the respective curves are aligned so that the first travelling wave impact occurs at ∆tsim = 0 ms in each case.
Even though the outer segment line type and overall share of UGC and OHL are the same in all three cases (50 % UGC and 50 % OHL), characteristic differences occur in the transient system behaviour at both line ends. At the OHL termination at Station 2, the fastest voltage drop to vdc ≤ 0 pu is recorded for the “long ends” topology (∆tvz ≈ 0.3 ms), in which the outer OHL stretch has a length of 130 km and all UGC-OHL transitions are bundled in the middle of the line. The slowest decay, on the other hand, appears for the “evenly spread” topology (∆tvz ≈ 1.9 ms), in which the same outer stretch contains two UGC-OHL transitions. From the three exemplifying topologies, it also represents the setup with the longest UGC section in the vicinity of Station 2.
Fig. 4-6: Transient voltage characteristics in different UGC and OHL arrangements for faults at the opposite line ends
0.0 2.0 4.0 6.0 8.0 10.00.0 2.0 4.0 6.0 8.0 10.0
-1
-0.5
0
0.5
1
Station 2Station 1
Station 1 UGC (50 km)
OHL (50 km)
UGC (50 km)
OHL (50 km)
UGC(50 km)
“even spread”
Station 1UGC (130 km)
“long ends”OHL (130 km)
Station 1UGC (130 km)
“short ends”OHL (130 km)
OHL(10 km)
UGC(10 km)
Station 2OHL (50 km)
Station 2
Station 2UGC (10 km)
OHL(10 km)
UGC(10 km)
UGC(10 km)
OHL(10 km)
OHL(10 km)
evenly spreadlong endsshort ends
Δtsim [ms] Δtsim [ms]
v dc[p
u]
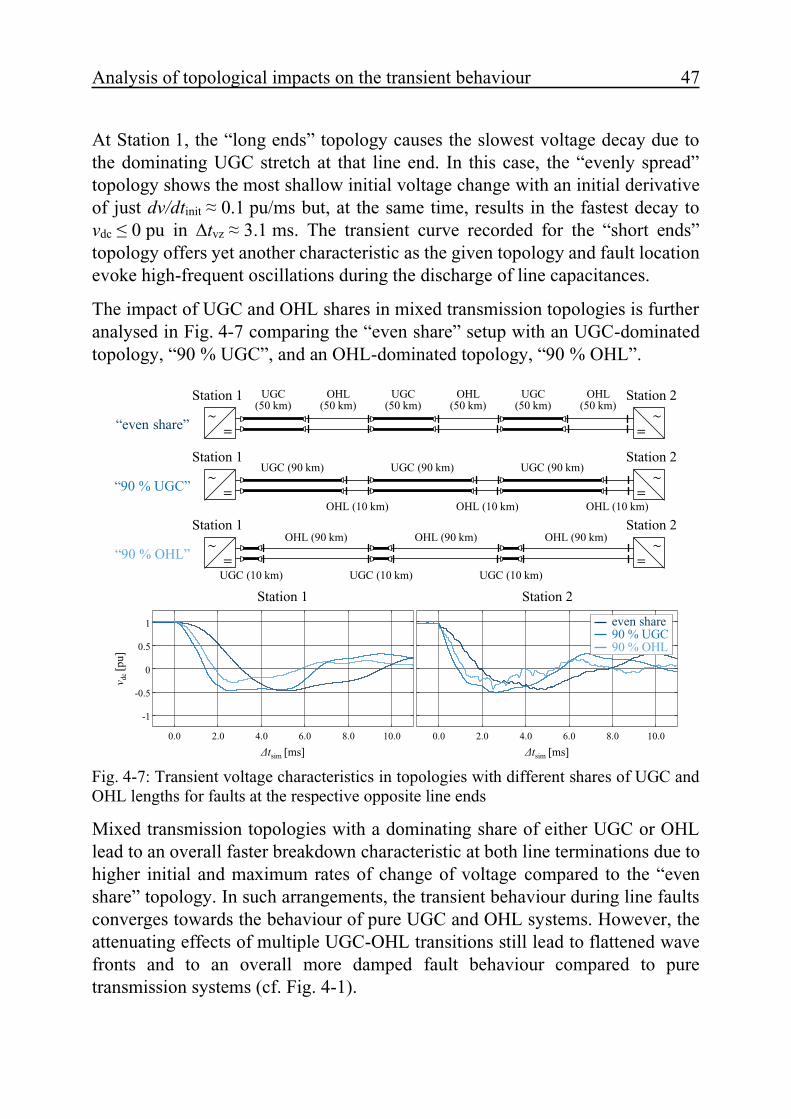
Analysis of topological impacts on the transient behaviour 47
At Station 1, the “long ends” topology causes the slowest voltage decay due to the dominating UGC stretch at that line end. In this case, the “evenly spread” topology shows the most shallow initial voltage change with an initial derivative of just dv/dtinit ≈ 0.1 pu/ms but, at the same time, results in the fastest decay to vdc ≤ 0 pu in ∆tvz ≈ 3.1 ms. The transient curve recorded for the “short ends” topology offers yet another characteristic as the given topology and fault location evoke high-frequent oscillations during the discharge of line capacitances.
The impact of UGC and OHL shares in mixed transmission topologies is further analysed in Fig. 4-7 comparing the “even share” setup with an UGC-dominated topology, “90 % UGC”, and an OHL-dominated topology, “90 % OHL”.
Mixed transmission topologies with a dominating share of either UGC or OHL lead to an overall faster breakdown characteristic at both line terminations due to higher initial and maximum rates of change of voltage compared to the “even share” topology. In such arrangements, the transient behaviour during line faults converges towards the behaviour of pure UGC and OHL systems. However, the attenuating effects of multiple UGC-OHL transitions still lead to flattened wave fronts and to an overall more damped fault behaviour compared to pure transmission systems (cf. Fig. 4-1).
Fig. 4-7: Transient voltage characteristics in topologies with different shares of UGC and OHL lengths for faults at the respective opposite line ends
0.0 2.0 4.0 6.0 8.0 10.00.0 2.0 4.0 6.0 8.0 10.0
-1
-0.5
0
0.5
1
Station 2Station 1
even share90 % UGC90 % OHL
Station 2
Station 2
Station 2
Station 1UGC (90 km)
OHL (10 km)
UGC (90 km)
OHL (10 km)OHL (10 km)
UGC (90 km)
“90 % UGC”
Station 1 UGC (50 km)
OHL (50 km)
UGC (50 km)
OHL (50 km)
OHL (50 km)
UGC(50 km)
“even share”
“90 % OHL”
Station 1OHL (90 km)
UGC (10 km)
OHL (90 km)
UGC (10 km) UGC (10 km)
OHL (90 km)
v dc[p
u]
Δtsim [ms] Δtsim [ms]
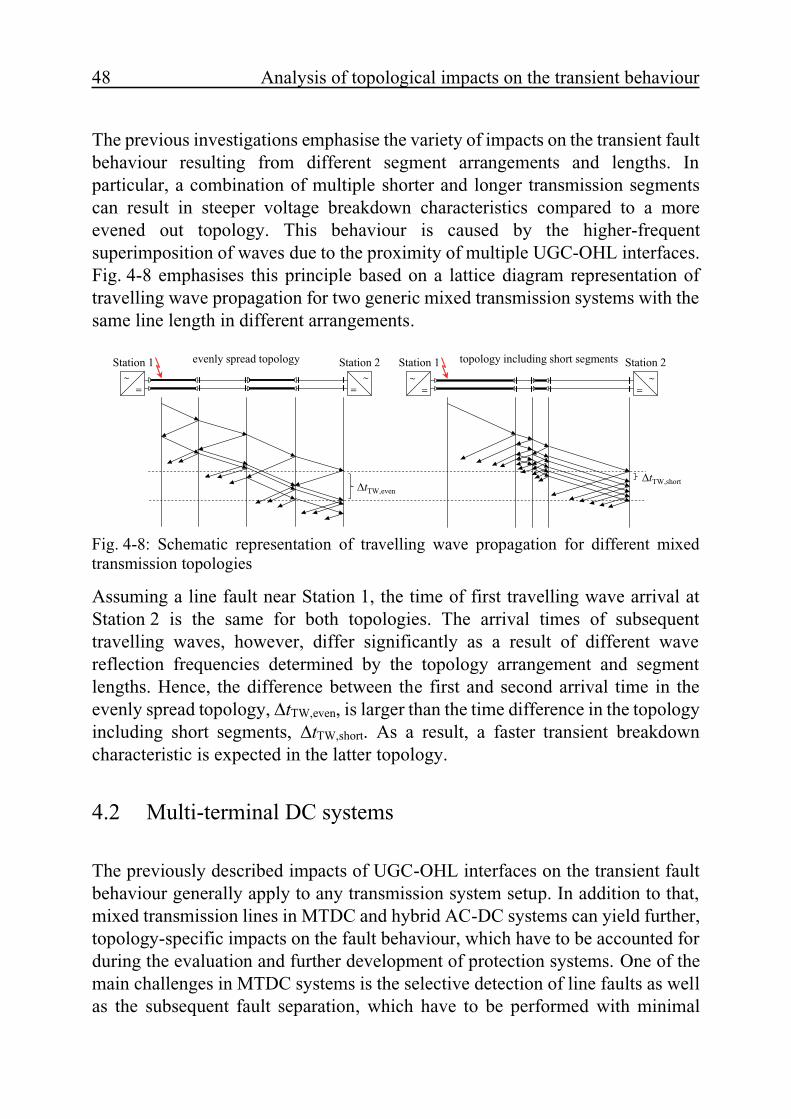
48 Analysis of topological impacts on the transient behaviour
The previous investigations emphasise the variety of impacts on the transient fault behaviour resulting from different segment arrangements and lengths. In particular, a combination of multiple shorter and longer transmission segments can result in steeper voltage breakdown characteristics compared to a more evened out topology. This behaviour is caused by the higher-frequent superimposition of waves due to the proximity of multiple UGC-OHL interfaces. Fig. 4-8 emphasises this principle based on a lattice diagram representation of travelling wave propagation for two generic mixed transmission systems with the same line length in different arrangements.
Assuming a line fault near Station 1, the time of first travelling wave arrival at Station 2 is the same for both topologies. The arrival times of subsequent travelling waves, however, differ significantly as a result of different wave reflection frequencies determined by the topology arrangement and segment lengths. Hence, the difference between the first and second arrival time in the evenly spread topology, ∆tTW,even, is larger than the time difference in the topology including short segments, ∆tTW,short. As a result, a faster transient breakdown characteristic is expected in the latter topology.
4.2 Multi-terminal DC systems
The previously described impacts of UGC-OHL interfaces on the transient fault behaviour generally apply to any transmission system setup. In addition to that, mixed transmission lines in MTDC and hybrid AC-DC systems can yield further, topology-specific impacts on the fault behaviour, which have to be accounted for during the evaluation and further development of protection systems. One of the main challenges in MTDC systems is the selective detection of line faults as well as the subsequent fault separation, which have to be performed with minimal
Fig. 4-8: Schematic representation of travelling wave propagation for different mixed transmission topologies
Station 2Station 1 evenly spread topology
∆tTW,even
Station 2Station 1 topology including short segments
∆tTW,short
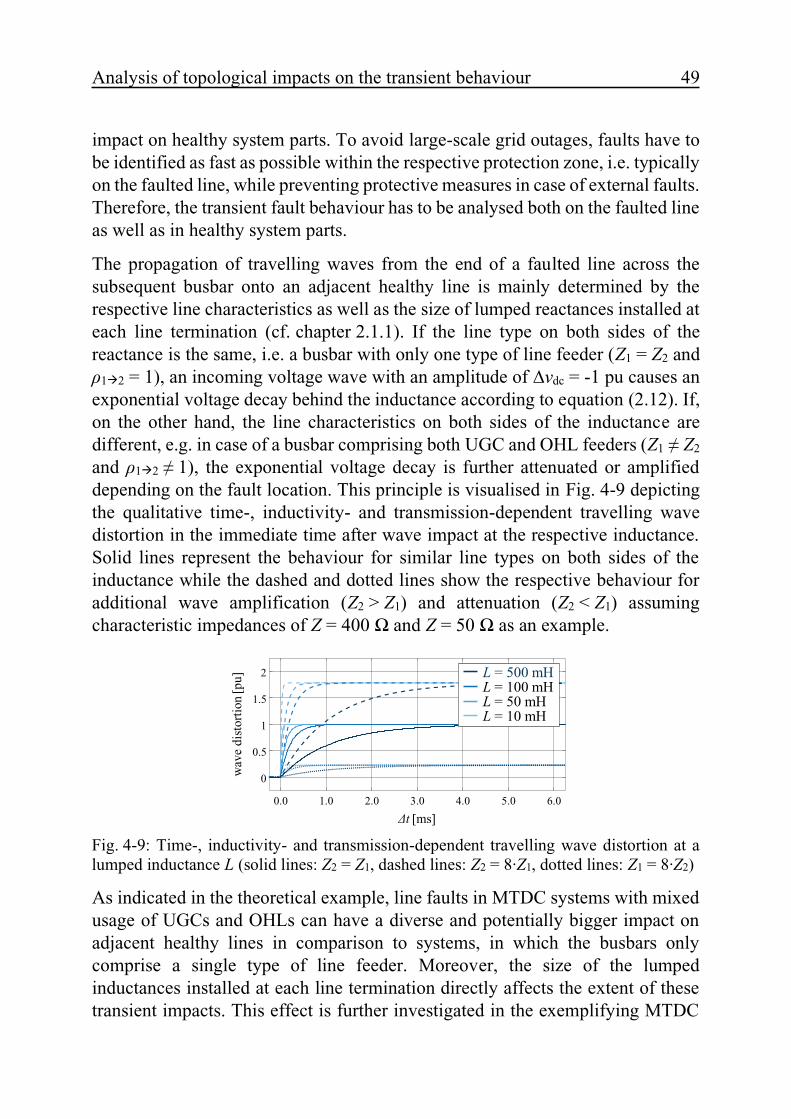
Analysis of topological impacts on the transient behaviour 49
impact on healthy system parts. To avoid large-scale grid outages, faults have to be identified as fast as possible within the respective protection zone, i.e. typically on the faulted line, while preventing protective measures in case of external faults. Therefore, the transient fault behaviour has to be analysed both on the faulted line as well as in healthy system parts.
The propagation of travelling waves from the end of a faulted line across the subsequent busbar onto an adjacent healthy line is mainly determined by the respective line characteristics as well as the size of lumped reactances installed at each line termination (cf. chapter 2.1.1). If the line type on both sides of the reactance is the same, i.e. a busbar with only one type of line feeder (Z1 = Z2 and ρ1 2 = 1), an incoming voltage wave with an amplitude of ∆vdc = -1 pu causes an exponential voltage decay behind the inductance according to equation (2.12). If, on the other hand, the line characteristics on both sides of the inductance are different, e.g. in case of a busbar comprising both UGC and OHL feeders (Z1 ≠ Z2 and ρ1 2 ≠ 1), the exponential voltage decay is further attenuated or amplified depending on the fault location. This principle is visualised in Fig. 4-9 depicting the qualitative time-, inductivity- and transmission-dependent travelling wave distortion in the immediate time after wave impact at the respective inductance. Solid lines represent the behaviour for similar line types on both sides of the inductance while the dashed and dotted lines show the respective behaviour for additional wave amplification (Z2 > Z1) and attenuation (Z2 < Z1) assuming characteristic impedances of Z = 400 Ω and Z = 50 Ω as an example.
As indicated in the theoretical example, line faults in MTDC systems with mixed usage of UGCs and OHLs can have a diverse and potentially bigger impact on adjacent healthy lines in comparison to systems, in which the busbars only comprise a single type of line feeder. Moreover, the size of the lumped inductances installed at each line termination directly affects the extent of these transient impacts. This effect is further investigated in the exemplifying MTDC
Fig. 4-9: Time-, inductivity- and transmission-dependent travelling wave distortion at a lumped inductance L (solid lines: Z2 = Z1, dashed lines: Z2 = 8∙Z1, dotted lines: Z1 = 8∙Z2)
0.0 1.0 2.0 3.0 4.0 5.0 6.0
0
0.5
1
1.5
2 L = 500 mHL = 100 mHL = 50 mHL = 10 mH
Δt [ms]
wav
edi
stor
tion
[pu]
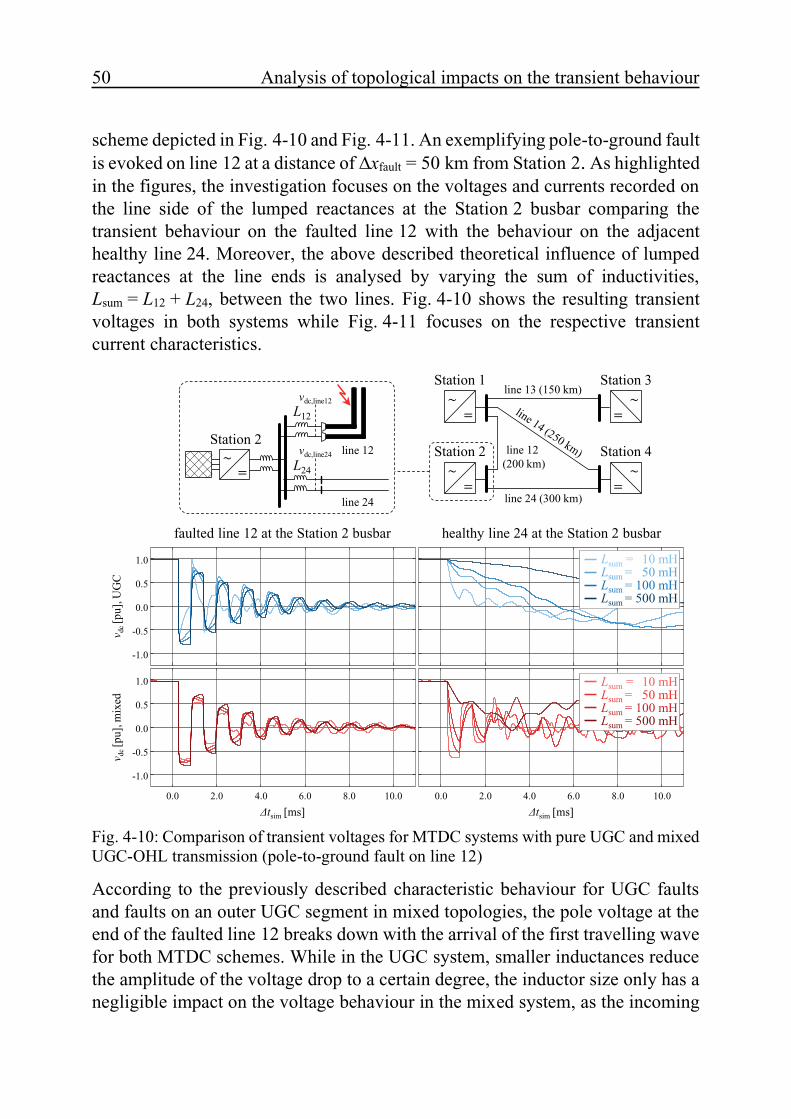
50 Analysis of topological impacts on the transient behaviour
scheme depicted in Fig. 4-10 and Fig. 4-11. An exemplifying pole-to-ground fault is evoked on line 12 at a distance of ∆xfault = 50 km from Station 2. As highlighted in the figures, the investigation focuses on the voltages and currents recorded on the line side of the lumped reactances at the Station 2 busbar comparing the transient behaviour on the faulted line 12 with the behaviour on the adjacent healthy line 24. Moreover, the above described theoretical influence of lumped reactances at the line ends is analysed by varying the sum of inductivities, Lsum = L12 + L24, between the two lines. Fig. 4-10 shows the resulting transient voltages in both systems while Fig. 4-11 focuses on the respective transient current characteristics.
According to the previously described characteristic behaviour for UGC faults and faults on an outer UGC segment in mixed topologies, the pole voltage at the end of the faulted line 12 breaks down with the arrival of the first travelling wave for both MTDC schemes. While in the UGC system, smaller inductances reduce the amplitude of the voltage drop to a certain degree, the inductor size only has a negligible impact on the voltage behaviour in the mixed system, as the incoming
Fig. 4-10: Comparison of transient voltages for MTDC systems with pure UGC and mixed UGC-OHL transmission (pole-to-ground fault on line 12)
0.0 2.0 4.0 6.0 8.0 10.00.0 2.0 4.0 6.0 8.0 10.0
-1.0
-0.5
0.0
0.5
1.0
-1.0
-0.5
0.0
0.5
1.0
healthy line 24 at the Station 2 busbarfaulted line 12 at the Station 2 busbar
Lsum = 10 mHLsum = 50 mHLsum = 100 mHLsum = 500 mH
Station 3Station 1
Station 4Station 2Station 2
L12
L24
line 24 (300 km)
line 12(200 km)
line 12
line 24
vdc,line12
vdc,line24
line 13 (150 km)
Lsum = 10 mHLsum = 50 mHLsum = 100 mHLsum = 500 mH
Δtsim [ms] Δtsim [ms]
v dc[p
u], m
ixed
v dc[p
u], U
GC

Analysis of topological impacts on the transient behaviour 51
travelling waves are not only reflected at the inductances but at the interface to the OHL transmission line 24 as well.
The biggest difference between the two systems is found on the adjacent healthy line. In the pure UGC system, the fault impact on line 24 can be reduced noticeably by increasing the inductivity between the two lines. An inductivity of Lsum = 10 mH leads to an almost immediate voltage decay on the healthy line 24 following the breakdown on the faulted line 12 (dv/dtinit ≈ 2.8 pu/ms and ∆tvz ≈ 1.4 ms). If an inductivity of Lsum = 100 mH is used, the initial voltage derivative can already be reduced to dv/dtinit ≈ 0.3 pu/ms and the time delay until the voltage crosses zero increases to ∆tvz ≈ 5.0 ms. Larger inductances can delay the fault impact even further. In the mixed MTDC topology, the same degree of decoupling cannot be accomplished as easily due to the UGC-to-OHL transition of the travelling waves propagating from line 12 onto line 24. An inductivity of Lsum = 100 mH still results in an almost immediate voltage breakdown on line 24 (∆tvz ≈ 0.3 ms). Even an inductivity of Lsum = 500 mH can only delay the time until voltage zero occurs to ∆tvz ≈ 2.8 ms, as the transient behaviour is dominated by a transmission coefficient of ρv,12 24 > 1 outweighing the decoupling effect of the lumped inductances. Hence, the healthy transmission line as well as the busbar and the converter station terminal are subject to a severe transient voltage drop during the UGC fault, which has to be taken into account during the layout and parametrisation of the respective protection systems.
In case of an OHL fault on line 24 and the resulting wave propagation via the Station 2 busbar onto the healthy UGC line 12, the transient fault behaviour is defined by the OHL-to-UGC transition effects previously described in chapter 4.1. In this case, the impact of the lumped reactances increases and the voltage waves propagating onto the UGC line 12 are noticeable attenuated (cf. curves in appendix A2). For the most part, the transient fault effects are limited to the affected OHL. Hence, this type of fault case is not expected to represent a particular challenge for the protection systems.
The impact of different lumped reactances on the transient current behaviour in pure UGC and mixed UGC-OHL MTDC systems is depicted in Fig. 4-11 for the above discussed line 12 fault. In the pure UGC system, the inductor size has a significant impact on the initial current derivative (di/dtinit ≈ 32.8 pu/ms for Lsum = 10 mH and di/dtinit ≈ 0.9 pu/ms for Lsum = 500 mH) as well as the maximum fault current amplitude in the relevant time frame for DC line protection. Moreover, inductivities in the range of several tens of millihenry and above noticeably reduce the high-frequent oscillations during this time resulting
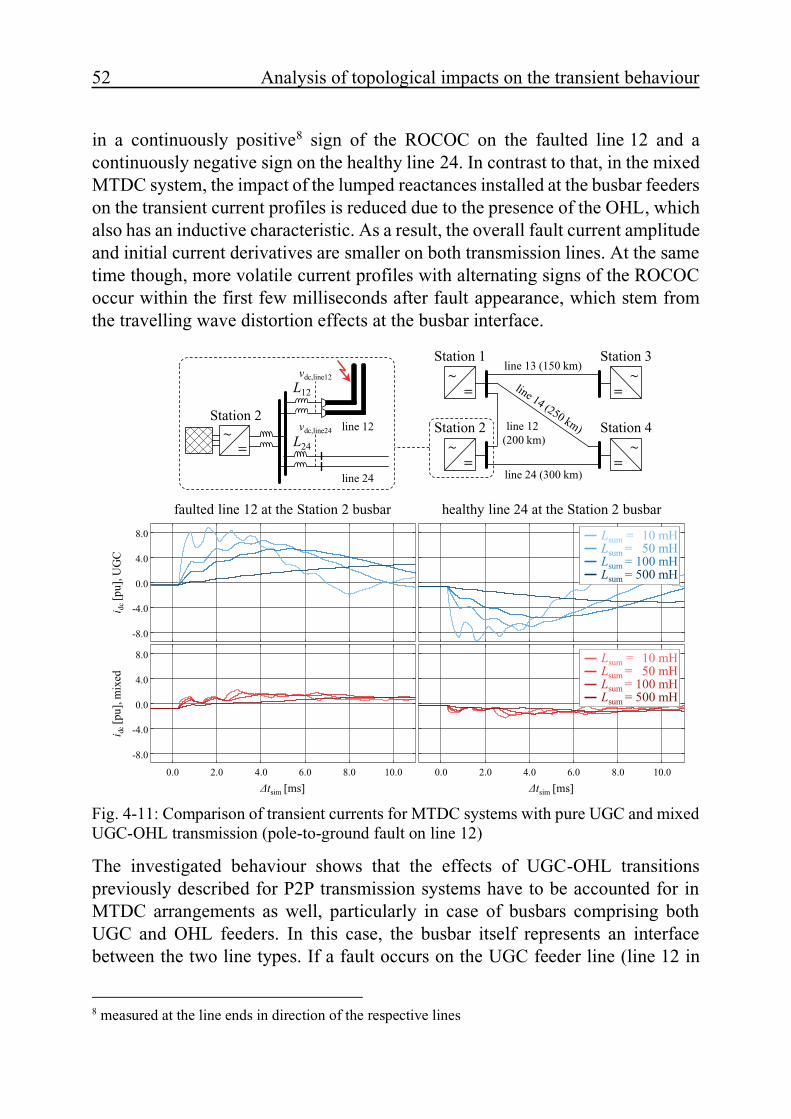
52 Analysis of topological impacts on the transient behaviour
in a continuously positive8 sign of the ROCOC on the faulted line 12 and a continuously negative sign on the healthy line 24. In contrast to that, in the mixed MTDC system, the impact of the lumped reactances installed at the busbar feeders on the transient current profiles is reduced due to the presence of the OHL, which also has an inductive characteristic. As a result, the overall fault current amplitude and initial current derivatives are smaller on both transmission lines. At the same time though, more volatile current profiles with alternating signs of the ROCOC occur within the first few milliseconds after fault appearance, which stem from the travelling wave distortion effects at the busbar interface.
The investigated behaviour shows that the effects of UGC-OHL transitions previously described for P2P transmission systems have to be accounted for in MTDC arrangements as well, particularly in case of busbars comprising both UGC and OHL feeders. In this case, the busbar itself represents an interface between the two line types. If a fault occurs on the UGC feeder line (line 12 in
8 measured at the line ends in direction of the respective lines
Fig. 4-11: Comparison of transient currents for MTDC systems with pure UGC and mixed UGC-OHL transmission (pole-to-ground fault on line 12)
0.0 2.0 4.0 6.0 8.0 10.0
-8.0
-4.0
0.0
4.0
8.0
-8.0
-4.0
0.0
4.0
8.0
0.0 2.0 4.0 6.0 8.0 10.0
healthy line 24 at the Station 2 busbarfaulted line 12 at the Station 2 busbar
Station 3Station 1
Station 4Station 2
line 24 (300 km)
line 12(200 km)
line 13 (150 km)
Station 2
L12
L24
line 12
line 24
vdc,line12
vdc,line24
Lsum = 10 mHLsum = 50 mHLsum = 100 mHLsum = 500 mH
Lsum = 10 mHLsum = 50 mHLsum = 100 mHLsum = 500 mH
Δtsim [ms] Δtsim [ms]
i dc[p
u], m
ixed
i dc[p
u], U
GC
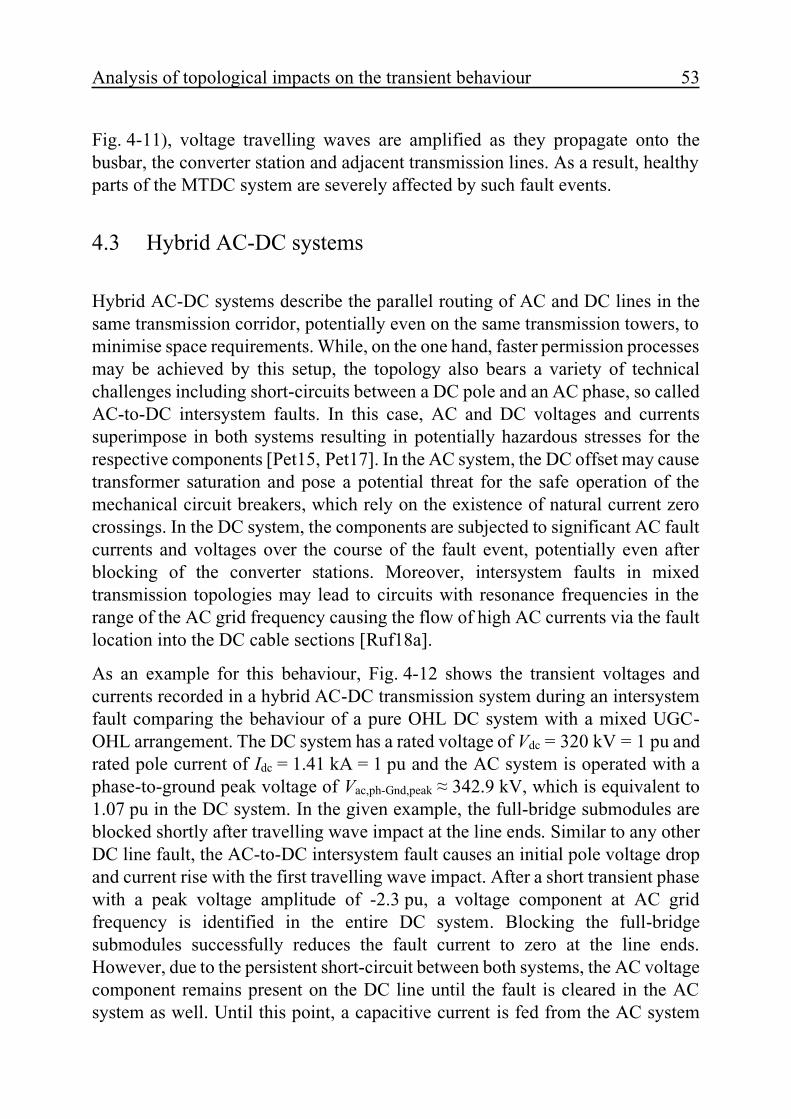
Analysis of topological impacts on the transient behaviour 53
Fig. 4-11), voltage travelling waves are amplified as they propagate onto the busbar, the converter station and adjacent transmission lines. As a result, healthy parts of the MTDC system are severely affected by such fault events.
4.3 Hybrid AC-DC systems
Hybrid AC-DC systems describe the parallel routing of AC and DC lines in the same transmission corridor, potentially even on the same transmission towers, to minimise space requirements. While, on the one hand, faster permission processes may be achieved by this setup, the topology also bears a variety of technical challenges including short-circuits between a DC pole and an AC phase, so called AC-to-DC intersystem faults. In this case, AC and DC voltages and currents superimpose in both systems resulting in potentially hazardous stresses for the respective components [Pet15, Pet17]. In the AC system, the DC offset may cause transformer saturation and pose a potential threat for the safe operation of the mechanical circuit breakers, which rely on the existence of natural current zero crossings. In the DC system, the components are subjected to significant AC fault currents and voltages over the course of the fault event, potentially even after blocking of the converter stations. Moreover, intersystem faults in mixed transmission topologies may lead to circuits with resonance frequencies in the range of the AC grid frequency causing the flow of high AC currents via the fault location into the DC cable sections [Ruf18a].
As an example for this behaviour, Fig. 4-12 shows the transient voltages and currents recorded in a hybrid AC-DC transmission system during an intersystem fault comparing the behaviour of a pure OHL DC system with a mixed UGC-OHL arrangement. The DC system has a rated voltage of Vdc = 320 kV = 1 pu and rated pole current of Idc = 1.41 kA = 1 pu and the AC system is operated with a phase-to-ground peak voltage of Vac,ph-Gnd,peak ≈ 342.9 kV, which is equivalent to 1.07 pu in the DC system. In the given example, the full-bridge submodules are blocked shortly after travelling wave impact at the line ends. Similar to any other DC line fault, the AC-to-DC intersystem fault causes an initial pole voltage drop and current rise with the first travelling wave impact. After a short transient phase with a peak voltage amplitude of -2.3 pu, a voltage component at AC grid frequency is identified in the entire DC system. Blocking the full-bridge submodules successfully reduces the fault current to zero at the line ends. However, due to the persistent short-circuit between both systems, the AC voltage component remains present on the DC line until the fault is cleared in the AC system as well. Until this point, a capacitive current is fed from the AC system
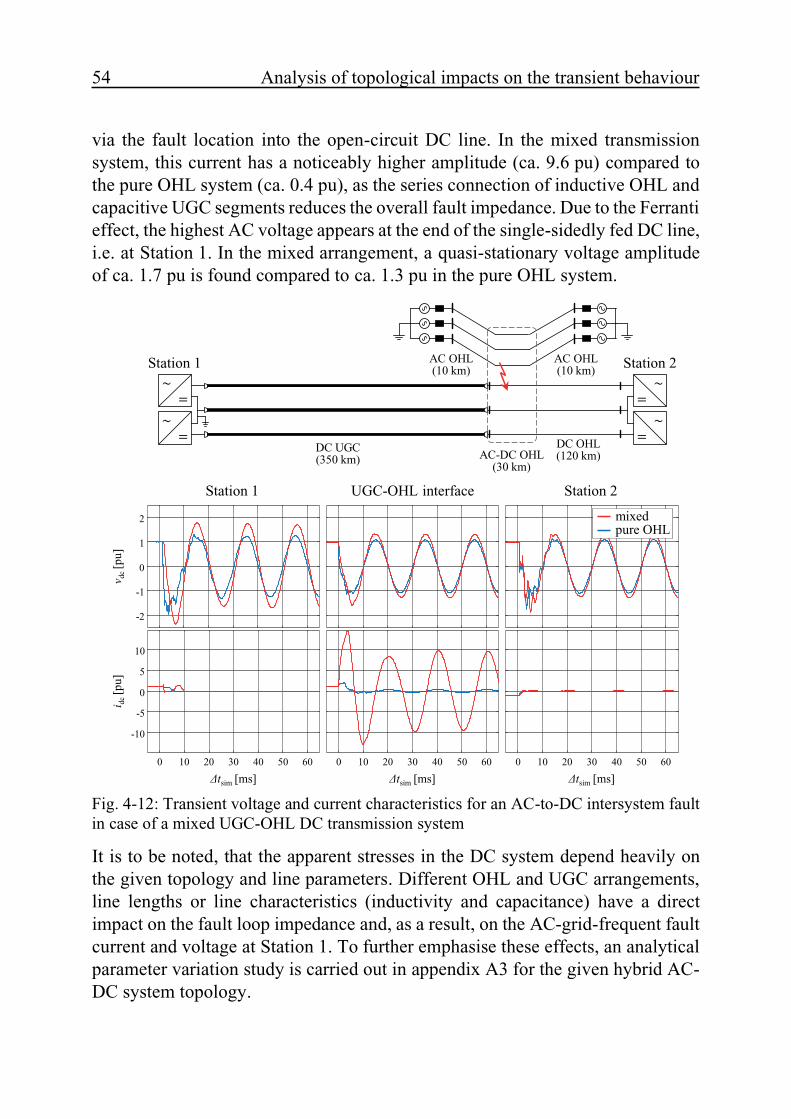
54 Analysis of topological impacts on the transient behaviour
via the fault location into the open-circuit DC line. In the mixed transmission system, this current has a noticeably higher amplitude (ca. 9.6 pu) compared to the pure OHL system (ca. 0.4 pu), as the series connection of inductive OHL and capacitive UGC segments reduces the overall fault impedance. Due to the Ferranti effect, the highest AC voltage appears at the end of the single-sidedly fed DC line, i.e. at Station 1. In the mixed arrangement, a quasi-stationary voltage amplitude of ca. 1.7 pu is found compared to ca. 1.3 pu in the pure OHL system.
It is to be noted, that the apparent stresses in the DC system depend heavily on the given topology and line parameters. Different OHL and UGC arrangements, line lengths or line characteristics (inductivity and capacitance) have a direct impact on the fault loop impedance and, as a result, on the AC-grid-frequent fault current and voltage at Station 1. To further emphasise these effects, an analytical parameter variation study is carried out in appendix A3 for the given hybrid AC-DC system topology.
Fig. 4-12: Transient voltage and current characteristics for an AC-to-DC intersystem fault in case of a mixed UGC-OHL DC transmission system
0 10 20 30 40 50 60
-10
-5
0
5
10
0 10 20 30 40 50 60 0 10 20 30 40 50 60
-2
-1
0
1
2
Station 2UGC-OHL interfaceStation 1
mixedpure OHL
Station 2Station 1
DC UGC (350 km)
DC OHL (120 km)AC-DC OHL
(30 km)
AC OHL(10 km)
AC OHL(10 km)
Δtsim [ms] Δtsim [ms] Δtsim [ms]
v dc[p
u]i d
c[p
u]
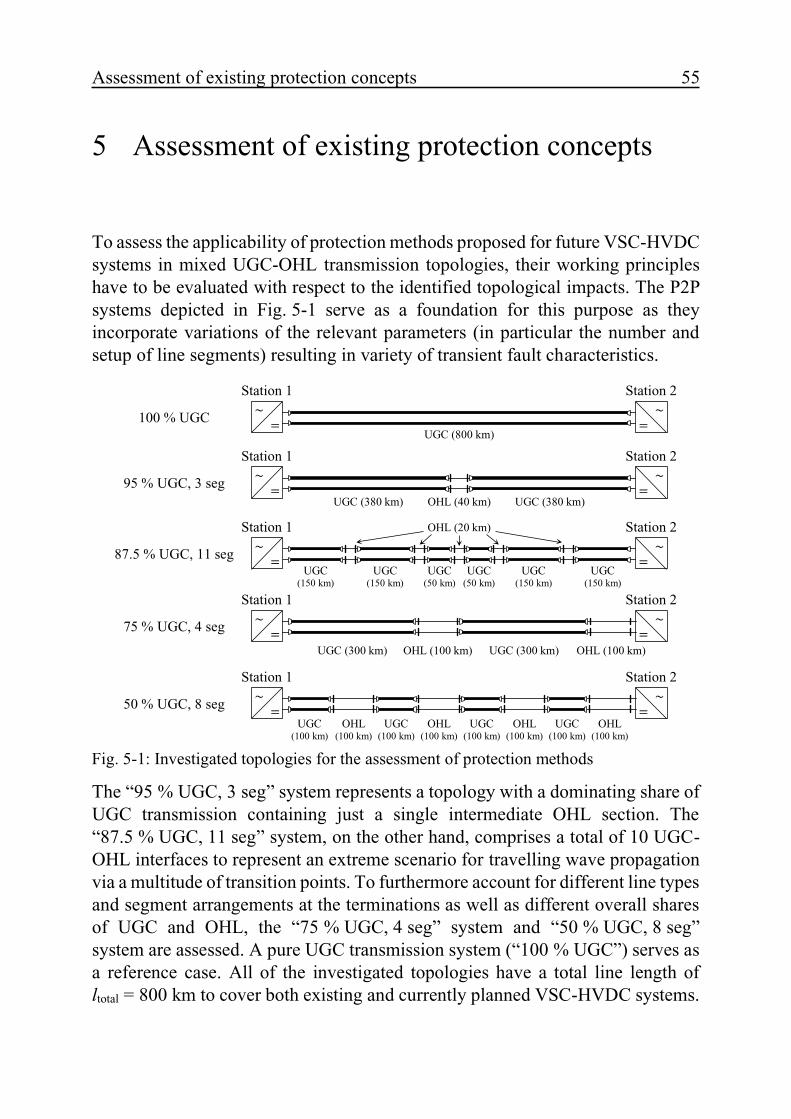
Assessment of existing protection concepts 55
5 Assessment of existing protection concepts
To assess the applicability of protection methods proposed for future VSC-HVDC systems in mixed UGC-OHL transmission topologies, their working principles have to be evaluated with respect to the identified topological impacts. The P2P systems depicted in Fig. 5-1 serve as a foundation for this purpose as they incorporate variations of the relevant parameters (in particular the number and setup of line segments) resulting in variety of transient fault characteristics.
The “95 % UGC, 3 seg” system represents a topology with a dominating share of UGC transmission containing just a single intermediate OHL section. The “87.5 % UGC, 11 seg” system, on the other hand, comprises a total of 10 UGC-OHL interfaces to represent an extreme scenario for travelling wave propagation via a multitude of transition points. To furthermore account for different line types and segment arrangements at the terminations as well as different overall shares of UGC and OHL, the “75 % UGC, 4 seg” system and “50 % UGC, 8 seg” system are assessed. A pure UGC transmission system (“100 % UGC”) serves as a reference case. All of the investigated topologies have a total line length of ltotal = 800 km to cover both existing and currently planned VSC-HVDC systems.
Fig. 5-1: Investigated topologies for the assessment of protection methods
Station 1
UGC (800 km)
Station 2
100 % UGC
Station 1
UGC (380 km) OHL (40 km) UGC (380 km)
Station 2
95 % UGC, 3 seg
Station 2Station 1
UGC (100 km)
OHL (100 km)
UGC (100 km)
OHL (100 km)
OHL (100 km)
UGC (100 km)
OHL (100 km)
UGC (100 km)
50 % UGC, 8 seg
Station 1 Station 2
UGC (300 km)UGC (300 km) OHL (100 km)OHL (100 km)
75 % UGC, 4 seg
Station 1
UGC (150 km)
Station 2
UGC (150 km)
UGC (150 km)
UGC (150 km)
UGC (50 km)
UGC (50 km)
OHL (20 km)
87.5 % UGC, 11 seg
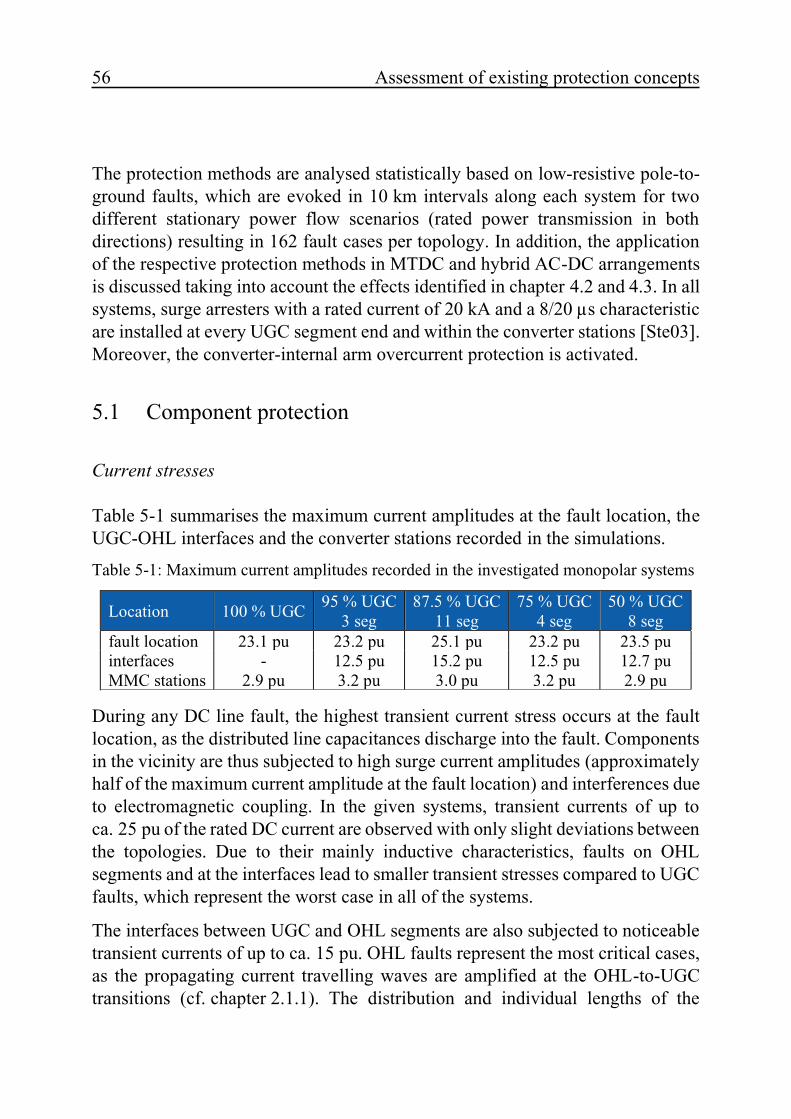
56 Assessment of existing protection concepts
The protection methods are analysed statistically based on low-resistive pole-to-ground faults, which are evoked in 10 km intervals along each system for two different stationary power flow scenarios (rated power transmission in both directions) resulting in 162 fault cases per topology. In addition, the application of the respective protection methods in MTDC and hybrid AC-DC arrangements is discussed taking into account the effects identified in chapter 4.2 and 4.3. In all systems, surge arresters with a rated current of 20 kA and a 8/20 µs characteristic are installed at every UGC segment end and within the converter stations [Ste03]. Moreover, the converter-internal arm overcurrent protection is activated.
5.1 Component protection
Current stresses
Table 5-1 summarises the maximum current amplitudes at the fault location, the UGC-OHL interfaces and the converter stations recorded in the simulations.
Table 5-1: Maximum current amplitudes recorded in the investigated monopolar systems
Location 100 % UGC 95 % UGC
3 seg 87.5 % UGC
11 seg 75 % UGC
4 seg 50 % UGC
8 seg fault location 23.1 pu 23.2 pu 25.1 pu 23.2 pu 23.5 pu interfaces - 12.5 pu 15.2 pu 12.5 pu 12.7 pu MMC stations 2.9 pu 3.2 pu 3.0 pu 3.2 pu 2.9 pu
During any DC line fault, the highest transient current stress occurs at the fault location, as the distributed line capacitances discharge into the fault. Components in the vicinity are thus subjected to high surge current amplitudes (approximately half of the maximum current amplitude at the fault location) and interferences due to electromagnetic coupling. In the given systems, transient currents of up to ca. 25 pu of the rated DC current are observed with only slight deviations between the topologies. Due to their mainly inductive characteristics, faults on OHL segments and at the interfaces lead to smaller transient stresses compared to UGC faults, which represent the worst case in all of the systems.
The interfaces between UGC and OHL segments are also subjected to noticeable transient currents of up to ca. 15 pu. OHL faults represent the most critical cases, as the propagating current travelling waves are amplified at the OHL-to-UGC transitions (cf. chapter 2.1.1). The distribution and individual lengths of the
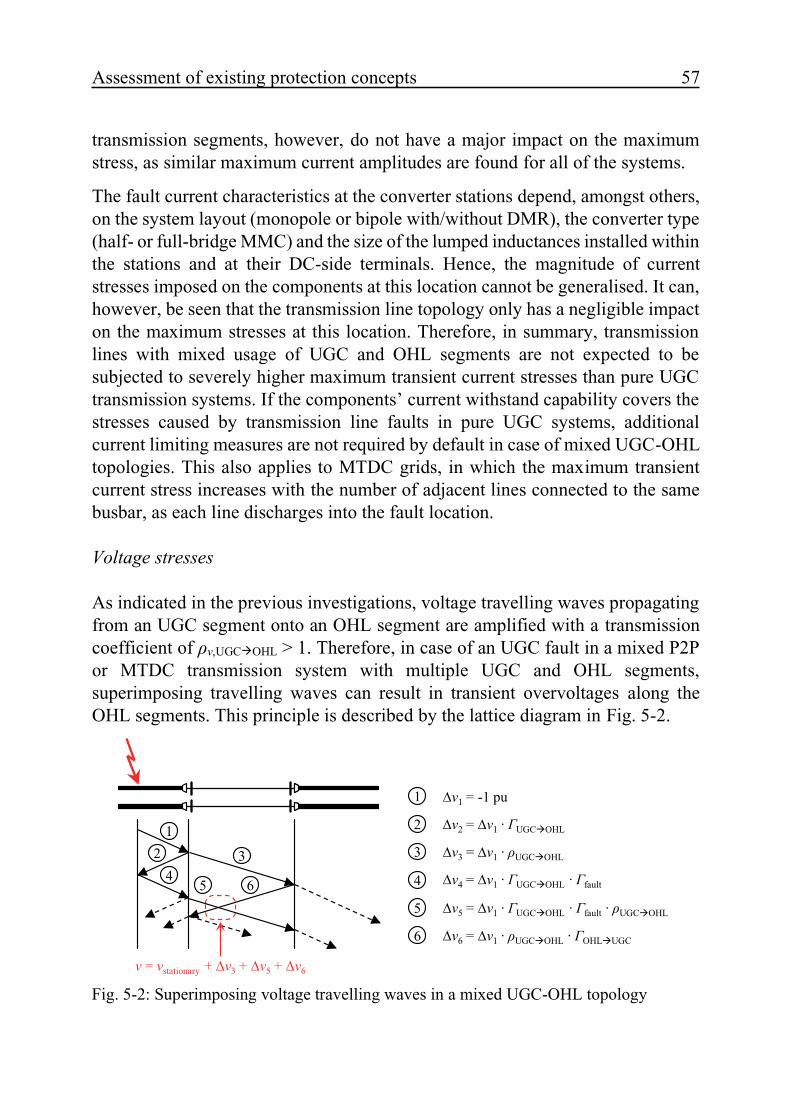
Assessment of existing protection concepts 57
transmission segments, however, do not have a major impact on the maximum stress, as similar maximum current amplitudes are found for all of the systems.
The fault current characteristics at the converter stations depend, amongst others, on the system layout (monopole or bipole with/without DMR), the converter type (half- or full-bridge MMC) and the size of the lumped inductances installed within the stations and at their DC-side terminals. Hence, the magnitude of current stresses imposed on the components at this location cannot be generalised. It can, however, be seen that the transmission line topology only has a negligible impact on the maximum stresses at this location. Therefore, in summary, transmission lines with mixed usage of UGC and OHL segments are not expected to be subjected to severely higher maximum transient current stresses than pure UGC transmission systems. If the components’ current withstand capability covers the stresses caused by transmission line faults in pure UGC systems, additional current limiting measures are not required by default in case of mixed UGC-OHL topologies. This also applies to MTDC grids, in which the maximum transient current stress increases with the number of adjacent lines connected to the same busbar, as each line discharges into the fault location.
Voltage stresses
As indicated in the previous investigations, voltage travelling waves propagating from an UGC segment onto an OHL segment are amplified with a transmission coefficient of ρv,UGC OHL > 1. Therefore, in case of an UGC fault in a mixed P2P or MTDC transmission system with multiple UGC and OHL segments, superimposing travelling waves can result in transient overvoltages along the OHL segments. This principle is described by the lattice diagram in Fig. 5-2.
Fig. 5-2: Superimposing voltage travelling waves in a mixed UGC-OHL topology
1
32
465
1 ∆v1 = -1 pu
2 ∆v2 = ∆v1 ∙ ΓUGC OHL
3 ∆v3 = ∆v1 ∙ ρUGC OHL
4 ∆v4 = ∆v1 ∙ ΓUGC OHL ∙ Γfault
5 ∆v5 = ∆v1 ∙ ΓUGC OHL ∙ Γfault ∙ ρUGC OHL
6 ∆v6 = ∆v1 ∙ ρUGC OHL ∙ ΓOHL UGC
v = vstationary + ∆v3 + ∆v5 + ∆v6
58 Assessment of existing protection concepts
At the indicated location and point in time in the diagram, the prospective DC voltage is the result of the superimposed stationary voltage vstationary as well as the forward and backward travelling waves ∆v3, ∆v5 and ∆v6. Assuming a characteristic impedance ratio of ZOHL/ZUGC = 6.2 according to the previous investigations and omitting propagation losses, the OHL can be temporarily subjected to a transient overvoltage of up to v ≈ 1.77 pu. In case of higher ratios of ZOHL/ZUGC , the transient overvoltage increases further, e.g. v ≈ 2.16 pu for ZOHL/ZUGC ≈ 10.0. The installation of surge arresters at every UGC-OHL transition point is therefore essential, not only to protect the interfaces and UGC sections from atmospheric impacts to the OHL, but also to limit overvoltages on the OHL segments resulting from UGC faults.
Apart from the use of surge arresters, UGCs in mixed transmission systems are, to a certain degree, naturally protected from external overvoltages by transmission coefficients below ρv,OHL UGC < 1 reducing the amplitudes of voltage travelling waves propagating from an OHL onto an UGC segment. However, as emphasised in chapter 2.2.2, polarised XLPE cable insulations are not only vulnerable to DC overvoltages of the same polarity, but also to transient voltages with opposite polarity. Due to the accumulation of space charges within the insulation material, even comparatively low voltages with reversed polarity may damage the insulation or even lead to an insulation failure [Maz13]. Fig. 5-3 therefore compares characteristic opposite polarity voltage profiles observed at the UGC terminations of the mixed topologies with the respective voltage profiles in pure UGC transmission systems and standardised CIGRE/IEC profiles specified for voltage polarity reversal tests [CIG12, IEC17].
Today, XLPE cables for HVDC applications are typically tested according to CIGRE recommendations, which have been adopted in IEC 62895 specifying test methods and requirements for extruded cables and their accessories with rated voltages up to Vdc,r = 320 kV [CIG12, IEC17]. With respect to polarity reversals, the specifications include superimposed opposite polarity switching and lightning impulse tests according to the profiles depicted in Fig. 5-3 a. The insulation is required to be capable of withstanding multiple switching impulses with an opposite polarity peak voltage of vstandard = -1.2 pu and lightning impulses with a respective peak voltage of vstandard = -2.1 pu of the rated DC voltage. Subsequent impulse voltages have to be applied within a maximum delay of two minutes.
As indicated in Fig. 5-3 b for two representative fault scenarios, DC pole-to-ground faults in pure UGC systems either lead to high-frequent voltage oscillations with opposite polarity amplitudes up to vUGC ≈ -1 pu for nearby faults
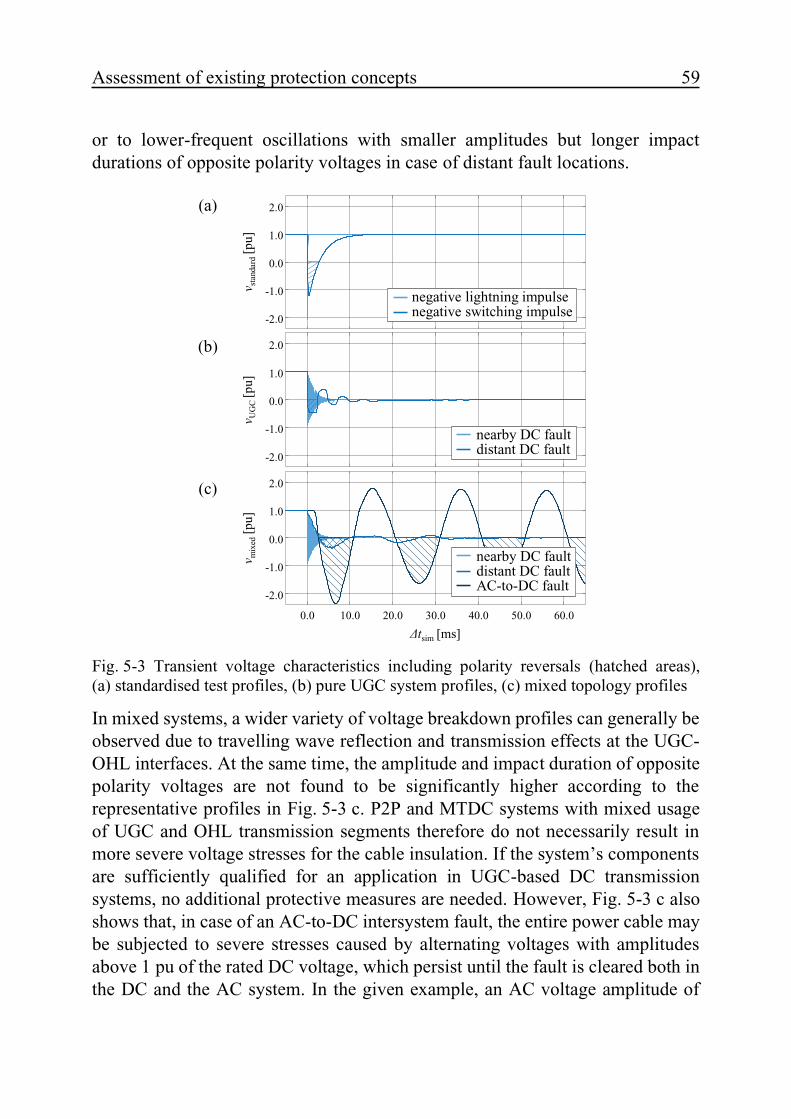
Assessment of existing protection concepts 59
or to lower-frequent oscillations with smaller amplitudes but longer impact durations of opposite polarity voltages in case of distant fault locations.
(a)
(b)
(c)
Fig. 5-3 Transient voltage characteristics including polarity reversals (hatched areas), (a) standardised test profiles, (b) pure UGC system profiles, (c) mixed topology profiles
In mixed systems, a wider variety of voltage breakdown profiles can generally be observed due to travelling wave reflection and transmission effects at the UGC-OHL interfaces. At the same time, the amplitude and impact duration of opposite polarity voltages are not found to be significantly higher according to the representative profiles in Fig. 5-3 c. P2P and MTDC systems with mixed usage of UGC and OHL transmission segments therefore do not necessarily result in more severe voltage stresses for the cable insulation. If the system’s components are sufficiently qualified for an application in UGC-based DC transmission systems, no additional protective measures are needed. However, Fig. 5-3 c also shows that, in case of an AC-to-DC intersystem fault, the entire power cable may be subjected to severe stresses caused by alternating voltages with amplitudes above 1 pu of the rated DC voltage, which persist until the fault is cleared both in the DC and the AC system. In the given example, an AC voltage amplitude of
0.0 10.0 20.0 30.0 40.0 50.0 60.0
-2.0
-1.0
0.0
1.0
2.0
-2.0
-1.0
0.0
1.0
2.0
-2.0
-1.0
0.0
1.0
2.0
nearby DC faultdistant DC fault
negative lightning impulsenegative switching impulse
nearby DC faultdistant DC faultAC-to-DC fault
Δtsim [ms]
v mix
ed[p
u]v U
GC
[pu]
v sta
ndar
d[p
u]
60 Assessment of existing protection concepts
vdc,max ≈ 1.7 pu with a negative peak voltage of vdc,min ≈ -2.3 pu is observed9. Hence, the insulation may be impacted for several AC cycles depending on the operating time of the mechanical AC circuit breakers. This can potentially result in accelerated ageing of the insulation including additional insulation breakdowns in areas of high space charge density (cf. chapter 2.2.2). Even though permanent AC-to-DC intersystem faults may represent a statistically improbable contingency, detailed analyses of the extent of the stresses have to be carried out, if a mixed topology bears the potential of such fault types. In certain scenarios, resonance phenomena between the AC grid and the DC line are caused requiring special protective measures to avoid large-scale cable damages. So far, only a few theoretical concepts have been proposed in this regard, e.g. [Ruf18a]. Fundamental research is still needed with respect to the insulation strength of polarised extruded cables when subjected to sinusoidal voltages and the development of components to limit the fault impacts in both systems.
5.2 Detection of line faults
Fault detection in future VSC-HVDC systems is expected to primarily rely on the identification of travelling wave impacts by evaluating transient voltage or current changes. This is either achieved by a decomposition of recorded measurements, e.g. using wavelet analysis, or by the more robust assessment of ROCOV and ROCOC. The sole use of overcurrent and undervoltage detection impedes selective fault identification in many setups, particularly in MTDC systems. They are therefore often proposed as backup protection or additional tripping conditions (e.g. vdc < 0.5 pu or idc > 2.0 pu) enhancing the more sensitive travelling wave identification methods. To reduce the stresses imposed on the semiconductor components and limit the extent of a line fault in the DC system, faults have to be detected as fast as possible, preferably within the first one or two milliseconds [Bra19, Let16, Tün19a].
Fig. 5-4 serves to assess these detection methods based on a statistical analysis of the relevant detection parameters for each of the systems in Fig. 5-1. This includes the maximum ROCOV and ROCOC values as well as voltage and current differentials, ∆vdc and ∆idc, within the first two milliseconds after travelling wave arrival. The boxplot representation shows the respective values’ 25th and 75th percentiles (borders of the box) as well as their median (horizontal line within each box). The whiskers cover approximately 99.3 % of the value range (dotted
9 To emphasise the extent of prospective voltage stresses, surge arresters are omitted in the example.
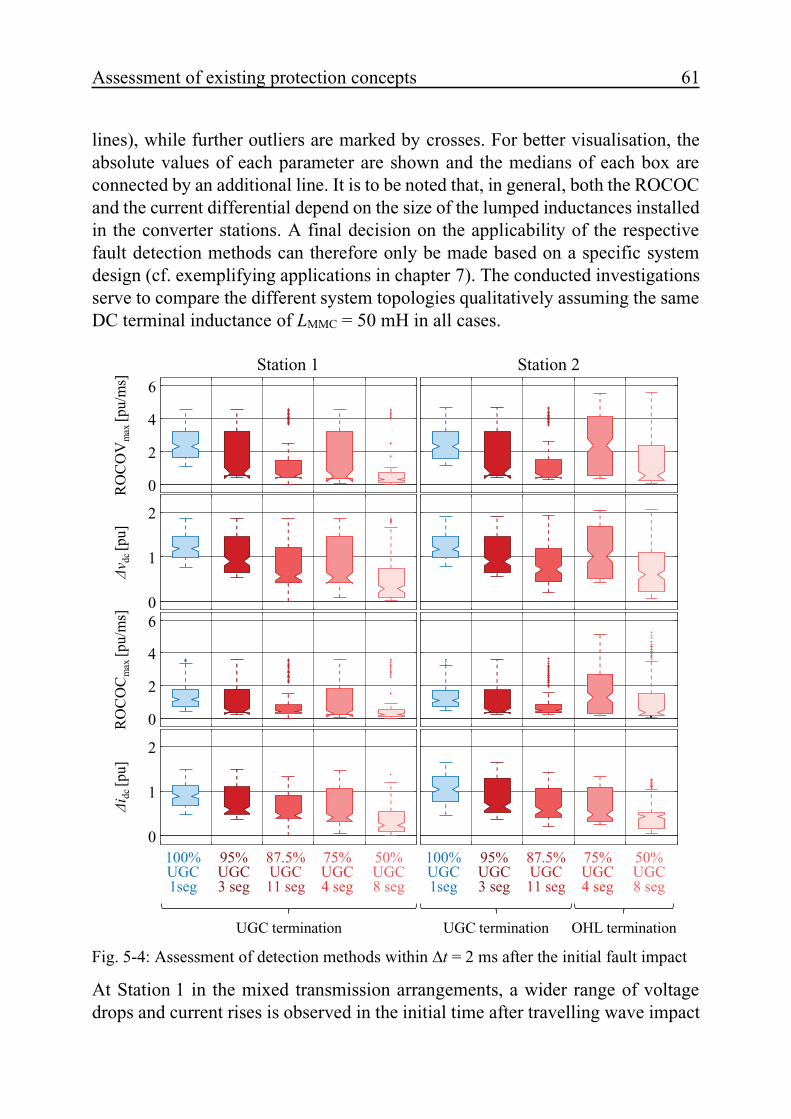
Assessment of existing protection concepts 61
lines), while further outliers are marked by crosses. For better visualisation, the absolute values of each parameter are shown and the medians of each box are connected by an additional line. It is to be noted that, in general, both the ROCOC and the current differential depend on the size of the lumped inductances installed in the converter stations. A final decision on the applicability of the respective fault detection methods can therefore only be made based on a specific system design (cf. exemplifying applications in chapter 7). The conducted investigations serve to compare the different system topologies qualitatively assuming the same DC terminal inductance of LMMC = 50 mH in all cases.
At Station 1 in the mixed transmission arrangements, a wider range of voltage drops and current rises is observed in the initial time after travelling wave impact
Fig. 5-4: Assessment of detection methods within ∆t = 2 ms after the initial fault impact
0
2
4
6
0
1
2
0
2
4
6
0
1
2
Station 1
100% UGC 1seg
100% UGC 1seg
UGC termination UGC termination OHL termination
RO
CO
Vm
ax[p
u/m
s]Δv
dc[p
u]R
OC
OC
max
[pu/
ms]
Δidc
[pu]
50% UGC8 seg
50% UGC8 seg
95% UGC3 seg
95% UGC3 seg
87.5% UGC11 seg
87.5% UGC11 seg
75% UGC4 seg
75% UGC4 seg
Station 2

62 Assessment of existing protection concepts
compared to the pure UGC system. This is indicated by larger ∆vdc and ∆idc boxes and an extended whisker range as well as the noticeably smaller medians for the mixed systems. More importantly for protection purposes, a significant number of fault scenarios is identified, in which no major voltage drop or current rise occurs within the first few milliseconds after fault impact. In the “100% UGC” system, a voltage differential of ∆vdc > 0.75 pu is apparent for all of the fault locations with a median of ∆vdc,median ≈ 1.18 pu and a respective median of the current differential of ∆idc,median ≈ 0.89 pu. The smallest fault impact from a statistical point of view occurs in the “50% UGC, 8 seg” system with a median of the voltage differential of just ∆vdc,median ≈ 0.28 pu and a median of the current differential of just ∆idc,median ≈ 0.24 pu.
With regard to ROCOV and ROCOC, similar tendencies are identified. The maximum values at Station 1 are the same for all five topologies, as they stem from an UGC fault in the direct vicinity of the converter station. Statistically, however, the average travelling wave impact and, most importantly, the minimum travelling wave impact are reduced noticeably in all of the mixed topologies compared to the pure UGC system. In particular, the two topologies with a high number of different UGC and OHL segments often only evoke comparatively small ROCOV and ROCOC values after the fault impact, as the travelling waves propagate via multiple UGC-OHL transitions before reaching the line end.
In the “87.5% UGC, 11 seg” system, approximately 25 % of the fault cases lead to a maximum ROCOV below 0.38 pu/ms; in the 8-segment topology, this value is as low as 0.01 pu/ms. Defining a selective threshold covering all of the fault cases, or even just a majority of them, therefore becomes a difficult task. Not only the faults within the protection zone have to be detected correctly, but a detection caused by external faults, temporary oscillations, electromagnetic coupling etc. has to be avoided. Due to the small voltage and current differentials in the same time span, they cannot be used to enhance the detection robustness. Moreover, the supporting use of directional criteria may not be possible due to alternating ROCOC signs, as shown in the MTDC investigations in chapter 4.2.
As a result of the symmetrical arrangement of the first three transmission systems, the same characteristics and detection assessments described above for Station 1 apply to Station 2 as well. A different behaviour is found for the “75% UGC, 4 seg” and “50% UGC, 8 seg” systems, as in this case Station 2 is connected to an OHL termination. The detection parameters therefore reach noticeably higher statistical values compared to Station 1 and, to a certain degree, compared to the pure UGC system. This is particularly the case for the ROCOV and voltage differential criteria due to travelling wave amplification at the transition from the
Assessment of existing protection concepts 63
UGC onto the outer OHL segment. Nonetheless, the minimal detection parameter values and the respective medians still fall short of the values for the “100% UGC” system (only exception: ROCOV medians of “75% UGC, 4 seg” system) impeding selective fault detection exclusively based on these methods.
Another aspect to be taken into consideration is that the statistical analysis in Fig. 5-4 is exclusively based on low-resistive pole-to-ground faults along the transmission systems. However, in contrast to pure UGC lines, OHLs can potentially be subjected to higher-impedance faults, e.g. in case of objects connecting the line to ground, which lead to an additional reduction in the extent of travelling wave impacts at the line ends due to smaller initial wave amplitudes. More sophisticated travelling wave detection methods, e.g. algorithms based on wavelet analysis, are even more reliant on dedicated wave fronts and are therefore not expected to allow selective fault identification in the investigated systems.
As pointed out by the investigations in chapter 4, distant faults in mixed UGC-OHL systems result in significant travelling wave attenuation and are therefore the most challenging faults to be detected fast and selectively on the affected line. This is emphasised by Fig. 5-5 showing separate statistical analyses of the detection methods for nearby faults on the respective outer line segments10 (left side of Fig. 5-5) and faults on the respective distant halves of the transmission lines11 (right side of Fig. 5-5). Each column represents one of the four mixed transmission topologies and contains both the Station 1 values (left boxes) and Station 2 values (right boxes).
The statistical analysis clearly points out the discrepancy of the detection methods’ effectiveness between nearby faults on the outer system segments and distant faults, in which the travelling waves propagate across one or more UGC-OHL interfaces. Voltage-based fault detection methods appear to be suitable for the fast detection of faults near the line ends, as a definition of robust thresholds seem feasible, such as ROCOV ≥ 1 pu/ms and ∆vdc ≥ 0.5…1 pu. The parametrisation of current-based detection methods depends on the specific application. However, in the given setup, thresholds of ROCOC ≥ 1 pu/ms and ∆idc ≥ 0.5…1 pu appear feasible for fast fault detection as well. On the other hand, as indicated on the right hand side of Fig. 5-5, the majority of line faults occurring behind the outer transmission segments would not be detected within the first milliseconds, if the protection concepts is exclusively set up of these methods and thresholds. In particular, ROCOV and ROCOC methods no longer act as primary
10 e.g. fault locations xfault = 420…800 km for Station 2 in the “95 % UGC, 3 seg” system (cf. Fig. 5-1) 11 i.e. fault locations xfault ≥ 400 km for Station 1 and xfault ≤ 400 km for Station 2 (cf. Fig. 5-1)

64 Assessment of existing protection concepts
fault detection methods (if at all) and most of the distant faults would at some point be detected by overcurrent or undervoltage relays.
The consequences of a delayed fault detection and whether or not this is acceptable in a given case may differ for each VSC-HVDC system and thus have to be evaluated based on the specific application. However, as pointed out in chapter 1.2.2, fault detection based on overcurrent and undervoltage criteria often results in non-selective fault handling, as the delayed reaction to the fault event may result in undesired converter blocking or false tripping of adjacent lines in MTDC systems. To ensure fast and selective fault detection in mixed transmission systems for all fault locations, additional detection methods are needed to complement the existing criteria and enhance the overall protection performance.
Fig. 5-5: Assessment of detection methods within ∆t = 2 ms after the initial fault impact for faults on the respective outer segments (left) and the distant line halves (right)
faults on nearby outer segments faults on distant line halves
50% UGC8 seg
50% UGC8 seg
95% UGC3 seg
95% UGC3 seg
87.5% UGC11 seg
87.5% UGC11 seg
75% UGC4 seg
75% UGC4 seg
0
2
4
0
1
2
0
2
4
0
1
2
RO
CO
Vm
ax[p
u/m
s]Δv
dc[p
u]R
OC
OC
max
[pu/
ms]
Δidc
[pu]
Assessment of existing protection concepts 65
With regard to the selectivity of the proposed fault detection methods in MTDC systems, the analyses of chapter 4.2 clearly show the severe transient impacts on healthy system parts caused by UGC faults in the vicinity of busbars comprising both UGC and OHL feeders. The resulting ROCOV and ROCOC values on healthy OHL feeders can easily surpass the values for faults inside the respective protection zones, even if reactances with significant inductance values are installed at the line terminations. In addition, oscillating currents during the transient discharge phase may impede an application of current direction criteria to discriminate internal and external faults. Since the use of sensitive, travelling wave based detection methods is of utmost importance in MTDC schemes to allow fast fault detection, the known methods have to be enhanced.
5.3 Fault separation
Most of the protection concepts proposed for future VSC-HVDC systems either rely on DCCBs or on FB-MMCs in combination with fast DC switches to separate line faults and restore normal system operation as fast as possible. As both methods typically make use of power electronic switches to reduce or break the DC fault current12, the maximum current amplitude during the fault separation process is often the most critical design criteria, along with the transient interruption voltage and energy dissipation [Dör16, Fra11, Tün19a]. In case of DCCBs, impermissible current stresses may damage the breaker components and impede reliable fault clearing. If FB-MMCs are used to actively control the DC fault current, exceeding the maximum permissible arm current will lead to protective submodule blocking. To avoid this behaviour, the lumped inductances installed in the converter stations and at each line end have to be designed according to the system setup and the equipment ratings without affecting the overall control performance [Buc14]. This applies not only to pure UGC and pure OHL systems, but to mixed UGC-OHL arrangements as well.
As pointed out in chapter 5.1, mixed systems do not inherently result in more severe DC voltage or current stresses at the line ends compared to pure UGC or pure OHL systems. Hence, no additional precautions have to be taken by default to ensure the reliability of the fault separation process. If a DCCB- or FB-MMC-based concept is generally feasible in pure UGC or pure OHL systems, it is expected to be suitable for mixed transmission systems as well. Nonetheless, a system-specific evaluation of the fault separation process is always recommended
12 exception: mechanical DCCBs with current injection
66 Assessment of existing protection concepts
due to the variety of mixed UGC-OHL setups and their respective characteristics. This is particularly relevant, if FB-MMCs apply control concepts allowing DC terminal voltages with sinusoidal components [Stu18, Tün16]. In this case, the resonance characteristics of the specific UGC-OHL arrangement have to be taken into consideration to avoid instabilities and severe component stresses.
5.4 Discrimination of UGC and OHL faults
After successful fault detection and separation, an automatic attempt to recover normal operation is desired for faults on OHL segments. On the contrary, re-start attempts must be avoided for UGC faults, which are always permanent. To be able to decide whether or not to initiate the recovery process, on-line methods discriminating UGC faults and OHL faults within several tens to hundreds of milliseconds after the initial fault impact are required, independent of the system type (P2P, MTDC or hybrid AC-DC).
The localisation accuracy of algorithms evaluating travelling wave patterns mainly depends on the accuracy of identifying travelling wave arrival instances, which in turn strongly depends on the measured signal characteristics as well as aliasing effects caused by the measurement equipment (physical low-pass filter properties, sampling frequency etc.). Therefore, to assess the applicability of transient signal analysis methods for on-line discrimination of faults, the very moment of travelling wave arrival at the line ends has to be studied. Fig. 5-6 shows the DC voltages recorded within the first tens of microseconds after the fault impact at both converter stations for pure OHL and pure UGC transmission as well as two mixed system arrangements from Fig. 5-1. Each case is based on an exemplifying fault in the middle of the respective line. For better comparability, the travelling wave arrival time is normalised to ∆tsim = 0 µs, as indicated by the dotted line. In the given examples, the simulation time step is reduced to ∆tstep = 1 µs to account for the typically required sampling frequencies of fsample ≥ 1 MHz. Moreover, in a first step, measurement inaccuracies and filter applications are omitted.
In the OHL system, the travelling wave impact is visible within the first ∆tsim = 2…5 µs after the theoretical wave arrival time, as the voltage quickly deviates by several percent from the steady-state value. If the localisation algorithms on both sides of the line are capable of identifying these events, a theoretical localisation error of less than ∆xlocalisation ≤ 0.75 km is ensured according to equation (1.1). Due to a higher attenuation of travelling waves in
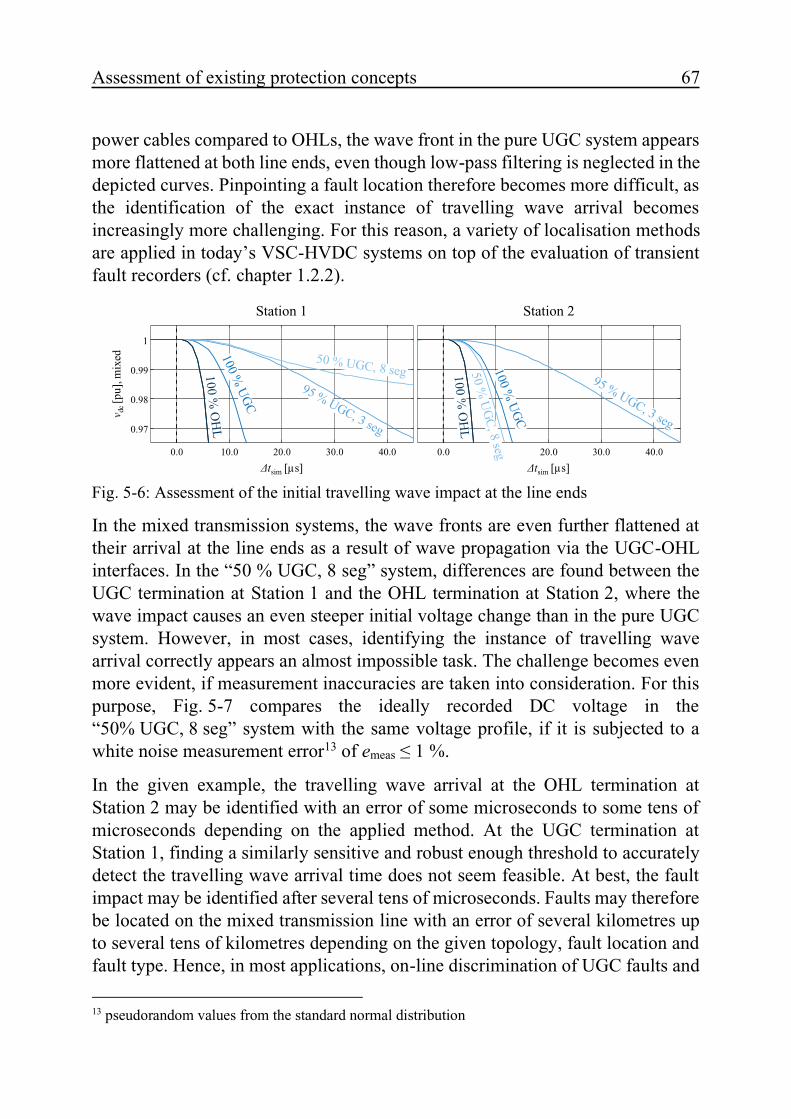
Assessment of existing protection concepts 67
power cables compared to OHLs, the wave front in the pure UGC system appears more flattened at both line ends, even though low-pass filtering is neglected in the depicted curves. Pinpointing a fault location therefore becomes more difficult, as the identification of the exact instance of travelling wave arrival becomes increasingly more challenging. For this reason, a variety of localisation methods are applied in today’s VSC-HVDC systems on top of the evaluation of transient fault recorders (cf. chapter 1.2.2).
In the mixed transmission systems, the wave fronts are even further flattened at their arrival at the line ends as a result of wave propagation via the UGC-OHL interfaces. In the “50 % UGC, 8 seg” system, differences are found between the UGC termination at Station 1 and the OHL termination at Station 2, where the wave impact causes an even steeper initial voltage change than in the pure UGC system. However, in most cases, identifying the instance of travelling wave arrival correctly appears an almost impossible task. The challenge becomes even more evident, if measurement inaccuracies are taken into consideration. For this purpose, Fig. 5-7 compares the ideally recorded DC voltage in the “50% UGC, 8 seg” system with the same voltage profile, if it is subjected to a white noise measurement error13 of emeas ≤ 1 %.
In the given example, the travelling wave arrival at the OHL termination at Station 2 may be identified with an error of some microseconds to some tens of microseconds depending on the applied method. At the UGC termination at Station 1, finding a similarly sensitive and robust enough threshold to accurately detect the travelling wave arrival time does not seem feasible. At best, the fault impact may be identified after several tens of microseconds. Faults may therefore be located on the mixed transmission line with an error of several kilometres up to several tens of kilometres depending on the given topology, fault location and fault type. Hence, in most applications, on-line discrimination of UGC faults and
13 pseudorandom values from the standard normal distribution
Fig. 5-6: Assessment of the initial travelling wave impact at the line ends
0.0 10.0 20.0 30.0 40.00.0 10.0 20.0 30.0 40.0
0.97
0.98
0.99
1
Station 2Station 1
Δtsim [µs] Δtsim [µs]
v dc[p
u], m
ixed
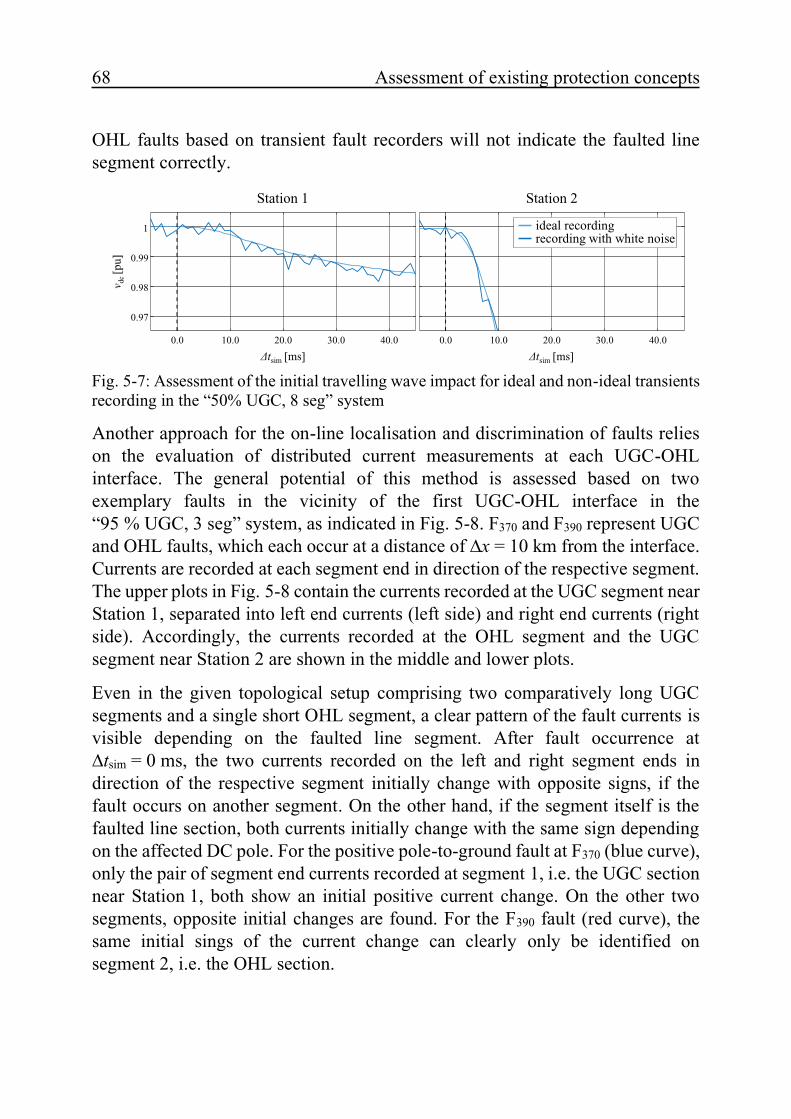
68 Assessment of existing protection concepts
OHL faults based on transient fault recorders will not indicate the faulted line segment correctly.
Another approach for the on-line localisation and discrimination of faults relies on the evaluation of distributed current measurements at each UGC-OHL interface. The general potential of this method is assessed based on two exemplary faults in the vicinity of the first UGC-OHL interface in the “95 % UGC, 3 seg” system, as indicated in Fig. 5-8. F370 and F390 represent UGC and OHL faults, which each occur at a distance of ∆x = 10 km from the interface. Currents are recorded at each segment end in direction of the respective segment. The upper plots in Fig. 5-8 contain the currents recorded at the UGC segment near Station 1, separated into left end currents (left side) and right end currents (right side). Accordingly, the currents recorded at the OHL segment and the UGC segment near Station 2 are shown in the middle and lower plots.
Even in the given topological setup comprising two comparatively long UGC segments and a single short OHL segment, a clear pattern of the fault currents is visible depending on the faulted line segment. After fault occurrence at ∆tsim = 0 ms, the two currents recorded on the left and right segment ends in direction of the respective segment initially change with opposite signs, if the fault occurs on another segment. On the other hand, if the segment itself is the faulted line section, both currents initially change with the same sign depending on the affected DC pole. For the positive pole-to-ground fault at F370 (blue curve), only the pair of segment end currents recorded at segment 1, i.e. the UGC section near Station 1, both show an initial positive current change. On the other two segments, opposite initial changes are found. For the F390 fault (red curve), the same initial sings of the current change can clearly only be identified on segment 2, i.e. the OHL section.
Fig. 5-7: Assessment of the initial travelling wave impact for ideal and non-ideal transients recording in the “50% UGC, 8 seg” system
0.0 10.0 20.0 30.0 40.00.0 10.0 20.0 30.0 40.0
0.97
0.98
0.99
1
Station 2Station 1
ideal recordingrecording with white noise
Δtsim [ms] Δtsim [ms]
v dc[p
u]
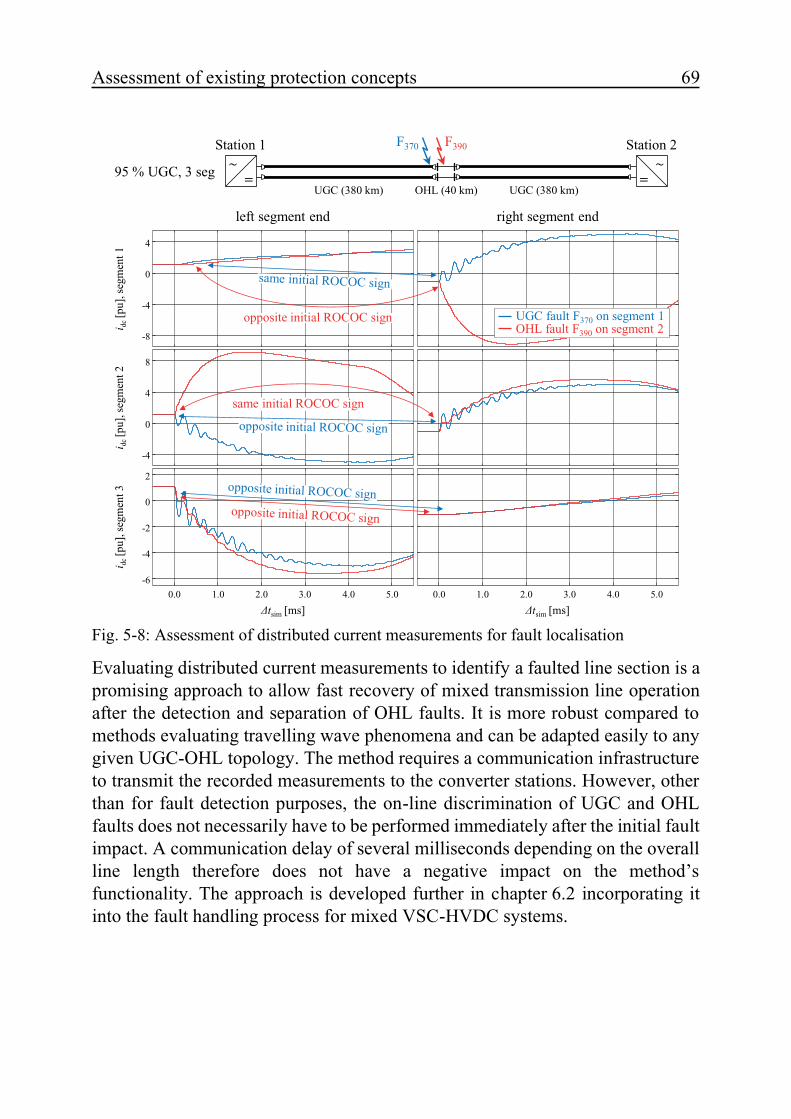
Assessment of existing protection concepts 69
Evaluating distributed current measurements to identify a faulted line section is a promising approach to allow fast recovery of mixed transmission line operation after the detection and separation of OHL faults. It is more robust compared to methods evaluating travelling wave phenomena and can be adapted easily to any given UGC-OHL topology. The method requires a communication infrastructure to transmit the recorded measurements to the converter stations. However, other than for fault detection purposes, the on-line discrimination of UGC and OHL faults does not necessarily have to be performed immediately after the initial fault impact. A communication delay of several milliseconds depending on the overall line length therefore does not have a negative impact on the method’s functionality. The approach is developed further in chapter 6.2 incorporating it into the fault handling process for mixed VSC-HVDC systems.
Fig. 5-8: Assessment of distributed current measurements for fault localisation
0.0 1.0 2.0 3.0 4.0 5.00.0 1.0 2.0 3.0 4.0 5.0
-6
-4
-2
0
2
-4
0
4
8
-8
-4
0
4
Station 2Station 1
UGC (380 km) OHL (40 km) UGC (380 km)
95 % UGC, 3 seg
F390F370
right segment endleft segment end
opposite initial ROCOC sign
same initial ROCOC sign
UGC fault F370 on segment 1OHL fault F390 on segment 2
Δtsim [ms] Δtsim [ms]
i dc[p
u], s
egm
ent1
i dc[p
u], s
egm
ent2
i dc[p
u], s
egm
ent3

70 Assessment of existing protection concepts
Development of enhanced protection methods 71
6 Development of enhanced protection methods
Based on the comprehensive analysis of the system behaviour and the subsequent assessment of existing protection methods, a variety of challenges for reliable, fast and selective line protection of VSC-HVDC systems with mixed usage of UGC and OHL transmission segments are identified. Most importantly, the known fault detection methods cannot ensure selectivity in the majority of mixed system arrangements without further enhancements and an incorporation of additional methods. Moreover, the distortion of travelling waves caused by UGC-OHL interfaces often impedes an accurate determination of travelling wave arrival times. Therefore, deciding whether or not to initiate an automatic re-start attempt on a faulted line exclusively based on local fault recorders and signal analyses becomes increasingly difficult.
Taking into account the observed characteristics, the following additional protection requirements are identified for mixed transmission systems:
Diversity and speed of fault detection
The system’s primary line protection has to incorporate methods to quickly detect faults on outer segments, which immediately cause steep voltage and current changes at the nearby line end, as well as methods to quickly detect distant faults, which may only cause marginal initial impacts on the voltages and current measured at the line ends.
Sensitivity and robustness of fault detection in MTDC systems
Fault detection methods have to be sensitive enough to quickly react to line faults and thus limit their impacts on healthy system parts. At the same time, the detection methods have to be robust enough to avoid tripping for faults on adjacent lines.
Accuracy and speed of on-line fault localisation
The faulted line segment has to be identified reliably within several tens of milliseconds after fault occurrence to enable automatic fault recovery strategies based on the determined fault type (OHL/UGC). Pinpointing the fault location is not required at this point.
To comply with these requirements, detecting and localising line faults cannot be based exclusively on the information content of the voltages and currents
72 Development of enhanced protection methods
measured at the line terminations. Instead, the information of remote faults has to be recorded in the vicinity of the event eliminating the impact of travelling wave attenuation and distortion caused by the UGC-OHL transitions as much as possible. The recorded information then has to be made available at the line ends and has to be incorporated directly into the fault detection and on-line localisation methods. Other than in pure UGC or pure OHL systems, where primary protection based on signal communication is not considered feasible due to the resulting delays, non-selective tripping caused by backup protection criteria is expected to take considerably longer in case of remote faults in mixed transmission systems. The aforementioned challenges of slowly decaying voltages and slowly rising currents at the line ends can therefore be used as an advantage, as more time is available to communicate measurement signals recorded along the transmission line to the respective line ends.
The enhanced line protection methods rely on DC pole voltage and current measurements at every UGC-OHL transition point. To transmit the recorded values, communication channels are introduced between both line ends (end-to-end, “e2e”) as well as between each interface and line end (interface-to-end, “i2e”). In the EMTP model framework, the signal communication is implemented using delay functions. A communication speed of ucom = 200 km/ms is assumed for signal transmission with an additional time delay of ∆tcom,proc = 500 µs to account for signal processing [CEN18]. Hence, the total i2e communication delay, ∆ti2e, is calculated from the distance xi2e between the respective interface and line end according to equation (6.1).
(6.1)
By incorporating the additionally available measurement data from the distributed voltage and current sensors, new and enhanced protection methods are developed to address the requirements for reliable, fast and selective fault handling in VSC-HVDC systems with mixed UGC-OHL transmission systems.
6.1 Fast and selective detection of line faults
Travelling wave based detection methods (ROCOV, ROCOC)
Faults near the transmission line terminations result in fast voltage and current changes requiring immediate fault detection based on local measurements and fast signal processing. Typically, less than a millisecond is available for the
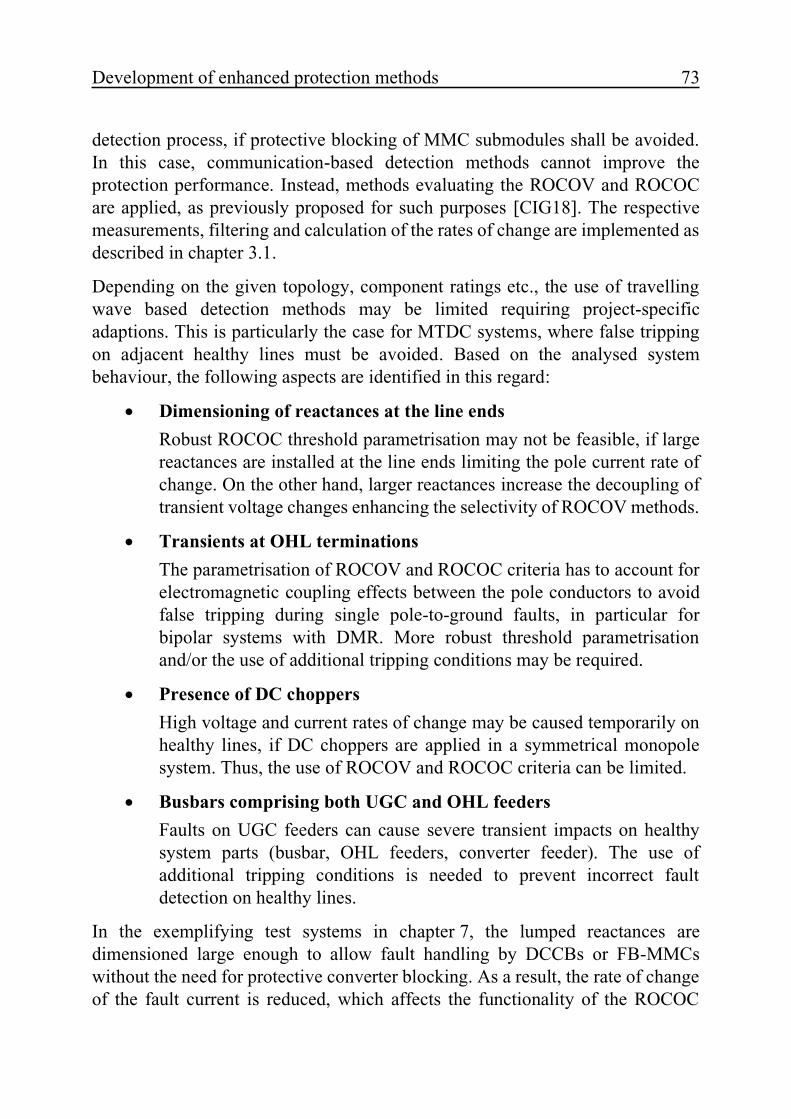
Development of enhanced protection methods 73
detection process, if protective blocking of MMC submodules shall be avoided. In this case, communication-based detection methods cannot improve the protection performance. Instead, methods evaluating the ROCOV and ROCOC are applied, as previously proposed for such purposes [CIG18]. The respective measurements, filtering and calculation of the rates of change are implemented as described in chapter 3.1.
Depending on the given topology, component ratings etc., the use of travelling wave based detection methods may be limited requiring project-specific adaptions. This is particularly the case for MTDC systems, where false tripping on adjacent healthy lines must be avoided. Based on the analysed system behaviour, the following aspects are identified in this regard:
Dimensioning of reactances at the line ends
Robust ROCOC threshold parametrisation may not be feasible, if large reactances are installed at the line ends limiting the pole current rate of change. On the other hand, larger reactances increase the decoupling of transient voltage changes enhancing the selectivity of ROCOV methods.
Transients at OHL terminations
The parametrisation of ROCOV and ROCOC criteria has to account for electromagnetic coupling effects between the pole conductors to avoid false tripping during single pole-to-ground faults, in particular for bipolar systems with DMR. More robust threshold parametrisation and/or the use of additional tripping conditions may be required.
Presence of DC choppers
High voltage and current rates of change may be caused temporarily on healthy lines, if DC choppers are applied in a symmetrical monopole system. Thus, the use of ROCOV and ROCOC criteria can be limited.
Busbars comprising both UGC and OHL feeders
Faults on UGC feeders can cause severe transient impacts on healthy system parts (busbar, OHL feeders, converter feeder). The use of additional tripping conditions is needed to prevent incorrect fault detection on healthy lines.
In the exemplifying test systems in chapter 7, the lumped reactances are dimensioned large enough to allow fault handling by DCCBs or FB-MMCs without the need for protective converter blocking. As a result, the rate of change of the fault current is reduced, which affects the functionality of the ROCOC
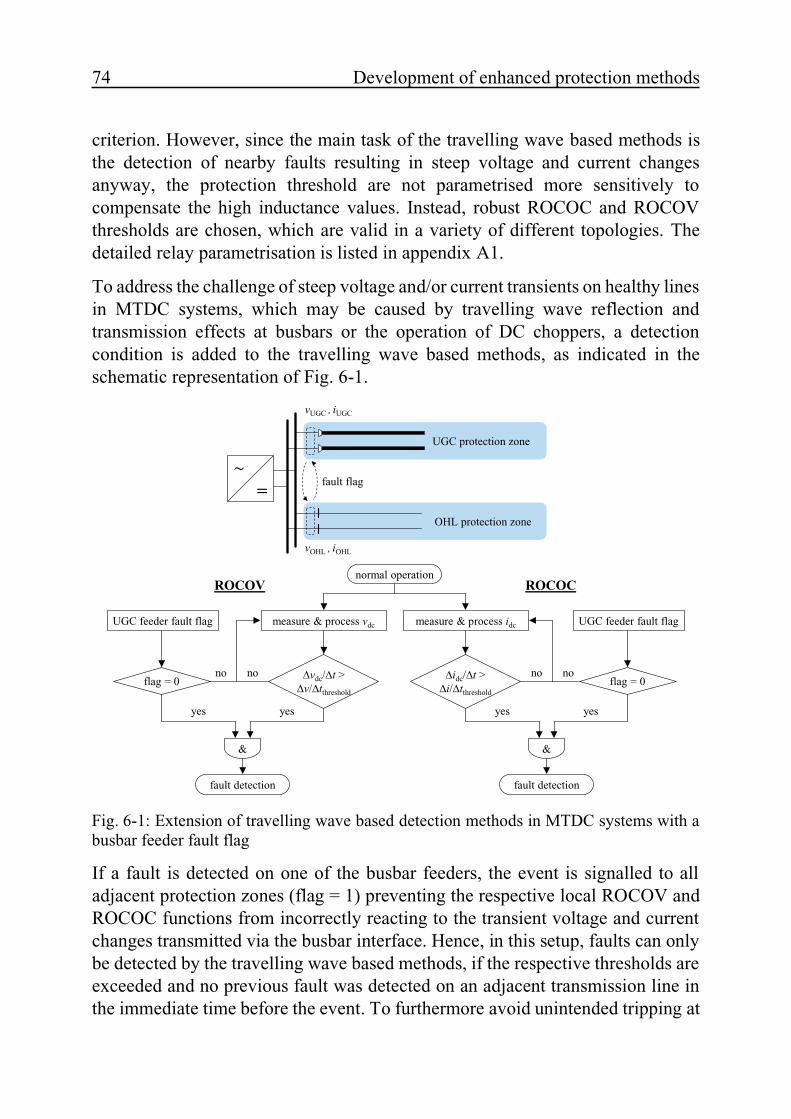
74 Development of enhanced protection methods
criterion. However, since the main task of the travelling wave based methods is the detection of nearby faults resulting in steep voltage and current changes anyway, the protection threshold are not parametrised more sensitively to compensate the high inductance values. Instead, robust ROCOC and ROCOV thresholds are chosen, which are valid in a variety of different topologies. The detailed relay parametrisation is listed in appendix A1.
To address the challenge of steep voltage and/or current transients on healthy lines in MTDC systems, which may be caused by travelling wave reflection and transmission effects at busbars or the operation of DC choppers, a detection condition is added to the travelling wave based methods, as indicated in the schematic representation of Fig. 6-1.
If a fault is detected on one of the busbar feeders, the event is signalled to all adjacent protection zones (flag = 1) preventing the respective local ROCOV and ROCOC functions from incorrectly reacting to the transient voltage and current changes transmitted via the busbar interface. Hence, in this setup, faults can only be detected by the travelling wave based methods, if the respective thresholds are exceeded and no previous fault was detected on an adjacent transmission line in the immediate time before the event. To furthermore avoid unintended tripping at
Fig. 6-1: Extension of travelling wave based detection methods in MTDC systems with a busbar feeder fault flag
measure & process idc
∆idc/∆t > ∆i/∆tthreshold
&
fault detection
normal operation
measure & process vdc
∆vdc/∆t > ∆v/∆tthreshold
UGC feeder fault flag
flag = 0nono
yes yes
&
fault detection
UGC feeder fault flag
flag = 0no no
yesyes
ROCOV ROCOC
fault flag
vOHL , iOHL
UGC protection zone
OHL protection zone
vUGC , iUGC
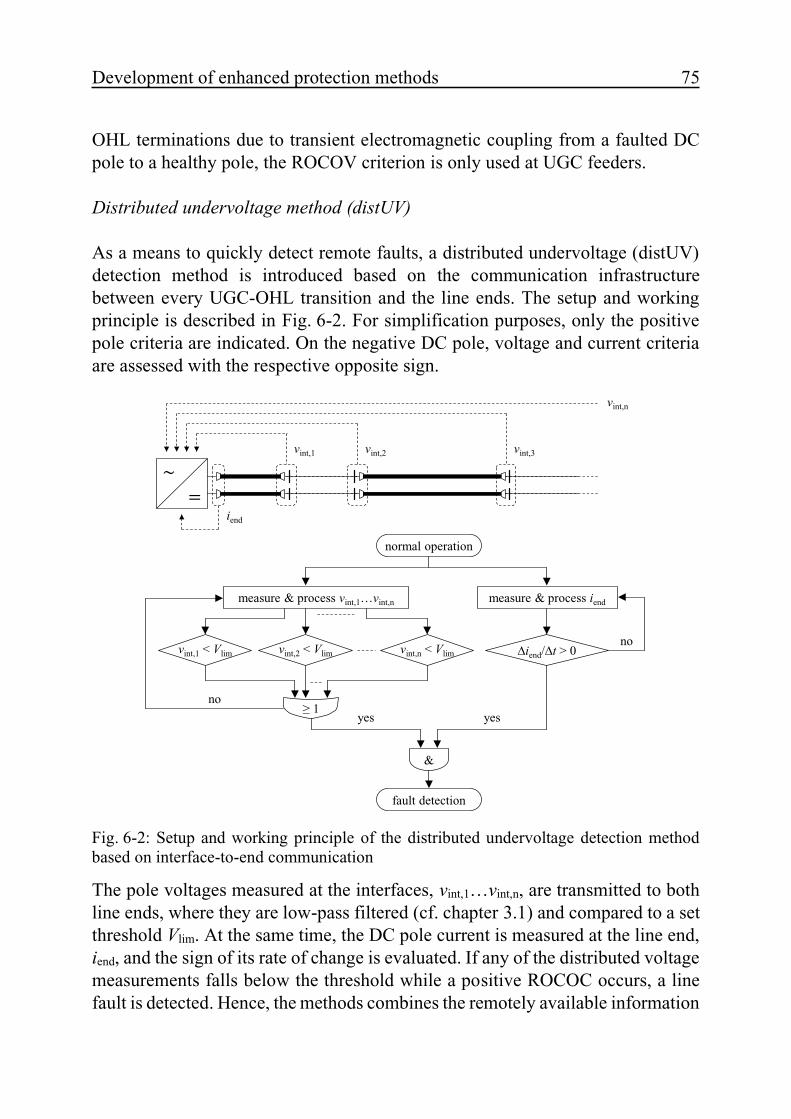
Development of enhanced protection methods 75
OHL terminations due to transient electromagnetic coupling from a faulted DC pole to a healthy pole, the ROCOV criterion is only used at UGC feeders.
Distributed undervoltage method (distUV)
As a means to quickly detect remote faults, a distributed undervoltage (distUV) detection method is introduced based on the communication infrastructure between every UGC-OHL transition and the line ends. The setup and working principle is described in Fig. 6-2. For simplification purposes, only the positive pole criteria are indicated. On the negative DC pole, voltage and current criteria are assessed with the respective opposite sign.
The pole voltages measured at the interfaces, vint,1…vint,n, are transmitted to both line ends, where they are low-pass filtered (cf. chapter 3.1) and compared to a set threshold Vlim. At the same time, the DC pole current is measured at the line end, iend, and the sign of its rate of change is evaluated. If any of the distributed voltage measurements falls below the threshold while a positive ROCOC occurs, a line fault is detected. Hence, the methods combines the remotely available information
Fig. 6-2: Setup and working principle of the distributed undervoltage detection method based on interface-to-end communication
vint,1 vint,2 vint,3
vint,n
iend
normal operation
measure & process vint,1…vint,n
vint,1 < Vlim vint,2 < Vlim vint,n < Vlim
≥ 1
measure & process iend
∆iend/∆t > 0
&
fault detection
yes yes
no
no
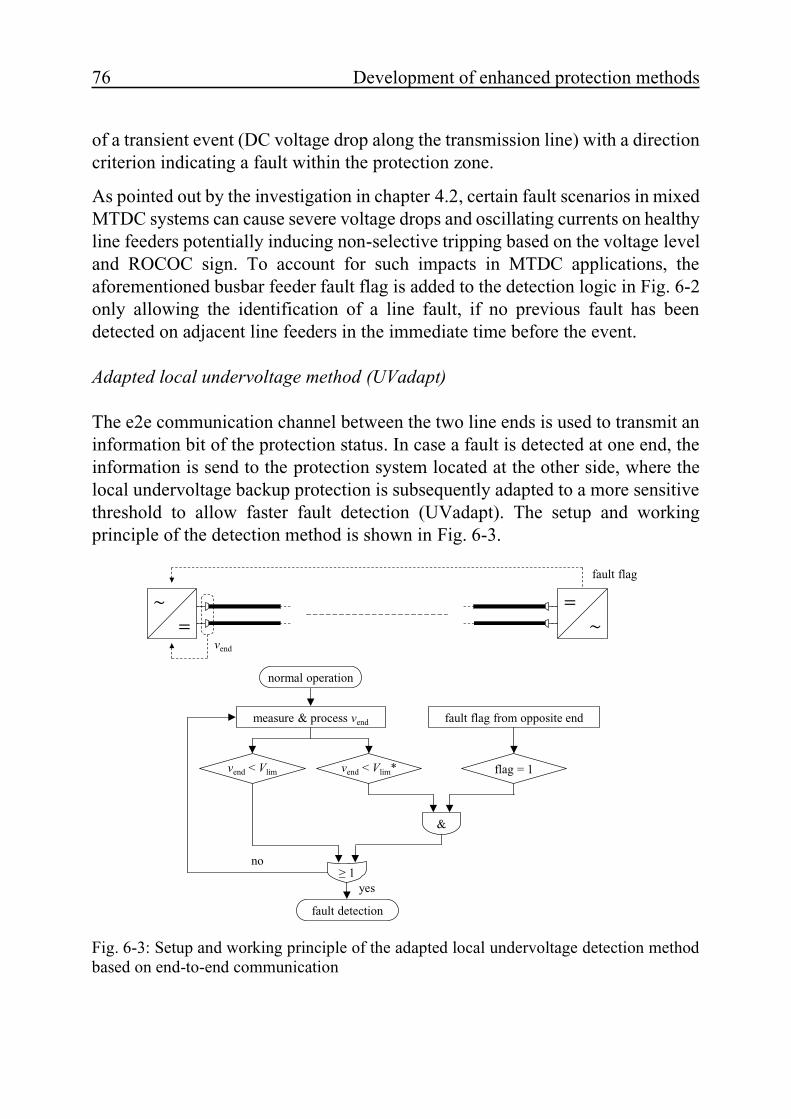
76 Development of enhanced protection methods
of a transient event (DC voltage drop along the transmission line) with a direction criterion indicating a fault within the protection zone.
As pointed out by the investigation in chapter 4.2, certain fault scenarios in mixed MTDC systems can cause severe voltage drops and oscillating currents on healthy line feeders potentially inducing non-selective tripping based on the voltage level and ROCOC sign. To account for such impacts in MTDC applications, the aforementioned busbar feeder fault flag is added to the detection logic in Fig. 6-2 only allowing the identification of a line fault, if no previous fault has been detected on adjacent line feeders in the immediate time before the event.
Adapted local undervoltage method (UVadapt)
The e2e communication channel between the two line ends is used to transmit an information bit of the protection status. In case a fault is detected at one end, the information is send to the protection system located at the other side, where the local undervoltage backup protection is subsequently adapted to a more sensitive threshold to allow faster fault detection (UVadapt). The setup and working principle of the detection method is shown in Fig. 6-3.
Fig. 6-3: Setup and working principle of the adapted local undervoltage detection method based on end-to-end communication
vend
fault flag
normal operation
measure & process vend
vend < Vlim*
fault flag from opposite end
flag = 1
fault detection
≥ 1
&
vend < Vlim
yes
no
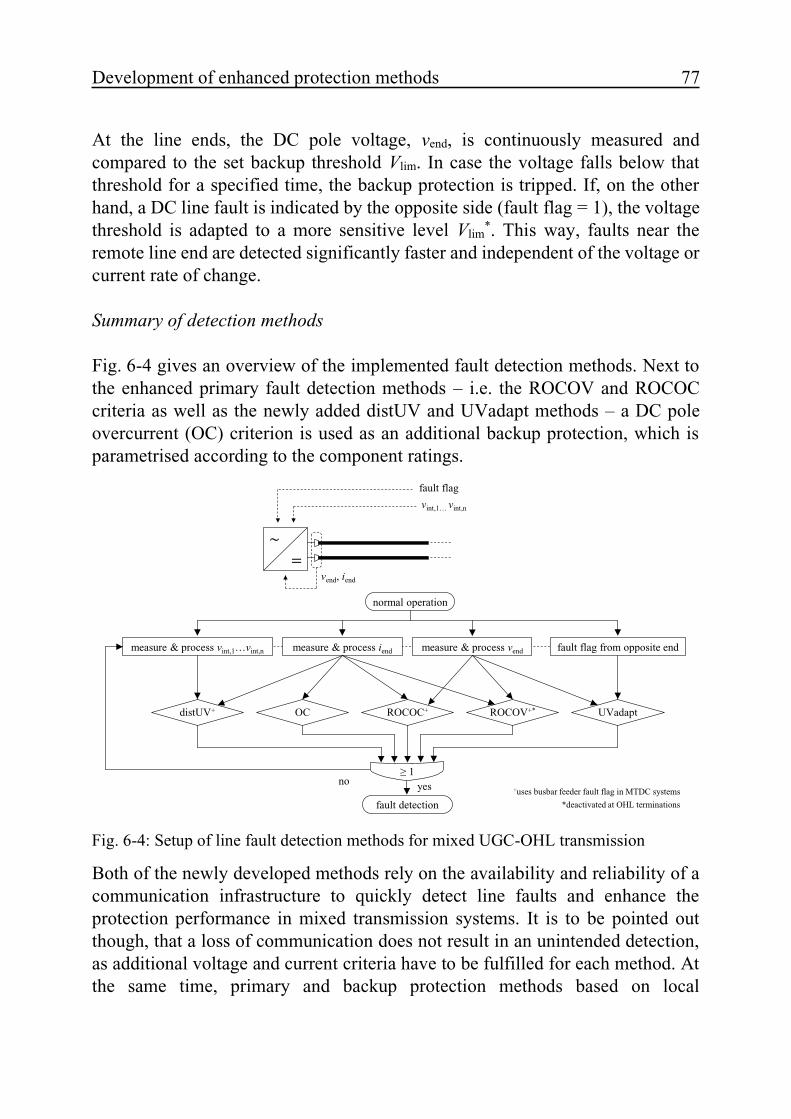
Development of enhanced protection methods 77
At the line ends, the DC pole voltage, vend, is continuously measured and compared to the set backup threshold Vlim. In case the voltage falls below that threshold for a specified time, the backup protection is tripped. If, on the other hand, a DC line fault is indicated by the opposite side (fault flag = 1), the voltage threshold is adapted to a more sensitive level Vlim
*. This way, faults near the remote line end are detected significantly faster and independent of the voltage or current rate of change.
Summary of detection methods
Fig. 6-4 gives an overview of the implemented fault detection methods. Next to the enhanced primary fault detection methods – i.e. the ROCOV and ROCOC criteria as well as the newly added distUV and UVadapt methods – a DC pole overcurrent (OC) criterion is used as an additional backup protection, which is parametrised according to the component ratings.
Both of the newly developed methods rely on the availability and reliability of a communication infrastructure to quickly detect line faults and enhance the protection performance in mixed transmission systems. It is to be pointed out though, that a loss of communication does not result in an unintended detection, as additional voltage and current criteria have to be fulfilled for each method. At the same time, primary and backup protection methods based on local
Fig. 6-4: Setup of line fault detection methods for mixed UGC-OHL transmission
vint,1… vint,n
vend, iend
fault flag
normal operation
distUV+ OC ROCOV+* UVadaptROCOC+
measure & process vint,1…vint,n measure & process iend measure & process vend fault flag from opposite end
no
fault detection
yes≥ 1
*deactivated at OHL terminations
+uses busbar feeder fault flag in MTDC systems
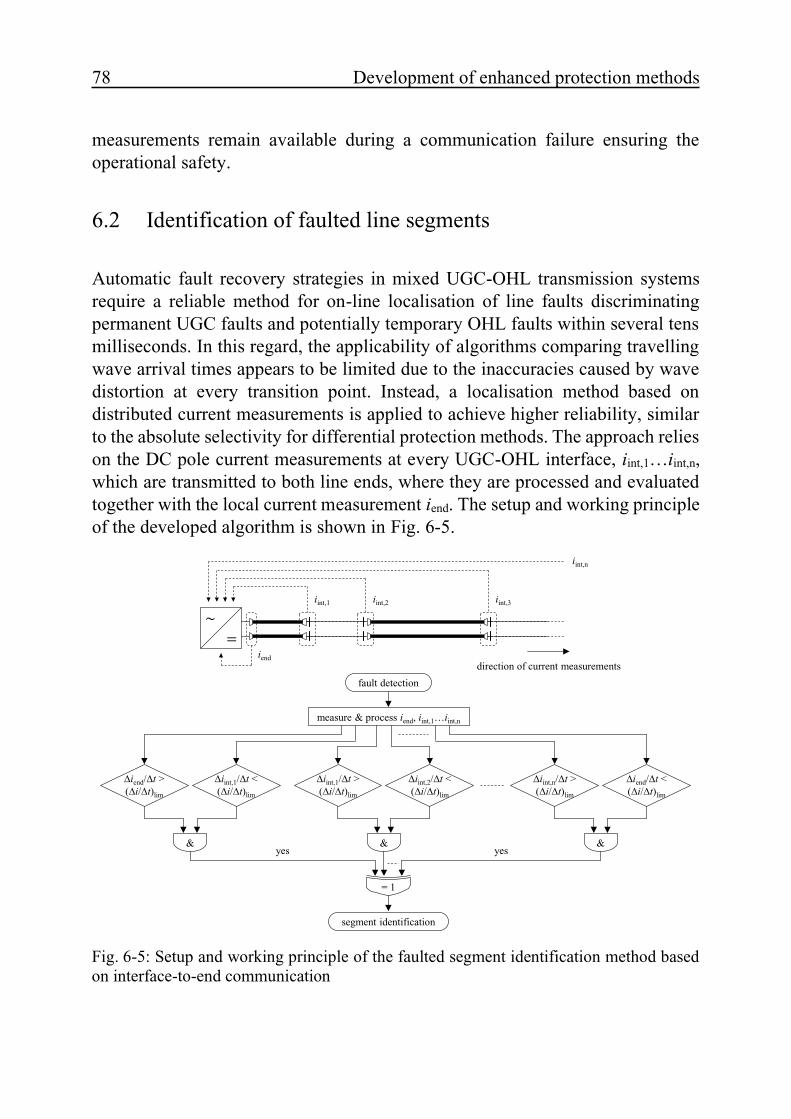
78 Development of enhanced protection methods
measurements remain available during a communication failure ensuring the operational safety.
6.2 Identification of faulted line segments
Automatic fault recovery strategies in mixed UGC-OHL transmission systems require a reliable method for on-line localisation of line faults discriminating permanent UGC faults and potentially temporary OHL faults within several tens milliseconds. In this regard, the applicability of algorithms comparing travelling wave arrival times appears to be limited due to the inaccuracies caused by wave distortion at every transition point. Instead, a localisation method based on distributed current measurements is applied to achieve higher reliability, similar to the absolute selectivity for differential protection methods. The approach relies on the DC pole current measurements at every UGC-OHL interface, iint,1…iint,n, which are transmitted to both line ends, where they are processed and evaluated together with the local current measurement iend. The setup and working principle of the developed algorithm is shown in Fig. 6-5.
Fig. 6-5: Setup and working principle of the faulted segment identification method based on interface-to-end communication
iint,1 iint,2 iint,3
iint,n
ienddirection of current measurements
∆iend/∆t > (∆i/∆t)lim
∆iint,1/∆t < (∆i/∆t)lim
∆iint,n/∆t > (∆i/∆t)lim
∆iend/∆t < (∆i/∆t)lim
∆iint,1/∆t > (∆i/∆t)lim
∆iint,2/∆t < (∆i/∆t)lim
measure & process iend, iint,1…iint,n
fault detection
& &&yes yes
= 1
segment identification
Development of enhanced protection methods 79
If a line fault in the mixed transmission system is detected, the distributed current measurements are analysed to identify the faulted line segment. Several approaches are conceivable for this purpose, e.g. the calculation of differential currents taking into account the different interface-to-end communication time delays [Tze18]. However, since the quasi-stationary fault behaviour of any DC system depends on its topological and technological setup, a more versatile approach based on the initial sing of the ROCOC is chosen.
As soon as any of the recorded current measurements is subject to a positive or negative change above/below a set threshold of ±(∆i/∆t)lim, the sign of the change is stored. Afterwards, the current change tendencies at both ends of each segment are compared. The faulted segment is identified clearly, if the current changes at both ends tend towards the segment, as the surrounding line segments and/or converters discharge into the fault location. In Fig. 6-5, the direction of current measurements is indicated from left to right. Hence, for a fault on the positive pole, the faulted line segment is characterised by a positive current change at its left end and a negative current change at its right end. The tendencies are vice versa in case of a negative pole fault.
Since the method is based on simple threshold comparisons, its operating time mainly depends on the time required to transmit and process the measurement data. Assuming a communication speed of ucom = 200 km/ms, the faulted line segment is identified within a few milliseconds after fault occurrence in most topologies. Hence, automatic recovery strategies can be realised without further delays.

80 Development of enhanced protection methods
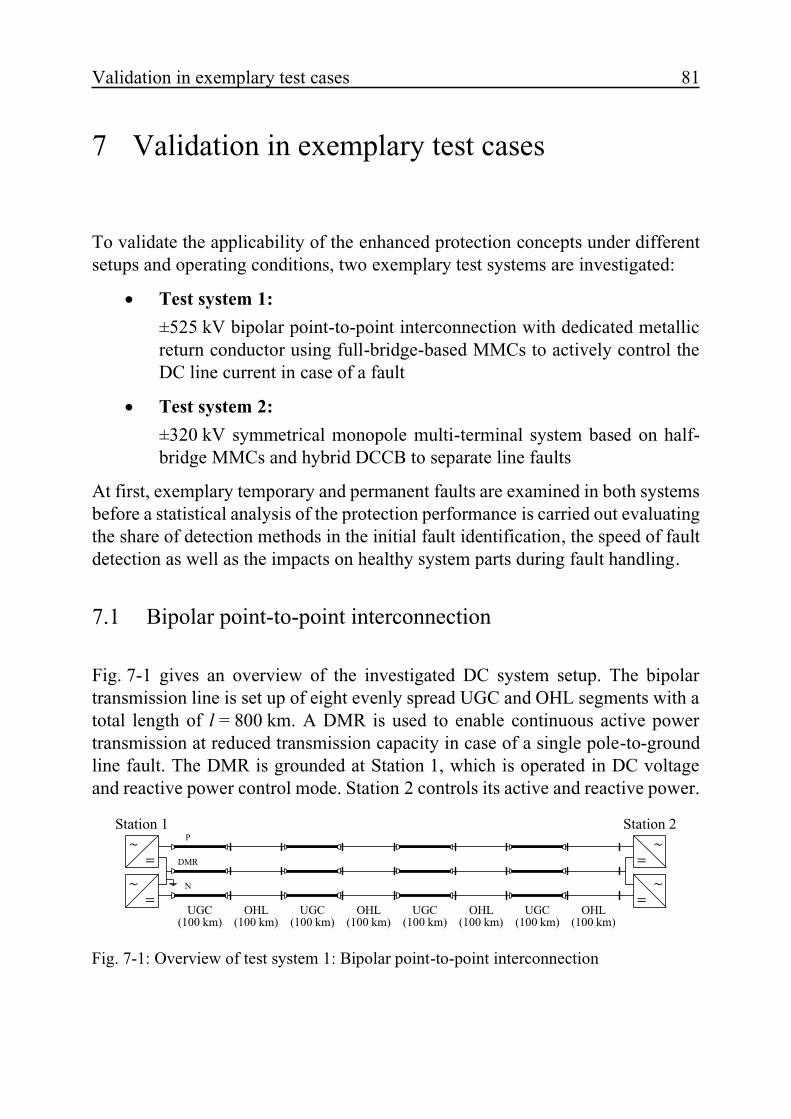
Validation in exemplary test cases 81
7 Validation in exemplary test cases
To validate the applicability of the enhanced protection concepts under different setups and operating conditions, two exemplary test systems are investigated:
Test system 1:
±525 kV bipolar point-to-point interconnection with dedicated metallic return conductor using full-bridge-based MMCs to actively control the DC line current in case of a fault
Test system 2:
±320 kV symmetrical monopole multi-terminal system based on half-bridge MMCs and hybrid DCCB to separate line faults
At first, exemplary temporary and permanent faults are examined in both systems before a statistical analysis of the protection performance is carried out evaluating the share of detection methods in the initial fault identification, the speed of fault detection as well as the impacts on healthy system parts during fault handling.
7.1 Bipolar point-to-point interconnection
Fig. 7-1 gives an overview of the investigated DC system setup. The bipolar transmission line is set up of eight evenly spread UGC and OHL segments with a total length of l = 800 km. A DMR is used to enable continuous active power transmission at reduced transmission capacity in case of a single pole-to-ground line fault. The DMR is grounded at Station 1, which is operated in DC voltage and reactive power control mode. Station 2 controls its active and reactive power.
Fig. 7-1: Overview of test system 1: Bipolar point-to-point interconnection
Station 2P
N
DMR
Station 1
UGC (100 km)
OHL (100 km)
UGC (100 km)
OHL (100 km)
OHL (100 km)
UGC (100 km)
OHL (100 km)
UGC (100 km)

82 Validation in exemplary test cases
Within the converter stations, each MMC arm comprises 215 full-bridge submodules with submodule capacitances of Csm = 5.0 mF at a rated voltage of Vr,sm = 2.7 kV. Lumped reactances of Ldc = 150 mH and Ldc = 25 mH are installed at the DC terminals of Station 1 and Station 2, respectively. The higher value at Station 1 is required to limit the transient current infeed from the converter station in case of a line fault, as the cable capacitances discharge into the fault location. Surge arresters rated at 20 kA with a 8/20 µs characteristic are installed at every UGC segment end [Ste03]. The converter-internal protections are set up according to the descriptions of the EMTP simulation framework in chapter 3.1.
First, the system’s reaction to a permanent UGC fault is examined. For this purpose, a short-circuit is evoked between the positive pole and ground at a distance of ∆xfault = 620 km from Station 1. Before the fault occurs, rated active power is transmitted from Station 1 to Station 2 and both converter stations provide reactive power to the connected AC grids. The resulting DC pole voltages and currents recorded at both line terminations are shown in Fig. 7-2 along with the fault detection signals. Below, the fault handling process is described referring to the points in time (1) to (4) indicated in the figure.
After fault inception at Δtsim = 0 ms (1), voltage and current travelling waves propagate through the transmission line in both directions. They reach Station 2 after approximately Δtsim 0.8 ms and Station 1 after Δtsim 2.9 ms instantly causing a voltage drop and current rise on the affected pole as well as transient voltage and current changes on the healthy conductors (2). Multiple detection methods quickly identify the contingency in the positive pole protection zone initiating the fault handling process (3). At Station 2, the ROCOC algorithm is the first to detect the fault at Δtsim 0.2 ms after the initial travelling wave impact due to the proximity of the fault location to the line end and the steep current change caused by travelling wave amplification at the UGC-to-OHL transition. Shortly afterwards, the distUV method detects the fault as well, as the voltage drop at the interface between segment 6 and segment 7 is recorded and the information is transmitted to the line end. At Station 1, a clear initial wave front cannot be detected, as the travelling waves propagate via several hundred kilometres and multiple UGC-OHL transitions. The fault is therefore detected first by the distUV method at Δtsim 1.0 ms after the initial travelling wave impact followed by the UVadapt method using the e2e communication channel from Station 2 to Station 1. The UV backup detection is tripped belatedly at both stations, as the DC voltage continuously stays below the set threshold of vdc < 0.5 pu.
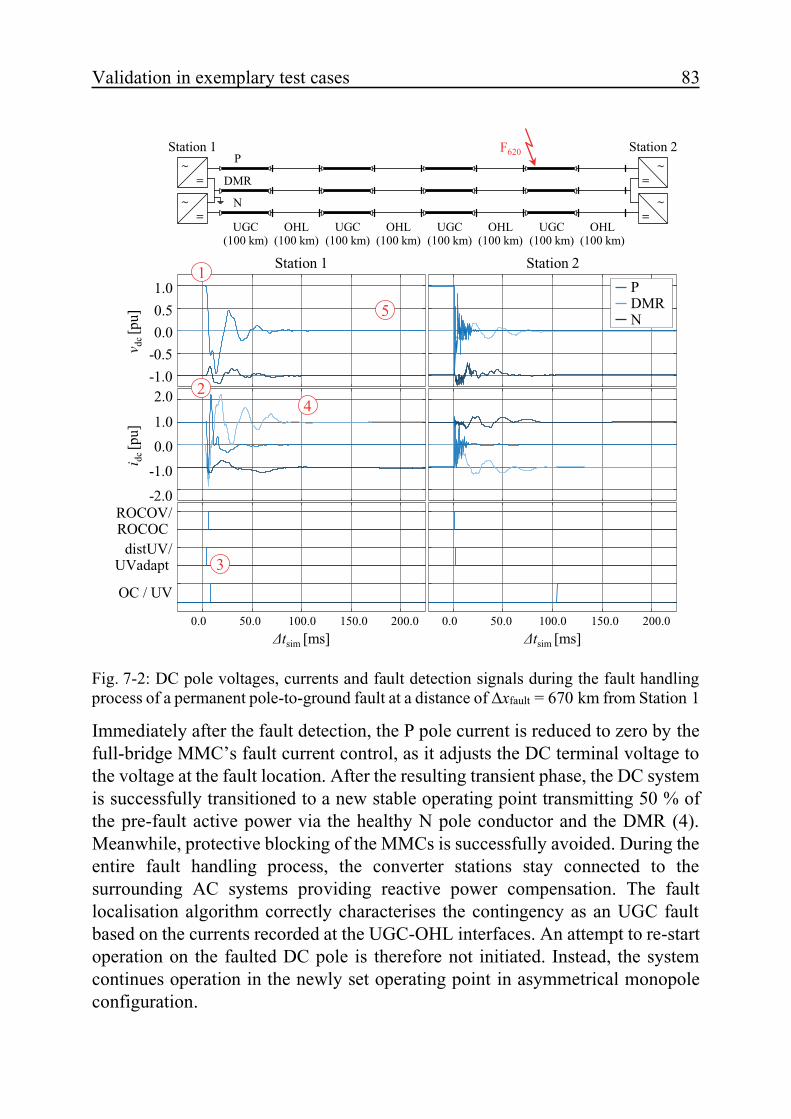
Validation in exemplary test cases 83
Immediately after the fault detection, the P pole current is reduced to zero by the full-bridge MMC’s fault current control, as it adjusts the DC terminal voltage to the voltage at the fault location. After the resulting transient phase, the DC system is successfully transitioned to a new stable operating point transmitting 50 % of the pre-fault active power via the healthy N pole conductor and the DMR (4). Meanwhile, protective blocking of the MMCs is successfully avoided. During the entire fault handling process, the converter stations stay connected to the surrounding AC systems providing reactive power compensation. The fault localisation algorithm correctly characterises the contingency as an UGC fault based on the currents recorded at the UGC-OHL interfaces. An attempt to re-start operation on the faulted DC pole is therefore not initiated. Instead, the system continues operation in the newly set operating point in asymmetrical monopole configuration.
Fig. 7-2: DC pole voltages, currents and fault detection signals during the fault handling process of a permanent pole-to-ground fault at a distance of ∆xfault = 670 km from Station 1
1
-1.0
-0.5
0.0
0.5
1.0
-2.0
-1.0
0.0
1.0
2.0
0.0 50.0 100.0 150.0 200.0 0.0 50.0 100.0 150.0 200.0
Station 2Station 1
ROCOV/ROCOC
distUV/UVadapt
OC / UV
Station 2P
N
DMR
Station 1
UGC (100 km)
OHL (100 km)
UGC (100 km)
OHL (100 km)
OHL (100 km)
UGC (100 km)
OHL (100 km)
UGC (100 km)
Δtsim [ms] Δtsim [ms]
v dc[p
u]i d
c[p
u]F620
3
42
PDMRN
5

84 Validation in exemplary test cases
The on-line fault localisation process is shown in Fig. 7-3 indicating the recorded signs of the ROCOC at every line segment end (seg. 1…seg. 8). It can be seen that the pattern of initial ROCOC signs observed at the ends of segment 7 differs from the other segments, as the transmission line capacitances discharge in direction of the fault location. Only at the ends of segment 7, both currents initially change with a positive ROCOC sign while opposite initial signs are recorded at the other segment ends. The fault location is thus identified and the detected contingency is characterised as a permanent UGC fault.
In the following example, the fault handling process is investigated for a temporary OHL fault in test system 1 assuming the same pre-fault steady-state conditions as in the previous case. Fig. 7-4 shows the recorded pole voltages, currents and detection signals for a temporary pole-to-pole-to-ground fault (P-N-Gnd) at a distance of ∆xfault = 120 km from Station 1. The fault is initiated at Δtsim = 0 ms (1) sending out travelling waves, which arrive at Station 1 shortly afterwards at Δtsim 0.7 ms and at Station 2 after Δtsim 3.0 ms. Both the P and N pole voltages break down and the pole currents rise accordingly (2). Due to the vicinity of the fault to Station 1, the initial voltage change is high enough to be detected by the ROCOV criterion at Δtsim 0.3 ms after travelling wave arrival (3). In addition, the fault is detected by the distUV and OC criteria at Δtsim 1.2 ms and Δtsim 1.4 ms, respectively. Due to the significant distance
Fig. 7-3: Fault localisation based on the initial ROCOC sign at every segment end for a permanent pole-to-ground fault on the UGC segment 7
0.0 1.0 2.0 3.0 4.0 5.0 6.0
seg. 1
seg. 8
seg. 2
seg. 3
seg. 4
seg. 5
seg. 6
seg. 7
Station 2F620
P
N
DMR
Station 1
segment 1 segment 2 segment 3 segment 6segment 4 segment 5 segment 8segment 7
ROCOC sign at left endROCOC sign at right end
same sign indicates the faulted segment
Δtsim [ms]

Validation in exemplary test cases 85
between the fault location and Station 2 as well as the multitude of UGC-OHL transitions, the fault is detected there first by the distUV criterion at Δtsim 1.9 ms after travelling wave arrival. The UVadapt and ROCOC criteria both trip as well at Δtsim 2.5 ms and Δtsim 2.7 ms, respectively. Other than in the previously investigated UGC fault scenario, the UV criterion does not trip, as the fault is quickly characterised as an OHL fault and the system is operated in a recovery mode, in which further detection due to DC undervoltage is blocked.
After successful limitation of the DC pole current by the full-bridge MMC’s fault current control, active power transmission is suspended on both poles of the DC system to allow arc extinction in case the OHL fault is indeed temporary (4). During this period, both converters operate as a static synchronous compensator exclusively providing reactive power to the connected AC grids. Protective blocking of the MMCs is successfully avoided.
Fig. 7-4: DC pole voltages, currents and fault detection signals during the fault handling process of a temporary P-N-Gnd fault at a distance of ∆xfault = 120 km from Station 1
-1.0
-0.5
0.0
0.5
1.0
-2.0
-1.0
0.0
1.0
2.0
Station 2Station 1
ROCOV/ROCOC
distUV/UVadapt
OC / UV
Station 2F120P
N
DMR
Station 1
UGC (100 km)
OHL (100 km)
UGC (100 km)
OHL (100 km)
OHL (100 km)
UGC (100 km)
OHL (100 km)
UGC (100 km)
1
2
4
5
6
Δtsim [s]
PDMRN
v dc[p
u]i d
c[p
u]
0.0 0.25 0.5 07.5 1.0 0.0 0.25 0.5 0.75 1.0
Δtsim [s]
3
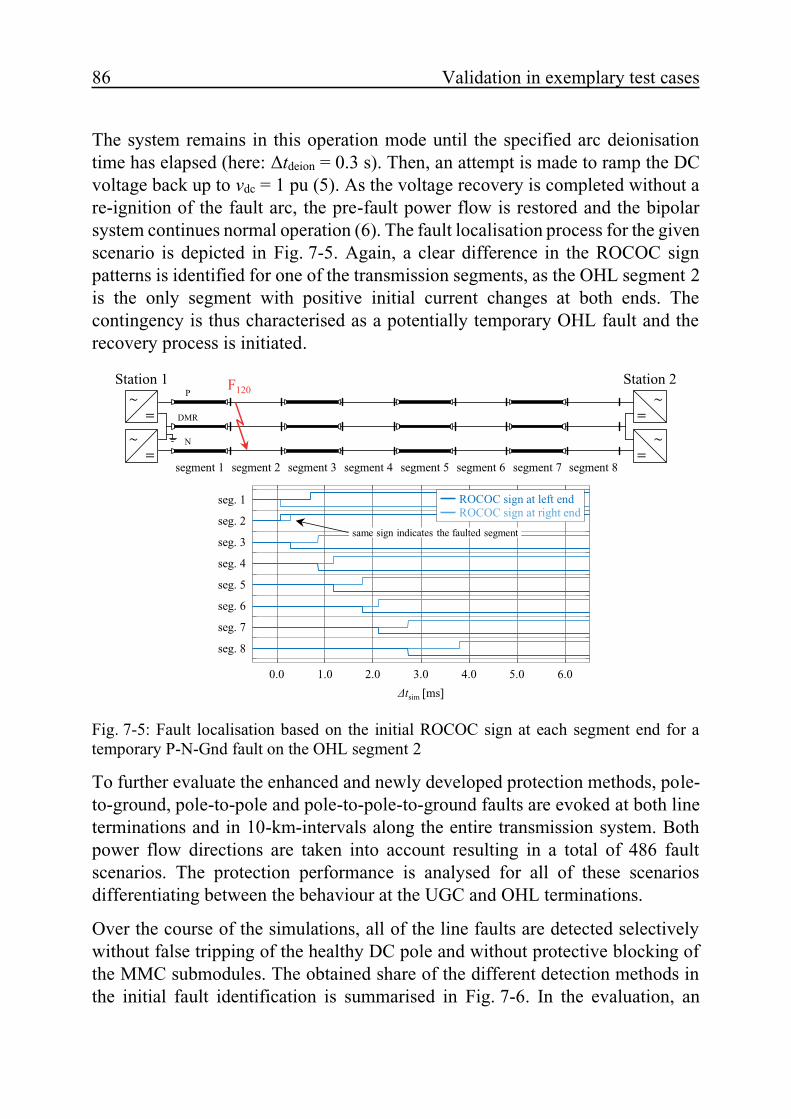
86 Validation in exemplary test cases
The system remains in this operation mode until the specified arc deionisation time has elapsed (here: Δtdeion = 0.3 s). Then, an attempt is made to ramp the DC voltage back up to vdc = 1 pu (5). As the voltage recovery is completed without a re-ignition of the fault arc, the pre-fault power flow is restored and the bipolar system continues normal operation (6). The fault localisation process for the given scenario is depicted in Fig. 7-5. Again, a clear difference in the ROCOC sign patterns is identified for one of the transmission segments, as the OHL segment 2 is the only segment with positive initial current changes at both ends. The contingency is thus characterised as a potentially temporary OHL fault and the recovery process is initiated.
To further evaluate the enhanced and newly developed protection methods, pole-to-ground, pole-to-pole and pole-to-pole-to-ground faults are evoked at both line terminations and in 10-km-intervals along the entire transmission system. Both power flow directions are taken into account resulting in a total of 486 fault scenarios. The protection performance is analysed for all of these scenarios differentiating between the behaviour at the UGC and OHL terminations.
Over the course of the simulations, all of the line faults are detected selectively without false tripping of the healthy DC pole and without protective blocking of the MMC submodules. The obtained share of the different detection methods in the initial fault identification is summarised in Fig. 7-6. In the evaluation, an
Fig. 7-5: Fault localisation based on the initial ROCOC sign at each segment end for a temporary P-N-Gnd fault on the OHL segment 2
0.0 1.0 2.0 3.0 4.0 5.0 6.0
seg. 1
seg. 8
seg. 2
seg. 3
seg. 4
seg. 5
seg. 6
seg. 7
Station 2P
N
DMR
Station 1
segment 1 segment 2 segment 3 segment 6segment 4 segment 5 segment 8segment 7
F120
Δtsim [ms]
ROCOC sign at left endROCOC sign at right end
same sign indicates the faulted segment
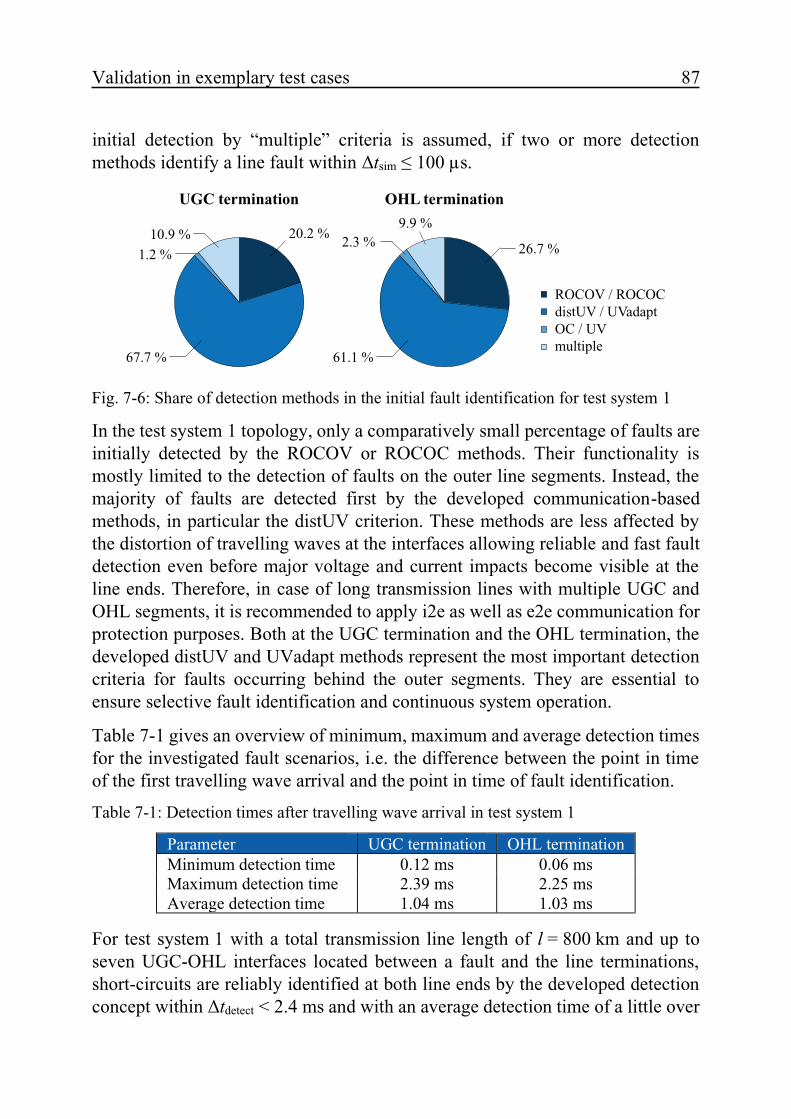
Validation in exemplary test cases 87
initial detection by “multiple” criteria is assumed, if two or more detection methods identify a line fault within Δtsim ≤ 100 µs.
In the test system 1 topology, only a comparatively small percentage of faults are initially detected by the ROCOV or ROCOC methods. Their functionality is mostly limited to the detection of faults on the outer line segments. Instead, the majority of faults are detected first by the developed communication-based methods, in particular the distUV criterion. These methods are less affected by the distortion of travelling waves at the interfaces allowing reliable and fast fault detection even before major voltage and current impacts become visible at the line ends. Therefore, in case of long transmission lines with multiple UGC and OHL segments, it is recommended to apply i2e as well as e2e communication for protection purposes. Both at the UGC termination and the OHL termination, the developed distUV and UVadapt methods represent the most important detection criteria for faults occurring behind the outer segments. They are essential to ensure selective fault identification and continuous system operation.
Table 7-1 gives an overview of minimum, maximum and average detection times for the investigated fault scenarios, i.e. the difference between the point in time of the first travelling wave arrival and the point in time of fault identification.
Table 7-1: Detection times after travelling wave arrival in test system 1
Parameter UGC termination OHL termination Minimum detection time 0.12 ms 0.06 ms Maximum detection time 2.39 ms 2.25 ms Average detection time 1.04 ms 1.03 ms
For test system 1 with a total transmission line length of l = 800 km and up to seven UGC-OHL interfaces located between a fault and the line terminations, short-circuits are reliably identified at both line ends by the developed detection concept within Δtdetect < 2.4 ms and with an average detection time of a little over
Fig. 7-6: Share of detection methods in the initial fault identification for test system 1
ROCOV / ROCOCdistUV / UVadaptOC / UVmultiple
UGC termination OHL termination
67.7 %
10.9 % 20.2 %
61.1 %
2.3 % 26.7 %1.2 %
9.9 %
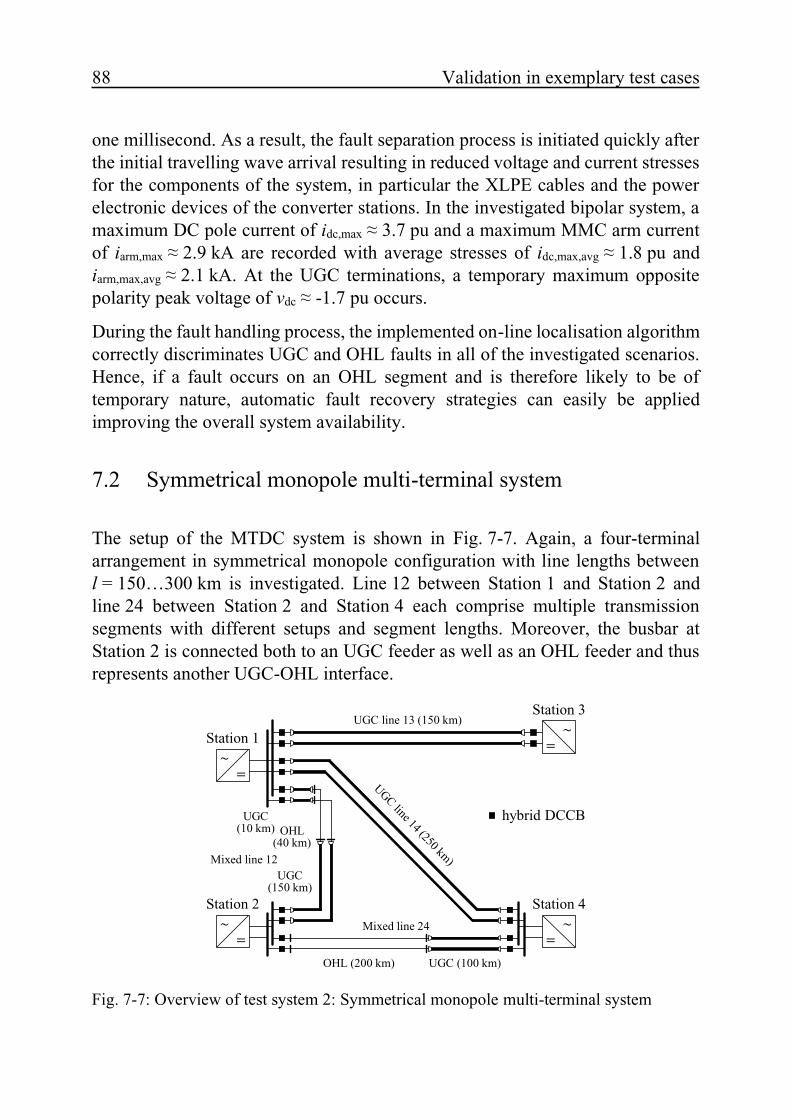
88 Validation in exemplary test cases
one millisecond. As a result, the fault separation process is initiated quickly after the initial travelling wave arrival resulting in reduced voltage and current stresses for the components of the system, in particular the XLPE cables and the power electronic devices of the converter stations. In the investigated bipolar system, a maximum DC pole current of idc,max ≈ 3.7 pu and a maximum MMC arm current of iarm,max ≈ 2.9 kA are recorded with average stresses of idc,max,avg ≈ 1.8 pu and iarm,max,avg ≈ 2.1 kA. At the UGC terminations, a temporary maximum opposite polarity peak voltage of vdc ≈ -1.7 pu occurs.
During the fault handling process, the implemented on-line localisation algorithm correctly discriminates UGC and OHL faults in all of the investigated scenarios. Hence, if a fault occurs on an OHL segment and is therefore likely to be of temporary nature, automatic fault recovery strategies can easily be applied improving the overall system availability.
7.2 Symmetrical monopole multi-terminal system
The setup of the MTDC system is shown in Fig. 7-7. Again, a four-terminal arrangement in symmetrical monopole configuration with line lengths between l = 150…300 km is investigated. Line 12 between Station 1 and Station 2 and line 24 between Station 2 and Station 4 each comprise multiple transmission segments with different setups and segment lengths. Moreover, the busbar at Station 2 is connected both to an UGC feeder as well as an OHL feeder and thus represents another UGC-OHL interface.
Fig. 7-7: Overview of test system 2: Symmetrical monopole multi-terminal system
Station 1
Station 3
Station 2 Station 4
UGC (10 km) OHL
(40 km)
UGC (150 km)
OHL (200 km) UGC (100 km)
UGC line 13 (150 km)
Mixed line 12
Mixed line 24
hybrid DCCB

Validation in exemplary test cases 89
In the given example, Station 1 is operated in DC voltage and reactive power control mode while the other stations control their active and reactive power exchange with the connected AC grids. The MMCs of the monopolar system contain 250 half-bridge submodules per converter arm with submodule capacitances of Csm = 5.2 mF at a rated voltage of Vr,sm = 2.7 kV. Lumped reactances of Ldc = 25 mH are installed at the DC terminals of the stations to limit the arm current rise during DC line faults and thus allow continuous system operation14. In addition to the common surge arrester and converter-internal protection settings, dynamic breaking systems, also known as DC choppers, are installed at Station 1 and Station 2 to be able to evacuate excess energy from the DC system and to provide fast voltage rebalancing after single pole-to-ground faults [Ruf19].
To separate a faulted DC line, hybrid DCCBs are installed at every line end along with dedicated lumped reactances to limit the rising fault currents (cf. chapter 3.1). At the UGC terminations, inductances of LDCCB,UGC = 250 mH are applied to reduce the impact of a line fault on adjacent healthy transmission lines. Due to the more inductive characteristics of OHLs compared to UGCs, a similar limiting effect is accomplished with a smaller inductance of LDCCB,OHL = 25 mH at the OHL termination near Station 2. Note that these values might be chosen differently in other systems depending on, amongst others, the given topology, component ratings and the protection philosophy. Surge arresters are installed at all UGC segment terminations and within the DCCBs according to the description of the EMTP simulation framework in chapter 3.1.
UGC faults near busbars comprising both UGC and OHL feeders are identified as the most challenging scenarios with respect to selective fault detection in MTDC systems. The protection functionality is therefore examined first for such a fault scenario. As indicated in Fig. 7-8, a permanent pole-to-ground short-circuit is evoked on the lower line 12 UGC section at a distance of ∆xfault = 170 km from Station 1. Before the fault occurs, rated active power is fed into the DC system from Station 3 and Station 4 while Station 2 provides rated active power to the AC grid. Station 1 balances the power flow. Fig. 7-8 shows the DC pole voltages and currents recorded at the two Station 2 busbar feeders along with the fault detection signals. Since the Station 1 busbar only comprises UGC feeders, the selective detection and separation of the line fault are less challenging at the upper end of the faulted line 12. The respective curves can be found in appendix A3.
14 In the indicated configuration, protective blocking only occurs at Station 4 for a few pole-to-pole short-circuits. To avoid this, the terminal inductance at Station 4 is increased to Ldc = 100 mH.
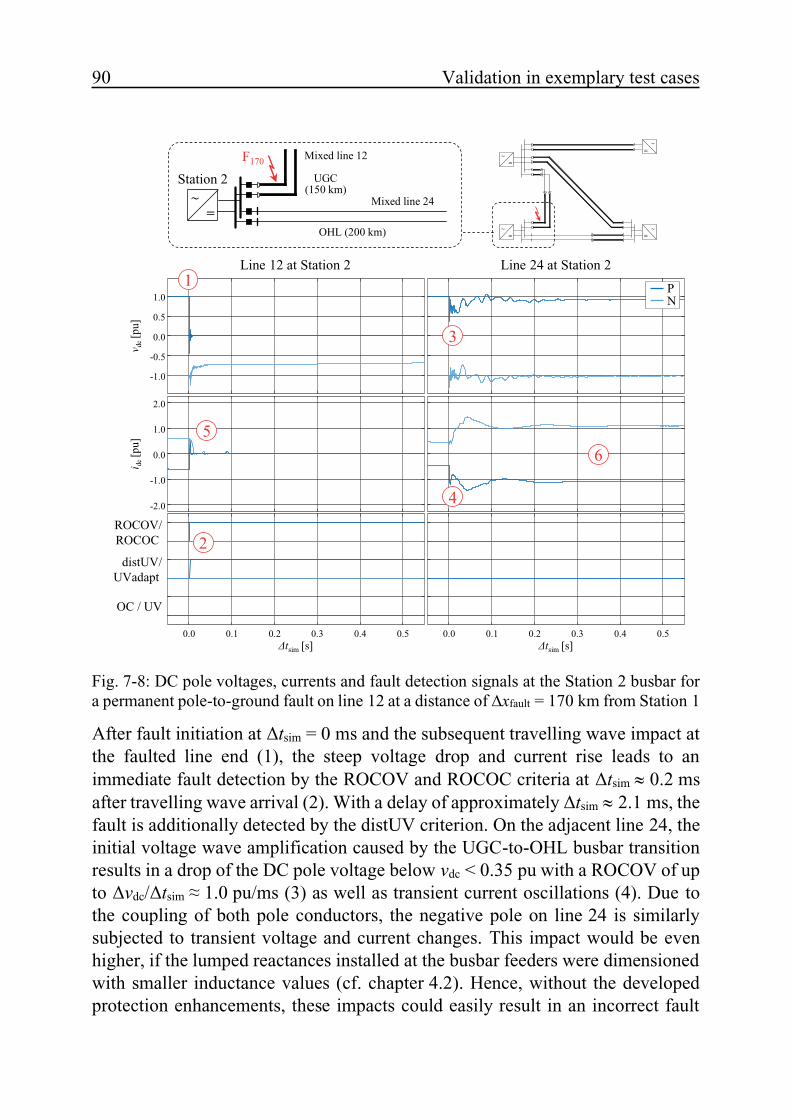
90 Validation in exemplary test cases
After fault initiation at Δtsim = 0 ms and the subsequent travelling wave impact at the faulted line end (1), the steep voltage drop and current rise leads to an immediate fault detection by the ROCOV and ROCOC criteria at Δtsim 0.2 ms after travelling wave arrival (2). With a delay of approximately Δtsim 2.1 ms, the fault is additionally detected by the distUV criterion. On the adjacent line 24, the initial voltage wave amplification caused by the UGC-to-OHL busbar transition results in a drop of the DC pole voltage below vdc < 0.35 pu with a ROCOV of up to Δvdc/Δtsim ≈ 1.0 pu/ms (3) as well as transient current oscillations (4). Due to the coupling of both pole conductors, the negative pole on line 24 is similarly subjected to transient voltage and current changes. This impact would be even higher, if the lumped reactances installed at the busbar feeders were dimensioned with smaller inductance values (cf. chapter 4.2). Hence, without the developed protection enhancements, these impacts could easily result in an incorrect fault
Fig. 7-8: DC pole voltages, currents and fault detection signals at the Station 2 busbar for a permanent pole-to-ground fault on line 12 at a distance of ∆xfault = 170 km from Station 1
0.0 0.1 0.2 0.3 0.4 0.50.0 0.1 0.2 0.3 0.4 0.5
-2.0
-1.0
0.0
1.0
2.0
-1.0
-0.5
0.0
0.5
1.0
Line 24 at Station 2Line 12 at Station 2
ROCOV/ROCOC
distUV/UVadapt
OC / UV
Station 2 UGC (150 km)
OHL (200 km)
Mixed line 12
Mixed line 24
F170
3
1
2
5
6
4
v dc[p
u]i d
c[p
u]
Δtsim [s] Δtsim [s]
PN
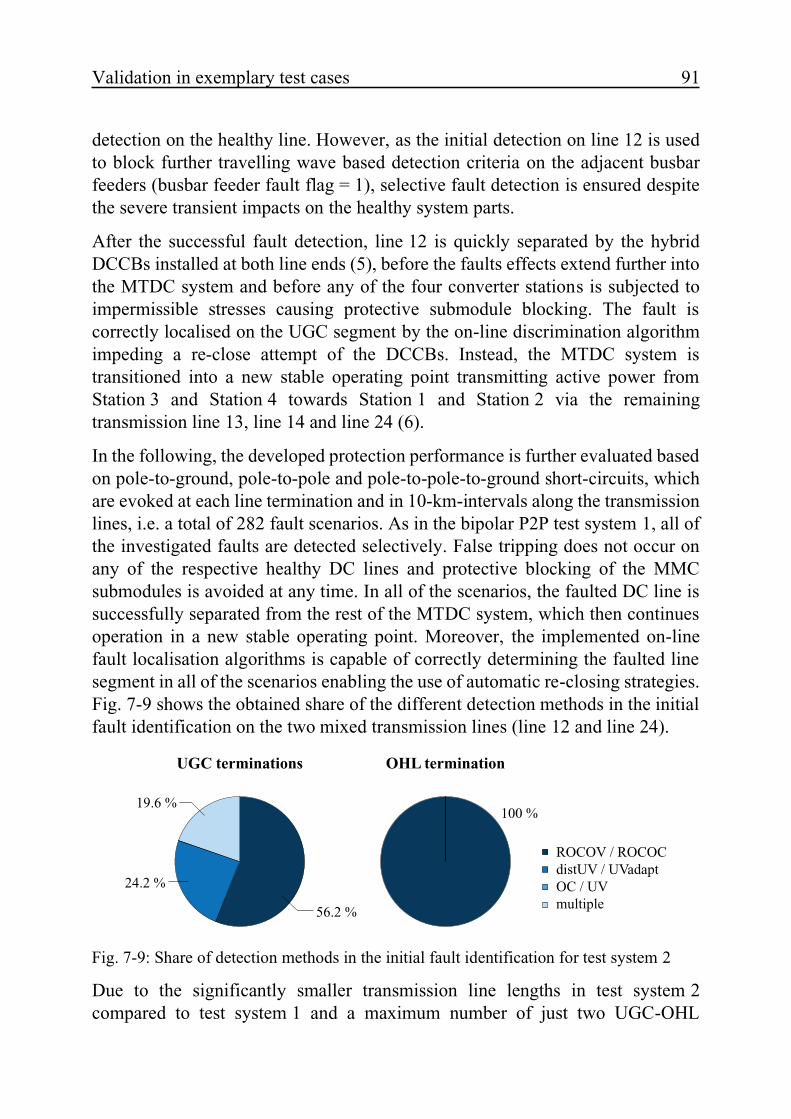
Validation in exemplary test cases 91
detection on the healthy line. However, as the initial detection on line 12 is used to block further travelling wave based detection criteria on the adjacent busbar feeders (busbar feeder fault flag = 1), selective fault detection is ensured despite the severe transient impacts on the healthy system parts.
After the successful fault detection, line 12 is quickly separated by the hybrid DCCBs installed at both line ends (5), before the faults effects extend further into the MTDC system and before any of the four converter stations is subjected to impermissible stresses causing protective submodule blocking. The fault is correctly localised on the UGC segment by the on-line discrimination algorithm impeding a re-close attempt of the DCCBs. Instead, the MTDC system is transitioned into a new stable operating point transmitting active power from Station 3 and Station 4 towards Station 1 and Station 2 via the remaining transmission line 13, line 14 and line 24 (6).
In the following, the developed protection performance is further evaluated based on pole-to-ground, pole-to-pole and pole-to-pole-to-ground short-circuits, which are evoked at each line termination and in 10-km-intervals along the transmission lines, i.e. a total of 282 fault scenarios. As in the bipolar P2P test system 1, all of the investigated faults are detected selectively. False tripping does not occur on any of the respective healthy DC lines and protective blocking of the MMC submodules is avoided at any time. In all of the scenarios, the faulted DC line is successfully separated from the rest of the MTDC system, which then continues operation in a new stable operating point. Moreover, the implemented on-line fault localisation algorithms is capable of correctly determining the faulted line segment in all of the scenarios enabling the use of automatic re-closing strategies. Fig. 7-9 shows the obtained share of the different detection methods in the initial fault identification on the two mixed transmission lines (line 12 and line 24).
Due to the significantly smaller transmission line lengths in test system 2 compared to test system 1 and a maximum number of just two UGC-OHL
Fig. 7-9: Share of detection methods in the initial fault identification for test system 2
ROCOV / ROCOCdistUV / UVadaptOC / UVmultiple
UGC terminations OHL termination
100 %
56.2 %
19.6 %
24.2 %
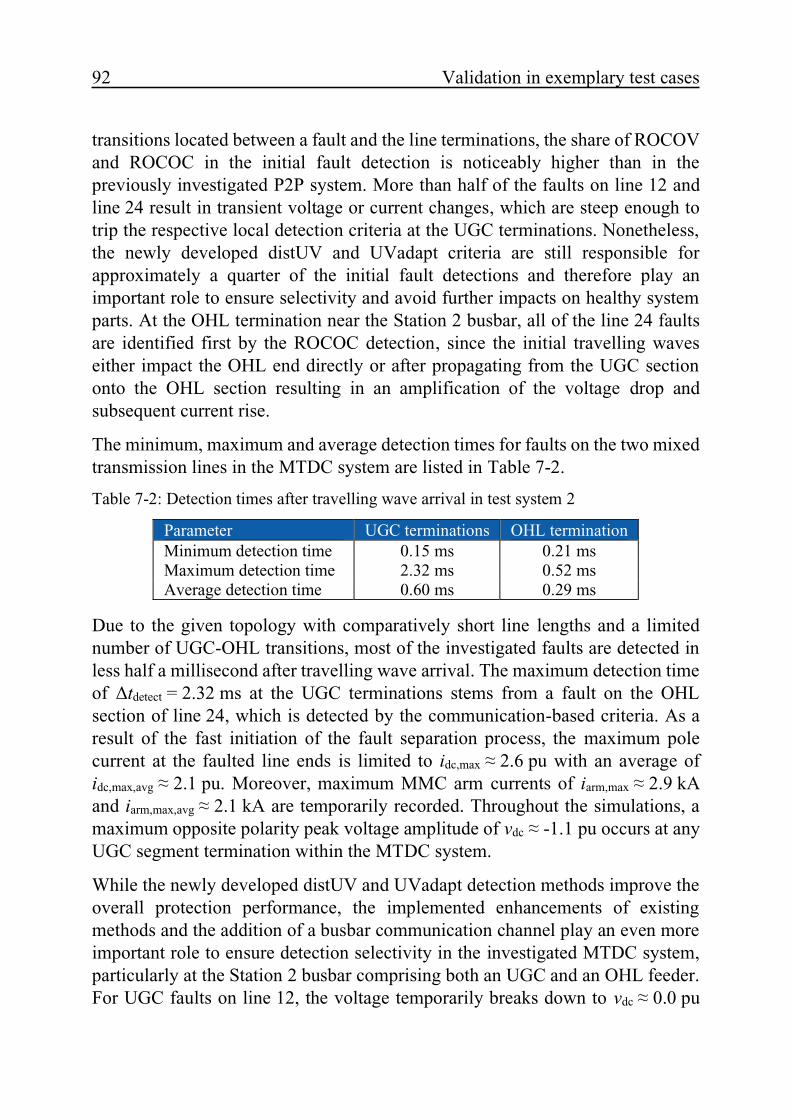
92 Validation in exemplary test cases
transitions located between a fault and the line terminations, the share of ROCOV and ROCOC in the initial fault detection is noticeably higher than in the previously investigated P2P system. More than half of the faults on line 12 and line 24 result in transient voltage or current changes, which are steep enough to trip the respective local detection criteria at the UGC terminations. Nonetheless, the newly developed distUV and UVadapt criteria are still responsible for approximately a quarter of the initial fault detections and therefore play an important role to ensure selectivity and avoid further impacts on healthy system parts. At the OHL termination near the Station 2 busbar, all of the line 24 faults are identified first by the ROCOC detection, since the initial travelling waves either impact the OHL end directly or after propagating from the UGC section onto the OHL section resulting in an amplification of the voltage drop and subsequent current rise.
The minimum, maximum and average detection times for faults on the two mixed transmission lines in the MTDC system are listed in Table 7-2.
Table 7-2: Detection times after travelling wave arrival in test system 2
Parameter UGC terminations OHL termination Minimum detection time 0.15 ms 0.21 ms Maximum detection time 2.32 ms 0.52 ms Average detection time 0.60 ms 0.29 ms
Due to the given topology with comparatively short line lengths and a limited number of UGC-OHL transitions, most of the investigated faults are detected in less half a millisecond after travelling wave arrival. The maximum detection time of Δtdetect = 2.32 ms at the UGC terminations stems from a fault on the OHL section of line 24, which is detected by the communication-based criteria. As a result of the fast initiation of the fault separation process, the maximum pole current at the faulted line ends is limited to idc,max ≈ 2.6 pu with an average of idc,max,avg ≈ 2.1 pu. Moreover, maximum MMC arm currents of iarm,max ≈ 2.9 kA and iarm,max,avg ≈ 2.1 kA are temporarily recorded. Throughout the simulations, a maximum opposite polarity peak voltage amplitude of vdc ≈ -1.1 pu occurs at any UGC segment termination within the MTDC system.
While the newly developed distUV and UVadapt detection methods improve the overall protection performance, the implemented enhancements of existing methods and the addition of a busbar communication channel play an even more important role to ensure detection selectivity in the investigated MTDC system, particularly at the Station 2 busbar comprising both an UGC and an OHL feeder. For UGC faults on line 12, the voltage temporarily breaks down to vdc ≈ 0.0 pu

Validation in exemplary test cases 93
on the healthy line 24, even though a total inductance of Lsum = 300 mH is installed between the two line ends. At the same time, positive ROCOC values of up to ∆idc/∆t = 0.3 pu/ms occur during the transient pole current oscillations on line 24. Adapting and enhancing the former travelling wave based fault detection methods therefore is essential to prevent a subsequent tripping on the OHL feeder.

94 Validation in exemplary test cases
Summary and outlook 95
8 Summary and outlook
Realising future VSC-HVDC systems with mixed power cable and overhead line transmission is seen as a viable means to address the increasing public objection to new transmission corridors, which is one of the main constraints for the required extensions of the power grid. To reduce the time needed for planning and commissioning of new lines, it is desirable to be able to flexibly adapt the transmission topology to different environments. Moreover, a combined use of cables and overhead lines allows an optimisation of space requirements and overall costs of the DC system.
So far, only limited operational experience with mixed UGC-OHL transmission systems is available, both in AC and DC applications, and several operational challenges still persist. In case of VSC-HVDC transmission, the increasing ratings of future systems no longer allow an entire system outage to clear line faults, as it is common practice in today’s point-to-point interconnectors. Bulk power transmission links and MTDC systems envisioned for the large-scale integration of renewable generation require reliable, fast and selective protection concepts to quickly react to contingencies on DC lines. For this purpose, several detection and localisation methods are proposed, which rely on the evaluation of transient voltage and current changes caused by travelling waves after fault occurrence. In addition, different technological approaches for fault separation exist, such as DC circuit breakers or fault-blocking converters with high-speed switches. These concepts are, however, typically designed for systems with either UGC or OHL transmission neglecting the impacts of mixed UGC-OHL setups.
Due to the different transmission properties of cables and overhead lines, every transition point between the two line types has a direct impact on the amplitude and shape of propagating travelling waves. Depending on the transition type, wave fronts are either amplified causing increased local voltage and current stresses or attenuated reducing the transient impact behind the transition point. As a result, the initial system behaviour during line faults can change significantly compared to pure UGC and pure OHL schemes.
To ensure a reliable protection of future VSC-HVDC systems with mixed usage of power cables and overhead lines, several investigations and developments are needed. The transient fault behaviour has to be analysed comprehensively to be able to assess the proposed methods for line fault handling and, if needed, develop
96 Summary and outlook
suitable enhancements. For this purpose, a stepwise investigation approach is chosen based on electromagnetic transient simulations in a developed model framework, which comprises detailed representations of the DC transmission systems, the control and protection infrastructure as well as an interface to allow an automated adaption of parameter settings for large-scale simulation sets.
In a first step, the propagation of voltage and current travelling waves and the resulting transient stresses at the transmission line ends and UGC-OHL interfaces are analysed. Various mixed transmission setups are considered to identify topological impact factors and to point out differences to pure UGC and pure OHL systems. Based on the results, several characteristics are identified, which have a direct impact on the performance of the line protection:
UGC-OHL transitions cause a wider range of initial transient impacts within the protection zone, as wave front amplitudes may exceed 1 pu or be reduced to shallow voltage and current changes lacking a clear front depending on the setup and fault location
Noticeable impact factors are the number of UGC-OHL transitions, the overall and segment line lengths as well as their arrangement
Travelling wave propagation via multiple transitions always results in significant attenuation of voltage and current wave amplitudes
In MTDC systems with busbars comprising both UGC and OHL feeders, severe transient impacts can be caused on healthy system parts despite the use of large inductances in the order of several hundred millihenry
AC-to-DC intersystem faults evoke substantial quasi-stationary voltage and current stresses at AC grid frequency along the entire mixed DC line
In a second step, the component safety and the functionality of existing fault detection, separation and localisation concepts are assessed in representative mixed topologies. Based on a statistical evaluation of the obtained voltage and current stresses and the protection criteria, the following aspects are identified as most relevant for the protection design:
Similar maximum current and opposite polarity voltage stresses are identified for pure UGC and mixed systems; no additional protective measures are required (exception: AC-to-DC intersystem faults)
Existing detection methods are only capable of selectively identifying faults near the line ends of P2P systems; in case of distant faults and in mixed MTDC systems, the use of additional detection criteria is needed
Summary and outlook 97
Mixed transmission systems do not inherently impede the use of DCCBs or fault-blocking MMCs for fault separation; both concepts are feasible
The attenuation of travelling wave fronts restricts the use of transient fault recorders at the line ends to discriminate UGC and OHL faults; instead, distributed measurements at the segment interfaces are needed
Based on the identified system behaviour and deficits of existing protection concepts, additional requirements for mixed systems are derived and enhanced fault detection and localisation methods are developed, most notably:
More robust setup of travelling wave based detection methods (enhanced trip logic, conservative thresholds, use of a busbar fault flag in MTDC)
Use of end-to-end as well as interface-to-end communication channels to incorporate distributed measurements and protection data
Development of distributed and adapted local undervoltage detection criteria based on the added communication channels
Implementation of a fault localisation algorithm based on a comparison of initial ROCOC signs at the line segment ends
In a final step, the functionality and flexible applicability of the enhanced line protection methods is validated in two test systems, which are set up according to relevant VSC-HVDC transmission configurations and technologies. A statistical analysis of the protection performance is carried out emphasising the importance of the added detection criteria as well as their positive impact on the speed of fault detection and the transient stresses imposed on the components. Even in extreme cases, line faults are detected with a maximum delay of ∆tdetect < 2.4 ms after travelling wave arrival, as the remotely available information of the faults are made accessible at the line ends with the help of the communication channels. A trip of the internal converter protection is successfully avoided in all of the investigated scenarios. Moreover, an accurate identification of the faulted line segment is guaranteed at all times enabling the use of fast fault revocery strategies to improve the overall availability of the DC transmission system.
The developed concepts are applicable to any VSC-HVDC system with mixed usage of power cables and overhead lines providing reliable, fast and selective line protection. Additional, project-specific adaptations related to the topology or the overall protection philosophy can be easily implemented taking into account the investigation results of this work.

98 Summary and outlook
References 99
References
[ABB13] ABB AB Grid Systems – HVDC, “HVDC Light® – It’s time to connect”, Ludvika, Sweden, 2013
[AlH16] H. A. Al Hassan, B. M. Grainger, T. E. McDermott, G. F. Reed, “Fault Location Identification of a Hybrid HVDC-VSC System Containing Cable and Overhead line Segments Using Transient Data”, 2016 IEEE/PES Transmission and Distribution Conference and Exposition, Dallas, USA, 2016
[Amp17] Amprion GmbH, “Underground Cables in the Transmission Grid – An Innovative Technology for Grid Expansion”, 2017
[An17] T. An, G. Tang, W. Wang, “Research and application on multi-terminal and DC grids based on VSC-HVDC technology in China”, IET High Voltage 2(1), pp. 1-10, 2017
[Ara19] T. Arai, S. Naoi, D. Suzuki, T. Murao, N. Kawakami, K. Usuki, K. Kashiwagi, A. Miura, “The Voltage-Sourced Converter applied to New Hokkaido-Honshu HVDC Link”, CIGRE-IEC 2019 Conference on EHV and UHV (AC & DC), Hakodate, Japan, 2019
[Arr07] J. Arrillaga, Y. H. Liu, N. R. Watson, “Flexible Power Transmission – The HVDC Options”, John Wiley & Sons, Chichester, UK, 2007
[Baw16] M. Bawart, M. Marzinotto, G. Mazzanti, “Diagnosis and Location of Faults in Submarine Power Cables”, IEEE Electrical Insulation Magazine 32(4), pp. 24-37, 2016
[Bed14] A. Beddard, M. Barnes, “HVDC Cable Modelling for VSC-HVDC Applications”, IEEE PES General Meeting, Washington, USA, 2014
[Bew63] L. V. Bewley, “Travelling Waves on Transmission Systems”, Dover Publications, Mineola, New York, 1963
[BmW16] Bundesministerium für Wirtschaft und Energie, “Nationales Reformprogramm 2016 – Unterrichtung durch die Bundesregierung“, Berlin, Germany, 2016
[Bra19] C. Brantl, P. Ruffing, P. Tünnerhoff, R. Puffer, “Impact of the HVDC system configuration on DC line protection”, 15th IET International Conference on AC and DC Power Transmission, Coventry, UK, 2019
[Buc14] M. Bucher, “Transient Fault Currents in HVDC VSC Networks During Pole-to-Ground Faults”, dissertation at ETH Zurich, Zurich, Switzerland, 2014

100 References
[Bui11] P. Buijs, D. Bekaert, S. Cole, D. Van Hertem, R. Belmans, “Transmission investment problems in Europe: Going beyond standard solutions”, Elsevier Energy Policy 39(3), pp. 1794-1801, 2011
[CEN18] CENELEC Technical Specification CLC/TS 50654-1, “HVDC Grid Systems and connected Converter Stations – Guideline and Parameter Lists for Functional Specifications – Part 1: Guidelines”, 2018
[Cha14] N. R. Chaudhuri, B. Chaudhuri, R. Majumder, A. Yazdani, “Multi-terminal Direct-Current Grids – Modeling, Analysis, and Control”, Wiley-IEEE Press, Hoboken, USA, 2014
[CIG09] CIGRE WG B1.10, TB 379, “Update of Service Experience of HV Underground and Submarine Cable Systems”, 2009
[CIG12] CIGRE WG B1.32, TB 496, “Recommendations for Testing DC Extruded Cable Systems for Power Transmission at a Rated Voltage up to 500 kV”, 2012
[CIG13a] CIGRE WG B4.52, TB 533, “HVDC Grid Feasibility Study”, 2013 [CIG13b] CIGRE WG B4.38, TB 563, “Modelling and Simulation Studies to
be performed during the lifecycle of HVDC Systems”, 2013 [CIG14] CIGRE WG B4.57, TB 604, “Guide for the Development of Models
for HVDC Converters in a HVDC Grid”, 2014 [CIG17] CIGRE JWG B4/B5.59, TB 739 “Technical Requirements and
Specifications of State-of-the-Art HVDC Switching Equipment”, 2017
[CIG18] CIGRE JWG A3/B4.34, TB 683 “Protection and Local Control of HVDC-Grids”, 2018
[DeK11] K. De Kerf, K. Srivastava, M. Reza, D. Bekaert, S. Cole, D. Van Hertem, R. Belmans, “Wavelet-based protection strategy for DC faults in multi-terminal VSC HVDC systems”, IET Generation, Transmission & Distribution 5(4), pp. 496-503, 2011
[Der81] A. Deri, G. Tevan, A. Semlyen, A. Castanheira, “The Complex Ground Return Plane – A Simplified Model for Homogeneous and Multi-Layer Earth Return”, IEEE Transactions on Power Apparatus and Systems 100(8), pp. 3686-3693, 1981
[DeS07] H. M. J. De Silva, A. M. Gole, L. M. Wendepohl, “Accurate Electromagnetic Transient Simulations of HVDC Cables and Overhead Transmission Lines”, Proceedings of the International Conference on Power Systems Transients 2007, Lyon, France, 2007
References 101
[Dom69] H. W. Dommel, “Digital Computer Solution of Electromagnetic Transients in Single- and Multiphase Networks”, IEEE Transactions on Power Apparatus and Systems 88(4), pp. 388-399, 1969
[Dör16] D. Döring, D. Ergin, K. Würflinger, J. Dorn, F. Schettler, E. Spahic, “System integration aspects of DC circuit breakers”, IET Power Electronics, 9(2), pp. 219-227, 2016
[Dor12] J. Dorn, H. Gambach, J. Strauss, T. Westerweller, J. Alligan, “Trans Bay Cable – A Breakthrough of VSC Multilevel Converters in HVDC Transmission”, CIGRE Colloquium on HVDC and Power Electronic Systems, San Francisco, USA, 2012
[EC14] European Council, “Conclusions on 2030 Climate and Energy Policy Framework”, SN 79/14, Brussels, Belgium, 2014
[Eli17] Elia System Operator S.A., “Elia commissions the Stevin high-voltage line: a key milestone in the expansion of offshore wind farms and the continued integration of the European grid”, press release, 21 November 2017
[ENT11] ENTSO-E, Europacable, “Joint paper: Feasibility and technical aspects of partial undergrounding of extra high voltage power transmission lines”, Brussels, Belgium, 2011
[ENT16a] ENTSO-E, “Ten-Year Network Development Plan 2016”, 2016 Edition, Executive Report, Brussels, Belgium, 2016
[ENT16b] ENTSO-E, “Research, Development & Innovation Roadmap 2017-2026”, Brussels, Belgium, 2016
[Ere16] M. Eremia, C. Liu, A. Edris, “Advanced Solutions in Power Systems: HVDC, FACTS, and Artificial Intelligence, Wiley-IEEE Press, Hoboken, USA, 2016
[Eur11] Europacable, “An Introduction to High Voltage Direct Current (HVDC) Underground Cables”, Brussels, Belgium, 2011
[Fab08] D. Fabiani, G. C. Montanari, C. Laurent, G. Teyssedre, R. Bodega, P. H. F. Morshuis, L. A. Dissado, A. Campus, U. H. Nielsson, “Polymeric HVDC Cable Design and Space Charge Accumulation. Part 1: Insulation/Semicon Interface”, IEEE Electrical Insulation Magazine 23(6), pp. 11-19, 2008
[Fra11] C. M. Franck, “HVDC Circuit Breakers: A Review Identifying Future Research Needs”, IEEE Transactions on Power Delivery 26(2), pp. 998-1007, 2011
102 References
[Gus99] B. Gustavsen, G. Irwin, R. Mangelrød, D. Brandt, K. Kent, “Transmission Line Models for the Simulation of Interaction Phenomena Between Parallel AC and DC Overhead Lines”, Proceedings of the International Conference on Power Systems Transients 1999, pp. 61-67, Budapest, Hungary, 1999
[Gus05] B. Gustavsen, J. A. Martinez, D. Durbak, “Parameter Determination for Modeling System Transients – Part II: Insulated Cables”, IEEE Transactions on Power Delivery 20(3), pp. 2045-2050, 2005
[Häf11] J. Häfner, B. Jacobson, “Proactive Hybrid HVDC Breakers – A key innovation for reliable HVDC grids”, CIGRE International Symposium, Bologna, Italy, 2011
[Han03] T. L. Hanley, R. P. Buford, R. J. Fleming, K. W. Barber, “A General Review of Polymeric Insulation for Use in HVDC Cables”, IEEE Electrical Insulation Magazine 19(1), pp. 13-24, 2003
[Hae17] M. Haeusler, S. Biswas, “HVDC Solutions for Integration of the Renewable Energy Resources”, International Conference on Large-Scale Grid Integration of Renewable Energy in India, New Delhi, India, 2017
[IEA11] International Energy Agency, Energy Research Institute, “Technology Roadmap – China Wind Energy Development Roadmap 2050”, Beijing, China, 2011
[IEC16] International Electrotecnical Commission, “IEC 61869-9: Instrument transformers – Part 9: Digital interface for instrument transformers”, 2016
[IEC17] International Electrotecnical Commission, “IEC 62895: High voltage direct current (HVDC) power transmission – cables with extruded insulation and their accessories for rated voltages up to 320 kV for land applications – test methods and requirements”, 2017
[IEE17] IEEE PES Power System Relaying and Control Committee, “Impact of Voltage Source Converter (VSC) Based HVDC Transmission on AC System Protection”, technical report, 2017
[Inf18] Infineon, Datasheet FZ1200R45HL3, IHM-B module with trench/ fieldstop IGBT3 and emitter controlled 3 diode, 2018
[Jov15] D. Jovcic, K. Ahmed, “High-Voltage Direct-Current Transmission – Converters, Systems and DC Grids”, Wiley-IEEE Press, Chichester, UK, 2015

References 103
[Kar15] C. Karawita, D. H. R. Suriyaarachchi, M. Mohaddes, “A Controlled DC Fault Clearance Mechanism for Full-Bridge MMC VSC Converters”, CIGRE International Symposium: Across Borders – HVDC Systems and Market Integration, Lund, Sweden, 2015
[Kie03] F. Kiessling, P. Nefzger, J. F. Nolasco, U. Kaintzyk, “Overhead Power Lines – Planning, Design, Construction”, Springer, Berlin, Heidelberg, Germany, 2003
[Kin15] R. King, C. Barker, A. Tzimas, G. Lucas, N. Kirby, “Validation of Cable Modelling for HVDC Transient Analysis Simulation”, 2015 CIGRE Canada Conference, Winnipeg, Canada, 2015
[Küc18] A. Küchler, “High Voltage Engineering: Fundamentals – Technology – Applications”, Springer Vieweg, Berlin, Germany, 2018
[Kwo17] G. Kwon, C. Lee, G. Lee, Y. Lee, S. Chang, C. Jung, J. Kang, Y. Shin, “Offline Fault Localization Technique on HVDC Submarine Cable via Time-Frequency Domain Reflectometry”, IEEE Transactions of Power Delivery 32(3), pp. 1626-1635, 2017
[Lab12] P. Labra Francos, S. Sanz Verdugo, H. Fernández Álvarez, S. Guyomarch, J. Loncle, “INELFE – Europe’s first integrated onshore HVDC interconnection”, IEEE PES General Meeting, San Diego, USA, 2012
[Let16] W. Leterme, “Communication-less Protection Algorithms for Meshed VSC HVDC Cable Grids”, dissertation at KU Leuven, Leuven, Belgium, 2016
[Lun17] P. Lundberg, F. Johansson, O. Vestergaard, J. Brake, “Maritime Link – enabling high availability with a VSC HVDC transmission”, CIGRE SC A3, B4 & D1 Colloquium, Winnipeg, Canada, 2017
[Mag16] T. G. Magg, F. Amputu, M. Manchen, E. Krige, J. Wasborg, K. Gustavsson, “Zambezi (previously Caprivi) Link HVDC Interconnector: Review of Operational Performance in the First Five Years”, 46th CIGRE Session, Paris, France, 2016
[Man05] Manitoba HVDC Research Centre Inc., “EMTDC – Transient Analysis for PSCAD Power System Simulation, USER’S GUIDE – A Comprehensive Resource for EMTDC”, Winnipeg, Canada, 2005
[Man18] Manitoba Hydro International Ltd., “PSCADTM – Power Systems Computer Aided Design, USER’S GUIDE of the use of PSCAD”, Winnipeg, Canada, 2018
104 References
[Mar10] R. Marquardt, “Modular Multilevel Converter: An universal concept for HVDC-Networks and extended DC-Bus-applications”, Proceedings of the 2010 International Power Electronics Conference, pp. 502-507, Sapporo, Japan, 2010
[Mar19] A.-K. Marten, V. Akhmatov, R. Storonowski, “Kriegers Flak Combined Grid Solution – novel double use of offshore equipment”, 15th IET International Conference on AC and DC Power Transmission, Coventry, UK, 2019
[Maz13] G. Mazzanti, M. Marzinotto, “Extruded Cables for High-Voltage Direct-Current Transmission – Advances in Research and Development”, Wiley-IEEE Press, Piscataway, USA, 2013
[Men14] R. Menges, G. Beyer, “Underground cables versus overhead lines: Do cables increase social acceptance of grid development? Results of a contingent valuation survey in Germany”, International Journal of Sustainable Energy Planning and Management 3, pp. 33-48, 2014
[Mor99] A. Morched, B. Gustavsen, M. Tartibi, “A Universal Model for Accurate Calculation of Electromagnetic Transients on Overhead Lines and Underground Cables”, IEEE Transactions on Power Delivery 14(3), pp. 1032-1038, 1999
[Nai04] D. Naidoo, N. M. Ijumba, “HVDC Line Protection for the Proposed Future HVDC Systems”, Proceedings of the 2004 International Conference on Power System Technology, Singapore, 2004
[Nan12] O. M. K. K. Nanayakkara, A. D. Rajapakse, R. Wachal, “Location of DC Line Faults in Conventional HVDC Systems With Segments of Cables and Overhead Lines Using Terminal Measurements”, IEEE Transactions on Power Delivery 27(1), pp. 279-288, 2012
[Nat15] National Grid, “Undergrounding high voltage electricity transmission lines – The technical issues”, 2015
[Nor10] Nordic Energy Regulators (NordREG), “Grid investments in a Nordic perspective”, Report to EMG, Eskilstuna, Sweden, 2010
[NRE17] National Renewable Energy Laboratory, Lawrence Berkeley National Laboratory, Power System Operation Corporation, United States Agency for International Development, “Greening the Grid – Pathways to Integrate 175 Gigawatts of Renewable Energy into India’s Electric Grid, Vol. I – National Study”, Golden, USA, 2017
[Pet15] C. Petino, D. Eichhoff, P. Tünnerhoff, A. Schnettler, “System protection during contact faults in hybrid AC/DC transmission systems”, CIGRE International Symposium: Across Borders – HVDC Systems and Market Integration, Lund, Sweden, 2015

References 105
[Pet17] C. Petino, “Classification and Handing of Intersystem Faults in Hybrid AC/DC Transmission Systems”, dissertation at RWTH Aachen University, Aachen, Germany, 2017
[Pip15] Y. Pipelzadeh, B. Chaudhuri, T. C. Green, Y. Wu, H. Pang, J. Cao, “Modelling and Dynamic Operation of the Zhoushan DC Grid: Worlds First Five-Terminal VSC-HVDC Project”, Proceedings of the 2015 International High Voltage Direct Current Conference, pp. 87-95, Seoul, Korea, 2015
[PRO16] PROMOTioN – Progress on Meshed HVDC Offshore Transmission Networks, D5.1, “HVDC Network Fault Analysis”, 2016
[PRO17] PROMOTioN – Progress on Meshed HVDC Offshore Transmission Networks, D4.2, “Broad comparison of fault clearing strategies for DC grids”, 2017
[Psa18] V. Psaras, A. Emhemed, G. Adam, G. Burt, “Review and Evaluation of the State of the Art of DC Fault Detection for HVDC Grids”, 53rd International Universities Power Engineering Conference, Glasgow, UK, 2018
[Rah08] S. Rahimi, W. Wiechowski, R. Randrup, J. Østergaard, A. H. Nielsen, “Identification of Problems when Using Long High Voltage AC Cable in Transmission System II: Resonance & Harmonic Resonance”, 2008 IEEE/PES Transmission and Distribution Conference and Exposition, Chicago, USA, 2008
[Rao15] H. Rao, “Architecture of Nan’ao Multi-terminal VSC-HVDC System and Its Multi-functional Control”, CSEE Journal of Power and Energy Systems 1(1), pp. 9-18, 2015
[Rie16] U. Riechert, M. Callavik, M. Salzer, P. Bergelin, “Compact High Voltage Direct Current (HVDC) Transmission Systems”, High Voltage Symposium, Stuttgart, Germany, 2016
[Rüd14] R. Rüdenberg “Electrical Shock Waves in Power Systems: Traveling Waves in Lumped and Distributed Circuit Elements”, Harvard University Press, Cambridge, USA, 2014
[Ruf18a] P. Ruffing, C. Petino, S. Rüberg, J. A. Campos Garcia, S. Beckler, A. Arnold, “Resonance Phenomena and DC Fault Handling during Intersystem Faults in Hybrid AC/DC Transmission Systems with Partial DC Cabling”, 2018 Power Systems Computation Conference, Dublin, Ireland, 2018

106 References
[Ruf18b] P. Ruffing, C. Brantl, C. Petino, A. Schnettler, “ Fault current control methods for multiterminal DC systems based on fault blocking converters”, IET The Journal of Engineering 2018(15), pp. 871-875, 2018
[Ruf19] P. Ruffing, C. Brantl, R. Puffer, “Post-Fault Voltage Recovery for Multi-Terminal HVDC Networks Based on Fault Blocking Converters”, CIGRE International Symposium: Going Offshore – Challenges of the future power grid, Aalborg, Denmark, 2019
[Sal97] M. Salah Khalil, “International Research and Development Trends and Problems of HVDC Cables with Polymeric Insulation”, IEEE Electrical Insulation Magazine 13(6), pp. 35-47, 1997
[Sha16] K. Sharifabadi, L. Harnefors, H.-P. Nee, S. Norrga, R. Teodorescu, “Design, Control, and Application of Modular Multilevel Converters for HVDC Transmission Systems”, Wiley-IEEE Press, Chichester, UK, 2016
[Shi02] T. Shimato, T. Hashimoto, M. Sampei, “The Kii Channel HVDC Link in Japan”, 39th CIGRE Session, Paris, France, 2002
[Sne16] J. Sneath, A. D. Rajapakse, “Fault Detection and Interruption in an Earthed HVDC Grid Using ROCOV and Hybrid DC Breakers”, IEEE Transactions on Power Delivery 31(3), pp. 973-981, 2016
[Sta14] V. Staudt, A. Steimel, M. Kohlmann, M. Kleine Jäger, C. Heising, D. Meyer, K. Vennemann, E. Grebe, D. Kleinekorte, “Control Concept Including Validation Strategy for an AC/DC Hybrid Link (»Ultranet«)”, Proceedings of the 2014 IEEE Energy Conversion Congress and Exposition, pp. 750-757, Pittsburgh, USA, 2014
[Ste03] K. Steinfeld, R. Göhler, D. Pepper, “High Voltage Surge Arresters for Protection of Series Compensation and HVDC Converter Stations”, Proceedings of the 4th International Conference on Power Transmission and Distribution Technology, pp. 1232-1243, Berlin, Germany, 2003
[Stu18] M. Stumpe, P. Ruffing, P. Wagner, A. Schnettler, “Adaptive Single-Pole Autoreclosing Concept with Advanced DC Fault Current Control for Full-Bridge MMC VSC Systems”, IEEE Transactions on Power Delivery 33(1) – special section on “Frontiers of DC technology”, pp. 321-329, 2018
[Swi18] Swissgrid AG, “Ground-breaking ceremony at «Gäbihübel»: Swissgrid starts construction of underground cabling near Bözberg/Riniken”, press release, 23 August 2018
References 107
[Tan18] G. Tang, H. Pang, Z. He, X. Wei, “Research on Key Technology and Equipment for Zhangbei 500kV DC Grid”, Proceedings of the 2018 International Power Electronics Conference, pp. 2343-2351, Niigata, Japan, 2018
[Ten13] TenneT TSO GmbH, Europacable, “Partial undergrounding complementing EHV overhead lines to accelerate grid extensions: the EnLAG opportunity!”, joint position paper of TenneT and Europacable, Berlin, Germany, 2013
[Tex96] Texas Instruments Inc., “The Bergeron Method – A Graphic Method for Determining Line Reflections in Transient Phenomena”, 1996
[Tün16] P. Tünnerhoff, C. Petino, M. Battiato, A. Schnettler, “Distance Protection for HVDC Transmission Lines Based on MMC Modulation Strategy”, 10th IEEE Electric Power Quality and Supply Reliability Conference, Tallinn, Estonia, 2016
[Tün17] P. Tünnerhoff, M. Stumpe, A. Schnettler, “Fault analysis of HVDC systems with partial underground cabling”, 13th IET International Conference on AC and DC Power Transmission, Manchester, UK, 2017
[Tün19a] P. Tünnerhoff, C. Brantl, D. Ergin, F. Schettler, A. Schön, D. Döring, “Impact of the DC circuit breaker design on selective fault detection and clearing methods in multi-terminal HVDC systems”, 15th IET International Conference on AC and DC Power Transmission, Coventry, UK, 2019
[Tün19b] P. Tünnerhoff, C. Brantl, R. Puffer, “Impacts of the mixed usage of cables and overhead lines on selective fault detection methods in multi-terminal HVDC systems”, CIGRE International Symposium: Going Offshore – Challenges of the future power grid, Aalborg, Denmark, 2019
[Tün19c] P. Tünnerhoff, P. Ruffing, R. Puffer, “Power cable stresses caused by transmission line faults in next generation VSC-MMC systems”, IET The Journal of Engineering 2019(16), pp. 2318-2323, 2019
[Tze18] D. Tzelepis, G. Fusiek, A. Dysko, P. Niewczas, C. Booth, X. Dong, “Novel Fault Location in MTDC Grids With Non-Homogeneous Transmission Lines Utilizing Distributed Current Sensing Technology”, IEEE Transactions on Smart Grid 9(5), pp. 5432-5443, 2018
[Van01] L. Van der Sluis,“Transients in Power Systems“, Wiley-IEEE Press, Chinchester, UK, 2001
108 References
[Van16] D. Van Hertem, O. Gomis-Bellmunt, J. Liang, “HVDC Grids – For Offshore and Supergrid of the Future”, Wiley-IEEE Press, Piscataway, USA, 2016
[Woo14] D. Woodford, “Symmetrical Monopole VSC Transmission”, Electranix Corporation, Winnipeg, Canada, 2014
[Zha96] Y. Zhang, J. Lewiner, C. Alquié, N. Hampton, “Evidence of Strong Correlation Between Space-charge Buildup and Breakdown in Cable Insulation”, IEEE Transactions on Dielectrics and Electrical Insulation 3(6), pp. 778-783, 1996
[Zho16] B. R. Zhou, C. Hong, X. M. Jin, T. Wang, H. X. Li, L. Huang, “Study of Backbone Structure Change From Synchronous to Asynchronous in China Southern Power Grid”, 46th CIGRE Session, Paris, France, 2016
[Zho18] H. Zhou, W. Qiu, K. Sun, J. Chen, X. Deng, F. Qiuan, D. Wang, B. Zhao, J. Li, S. Li, Y. Qiu, J. Yu, “Ultra-high Voltage AC/DC Power Transmission”, Zhejiang University Press, Beijing, China & Springer, Berlin, Germany, 2018

List of abbreviations 109
List of abbreviations
AC alternating current cf. Confer DC direct current DCCB direct current circuit breaker distUV distributed undervoltage DMR dedicated metallic return e.g. exempli gratia e2e end-to-end EHV extra high voltage EMT electromagnetic transient EMTP electromagnetic transient program FB full-bridge HVAC high voltage alternating current HVDC high voltage direct current i.e. id est i2e interface-to-end IGBT insulated-gate bipolar transistor LCC Line Commutated Converter MMC Modular Multilevel Converter MTDC multi-terminal direct current OC Overcurrent OHL overhead line P2P point-to-point P-N-Gnd pole-to-pole-to-ground RMS root mean square ROCOC rate of change of current ROCOV rate of change of voltage TIV transient interruption voltage UGC underground cable UVadapt adapted local undervoltage VSC Voltage Source Converter XLPE cross-linked polyethylene

110 List of abbreviations
List of publications 111
List of publications
Published journal articles
1) P. Tünnerhoff, P. Ruffing, R. Puffer, “Power Cable Stresses Caused by Transmission Line Faults in Next Generation VSC-MMC Systems”, IET The Journal of Engineering 2019(16), pp. 2318-2323, 2019
2) C. Brantl, P. Ruffing, P. Tünnerhoff, R. Puffer, “Impact of the HVDC system configuration on DC line protection”, CIGRE Science & Engineering 2019(15), pp. 25-32, 2019
3) P. Tünnerhoff, P. Ruffing, A. Schnettler, “Comprehensive Fault Type Discrimination Concept for Bipolar Full-Bridge-Based MMC HVDC Systems with Dedicated Metallic Return”, IEEE Transactions on Power Delivery 33(1) – special section on “Frontiers of DC technology”, pp. 330-339, 2018
4) M. Stumpe, P. Tünnerhoff, J. Dave, A. Schnettler, D. Ergin, A. Schön, K. Würflinger, F. Schettler, “DC fault protection for modular multi-level converter-based HVDC multi-terminal systems with solid state circuit breakers”, IET Generation, Transmission & Distribution 12(12), pp. 3013-3020, 2018
Filed patents / inventions
1) 2018E05836 DE P. Tünnerhoff, C. Brantl, D. Ergin, A. Schön, “Selektiver Leitungsschutz für Multi-terminal HVDC mit Halbbrücken MMC und DC-Leistungsschaltern“, filed 18 June 2018
2) 2017059897 DE D. Ergin, C. Petino, M. Stumpe, P. Tünnerhoff, “Verfahren und Anordnung zum Erzeugen eines Auslösesignals für einen HVDC-Schalter“, filed 26 April 2017
112 List of publications
Published conference contributions
1) P. Tünnerhoff, C. Brantl, R. Puffer, “Impacts of the mixed usage of cable and overhead lines on selective fault detection methods in multi-terminal HVDC systems”, CIGRE International Symposium: Going Offshore – Challenges of the Future Power Grid, Aalborg, Denmark, 2019
2) C. Brantl, P. Ruffing, P. Tünnerhoff, R. Puffer, “Impact of the HVDC system configuration on DC line protection”, CIGRE International Symposium: Going Offshore – Challenges of the Future Power Grid, Aalborg, Denmark, 2019
3) P. Tünnerhoff, C. Brantl, D. Ergin, F. Schettler, A. Schön, D. Döring, “Impact of the DC circuit breaker design on selective fault detection and clearing methods in multi-terminal HVDC systems”, 15th IET International Conference on AC and DC Power Transmission, Coventry, UK, 2019
4) C. Brantl, P. Tünnerhoff, P. Ruffing, “Impact factors on the power flow recovery in multi-terminal HVDC systems after fault clearance”, 15th IET International Conference on AC and DC Power Transmission, Coventry, UK, 2019
5) C. Brantl, P. Ruffing, P. Tünnerhoff, R. Puffer, “Impact factors of modular multilevel converters on the second zone of distance protection”, 54th International Universities Power Engineering Conference, Bucharest, Romania, 2019
6) G. Meyer, M. Biller, J. Jaeger, C. Romeis, L. Shang-Jaeger, M. Dauer, R. Krebs, N. Schäkel, B. Braun, M. Stumpe, P. Tünnerhoff, “Digital System Protection Design – A new Toolchain for Protection System Automation”, 25th International Conference on Electricity Distribution (CIRED), Madrid, Spain, 2019
7) P. Tünnerhoff, P. Ruffing, R. Puffer, “Power Cable Stresses Caused by Transmission Line Faults in Next Generation VSC-MMC Systems”, 14th IET International Conference on AC and DC Power Transmission, Chengdu, China, 2018
List of publications 113
8) M. Stumpe, P. Tünnerhoff, A. Schnettler, D. Schmidt “Grid Topology and Technology Influences on Selective Protection Concepts for Multi-Terminal Medium Voltage DC Grids”, 14th IET International Con-ference on Developments in Power System Protection, Belfast, UK, 2018
9) P. Tünnerhoff, M. Stumpe, A. Schnettler, “Fault analysis of HVDC systems with partial underground cabling”, 13th IET International Conference on AC and DC Power Transmission, Manchester, UK, 2017
10) M. Stumpe, P. Tünnerhoff, R. Puffer, A. Schnettler, “Development of an Adaptive Single-Pole Auto-Reclosing Concept for VSC HVDC with Fault Current Controllability”, 20th International Symposium on High Voltage Engineering, Buenos Aires, Argentina, 2017
11) P. Tünnerhoff, C. Petino, M. Battiato, A. Schnettler, “Distance protection for HVDC transmission lines based on MMC modulation strategy”, 10th IEEE Electric Power Quality and Supply Reliability Conference, Tallinn, Estonia, 2016
12) C. Petino, D. Eichhoff, P. Tünnerhoff, A. Schnettler, “System protection during contact faults in hybrid AC/DC transmission systems”, CIGRE International Symposium: Across Borders – HVDC Systems and Market Integration, Lund, Sweden, 2015
Conference contributions accepted for publication
1) A. Wagner, C. Freitag, P. Tünnerhoff, M. Bendig, “Evaluation of Degrees of Freedom for the Design of Metallic Screen Grounding Systems of Long HVDC Underground Cable Systems” , 48th CIGRE Session, Paris, France, 2020
2) F. Loku, P. Ruffing, P. Tünnerhoff, R. Puffer, J. Rivest, N. Stankovich, J. Bélanger, “Demonstration of Multi-terminal DC Grid Integration with an MMC Test Bench”, 48th CIGRE Session, Paris, France, 2020

114 List of publications
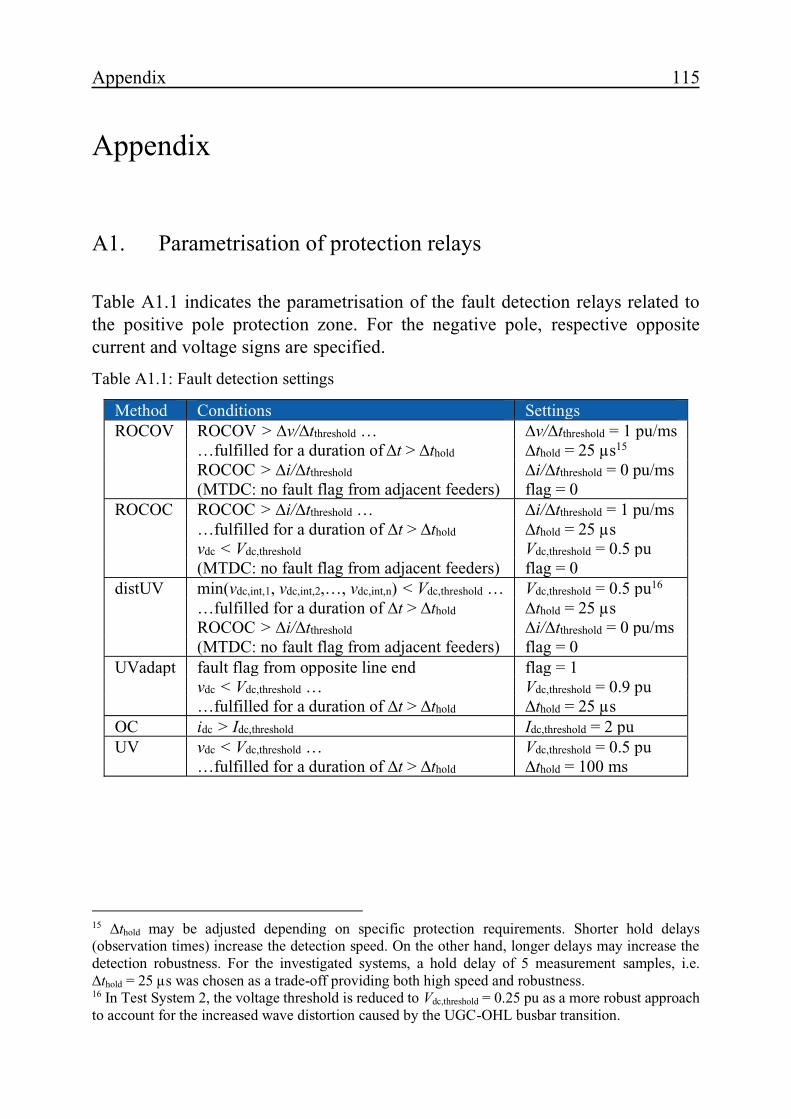
Appendix 115
Appendix
A1. Parametrisation of protection relays
Table A1.1 indicates the parametrisation of the fault detection relays related to the positive pole protection zone. For the negative pole, respective opposite current and voltage signs are specified.
Table A1.1: Fault detection settings
Method Conditions Settings ROCOV ROCOV > ∆v/∆tthreshold … ∆v/∆tthreshold = 1 pu/ms …fulfilled for a duration of ∆t > ∆thold ∆thold = 25 µs15 ROCOC > ∆i/∆tthreshold ∆i/∆tthreshold = 0 pu/ms (MTDC: no fault flag from adjacent feeders) flag = 0 ROCOC ROCOC > ∆i/∆tthreshold … ∆i/∆tthreshold = 1 pu/ms …fulfilled for a duration of ∆t > ∆thold ∆thold = 25 µs vdc < Vdc,threshold Vdc,threshold = 0.5 pu (MTDC: no fault flag from adjacent feeders) flag = 0 distUV min(vdc,int,1, vdc,int,2,…, vdc,int,n) < Vdc,threshold … Vdc,threshold = 0.5 pu16 …fulfilled for a duration of ∆t > ∆thold ∆thold = 25 µs ROCOC > ∆i/∆tthreshold ∆i/∆tthreshold = 0 pu/ms (MTDC: no fault flag from adjacent feeders) flag = 0 UVadapt fault flag from opposite line end flag = 1 vdc < Vdc,threshold … Vdc,threshold = 0.9 pu …fulfilled for a duration of ∆t > ∆thold ∆thold = 25 µs OC idc > Idc,threshold Idc,threshold = 2 pu UV vdc < Vdc,threshold … Vdc,threshold = 0.5 pu …fulfilled for a duration of ∆t > ∆thold ∆thold = 100 ms
15 ∆thold may be adjusted depending on specific protection requirements. Shorter hold delays (observation times) increase the detection speed. On the other hand, longer delays may increase the detection robustness. For the investigated systems, a hold delay of 5 measurement samples, i.e. ∆thold = 25 µs was chosen as a trade-off providing both high speed and robustness. 16 In Test System 2, the voltage threshold is reduced to Vdc,threshold = 0.25 pu as a more robust approach to account for the increased wave distortion caused by the UGC-OHL busbar transition.
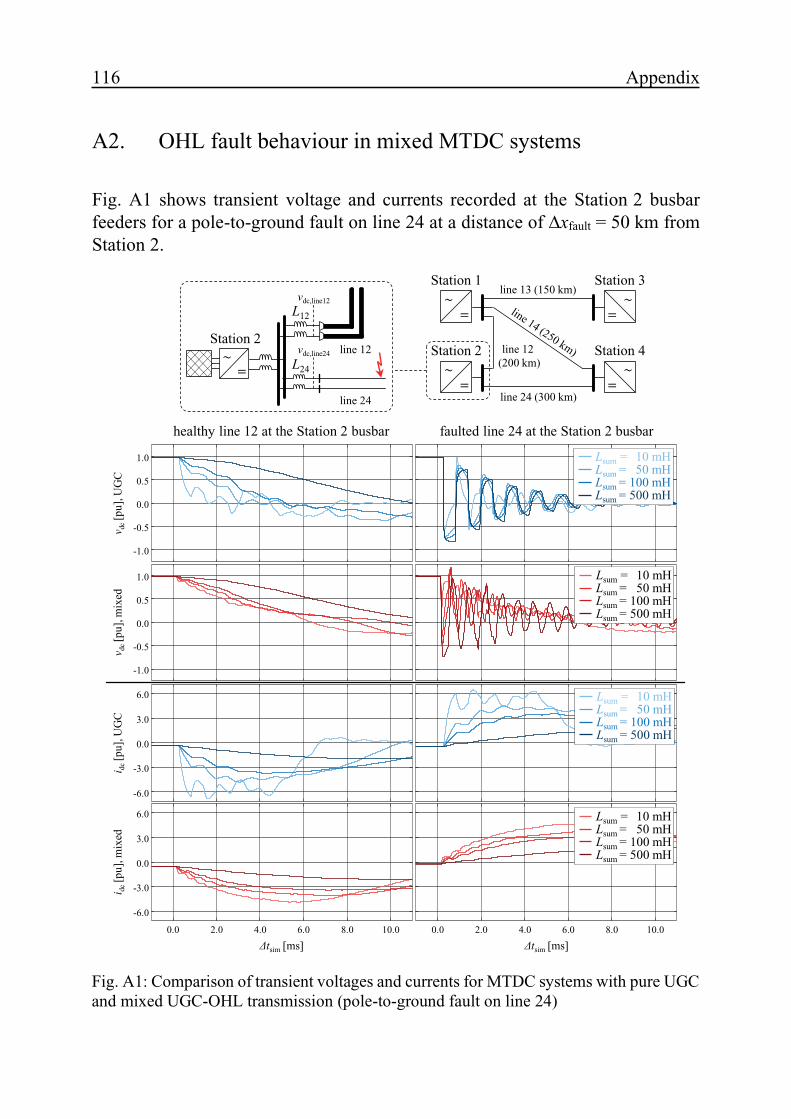
116 Appendix
A2. OHL fault behaviour in mixed MTDC systems
Fig. A1 shows transient voltage and currents recorded at the Station 2 busbar feeders for a pole-to-ground fault on line 24 at a distance of ∆xfault = 50 km from Station 2.
Fig. A1: Comparison of transient voltages and currents for MTDC systems with pure UGC and mixed UGC-OHL transmission (pole-to-ground fault on line 24)
0.0 2.0 4.0 6.0 8.0 10.0
tsim [ms]
0.0 2.0 4.0 6.0 8.0 10.00.0 2.0 4.0 6.0 8.0 10.0
-6.0
-3.0
0.0
3.0
6.0
0.0 2.0 4.0 6.0 8.0 10.0
tsim [ms]
-1.0
-0.5
0.0
0.5
1.0
-6.0
-3.0
0.0
3.0
6.0
-1.0
-0.5
0.0
0.5
1.0
faulted line 24 at the Station 2 busbarhealthy line 12 at the Station 2 busbar
Lsum = 10 mHLsum = 50 mHLsum = 100 mHLsum = 500 mH
Station 3Station 1
Station 4Station 2
line 24 (300 km)
line 12(200 km)
line 13 (150 km)
Station 2
L12
L24
line 12
line 24
vdc,line12
vdc,line24
Lsum = 10 mHLsum = 50 mHLsum = 100 mHLsum = 500 mH
Lsum = 10 mHLsum = 50 mHLsum = 100 mHLsum = 500 mH
Lsum = 10 mHLsum = 50 mHLsum = 100 mHLsum = 500 mH
Δtsim [ms]Δtsim [ms]
v dc[p
u], m
ixed
v dc[p
u], U
GC
i dc[p
u], m
ixed
i dc[p
u], U
GC
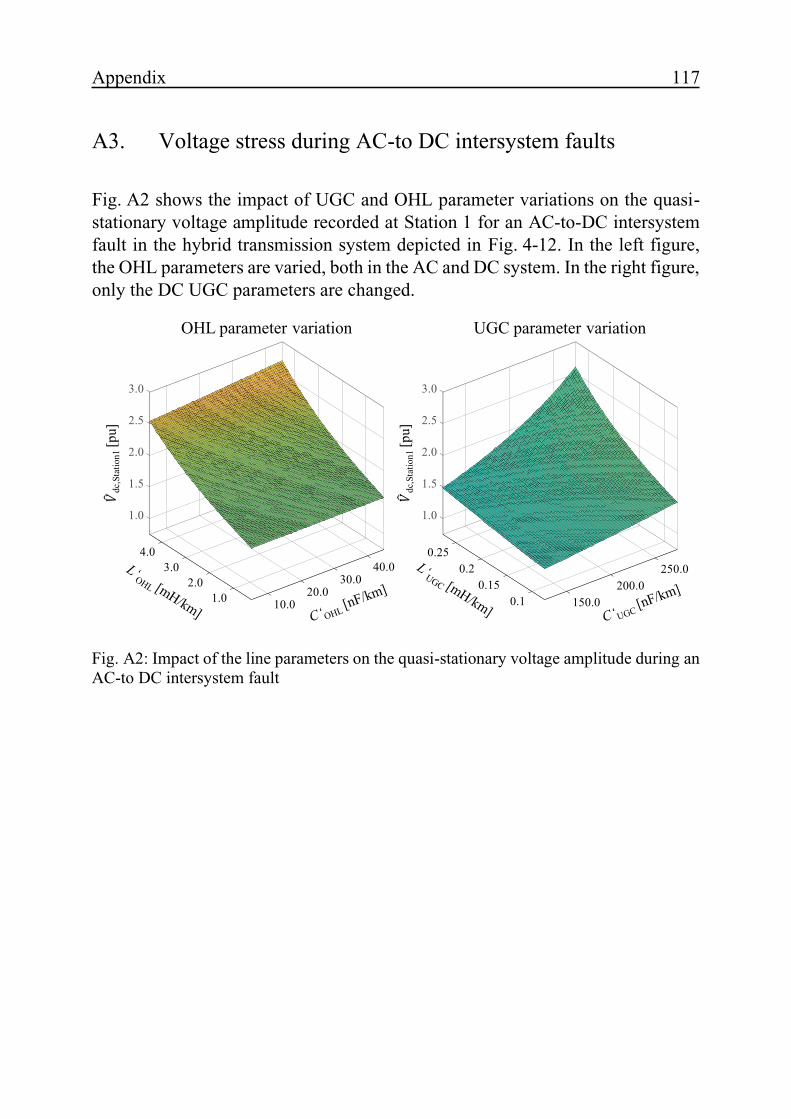
Appendix 117
A3. Voltage stress during AC-to DC intersystem faults
Fig. A2 shows the impact of UGC and OHL parameter variations on the quasi-stationary voltage amplitude recorded at Station 1 for an AC-to-DC intersystem fault in the hybrid transmission system depicted in Fig. 4-12. In the left figure, the OHL parameters are varied, both in the AC and DC system. In the right figure, only the DC UGC parameters are changed.
Fig. A2: Impact of the line parameters on the quasi-stationary voltage amplitude during an AC-to DC intersystem fault
dc,S
tatio
n1 [p
u]
dc,S
tatio
n1 [p
u]
OHL parameter variation UGC parameter variation
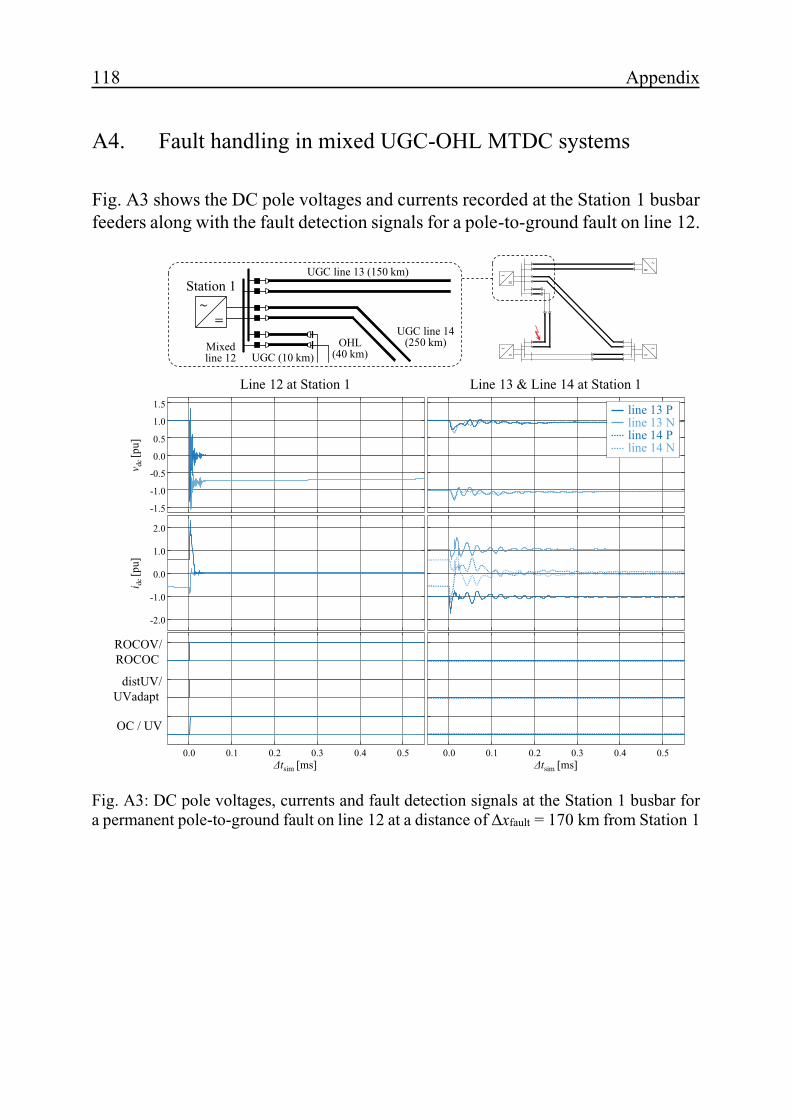
118 Appendix
A4. Fault handling in mixed UGC-OHL MTDC systems
Fig. A3 shows the DC pole voltages and currents recorded at the Station 1 busbar feeders along with the fault detection signals for a pole-to-ground fault on line 12.
Fig. A3: DC pole voltages, currents and fault detection signals at the Station 1 busbar for a permanent pole-to-ground fault on line 12 at a distance of ∆xfault = 170 km from Station 1
0.0 0.1 0.2 0.3 0.4 0.5
-2.0
-1.0
0.0
1.0
2.0
0.0 0.1 0.2 0.3 0.4 0.5
-1.5
-1.0
-0.5
0.0
0.5
1.0
1.5
Line 13 & Line 14 at Station 1Line 12 at Station 1
ROCOV/ROCOC
distUV/UVadapt
OC / UV
line 13 P line 13 Nline 14 P line 14 N
Station 1
UGC (10 km)OHL
(40 km)
UGC line 14 (250 km)
UGC line 13 (150 km)
Mixed line 12
i dc[p
u]v d
c[p
u]
Δtsim [ms]Δtsim [ms]


![Overview of the Configuration and Power Converters in High ... · Fig. 8. Basic scheme of the LCC-HVDC and VSC-HVDC transmission system [6]. Comparison of the CSC-HVDC and VSC-HVDC](https://img.pdfslide.us/doc/110x75/5ebc0e8dd027f5592e56ad65/overview-of-the-configuration-and-power-converters-in-high-fig-8-basic-scheme.jpg)