Embed Size (px)
Citation preview
Protect Capital INVESTORPRESENTATION
August 2018
Create Wealth
1
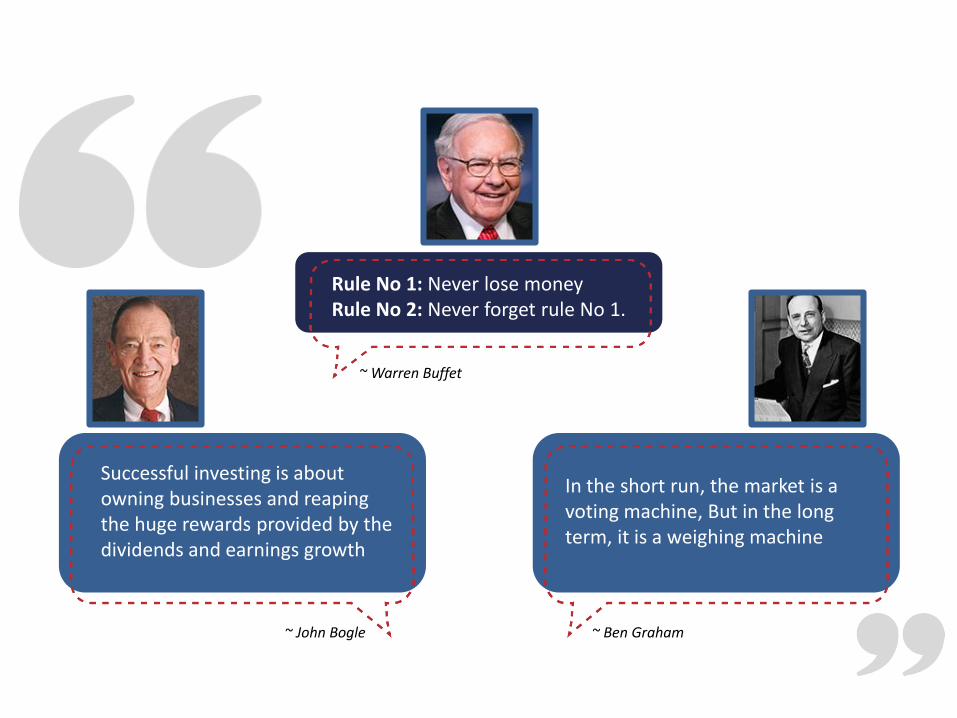
~ Warren Buffet
Rule No 1: Never lose moneyRule No 2: Never forget rule No 1.
~ Ben Graham
In the short run, the market is a voting machine, But in the long term, it is a weighing machine
~ John Bogle
Successful investing is about owning businesses and reaping the huge rewards provided by the dividends and earnings growth
We Protect Capital
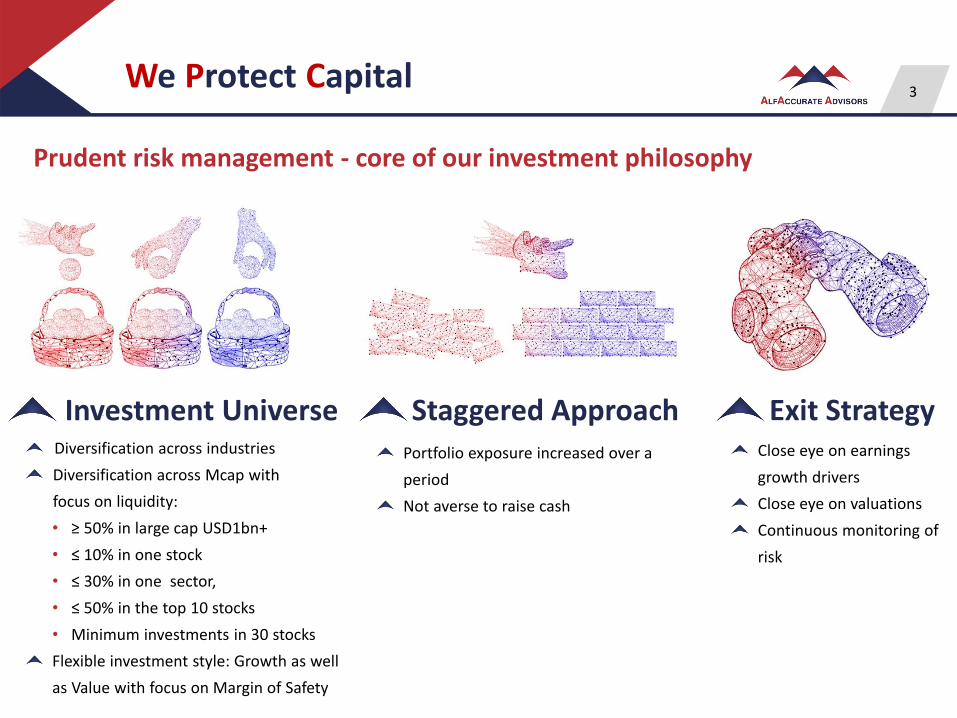
Prudent risk management - core of our investment philosophy
Investment UniverseDiversification across industries
Diversification across Mcap with
focus on liquidity:
• ≥ 50% in large cap USD1bn+
• ≤ 10% in one stock
• ≤ 30% in one sector,
• ≤ 50% in the top 10 stocks
• Minimum investments in 30 stocks
Flexible investment style: Growth as well
as Value with focus on Margin of Safety
Staggered ApproachPortfolio exposure increased over a
period
Not averse to raise cash
Close eye on earnings
growth drivers
Close eye on valuations
Continuous monitoring of
risk
Exit Strategy
3
We Create Wealth
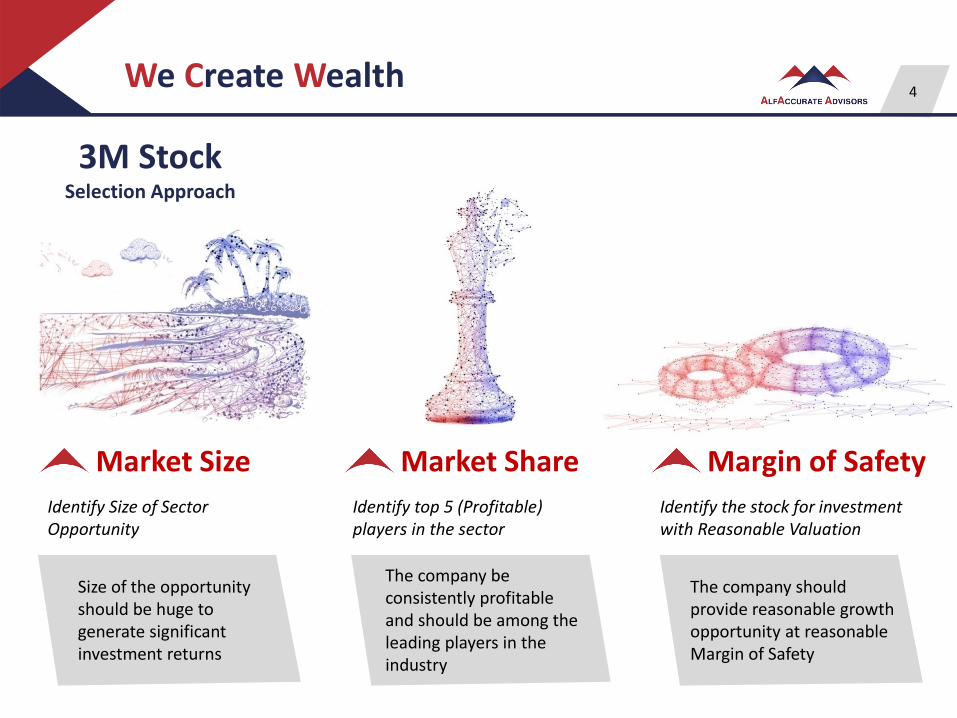
3M StockSelection Approach
Identify Size of Sector Opportunity
Market Size
Size of the opportunity should be huge to generate significant investment returns
Identify top 5 (Profitable) players in the sector
Market Share
The company be consistently profitable and should be among the leading players in the industry
Identify the stock for investment with Reasonable Valuation
Margin of Safety
The company should provide reasonable growth opportunity at reasonable Margin of Safety
4
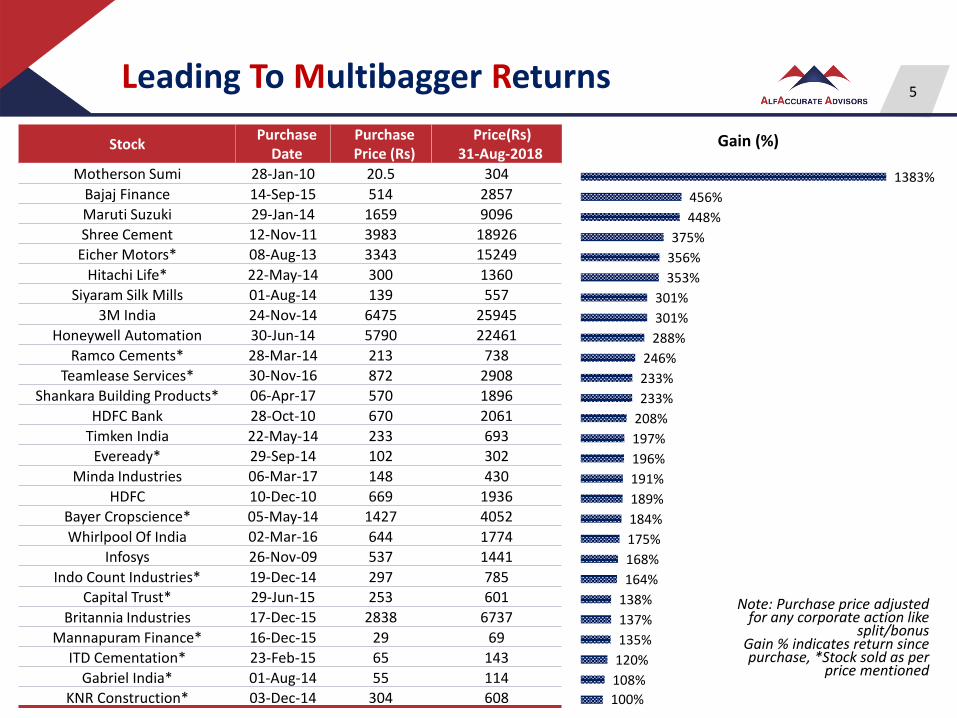
Stock Purchase
DatePurchase Price (Rs)
Price(Rs)31-Aug-2018
Motherson Sumi 28-Jan-10 20.5 304
Bajaj Finance 14-Sep-15 514 2857
Maruti Suzuki 29-Jan-14 1659 9096
Shree Cement 12-Nov-11 3983 18926
Eicher Motors* 08-Aug-13 3343 15249
Hitachi Life* 22-May-14 300 1360
Siyaram Silk Mills 01-Aug-14 139 557
3M India 24-Nov-14 6475 25945
Honeywell Automation 30-Jun-14 5790 22461
Ramco Cements* 28-Mar-14 213 738
Teamlease Services* 30-Nov-16 872 2908
Shankara Building Products* 06-Apr-17 570 1896
HDFC Bank 28-Oct-10 670 2061
Timken India 22-May-14 233 693
Eveready* 29-Sep-14 102 302
Minda Industries 06-Mar-17 148 430
HDFC 10-Dec-10 669 1936
Bayer Cropscience* 05-May-14 1427 4052
Whirlpool Of India 02-Mar-16 644 1774
Infosys 26-Nov-09 537 1441
Indo Count Industries* 19-Dec-14 297 785
Capital Trust* 29-Jun-15 253 601
Britannia Industries 17-Dec-15 2838 6737
Mannapuram Finance* 16-Dec-15 29 69
ITD Cementation* 23-Feb-15 65 143
Gabriel India* 01-Aug-14 55 114
KNR Construction* 03-Dec-14 304 608
Leading To Multibagger Returns
Note: Purchase price adjusted for any corporate action like
split/bonusGain % indicates return since purchase, *Stock sold as per
price mentioned
5
1383%
456%
448%
375%
356%
353%
301%
301%
288%
246%
233%
233%
208%
197%
196%
191%
189%
184%
175%
168%
164%
138%
137%
135%
120%
108%
100%
Gain (%)
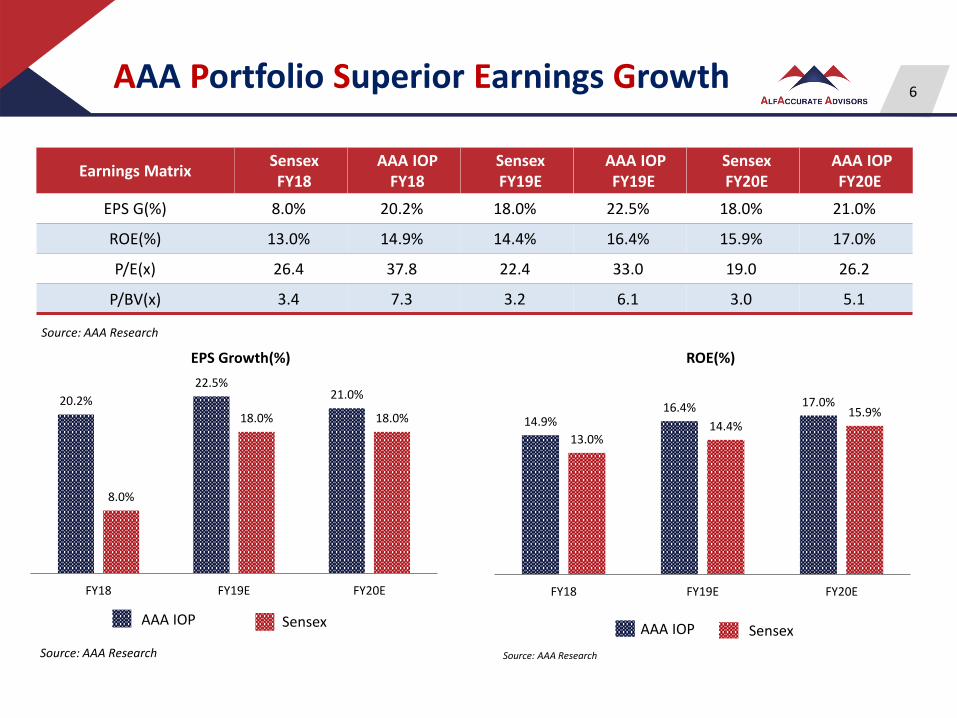
AAA Portfolio Superior Earnings Growth
Earnings MatrixSensexFY18
AAA IOPFY18
SensexFY19E
AAA IOPFY19E
SensexFY20E
AAA IOPFY20E
EPS G(%) 8.0% 20.2% 18.0% 22.5% 18.0% 21.0%
ROE(%) 13.0% 14.9% 14.4% 16.4% 15.9% 17.0%
P/E(x) 26.4 37.8 22.4 33.0 19.0 26.2
P/BV(x) 3.4 7.3 3.2 6.1 3.0 5.1
20.2%
22.5%21.0%
8.0%
18.0% 18.0%
FY18 FY19E FY20E
EPS Growth(%)
AAA IOP Sensex
Source: AAA Research
14.9%16.4% 17.0%
13.0%14.4%
15.9%
FY18 FY19E FY20E
ROE(%)
AAA IOP Sensex
Source: AAA Research
6
Source: AAA Research
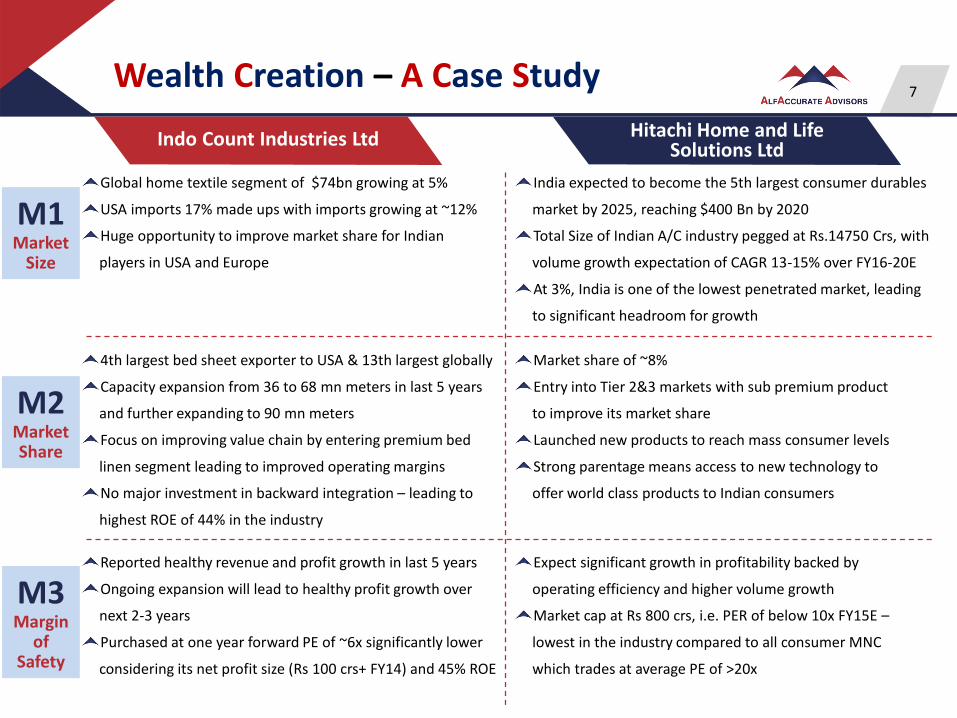
Wealth Creation – A Case Study
Global home textile segment of $74bn growing at 5%
USA imports 17% made ups with imports growing at ~12%
Huge opportunity to improve market share for Indian
players in USA and Europe
India expected to become the 5th largest consumer durables
market by 2025, reaching $400 Bn by 2020
Total Size of Indian A/C industry pegged at Rs.14750 Crs, with
volume growth expectation of CAGR 13-15% over FY16-20E
At 3%, India is one of the lowest penetrated market, leading
to significant headroom for growth
4th largest bed sheet exporter to USA & 13th largest globally
Capacity expansion from 36 to 68 mn meters in last 5 years
and further expanding to 90 mn meters
Focus on improving value chain by entering premium bed
linen segment leading to improved operating margins
No major investment in backward integration – leading to
highest ROE of 44% in the industry
Market share of ~8%
Entry into Tier 2&3 markets with sub premium product
to improve its market share
Launched new products to reach mass consumer levels
Strong parentage means access to new technology to
offer world class products to Indian consumers
Reported healthy revenue and profit growth in last 5 years
Ongoing expansion will lead to healthy profit growth over
next 2-3 years
Purchased at one year forward PE of ~6x significantly lower
considering its net profit size (Rs 100 crs+ FY14) and 45% ROE
Expect significant growth in profitability backed by
operating efficiency and higher volume growth
Market cap at Rs 800 crs, i.e. PER of below 10x FY15E –
lowest in the industry compared to all consumer MNC
which trades at average PE of >20x
M1Market
Size
M2Market Share
M3Margin
of Safety
Indo Count Industries Ltd Hitachi Home and Life Solutions Ltd
7

The Investment Process….
Stock Identification1
Identify emerging trends and opportunities from a
universe of 450 companies
Filter approach – using variety of valuation
parameters
Focus on earnings, free cash flow, ROE, long term
growth and profitability trends
Portfolio Construction Monitoring & Nurturing3
Combination of Top Down and Bottom Up approach with a
benchmark agnostic strategy to achieve Long term
investment objective
Continuous portfolio monitoring ensures prudent risk
management
Regular interaction to provide strategic inputs to strengthen
systems, controls and CG in line with best practices
Analysis & Decision making Process2Initial screening
Corporate meeting and detailed due diligence
Identify sustainable competitive advantage
Exiting & Realizing Value4Constant evaluation of valuation metrics to
decide optimum return potential
Intrinsic value V/s Current Market Price to
evaluate Margin of Safety
Change in underlying assumptions of investment
thesis
8
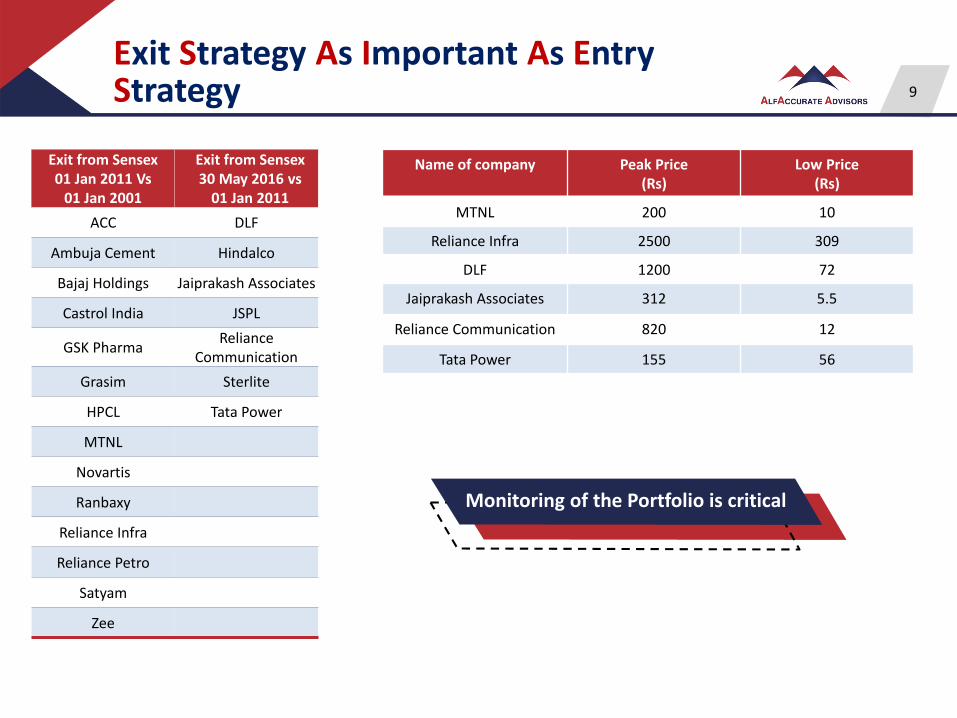
Exit from Sensex 01 Jan 2011 Vs
01 Jan 2001
Exit from Sensex 30 May 2016 vs
01 Jan 2011
ACC DLF
Ambuja Cement Hindalco
Bajaj Holdings Jaiprakash Associates
Castrol India JSPL
GSK PharmaReliance
Communication
Grasim Sterlite
HPCL Tata Power
MTNL
Novartis
Ranbaxy
Reliance Infra
Reliance Petro
Satyam
Zee
Monitoring of the Portfolio is critical
Exit Strategy As Important As EntryStrategy 9
Name of company Peak Price (Rs)
Low Price (Rs)
MTNL 200 10
Reliance Infra 2500 309
DLF 1200 72
Jaiprakash Associates 312 5.5
Reliance Communication 820 12
Tata Power 155 56

MarketOutlook
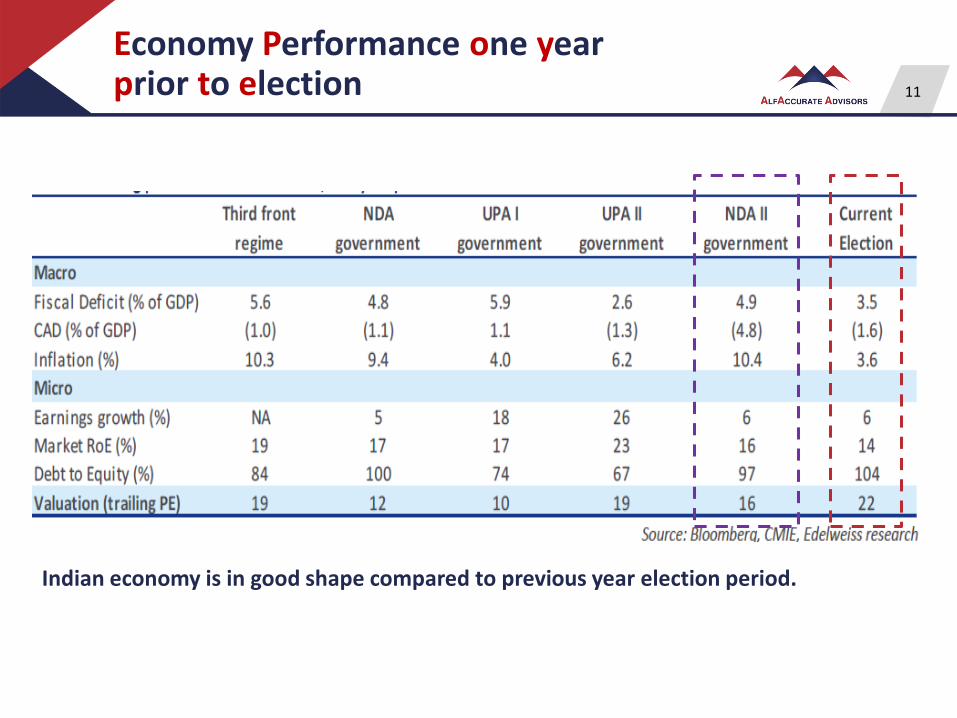
Economy Performance one year prior to election 11
Indian economy is in good shape compared to previous year election period.
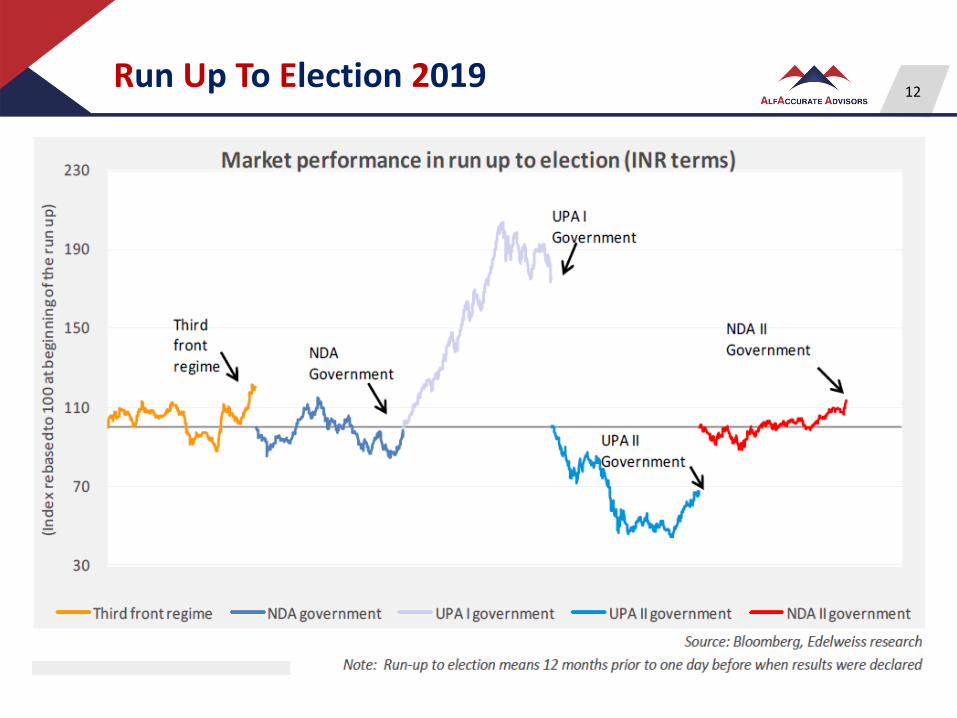
Run Up To Election 201912
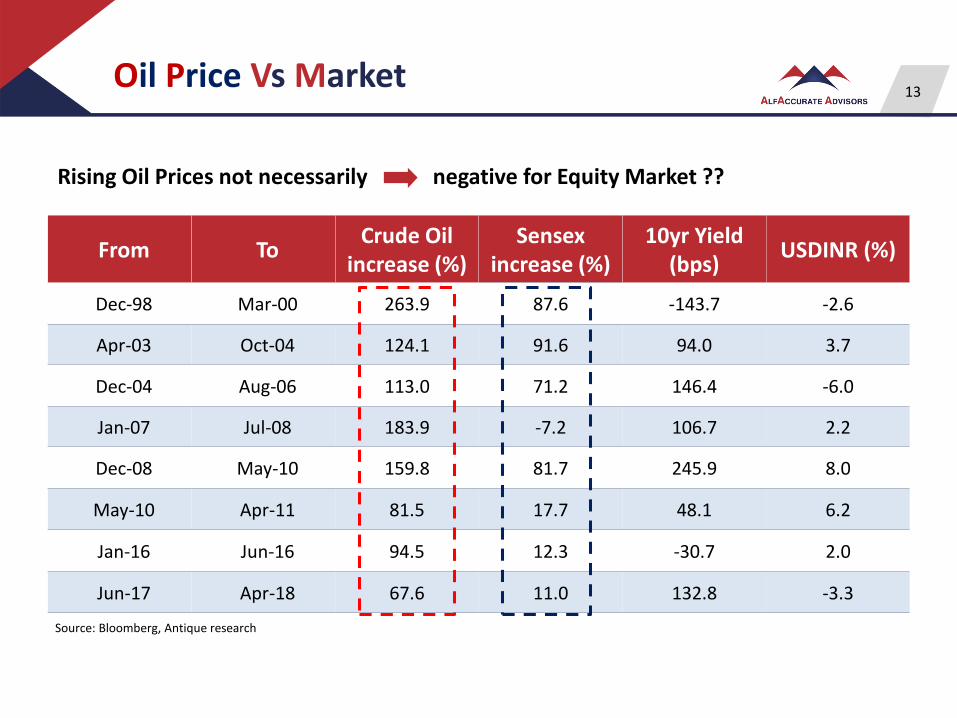
Oil Price Vs Market13
From ToCrude Oil
increase (%)Sensex
increase (%)10yr Yield
(bps)USDINR (%)
Dec-98 Mar-00 263.9 87.6 -143.7 -2.6
Apr-03 Oct-04 124.1 91.6 94.0 3.7
Dec-04 Aug-06 113.0 71.2 146.4 -6.0
Jan-07 Jul-08 183.9 -7.2 106.7 2.2
Dec-08 May-10 159.8 81.7 245.9 8.0
May-10 Apr-11 81.5 17.7 48.1 6.2
Jan-16 Jun-16 94.5 12.3 -30.7 2.0
Jun-17 Apr-18 67.6 11.0 132.8 -3.3
Rising Oil Prices not necessarily negative for Equity Market ??
Source: Bloomberg, Antique research
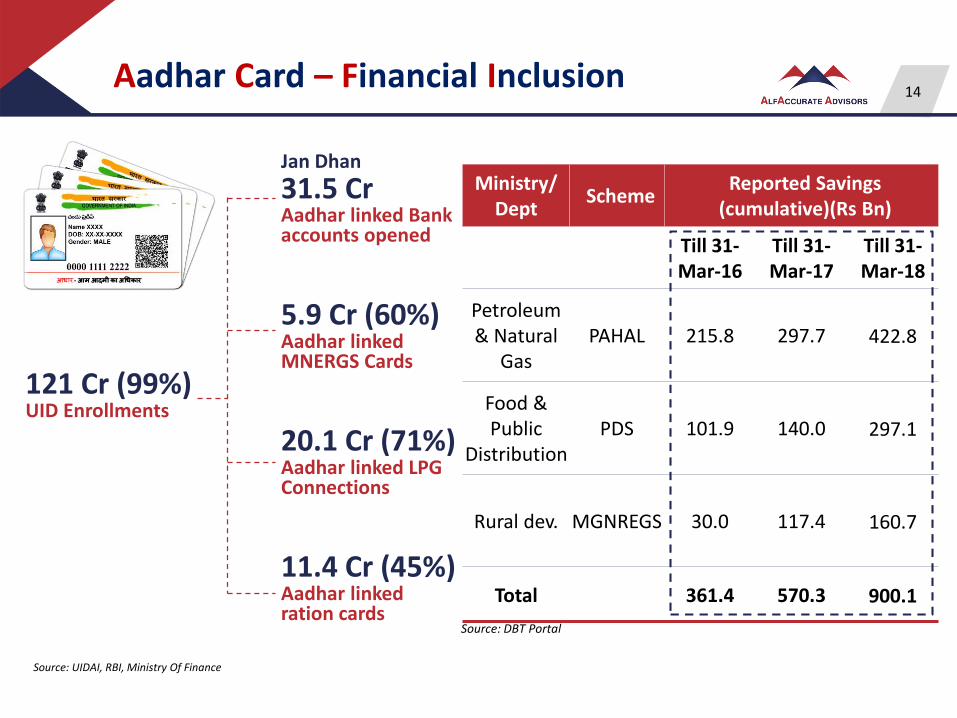
Aadhar Card – Financial Inclusion
Source: UIDAI, RBI, Ministry Of Finance
Ministry/ Dept
SchemeReported Savings
(cumulative)(Rs Bn)
Till 31-Mar-16
Till 31-Mar-17
Till 31-Mar-18
Petroleum & Natural
GasPAHAL 215.8 297.7 422.8
Food & Public
DistributionPDS 101.9 140.0 297.1
Rural dev. MGNREGS 30.0 117.4 160.7
Total 361.4 570.3 900.1
Source: DBT Portal
121 Cr (99%)UID Enrollments
Jan Dhan
31.5 CrAadhar linked Bank accounts opened
5.9 Cr (60%)Aadhar linked MNERGS Cards
20.1 Cr (71%) Aadhar linked LPG Connections
11.4 Cr (45%) Aadhar linkedration cards
14
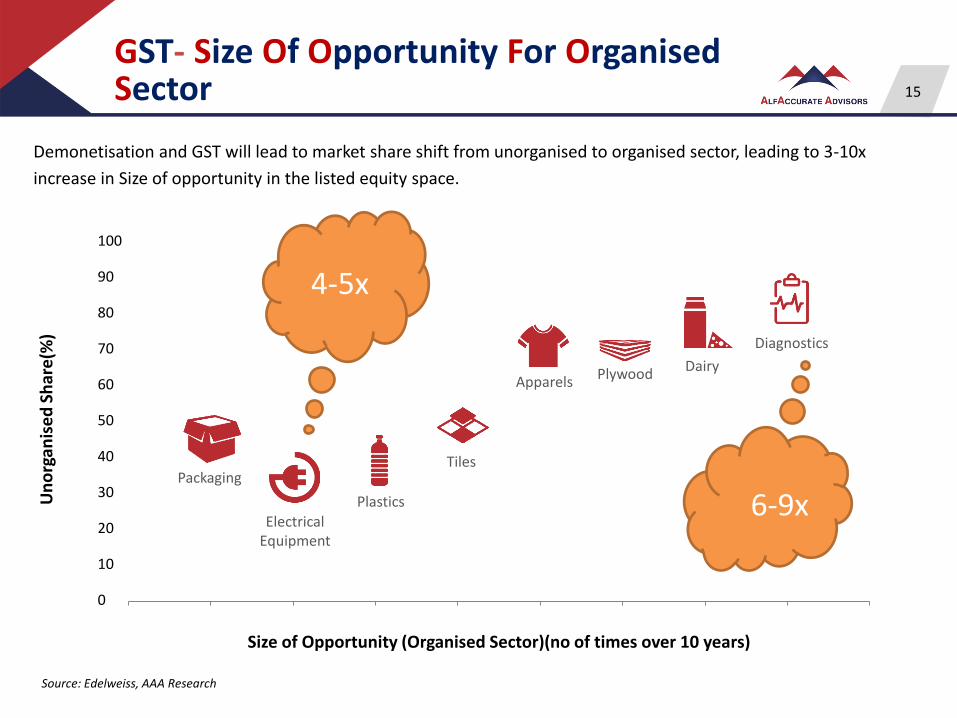
GST- Size Of Opportunity For Organised Sector
Demonetisation and GST will lead to market share shift from unorganised to organised sector, leading to 3-10x
increase in Size of opportunity in the listed equity space.
Source: Edelweiss, AAA Research
0.00 1.00 2.00 3.00 4.00 5.00 6.00 7.00 8.00 9.00
Un
org
anis
ed
Sh
are
(%)
Size of Opportunity (Organised Sector)(no of times over 10 years)
Packaging
Electrical Equipment
Plastics
Tiles
Apparels Plywood Dairy
Diagnostics
100
90
80
70
60
50
40
30
20
10
0
6-9x
15
4-5x
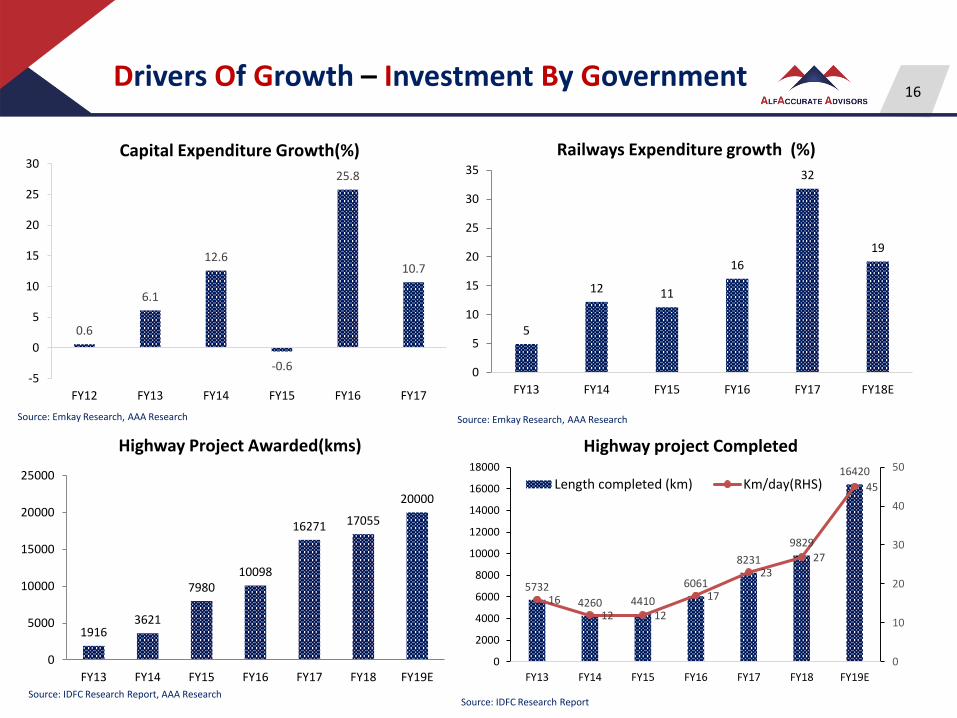
Drivers Of Growth – Investment By Government16
5
12 11
16
32
19
0
5
10
15
20
25
30
35
FY13 FY14 FY15 FY16 FY17 FY18E
Railways Expenditure growth (%)
Source: Emkay Research, AAA Research
0.6
6.1
12.6
-0.6
25.8
10.7
-5
0
5
10
15
20
25
30
FY12 FY13 FY14 FY15 FY16 FY17
Capital Expenditure Growth(%)
Source: Emkay Research, AAA Research
Source: IDFC Research Report
19163621
798010098
16271 17055
20000
0
5000
10000
15000
20000
25000
FY13 FY14 FY15 FY16 FY17 FY18 FY19E
Highway Project Awarded(kms)
Source: IDFC Research Report, AAA Research
5732
4260 4410
6061
8231
9829
16420
16
12 12
17
23
27
45
0
10
20
30
40
50
0
2000
4000
6000
8000
10000
12000
14000
16000
18000
FY13 FY14 FY15 FY16 FY17 FY18 FY19E
Highway project Completed
Length completed (km) Km/day(RHS)
17
Source : BOBCAPS Research
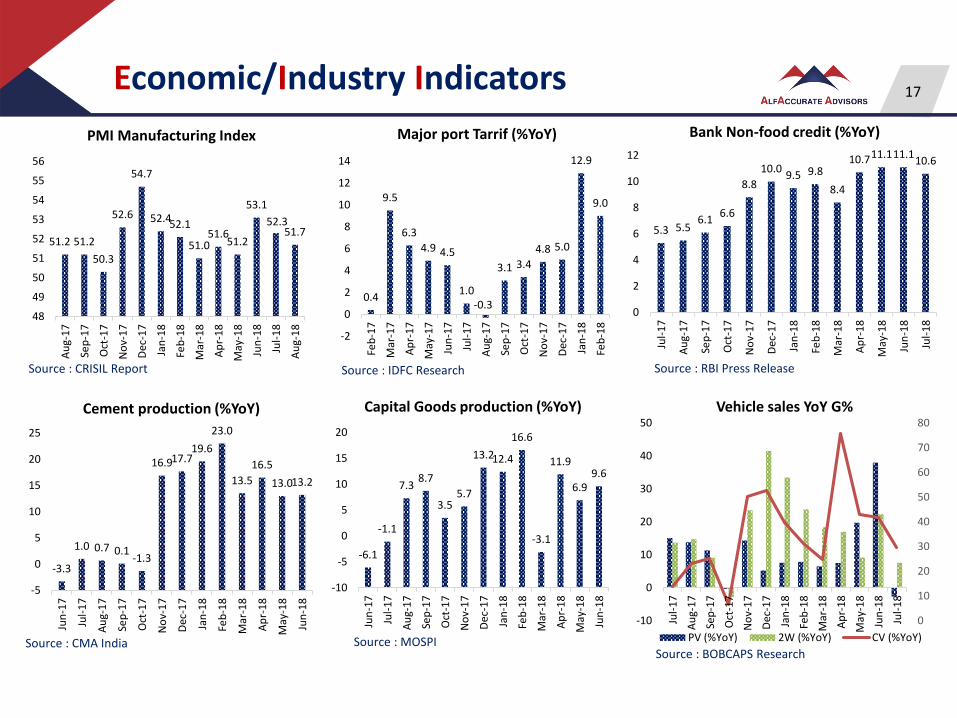
Source : RBI Press ReleaseSource : IDFC Research
Source : MOSPI
Source : CRISIL Report
0.4
9.5
6.3
4.9 4.5
1.0-0.3
3.1 3.4
4.8 5.0
12.9
9.0
-2
0
2
4
6
8
10
12
14
Feb
-17
Mar
-17
Ap
r-1
7
May
-17
Jun
-17
Jul-
17
Au
g-1
7
Sep
-17
Oct
-17
No
v-1
7
Dec
-17
Jan
-18
Feb
-18
Major port Tarrif (%YoY)
Source : CMA India
Economic/Industry Indicators
5.3 5.56.1
6.6
8.8
10.09.5 9.8
8.4
10.711.111.110.6
0
2
4
6
8
10
12
Jul-
17
Au
g-1
7
Sep
-17
Oct
-17
No
v-1
7
Dec
-17
Jan
-18
Feb
-18
Mar
-18
Ap
r-1
8
May
-18
Jun
-18
Jul-
18
Bank Non-food credit (%YoY)
-3.3
1.0 0.7 0.1-1.3
16.917.719.6
23.0
13.5
16.5
13.013.2
-5
0
5
10
15
20
25
Jun
-17
Jul-
17
Au
g-1
7
Sep
-17
Oct
-17
No
v-1
7
Dec
-17
Jan
-18
Feb
-18
Mar
-18
Ap
r-1
8
May
-18
Jun
-18
Cement production (%YoY)
-6.1
-1.1
7.38.7
3.55.7
13.212.4
16.6
-3.1
11.9
6.99.6
-10
-5
0
5
10
15
20
Jun
-17
Jul-
17
Au
g-1
7
Sep
-17
Oct
-17
No
v-1
7
Dec
-17
Jan
-18
Feb
-18
Mar
-18
Ap
r-1
8
May
-18
Jun
-18
Capital Goods production (%YoY)
51.2 51.2
50.3
52.6
54.7
52.452.1
51.051.6
51.2
53.1
52.351.7
48
49
50
51
52
53
54
55
56
Au
g-1
7
Sep
-17
Oct
-17
No
v-1
7
Dec
-17
Jan
-18
Feb
-18
Mar
-18
Ap
r-1
8
May
-18
Jun
-18
Jul-
18
Au
g-1
8
PMI Manufacturing Index
0
10
20
30
40
50
60
70
80
-10
0
10
20
30
40
50
Jul-
17
Au
g-1
7
Sep
-17
Oct
-17
No
v-1
7
Dec
-17
Jan
-18
Feb
-18
Mar
-18
Ap
r-1
8
May
-18
Jun
-18
Jul-
18
Vehicle sales YoY G%
PV (%YoY) 2W (%YoY) CV (%YoY)
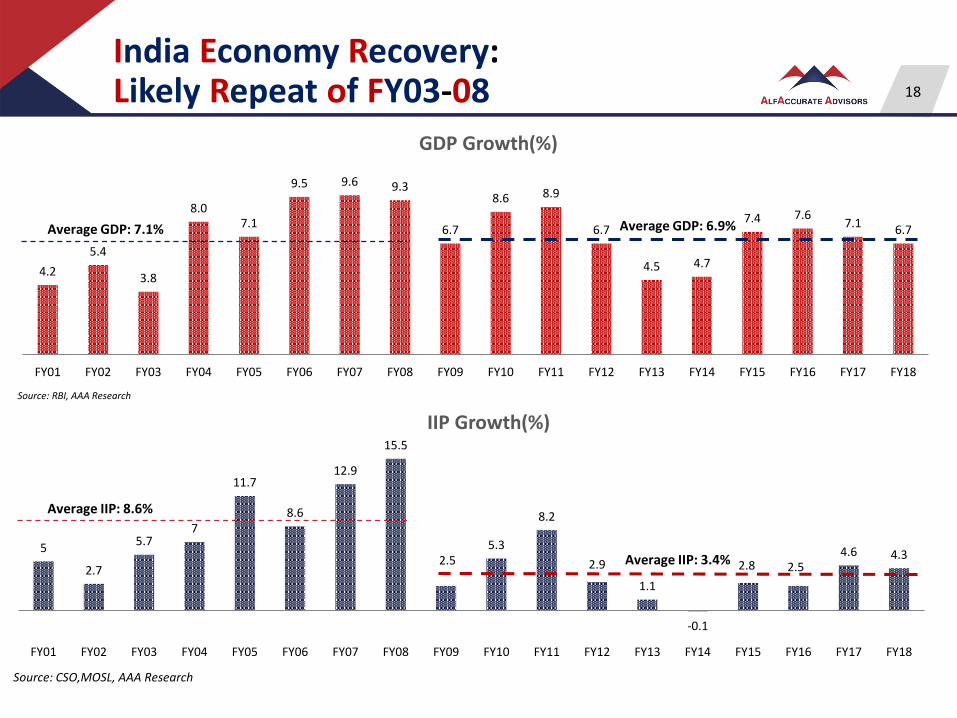
India Economy Recovery: Likely Repeat of FY03-08
Source: RBI, AAA Research
GDP Growth(%)
4.2
5.4
3.8
8.07.1
9.5 9.6 9.3
6.7
8.6 8.9
6.7
4.5 4.7
7.4 7.67.1
6.7
FY01 FY02 FY03 FY04 FY05 FY06 FY07 FY08 FY09 FY10 FY11 FY12 FY13 FY14 FY15 FY16 FY17 FY18
Average GDP: 7.1% Average GDP: 6.9%
Source: CSO,MOSL, AAA Research
IIP Growth(%)
5
2.7
5.77
11.7
8.6
12.9
15.5
2.55.3
8.2
2.9
1.1
-0.1
2.8 2.54.6 4.3
FY01 FY02 FY03 FY04 FY05 FY06 FY07 FY08 FY09 FY10 FY11 FY12 FY13 FY14 FY15 FY16 FY17 FY18
Average IIP: 8.6%
Average IIP: 3.4%
18
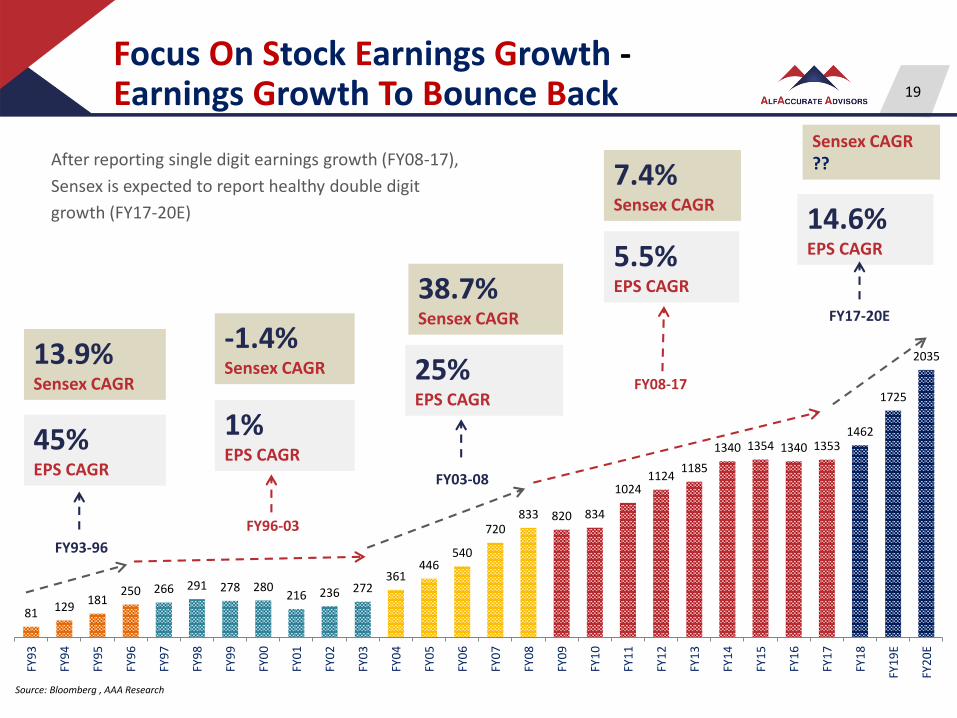
81 129181
250 266 291 278 280216 236 272
361446
540
720833 820 834
10241124
1185
1340 1354 1340 13531462
1725
2035
FY9
3
FY9
4
FY9
5
FY9
6
FY9
7
FY9
8
FY9
9
FY0
0
FY0
1
FY0
2
FY0
3
FY0
4
FY0
5
FY0
6
FY0
7
FY0
8
FY0
9
FY1
0
FY1
1
FY1
2
FY1
3
FY1
4
FY1
5
FY1
6
FY1
7
FY1
8
FY1
9E
FY2
0E
Focus On Stock Earnings Growth -Earnings Growth To Bounce Back
After reporting single digit earnings growth (FY08-17),
Sensex is expected to report healthy double digit
growth (FY17-20E)
38.7%Sensex CAGR
FY03-08
-1.4%Sensex CAGR
FY96-03
13.9%Sensex CAGR
FY93-96
7.4%Sensex CAGR
FY08-17
Sensex CAGR ??
FY17-20E
Source: Bloomberg , AAA Research
45%EPS CAGR
1%EPS CAGR
25%EPS CAGR
5.5%EPS CAGR
14.6%EPS CAGR
19
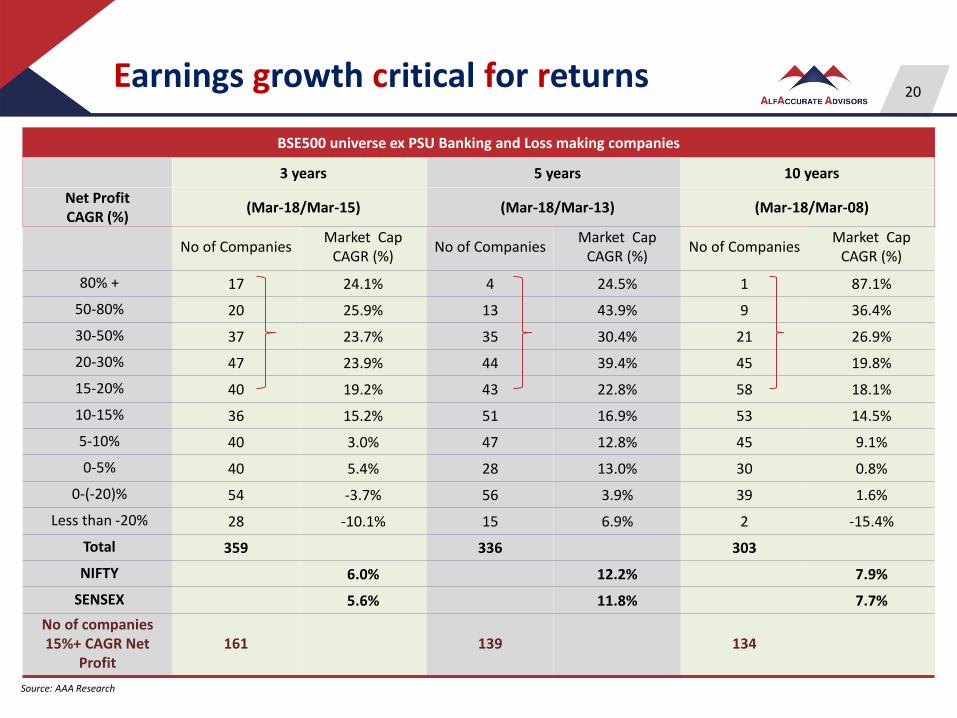
Earnings growth critical for returns
BSE500 universe ex PSU Banking and Loss making companies
3 years 5 years 10 years
Net ProfitCAGR (%)
(Mar-18/Mar-15) (Mar-18/Mar-13) (Mar-18/Mar-08)
No of CompaniesMarket Cap
CAGR (%)No of Companies
Market Cap CAGR (%)
No of CompaniesMarket Cap
CAGR (%)
80% + 17 24.1% 4 24.5% 1 87.1%
50-80% 20 25.9% 13 43.9% 9 36.4%
30-50% 37 23.7% 35 30.4% 21 26.9%
20-30% 47 23.9% 44 39.4% 45 19.8%
15-20% 40 19.2% 43 22.8% 58 18.1%
10-15% 36 15.2% 51 16.9% 53 14.5%
5-10% 40 3.0% 47 12.8% 45 9.1%
0-5% 40 5.4% 28 13.0% 30 0.8%
0-(-20)% 54 -3.7% 56 3.9% 39 1.6%
Less than -20% 28 -10.1% 15 6.9% 2 -15.4%
Total 359 336 303
NIFTY 6.0% 12.2% 7.9%
SENSEX 5.6% 11.8% 7.7%
No of companies 15%+ CAGR Net
Profit161 139 134
Source: AAA Research
20
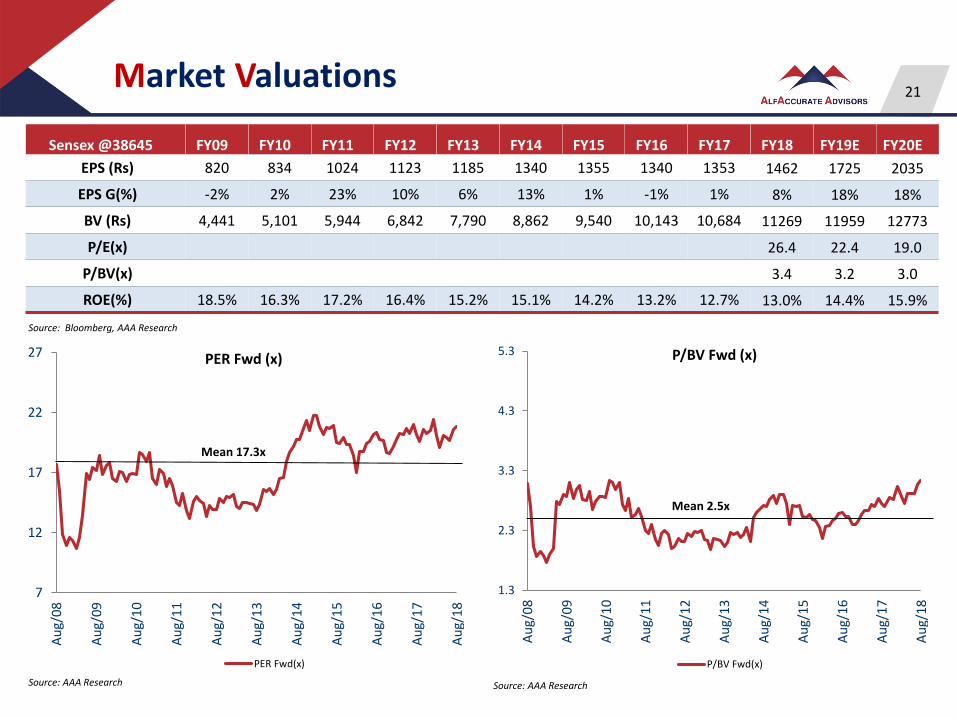
Market Valuations
Source: Bloomberg, AAA Research
Sensex @38645 FY09 FY10 FY11 FY12 FY13 FY14 FY15 FY16 FY17 FY18 FY19E FY20E
EPS (Rs) 820 834 1024 1123 1185 1340 1355 1340 1353 1462 1725 2035
EPS G(%) -2% 2% 23% 10% 6% 13% 1% -1% 1% 8% 18% 18%
BV (Rs) 4,441 5,101 5,944 6,842 7,790 8,862 9,540 10,143 10,684 11269 11959 12773
P/E(x) 26.4 22.4 19.0
P/BV(x) 3.4 3.2 3.0
ROE(%) 18.5% 16.3% 17.2% 16.4% 15.2% 15.1% 14.2% 13.2% 12.7% 13.0% 14.4% 15.9%
Source: AAA Research
21
Source: AAA Research
7
12
17
22
27
Au
g/0
8
Au
g/0
9
Au
g/1
0
Au
g/1
1
Au
g/1
2
Au
g/1
3
Au
g/1
4
Au
g/1
5
Au
g/1
6
Au
g/1
7
Au
g/1
8
PER Fwd (x)
PER Fwd(x)
Mean 17.3x
1.3
2.3
3.3
4.3
5.3
Au
g/0
8
Au
g/0
9
Au
g/1
0
Au
g/1
1
Au
g/1
2
Au
g/1
3
Au
g/1
4
Au
g/1
5
Au
g/1
6
Au
g/1
7
Au
g/1
8
P/BV Fwd (x)
P/BV Fwd(x)
Mean 2.5x

The people running the show at
AlfAccurate Advisors
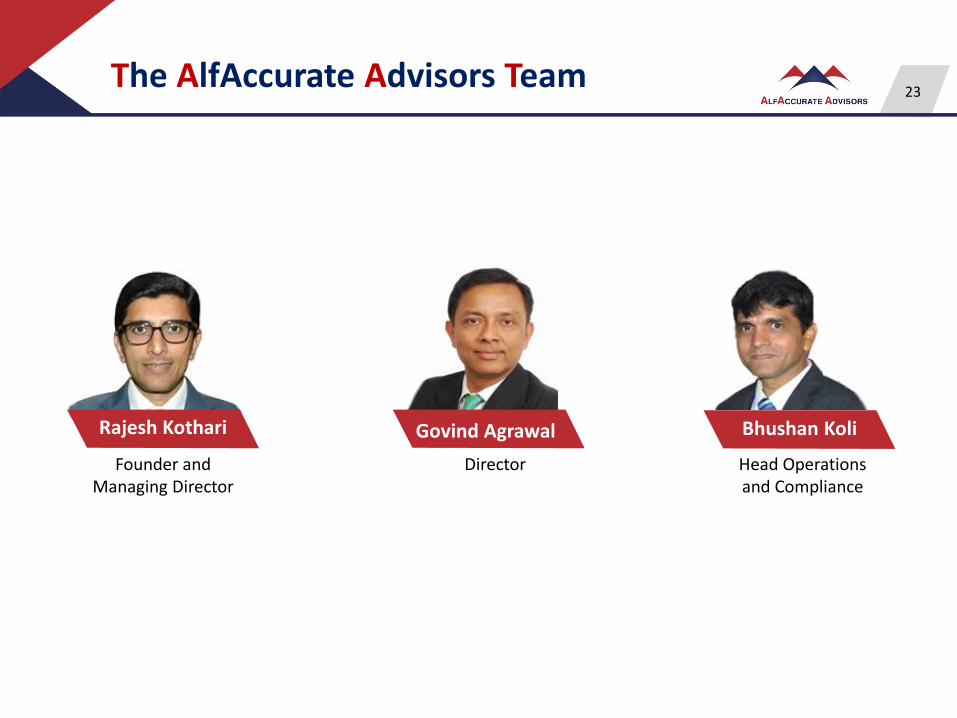
The AlfAccurate Advisors Team23
Rajesh Kothari
Founder and Managing Director
Head Operations and Compliance
Bhushan KoliGovind Agrawal
Director
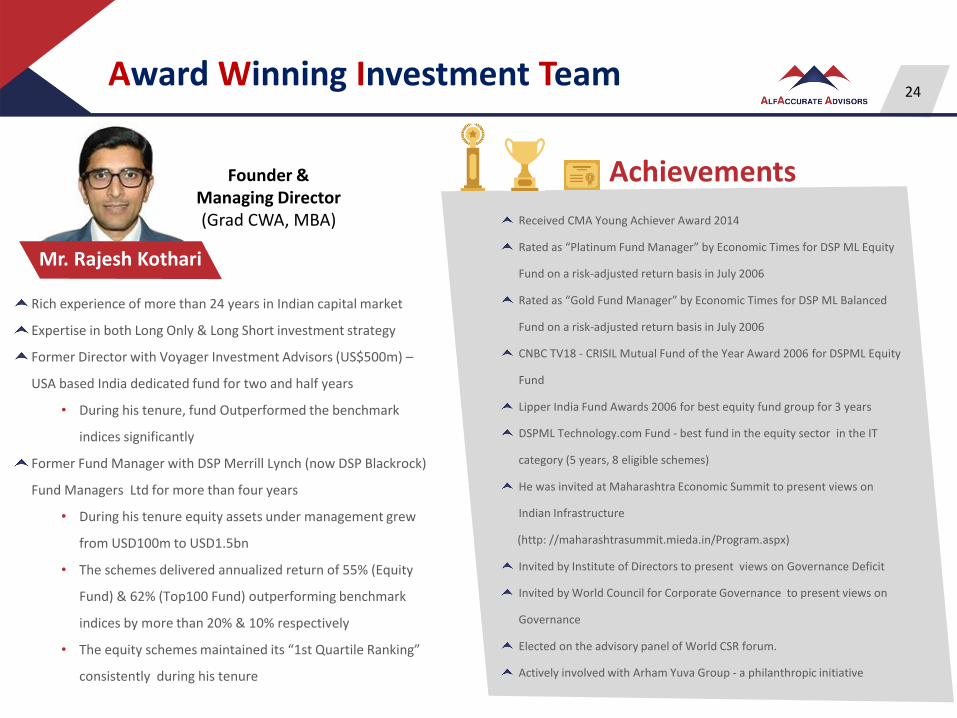
Mr. Rajesh Kothari
Founder & Managing Director (Grad CWA, MBA)
Award Winning Investment Team
Rich experience of more than 24 years in Indian capital market
Expertise in both Long Only & Long Short investment strategy
Former Director with Voyager Investment Advisors (US$500m) –
USA based India dedicated fund for two and half years
• During his tenure, fund Outperformed the benchmark
indices significantly
Former Fund Manager with DSP Merrill Lynch (now DSP Blackrock)
Fund Managers Ltd for more than four years
• During his tenure equity assets under management grew
from USD100m to USD1.5bn
• The schemes delivered annualized return of 55% (Equity
Fund) & 62% (Top100 Fund) outperforming benchmark
indices by more than 20% & 10% respectively
• The equity schemes maintained its “1st Quartile Ranking”
consistently during his tenure
Received CMA Young Achiever Award 2014
Rated as “Platinum Fund Manager” by Economic Times for DSP ML Equity
Fund on a risk-adjusted return basis in July 2006
Rated as “Gold Fund Manager” by Economic Times for DSP ML Balanced
Fund on a risk-adjusted return basis in July 2006
CNBC TV18 - CRISIL Mutual Fund of the Year Award 2006 for DSPML Equity
Fund
Lipper India Fund Awards 2006 for best equity fund group for 3 years
DSPML Technology.com Fund - best fund in the equity sector in the IT
category (5 years, 8 eligible schemes)
He was invited at Maharashtra Economic Summit to present views on
Indian Infrastructure
(http: //maharashtrasummit.mieda.in/Program.aspx)
Invited by Institute of Directors to present views on Governance Deficit
Invited by World Council for Corporate Governance to present views on
Governance
Elected on the advisory panel of World CSR forum.
Actively involved with Arham Yuva Group - a philanthropic initiative
Achievements
24
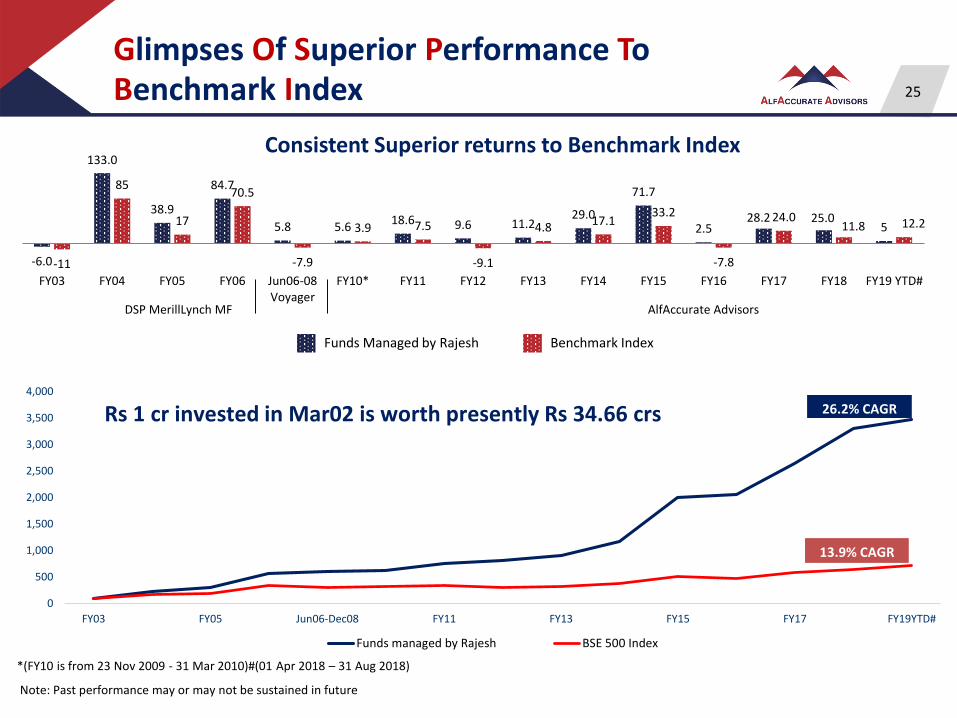
Glimpses Of Superior Performance ToBenchmark Index
-6.0
133.0
38.9
84.7
5.8 5.618.6 9.6 11.2
29.0
71.7
2.528.2 25.0
5
-11
85
17
70.5
-7.9
3.9 7.5
-9.1
4.8 17.133.2
-7.8
24.011.8 12.2
FY03 FY04 FY05 FY06 Jun06-08Voyager
FY10* FY11 FY12 FY13 FY14 FY15 FY16 FY17 FY18 FY19 YTD#
Consistent Superior returns to Benchmark Index
Funds Managed by Rajesh Benchmark Index
DSP MerillLynch MF AlfAccurate Advisors
*(FY10 is from 23 Nov 2009 - 31 Mar 2010)#(01 Apr 2018 – 31 Aug 2018)
Note: Past performance may or may not be sustained in future
25
0
500
1,000
1,500
2,000
2,500
3,000
3,500
4,000
FY03 FY05 Jun06-Dec08 FY11 FY13 FY15 FY17 FY19YTD#
Funds managed by Rajesh BSE 500 Index
26.2% CAGR
13.9% CAGR
Rs 1 cr invested in Mar02 is worth presently Rs 34.66 crs
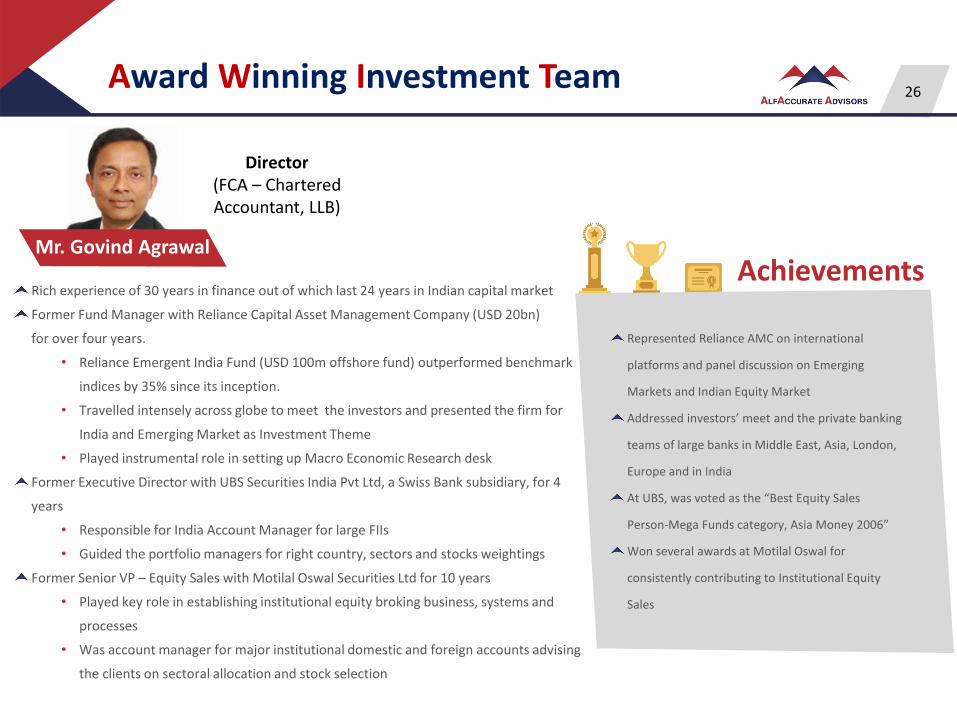
Mr. Govind Agrawal
Director(FCA – Chartered Accountant, LLB)
Rich experience of 30 years in finance out of which last 24 years in Indian capital market
Former Fund Manager with Reliance Capital Asset Management Company (USD 20bn)
for over four years.
• Reliance Emergent India Fund (USD 100m offshore fund) outperformed benchmark
indices by 35% since its inception.
• Travelled intensely across globe to meet the investors and presented the firm for
India and Emerging Market as Investment Theme
• Played instrumental role in setting up Macro Economic Research desk
Former Executive Director with UBS Securities India Pvt Ltd, a Swiss Bank subsidiary, for 4
years
• Responsible for India Account Manager for large FIIs
• Guided the portfolio managers for right country, sectors and stocks weightings
Former Senior VP – Equity Sales with Motilal Oswal Securities Ltd for 10 years
• Played key role in establishing institutional equity broking business, systems and
processes
• Was account manager for major institutional domestic and foreign accounts advising
the clients on sectoral allocation and stock selection
Achievements
Award Winning Investment Team
Represented Reliance AMC on international
platforms and panel discussion on Emerging
Markets and Indian Equity Market
Addressed investors’ meet and the private banking
teams of large banks in Middle East, Asia, London,
Europe and in India
At UBS, was voted as the “Best Equity Sales
Person‐Mega Funds category, Asia Money 2006”
Won several awards at Motilal Oswal for
consistently contributing to Institutional Equity
Sales
26

The
AlfAccurate Advisorsphilosophy
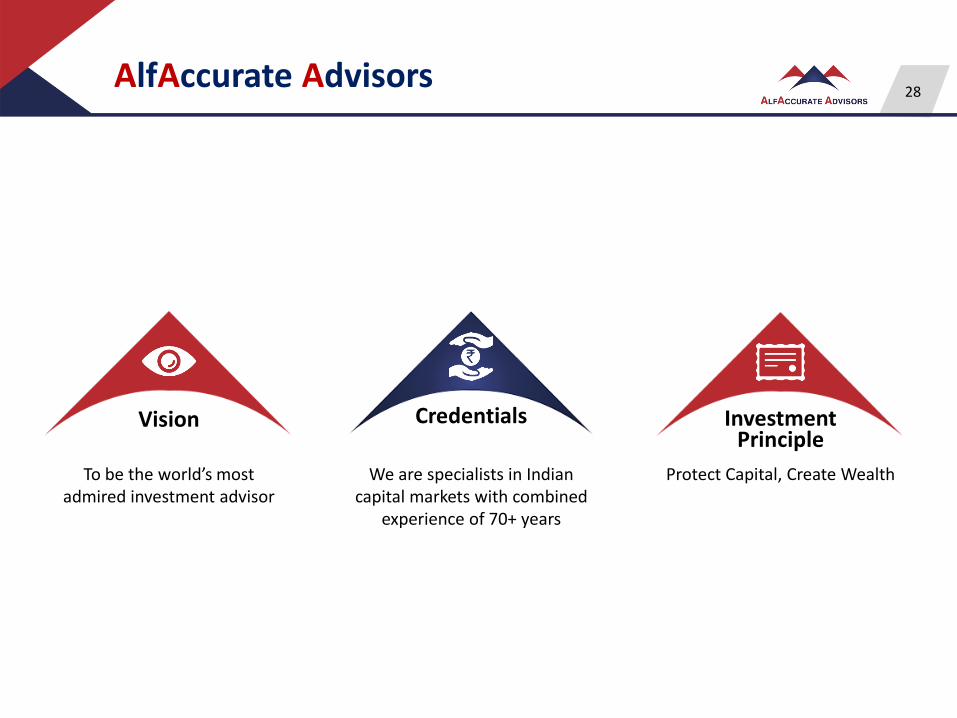
AlfAccurate Advisors
Credentials
We are specialists in Indian capital markets with combined
experience of 70+ years
Investment Principle
Protect Capital, Create Wealth
Vision
To be the world’s most admired investment advisor
28
Our Guiding Principles29
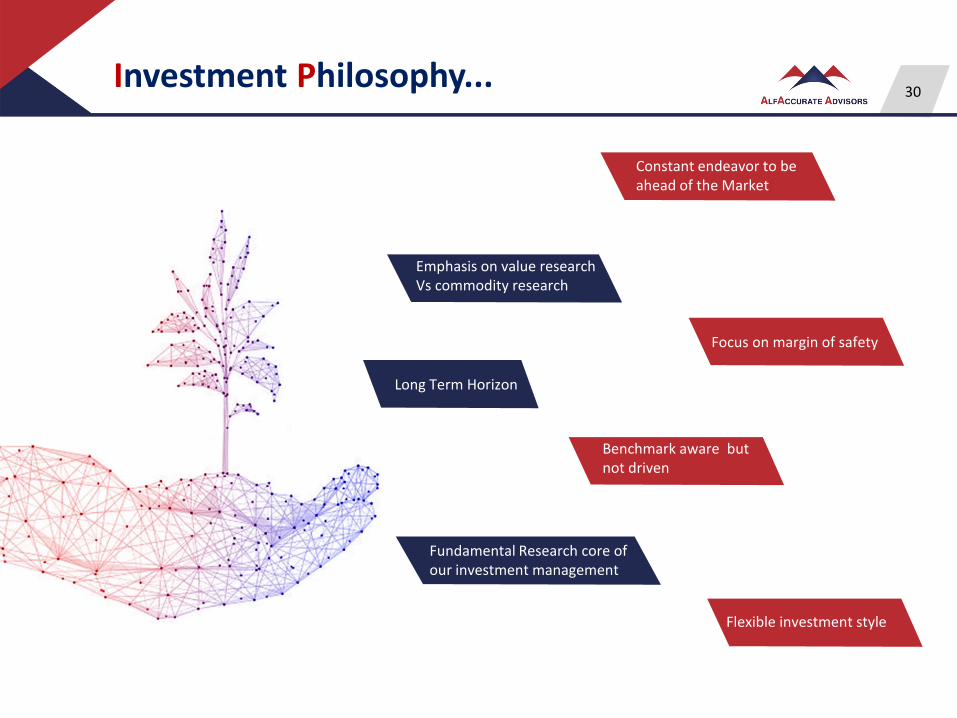
Investment Philosophy...
Fundamental Research core ofour investment management
Constant endeavor to be ahead of the Market
Emphasis on value research Vs commodity research
Benchmark aware butnot driven
Flexible investment style
Focus on margin of safety
Long Term Horizon
30
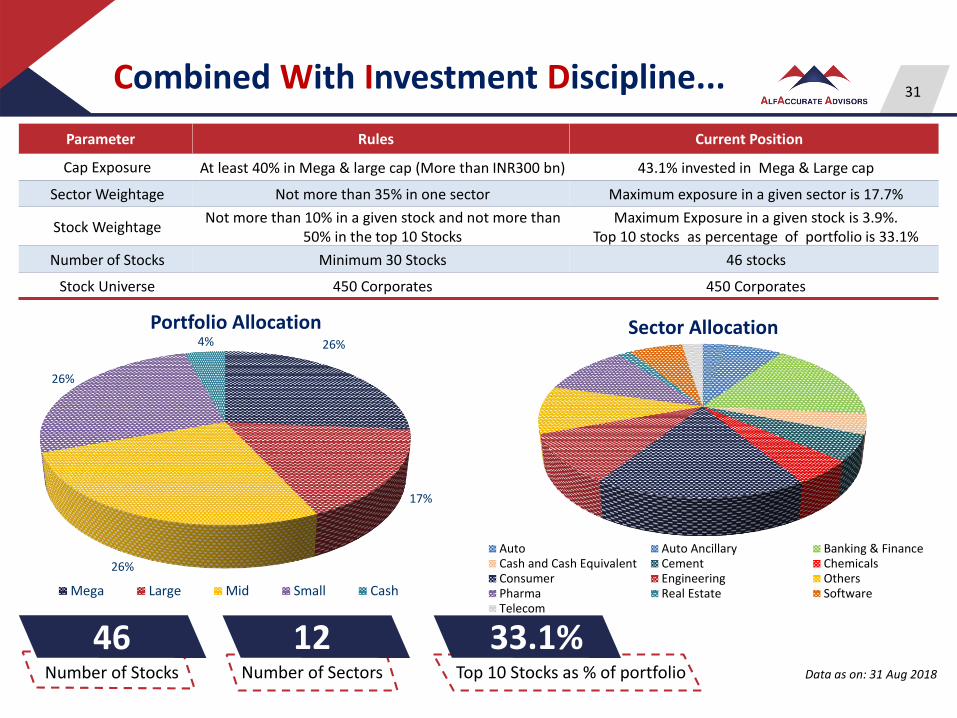
Combined With Investment Discipline...
Parameter Rules Current Position
Cap Exposure At least 40% in Mega & large cap (More than INR300 bn) 43.1% invested in Mega & Large cap
Sector Weightage Not more than 35% in one sector Maximum exposure in a given sector is 17.7%
Stock WeightageNot more than 10% in a given stock and not more than
50% in the top 10 StocksMaximum Exposure in a given stock is 3.9%.
Top 10 stocks as percentage of portfolio is 33.1%
Number of Stocks Minimum 30 Stocks 46 stocks
Stock Universe 450 Corporates 450 Corporates
Data as on: 31 Aug 2018
46Number of Stocks
12Number of Sectors
33.1%Top 10 Stocks as % of portfolio
31
Sector Allocation
Auto Auto Ancillary Banking & FinanceCash and Cash Equivalent Cement ChemicalsConsumer Engineering OthersPharma Real Estate SoftwareTelecom
26%
17%
26%
26%
4%
Portfolio Allocation
Mega Large Mid Small Cash
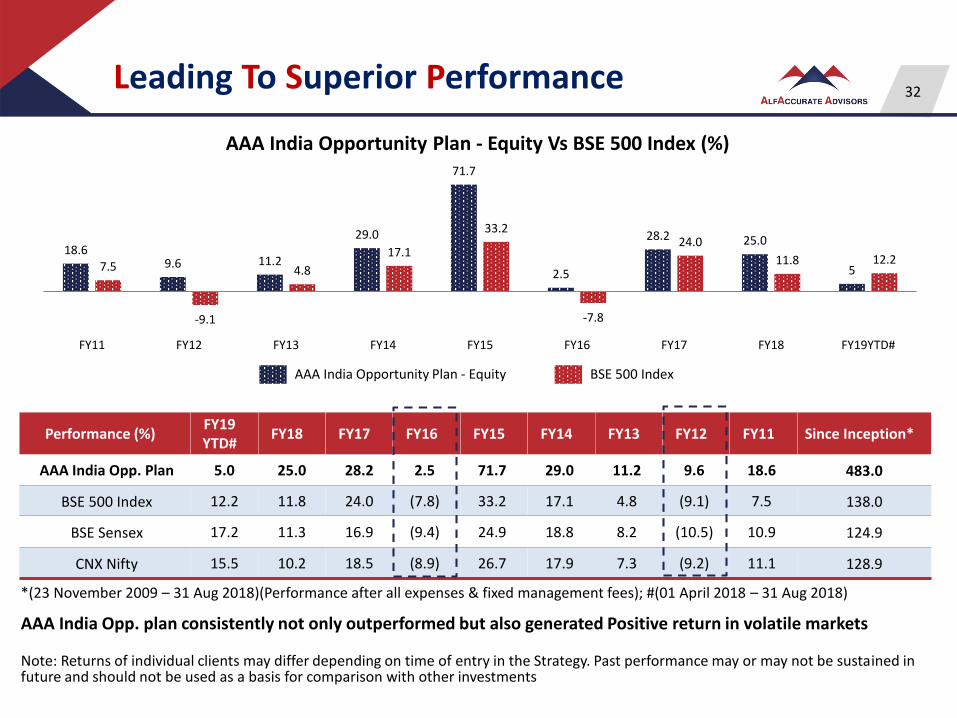
AAA India Opportunity Plan - Equity BSE 500 Index
AAA India Opportunity Plan - Equity Vs BSE 500 Index (%)
18.69.6 11.2
29.0
71.7
2.5
28.2 25.0
57.5
-9.1
4.8
17.1
33.2
-7.8
24.0
11.8 12.2
FY11 FY12 FY13 FY14 FY15 FY16 FY17 FY18 FY19YTD#
Performance (%)FY19YTD#
FY18 FY17 FY16 FY15 FY14 FY13 FY12 FY11 Since Inception*
AAA India Opp. Plan 5.0 25.0 28.2 2.5 71.7 29.0 11.2 9.6 18.6 483.0
BSE 500 Index 12.2 11.8 24.0 (7.8) 33.2 17.1 4.8 (9.1) 7.5 138.0
BSE Sensex 17.2 11.3 16.9 (9.4) 24.9 18.8 8.2 (10.5) 10.9 124.9
CNX Nifty 15.5 10.2 18.5 (8.9) 26.7 17.9 7.3 (9.2) 11.1 128.9
*(23 November 2009 – 31 Aug 2018)(Performance after all expenses & fixed management fees); #(01 April 2018 – 31 Aug 2018)
AAA India Opp. plan consistently not only outperformed but also generated Positive return in volatile markets
Note: Returns of individual clients may differ depending on time of entry in the Strategy. Past performance may or may not be sustained in future and should not be used as a basis for comparison with other investments
32Leading To Superior Performance
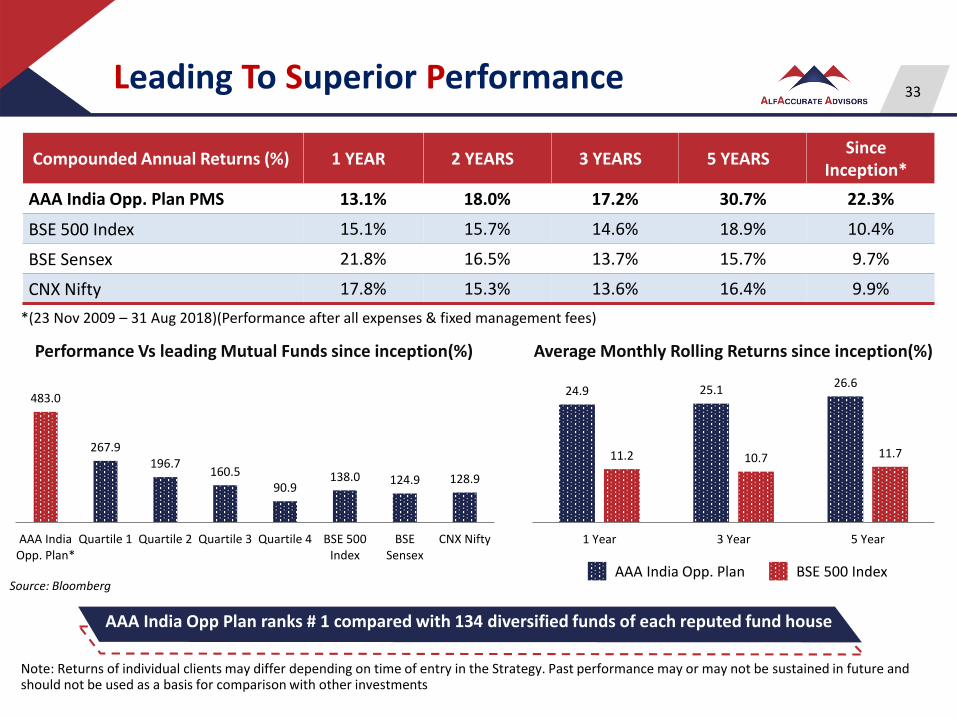
Compounded Annual Returns (%) 1 YEAR 2 YEARS 3 YEARS 5 YEARSSince
Inception*
AAA India Opp. Plan PMS 13.1% 18.0% 17.2% 30.7% 22.3%
BSE 500 Index 15.1% 15.7% 14.6% 18.9% 10.4%
BSE Sensex 21.8% 16.5% 13.7% 15.7% 9.7%
CNX Nifty 17.8% 15.3% 13.6% 16.4% 9.9%
*(23 Nov 2009 – 31 Aug 2018)(Performance after all expenses & fixed management fees)
Performance Vs leading Mutual Funds since inception(%)
483.0
267.9196.7
160.590.9
138.0 124.9 128.9
AAA IndiaOpp. Plan*
Quartile 1 Quartile 2 Quartile 3 Quartile 4 BSE 500Index
BSESensex
CNX Nifty
Average Monthly Rolling Returns since inception(%)
24.9 25.126.6
11.2 10.7 11.7
1 Year 3 Year 5 Year
AAA India Opp. Plan BSE 500 Index
AAA India Opp Plan ranks # 1 compared with 134 diversified funds of each reputed fund house
Note: Returns of individual clients may differ depending on time of entry in the Strategy. Past performance may or may not be sustained in future and should not be used as a basis for comparison with other investments
Source: Bloomberg
33Leading To Superior Performance
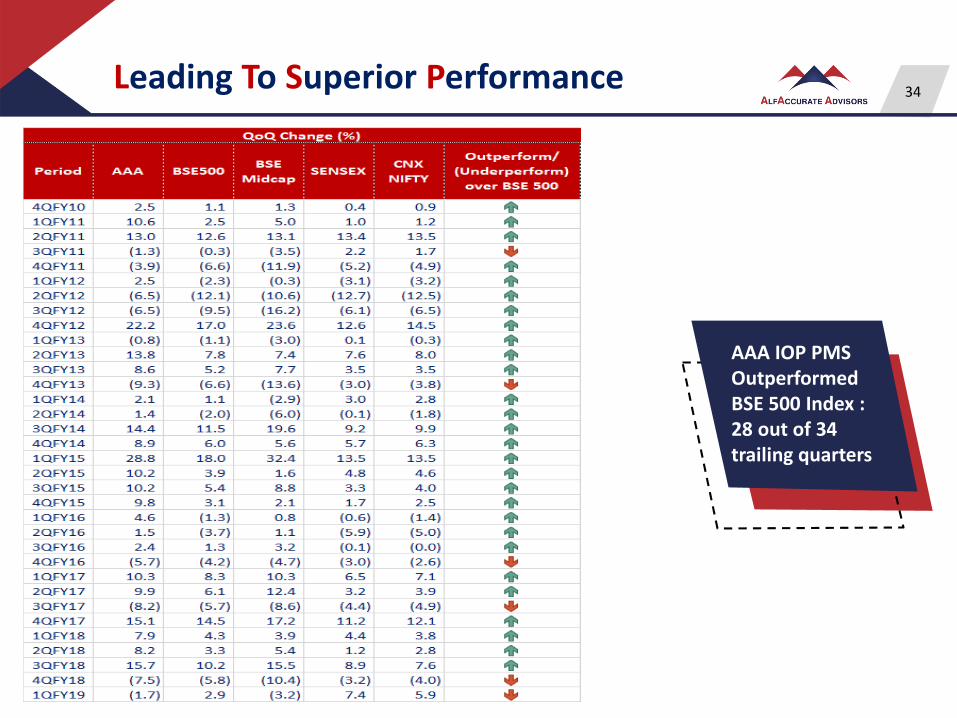
AAA IOP PMS Outperformed BSE 500 Index : 28 out of 34 trailing quarters
34Leading To Superior Performance
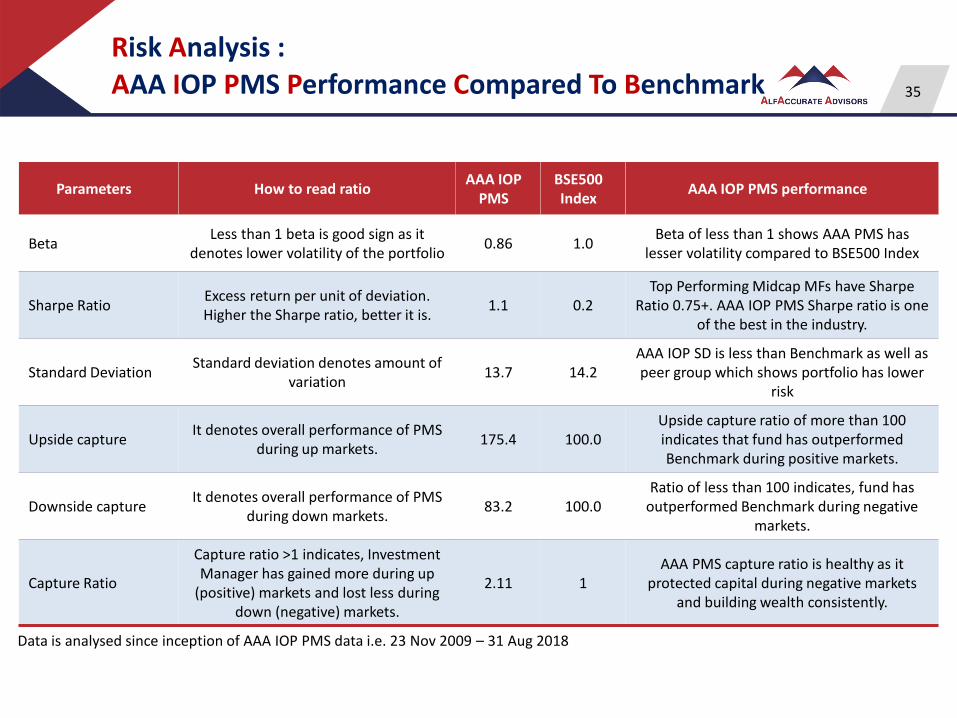
Risk Analysis :AAA IOP PMS Performance Compared To Benchmark
Parameters How to read ratioAAA IOP
PMSBSE500 Index
AAA IOP PMS performance
BetaLess than 1 beta is good sign as it
denotes lower volatility of the portfolio0.86 1.0
Beta of less than 1 shows AAA PMS has lesser volatility compared to BSE500 Index
Sharpe Ratio Excess return per unit of deviation. Higher the Sharpe ratio, better it is.
1.1 0.2Top Performing Midcap MFs have Sharpe
Ratio 0.75+. AAA IOP PMS Sharpe ratio is one of the best in the industry.
Standard DeviationStandard deviation denotes amount of
variation13.7 14.2
AAA IOP SD is less than Benchmark as well as peer group which shows portfolio has lower
risk
Upside capture It denotes overall performance of PMS
during up markets. 175.4 100.0
Upside capture ratio of more than 100 indicates that fund has outperformed Benchmark during positive markets.
Downside captureIt denotes overall performance of PMS
during down markets. 83.2 100.0
Ratio of less than 100 indicates, fund has outperformed Benchmark during negative
markets.
Capture Ratio
Capture ratio >1 indicates, Investment Manager has gained more during up
(positive) markets and lost less during down (negative) markets.
2.11 1AAA PMS capture ratio is healthy as it
protected capital during negative markets and building wealth consistently.
Data is analysed since inception of AAA IOP PMS data i.e. 23 Nov 2009 – 31 Aug 2018
35
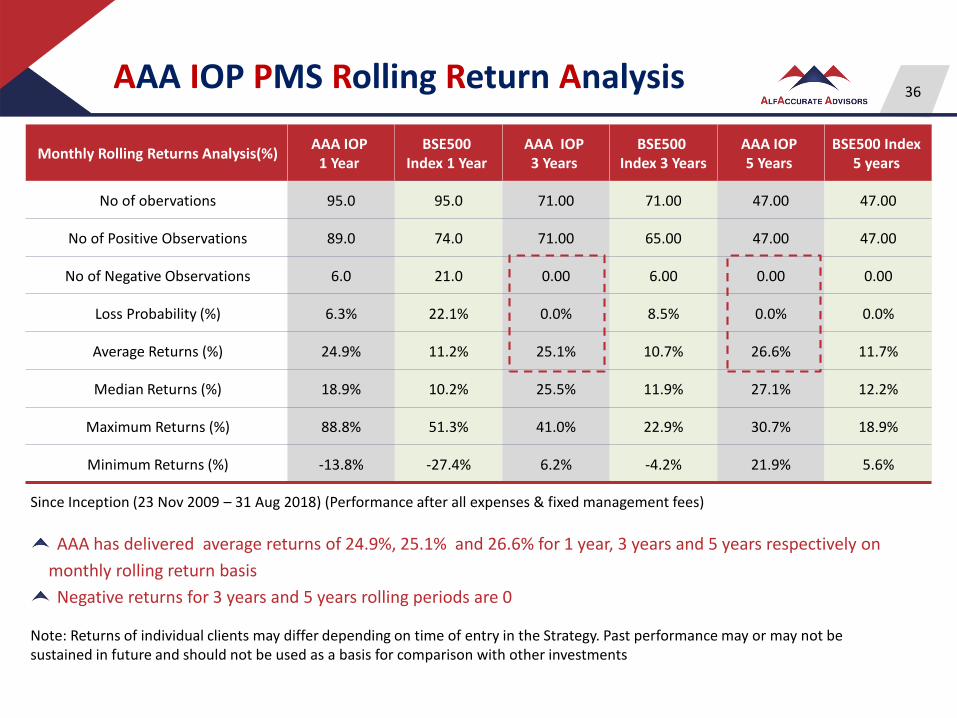
AAA IOP PMS Rolling Return Analysis
Monthly Rolling Returns Analysis(%)AAA IOP
1 YearBSE500
Index 1 YearAAA IOP3 Years
BSE500Index 3 Years
AAA IOP 5 Years
BSE500 Index 5 years
No of obervations 95.0 95.0 71.00 71.00 47.00 47.00
No of Positive Observations 89.0 74.0 71.00 65.00 47.00 47.00
No of Negative Observations 6.0 21.0 0.00 6.00 0.00 0.00
Loss Probability (%) 6.3% 22.1% 0.0% 8.5% 0.0% 0.0%
Average Returns (%) 24.9% 11.2% 25.1% 10.7% 26.6% 11.7%
Median Returns (%) 18.9% 10.2% 25.5% 11.9% 27.1% 12.2%
Maximum Returns (%) 88.8% 51.3% 41.0% 22.9% 30.7% 18.9%
Minimum Returns (%) -13.8% -27.4% 6.2% -4.2% 21.9% 5.6%
Since Inception (23 Nov 2009 – 31 Aug 2018) (Performance after all expenses & fixed management fees)
AAA has delivered average returns of 24.9%, 25.1% and 26.6% for 1 year, 3 years and 5 years respectively on
monthly rolling return basis
Negative returns for 3 years and 5 years rolling periods are 0
Note: Returns of individual clients may differ depending on time of entry in the Strategy. Past performance may or may not besustained in future and should not be used as a basis for comparison with other investments
36
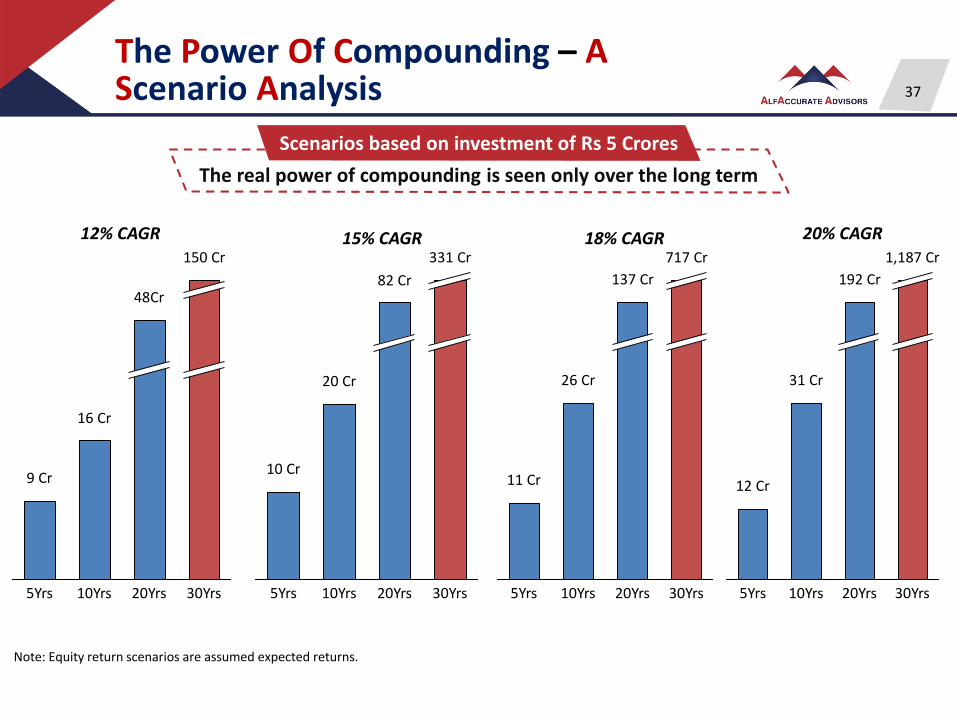
Note: Equity return scenarios are assumed expected returns.
12% CAGR 15% CAGR 20% CAGR
30Yrs
150 Cr
9 Cr
20Yrs5Yrs 10Yrs
16 Cr
48Cr
331 Cr
20 Cr
5Yrs
82 Cr
20Yrs 30Yrs10Yrs
10 Cr
10Yrs 30Yrs
717 Cr
20Yrs
137 Cr
26 Cr
5Yrs
11 Cr
30Yrs20Yrs
1,187 Cr
5Yrs
31 Cr
192 Cr
10Yrs
12 Cr
18% CAGR
The Power Of Compounding – AScenario Analysis
Scenarios based on investment of Rs 5 Crores
The real power of compounding is seen only over the long term
37

Why we should be your choice of
Investment Advisory
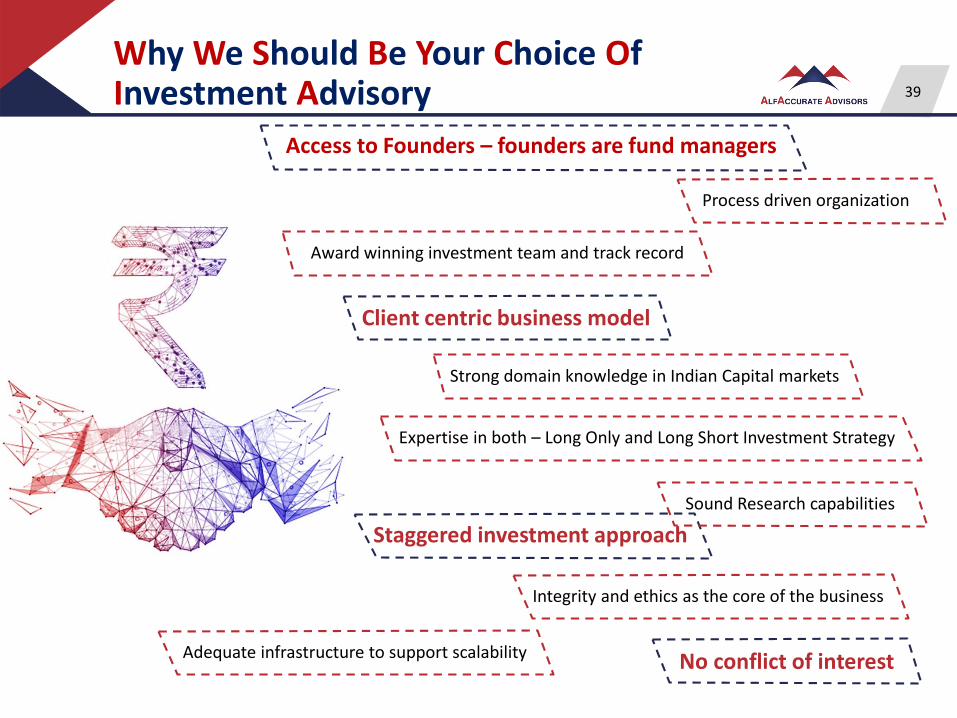
Why We Should Be Your Choice OfInvestment Advisory
Access to Founders – founders are fund managers
Process driven organization
Award winning investment team and track record
No conflict of interest
Staggered investment approach
Sound Research capabilities
Adequate infrastructure to support scalability
Integrity and ethics as the core of the business
Client centric business model
Strong domain knowledge in Indian Capital markets
Expertise in both – Long Only and Long Short Investment Strategy
39
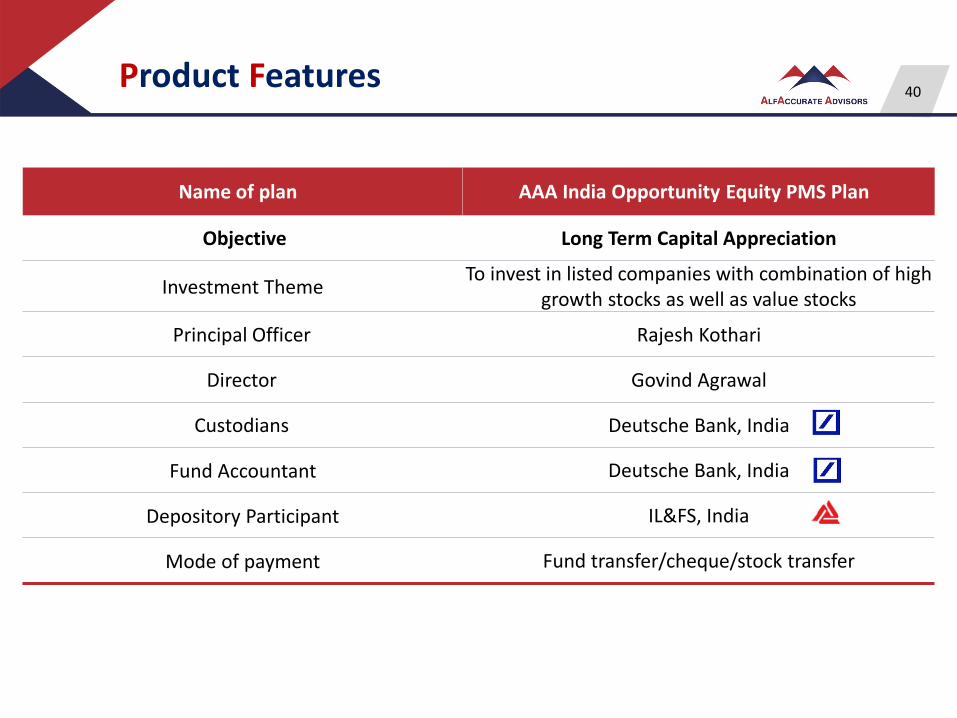
Product Features
Name of plan AAA India Opportunity Equity PMS Plan
Objective Long Term Capital Appreciation
Investment ThemeTo invest in listed companies with combination of high
growth stocks as well as value stocks
Principal Officer Rajesh Kothari
Director Govind Agrawal
Custodians Deutsche Bank, India
Fund Accountant Deutsche Bank, India
Depository Participant IL&FS, India
Mode of payment Fund transfer/cheque/stock transfer
40
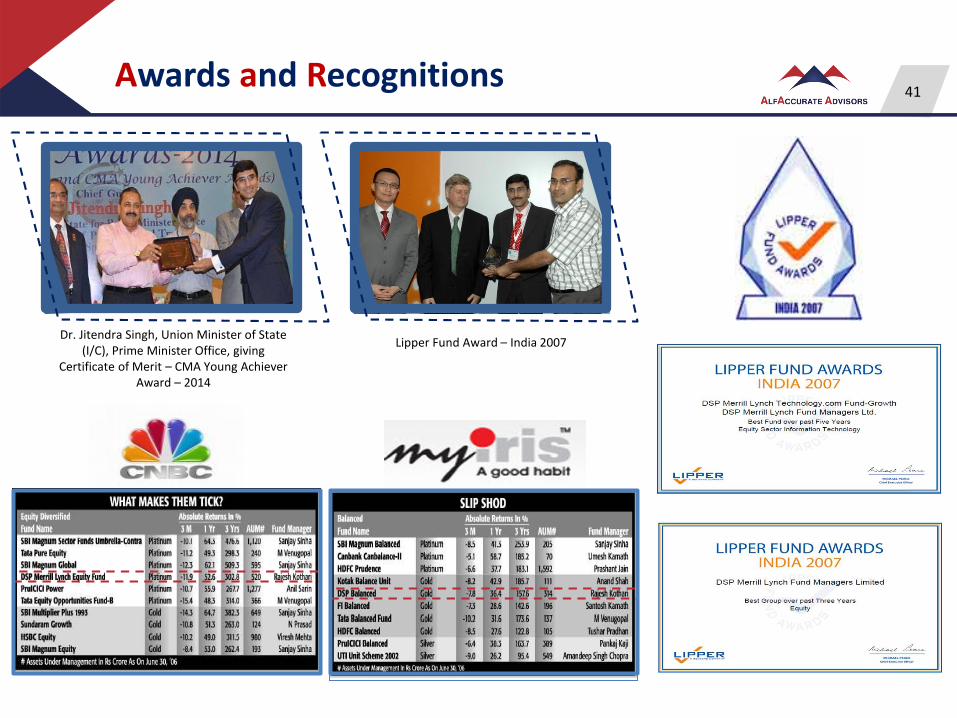
Awards and Recognitions
Dr. Jitendra Singh, Union Minister of State (I/C), Prime Minister Office, giving
Certificate of Merit – CMA Young Achiever Award – 2014
Lipper Fund Award – India 2007
41

Thank You
Rajesh KothariT : +91 22 4236 0301
M : +91 98200 [email protected]
Govind AgrawalT : +91 22 4236 0311M : +91 93208 [email protected]
AlfAccurate Advisors Pvt. Ltd503, B Wing, Naman Midtown,
Elphinstone Road, Mumbai - 400 013, India
T : +91 22 42360300; F : +91 22 42360333 [email protected]
Contact us
Disclaimer: Equity Investments are subject to market risks , read all plan related documents carefully. This document is not for public distribution and has been furnished to you solelyfor your information and may not be reproduced or redistributed to any other person. This material is for the personal information of the authorized recipient. The material is basedupon publicly available information that we consider reliable, but we do not represent that it is accurate or complete, and it should not be relied upon. Opinions expressed are ourcurrent opinions as of the date appearing on this material only. Prospective investors and others are cautioned that any forward-looking statements are not predictions and may besubject to change without notice. Past performance may or may not be sustained in future. No part of this material may be duplicated in any form and/or redistributed withoutAlfAccurate Advisors Pvt Ltd.'s prior written consent. In so far as this report includes current or historical information, it is believed to be reliable, although its accuracy andcompleteness cannot be guaranteed. Alfaccurate Advisors Pvt. Ltd and any person connected with the firm, does not accept any liability arising from the use of this document.