Embed Size (px)
Citation preview

Report produced by Engage Cuba, in coordination with Brian D. Healy, [email protected] (202) 720-8322, USDA-FAS, Office of Global Analysis, Global Policy Analysis Division. Alternate contact: [email protected]
Overview American agribusiness continues to lose market share to the EU, Brazil, and Argentina due to current U.S. policies. The U.S. now ranks 4th in agricultural exports to Cuba. Cuba’s agricultural imports are expected to grow as increased tourism fuels demand for food products, especially those of higher quality, and as remittances flow more freely due to U.S. policy revisions—all within the context of stagnant Cuban production. If Congress were to change U.S. policy on agricultural exports to Cuba, American exports would be more competitive and able to recapture lost market share. Table of Contents
U.S.-Cuba Overview………1 Arkansas……………………2 Georgia……………………...3 Illinois……………………….4 Kansas………………………5 Louisiana…………………...6 Minnesota…………………..7 Nebraska……………………8 Ohio………………………….9 Tennessee…………………10 Texas……………………….11
Prospects for U.S. Agribusiness in Cuba
*Updated as of February 9, 2016 2
Key Points
• American agribusiness continues to lose market share to the EU, Brazil, and Argentina due to current U.S. policies. The U.S. now ranks 4th in agricultural exports to Cuba.
• Cuba’s agricultural imports are expected to grow as increased tourism fuels demand for food products, especially those of higher quality, and as remittances flow more freely due to U.S. policy revisions—all within the context of stagnant Cuban production.
• If Congress were to change U.S. policy on agricultural exports to Cuba, American exports would be more competitive and able to recapture lost market share.
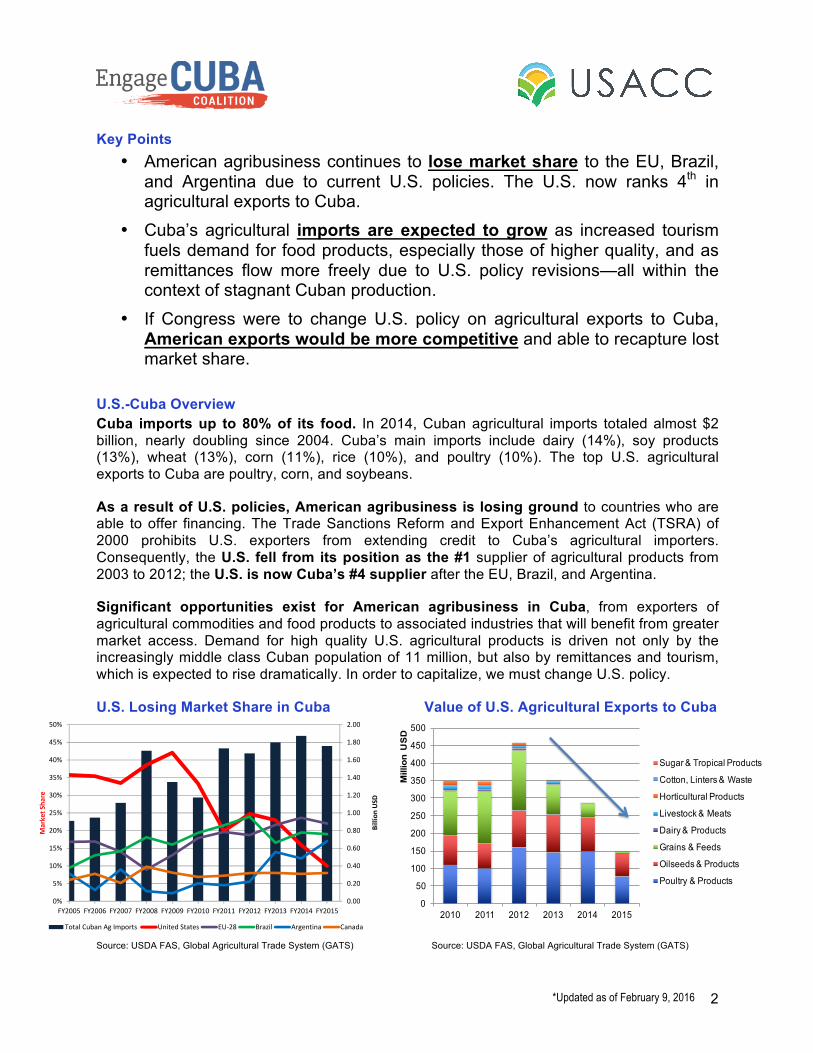
U.S.-Cuba Overview Cuba imports up to 80% of its food. In 2014, Cuban agricultural imports totaled almost $2 billion, nearly doubling since 2004. Cuba’s main imports include dairy (14%), soy products (13%), wheat (13%), corn (11%), rice (10%), and poultry (10%). The top U.S. agricultural exports to Cuba are poultry, corn, and soybeans.
As a result of U.S. policies, American agribusiness is losing ground to countries who are able to offer financing. The Trade Sanctions Reform and Export Enhancement Act (TSRA) of 2000 prohibits U.S. exporters from extending credit to Cuba’s agricultural importers. Consequently, the U.S. fell from its position as the #1 supplier of agricultural products from 2003 to 2012; the U.S. is now Cuba’s #4 supplier after the EU, Brazil, and Argentina.
Significant opportunities exist for American agribusiness in Cuba, from exporters of agricultural commodities and food products to associated industries that will benefit from greater market access. Demand for high quality U.S. agricultural products is driven not only by the increasingly middle class Cuban population of 11 million, but also by remittances and tourism, which is expected to rise dramatically. In order to capitalize, we must change U.S. policy.
U.S. Losing Market Share in Cuba Value of U.S. Agricultural Exports to Cuba
Source: USDA FAS, Global Agricultural Trade System (GATS) Source: USDA FAS, Global Agricultural Trade System (GATS)
0
50
100
150
200
250
300
350
400
450
500
2010 2011 2012 2013 2014 2015
Mill
ion
US
D
Sugar & Tropical Products
Cotton, Linters & Waste
Horticultural Products
Livestock & Meats
Dairy & Products
Grains & Feeds
Oilseeds & Products
Poultry & Products
0.00
0.20
0.40
0.60
0.80
1.00
1.20
1.40
1.60
1.80
2.00
0%
5%
10%
15%
20%
25%
30%
35%
40%
45%
50%
FY2005 FY2006 FY2007 FY2008 FY2009 FY2010 FY2011 FY2012 FY2013 FY2014 FY2015
Billion
USD
Market S
hare
Total Cuban Ag Imports United States EU‐28 Brazil Argentina Canada

*Updated as of February 9, 2016 3
Opportunity Outlook: Arkansas
Arkansas exports to Cuba have considerable room for growth if changes in U.S. policies open opportunities for agricultural trade with Cuba and allow U.S. exporters to offer credit, export and technical assistance, and market development programs. Arkansas is the #1 U.S. rice exporter. Cuba has the highest per capita rice consumption in the Western Hemisphere: about 177lbs per person, compared to 26lbs in the U.S. Prior to the embargo, Cuba was typically the largest market for U.S. long-grain rice exports. Since FY2009, Cuba has not imported any significant quantity of rice from the U.S. The U.S. held nearly 40% of market share in FY2004, but it has been lost to Vietnam and Brazil, who offer credit to Cuba. Arkansas is the #4 U.S. exporter of poultry, reaching $475 million in 2014. Approximately 10% of Cuba’s agricultural imports are poultry meat and poultry products. In spite of the embargo, Cuba is consistently a significant export market for U.S. poultry; in FY2015, Cuba was the 8th largest market for U.S. poultry exports. In 2014, the U.S. exported $148 million in poultry meat to Cuba—comprising 77% of the market—but fell to 52% market share at $96 million in 2015. As a top exporter, Arkansas stands to gain from growth in Cuba’s poultry imports and recapturing market share from Brazil, which owns 43% of the market as of FY2015. Soybeans and corn, Arkansas’s #1 and #7 exports, will be increasingly important as Cuba’s livestock sector develops in the longer term. Already, of Cuba’s nearly $2 billion in agricultural imports, 13% are soybean products (meal plus soybean oil) and 11% corn. The U.S. used to be a major supplier, but has lost market share to Argentina and Brazil. Cuba’s Agricultural Imports, FY2014 Arkansas’s Top Agricultural Exports, 2014
Source: Global Trade Atlas Source: USDA ERS Cuban Rice Imports: Lost U.S. Market Share Cuba’s Broiler Meat Imports
Dairy Products
14%Wheat13%
Corn11%
Rice10%
Poultry10%Soybean
Meal8%
Soybean Oil5%
Feed & Fodder
5%
Other24%
0
50
100
150
200
250
2000
2001
2002
2003
2004
2005
2006
2007
2008
2009
2010
2011
2012
2013
2014
2015
2016
1000
MT
Rank Commodity Value (millions) 1 Soybeans $995.5 2 Rice $809.3 3 Broiler Meat $475.0 4 Cotton $245.8 5 Soybean Meal $229.0 6 Other Poultry Products $146.3 7 Corn $127.7 8 Feeds & Feed Grains $127.6 9 Vegetable Oils $127.0
10 Processed Grain $110.2
0
100
200
300
400
500
600
700
800
2000
/01
2001
/02
2002
/03
2003
/04
2004
/05
2005
/06
2006
/07
2007
/08
2008
/09
2009
/10
2010
/11
2011
/12
2012
/13
2013
/14
2014
/15
1000
MT
Total Imports Imports from U.S.
Source: USDA ERS Source: USDA FAS, PSD Database

*Updated as of February 9, 2016 4
Opportunity Outlook: Georgia
Georgia exports to Cuba have considerable room for growth if changes in U.S. policies open opportunities for agricultural trade with Cuba. Of Cuba’s nearly $2 billion in agricultural imports in FY2014, U.S. agricultural exports to Cuba totaled $300 million—representing 16% market share. However, one area where the U.S. has a dominant role is in the poultry market: in 2014, the U.S. exported $148 million in poultry meat to Cuba—comprising 77% of the market. Georgia is the top U.S. exporter of poultry, reaching almost $600 million in 2014. Approximately 10% of Cuba’s agricultural imports are poultry meat and poultry products. In spite of the embargo, Cuba is consistently a significant export market for U.S. poultry; in FY2014, Cuba was the 8th largest market for U.S. poultry exports. As the top exporter, Georgia stands to gain from the increasing trend in Cuba’s poultry imports and recapturing the market from Brazil. Soybeans and corn, some of Georgia’s top exports, will be increasingly important for Cuba’s agricultural imports as its livestock sector develops. In FY2014, 13% of Cuba’s agricultural imports were soybean products (meal plus soybean oil) and 11% corn. The U.S. used to be a major supplier, but has lost soybean product market share to Argentina and Brazil. Cuba’s Agricultural Imports, FY2014 Georgia’s Top Agricultural Exports, 2014
Source: Global Trade Atlas Source: USDA ERS
Top U.S. Broiler Chicken Exporters in 2014 Cuba’s Broiler Meat Imports
Source: USDA ERS Source: USDA FAS, PSD Database
Dairy Products
14%Wheat13%
Corn11%
Rice10%
Poultry10%Soybean
Meal8%
Soybean Oil5%
Feed & Fodder
5%
Other24%
0
100
200
300
400
500
600
Georgia Alabama North Carolina
Arkansas Mississippi Texas Delaware
Mill
ion $
0
50
100
150
200
250
2000
2001
2002
2003
2004
2005
2006
2007
2008
2009
2010
2011
2012
2013
2014
2015
2016
1000
MT
Rank Commodity Value (millions) 1 Cotton $688.6 2 Broiler Meat (Chicken) $596.3 3 Other Oilseeds $517.8 4 Other Plant Products $228.5 5 Tree Nuts $142.1 6 Other Poultry Products $107.1 7 Processed Vegetables $89.5 8 Soybeans $67.3 9 Corn $67.1
10 Dairy Products $63.7

*Updated as of February 9, 2016 5
Opportunity Outlook: Illinois
Illinois exports to Cuba have considerable room for growth if changes in U.S. policies open opportunities for agricultural trade with Cuba and allow U.S. exporters to extend credit, export and technical assistance, and market development programs. Of Cuba’s nearly $2 billion in agricultural imports in FY2014, U.S. agricultural exports to Cuba totaled $300 million—representing only 16% market share. The U.S. share of total exports fell to 10% in FY2015. As the #3 exporter of U.S. agricultural products, Illinois stands to gain from a change in U.S. policy toward Cuba. Illinois is the top U.S. soybean exporter, nearing $3.4 billion in FY2014. Soybeans and soybean meal will be increasingly important for Cuba’s agricultural imports as its livestock sector develops in the longer term. Already, in FY2014, 13% of Cuba’s agricultural imports were soybean products (meal plus soybean oil). The U.S. used to be a major supplier, but has lost soybean product market share to Argentina and Brazil. Corn, Illinois’s #2 export, presents significant export opportunity. Approximately 11% of Cuba’s agricultural imports are corn. The U.S. was Cuba’s largest corn supplier between 2002 and 2012, with U.S. market share up to 64% in FY2012. However, U.S. exports to Cuba have declined precipitously, outweighed by Argentina and Brazil. In FY2014, U.S. corn exports to Cuba were valued at $28 million, falling to $4.9 million in FY2015. Changes to U.S. policy on agricultural exports to Cuba would allow Illinois exporters to recapture lost market share. Cuba’s Agricultural Imports, FY2014 Illinois’s Top Agricultural Exports, 2014
Source: Global Trade Atlas Source: USDA ERS
Top U.S. Agricultural Exporters in 2014 Cuban Corn Imports: Lost U.S. Market Share
Dairy Products
14%Wheat13%
Corn11%
Rice10%
Poultry10%Soybean
Meal8%
Soybean Oil5%
Feed & Fodder
5%
Other24%
Rank Commodity Value (millions) 1 Soybeans $3,393.0 2 Corn $1,709.5 3 Feeds & Feed Grains $1,382.5 4 Soybean Meal $780.4 5 Pork $438.5 6 Vegetable Oils $433.0 7 Processed Grains $413.2 8 Other Plant Products $292.9 9 Wheat $149.7
10 Beef & Veal $71.1
0100200300400500600700800900
1000
2000
/01
2001
/02
2002
/03
2003
/04
2004
/05
2005
/06
2006
/07
2007
/08
2008
/09
2009
/10
2010
/11
2011
/12
2012
/13
2013
/14
2014
/15
2015
/16
1000
MT
Corn Total Imports Corn Imports from U.S.
Source: USDA ERS Source: USDA FAS, PSD Database
23.6
11.39.3
7.3 7.3 6.4 5.7 4.7 4.5 4.5
0
5
10
15
20
25
CA IA IL MN NE TX IN KS ND OH
Bill
ion
USD
Illinios Rankings for Agricultural Exports:Soybeans & Meal - #1
Corn - #1Feed - #1Pork - #4

*Updated as of February 9, 2016 6
Opportunity Outlook: Kansas
Kansas exports to Cuba have considerable room for growth if changes in U.S. policies open opportunities for agricultural trade with Cuba and allow U.S. exporters to offer credit, export and technical assistance, and market development programs. Kansas is the #2 exporter of U.S. wheat. Wheat is Kansas’s primary agricultural export, accounting for 21% of the state total in 2014 at nearly $990 million. In FY2014, of Cuba’s nearly $2 billion in agricultural imports, 13% was wheat. Prior to the U.S. embargo on Cuba, wheat was one of the top four agricultural exports from the U.S. to Cuba. The U.S. had 43% market share in FY2009 but has not shipped wheat to Cuba since FY2011. The U.S. has been supplanted by other suppliers, namely the EU and Canada. Changes to U.S. policies would allow Kansas wheat exporters to recapture lost market share. Soybeans, feed grains, and corn—Kansas’s #3, #5, and #6 exports, respectively—will be increasingly important as Cuba’s livestock sector develops in the longer term. Already, 13% of Cuba’s agricultural imports are soybean products (meal plus soybean oil), 11% corn, and 5% feed. Like with wheat, the U.S. used to be a major supplier of soybeans and corn, but has lost market share to Argentina and Brazil. Significant opportunities also exist for Kansas to export meat products to Cuba as tourism and remittance growth are expected to fuel demand. Cuba’s Agricultural Imports, FY2014 Kansas’s Top Agricultural Exports, 2014
Source: Global Trade Atlas Source: USDA ERS
Top U.S. Agricultural Exporters Cuban Wheat Imports: Lost U.S. Market Share
Source: USDA ERS Source: USDA FAS, PSD Database
Dairy Products
14%Wheat13%
Corn11%
Rice10%
Poultry10%Soybean
Meal8%
Soybean Oil5%
Feed & Fodder
5%
Other24%
Rank Commodity Value (millions) 1 Wheat $988.8 2 Beef & Veal $787.8 3 Soybeans $556.8 4 Other oilseeds $519.9 5 Feeds & Feed Grains $432.9 6 Corn $361.1 7 Hides & Skins $260.7 8 Processed Grain $196.5 9 Pork $127.0
10 Soybean Meal $110.2
0
200
400
600
800
1000
1200
2000
/01
2001
/02
2002
/03
2003
/04
2004
/05
2005
/06
2006
/07
2007
/08
2008
/09
2009
/10
2010
/11
2011
/12
2012
/13
2013
/14
2014
/15
2015
/16
1000
MT
Wheat Total Imports Wheat Imports from U.S.
23.6
11.39.3
7.3 7.3 6.4 5.7 4.7 4.5 4.5
0.0
5.0
10.0
15.0
20.0
25.0
CA IA IL MN NE TX IN KS ND OH
Bill
ion
USD
Kansas Rankings for Agricultural Exports:Wheat - #2
Beef & Veal - #3Corn - #9
*Updated as of February 9, 2016 7
Opportunity Outlook: Louisiana
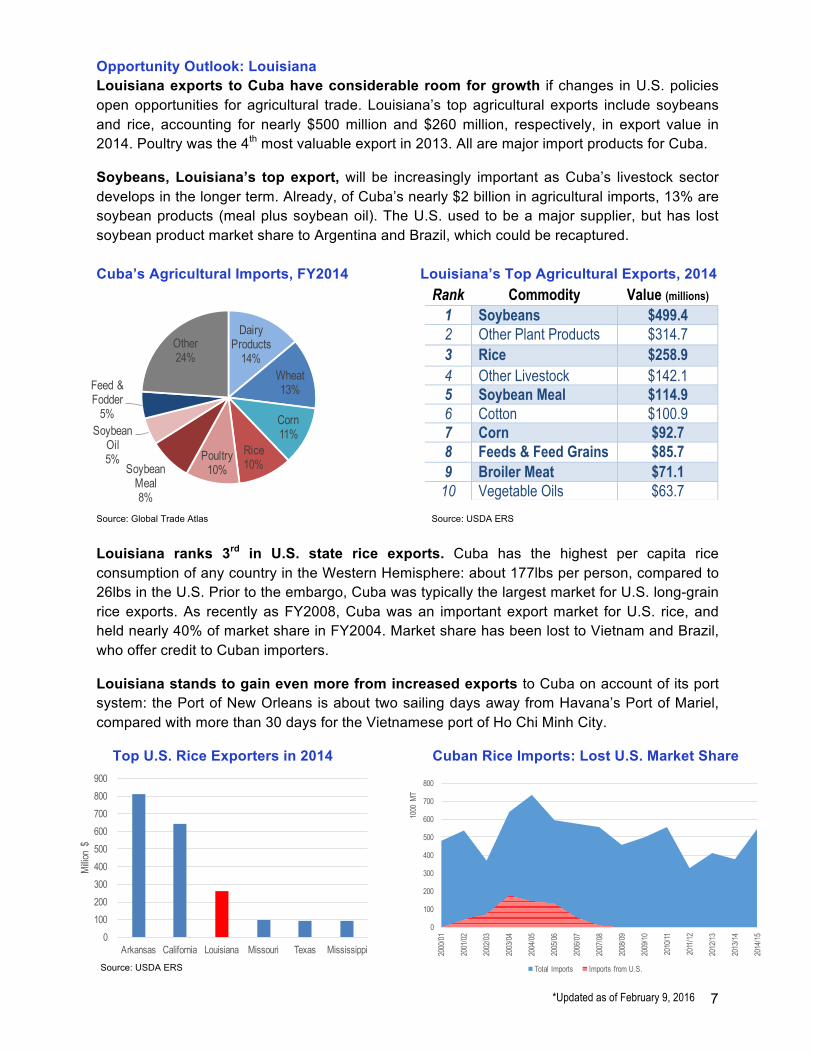
Louisiana exports to Cuba have considerable room for growth if changes in U.S. policies open opportunities for agricultural trade. Louisiana’s top agricultural exports include soybeans and rice, accounting for nearly $500 million and $260 million, respectively, in export value in 2014. Poultry was the 4th most valuable export in 2013. All are major import products for Cuba. Soybeans, Louisiana’s top export, will be increasingly important as Cuba’s livestock sector develops in the longer term. Already, of Cuba’s nearly $2 billion in agricultural imports, 13% are soybean products (meal plus soybean oil). The U.S. used to be a major supplier, but has lost soybean product market share to Argentina and Brazil, which could be recaptured. Cuba’s Agricultural Imports, FY2014 Louisiana’s Top Agricultural Exports, 2014
Source: Global Trade Atlas Source: USDA ERS
Louisiana ranks 3rd in U.S. state rice exports. Cuba has the highest per capita rice consumption of any country in the Western Hemisphere: about 177lbs per person, compared to 26lbs in the U.S. Prior to the embargo, Cuba was typically the largest market for U.S. long-grain rice exports. As recently as FY2008, Cuba was an important export market for U.S. rice, and held nearly 40% of market share in FY2004. Market share has been lost to Vietnam and Brazil, who offer credit to Cuban importers. Louisiana stands to gain even more from increased exports to Cuba on account of its port system: the Port of New Orleans is about two sailing days away from Havana’s Port of Mariel, compared with more than 30 days for the Vietnamese port of Ho Chi Minh City. Top U.S. Rice Exporters in 2014 Cuban Rice Imports: Lost U.S. Market Share
Source: USDA ERS
Dairy Products
14%Wheat13%
Corn11%
Rice10%
Poultry10%Soybean
Meal8%
Soybean Oil5%
Feed & Fodder
5%
Other24%
Rank Commodity Value (millions) 1 Soybeans $499.4 2 Other Plant Products $314.7 3 Rice $258.9 4 Other Livestock $142.1 5 Soybean Meal $114.9 6 Cotton $100.9 7 Corn $92.7 8 Feeds & Feed Grains $85.7 9 Broiler Meat $71.1
10 Vegetable Oils $63.7
0
100
200
300
400
500
600
700
800
900
Arkansas California Louisiana Missouri Texas Mississippi
Milli
on $
0
100
200
300
400
500
600
700
800
2000
/01
2001
/02
2002
/03
2003
/04
2004
/05
2005
/06
2006
/07
2007
/08
2008
/09
2009
/10
2010
/11
2011
/12
2012
/13
2013
/14
2014
/15
1000
MT
Total Imports Imports from U.S.

*Updated as of February 9, 2016 8
Opportunity Outlook: Minnesota
Minnesota exports to Cuba have considerable room for growth if changes in U.S. policies open opportunities for agricultural trade with Cuba and allow U.S. exporters to extend credit, export and technical assistance, and market development programs. Of Cuba’s nearly $2 billion in agricultural imports in FY2014, U.S. represented only 16% market share. As a top agricultural exporter, Minnesota stands to gain from a change in U.S. policy toward Cuba. Minnesota ranks 4th in the U.S. in terms of agricultural exports, with soybeans and corn accounting for nearly 40% of the state’s total export value. Minnesota’s soy exports reached more than $1.9 billion in 2014. Soybeans and soybean meal, Minnesota’s #1 and #6 top exports, respectively, will be increasingly important for Cuba’s agricultural imports as its livestock sector develops in the longer term. Already, in FY2014, 13% of Cuba’s agricultural imports were soybean products (meal plus soybean oil). The U.S. used to be a major supplier, but has lost soybean product market share to Argentina and Brazil. Corn, Minnesota’s #2 export, presents significant export opportunity. Approximately 11% of Cuba’s agricultural imports are corn. The U.S. was Cuba’s largest corn supplier between 2002 and 2012, with U.S. market share up to 64% in FY2012. However, U.S. exports to Cuba have declined precipitously, outweighed by Argentina and Brazil. In FY2014, U.S. corn exports to Cuba were valued at $28 million, falling to $4.9 million in FY2015. Significant opportunities also exist for Minnesota to export meat and dairy products to Cuba as tourism and remittance growth are expected to fuel demand. Cuba’s Agricultural Imports, FY2014 Minnesota’s Top Agricultural Exports, 2014
Source: Global Trade Atlas Source: USDA ERS
Top U.S. Agricultural Exporters in 2014 Cuban Corn Imports: Lost U.S. Market Share
Dairy Products
14%Wheat13%
Corn11%
Rice10%
Poultry10%Soybean
Meal8%
Soybean Oil5%
Feed & Fodder
5%
Other24%
Rank Commodity Value (millions) 1 Soybeans $1,950.2 2 Corn $938.9 3 Pork $797.7 4 Feeds & Feed Grains $781.4 5 Other Plant Products $543.1 6 Soybean Meal $448.6 7 Dairy Products $321.9 8 Wheat $264.9 9 Vegetable Oils $250.6
10 Processed Grains $246.6
0100200300400500600700800900
1000
2000
/01
2001
/02
2002
/03
2003
/04
2004
/05
2005
/06
2006
/07
2007
/08
2008
/09
2009
/10
2010
/11
2011
/12
2012
/13
2013
/14
2014
/15
2015
/16
1000
MT
Corn Total Imports Corn Imports from U.S.
23.6
11.39.3
7.3 7.3 6.4 5.7 4.7 4.5 4.5
0
5
10
15
20
25
CA IA IL MN NE TX IN KS ND OH
Bill
ion
USD
Minnesota Rankings for Agricultural Exports:Pork- #2Corn - #4
Soybeans & Meal - #4Dairy- #8
Source: USDA ERS Source: USDA FAS, PSD Database

*Updated as of February 9, 2016 9
Opportunity Outlook: Nebraska
Nebraska exports to Cuba have considerable room for growth if changes in U.S. policies open opportunities for agricultural trade with Cuba and allow U.S. exporters to extend credit. Of Cuba’s nearly $2 billion in agricultural imports in FY2014, U.S. agricultural exports to Cuba totaled $300 million—representing only 16% market share. The U.S. share of exports fell to 10% in FY2015. As the #3 U.S. exporter of corn, Nebraska stands to gain from a change in U.S. policy toward Cuba. Nebraska’s corn exports reached more than $1.2 billion in 2014. Approximately 11% of Cuba’s agricultural imports are corn. The U.S. was Cuba’s largest corn supplier between 2002 and 2012, with U.S. market share up to 64% in FY2012. However, U.S. exports to Cuba have declined precipitously, outweighed by Argentina and Brazil. In FY2014, U.S. corn exports to Cuba were valued at $28 million but fell to $4.9 million in FY2015. Soybeans and soybean meal, Nebraska’s #1 and #5 top exports, respectively, will be increasingly important for Cuba’s agricultural imports as its livestock sector develops in the longer term. In FY2014, 13% of Cuba’s agricultural imports were soybean products (meal plus soybean oil). As with corn, the U.S. has lost soybean product market share to Brazil and Argentina, who are able to offer credit to Cuba. Cuba’s Agricultural Imports, FY2014 Nebraska’s Top Agricultural Exports, 2014
Source: Global Trade Atlas Source: USDA ERS
Top U.S. Agricultural Exporters in 2014 Cuban Corn Imports: Lost U.S. Market Share
Source: USDA ERS Source: USDA FAS, PSD Database
Dairy Products
14%Wheat13%
Corn11%
Rice10%
Poultry10%Soybean
Meal8%
Soybean Oil5%
Feed & Fodder
5%
Other24%
Rank Commodity Value (millions) 1 Soybeans $1,728.6 2 Corn $1,212.4 3 Beef & Veal $1,128.7 4 Feeds & Feed Grains $1,007.7 5 Soybean Meal $397.6 6 Hides & Skins $377.2 7 Processed Grains $310.5 8 Pork $260.2 9 Wheat $239.2
10 Vegetable Oils $221.3
0100200300400500600700800900
1000
2000
/01
2001
/02
2002
/03
2003
/04
2004
/05
2005
/06
2006
/07
2007
/08
2008
/09
2009
/10
2010
/11
2011
/12
2012
/13
2013
/14
2014
/15
2015
/16
1000
MT
Corn Total Imports Corn Imports from U.S.
23.6
11.39.3
7.3 7.3 6.4 5.7 4.7 4.5 4.5
0
5
10
15
20
25
CA IA IL MN NE TX IN KS ND OH
Bill
ion
USD
Nebraska Rankings for Agricultural Exports:Beef & Veal - #1
Corn - #3Feed - #3
Soybeans & Meal - #5
*Updated as of February 9, 2016 10
Opportunity Outlook: Ohio
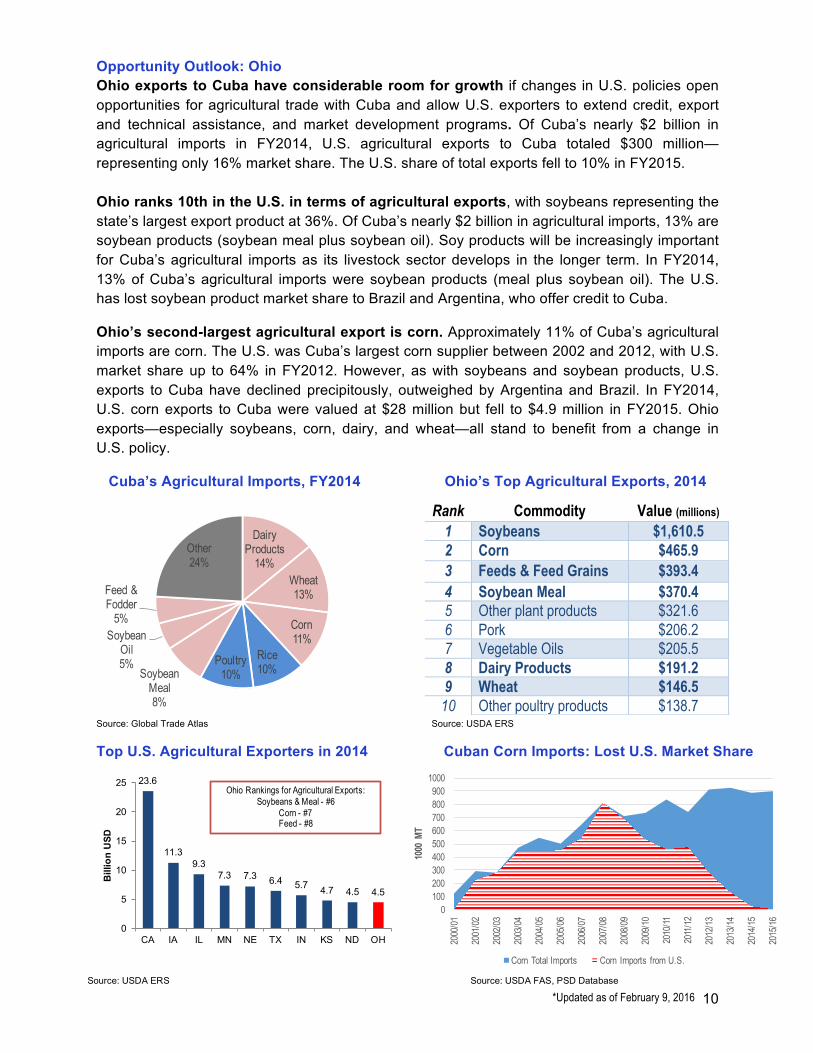
Ohio exports to Cuba have considerable room for growth if changes in U.S. policies open opportunities for agricultural trade with Cuba and allow U.S. exporters to extend credit, export and technical assistance, and market development programs. Of Cuba’s nearly $2 billion in agricultural imports in FY2014, U.S. agricultural exports to Cuba totaled $300 million—representing only 16% market share. The U.S. share of total exports fell to 10% in FY2015. Ohio ranks 10th in the U.S. in terms of agricultural exports, with soybeans representing the state’s largest export product at 36%. Of Cuba’s nearly $2 billion in agricultural imports, 13% are soybean products (soybean meal plus soybean oil). Soy products will be increasingly important for Cuba’s agricultural imports as its livestock sector develops in the longer term. In FY2014, 13% of Cuba’s agricultural imports were soybean products (meal plus soybean oil). The U.S. has lost soybean product market share to Brazil and Argentina, who offer credit to Cuba. Ohio’s second-largest agricultural export is corn. Approximately 11% of Cuba’s agricultural imports are corn. The U.S. was Cuba’s largest corn supplier between 2002 and 2012, with U.S. market share up to 64% in FY2012. However, as with soybeans and soybean products, U.S. exports to Cuba have declined precipitously, outweighed by Argentina and Brazil. In FY2014, U.S. corn exports to Cuba were valued at $28 million but fell to $4.9 million in FY2015. Ohio exports—especially soybeans, corn, dairy, and wheat—all stand to benefit from a change in U.S. policy. Cuba’s Agricultural Imports, FY2014 Ohio’s Top Agricultural Exports, 2014
Source: Global Trade Atlas Source: USDA ERS
Top U.S. Agricultural Exporters in 2014 Cuban Corn Imports: Lost U.S. Market Share
Dairy Products
14%Wheat13%
Corn11%
Rice10%
Poultry10%Soybean
Meal8%
Soybean Oil5%
Feed & Fodder
5%
Other24%
23.6
11.39.3
7.3 7.3 6.4 5.7 4.7 4.5 4.5
0
5
10
15
20
25
CA IA IL MN NE TX IN KS ND OH
Bill
ion
USD
Ohio Rankings for Agricultural Exports:Soybeans & Meal - #6
Corn - #7Feed - #8
Rank Commodity Value (millions) 1 Soybeans $1,610.5 2 Corn $465.9 3 Feeds & Feed Grains $393.4 4 Soybean Meal $370.4 5 Other plant products $321.6 6 Pork $206.2 7 Vegetable Oils $205.5 8 Dairy Products $191.2 9 Wheat $146.5
10 Other poultry products $138.7
0100200300400500600700800900
1000
2000
/01
2001
/02
2002
/03
2003
/04
2004
/05
2005
/06
2006
/07
2007
/08
2008
/09
2009
/10
2010
/11
2011
/12
2012
/13
2013
/14
2014
/15
2015
/16
1000
MT
Corn Total Imports Corn Imports from U.S.
Source: USDA ERS Source: USDA FAS, PSD Database
*Updated as of February 9, 2016 11
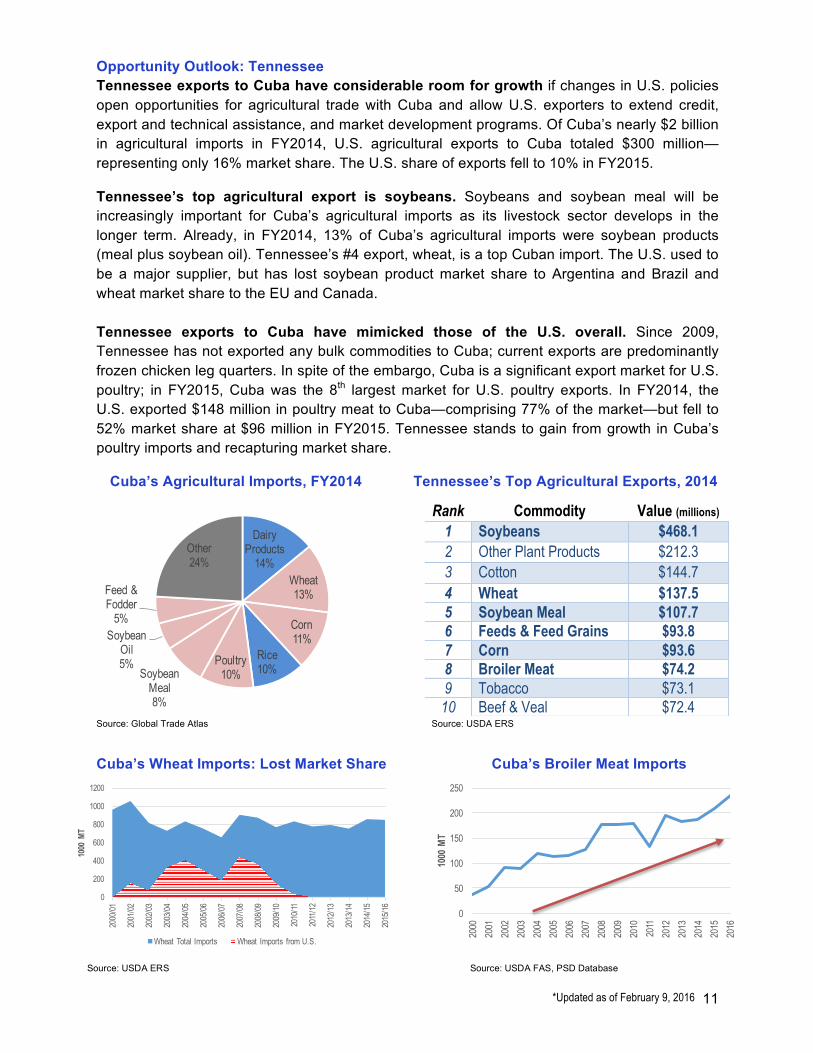
Opportunity Outlook: Tennessee
Tennessee exports to Cuba have considerable room for growth if changes in U.S. policies open opportunities for agricultural trade with Cuba and allow U.S. exporters to extend credit, export and technical assistance, and market development programs. Of Cuba’s nearly $2 billion in agricultural imports in FY2014, U.S. agricultural exports to Cuba totaled $300 million—representing only 16% market share. The U.S. share of exports fell to 10% in FY2015. Tennessee’s top agricultural export is soybeans. Soybeans and soybean meal will be increasingly important for Cuba’s agricultural imports as its livestock sector develops in the longer term. Already, in FY2014, 13% of Cuba’s agricultural imports were soybean products (meal plus soybean oil). Tennessee’s #4 export, wheat, is a top Cuban import. The U.S. used to be a major supplier, but has lost soybean product market share to Argentina and Brazil and wheat market share to the EU and Canada. Tennessee exports to Cuba have mimicked those of the U.S. overall. Since 2009, Tennessee has not exported any bulk commodities to Cuba; current exports are predominantly frozen chicken leg quarters. In spite of the embargo, Cuba is a significant export market for U.S. poultry; in FY2015, Cuba was the 8th largest market for U.S. poultry exports. In FY2014, the U.S. exported $148 million in poultry meat to Cuba—comprising 77% of the market—but fell to 52% market share at $96 million in FY2015. Tennessee stands to gain from growth in Cuba’s poultry imports and recapturing market share. Cuba’s Agricultural Imports, FY2014 Tennessee’s Top Agricultural Exports, 2014
Source: Global Trade Atlas Source: USDA ERS
Cuba’s Wheat Imports: Lost Market Share Cuba’s Broiler Meat Imports
Dairy Products
14%Wheat13%
Corn11%
Rice10%
Poultry10%Soybean
Meal8%
Soybean Oil5%
Feed & Fodder
5%
Other24%
Rank Commodity Value (millions) 1 Soybeans $468.1 2 Other Plant Products $212.3 3 Cotton $144.7 4 Wheat $137.5 5 Soybean Meal $107.7 6 Feeds & Feed Grains $93.8 7 Corn $93.6 8 Broiler Meat $74.2 9 Tobacco $73.1
10 Beef & Veal $72.4
Source: USDA ERS Source: USDA FAS, PSD Database
0
50
100
150
200
250
2000
2001
2002
2003
2004
2005
2006
2007
2008
2009
2010
2011
2012
2013
2014
2015
2016
1000
MT
0
200
400
600
800
1000
1200
2000
/01
2001
/02
2002
/03
2003
/04
2004
/05
2005
/06
2006
/07
2007
/08
2008
/09
2009
/10
2010
/11
2011
/12
2012
/13
2013
/14
2014
/15
2015
/16
1000
MT
Wheat Total Imports Wheat Imports from U.S.
*Updated as of February 9, 2016 12
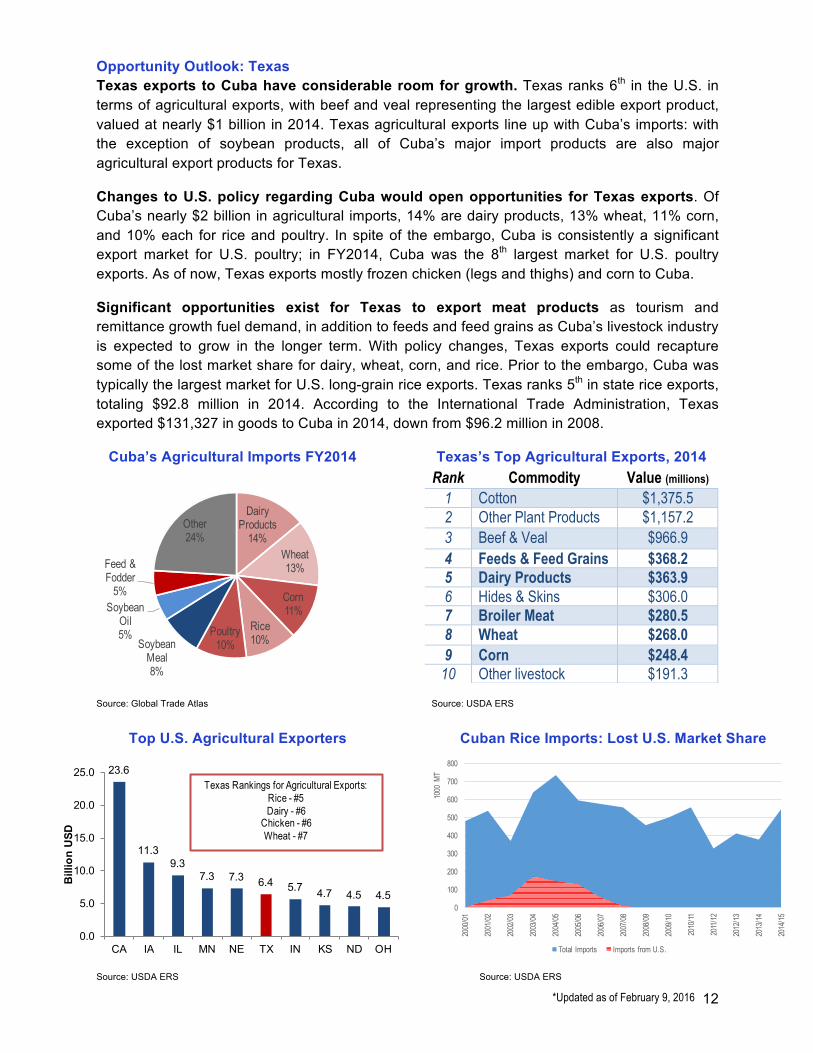
Opportunity Outlook: Texas
Texas exports to Cuba have considerable room for growth. Texas ranks 6th in the U.S. in terms of agricultural exports, with beef and veal representing the largest edible export product, valued at nearly $1 billion in 2014. Texas agricultural exports line up with Cuba’s imports: with the exception of soybean products, all of Cuba’s major import products are also major agricultural export products for Texas. Changes to U.S. policy regarding Cuba would open opportunities for Texas exports. Of Cuba’s nearly $2 billion in agricultural imports, 14% are dairy products, 13% wheat, 11% corn, and 10% each for rice and poultry. In spite of the embargo, Cuba is consistently a significant export market for U.S. poultry; in FY2014, Cuba was the 8th largest market for U.S. poultry exports. As of now, Texas exports mostly frozen chicken (legs and thighs) and corn to Cuba. Significant opportunities exist for Texas to export meat products as tourism and remittance growth fuel demand, in addition to feeds and feed grains as Cuba’s livestock industry is expected to grow in the longer term. With policy changes, Texas exports could recapture some of the lost market share for dairy, wheat, corn, and rice. Prior to the embargo, Cuba was typically the largest market for U.S. long-grain rice exports. Texas ranks 5th in state rice exports, totaling $92.8 million in 2014. According to the International Trade Administration, Texas exported $131,327 in goods to Cuba in 2014, down from $96.2 million in 2008. Cuba’s Agricultural Imports FY2014 Texas’s Top Agricultural Exports, 2014
Source: Global Trade Atlas Source: USDA ERS
Top U.S. Agricultural Exporters Cuban Rice Imports: Lost U.S. Market Share
Source: USDA ERS Source: USDA ERS
Dairy Products
14%Wheat13%
Corn11%
Rice10%
Poultry10%Soybean
Meal8%
Soybean Oil5%
Feed & Fodder
5%
Other24%
23.6
11.39.3
7.3 7.3 6.4 5.7 4.7 4.5 4.5
0.0
5.0
10.0
15.0
20.0
25.0
CA IA IL MN NE TX IN KS ND OH
Bill
ion
USD
Texas Rankings for Agricultural Exports:Rice - #5 Dairy - #6
Chicken - #6Wheat - #7
Rank Commodity Value (millions) 1 Cotton $1,375.5 2 Other Plant Products $1,157.2 3 Beef & Veal $966.9 4 Feeds & Feed Grains $368.2 5 Dairy Products $363.9 6 Hides & Skins $306.0 7 Broiler Meat $280.5 8 Wheat $268.0 9 Corn $248.4
10 Other livestock $191.3
0
100
200
300
400
500
600
700
800
2000
/01
2001
/02
2002
/03
2003
/04
2004
/05
2005
/06
2006
/07
2007
/08
2008
/09
2009
/10
2010
/11
2011
/12
2012
/13
2013
/14
2014
/15
1000
MT
Total Imports Imports from U.S.