Embed Size (px)
Citation preview
Journal of Economic Perspectives—Volume 26, Number 1—Winter 2012—Pages 49–66
II n September 2007, the U.S. Nuclear Regulatory Commission (NRC) received n September 2007, the U.S. Nuclear Regulatory Commission (NRC) received a license application for a proposed nuclear power reactor to be built in a license application for a proposed nuclear power reactor to be built in southern Texas. The application marked the fi rst new license application southern Texas. The application marked the fi rst new license application
in almost three decades. During the following year, the NRC received 16 license in almost three decades. During the following year, the NRC received 16 license applications for a total of 24 proposed reactors. The time was right, so it seemed, applications for a total of 24 proposed reactors. The time was right, so it seemed, for a nuclear power renaissance in the United States. Natural gas prices were at their for a nuclear power renaissance in the United States. Natural gas prices were at their highest level ever in real terms. The 2005 Energy Policy Act provided loan guar-highest level ever in real terms. The 2005 Energy Policy Act provided loan guar-antees, production tax credits, and other subsidies for new nuclear plants. Many antees, production tax credits, and other subsidies for new nuclear plants. Many believed that the United States was close to enacting legislation that would limit believed that the United States was close to enacting legislation that would limit emissions of carbon dioxide.emissions of carbon dioxide.
Then everything changed. Natural gas prices fell sharply in 2009. Legislation to Then everything changed. Natural gas prices fell sharply in 2009. Legislation to limit carbon emissions stalled in Congress. The global recession slowed the growth limit carbon emissions stalled in Congress. The global recession slowed the growth of electricity demand. And in March 2011, an earthquake and tsunami knocked out of electricity demand. And in March 2011, an earthquake and tsunami knocked out power at the Fukushima Daiichi Nuclear Plant in northern Japan, causing partial power at the Fukushima Daiichi Nuclear Plant in northern Japan, causing partial meltdowns at the plant’s three active reactors and large-scale releases of radioactive meltdowns at the plant’s three active reactors and large-scale releases of radioactive steam. Since 2009, only a single additional license application has been fi led with steam. Since 2009, only a single additional license application has been fi led with the NRC. The project proposed for southern Texas has been canceled, and few of the NRC. The project proposed for southern Texas has been canceled, and few of the applications pending with the NRC are moving forward. Fukushima has had the applications pending with the NRC are moving forward. Fukushima has had perhaps an even stronger impact worldwide, leading Germany, Switzerland, and perhaps an even stronger impact worldwide, leading Germany, Switzerland, and Italy to announce plans to phase out their nuclear power programs and causing Italy to announce plans to phase out their nuclear power programs and causing China to suspend approvals for new reactors.China to suspend approvals for new reactors.
Nuclear power has long been controversial because of concerns about nuclear Nuclear power has long been controversial because of concerns about nuclear accidents, storage of spent fuel, and about how the spread of nuclear power might accidents, storage of spent fuel, and about how the spread of nuclear power might
Prospects for Nuclear Power
■ ■ Lucas W. Davis is Assistant Professor at the Haas School of Business, University of Lucas W. Davis is Assistant Professor at the Haas School of Business, University of California, Berkeley, California. His e-mail address is California, Berkeley, California. His e-mail address is ⟨⟨[email protected]@haas.berkeley.edu⟩⟩..
doi=10.1257/jep.26.1.49
Lucas W. Davis
50 Journal of Economic Perspectives
raise risks of the proliferation of nuclear weapons. These concerns are real and raise risks of the proliferation of nuclear weapons. These concerns are real and iimportant. However, emphasizing these concerns implicitly suggests that unless mportant. However, emphasizing these concerns implicitly suggests that unless these issues are taken into account, nuclear power would otherwise be cost effective these issues are taken into account, nuclear power would otherwise be cost effective compared to other forms of electricity generation. This implication is unwarranted. compared to other forms of electricity generation. This implication is unwarranted. Throughout the history of nuclear power, a key challenge has been the high cost of Throughout the history of nuclear power, a key challenge has been the high cost of construction for nuclear plants. Construction costs are high enough that it becomes construction for nuclear plants. Construction costs are high enough that it becomes diffi cult to make an economic argument for nuclear even before incorporating diffi cult to make an economic argument for nuclear even before incorporating these external factors. This is particularly true in countries like the United States these external factors. This is particularly true in countries like the United States where recent technological advances have dramatically increased the availability of where recent technological advances have dramatically increased the availability of natural gas.natural gas.
The chairman of one of the largest U.S. nuclear companies recently said that The chairman of one of the largest U.S. nuclear companies recently said that his company would not break ground on a new nuclear plant until the price of his company would not break ground on a new nuclear plant until the price of natural gas was more than double today’s level and carbon emissions cost $25 per natural gas was more than double today’s level and carbon emissions cost $25 per ton (Wald 2010). This comment summarizes the current economics of nuclear ton (Wald 2010). This comment summarizes the current economics of nuclear power pretty well. Yes, there is a certain confl uence of factors that could make power pretty well. Yes, there is a certain confl uence of factors that could make nuclear power a viable economic option. Otherwise, a nuclear power renaissance nuclear power a viable economic option. Otherwise, a nuclear power renaissance seems unlikely.seems unlikely.
The First Boom and BustThe First Boom and Bust
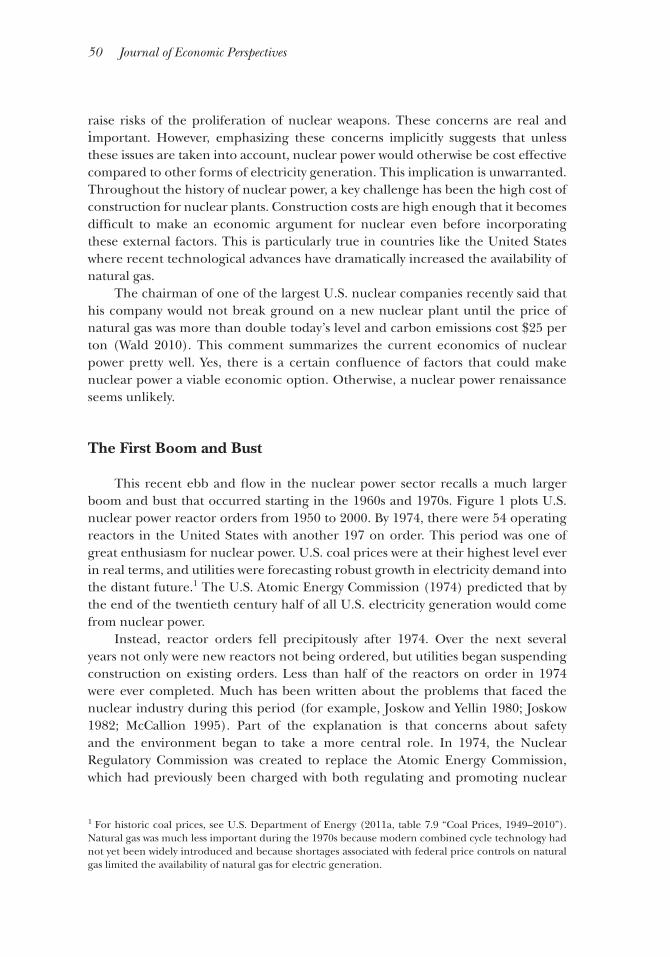
This recent ebb and fl ow in the nuclear power sector recalls a much larger This recent ebb and fl ow in the nuclear power sector recalls a much larger boom and bust that occurred starting in the 1960s and 1970s. Figure 1 plots U.S. boom and bust that occurred starting in the 1960s and 1970s. Figure 1 plots U.S. nuclear power reactor orders from 1950 to 2000. By 1974, there were 54 operating nuclear power reactor orders from 1950 to 2000. By 1974, there were 54 operating reactors in the United States with another 197 on order. This period was one of reactors in the United States with another 197 on order. This period was one of great enthusiasm for nuclear power. U.S. coal prices were at their highest level ever great enthusiasm for nuclear power. U.S. coal prices were at their highest level ever in real terms, and utilities were forecasting robust growth in electricity demand into in real terms, and utilities were forecasting robust growth in electricity demand into the distant future.the distant future.11 The U.S. Atomic Energy Commission (1974) predicted that by The U.S. Atomic Energy Commission (1974) predicted that by the end of the twentieth century half of all U.S. electricity generation would come the end of the twentieth century half of all U.S. electricity generation would come from nuclear power.from nuclear power.
Instead, reactor orders fell precipitously after 1974. Over the next several Instead, reactor orders fell precipitously after 1974. Over the next several years not only were new reactors not being ordered, but utilities began suspending years not only were new reactors not being ordered, but utilities began suspending construction on existing orders. Less than half of the reactors on order in 1974 construction on existing orders. Less than half of the reactors on order in 1974 were ever completed. Much has been written about the problems that faced the were ever completed. Much has been written about the problems that faced the nuclear industry during this period (for example, Joskow and Yellin 1980; Joskow nuclear industry during this period (for example, Joskow and Yellin 1980; Joskow 1982; McCallion 1995). Part of the explanation is that concerns about safety 1982; McCallion 1995). Part of the explanation is that concerns about safety and the environment began to take a more central role. In 1974, the Nuclear and the environment began to take a more central role. In 1974, the Nuclear Regulatory Commission was created to replace the Atomic Energy Commission, Regulatory Commission was created to replace the Atomic Energy Commission, which had previously been charged with both regulating and promoting nuclear which had previously been charged with both regulating and promoting nuclear
1 For historic coal prices, see U.S. Department of Energy (2011a, table 7.9 “Coal Prices, 1949–2010”). Natural gas was much less important during the 1970s because modern combined cycle technology had not yet been widely introduced and because shortages associated with federal price controls on natural gas limited the availability of natural gas for electric generation.
Lucas W. Davis 51
power—a combination of duties which many viewed to be in direct confl ict. This power—a combination of duties which many viewed to be in direct confl ict. This new organization was to oversee the safety and security of all aspects of nuclear new organization was to oversee the safety and security of all aspects of nuclear power, including the initial licensing of reactors, the handling of radioactive mate-power, including the initial licensing of reactors, the handling of radioactive mate-rials, and the storage and disposal of spent fuels. Beginning in the 1970s, it also rials, and the storage and disposal of spent fuels. Beginning in the 1970s, it also became more diffi cult to site nuclear power plants. Communities began challenging became more diffi cult to site nuclear power plants. Communities began challenging nuclear power projects in federal and state courts, leading to extended construction nuclear power projects in federal and state courts, leading to extended construction delays and changing public attitudes about nuclear power.delays and changing public attitudes about nuclear power.
Utility regulation also experienced structural change at this time. During the Utility regulation also experienced structural change at this time. During the 1950s and 1960s, economies of scale, decreasing commodity costs, and relatively 1950s and 1960s, economies of scale, decreasing commodity costs, and relatively low infl ation led to steady decreases in the nominal cost of electricity. Public utility low infl ation led to steady decreases in the nominal cost of electricity. Public utility commissions and consumers were pacifi ed with prices that remained essentially commissions and consumers were pacifi ed with prices that remained essentially the same in nominal terms year after year. Joskow (1974) explains that infl ation in the same in nominal terms year after year. Joskow (1974) explains that infl ation in the early 1970s, “wreaked havoc on this process that appeared to function so the early 1970s, “wreaked havoc on this process that appeared to function so smoothly before . . . and most major fi rms found that they had to raise prices (some smoothly before . . . and most major fi rms found that they had to raise prices (some for the fi rst time in 25 years) and trigger formal regulatory reviews.” These reviews for the fi rst time in 25 years) and trigger formal regulatory reviews.” These reviews led to increased scrutiny of utilities’ capital expenditures, and in particular, invest-led to increased scrutiny of utilities’ capital expenditures, and in particular, invest-ments in nuclear plants.ments in nuclear plants.
Then in March 1979, one of the reactors at the Three Mile Island plant in Then in March 1979, one of the reactors at the Three Mile Island plant in Pennsylvania suffered a partial core meltdown. Although not a single person Pennsylvania suffered a partial core meltdown. Although not a single person was injured, the accident intensifi ed public concerns about nuclear safety. The was injured, the accident intensifi ed public concerns about nuclear safety. The combination of severe public concern about the risk of nuclear acci dents and combination of severe public concern about the risk of nuclear acci dents and
Figure 1U.S. Nuclear Power Reactor Orders
Source: Author based on data from U.S. Department of Energy (1997).
0
10
20
30
40
1950 1955 1960 1965 1970 1975 1980 1985 1990 1995 2000
Three Mile Island
Chernobyl
52 Journal of Economic Perspectives
escalating construction costs put nuclear projects in an extremely vulnerable posi-escalating construction costs put nuclear projects in an extremely vulnerable posi-tion. By the time the Chernobyl disaster occurred in April 1986, expansion of U.S. tion. By the time the Chernobyl disaster occurred in April 1986, expansion of U.S. nuclear power had largely halted. Today in the United States, there are a total of nuclear power had largely halted. Today in the United States, there are a total of 104 nuclear power reactors at 65 sites, accounting for 20 percent of U.S. electricity 104 nuclear power reactors at 65 sites, accounting for 20 percent of U.S. electricity generationgeneration (U.S. Department of Energy 2011a, table 8.2a).(U.S. Department of Energy 2011a, table 8.2a).22 All of these reactors All of these reactors were ordered prior to 1974.were ordered prior to 1974.
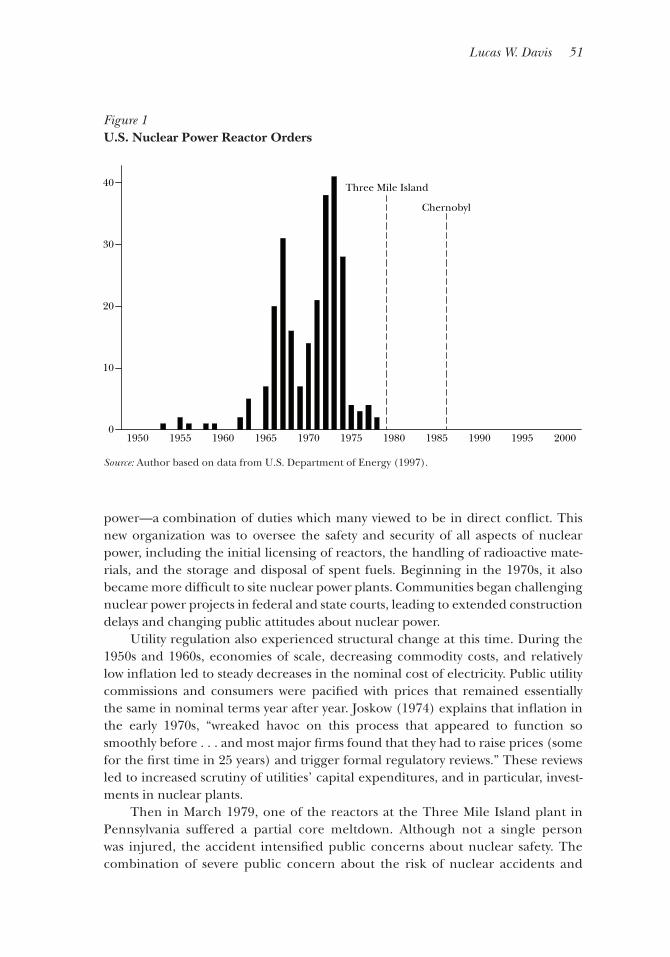
Nuclear reactor construction outside the United States followed a similar Nuclear reactor construction outside the United States followed a similar pattern with a substantial boom in the 1960s and 1970s, followed by a long period pattern with a substantial boom in the 1960s and 1970s, followed by a long period of decline, shown in Figure 2. In addition to the United States, the other large-of decline, shown in Figure 2. In addition to the United States, the other large-scale early adopters of nuclear power were the United Kingdom, France, Germany, scale early adopters of nuclear power were the United Kingdom, France, Germany, Canada, and Japan. By the 1990s, construction had moved to Eastern Europe and in Canada, and Japan. By the 1990s, construction had moved to Eastern Europe and in particular Russia and the Ukraine. The increase in construction 2008–2010 comes particular Russia and the Ukraine. The increase in construction 2008–2010 comes primarily from China, which today has more reactors under construction than any primarily from China, which today has more reactors under construction than any other country.other country.
2 U.S. Department of Energy (2011a, table 8.2a) also reports that U.S. net generation of electricity in 2010 includes coal (45 percent), natural gas (24 percent), nuclear (20 percent), hydroelectric power (7 percent), and wind and other renewables (4 percent). In Davis and Wolfram (2011), my coauthor and I examine in detail operating performance at U.S. nuclear plants.
Figure 2Nuclear Reactors under Construction Worldwide
Source: Author based on data from International Atomic Energy Agency (2011).
0
50
100
150
200 Other
Eastern Europe
Western Europe
United States and Canada
1950 1960 1970 1980 1990 20102000
Prospects for Nuclear Power 53
Historical Construction CostsHistorical Construction Costs
Nuclear power plants are characterized by high construction costs and rela-Nuclear power plants are characterized by high construction costs and rela-tively low operating costs. Later in the paper, I present estimates of “levelized costs,” tively low operating costs. Later in the paper, I present estimates of “levelized costs,” which facilitate comparisons with other generating technologies with different cost which facilitate comparisons with other generating technologies with different cost profi les over time. It is worth starting with construction costs, however, because they profi les over time. It is worth starting with construction costs, however, because they represent a large share of the total cost of nuclear power.represent a large share of the total cost of nuclear power.
Nuclear power plants are enormous facilities with high construction costs. The Nuclear power plants are enormous facilities with high construction costs. The sheer scale of commercial-sized nuclear reactors means that most components must sheer scale of commercial-sized nuclear reactors means that most components must be specially designed and constructed, often with few potential suppliers worldwide. be specially designed and constructed, often with few potential suppliers worldwide. These components are then assembled on site, and structures are constructed to These components are then assembled on site, and structures are constructed to house the assembled components. All stages of design, construction, assembly, and house the assembled components. All stages of design, construction, assembly, and testing require highly-skilled, highly-specialized engineers. Differences in reactor testing require highly-skilled, highly-specialized engineers. Differences in reactor design and site-specifi c factors have historically meant that there was little scope for design and site-specifi c factors have historically meant that there was little scope for spreading design and production costs across multiple projects.spreading design and production costs across multiple projects.
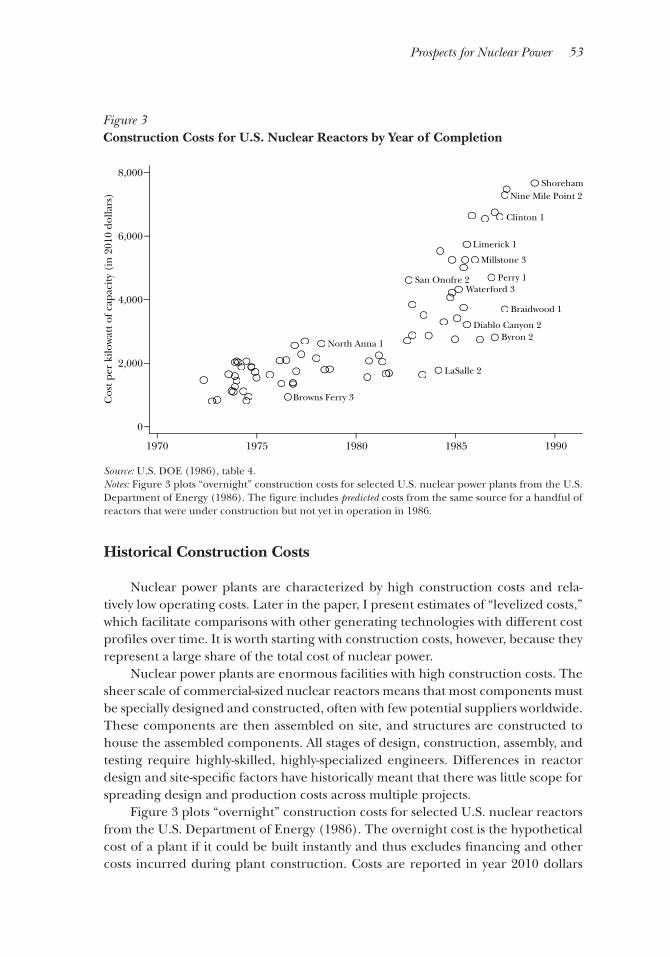
Figure 3 plots “overnight” construction costs for selected U.S. nuclear reactors Figure 3 plots “overnight” construction costs for selected U.S. nuclear reactors from the U.S. Department of Energy (1986). The overnight cost is the hypothetical from the U.S. Department of Energy (1986). The overnight cost is the hypothetical cost of a plant if it could be built instantly and thus excludes fi nancing and other cost of a plant if it could be built instantly and thus excludes fi nancing and other costs incurred during plant construction. Costs are reported in year 2010 dollars costs incurred during plant construction. Costs are reported in year 2010 dollars
Figure 3Construction Costs for U.S. Nuclear Reactors by Year of Completion
Source: U.S. DOE (1986), table 4.Notes: Figure 3 plots “overnight” construction costs for selected U.S. nuclear power plants from the U.S. Department of Energy (1986). The fi gure includes predicted costs from the same source for a handful of reactors that were under construction but not yet in operation in 1986.
1970 1975 1980 1985 1990
0
Cos
t per
kilo
wat
t of c
apac
ity
(in
201
0 do
llars
)
2,000
4,000
6,000
8,000
Browns Ferry 3
North Anna 1
LaSalle 2
Byron 2Diablo Canyon 2
Braidwood 1
Waterford 3Perry 1San Onofre 2
Millstone 3
Limerick 1
Clinton 1
ShorehamNine Mile Point 2
54 Journal of Economic Perspectives
per kilowatt of capacity. The fi gure reveals a pronounced increase in construction per kilowatt of capacity. The fi gure reveals a pronounced increase in construction costs, particularly for plants completed during the 1980s.costs, particularly for plants completed during the 1980s.33
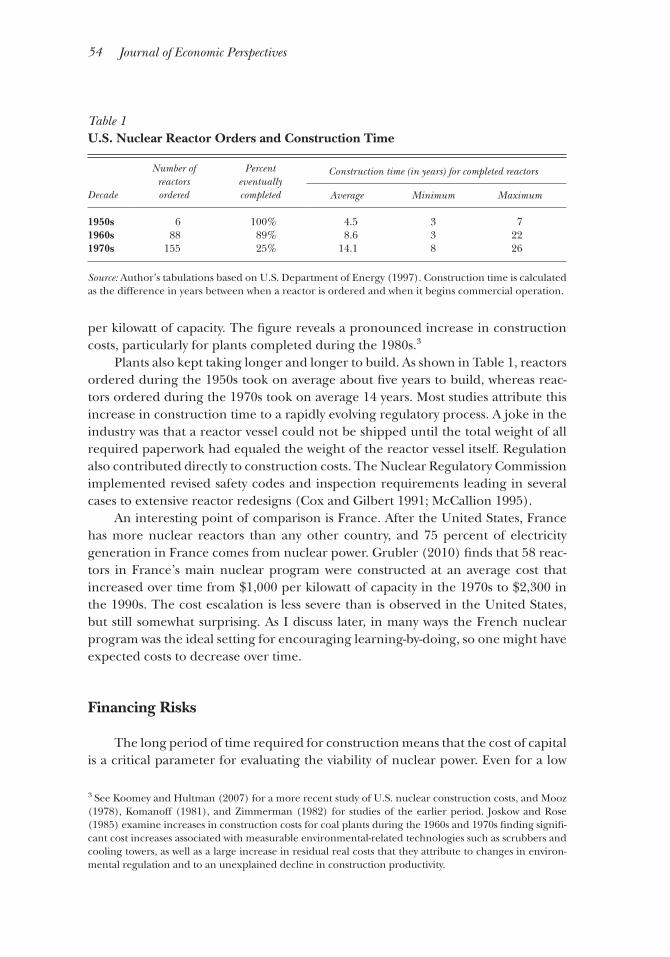
Plants also kept taking longer and longer to build. As shown in Table 1, reactors Plants also kept taking longer and longer to build. As shown in Table 1, reactors ordered during the 1950s took on average about fi ve years to build, whereas reac-ordered during the 1950s took on average about fi ve years to build, whereas reac-tors ordered during the 1970s took on average 14 years. Most studies attribute this tors ordered during the 1970s took on average 14 years. Most studies attribute this increase in construction time to a rapidly evolving regulatory process. A joke in the increase in construction time to a rapidly evolving regulatory process. A joke in the industry was that a reactor vessel could not be shipped until the total weight of all industry was that a reactor vessel could not be shipped until the total weight of all required pa perwork had equaled the weight of the reactor vessel itself. Regulation required pa perwork had equaled the weight of the reactor vessel itself. Regulation also contributed directly to construction costs. The Nuclear Regulatory Commission also contributed directly to construction costs. The Nuclear Regulatory Commission implemented revised safety codes and inspection requirements leading in several implemented revised safety codes and inspection requirements leading in several cases to extensive reactor redesigns (Cox and Gilbert 1991; McCallion 1995).cases to extensive reactor redesigns (Cox and Gilbert 1991; McCallion 1995).
An interesting point of comparison is France. After the United States, France An interesting point of comparison is France. After the United States, France has more nuclear reactors than any other country, and 75 percent of electricity has more nuclear reactors than any other country, and 75 percent of electricity generation in France comes from nuclear power. Grubler (2010) fi nds that 58 reac-generation in France comes from nuclear power. Grubler (2010) fi nds that 58 reac-tors in France’s main nuclear program were constructed at an average cost that tors in France’s main nuclear program were constructed at an average cost that increased over time from $1,000 per kilowatt of capacity in the 1970s to $2,300 in increased over time from $1,000 per kilowatt of capacity in the 1970s to $2,300 in the 1990s. The cost escalation is less severe than is observed in the United States, the 1990s. The cost escalation is less severe than is observed in the United States, but still somewhat surprising. As I discuss later, in many ways the French nuclear but still somewhat surprising. As I discuss later, in many ways the French nuclear program was the ideal setting for encouraging learning-by-doing, so one might have program was the ideal setting for encouraging learning-by-doing, so one might have expected costs to decrease over time.expected costs to decrease over time.
Financing RisksFinancing Risks
The long period of time required for construction means that the cost of capital The long period of time required for construction means that the cost of capital is a critical parameter for evaluating the viability of nuclear power. Even for a low is a critical parameter for evaluating the viability of nuclear power. Even for a low
3 See Koomey and Hultman (2007) for a more recent study of U.S. nuclear construction costs, and Mooz (1978), Komanoff (1981), and Zimmerman (1982) for studies of the earlier period. Joskow and Rose (1985) examine increases in construction costs for coal plants during the 1960s and 1970s fi nding signifi -cant cost increases associated with measurable environmental-related technologies such as scrubbers and cooling towers, as well as a large increase in residual real costs that they attribute to changes in environ-mental regulation and to an unexplained decline in construction productivity.
Table 1U.S. Nuclear Reactor Orders and Construction Time
Number of reactors ordered
Percent eventually completed
Construction time (in years) for completed reactors
Decade Average Minimum Maximum
1950s 6 100% 4.5 3 71960s 88 89% 8.6 3 221970s 155 25% 14.1 8 26
Source: Author’s tabulations based on U.S. Department of Energy (1997). Construction time is calculated as the difference in years between when a reactor is ordered and when it begins commercial operation.
Lucas W. Davis 55
cost of capital, the extended construction period imposes fi nancing costs that are a cost of capital, the extended construction period imposes fi nancing costs that are a substantial part of total project costs. However, nuclear projects typically face a cost substantial part of total project costs. However, nuclear projects typically face a cost of capital well above the risk-free rate. These large-scale projects have a historically of capital well above the risk-free rate. These large-scale projects have a historically high risk of default. The high cost of capital that they face refl ects the number of high risk of default. The high cost of capital that they face refl ects the number of risks that threaten the profi tability, and even viability, of a nuclear project.risks that threaten the profi tability, and even viability, of a nuclear project.
More so than in most other investments, nuclear power plants face sub stantial More so than in most other investments, nuclear power plants face sub stantial regulatory risk. The Nuclear Regulatory Commission has recently adopted several regulatory risk. The Nuclear Regulatory Commission has recently adopted several new procedures intended to streamline the regulatory process. These reforms new procedures intended to streamline the regulatory process. These reforms include pre-approving standard reactor designs, an early site permitting process, include pre-approving standard reactor designs, an early site permitting process, and combining construction and operat ing licenses which previously were applied and combining construction and operat ing licenses which previously were applied for separately. It remains to be seen how these procedures will work in practice. for separately. It remains to be seen how these procedures will work in practice. Regulatory approval is also required at the state and local level, and it can be a Regulatory approval is also required at the state and local level, and it can be a real constraint on plants. For example, in 1989 New York Gov ernor Mario Cuomo real constraint on plants. For example, in 1989 New York Gov ernor Mario Cuomo and the Long Island Lighting Company closed the Shoreham Nuclear Power Plant and the Long Island Lighting Company closed the Shoreham Nuclear Power Plant over long-standing concerns about how nearby residents would be evacuated in over long-standing concerns about how nearby residents would be evacuated in the event of an emergency. The plant was 100 percent completed and had been the event of an emergency. The plant was 100 percent completed and had been connected to the grid, yet was never used to produce a single kilowatt hour of connected to the grid, yet was never used to produce a single kilowatt hour of commercial electricity.commercial electricity.
Nuclear power is also sensitive to federal energy policy. The enthusiasm for Nuclear power is also sensitive to federal energy policy. The enthusiasm for nuclear power in 2007 and 2008 was driven in part by the prospect of a federal nuclear power in 2007 and 2008 was driven in part by the prospect of a federal cap on carbon emissions, and so when the key legislative vehicle (H.R. 2454, the cap on carbon emissions, and so when the key legislative vehicle (H.R. 2454, the “Waxman–Markey bill”) stalled in the U.S. Senate in 2009, it was a signifi cant blow “Waxman–Markey bill”) stalled in the U.S. Senate in 2009, it was a signifi cant blow to the economic viability of new nuclear plants. In the last few years, the Obama to the economic viability of new nuclear plants. In the last few years, the Obama administration and some members of Congress have voiced support for a federal administration and some members of Congress have voiced support for a federal “clean energy standard” under which a proportion of total electricity generation “clean energy standard” under which a proportion of total electricity generation would be required to come from sources that do not generate carbon emissions. would be required to come from sources that do not generate carbon emissions. Such a policy could be a considerable boost for nuclear power, but the exact form Such a policy could be a considerable boost for nuclear power, but the exact form of such legislation, or how likely its adoption would be, is unclear.of such legislation, or how likely its adoption would be, is unclear.
Investors in nuclear power also face the risk that fossil fuel prices could decrease. Investors in nuclear power also face the risk that fossil fuel prices could decrease. In the United States, natural gas prices typically determine the marginal cost of In the United States, natural gas prices typically determine the marginal cost of electricity, so a decrease in natural gas prices reduces profi ts for nuclear plants electricity, so a decrease in natural gas prices reduces profi ts for nuclear plants that sell power in wholesale electricity markets. Global availability of natural gas that sell power in wholesale electricity markets. Global availability of natural gas has increased dramatically in recent years with improvements in horizontal drilling has increased dramatically in recent years with improvements in horizontal drilling and hydraulic fracturing technology. Natural gas producers have long known that and hydraulic fracturing technology. Natural gas producers have long known that shale and other rock deposits contain large amounts of natural gas. It was not until shale and other rock deposits contain large amounts of natural gas. It was not until recently, however, that these resources could be accessed at reasonably low cost.recently, however, that these resources could be accessed at reasonably low cost.
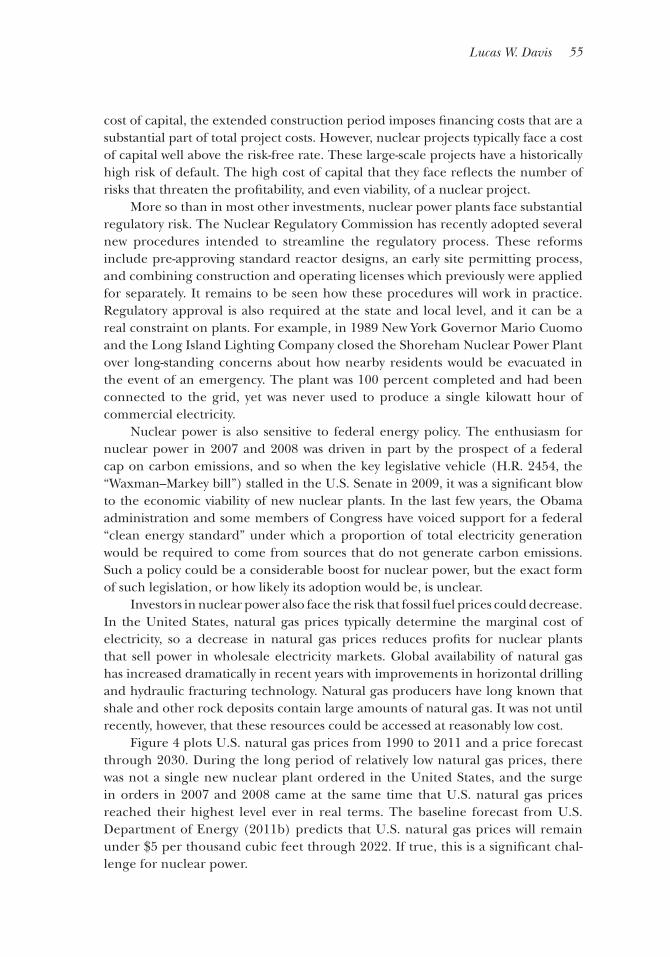
Figure 4 plots U.S. natural gas prices from 1990 to 2011 and a price forecast Figure 4 plots U.S. natural gas prices from 1990 to 2011 and a price forecast through 2030. During the long period of relatively low natural gas prices, there through 2030. During the long period of relatively low natural gas prices, there was not a single new nuclear plant ordered in the United States, and the surge was not a single new nuclear plant ordered in the United States, and the surge in orders in 2007 and 2008 came at the same time that U.S. natural gas prices in orders in 2007 and 2008 came at the same time that U.S. natural gas prices reached their highest level ever in real terms. The baseline forecast from U.S. reached their highest level ever in real terms. The baseline forecast from U.S. Department of Energy (2011b) predicts that U.S. natural gas prices will remain Department of Energy (2011b) predicts that U.S. natural gas prices will remain under $5 per thousand cubic feet through 2022. If true, this is a signifi cant chal-under $5 per thousand cubic feet through 2022. If true, this is a signifi cant chal-lenge for nuclear power.lenge for nuclear power.
56 Journal of Economic Perspectives
Finally, investments in nuclear power face considerable technology risk. Over Finally, investments in nuclear power face considerable technology risk. Over the 40-plus year lifetime of a nuclear plant, the available sources of electricity gener-the 40-plus year lifetime of a nuclear plant, the available sources of electricity gener-ation could change considerably. An alternative, lower-cost technology could come ation could change considerably. An alternative, lower-cost technology could come along, or perhaps a technology that is known today such as wind or solar could along, or perhaps a technology that is known today such as wind or solar could quickly become more cost effective. An alternative technology for carbon abate-quickly become more cost effective. An alternative technology for carbon abate-ment could become practical, like some form of carbon capture and storage, which ment could become practical, like some form of carbon capture and storage, which would render moot one of the advantages of nuclear power. New energy effi ciency would render moot one of the advantages of nuclear power. New energy effi ciency technologies might reduce electricity demand.technologies might reduce electricity demand.
Recent International ExperienceRecent International Experience
More recent evidence on construction costs comes from nuclear reactors More recent evidence on construction costs comes from nuclear reactors currently being built in Olkiluoto, Finland, and Flamanville, France. Much has currently being built in Olkiluoto, Finland, and Flamanville, France. Much has been written about these reactors because they are the fi rst new reactors to be built been written about these reactors because they are the fi rst new reactors to be built in Europe in many years, and because they use a “next generation” design that in Europe in many years, and because they use a “next generation” design that incorporates several new safety features into a reactor design that is widely used incorporates several new safety features into a reactor design that is widely used around the world. Construction in Finland began in 2005 and was expected to around the world. Construction in Finland began in 2005 and was expected to
Figure 4U.S. Natural Gas Prices and Applications to the U.S. Nuclear Regulatory Commission (NRC)
Sources: Author based on data from U.S. Department of Energy (2011a, b) and U.S. Nuclear Regulatory Commission (2011).
Vertical lines indicate applications to NRC
Baseline price forecast, DOE (2011b)
1990 2000 2010 2020 2030
Pric
e pe
r th
ousa
nd
cubi
c fe
et (
in U
.S. 2
010
dolla
rs)
0
2
4
6
8
10
12
Prospects for Nuclear Power 57
be completed in 2009 at cost of about $2,800 per kilowatt of capacity. A series of be completed in 2009 at cost of about $2,800 per kilowatt of capacity. A series of problems and delays have now pushed operations back to 2013, and costs are now problems and delays have now pushed operations back to 2013, and costs are now estimated to be about twice the original estimate. Similarly, construction in France estimated to be about twice the original estimate. Similarly, construction in France began in 2007 and the reactor was expected to be completed by 2011 at a cost of began in 2007 and the reactor was expected to be completed by 2011 at a cost of $2,900 per kilowatt. Completion has now been pushed back to 2014 and the project $2,900 per kilowatt. Completion has now been pushed back to 2014 and the project is reported to be 50 percent over budget.is reported to be 50 percent over budget.
These experiences provide a reminder about problems that can occur during These experiences provide a reminder about problems that can occur during reactor construction, particularly given the lack of recent construction experi-reactor construction, particularly given the lack of recent construction experi-ence. Both projects were delayed substantially when government safety inspectors ence. Both projects were delayed substantially when government safety inspectors found problems. In Finland, the concrete foundation of the reactor building was found problems. In Finland, the concrete foundation of the reactor building was found to be too porous. In France, inspectors found cracks in the concrete foun-found to be too porous. In France, inspectors found cracks in the concrete foun-dation and steel reinforcements in the wrong places. Project managers have been dation and steel reinforcements in the wrong places. Project managers have been blamed in both projects for hiring inexperienced contractors and for providing blamed in both projects for hiring inexperienced contractors and for providing insuffi cient oversight.insuffi cient oversight.
Construction costs have tended to be lower elsewhere. Du and Parsons (2009) Construction costs have tended to be lower elsewhere. Du and Parsons (2009) report a mean overnight cost of $3,100 per kilowatt from fi ve reactors completed in report a mean overnight cost of $3,100 per kilowatt from fi ve reactors completed in Korea and Japan between 2004 and 2006. Construction costs from plants recently Korea and Japan between 2004 and 2006. Construction costs from plants recently completed in China are reported to be even lower and an important area for future completed in China are reported to be even lower and an important area for future research is to examine these costs in detail.research is to examine these costs in detail.
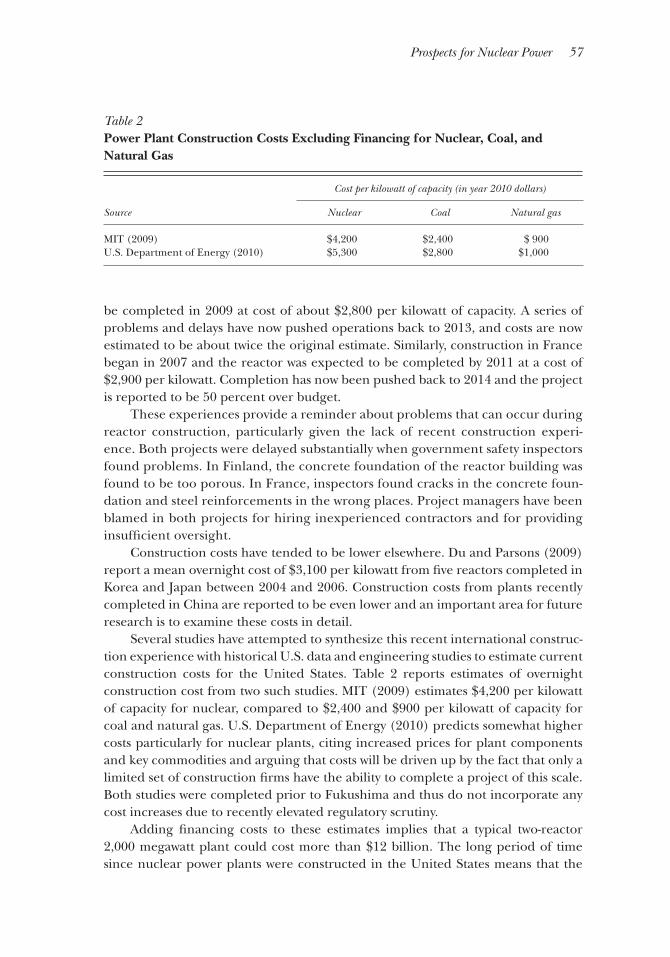
Several studies have attempted to synthesize this recent international construc-Several studies have attempted to synthesize this recent international construc-tion experience with historical U.S. data and engineering studies to estimate current tion experience with historical U.S. data and engineering studies to estimate current construction costs for the United States. Table 2 reports estimates of overnight construction costs for the United States. Table 2 reports estimates of overnight construction cost from two such studies. MIT (2009) estimates $4,200 per kilowatt construction cost from two such studies. MIT (2009) estimates $4,200 per kilowatt of capacity for nuclear, compared to $2,400 and $900 per kilowatt of capacity for of capacity for nuclear, compared to $2,400 and $900 per kilowatt of capacity for coal and natural gas. U.S. Department of Energy (2010) predicts somewhat higher coal and natural gas. U.S. Department of Energy (2010) predicts somewhat higher costs particularly for nuclear plants, citing increased prices for plant components costs particularly for nuclear plants, citing increased prices for plant components and key commodities and arguing that costs will be driven up by the fact that only a and key commodities and arguing that costs will be driven up by the fact that only a limited set of construction fi rms have the ability to complete a project of this scale. limited set of construction fi rms have the ability to complete a project of this scale. Both studies were completed prior to Fukushima and thus do not incorporate any Both studies were completed prior to Fukushima and thus do not incorporate any cost increases due to recently elevated regulatory scrutiny.cost increases due to recently elevated regulatory scrutiny.
Adding fi nancing costs to these estimates implies that a typical two-reactor Adding fi nancing costs to these estimates implies that a typical two-reactor 2,000 megawatt plant could cost more than $12 billion. The long period of time 2,000 megawatt plant could cost more than $12 billion. The long period of time since nuclear power plants were constructed in the United States means that the since nuclear power plants were constructed in the United States means that the
Table 2Power Plant Construction Costs Excluding Financing for Nuclear, Coal, and Natural Gas
Cost per kilowatt of capacity (in year 2010 dollars)
Source Nuclear Coal Natural gas
MIT (2009) $4,200 $2,400 $ 900U.S. Department of Energy (2010) $5,300 $2,800 $1,000
58 Journal of Economic Perspectives
relevant experience that had been accumulated by companies involved with nuclear relevant experience that had been accumulated by companies involved with nuclear engineering and plant construction has atrophied substantially (Joskow and Parsons engineering and plant construction has atrophied substantially (Joskow and Parsons 2009). There is some scope for importing nuclear engineers and other professionals 2009). There is some scope for importing nuclear engineers and other professionals who have worked on more recent nuclear projects in other countries, but the overall who have worked on more recent nuclear projects in other countries, but the overall level of nuclear construction activity worldwide over the last 20 years has been so level of nuclear construction activity worldwide over the last 20 years has been so low that the available global talent is limited. Moreover, the supply of nuclear plant low that the available global talent is limited. Moreover, the supply of nuclear plant components is now more limited than it was during the fi rst wave of nuclear power components is now more limited than it was during the fi rst wave of nuclear power plant construction. For example, there is currently only one facility in the world that plant construction. For example, there is currently only one facility in the world that can produce the nuclear-grade heavy-steel reactor vessel needed for a boiling water can produce the nuclear-grade heavy-steel reactor vessel needed for a boiling water reactor, and there is currently a long waiting period for these forgings and for other reactor, and there is currently a long waiting period for these forgings and for other key nuclear components (Ives, McCabe, and Gilmartin 2010).key nuclear components (Ives, McCabe, and Gilmartin 2010).
These construction cost estimates contain considerable uncertainty, which is These construction cost estimates contain considerable uncertainty, which is itself a barrier to investment. Pindyck (1993) uses a model of irreversible investment itself a barrier to investment. Pindyck (1993) uses a model of irreversible investment to illustrate how uncertainty over the prices of construction inputs and over govern-to illustrate how uncertainty over the prices of construction inputs and over govern-ment regulation affecting construction costs can lead investors to delay investment ment regulation affecting construction costs can lead investors to delay investment on nuclear projects. One of the economic arguments made in support of the subsi-on nuclear projects. One of the economic arguments made in support of the subsi-dies for new nuclear plants in the 2005 Energy Policy Act was that they would help dies for new nuclear plants in the 2005 Energy Policy Act was that they would help resolve this uncertainty about construction costs.resolve this uncertainty about construction costs.
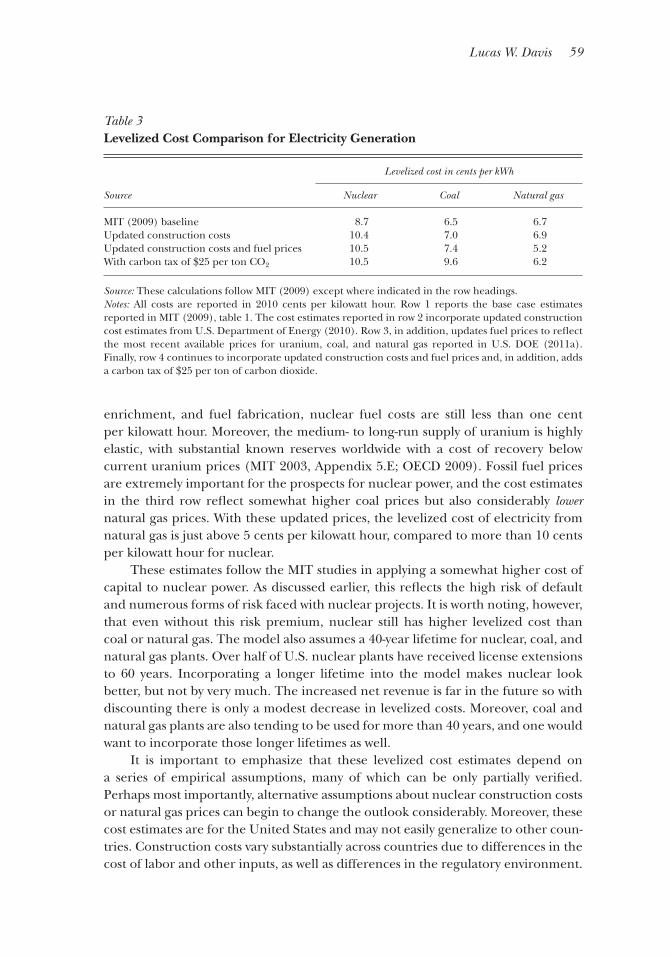
Levelized Cost EstimatesLevelized Cost Estimates
The total cost of producing electricity depends both on construction costs and on The total cost of producing electricity depends both on construction costs and on operations and maintenance expenditures, including fuel. These variable costs tend operations and maintenance expenditures, including fuel. These variable costs tend to be low for nuclear, potentially offsetting the higher cost of construction. Table 3 to be low for nuclear, potentially offsetting the higher cost of construction. Table 3 reports “levelized” costs for electricity generated in the United States from nuclear, reports “levelized” costs for electricity generated in the United States from nuclear, coal, and natural gas, the three primary forms of baseload electricity generation. These coal, and natural gas, the three primary forms of baseload electricity generation. These estimates are based on a cash fl ow model developed in an ongoing series of studies estimates are based on a cash fl ow model developed in an ongoing series of studies at the Massachusetts Institute of Technology (MIT 2003; MIT 2009; Joskow 2006; Du at the Massachusetts Institute of Technology (MIT 2003; MIT 2009; Joskow 2006; Du and Parsons 2009; Joskow and Parsons 2009). For these estimates, all costs including and Parsons 2009; Joskow and Parsons 2009). For these estimates, all costs including construction, operation, maintenance and fuel are calculated and discounted back to construction, operation, maintenance and fuel are calculated and discounted back to the present using an assumed cost of capital. This total cost is then “levelized” over the the present using an assumed cost of capital. This total cost is then “levelized” over the lifetime of a plant in constant dollars to yield the long-run average cost of producing lifetime of a plant in constant dollars to yield the long-run average cost of producing a kilowatt hour of electricity. This is equivalent to the real price per kilowatt hour that a kilowatt hour of electricity. This is equivalent to the real price per kilowatt hour that the plant would need to receive over its lifetime in order to break even.the plant would need to receive over its lifetime in order to break even.
Under the baseline assumptions, nuclear is not competitive with either coal or Under the baseline assumptions, nuclear is not competitive with either coal or natural gas. The fi rst row of Table 3 reports the base case estimates reported in MIT natural gas. The fi rst row of Table 3 reports the base case estimates reported in MIT (2009). The levelized cost of nuclear power is 8.7 cents per kilowatt hour, compared (2009). The levelized cost of nuclear power is 8.7 cents per kilowatt hour, compared to 6.5 cents for coal and 6.7 cents for natural gas. This gap widens in the second to 6.5 cents for coal and 6.7 cents for natural gas. This gap widens in the second row after updating these estimates to refl ect higher construction cost estimates row after updating these estimates to refl ect higher construction cost estimates from U.S. Department of Energy (2010). The third row updates the estimates to from U.S. Department of Energy (2010). The third row updates the estimates to refl ect changes in fuel prices since 2009. Uranium prices have increased modestly, refl ect changes in fuel prices since 2009. Uranium prices have increased modestly, but fuel expenditures represent a relatively small proportion of the total cost of but fuel expenditures represent a relatively small proportion of the total cost of nuclear power, and at this higher price, even after including costs for conversion, nuclear power, and at this higher price, even after including costs for conversion,
Lucas W. Davis 59
enrichment, and fuel fabrication, nuclear fuel costs are still less than one cent enrichment, and fuel fabrication, nuclear fuel costs are still less than one cent per kilowatt hour. Moreover, the medium- to long-run supply of uranium is highly per kilowatt hour. Moreover, the medium- to long-run supply of uranium is highly elastic, with substantial known reserves worldwide with a cost of recovery below elastic, with substantial known reserves worldwide with a cost of recovery below current uranium prices (MIT 2003, Appendix 5.E; OECD 2009). Fossil fuel prices current uranium prices (MIT 2003, Appendix 5.E; OECD 2009). Fossil fuel prices are extremely important for the prospects for nuclear power, and the cost estimates are extremely important for the prospects for nuclear power, and the cost estimates in the third row refl ect somewhat higher coal prices but also considerably in the third row refl ect somewhat higher coal prices but also considerably lower natural gas prices. With these updated prices, the levelized cost of electricity from natural gas prices. With these updated prices, the levelized cost of electricity from natural gas is just above 5 cents per kilowatt hour, compared to more than 10 cents natural gas is just above 5 cents per kilowatt hour, compared to more than 10 cents per kilowatt hour for nuclear.per kilowatt hour for nuclear.
These estimates follow the MIT studies in applying a somewhat higher cost of These estimates follow the MIT studies in applying a somewhat higher cost of capital to nuclear power. As discussed earlier, this refl ects the high risk of default capital to nuclear power. As discussed earlier, this refl ects the high risk of default and numerous forms of risk faced with nuclear projects. It is worth noting, however, and numerous forms of risk faced with nuclear projects. It is worth noting, however, that even without this risk premium, nuclear still has higher levelized cost than that even without this risk premium, nuclear still has higher levelized cost than coal or natural gas. The model also assumes a 40-year lifetime for nuclear, coal, and coal or natural gas. The model also assumes a 40-year lifetime for nuclear, coal, and natural gas plants. Over half of U.S. nuclear plants have received license extensions natural gas plants. Over half of U.S. nuclear plants have received license extensions to 60 years. Incorporating a longer lifetime into the model makes nuclear look to 60 years. Incorporating a longer lifetime into the model makes nuclear look better, but not by very much. The increased net revenue is far in the future so with better, but not by very much. The increased net revenue is far in the future so with discounting there is only a modest decrease in levelized costs. Moreover, coal and discounting there is only a modest decrease in levelized costs. Moreover, coal and natural gas plants are also tending to be used for more than 40 years, and one would natural gas plants are also tending to be used for more than 40 years, and one would want to incorporate those longer lifetimes as well.want to incorporate those longer lifetimes as well.
It is important to emphasize that these levelized cost estimates depend on It is important to emphasize that these levelized cost estimates depend on a series of empirical assumptions, many of which can be only partially verifi ed. a series of empirical assumptions, many of which can be only partially verifi ed. Perhaps most importantly, alternative assumptions about nuclear construction costs Perhaps most importantly, alternative assumptions about nuclear construction costs or natural gas prices can begin to change the outlook considerably. Moreover, these or natural gas prices can begin to change the outlook considerably. Moreover, these cost estimates are for the United States and may not easily generalize to other coun-cost estimates are for the United States and may not easily generalize to other coun-tries. Construction costs vary substantially across countries due to differences in the tries. Construction costs vary substantially across countries due to differences in the cost of labor and other inputs, as well as differences in the regulatory environment. cost of labor and other inputs, as well as differences in the regulatory environment.
Table 3Levelized Cost Comparison for Electricity Generation
Levelized cost in cents per kWh
Source Nuclear Coal Natural gas
MIT (2009) baseline 8.7 6.5 6.7Updated construction costs 10.4 7.0 6.9Updated construction costs and fuel prices 10.5 7.4 5.2With carbon tax of $25 per ton CO2 10.5 9.6 6.2
Source: These calculations follow MIT (2009) except where indicated in the row headings.Notes: All costs are reported in 2010 cents per kilowatt hour. Row 1 reports the base case estimates reported in MIT (2009), table 1. The cost estimates reported in row 2 incorporate updated construction cost estimates from U.S. Department of Energy (2010). Row 3, in addition, updates fuel prices to refl ect the most recent available prices for uranium, coal, and natural gas reported in U.S. DOE (2011a). Finally, row 4 continues to incorporate updated construction costs and fuel prices and, in addition, adds a carbon tax of $25 per ton of carbon dioxide.
60 Journal of Economic Perspectives
Another key factor is the availability of natural gas. Global capacity to transport Another key factor is the availability of natural gas. Global capacity to transport liquefi ed natural gas is increasing rapidly but is still insuffi cient to have eliminated liquefi ed natural gas is increasing rapidly but is still insuffi cient to have eliminated price differences across countries.price differences across countries.
Incorporating ExternalitiesIncorporating Externalities
Levelized cost estimates are typically designed to refl ect the Levelized cost estimates are typically designed to refl ect the private costs of costs of investing in different forms of electricity generation. Thus they provide a basis investing in different forms of electricity generation. Thus they provide a basis for determining whether different types of plants for determining whether different types of plants will be built, but not necessarily be built, but not necessarily for determining whether different types of plants for determining whether different types of plants should be built.be built.
The fourth row in Table 3 incorporates a tax of $25 per ton of carbon dioxide. The fourth row in Table 3 incorporates a tax of $25 per ton of carbon dioxide. As a point of comparison, the Federal Interagency Working Group (2010) adopts a As a point of comparison, the Federal Interagency Working Group (2010) adopts a central social cost of carbon dioxide of $25 for 2015. Under this scenario, nuclear central social cost of carbon dioxide of $25 for 2015. Under this scenario, nuclear continues to have the highest levelized cost. The levelized cost of coal increases by continues to have the highest levelized cost. The levelized cost of coal increases by 2 cents per kilowatt hour, but the levelized cost of natural gas increases by only about 2 cents per kilowatt hour, but the levelized cost of natural gas increases by only about 1 cent, not nearly enough to close the gap between nuclear and natural gas. More-1 cent, not nearly enough to close the gap between nuclear and natural gas. More-over, this static comparison based on current fuel prices ignores that coal and natural over, this static comparison based on current fuel prices ignores that coal and natural gas prices would likely fall in response to a carbon tax. For both coal and natural gas gas prices would likely fall in response to a carbon tax. For both coal and natural gas there is a range of different sources available, much of which has a marginal cost of there is a range of different sources available, much of which has a marginal cost of extraction below current prices.extraction below current prices.
Fossil fuel plants also emit large amounts of local and regional pollutants. Fossil fuel plants also emit large amounts of local and regional pollutants. Muller, Mendelsohn, and Nordhaus (2011) calculate that the external costs from Muller, Mendelsohn, and Nordhaus (2011) calculate that the external costs from sulfur dioxide, nitrogen oxides, and particulates average 3.5 cents per kilowatt hour sulfur dioxide, nitrogen oxides, and particulates average 3.5 cents per kilowatt hour for coal, but only 0.1 cents per kilowatt hour for natural gas. Thus, incorporating the for coal, but only 0.1 cents per kilowatt hour for natural gas. Thus, incorporating the external costs of these pollutants improves the prospects considerably for nuclear external costs of these pollutants improves the prospects considerably for nuclear power versus coal, but does little to close the gap versus natural gas. A comprehen-power versus coal, but does little to close the gap versus natural gas. A comprehen-sive welfare analysis would also incorporate the negative production externalities sive welfare analysis would also incorporate the negative production externalities from coal and natural gas. Perhaps most importantly, recent increases in shale gas from coal and natural gas. Perhaps most importantly, recent increases in shale gas production have raised environmental concerns about water consumption and production have raised environmental concerns about water consumption and contamination of drinking water. These costs are not yet well understood. However, contamination of drinking water. These costs are not yet well understood. However, the levelized cost estimates give some sense of how large these externalities would the levelized cost estimates give some sense of how large these externalities would need to be in order to make nuclear power the low-cost option.need to be in order to make nuclear power the low-cost option.
There are also external costs associated with nuclear power. Included in these There are also external costs associated with nuclear power. Included in these levelized cost estimates is a spent fuel waste fee of 0.1 cents per kilowatt hour. Since levelized cost estimates is a spent fuel waste fee of 0.1 cents per kilowatt hour. Since 1983, the Department of Energy has collected this fee from U.S. nuclear reactors, 1983, the Department of Energy has collected this fee from U.S. nuclear reactors, intended eventually to fi nance a centralized storage facility for spent nuclear fuel. intended eventually to fi nance a centralized storage facility for spent nuclear fuel. Currently, most spent nuclear fuel is stored on-site in spent fuel pools and dry Currently, most spent nuclear fuel is stored on-site in spent fuel pools and dry casks. A comprehensive welfare analysis would need to include both the private casks. A comprehensive welfare analysis would need to include both the private and external costs of this on-site storage. MIT (2010) and U.S. Nuclear Regulatory and external costs of this on-site storage. MIT (2010) and U.S. Nuclear Regulatory Commission (2011) discuss details of the nuclear fuel cycle. Commission (2011) discuss details of the nuclear fuel cycle.
Considerably harder to quantify are the risks from nuclear accidents. Since Considerably harder to quantify are the risks from nuclear accidents. Since 1957, the Price–Anderson Act has indemnifi ed U.S. nuclear plant operators from 1957, the Price–Anderson Act has indemnifi ed U.S. nuclear plant operators from accident liability above a certain cap, currently $12 billion. A Fukushima-type accident liability above a certain cap, currently $12 billion. A Fukushima-type
Prospects for Nuclear Power 61
accident in the United States could easily cause damages well above this cap. It is accident in the United States could easily cause damages well above this cap. It is too early to measure the long-term external costs of Fukushima, but an early study too early to measure the long-term external costs of Fukushima, but an early study estimates that radioactive contamination could cause 1,000 total cancer deaths estimates that radioactive contamination could cause 1,000 total cancer deaths (von Hippel 2011). As a point of comparison, cancer deaths from Chernobyl are (von Hippel 2011). As a point of comparison, cancer deaths from Chernobyl are estimated to be approximately 14,000 (Cardis et al. 2006). In addition to cancer estimated to be approximately 14,000 (Cardis et al. 2006). In addition to cancer deaths, one would want to incorporate the costs from other health outcomes, as deaths, one would want to incorporate the costs from other health outcomes, as well as the pecuniary and psychological costs associated with relocating people well as the pecuniary and psychological costs associated with relocating people living near the accident site.living near the accident site.
Perhaps hardest of all to measure are the risks associated with the prolifera-Perhaps hardest of all to measure are the risks associated with the prolifera-tion of nuclear weapons. This could come through the misuse of nuclear facilities tion of nuclear weapons. This could come through the misuse of nuclear facilities to produce weapons materials, or from a “dirty bomb” in which stolen radioactive to produce weapons materials, or from a “dirty bomb” in which stolen radioactive materials from any source are dispersed using conventional explosives. These risks materials from any source are dispersed using conventional explosives. These risks are particularly acute in countries like France, the United Kingdom, and Japan that are particularly acute in countries like France, the United Kingdom, and Japan that have facilities for reprocessing nuclear waste. MIT (2003) and MIT (2010) discuss have facilities for reprocessing nuclear waste. MIT (2003) and MIT (2010) discuss these issues.these issues.
Incorporating the external costs of nuclear power would further increase the Incorporating the external costs of nuclear power would further increase the gap between the levelized costs of nuclear and natural gas. An important priority gap between the levelized costs of nuclear and natural gas. An important priority for future work is to refi ne measures of these external costs and incorporate them for future work is to refi ne measures of these external costs and incorporate them explicitly into levelized cost analyses. However, given current market conditions in explicitly into levelized cost analyses. However, given current market conditions in the United States, it becomes diffi cult to make an economic argument for nuclear the United States, it becomes diffi cult to make an economic argument for nuclear power regardless of the magnitude of these external costs. The fi rst challenge power regardless of the magnitude of these external costs. The fi rst challenge continues to be construction costs, which are high enough that nuclear power strug-continues to be construction costs, which are high enough that nuclear power strug-gles to compete with natural gas even if one ignores these external costs completely. gles to compete with natural gas even if one ignores these external costs completely.
Learning-By-DoingLearning-By-Doing
What would it take to reduce nuclear construction costs? One possibility What would it take to reduce nuclear construction costs? One possibility is learning-by-doing. In 2004, the Senior Vice President of the Nuclear Energy is learning-by-doing. In 2004, the Senior Vice President of the Nuclear Energy Institute testifi ed in front of the U.S. Senate that nuclear construction costs would Institute testifi ed in front of the U.S. Senate that nuclear construction costs would decrease by 20–30 percent after the fi rst few plants (Fertel 2004). In part on the decrease by 20–30 percent after the fi rst few plants (Fertel 2004). In part on the basis of this testimony, the 2005 Energy Policy Act was drafted to include loan basis of this testimony, the 2005 Energy Policy Act was drafted to include loan guarantees, production tax credits, and other subsidies for new nuclear plants. If guarantees, production tax credits, and other subsidies for new nuclear plants. If learning-by-doing could push construction costs down, this could change the equa-learning-by-doing could push construction costs down, this could change the equa-tion considerably for nuclear power. A substantial literature in economics indicates tion considerably for nuclear power. A substantial literature in economics indicates that learning-by-doing matters in a variety of markets (Alchian 1963; Joskow and that learning-by-doing matters in a variety of markets (Alchian 1963; Joskow and Rose 1985; Irwin and Klenow 1994; Benkard 2000; Thornton and Thompson 2001; Rose 1985; Irwin and Klenow 1994; Benkard 2000; Thornton and Thompson 2001; Kellogg 2011), and several studies have examined learning-by-doing in the construc-Kellogg 2011), and several studies have examined learning-by-doing in the construc-tion of nuclear power plants.tion of nuclear power plants.
Recall that the time pattern of construction costs in Figure 3 did not provide Recall that the time pattern of construction costs in Figure 3 did not provide any immediate evidence of learning-by-doing. Instead, construction costs tended to any immediate evidence of learning-by-doing. Instead, construction costs tended to increase considerably over time. Several studies have nonetheless attempted to disen- considerably over time. Several studies have nonetheless attempted to disen-tangle learning-by-doing from industrywide factors that were changing over time. tangle learning-by-doing from industrywide factors that were changing over time. Using data from the early nuclear builds, both Mooz (1978) and Komanoff (1981) Using data from the early nuclear builds, both Mooz (1978) and Komanoff (1981)
62 Journal of Economic Perspectives
fi nd evidence of modest amounts of learning-by-doing in nuclear plant construction fi nd evidence of modest amounts of learning-by-doing in nuclear plant construction that accrue to the construction company in charge of the project, but no evidence that accrue to the construction company in charge of the project, but no evidence of industrywide learning-by-doing. Zimmerman (1982) also fi nds learning-by-doing of industrywide learning-by-doing. Zimmerman (1982) also fi nds learning-by-doing for the construction company and some evidence of spillovers across companies. for the construction company and some evidence of spillovers across companies. Using a longer panel, McCabe (1996) fi nds evidence of learning-by-doing for both Using a longer panel, McCabe (1996) fi nds evidence of learning-by-doing for both the construction company and the utility managing the project, but does not test the construction company and the utility managing the project, but does not test for industrywide learning.for industrywide learning.
Learning-by-doing is important for the prospects of nuclear power because Learning-by-doing is important for the prospects of nuclear power because it provides a plausible mechanism by which nuclear construction costs could it provides a plausible mechanism by which nuclear construction costs could decrease below the levels reported in Table 2. This is true regardless of whether decrease below the levels reported in Table 2. This is true regardless of whether or not this learning-by-doing is privately captured. Who captures the learning-by-or not this learning-by-doing is privately captured. Who captures the learning-by-doing is important, however, for government policy. The economic argument for doing is important, however, for government policy. The economic argument for an industry-specifi c subsidy hinges on there being learning- by-doing that is not an industry-specifi c subsidy hinges on there being learning- by-doing that is not captured by individual companies. If learning is fully appropriable, then fi rms face captured by individual companies. If learning is fully appropriable, then fi rms face effi cient incentives for investment and no government intervention is necessary. effi cient incentives for investment and no government intervention is necessary. In addition, while there is almost certainly some industrywide learning-by-doing in In addition, while there is almost certainly some industrywide learning-by-doing in nuclear, there is also likely to be learning-by-doing in emerging energy technologies nuclear, there is also likely to be learning-by-doing in emerging energy technologies such as wind, solar, and biomass. When there are a number of competing alterna-such as wind, solar, and biomass. When there are a number of competing alterna-tives, as in electricity generation, many economists favor broad-based subsidies that tives, as in electricity generation, many economists favor broad-based subsidies that do not single out individual technologies (Schmalensee 1980).do not single out individual technologies (Schmalensee 1980).
Tied up in this discussion is a key tradeoff between innovation and standardiza-Tied up in this discussion is a key tradeoff between innovation and standardiza-tion. On the one hand, it is important to continue allowing for new and better reactor tion. On the one hand, it is important to continue allowing for new and better reactor designs with enhanced features for reliability and safety. On the other hand, frequent designs with enhanced features for reliability and safety. On the other hand, frequent redesigns make it harder to spread engineering costs across projects. The fi rst wave redesigns make it harder to spread engineering costs across projects. The fi rst wave of U.S. reactors were manufactured by four different companies—Westinghouse, of U.S. reactors were manufactured by four different companies—Westinghouse, General Electric, Combustion Engineering, and Babcock & Wilcox—each with General Electric, Combustion Engineering, and Babcock & Wilcox—each with several different designs. At the time, such differences were inevitable. The United several different designs. At the time, such differences were inevitable. The United States led the way in the development of commercial nuclear reactors and the States led the way in the development of commercial nuclear reactors and the technology was evolving rapidly. Still, this diversity of designs provides a possible technology was evolving rapidly. Still, this diversity of designs provides a possible explanation for the lack of immediate evidence of learning-by-doing (Lester and explanation for the lack of immediate evidence of learning-by-doing (Lester and McCabe 1993).McCabe 1993).
France offers a useful comparison on this point. Development of nuclear France offers a useful comparison on this point. Development of nuclear power in France began later and with much less design variation. When Electricité power in France began later and with much less design variation. When Electricité de France began seriously building reactors in the 1970s, it adopted a single design de France began seriously building reactors in the 1970s, it adopted a single design for all of its reactors. With one exception, all nuclear power reactors currently in for all of its reactors. With one exception, all nuclear power reactors currently in operation in France are of exactly this same design (International Atomic Energy operation in France are of exactly this same design (International Atomic Energy Agency 2011). In addition, Electricité de France has long enjoyed a high degree Agency 2011). In addition, Electricité de France has long enjoyed a high degree of regulatory stability due to its close relationship with the French National Safety of regulatory stability due to its close relationship with the French National Safety Authority and broad public support for nuclear power. Given this high degree of Authority and broad public support for nuclear power. Given this high degree of standardization, the apparent cost standardization, the apparent cost escalation in French construction costs is particu-in French construction costs is particu-larly striking.larly striking.
Some within the U.S. nuclear industry claim that the United States is headed Some within the U.S. nuclear industry claim that the United States is headed more toward the French model. For example, Michael Wallace, chairman of a major more toward the French model. For example, Michael Wallace, chairman of a major nuclear power company predicted a couple of years ago (as quoted in Kanter 2009) nuclear power company predicted a couple of years ago (as quoted in Kanter 2009)
Lucas W. Davis 63
that new reactors would be standardized down to “the carpeting and wallpaper.” that new reactors would be standardized down to “the carpeting and wallpaper.” Perhaps the industry will quickly coalesce around a very small number of reactor Perhaps the industry will quickly coalesce around a very small number of reactor designs, but this is not obvious based on applications received to date by the Nuclear designs, but this is not obvious based on applications received to date by the Nuclear Regulatory Commission. Among the 17 applica tions that have been received, there Regulatory Commission. Among the 17 applica tions that have been received, there is a mix of both pressurized water reactors and boiling water reactors, manufac-is a mix of both pressurized water reactors and boiling water reactors, manufac-tured by fi ve different reactor manufacturers (Areva, Westinghouse, Mitsubishi, tured by fi ve different reactor manufacturers (Areva, Westinghouse, Mitsubishi, GE-Hitachi, and GE). At a minimum, it seems clear that the French approach of GE-Hitachi, and GE). At a minimum, it seems clear that the French approach of supporting a single reactor design is not going to be adopted in the United States.supporting a single reactor design is not going to be adopted in the United States.
ConclusionConclusion
Nuclear power continues to generate enthusiasm based on its potential to Nuclear power continues to generate enthusiasm based on its potential to reduce greenhouse gas emissions. A single pound of reactor-grade uranium oxide reduce greenhouse gas emissions. A single pound of reactor-grade uranium oxide produces as much electricity as over 16,000 pounds of coal—enough to meet produces as much electricity as over 16,000 pounds of coal—enough to meet the needs of the average U.S. household for more than a year.the needs of the average U.S. household for more than a year.44 While burning While burning 16,000 pounds of coal generates thousands of pounds of carbon dioxide, sulfur 16,000 pounds of coal generates thousands of pounds of carbon dioxide, sulfur dioxide, and nitrogen oxides—nuclear power is virtually emissions-free.dioxide, and nitrogen oxides—nuclear power is virtually emissions-free.
Nuclear power, however, is not without challenges. Fukushima has brought Nuclear power, however, is not without challenges. Fukushima has brought to the forefront ongoing concerns about nuclear accidents and the handling and to the forefront ongoing concerns about nuclear accidents and the handling and storage of spent fuel. These external costs are storage of spent fuel. These external costs are in addition to substantial private costs. to substantial private costs. In 1942, with a shoestring budget in an abandoned squash court at the University In 1942, with a shoestring budget in an abandoned squash court at the University of Chicago, Enrico Fermi demonstrated that electricity could be generated using of Chicago, Enrico Fermi demonstrated that electricity could be generated using a self-sustaining nuclear reaction. Seventy years later the industry is still trying to a self-sustaining nuclear reaction. Seventy years later the industry is still trying to demonstrate how this can be scaled up cheaply enough to compete with coal and demonstrate how this can be scaled up cheaply enough to compete with coal and natural gas.natural gas.
■ ■ I am thankful to David Autor, Severin Borenstein, Chad Jones, John List, John Parsons, Timothy Taylor, Catherine Wolfram, and seminar participants at the University of Tennessee, Brookings Institution, University of California Energy Institute, Berkeley Energy and Resources Collaborative Symposium, California Public Utilities Commission, and the University of Chicago for helpful comments.
4 This is my own back-of-the-envelope calculation based on U.S. Department of Energy (2011a), table 8.2a “Electricity Net Generation,” table 8.5a “Consumption of Combustible Fuels,” table 8.9 “Electricity End Use,” table 9.3 “Uranium Overview,” and table 12.7b “Emissions from Energy Consumption for Elec-tricity Generation.”
64 Journal of Economic Perspectives
References
Alchian, Armen. 1963. “Reliability of Progress Curves in Airframe Production.” Econometrica 31(4): 679–94.
Benkard, C. Lanier. 2000. “Learning and Forgetting: The Dynamics of Aircraft Production.” American Economic Review 90(4): 1034–54.
Cardis, Elisabeth, et al. 2006. “Estimates of the Cancer Burden in Europe from Radioactive Fallout from the Chernobyl Accident.” Interna-tional Journal of Cancer 119(6): 1224–35.
Cox, Alan J., and Richard J. Gilbert. 1991. “An Economic Evaluation of the Costs and Benefi ts of Diablo Canyon.” In Regulatory Choices: A Perspective on Developments in Energy Policy, edited by Richard J. Gilvert, 260–89. Berkeley: University of California Press.
Davis, Lucas W., and Catherine Wolfram. 2011. “Deregulation, Consolidation, and Effi ciency: Evidence from U.S. Nuclear Power.” EI@Haas WP 217, Energy Institute at Haas.
Du, Yangbo, and John E. Parsons. 2009. “Update on the Cost of Nuclear Power.” MIT Center for Energy and Environmental Policy Research Working Paper 09-004.
Federal Interagency Working Group. 2010 “Technical Support Document: Social Cost of Carbon for Regulatory Impact Analysis: Under Executive Order 12866.” http://www.epa.gov/otaq/climate/regulations/scc-tsd.pdf.
Fertel, Marvin S. (Senior Vice President and Chief Nuclear Offi cer of the Nuclear Energy Insti-tute). 2004.“Testimony before the Senate Energy and Natural Resources Committee, U.S. Senate.” March 4. http://www.nei.org/publicpolicy/congressionaltestimony/energysubcmtefertelextended/.
Grubler, Arnulf. 2010. “The Costs of the French Nuclear Scale-Up: A Case of Negative Learning by Doing.” Energy Policy 38(9): 5174–88.
International Atomic Energy Agency. 2011. Nuclear Power Reactors in the World. 2011 Edi tion. Vienna: IAEA.
Irwin, Douglas A., and Peter J. Klenow. 1994. “Learning-by-Doing Spillovers in the Semicon-ductor Industry.” Journal of Political Economy 102(6): 1200–27.
Ives, Nathan, Steve McCabe, and Gary Gilmartin. 2010 “Nuclear Renaissance and the Global Supply Chain: Avoiding Pitfalls, Realizing Benefi ts.” Public Utilities Fortnightly, December 1.
Joskow, Paul L. 1974. “Infl ation and Environ-mental Concern: Structural Change in the Process of Public Utility Price Regulation.” Journal and Law and Economics 17(2): 291–327.
Joskow, Paul L. 1982. “Problems and Prospects
for Nuclear Energy in the United States.” In Energy, Economics and the Environment, edited by Gregory A. Daneke, 231–54. Lexington: D.C. Heath and Company.
Joskow, Paul L. 2006. “The Future of Nuclear Power in the United States: Economic and Regula-tory Challenges.” MIT CEEPR Working Paper 06-019, Massachusetts Institute of Technology Center for Energy and Environmental Policy Research.
Joskow, Paul L., and John E. Parsons. 2009. “The Economic Future of Nuclear Power.” Daedalus 138(4): 45–59.
Joskow, Paul L., and Nancy L. Rose. 1985. “The Effects of Technological Change, Experience, and Environmental Regulation on the Construction Cost of Coal-Burning Generating Units.” RAND Journal of Economics 16(1): 1–17.
Joskow, Paul L., and Joel Yellin. 1980. “Siting Nuclear Power Plants.” Virginia Journal of Natural Resource Law 1(1): 1–67.
Kanter, James. 2009. “In Finland, Nuclear Renaissance Runs into Trouble.” New York Times, May 28. http://www.nytimes.com/2009/05/29/business/energy-environment/29nuke.html?pagewanted=all.
Kellogg, Ryan. 2011. “Learning by Drilling: Inter-Firm Learning and Relationship Persis-tence in the Texas Oilpatch.” Quarterly Journal of Economics 126(4): 1961–2004.
Komanoff, Charles. 1981. Power Plant Escala-tion: Nuclear and Coal Capital Costs, Regulation, and Economics. New York: Van Nostrand Reinhold Company.
Koomey, Jonathan, and Nathan E. Hultman. 2007. “A Reactor-Level Analysis of Busbar Costs for U.S. Nuclear Plants, 1970–2005.” Energy Policy 35(11): 5630–42.
Lester, Richard K., and Mark J. McCabe. 1993. “The Effect of Industrial Structure on Learning by Doing in Nuclear Power Plant Operation.” RAND Journal of Economics 24(3): 418–38.
McCabe, Mark J. 1996. “Principals, Agents, and the Learning Curve: The Case of Steam-Electric Power Plant Design and Construction.” Journal of Industrial Economics 44(4): 357–75.
McCallion, Kenneth. 1995. Shoreham and the Rise and Fall of the Nuclear Power Industry. Praeger, Westport.
MIT. 2003. The Future of Nuclear Power. An Interdisciplinary MIT Study. MIT Energy Initiative, Massachusetts Institute of Technology.
MIT. 2009. “Update of the MIT 2003 Future of Nuclear Power. An Interdisciplinary MIT Study.”
Prospects for Nuclear Power 65
MIT Energy Initiative, Massachusetts Institute of Technology.
MIT. 2010. The Future of the Nuclear Fuel Cycle. An Interdisciplinary MIT Study. MIT Energy Initia-tive, Massachusetts Institute of Technology.
Mooz, William E. 1978. Cost Analysis of Light Water Reactor Power Plants. RAND Report, Prepared for the Department of Energy. R2304-DOE, June. RAND Corporation.
Muller, Nicholas Z., Robert Mendelsohn, and William Nordhaus. 2011. “Environmental Accounting for Pollution in the United States Economy.” American Economic Review 101(5), 1649–75.
OECD Nuclear Energy Agency and Interna-tional Atomic Energy Agency. 2009. Uranium 2009: Resources, Production, and Demand. (“The Red Book.”) OECD, Nuclear Energy Agency.
Pindyck, Robert S. 1993. “Investment of Uncer-tain Cost.” Journal of Financial Economics 34(1): 53–76.
Schmalensee, Richard. 1980. “Appropriate Government Policy toward Commercialization of New Energy Supply Technologies.” Energy Journal 1(2): 1–40.
Thornton, Rebecca A., and Peter Thompson. 2001. “Learning from Experience and Learning from Others: An Exploration of Learning and Spillovers in Wartime Shipbuilding.” American Economic Review 91(5): 1350–68.
U.S. Atomic Energy Commission, Offi ce of Planning and Analysis. 1974. Nuclear Power Growth, 1974–2000. WASH-1139(74). U.S. Department of Energy.
U.S. Department of Energy (DOE), Energy
Information Administration. 1986. An Analysis of Nuclear Power Plant Construction Costs. DOE/EIA-0485. U.S. Department of Energy.
U.S. Department of Energy (DOE), Energy Information Administration. 1997. Nuclear Power Gen eration and Fuel Cycle Report 1997. DOE/EIA-0436(97). U.S. Department of Energy.
U.S. Department of Energy (DOE), Energy Information Administration. 2010. Updated Capital Cost Estimates for Electricity Generation Plants. November. U.S. Department of Energy. http://www.eia.gov/oiaf/beck_plantcosts/.
U.S. Department of Energy (DOE), Energy Information Administration. 2011a. “Annual Energy Review 2010.” DOE/EIA-0384, October. U.S. Department of Energy.
U.S. Department of Energy (DOE), Energy Information Administration. 2011b. Annual Energy Out look 2011. DOE/EIA-0383, April. U.S. Depart-ment of Energy.
U.S. Nuclear Regulatory Commission (NRC). 2011. Information Digest 2011–2012. NUREG-1350, Volume 23, August.
von Hippel, Frank N. 2011. “The Radiological and Psychological Consequences of the Fukushima Daiichi Accident.” Bulletin of the Atomic Scien-tists 67(5): 27–36.
Wald, Matthew L. 2010. “Giant Holes in the Ground.” MIT Technology Review November/December, http://www.technologyreview.com/energy/26542/.
Zimmerman, Martin B. 1982. “Learning Effects and the Commercialization of New Energy Tech-nologies: The Case of Nuclear Power.” Bell Journal of Economics 13(2): 297–310.