Embed Size (px)
Citation preview
1 Intia-ilmiö ja Suomi
Prospects for India-FinlandEconomic Cooperation Shashanka Bhide, Dripto Mukhopadhyay, Divjot Singh
Sitra Reports 62

Prospects for India-Finland Economic Cooperation
Areas for Business Opportunities from an Indian Perspective

3
Prospects for India-Finland Economic Cooperation
Areas for Business Opportunities from an Indian Perspective
Shashanka Bhide
Dripto Mukhopadhyay
Divjot Singh
Sitra Reports 62
S I T R A • H E L S I N K I
This Sitra report has been prepared byThe National Council of Applied Economic Research, New Delhi.
Study Team:Shashanka Bhide, Project LeaderDripto MukhopadhyayDivjot SinghNandini AcharyaDivya KrishnanPawan Kumar
Sitra Reports 62
© 2006 Sitra and NCAER
Layout: Anu MikkonenCover picture: Corbis/SKOY
ISBN 951-563-518-7ISSN 1457-571X (paperback)
ISBN 951-563-519-5 (URL: http://www.sitra.fi )ISSN 1457-5728 (URL: http://www.sitra.fi )
In the Sitra Reports series Sitra publishes results from research, reports and evaluations. The publications can be ordered from Sitra, tel. +358 9 618 991, e-mail [email protected]
Edita Prima Ltd.Helsinki 2006
Preface by Sitra
Sitra’s India Programme continues to produce information about the India phenomenon, the expanding economy and opening society of India, and the opportunities this offers Finland. The report in hand is in a way a coun-terpart to the earlier, somewhat more extensive report The India Phenomenon and Finland (Edita 2005), which was produced by Finnish researchers. With this new report the fl oor is given to Indian economists, who provide us with a systematic analysis of the industrial sector, trade and investment oppor-tunities in India. They identify areas where mutually benefi cial Finland-India economic cooperation, investment and trade fl ows between the two coun-tries could be expanded substantially.
By producing this report with an Indian research institute, the National Council of Applied Economic Research (NCAER), Sitra also international-ises its activities one step further. In today’s globalised conditions, Sitra’smission to promote the prosperity and the future success of Finland is best served by cooperating also with international partners.
I would like to offer my appreciation to all of the contributors to this study. In particular I would like to thank Dr. Shashanka Bhide, who was the leader of this study project at NCAER. Cooperation with him and with the NCAER has been a good and pleasant experience.
Helsinki, June 2006
Vesa-Matti LahtiResearch ManagerHead of Sitra’s India Programme
6
Indian Preface
India’s economic performance in the recent two decades has raised expecta-tions of continued high growth over the medium term future of next decade or so. International links of trade and investment will be essential for realis-ing these expectations. Sustained high levels of economic growth would be needed for meeting our development agenda.
This study undertaken by NCAER at the request of Sitra provides an as-sessment of the changes taking place in the Indian economy and more particu-larly in the manufacturing sector. The study shares some of the insights emerg-ing from our surveys of consumer expenditures in India. This study has high-lighted the areas in which economic linkages between India and Finland can be strengthened. We hope that studies such as these will help build knowledge base for undertaking activities that will be benefi cial for both the economies.
We wish to record our appreciation to Sitra for providing us the fi nancial support for undertaking this study and particularly to Dr. Vesa-Matti Lahti for encouraging us to undertake this study. The study team would like to acknowl-edge the support of Dr. R.K. Shukla, Senior Fellow at NCAER for sharing with us the estimates of penetration rates of selected consumer durables and also the estimated income distribution of households that are presented in this report. We are grateful to a number of offi cials from the industry associations and enterprises who cooperated with the study team sharing their experience and thoughts on the potential for economic linkages between India and Finland. The study team also acknowledges the support from Ms. Nandini Acharya, Ms. Di-vya Krishnan and Mr. Pawan Kumar at NCAER for their research assistance.
New Delhi, May 2006
Suman BeryDirector-GeneralNational Council of Applied Economic Research (NCAER)
7
Contents
1 Introduction 8
2 Growth of Indian Economy: Changing Paradigm 11
3 Economic Linkages between India and Finland 22
4 Opportunities for Cooperation: Industry Perspectives 32India-EU Economic Cooperation 32
Textiles 33Food Processing Industry 34Environmental Technology 35Telecom Equipment 36Chemicals 37Cement and Steel 37Automobile Components 38Automobile Manufacturers 39
A Synthesis of the Perspectives Obtained from Interviews 39
5 Conclusions 42
Appendix 44
8
1 Introduction
India is the fourth-largest economy in the world behind the United States, China and Japan in terms of purchasing power parity dollars. It is set to overtake Japan in terms of GDP in purchasing power parity dollars in 2008. India is also one of the 15 fastest-growing economies in the world in the past two decades. According to the IMF World Economic Outlook (April 2004) India’s average annual real GDP growth 1986–1995 was 5.7 percent. The growth rate for China was 9.9 percent in the same period. In the next 10 years, the growth rate for China was 8.2 percent and for India 5.9 percent. For the two economies with a population of more than one billion today, this represents an enormous increase in output.
The period from 1980 onwards has been a period of accelerated eco-nomic growth for India. Today’s optimism of average growth exceeding 8 percent per year over the next decade or so would have been unthinkable even some ten years ago. Although within a framework of centralised eco-nomic planning, acceleration in growth was always targeted, actual per-formance was well below the targets.
Even with this unprecedented growth over a twenty-year period in al-most two centuries, India remains a poor country. The per capita income in 2004 was under US$650. With more than a billion population today, the socio-economic policy challenges before the country are enormous.
The opportunities now provided by the growth momentum need to be exploited to meet the socio-economic policy objectives. The social concerns relate to the creation of employment for the masses, eradication of poverty, and provision of basic minimum services broadly refl ecting the Millennium Development Goals. There are also the economic constraints that need to be overcome with respect to infrastructure. Power, roads, the railway network, air-ports, telecommunication and ports remain areas where rapid and signifi cant improvements are essential to enable sustained growth in the economy.
9
India’s economic growth has not been entirely internally driven. The ratio of merchandise exports to GDP increased from 5.9 percent in 1990–91to 10.8 percent in 2003–04. During the same period, the imports to GDP ratio also increased at a rapid pace, rising from 8.8 percent to 13.3 percent. The receipts under invisibles in the external accounts that were roughly 33 percent of the earnings from merchandise exports rose to more than 80 percent in 2003–04. Foreign investments in terms of FDI and net portfolio investments amounted to $15 billion in 2004. In 1990, these fl ows were nearly nonexistent.
These are enormous changes in the Indian economy. Indian policies are evolving to benefi t from the positive aspects of globalisation to meet the de-velopmental aspirations. It has liberalised its international trade regime and investment regime to enable movement of output and factors of production in order to increase employment and income. Thus, there are new opportu-nities for bilateral and global cooperation for the producers of goods and services to benefi t from more effi cient production facilities everywhere.
In this paper, we look at the potential opportunities for such coop-eration between India and Finland. Finland is a developed economy and it is technologically among the most advanced. In terms of the Growth Competitiveness Index estimated periodically by the World Economic Fo-rum, Finland was ranked the highest among all countries in the year 2004. The United States is in second position and India is 56th. The per capita income of Finland was estimated at US$27,000 in 2004. The differences in technological standards, incomes and infrastructure between the two economies are sharp.
However, the pace of growth in the Indian economy and the need for technology and investment to sustain the growth requires that India look for cooperation and trade with developed and developing economies. In turn, India offers a large and growing market for producers in the other economies and it also offers a huge labour force and hence investment op-portunities.
International cooperation in trade, investment and fl ow of labour re-sources will require supportive economic policies. India’s economic polices saw a major change in the early 1990s, giving a push to international trade and liberalisation of domestic policies and providing a greater impetus for private enterprise.
The macroeconomic policy environment has sustained the economic growth impulses. Policies in the industrial, fi nancial, trade and fi scal sectors have continued to provide a favourable environment for economic growth, although progress has been slow. Rationalisation of tax rates, shifting the banking sector to international standards of prudential lending and supervi-sion, the entry of new service providers in the sector, opening up the equity
10
and debt markets to foreign participants (Foreign Institutional Investors), liberalising the rules for Foreign Direct Investment, reduction in tariff and non-tariff barriers, and an exchange rate policy that is sensitive to market conditions, have created greater space for enterprises to function.
The direction of policy changes has now been well established. The economy is moving in the direction of greater competition and market-de-termined allocation of resources. The government policies are expected to infl uence the growth pattern such that it does not become skewed to favour small sections of the society. These policies are expected to provide resources for the development of health, education and access to basic infrastructure services for the population. Government policies can also be expected to provide social safety nets, especially for the economically disadvantaged.
Given this overall economic context, how is the potential for coop-eration between two disparate economies such as India and Finland to be understood? There are already business contacts between the two countries. Investment fl ows are taking place and trade is increasing. In this paper, we provide a systematic analysis of the industrial sector in India in terms of its growth pattern and opportunities in trade and investment. We also report some insights from interviews conducted with industry experts on the pros-pects of improving international linkages for India’s industry.
11
2 Growth of Indian Economy: Changing Paradigm
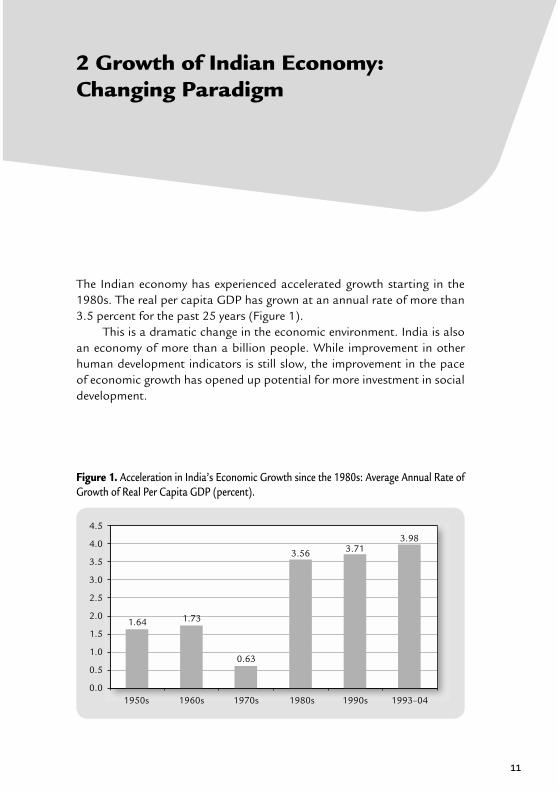
The Indian economy has experienced accelerated growth starting in the 1980s. The real per capita GDP has grown at an annual rate of more than 3.5 percent for the past 25 years (Figure 1).
This is a dramatic change in the economic environment. India is also an economy of more than a billion people. While improvement in other human development indicators is still slow, the improvement in the pace of economic growth has opened up potential for more investment in social development.
Figure 1. Acceleration in India’s Economic Growth since the 1980s: Average Annual Rate of Growth of Real Per Capita GDP (percent).
4.5
4.0
3.5
3.0
2.5
2.0
1.5
1.0
0.5
0.01950s 1960s 1970s 1980s 1990s 1993–04
1.64 1.73
0.63
3.56 3.713.98
12
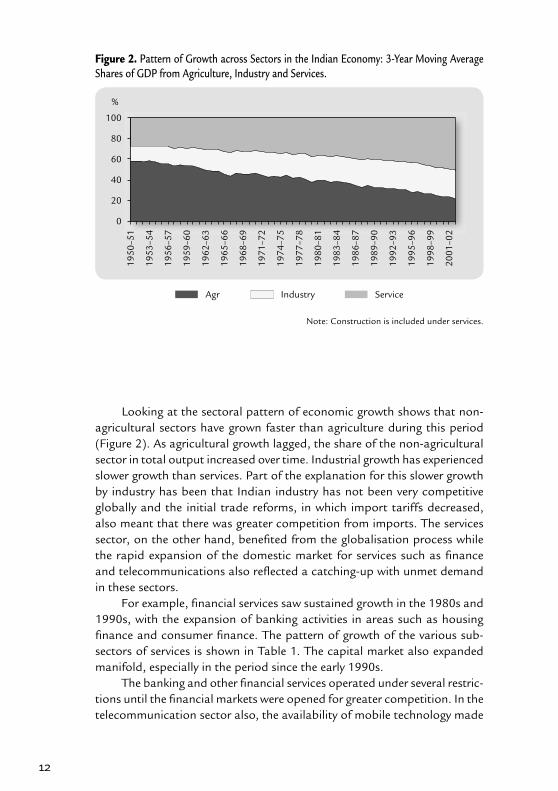
Looking at the sectoral pattern of economic growth shows that non-agricultural sectors have grown faster than agriculture during this period (Figure 2). As agricultural growth lagged, the share of the non-agricultural sector in total output increased over time. Industrial growth has experienced slower growth than services. Part of the explanation for this slower growth by industry has been that Indian industry has not been very competitive globally and the initial trade reforms, in which import tariffs decreased, also meant that there was greater competition from imports. The services sector, on the other hand, benefi ted from the globalisation process while the rapid expansion of the domestic market for services such as fi nance and telecommunications also refl ected a catching-up with unmet demand in these sectors.
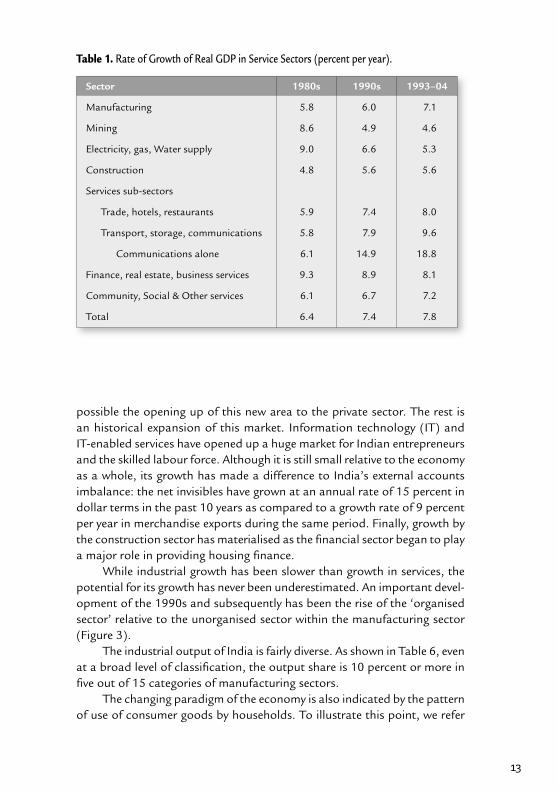
For example, fi nancial services saw sustained growth in the 1980s and 1990s, with the expansion of banking activities in areas such as housing fi nance and consumer fi nance. The pattern of growth of the various sub-sectors of services is shown in Table 1. The capital market also expanded manifold, especially in the period since the early 1990s.
The banking and other fi nancial services operated under several restric-tions until the fi nancial markets were opened for greater competition. In the telecommunication sector also, the availability of mobile technology made
Figure 2. Pattern of Growth across Sectors in the Indian Economy: 3-Year Moving Average Shares of GDP from Agriculture, Industry and Services.
Note: Construction is included under services.
100
80
60
40
20
0
1950
–51
1953
–54
1956
–57
1959
–60
1962
–63
1965
–66
1968
–69
1971
–72
1974
–75
1977
–78
1980
–81
1983
–84
1986
–87
1989
–90
1992
–93
1995
–96
1998
–99
2001
–02
Agr Industry Service
%
13
possible the opening up of this new area to the private sector. The rest is an historical expansion of this market. Information technology (IT) and IT-enabled services have opened up a huge market for Indian entrepreneurs and the skilled labour force. Although it is still small relative to the economy as a whole, its growth has made a difference to India’s external accounts imbalance: the net invisibles have grown at an annual rate of 15 percent in dollar terms in the past 10 years as compared to a growth rate of 9 percent per year in merchandise exports during the same period. Finally, growth by the construction sector has materialised as the fi nancial sector began to play a major role in providing housing fi nance.
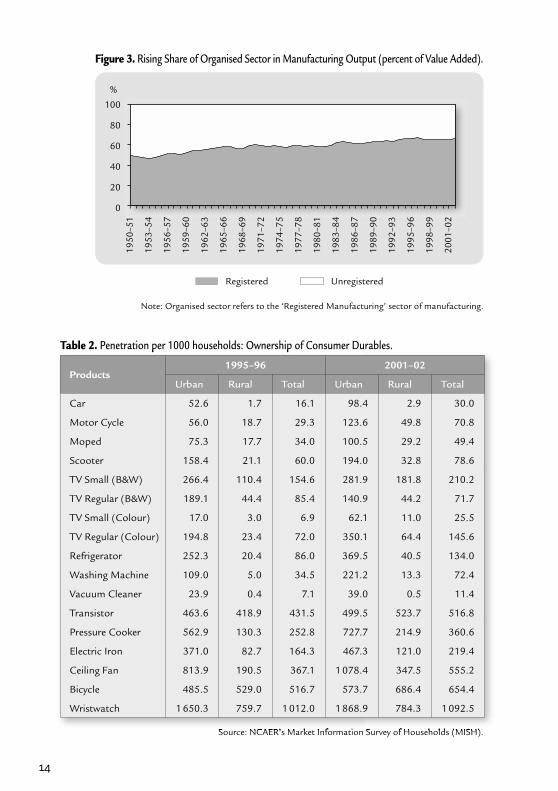
While industrial growth has been slower than growth in services, the potential for its growth has never been underestimated. An important devel-opment of the 1990s and subsequently has been the rise of the ‘organised sector’ relative to the unorganised sector within the manufacturing sector (Figure 3).
The industrial output of India is fairly diverse. As shown in Table 6, even at a broad level of classifi cation, the output share is 10 percent or more in fi ve out of 15 categories of manufacturing sectors.
The changing paradigm of the economy is also indicated by the pattern of use of consumer goods by households. To illustrate this point, we refer
Table 1. Rate of Growth of Real GDP in Service Sectors (percent per year).
Sector 1980s 1990s 1993–04
Manufacturing 5.8 6.0 7.1
Mining 8.6 4.9 4.6
Electricity, gas, Water supply 9.0 6.6 5.3
Construction 4.8 5.6 5.6
Services sub-sectors
Trade, hotels, restaurants 5.9 7.4 8.0
Transport, storage, communications 5.8 7.9 9.6
Communications alone 6.1 14.9 18.8
Finance, real estate, business services 9.3 8.9 8.1
Community, Social & Other services 6.1 6.7 7.2
Total 6.4 7.4 7.8
14
Note: Organised sector refers to the ‘Registered Manufacturing’ sector of manufacturing.
Figure 3. Rising Share of Organised Sector in Manufacturing Output (percent of Value Added).
100
80
60
40
20
0
1950
–51
1953
–54
1956
–57
1959
–60
1962
–63
1965
–66
1968
–69
1971
–72
1974
–75
1977
–78
1980
–81
1983
–84
1986
–87
1989
–90
1992
–93
1995
–96
1998
–99
2001
–02
Registered Unregistered
%
Table 2. Penetration per 1000 households: Ownership of Consumer Durables.
Source: NCAER’s Market Information Survey of Households (MISH).
Products1995–96 2001–02
Urban Rural Total Urban Rural Total
Car 52.6 1.7 16.1 98.4 2.9 30.0
Motor Cycle 56.0 18.7 29.3 123.6 49.8 70.8
Moped 75.3 17.7 34.0 100.5 29.2 49.4
Scooter 158.4 21.1 60.0 194.0 32.8 78.6
TV Small (B&W) 266.4 110.4 154.6 281.9 181.8 210.2
TV Regular (B&W) 189.1 44.4 85.4 140.9 44.2 71.7
TV Small (Colour) 17.0 3.0 6.9 62.1 11.0 25.5
TV Regular (Colour) 194.8 23.4 72.0 350.1 64.4 145.6
Refrigerator 252.3 20.4 86.0 369.5 40.5 134.0
Washing Machine 109.0 5.0 34.5 221.2 13.3 72.4
Vacuum Cleaner 23.9 0.4 7.1 39.0 0.5 11.4
Transistor 463.6 418.9 431.5 499.5 523.7 516.8
Pressure Cooker 562.9 130.3 252.8 727.7 214.9 360.6
Electric Iron 371.0 82.7 164.3 467.3 121.0 219.4
Ceiling Fan 813.9 190.5 367.1 1 078.4 347.5 555.2
Bicycle 485.5 529.0 516.7 573.7 686.4 654.4
Wristwatch 1 650.3 759.7 1 012.0 1 868.9 784.3 1 092.5
15
to two types of information. First is the pattern of owner-ship of selected consumer durable goods by rural and urban households. Even with-in a period of 6 years, there has been a very sharp change in the purchase of consumer durables. The consumer ex-penditure surveys conducted by NCAER show that between 1995–96 and 2001–02, the changes have been very strik-ing in both rural and urban households (Table 2).
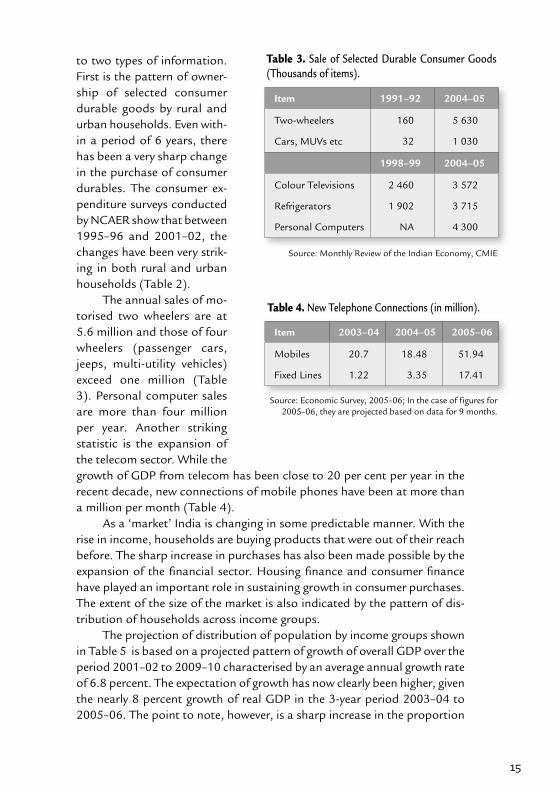
The annual sales of mo-torised two wheelers are at 5.6 million and those of four wheelers (passenger cars, jeeps, multi-utility vehicles) exceed one million (Table 3). Personal computer sales are more than four million per year. Another striking statistic is the expansion of the telecom sector. While the growth of GDP from telecom has been close to 20 per cent per year in the recent decade, new connections of mobile phones have been at more than a million per month (Table 4).
As a ‘market’ India is changing in some predictable manner. With the rise in income, households are buying products that were out of their reach before. The sharp increase in purchases has also been made possible by the expansion of the fi nancial sector. Housing fi nance and consumer fi nance have played an important role in sustaining growth in consumer purchases. The extent of the size of the market is also indicated by the pattern of dis-tribution of households across income groups.
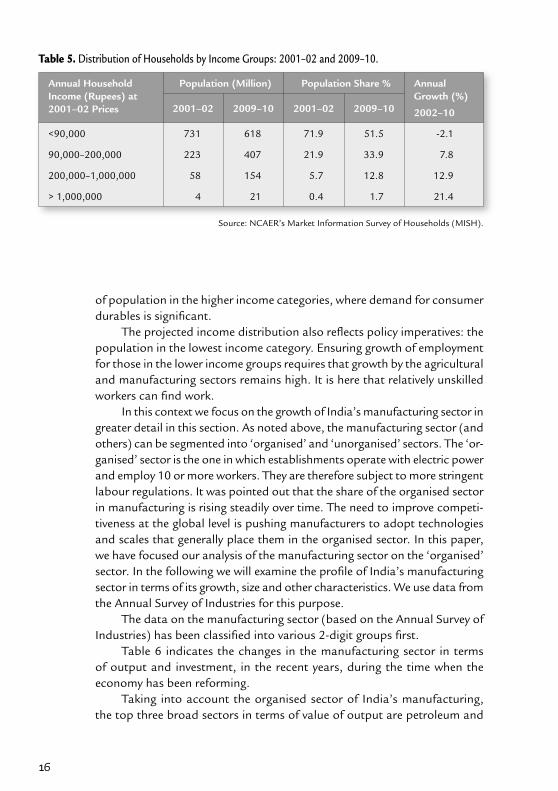
The projection of distribution of population by income groups shown in Table 5 is based on a projected pattern of growth of overall GDP over the period 2001–02 to 2009–10 characterised by an average annual growth rate of 6.8 percent. The expectation of growth has now clearly been higher, given the nearly 8 percent growth of real GDP in the 3-year period 2003–04 to 2005–06. The point to note, however, is a sharp increase in the proportion
Item 1991–92 2004–05
Two-wheelers 160 5 630
Cars, MUVs etc 32 1 030
1998–99 2004–05
Colour Televisions 2 460 3 572
Refrigerators 1 902 3 715
Personal Computers NA 4 300
Item 2003–04 2004–05 2005–06
Mobiles 20.7 18.48 51.94
Fixed Lines 1.22 3.35 17.41
Table 3. Sale of Selected Durable Consumer Goods (Thousands of items).
Source: Monthly Review of the Indian Economy, CMIE
Table 4. New Telephone Connections (in million).
Source: Economic Survey, 2005–06; In the case of figures for 2005–06, they are projected based on data for 9 months.
16
of population in the higher income categories, where demand for consumer durables is signifi cant.
The projected income distribution also refl ects policy imperatives: the population in the lowest income category. Ensuring growth of employment for those in the lower income groups requires that growth by the agricultural and manufacturing sectors remains high. It is here that relatively unskilled workers can fi nd work.
In this context we focus on the growth of India’s manufacturing sector in greater detail in this section. As noted above, the manufacturing sector (and others) can be segmented into ‘organised’ and ‘unorganised’ sectors. The ‘or-ganised’ sector is the one in which establishments operate with electric power and employ 10 or more workers. They are therefore subject to more stringent labour regulations. It was pointed out that the share of the organised sector in manufacturing is rising steadily over time. The need to improve competi-tiveness at the global level is pushing manufacturers to adopt technologies and scales that generally place them in the organised sector. In this paper, we have focused our analysis of the manufacturing sector on the ‘organised’sector. In the following we will examine the profi le of India’s manufacturing sector in terms of its growth, size and other characteristics. We use data from the Annual Survey of Industries for this purpose.
The data on the manufacturing sector (based on the Annual Survey of Industries) has been classifi ed into various 2-digit groups fi rst.
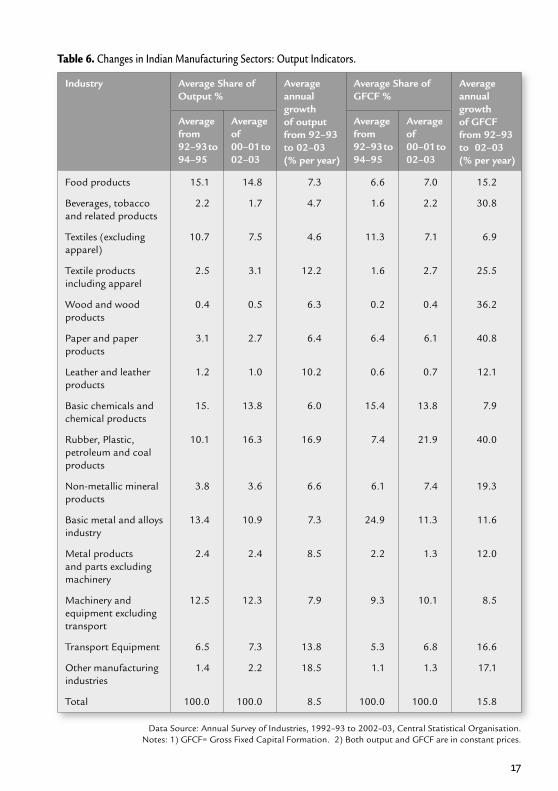
Table 6 indicates the changes in the manufacturing sector in terms of output and investment, in the recent years, during the time when the economy has been reforming.
Taking into account the organised sector of India’s manufacturing, the top three broad sectors in terms of value of output are petroleum and
Table 5. Distribution of Households by Income Groups: 2001–02 and 2009–10.
Source: NCAER’s Market Information Survey of Households (MISH).
Annual Household Income (Rupees) at 2001–02 Prices
Population (Million) Population Share % Annual Growth (%)
2002–102001–02 2009–10 2001–02 2009–10
<90,000 731 618 71.9 51.5 -2.1
90,000–200,000 223 407 21.9 33.9 7.8
200,000–1,000,000 58 154 5.7 12.8 12.9
> 1,000,000 4 21 0.4 1.7 21.4
17
Industry Average Share of Output %
Average annualgrowthof output from 92–93to 02–03(% per year)
Average Share of GFCF %
Average annualgrowthof GFCF from 92–93to 02–03(% per year)
Average from92–93 to 94–95
Average of00–01 to 02–03
Average from92–93 to 94–95
Average of00–01 to 02–03
Food products 15.1 14.8 7.3 6.6 7.0 15.2
Beverages, tobacco and related products
2.2 1.7 4.7 1.6 2.2 30.8
Textiles (excluding apparel)
10.7 7.5 4.6 11.3 7.1 6.9
Textile products including apparel
2.5 3.1 12.2 1.6 2.7 25.5
Wood and wood products
0.4 0.5 6.3 0.2 0.4 36.2
Paper and paper products
3.1 2.7 6.4 6.4 6.1 40.8
Leather and leather products
1.2 1.0 10.2 0.6 0.7 12.1
Basic chemicals and chemical products
15. 13.8 6.0 15.4 13.8 7.9
Rubber, Plastic, petroleum and coal products
10.1 16.3 16.9 7.4 21.9 40.0
Non-metallic mineral products
3.8 3.6 6.6 6.1 7.4 19.3
Basic metal and alloys industry
13.4 10.9 7.3 24.9 11.3 11.6
Metal products and parts excluding machinery
2.4 2.4 8.5 2.2 1.3 12.0
Machinery and equipment excluding transport
12.5 12.3 7.9 9.3 10.1 8.5
Transport Equipment 6.5 7.3 13.8 5.3 6.8 16.6
Other manufacturing industries
1.4 2.2 18.5 1.1 1.3 17.1
Total 100.0 100.0 8.5 100.0 100.0 15.8
Table 6. Changes in Indian Manufacturing Sectors: Output Indicators.
Data Source: Annual Survey of Industries, 1992–93 to 2002–03, Central Statistical Organisation.Notes: 1) GFCF= Gross Fixed Capital Formation. 2) Both output and GFCF are in constant prices.
18
Figure 4. Restructuring of Indian Manufacturing Sector: Growth vs. Size of output.
20
18
16
14
12
10
8
6
4
2
0
Woo
d pr
od
Leat
her
Bev
erag
es
Oth
er
Met
al p
rod
Pape
r pr
od
App
arel
Non
-met
al
Tra
nspo
rt
Text
iles
Bas
ic m
etal
s
Mac
hine
ry
Che
mic
als
Food
Petr
o pr
od
Share
Growth Rate
Figure 5. The Growth Indicators of the Indian Manufacturing Sector.
Output
GFCF
45
40
35
30
25
20
15
10
5
0
Text
iles
Bev
erag
es
Che
mic
als
Woo
d pr
od
Pape
r pr
od
Non
-met
al
Food
Bas
ic m
etal
s
Mac
hine
ry
Met
al p
rod
Leat
her
App
arel
Tra
nspo
rt
Petr
o pr
od
Oth
er
19
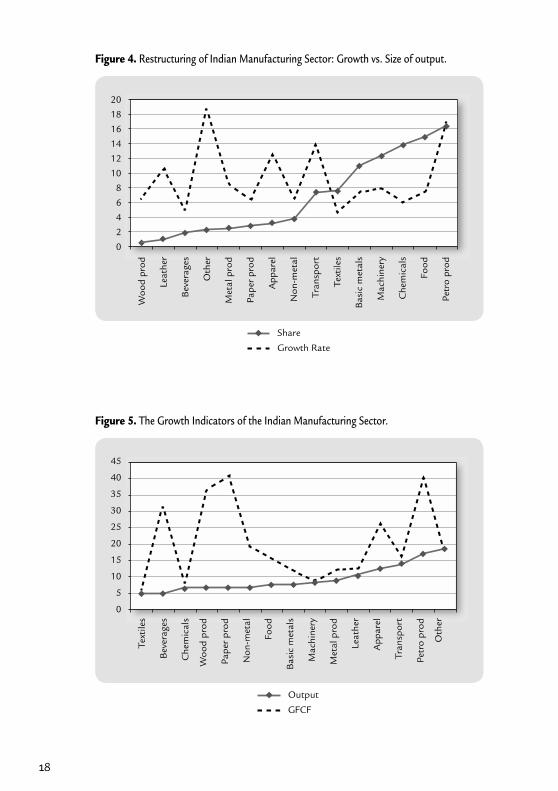
plastic products, food products and chemicals. But in terms of growth of output, they are not the same. The three fastest-growing sectors in terms of output are ‘Other Manufacturing’, petroleum and plastic products and transport equipment (Figure 4).
In general, the pattern shows that smaller sectors are growing faster than larger ones. The sectors that were relatively small for a variety of rea-sons have now begun to grow faster. Part of the reason may be that the previous policy regime had indeed infl uenced the pattern of growth, encour-aging growth in some and discouraging it in others.
If the past pattern of growth is an indication of future pattern, a look at the past growth pattern will be useful. The growth of output has shown a pattern that refl ects current demand conditions. The pattern of investment suggests the pattern of expected growth in demand. Rubber, plastic and petroleum products again score the most in terms of growth in gross fi xed capital formation (Table 6).
Wood and wood products (including furniture and fi xtures) and bever-ages, tobacco and related products are the other two groups representing the highest growth of investment (Gross Fixed Capital Formation, GFCF). A closer look at the pattern shows that there is a reasonable positive associa-tion between the growth rate of output and growth rate of GFCF (Figure 5) especially as growth rate of output increases.
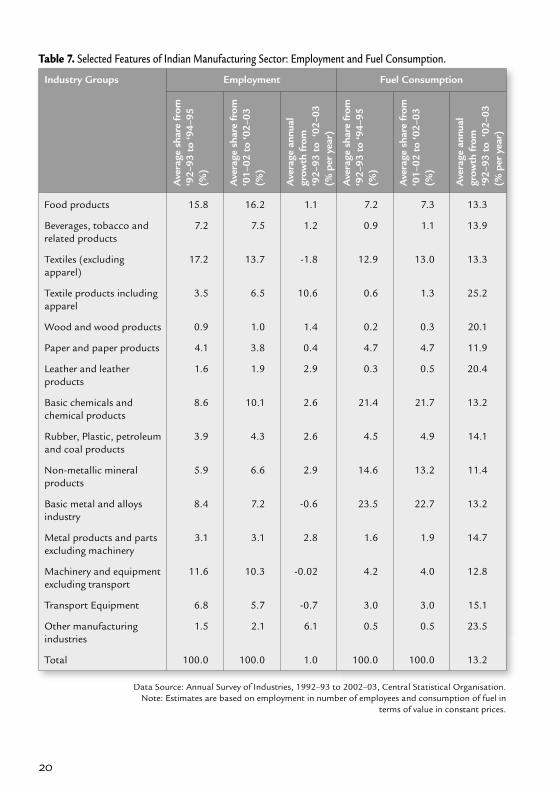
If we consider the sectors in terms of employment, yet another pat-tern emerges: food products, textiles and machinery are the three largest employers among the 15 broad sectors of manufacturing (Table 7). The implications of this pattern is that changes in the composition of output of manufacturing over time, as a result of various growth stimuli, would have different impacts on employment and energy use in the economy.
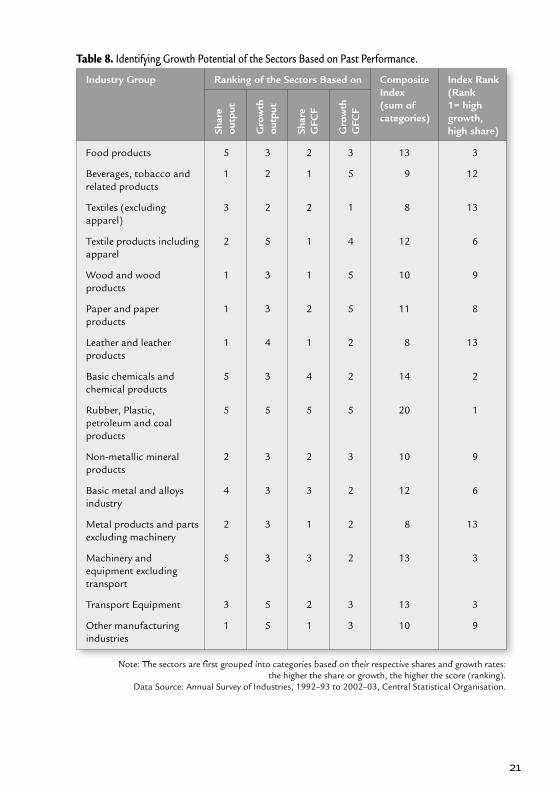
The review of past patterns of growth in output and investment at the sectoral level shows that there is a restructuring of output of Indian manufacturing in progress. While the past pattern alone is not a defi nitive indicator of changes in the future, past patterns are an important indicator that needs to be kept in view in judging the future course of the sectors. In Table 8 we make an attempt to rank the sub-sectors of manufacturing with respect to their growth potential. The share and growth rates of output and GFCF are combined to provide a single indicator of growth potential.
What emerges is that some complex engineering products become more prominent: Machinery and transport equipment closely follow the top two sectors of petroleum products (plastic and rubber products in-cluded) and basic chemicals. The industrial base of the Indian economy is expected to require more technological inputs for its growth and in this sense, greater integration with the global economy will make the transfor-mation more effi cient.
20
Data Source: Annual Survey of Industries, 1992–93 to 2002–03, Central Statistical Organisation.Note: Estimates are based on employment in number of employees and consumption of fuel in
terms of value in constant prices.
Industry Groups Employment Fuel Consumption
Ave
rage
sha
re fr
om
‘92–
93 t
o ‘9
4–95
(%)
Ave
rage
sha
re fr
om
‘01–
02 t
o ‘0
2–03
(%)
Ave
rage
ann
ual
grow
th fr
om
‘92–
93 t
o‘0
2–03
(% p
er y
ear)
Ave
rage
sha
re fr
om
‘92–
93 t
o ‘9
4–95
(%)
Ave
rage
sha
re fr
om
‘01–
02 t
o ‘0
2–03
(%)
Ave
rage
ann
ual
grow
th fr
om
‘92–
93 t
o‘0
2–03
(% p
er y
ear)
Food products 15.8 16.2 1.1 7.2 7.3 13.3
Beverages, tobacco and related products
7.2 7.5 1.2 0.9 1.1 13.9
Textiles (excluding apparel)
17.2 13.7 -1.8 12.9 13.0 13.3
Textile products including apparel
3.5 6.5 10.6 0.6 1.3 25.2
Wood and wood products 0.9 1.0 1.4 0.2 0.3 20.1
Paper and paper products 4.1 3.8 0.4 4.7 4.7 11.9
Leather and leather products
1.6 1.9 2.9 0.3 0.5 20.4
Basic chemicals and chemical products
8.6 10.1 2.6 21.4 21.7 13.2
Rubber, Plastic, petroleum and coal products
3.9 4.3 2.6 4.5 4.9 14.1
Non-metallic mineral products
5.9 6.6 2.9 14.6 13.2 11.4
Basic metal and alloys industry
8.4 7.2 -0.6 23.5 22.7 13.2
Metal products and parts excluding machinery
3.1 3.1 2.8 1.6 1.9 14.7
Machinery and equipment excluding transport
11.6 10.3 -0.02 4.2 4.0 12.8
Transport Equipment 6.8 5.7 -0.7 3.0 3.0 15.1
Other manufacturing industries
1.5 2.1 6.1 0.5 0.5 23.5
Total 100.0 100.0 1.0 100.0 100.0 13.2
Table 7. Selected Features of Indian Manufacturing Sector: Employment and Fuel Consumption.
21
Table 8. Identifying Growth Potential of the Sectors Based on Past Performance.
Note: The sectors are first grouped into categories based on their respective shares and growth rates: the higher the share or growth, the higher the score (ranking).
Data Source: Annual Survey of Industries, 1992–93 to 2002–03, Central Statistical Organisation.
Industry Group Ranking of the Sectors Based on Composite Index(sum of categories)
Index Rank (Rank1= high growth,high share)Sh
are
outp
ut
Gro
wth
outp
ut
Shar
eG
FCF
Gro
wth
GFC
F
Food products 5 3 2 3 13 3
Beverages, tobacco and related products
1 2 1 5 9 12
Textiles (excluding apparel)
3 2 2 1 8 13
Textile products including apparel
2 5 1 4 12 6
Wood and wood products
1 3 1 5 10 9
Paper and paper products
1 3 2 5 11 8
Leather and leather products
1 4 1 2 8 13
Basic chemicals and chemical products
5 3 4 2 14 2
Rubber, Plastic, petroleum and coal products
5 5 5 5 20 1
Non-metallic mineral products
2 3 2 3 10 9
Basic metal and alloys industry
4 3 3 2 12 6
Metal products and parts excluding machinery
2 3 1 2 8 13
Machinery and equipment excluding transport
5 3 3 2 13 3
Transport Equipment 3 5 2 3 13 3
Other manufacturing industries
1 5 1 3 10 9
22
3 Economic Linkages between India and Finland
One dimension of the opportunities for economic cooperation is refl ected in the trade pattern between economies. Naturally, trade in merchandise alone is no more the standard by which to judge commerce between countries. Services trade is expanding rapidly. However, we focus here on merchandise trade. The complementarities between the economies in terms of supply-demand gaps may be refl ected in the pattern of imports and exports. With this in view, we fi rst examine the pattern of trade between India and Finland in the context of the pattern of trade between India and the other major EU economies as well as India’s total exports.
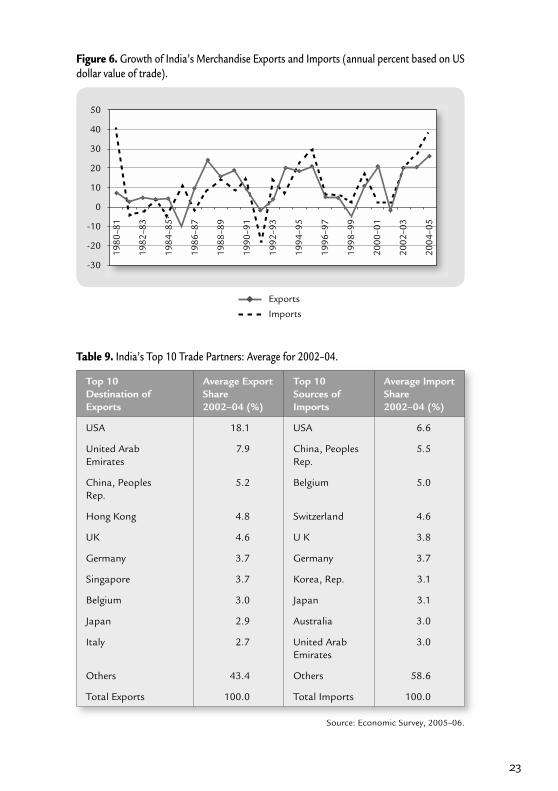
To begin, with we note the improving trade performance of the Indian economy since the economic reforms began. There were cycles of ups and downs that matched with the global scenario, but there has been a general rise in the levels of imports and exports (Figure 6). After a slump in the second half of the 1990s coinciding with the Asian fi nancial crisis, the rise in India’s trade levels has been steady.
Energy dominates India’s import strategies, although there is now an increasing need for capital goods that improves the quality and technology of the manufacturing base. In Table 9 we show the top 10 export destina-tions and the top 10 import sources. The United States is the largest trade partner for India, but China is emerging as an important source of imports as well as a destination for exports. Even the traditionally important partner, Japan, is now being overtaken by China in volume of trade.
The international trade scenario of India in recent years highlights the role of earnings on invisibles in the external account. Net invisible earnings were less than $3 billion during the period up to 1993–94, rising steadily to over $31 billion for the year ending March 2005. Earnings of services trade have driven this increase. IT services have provided an important source of trade earnings for India in the 1990s and thereafter.
23
Figure 6. Growth of India’s Merchandise Exports and Imports (annual percent based on US dollar value of trade).
50
40
30
20
10
0
-10
-20
-30
1980
–81
1982
–83
1984
–85
1986
–87
1988
–89
1990
–91
1992
–93
1994
–95
1996
–97
1998
–99
2000
–01
2002
–03
2004
–05
Exports
Imports
Table 9. India’s Top 10 Trade Partners: Average for 2002–04.
Source: Economic Survey, 2005–06.
Top 10 Destination of Exports
Average Export Share2002–04 (%)
Top 10 Sources ofImports
Average Import Share2002–04 (%)
USA 18.1 USA 6.6
United ArabEmirates
7.9 China, PeoplesRep.
5.5
China, PeoplesRep.
5.2 Belgium 5.0
Hong Kong 4.8 Switzerland 4.6
UK 4.6 U K 3.8
Germany 3.7 Germany 3.7
Singapore 3.7 Korea, Rep. 3.1
Belgium 3.0 Japan 3.1
Japan 2.9 Australia 3.0
Italy 2.7 United ArabEmirates
3.0
Others 43.4 Others 58.6
Total Exports 100.0 Total Imports 100.0
24
The overall expansion of trade by India has now been a clear trend. The increasing integration with the rest of the world has also led to foreign investment in the economy. Financial investment now amounts to $10 bil-lion during the year 2005 and foreign direct investment to about $4 billion. Against this background, the opportunities for business with India and in India are expanding rapidly. We examine the emerging trade scenario with some focus on India-Finland trade.
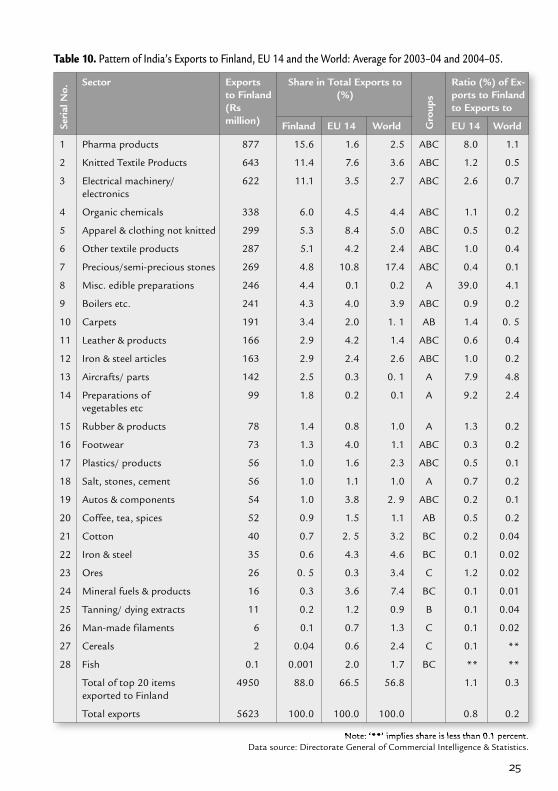
What does India export to Finland? This is a measure of how Indian businesses look at Finland as a market for their products. Taking the re-cent disaggregated data at a 2-digit level classifi cation of traded goods (Harmonised Series) we fi nd that India’s top 20 exports account for about 88 percent of India’s total exports to Finland (Table 10). The same com-modities account for roughly 65 percent of total exports to the original EU countries excluding Finland (EU 14). The top 20 Finland-bound export commodities account for only 57 percent of India’s exports to the world as a whole. In other words, there is some variation in the basket of Indian exports relative to what is exported to the other major EU countries and to the world as a whole.
The distinctiveness of the Finnish market to Indian businesses is also refl ected by the fact that, out of the top 20 export commodities to Finland, only 15 appear in the top 20 export commodities to the EU 14, and only 13 commodities make it to the top 20 list of Indian exports to the world as a whole.
Pharmaceutical products rank at the top of India’s exports to Finland, accounting for 15.6 percent of Indian exports to Finland. This group of products accounts for 1.6 percent of India’s exports to the EU 14 and 2.5 percent of India’s total exports. In other words, pharmaceutical products form a very large proportion of India’s exports to Finland and relatively a much lower proportion of her exports to the other major EU countries.
In absolute values, naturally, exports to Finland are very small relative to the other major EU countries or India’s total exports to world. Comparing Finland as a destination for exports, total exports to Finland amount to less than 1 percent of India’s exports to the EU 14 group. At the global level, the share of Finland in Indian exports is a very small proportion.
There are a few items in which Finland is relatively more attracted to India than other EU countries or other countries in the world. For example, Indian exports to Finland of miscellaneous edible preparations, prepara-tions of vegetables and fruits etc, aircrafts and parts, and the pharmaceuti-cal products are high relative to India’s exports of these commodities to the EU 14. As compared to the ratio (India’s total exports to Finland/ India’sexports to EU-14), which is at less than 1 percent, the ratio at the sectoral level for these commodity groups exceeds 7 percent. The point to be made
25
Table 10. Pattern of India’s Exports to Finland, EU 14 and the World: Average for 2003–04 and 2004–05.
Note: ‘**’ implies share is less than 0.1 percent.Data source: Directorate General of Commercial Intelligence & Statistics.
Seri
al N
o.
Sector Exports to Finland (Rsmillion)
Share in Total Exports to (%)
Gro
ups
Ratio (%) of Ex-ports to Finland to Exports to
Finland EU 14 World EU 14 World
1 Pharma products 877 15.6 1.6 2.5 ABC 8.0 1.1
2 Knitted Textile Products 643 11.4 7.6 3.6 ABC 1.2 0.5
3 Electrical machinery/electronics
622 11.1 3.5 2.7 ABC 2.6 0.7
4 Organic chemicals 338 6.0 4.5 4.4 ABC 1.1 0.2
5 Apparel & clothing not knitted 299 5.3 8.4 5.0 ABC 0.5 0.2
6 Other textile products 287 5.1 4.2 2.4 ABC 1.0 0.4
7 Precious/semi-precious stones 269 4.8 10.8 17.4 ABC 0.4 0.1
8 Misc. edible preparations 246 4.4 0.1 0.2 A 39.0 4.1
9 Boilers etc. 241 4.3 4.0 3.9 ABC 0.9 0.2
10 Carpets 191 3.4 2.0 1. 1 AB 1.4 0. 5
11 Leather & products 166 2.9 4.2 1.4 ABC 0.6 0.4
12 Iron & steel articles 163 2.9 2.4 2.6 ABC 1.0 0.2
13 Aircrafts/ parts 142 2.5 0.3 0. 1 A 7.9 4.8
14 Preparations ofvegetables etc
99 1.8 0.2 0.1 A 9.2 2.4
15 Rubber & products 78 1.4 0.8 1.0 A 1.3 0.2
16 Footwear 73 1.3 4.0 1.1 ABC 0.3 0.2
17 Plastics/ products 56 1.0 1.6 2.3 ABC 0.5 0.1
18 Salt, stones, cement 56 1.0 1.1 1.0 A 0.7 0.2
19 Autos & components 54 1.0 3.8 2. 9 ABC 0.2 0.1
20 Coffee, tea, spices 52 0.9 1.5 1.1 AB 0.5 0.2
21 Cotton 40 0.7 2. 5 3.2 BC 0.2 0.04
22 Iron & steel 35 0.6 4.3 4.6 BC 0.1 0.02
23 Ores 26 0. 5 0.3 3.4 C 1.2 0.02
24 Mineral fuels & products 16 0.3 3.6 7.4 BC 0.1 0.01
25 Tanning/ dying extracts 11 0.2 1.2 0.9 B 0.1 0.04
26 Man-made filaments 6 0.1 0.7 1.3 C 0.1 0.02
27 Cereals 2 0.04 0.6 2.4 C 0.1 **
28 Fish 0.1 0.001 2.0 1.7 BC ** **
Total of top 20 items exported to Finland
4950 88.0 66.5 56.8 1.1 0.3
Total exports 5623 100.0 100.0 100.0 0.8 0.2
26
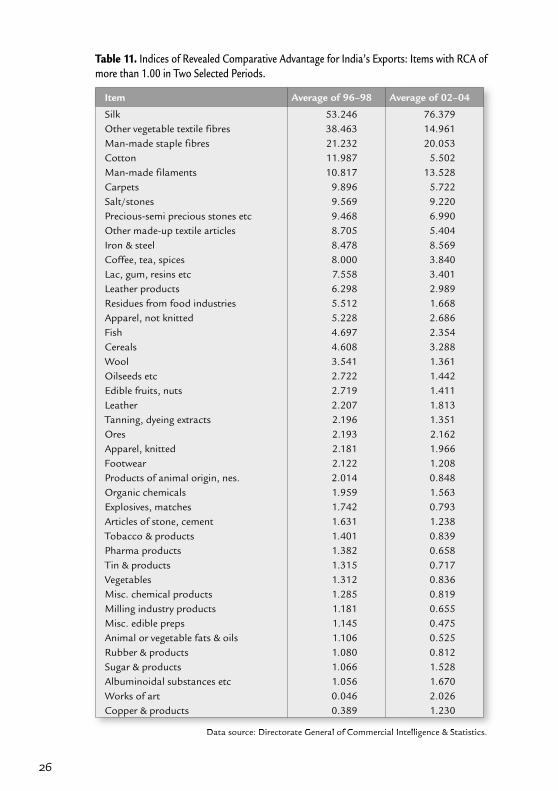
Table 11. Indices of Revealed Comparative Advantage for India’s Exports: Items with RCA of more than 1.00 in Two Selected Periods.
Data source: Directorate General of Commercial Intelligence & Statistics.
Item Average of 96–98 Average of 02–04
Silk 53.246 76.379Other vegetable textile fibres 38.463 14.961Man-made staple fibres 21.232 20.053Cotton 11.987 5.502Man-made filaments 10.817 13.528Carpets 9.896 5.722Salt/stones 9.569 9.220Precious-semi precious stones etc 9.468 6.990Other made-up textile articles 8.705 5.404Iron & steel 8.478 8.569Coffee, tea, spices 8.000 3.840Lac, gum, resins etc 7.558 3.401Leather products 6.298 2.989Residues from food industries 5.512 1.668Apparel, not knitted 5.228 2.686Fish 4.697 2.354Cereals 4.608 3.288Wool 3.541 1.361Oilseeds etc 2.722 1.442Edible fruits, nuts 2.719 1.411Leather 2.207 1.813Tanning, dyeing extracts 2.196 1.351Ores 2.193 2.162Apparel, knitted 2.181 1.966Footwear 2.122 1.208Products of animal origin, nes. 2.014 0.848Organic chemicals 1.959 1.563Explosives, matches 1.742 0.793Articles of stone, cement 1.631 1.238Tobacco & products 1.401 0.839Pharma products 1.382 0.658Tin & products 1.315 0.717Vegetables 1.312 0.836Misc. chemical products 1.285 0.819Milling industry products 1.181 0.655Misc. edible preps 1.145 0.475Animal or vegetable fats & oils 1.106 0.525Rubber & products 1.080 0.812Sugar & products 1.066 1.528Albuminoidal substances etc 1.056 1.670Works of art 0.046 2.026Copper & products 0.389 1.230
27
at this stage is that it is not only traditional export items such as textiles, leather products and spices that have entered the Finnish market; the list includes more technology-intensive items such as pharmaceutical products and electrical machinery at the top of the list. These commodities are also among the top Indian exports to the world as a whole, indicating the overall technological or industrial base of the Indian economy.
However, India’s export advantage in the technologically advanced sectors is yet to catch up with the rest of the trading economies. The index of Revealed Comparative Advantage (RCA)1 estimated for the two recent periods of 1996–98 and 2002–04 shows that the advantage still lies at the stage of primary processing (Table 11).
In the list of items with an RCA above 1.0 in either of the two periods, at the top are items relating to textiles and processing of primary products. Iron and steel show up at 10th position out of a total of about 98 commod-ity groups considered.
However, it is only pharmaceuticals and chemical products that have an RCA higher than 1.0 in either of the two periods we have selected here that may be considered as requiring a complex manufacturing base. What the RCA fi gures suggest is that there is likely to be considerable change in the Indian export basket when technological changes are absorbed as globalisa-tion trends make further progress. The RCAs appear fairly stable between the two periods, as only eleven out of forty product groups are seen to lose RCA (value dropping to below 1.0) in the second period as compared to the fi rst, and only two new products achieve an RCA value of above 1.0 in the second period. Nevertheless, there are changes in the RCA fi gures between the two periods which indicating changes in the composition of exports.
Comparison of Tables 10 and 11 also shows that 20 out of the 28 commodities coming in the top 20 exports of India to Finland, the EU 14 or the world as a whole have an RCA of more than 1.0. Considering the top 20 exports to Finland, only 13 of them have an RCA above 1.0 in either of the two periods considered. In other words, there are some sectors in which Finnish markets are an important attraction for Indian exports. The sectors
1 RCA is defi ned as a ratio of the share of a commodity in a country’s total exports to the share of the product in total global exports. It ranges from zero to any positive number. If the RCA is ‘1’ then the share of a commodity in a country’s exports is exactly equal to the commodity’s share in global trade. Only when RCA exceeds 1 can we say that the country has a comparative advantage in producing that commodity, as it exports relatively more of the commodity in question relative to the world export pattern.
28
or commodity groups in which exports to Finland are among top 20 but the RCA is less than 1.0 are as follows:
Electrical machinery/electronicsBoilers etc.Iron & steel articlesAircrafts/ partsPreparations of vegetables etcPlastics/ productsAutos & auto components
It is interesting that Finland is a market for Indian products even where a comparative advantage is yet to emerge for these commodities. Trade can therefore develop in patterns that are specifi c to the complementarities be-tween partners and strengths of each economy.
We also look at the pattern of India’s overall exports in order to un-derstand which sectors of the Indian economy are advancing in the global market.
The pattern of imports to India from Finland shows that technological-ly complex products are sourced from Finland, in addition to the products in which Finland has a resource advantage, as in pulp. Table 12 provides a comparison of the top 20 imports of India from Finland and then compares them with the top 20 imports from the EU 14 and the world as a whole.
Machinery, instruments and project goods are essential to industrial activity, and Finland is an important source of these products. In fact, three out of the top 5 imports from Finland also fi gure among the top fi ve imports from the EU 14. In other words, as far as imports are concerned, Finland has a similar advantage to those of the other major EU countries in exporting to India. If we consider the total imports of India from all countries, then only mechanical machinery/appliances and electrical machinery and electronics remain among the top fi ve commodity groups. Mineral fuels (or petroleum fuels) rank at the top of India’s imports as a whole.
Imports from Finland are more concentrated in a few commodities than in the case of imports from the EU 14 and the world. The top 5 imports from Finland account for 87 percent of total imports from that country, whereas in the case of the EU 14 the proportion is 65 percent and for the world as a whole 67 percent. Finland appears to be exploiting its strengths in technology-intensive products and products in which it has a resource advantage.
As many as 12 out of the top 20 Finnish exports to India are also among the top 20 exports of the EU and the world to India. Only six com-modity groups are among the top 20 Finnish exports to India and these are
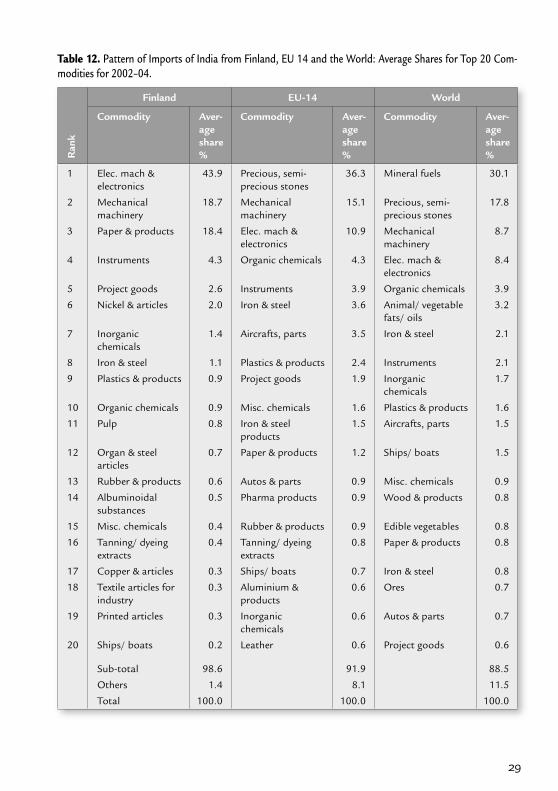
29
Table 12. Pattern of Imports of India from Finland, EU 14 and the World: Average Shares for Top 20 Com-modities for 2002–04.
Ran
k
Finland EU-14 World
Commodity Aver-ageshare%
Commodity Aver-ageshare%
Commodity Aver-ageshare%
1 Elec. mach & electronics
43.9 Precious, semi-precious stones
36.3 Mineral fuels 30.1
2 Mechanical machinery
18.7 Mechanical machinery
15.1 Precious, semi-precious stones
17.8
3 Paper & products 18.4 Elec. mach & electronics
10.9 Mechanical machinery
8.7
4 Instruments 4.3 Organic chemicals 4.3 Elec. mach & electronics
8.4
5 Project goods 2.6 Instruments 3.9 Organic chemicals 3.9
6 Nickel & articles 2.0 Iron & steel 3.6 Animal/ vegetable fats/ oils
3.2
7 Inorganic chemicals
1.4 Aircrafts, parts 3.5 Iron & steel 2.1
8 Iron & steel 1.1 Plastics & products 2.4 Instruments 2.1
9 Plastics & products 0.9 Project goods 1.9 Inorganic chemicals
1.7
10 Organic chemicals 0.9 Misc. chemicals 1.6 Plastics & products 1.6
11 Pulp 0.8 Iron & steel products
1.5 Aircrafts, parts 1.5
12 Organ & steel articles
0.7 Paper & products 1.2 Ships/ boats 1.5
13 Rubber & products 0.6 Autos & parts 0.9 Misc. chemicals 0.9
14 Albuminoidal substances
0.5 Pharma products 0.9 Wood & products 0.8
15 Misc. chemicals 0.4 Rubber & products 0.9 Edible vegetables 0.8
16 Tanning/ dyeing extracts
0.4 Tanning/ dyeing extracts
0.8 Paper & products 0.8
17 Copper & articles 0.3 Ships/ boats 0.7 Iron & steel 0.8
18 Textile articles for industry
0.3 Aluminium & products
0.6 Ores 0.7
19 Printed articles 0.3 Inorganic chemicals
0.6 Autos & parts 0.7
20 Ships/ boats 0.2 Leather 0.6 Project goods 0.6
Sub-total 98.6 91.9 88.5
Others 1.4 8.1 11.5
Total 100.0 100.0 100.0
30
not among the top 20 exports of the EU 14 or of the world to India. These commodities are the following:
Albuminoidal substancesPulpPrinted articlesTextile articles for industryCopper & articlesNickel & articles
Table 13. How Big is the Indian Market Relative to China?: Finland’s Exports.
Note: NT= Not in the top 20 exports from Finland to China.
SerialNo.
Commodity Average of 2002–04(Rs million)
Ratio to Exports to China %
1 Electr. Machinery & electronics 5 971 19.7
2 Mechanical machinery 2 364 7.9
3 Paper & products 2 292 45.4
4 Instruments 546 21.3
5 Project goods 263 NT
6 Nickel & articles 232 96.5
7 Inorganic chemicals 184 NT
8 Iron & steel 152 2.8
9 Plastics & products 118 15.4
10 Pulp 117 5.8
11 Organic chemicals 115 NT
12 Iron & steel articles 90 18.2
13 Rubber & products 78 NT
14 Albuminoidal substances 60 27.0
15 Misc. chemicals 52 19.3
16 Tanning/dyeing extracts 50 24.2
17 Copper & articles 45 6.8
18 Textile articles for industry 41 18.5
19 Printed articles 31 NT
20 Ships/boats 23 NT
31
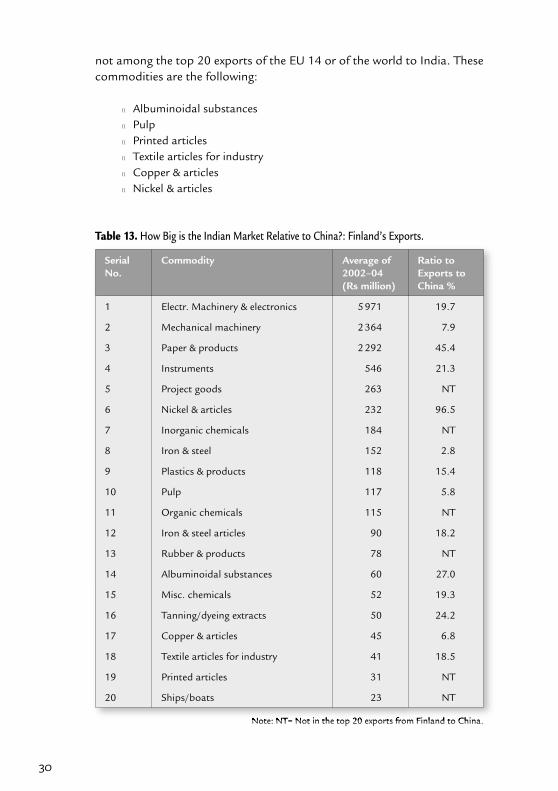
We also examined the size of the Indian market to Finland relative to China (Table 13). Admittedly India is a smaller destination for Finnish exports than China, but there are some products for which the size is not small.
It is instructive that many of the top imports by India from Finland are also top imports by China from Finland. For their respective manufactur-ing activities, both India and China are tapping the specialised production strengths of the Finnish economy. As the Indian economy expands further, Finnish exports to India can also be expected to grow, given that the more advanced Chinese economy also indicates that Finnish products are a com-petitive source for industrial growth.
32
4 Opportunities for Cooperation: Industry Perspectives
The project team interacted with offi cials from chambers of commerce and industry associations to understand the perspectives of Indian industry on the potential for India-Finland economic linkages. To provide focus to dis-cussions, we selected a few sectors of industry. Initially the discussions were at a broader level of economic relationships and interactions and then on more specifi c expectations. The organisations/individuals consulted for the industry perspectives are listed in Appendix 1. The broad areas of the discus-sions were as follows:
India-EU economic cooperationTextiles Food processing industry (FPI)Environmental technologyTelecom equipmentChemicalsCementSteelAutomobile components
India-EU Economic Cooperation
The potential for India-Finland economic cooperation can be seen in the con-text of the fact that the European Union is a major trading partner for India and Finland has been a committed member nation since the inception of the Union. The European Union is also among the largest investors in India. Therefore, India-Finland economic linkages are likely to strengthen further, given the need for increased trade and investments for the expansion of the Indian economy.
33
A key attraction of Finland to Indian industry is its potential as a source of technologies and hi-tech products to meet the increasing needs for tech-nology upgrades of Indian industry. Finland is also a window for wider in-teraction with the larger European market. In the present stage of India’sefforts to manage the growing integration of her economy with the global market, there is a need to improve the quality of products and effi ciency in production. Both require technologies that are of global standards. Indian industry requires new technologies.
There are specifi c areas in which technology upgrading is urgent. Food processing and textiles are cited as two sectors in which both investment funds and new technologies are needed. In food processing, technologies are needed not only for manufacturing but also for setting up infrastructure such as cold chains. In the automobile sector, manufacturing of electronic components is cited as an area in which Finland can offer technologies or products; in the public transportation sector, electric trolley buses were cited as potential options for India’s urban transport.
At a general level, or across the sectors, the urgent need to create greater awareness among Indian producers about global market standards has been cited as a major opportunity for Indo-Finnish cooperation. With its European moorings, Finland is a source of knowledge for standards. Furthermore, well-integrated supply chain management, which is a charac-teristic of European markets, is needed by Indian industry. Indian exports reaching European markets see manifold value addition before they reach the consumer. The logistics support and management of the value-addi-tion process are areas where there are opportunities for mutual benefi ts to enterprises in both countries.
Across different segments of the industry, there are also opportunities for using India as a manufacturing hub for exports to other countries. In-dian industries may also fi nd Finland a useful partner in establishing supply chains to other markets in Europe.
The broader discussion identifi ed the following sectors for exploring potential in bilateral cooperation: 1) textiles, 2) processed food industries and 3) energy and environment.
We note here the points made during the interviews with respect to specifi c sectors:
Textiles
Textiles and clothing is one of the largest industries in India in terms of its contribution to employment and exports. With the ending of the Multi-fi bre Agreement at the end of 2004, quotas on international trade in clothes have been lifted. It is estimated that after China, India will benefi t most from the
34
new regime. Cotton, silk and specialty fabrics hold signifi cance and poten-tial for India’s international trade. India’s textile industry is, however, highly segmented in terms of scale of operations as well as technology. The top few Indian players have invested in large-scale capacity units and rest of the industry is in fragmented units of production. In weaving and processing, 95 percent of the units use primitive/obsolete technology. However, change is taking place very rapidly, but change needs to be facilitated. The weaving segment’s technology gap is being addressed by second-hand machines en-tering the Indian textiles industry, revealing an Indian advantage in accepting and being able to run second-hand machinery. With low cost maintenance skills, 30,000 second-hand looms have been sourced by imports. About 5 000 new looms have been imported. New investments have benefi ted from access to the Technology Upgradation Fund in the past 16 months.
There is a clear opportunity for exports of technologically advanced power looms to India. Finland, with its expertise for plant-level technology upgrading, could be an important partner in managing the transformation in the Indian textiles sector. As restrictions on investments and imports have receded, growth has taken off in the past two years in new investments in the textiles and clothing sector, and with further reductions in import du-ties on inputs and capital goods, growth is expected to be brisk in the next 5 years.
In this phase of growth and technology upgrading in the sector, Indian industry is open to cooperation with Finland for its dyes and chemicals. Be-sides these, Finland could also be a source of R&D support for design and for consultation or actual marketing and brand creation of Indian textiles globally.
The quality of the delivered product has a high variance level. Export-ers often fi nd their deliveries to be substandard. The mechanism for the due diligence of exports is weak. There is scope for cooperation in building awareness on the part of Indian exporters.
Food Processing Industry
The food processing industry is important to the Indian economy in several respects. Its linkage to the agricultural sector makes its role as catalyst in driving agricultural growth one of critical importance in policy. The total Indian market for food processing equipment is currently estimated at more than 1.7 billion euros, and is expected to grow at over 15 percent annually over the next two years. India is among the world’s largest producers of cereals, milk, fruits, vegetables and poultry, growth being driven by rising domestic demand for food and beverage products. More than 25 percent of India’s food production is said to be lost due to inadequate food processing
35
technology and storage facilities. Additionally, there is a growing potential in the convenience and ethnic foods markets.
This industry has a high trade potential as it is driven by technologies developed in the developed world. However, the penetration of such tech-nologies of global standards in Indian industry is still restricted to a handful of sectors and to large manufacturing fi rms. On the general level, that is, across the manufacturing fi rms, there is a signifi cant need for establish-ing cold chains and upgraded packaging facilities. Due to entrepreneurs’uncertainty about future demand for the product, the investment required for setting up cold chains is not forthcoming. There is therefore a need to address the issue of risk sharing, which may be a result of quality-related concerns and access to investment funds as the industry is still dispersed among many small fi rms.
The industry has both a huge internal or domestic demand and an export demand. There appears to be a lack of adequate fi nancial appraisal skills for this industry, refl ecting the need for a more integrated approach to the development of the industry. There is a new impetus to the industry in the form of setting up agriculture export zones. Such an approach provides an opportunity for the development of infrastructure specifi c to the sector. The development of supply-chain-related infrastructure is an important area in which both technology and investment funds are needed.
Environmental Technology
The Indian Ministry of Environment and Forests is investing heavily in en-vironmental protection strategies, prevention of pollution and support for clean technologies. The Indian government continues to promote stringent statutory norms for energy effi ciency, vehicular pollution (e.g., Euro III norms will be mandatory across the country by 2010), biomedical waste disposal, and water recycling. This will continue to drive the demand for pollution-control technologies in future. The market for pollution-control equipment has witnessed an annual growth of more than 10 percent 2002–04.
Finland has suitable expertise in water purifi cation, waste-water treat-ment, waste management, recycling and utilisation of renewable energy sources, among others. Indian industry could benefi t from collaboration with Finland in this area.
Finland is listed in Annex 1 of the Kyoto Protocol, thus giving it the position of a carbon credits buyer from a developing economy like India. In India the Ministry of Environment and Forests have approved about 180 projects for Clean Development Mechanism (CDM). This number reportedly means that India has approved the largest number of CDM projects among developing countries.
36
India’s National Forest Policy has set the country’s goal of achieving forests and tree cover as 33.3 percent of its land area. So far, this has been achieved for 23.03 percent of the country’s geographical area. With the af-forestation drive now being addressed via carbon sequestration, it may be opportune for Finland to apply its expertise in forestry in India while earning carbon credits to fulfi ll its Kyoto Protocol commitments in the process.
Telecom Equipment
India envisions telecom access going from the current 120 million to 250 million by the year 2007. E-connectivity among the population and estab-lishments is viewed as a catalyst for increasing the effi ciency of infrastructure service provision.
The telecom equipment industry is growing at a breakneck speed of 30 percent per year. The teledensity has moved from the level of 5 per hundred inhabitants fi ve years ago to the current level of 12 percent. This growth is, however, not evenly spread. The digital divide can be observed with rural-urban teledensity at 2 and 31 percent respectively. New Delhi alone has teledensity of 60, which is close to western countries’ standards. Chennai has the highest teledensity among the four metropolitan regions at 62.2 percent. According to ITU-International Telecom Union, the teledensities for the USA, China, France, Germany and the UK are 60 percent, 23 percent, 73 percent, 86.4 percent and 102 percent, respectively.
Buoyed by the better than expected teledensity in 2005 (11.45 against 8.6 percent in 2004), the Department of Telecommunication of the Gov-ernment of India is planning to revise upwards the target of 22 percent teledensity by 2007.
The telecom equipment manufacturing sector already has a dominat-ing presence in the Finnish fi rm, Nokia, which makes mobile handsets. The potential for international cooperation is clearly seen in the areas of setting up a manufacturing base for semiconductors and fabrication of chips in India. R&D for product design and marketing is another area where there is potential for joint ventures, given the skilled technical labour force in India and the technology strengths of Finland.
The Telecom Equipment Manufacturers’ Association (TEMA), is asking the government to address the need for the following:
Development of framework for protection of intellectual property rights in this sector.Infrastructure base for sector-specifi c requirements in the area of transport, power and operational logistics.Accredited information centre for world quality standards.
37
These are also the avenues for international economic cooperation. Since the immediate interests of the sector’s companies do not lead them to in-vestment in these areas, but from a collective perspective these facilities would help to realise economies of scale for the growing sector.
Chemicals
India has a large chemical industry to meet the needs of the domestic market and also to cater to export demand. India’s exports have a strong foothold in the specialty chemicals market. However, as in the case of other industries, Indian manufacturers are looking for technologies to improve the effi ciency of production and the quality of products.
In the polymer industry, there is a clear need for seven naphtha cracker plants of 750 thousand tonnes each, to be installed by 2015. A high rate of economic growth implies that there will be substantial growth in the de-mand for a variety of chemicals. The domestic industry has an opportunity for expansion. The industry will be looking for avenues for technology col-laboration and investment.
Cement and Steel
Cement and steel are basic inputs for an economy. Their widespread use in construction and many other applications make them key manufacturing products. The projected high rates of economic growth in India will require major growth in the construction and machinery industries. Both cement and steel will have high demand in the years ahead.
Cement
India is the world’s second-largest producer of cement after China. There is growing interest in the Indian cement industry from global companies. This suggests that any bilateral economic cooperation will have to be seen in context of the global cement market.
Finnish expertise in mining equipment would be valuable for the Indian cement industry.
Setting up cement plants in other parts of the world could be a joint effort with Finnish fi rms.
Steel
Indian steel manufacturing experienced an annual growth rate of 8.8 per-cent in the period 1993–2004. It has reported a growth rate of 7 percent
38
in the year 2004–05. India imports signifi cant quantities of raw mate-rial/energy sources for steel manufacturing. 70 percent of its coking coal requirement is imported. The quantity is about 19–20 million. Imports are sourced largely from Australia on long-term contract or from the spot markets.
There is practically no government-imposed barrier to trade on manu-factured steel in India. There is nevertheless a requirement for high-grade iron ore exports to be done through channelling agencies like the Minerals and Metals Trading Corporation (MMTC) and the National Minerals De-velopment Corporation (NMDC).
Bilateral trade between India and Finland could be promoted further with Finnish input in R&D and manufacturing of machinery and equipment for steel manufacturing.
Automobile Components
The automobile components industry has grown in India based on the growth of both the domestic automobile market and international demand. India-based automotive components manufacturing has the potential to grow by 500 per cent from its current level to revenues of US $33–40 bil-lion by 2015, including US $20–25 billion in exports and US $13–15 billion in domestic consumption and indirect exports. Such growth could create 2.5–3 million additional direct and indirect jobs, especially for the rural/small town population.
The projected growth potential may be even greater. In the global auto-motive industry, the manufacturing capacities are migrating from high-cost location to LCCs (low-cost countries) such as China, India, Thailand and Turkey. As indicated in Vision 2015, a joint report by the Automotive Com-ponents Manufacturers Association (ACMA) and McKinsey on the overall global automotive components market, India-based suppliers will be in a position to compete for 40 per cent, or US $700 billion, by 2015. The ad-vantages that India can build on are as follows:
Low factor costLow-cost pool of skilled, engineering manpowerMaturity of its domestic supplier markets
Capitalising on these strengths, India stands to build an advantage over most competing LCCs in skill-intensive segments of the industry. India’sdisadvantage lies in manufacturing (a) electronic and (b) plastic intensive parts. The disadvantage is due to a lower manufacturing scale than in other low-cost countries and higher raw material costs.
39
However, India is increasingly viewed as a country offering international quality products at a competitive price, as a result of which many countries are making India a hub for components manufacturing.
SASA, the Scandinavian Automotive Suppliers Association, has recently signed an agreement with ACMA for sourcing and stocking auto compo-nents from India, for supplying to companies in some Scandinavian coun-tries. Opportunities exist for collaboration in areas such as:
Engine development Alternative fuel technologies Vehicle stylingDevelopment of new infrastructure for automotive testing
Volvo of Sweden has set up its Indian base in Bangalore and also has a research and development wing there.
Automobile Manufacturers
India exports to Finland the Alto and Santro models of cars manufactured by Maruti Udyog Ltd and Hyundai. The expertise in Finland for Integrated Transportation Systems, or electric trolleys, is valuable for the Indian econ-omy. Economic cooperation between the two countries in the automobile manufacturing sector may involve the following:
Export of electronic components from Finland to IndiaTraining of dealers for maintenance industry in India by Finnish or-ganisationsIntroduction and progressive involvement of Finland in renewable energy technologies in automobile manufacturing sector, namely, hydrogen technologyEnhanced adoption of environmentally friendly technologies in the Indian automobile manufacturing segment with Finnish cooperation
A Synthesis of the Perspectives Obtained from Interviews
The discussions reported above provide a basis for a SWOT analysis of the sectors with respect to business cooperation between India and Fin-land. The discussions reveal that the status of technology, competitiveness, trade openness, and growth determinants shed light on potential areas for cooperation. The avenues for bilateral economic cooperation can be sum-marised as:
40
Technology modernisationMaking exports and imports cost-effi cient through improving access to supply chains in Europe, improving logistics of distribution FDI for skill development in specialised sectorsInfrastructure development along the lines of Special Economic ZonesCustomised R&DJoint ventures for catering to other growing markets, specifi cally South AsiaInvestment for Intellectual Property Rights developmentInvestment for information and due diligence to disseminate global quality standards among Indian exporters and manufacturers.Development of sector-specifi c project appraisal skills in fi nancial institutionsIntegration of the value chain within India for improved terms of trade
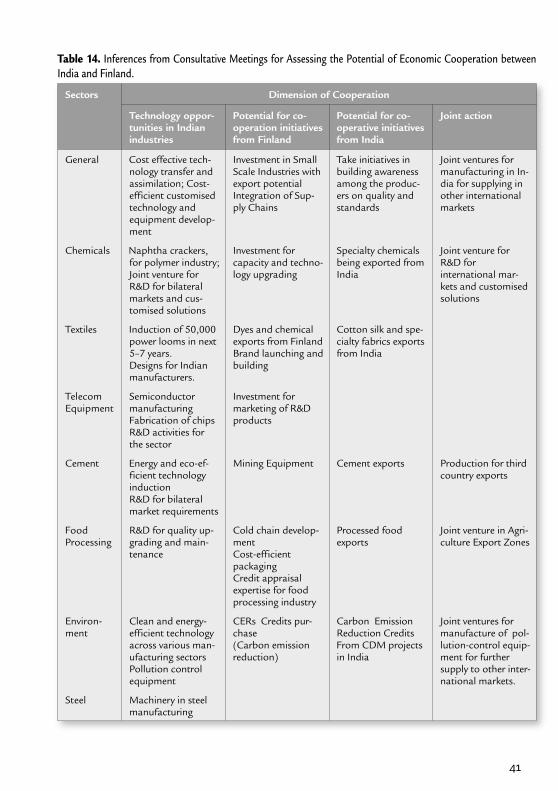
A summary of the various issues that have emerged from the discussions with industry is shown in Table 14.
41
Table 14. Inferences from Consultative Meetings for Assessing the Potential of Economic Cooperation between India and Finland.
Sectors Dimension of Cooperation
Technology oppor-tunities in Indian industries
Potential for co-operation initiatives from Finland
Potential for co-operative initiatives from India
Joint action
General Cost effective tech-nology transfer and assimilation; Cost-efficient customised technology and equipment develop-ment
Investment in Small Scale Industries with export potential Integration of Sup-ply Chains
Take initiatives in building awareness among the produc-ers on quality and standards
Joint ventures for manufacturing in In-dia for supplying in other international markets
Chemicals Naphtha crackers, for polymer industry;Joint venture for R&D for bilateral markets and cus-tomised solutions
Investment for capacity and techno-logy upgrading
Specialty chemicals being exported from India
Joint venture for R&D forinternational mar-kets and customised solutions
Textiles Induction of 50,000 power looms in next 5–7 years.Designs for Indian manufacturers.
Dyes and chemical exports from FinlandBrand launching and building
Cotton silk and spe-cialty fabrics exports from India
Telecom Equipment
SemiconductormanufacturingFabrication of chipsR&D activities for the sector
Investment for marketing of R&D products
Cement Energy and eco-ef-ficient technology inductionR&D for bilateral market requirements
Mining Equipment Cement exports Production for third country exports
FoodProcessing
R&D for quality up-grading and main-tenance
Cold chain develop-mentCost-efficient packaging Credit appraisal expertise for food processing industry
Processed food exports
Joint venture in Agri-culture Export Zones
Environ-ment
Clean and energy- efficient technology across various man-ufacturing sectorsPollution control equipment
CERs Credits pur-chase(Carbon emission reduction)
Carbon Emission Reduction CreditsFrom CDM projects in India
Joint ventures for manufacture of pol-lution-control equip-ment for further supply to other inter-national markets.
Steel Machinery in steel manufacturing
42
5 Conclusions
This paper has provided an overview of the changes in the Indian economy since the beginning of its liberalisation of economic policies in the early 1990s. A key driver of changes in the economy today is the deepening of the process of integration of the economy with the global market. The structure of the economy is undergoing change in response to the competitive pres-sures, both domestic and in the international market. More liberal economic policies are also altering the composition of demand. Demand for consumer durables has been expanding rapidly as income levels rise.
The last twenty-fi ve year period has witnessed a growth of per capita income at a rate of close to four percent per annum, a dramatic improve-ment over the growth rate of roughly two percent per annum in the previous three decades. Growth in the years since the 1980s has been rapid by India’sown previous experience. In this context, we set out to examine the pattern of changes to understand where the opportunities are for cooperation be-tween India and Finland. The approach was one of assessing the quantitative information on industry and trade as well as understanding the perspectives of Indian industry.
The past trends clearly show that Indian manufacturing is moving to-wards a structure that will exploit technology and scale of operations. Its composition of output and trade indicate that manufactured engineering goods are increasingly a part of its basket of output and exports. This sug-gests that the technologically advanced economy of Finland and the fast-growing economy of India do indeed have areas of cooperation. Electrical machinery and electronics are emerging as important sectors in which trade opportunities are expanding for India. In comparison to China, India is a smaller market for Finland. Finland is a small market for India in compari-son to the rest of the EU. However, the areas of complementarities are wide and signifi cant.
43
This point emerges more strongly in the discussions with industry of-fi cials. The areas in which cooperation has been pinpointed are ‘technol-ogy-upgrading’ and ‘supply chain management or logistics’. It is realised that India’s infrastructure constraints are formidable and most must be made of what is available. In this regard, the ‘integrated supply chain’ of Europe has been noted. The amount of value addition that takes place within European markets is noted as an area in which there are opportuni-ties for cooperation.
The idea of disseminating the importance of quality and standards of products in international markets came up repeatedly in the interviews. To build markets for products on a sustained basis, it is important to supply products of high quality on a consistent basis. Cooperation in building this awareness was recognised as a necessary condition for expanding trade.
Technology upgrading in textiles was noted as an area in which there are considerable opportunities for trade and investment cooperation be-tween India and Finland. The key point appears to be the recognition that Finland is an important source of modern technologies.
It is also recognised that cooperation is possible in trading with third countries, with either India as a manufacturing hub or Finland as a partner for exchange with the rest of Europe.
Environment-related technologies are also cited as areas of coopera-tion. Introducing technologies that conserve and sustain natural resources is a necessity for India, where the pressure of rising population and economic growth on environmental resources is acute.
The telecom revolution has provided new opportunities for economic linkages with Finland, but growth in the automobile industry in India opens up another opportunity. Expansion of infrastructure in terms of electricity and transport sectors is another potential area for investment and trade.
The comparative advantage of India as a labour-rich economy is slowly emerging. Its success in providing IT-related services globally has provided it the necessary impetus to focus on building its human resources. However, growth in the manufacturing sector in the country is also imperative from the employment perspective. It is important, therefore, to identify areas of how the manufacturing sector will organise itself to compete at the global level in the years ahead. The opportunities for technology upgrading and infrastructure development will be very great.
This paper has provided an overview of these dimensions of Indian-Finnish cooperation in building economic opportunities for mutual advan-tage. We have not addressed the issues relating to trade in services. Issues related to investment are also not addressed. However, the paper provides an insight into the likely direction in which opportunities for business are expected to emerge in Indian industry.
44
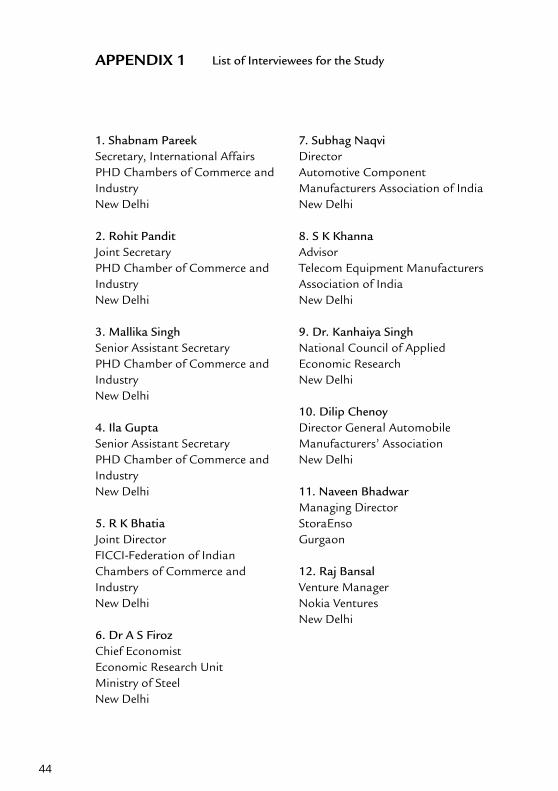
APPENDIX 1 List of Interviewees for the Study
1. Shabnam Pareek Secretary, International Affairs PHD Chambers of Commerce and IndustryNew Delhi
2. Rohit PanditJoint Secretary PHD Chamber of Commerce and Industry New Delhi
3. Mallika SinghSenior Assistant Secretary PHD Chamber of Commerce and Industry New Delhi
4. Ila Gupta Senior Assistant Secretary PHD Chamber of Commerce and IndustryNew Delhi
5. R K BhatiaJoint Director FICCI-Federation of Indian Chambers of Commerce and IndustryNew Delhi
6. Dr A S Firoz Chief EconomistEconomic Research UnitMinistry of SteelNew Delhi
7. Subhag Naqvi Director Automotive Component Manufacturers Association of IndiaNew Delhi
8. S K KhannaAdvisorTelecom Equipment Manufacturers Association of IndiaNew Delhi
9. Dr. Kanhaiya Singh National Council of Applied Economic Research New Delhi
10. Dilip ChenoyDirector General Automobile Manufacturers’ Association New Delhi
11. Naveen Bhadwar Managing DirectorStoraEnso Gurgaon
12. Raj Bansal Venture Manager Nokia VenturesNew Delhi
45
APPENDIX 2 List of Acronyms
ACMA Automotive Components Manufacturers AssociationCDM Clean Development MechanismEU European UnionFDI Foreign Direct InvestmentFPI Food Processing IndustryGDP Gross Domestic ProductGFCF Gross Fixed Capital FormationMisc. MiscellaneousMMTC Minerals and Metals Trading CorporationMUVs Multi-Utility VehiclesNA Not AvailableNCAER National Council of Applied Economic ResearchNMDC National Minerals Development CorporationITES Information Technology Enabled ServicesITU International Telecom UnionRCA Revealed Comparative AdvantageR & D Research and DevelopmentRep. RepublicSitra Finnish National Fund for Research and DevelopmentTEMA Telecom Equipment Manufacturers Association of IndiaUK United KingdomUS United States of America Vs. Versus


With the expansion of cross-border trade and investment fl ows, it is necessary for each country to be more aware of the op-portunities that help improve the effi cien-cy of scarce resources. India and Finland are very different economies. India is a large, fast-growing, diversifi ed develop-ing economy, while Finland is a relatively small, developed economy known for ex-ample for its technology industries. What are the opportunities for their interaction? This report provides a systematic analysis of the trade and investment opportuni-ties in India’s industrial sector to identify potential areas where investment and trade fl ows between the two countries can be expanded substantially.
ISBN 951-563-518-7ISSN 1457-571X
Itämerentori 2, P.O. Box 160, FI-00181 Helsinki, Finland, www.sitra.fi Telephone +358 9 618 991, fax +358 9 645 072, [email protected]
Finnish National Fund for Research and Development