Embed Size (px)
Citation preview
P: +41 22 730 0111F: +41 22 733 4439E: [email protected]
Postal addressInternational Trade CentrePalais des Nations1211 Geneva 10, Switzerland
Street addressInternational Trade Centre54-56 Rue de Montbrillant1202 Geneva, Switzerland
P: +41 22 730 0111F: +41 22 733 4439E: [email protected]
Postal addressInternational Trade CentrePalais des Nations1211 Geneva 10, Switzerland
Street addressInternational Trade Centre54-56 Rue de Montbrillant1202 Geneva, Switzerland
P: +41 22 730 0111F: +41 22 733 4439E: [email protected]
Postal addressInternational Trade CentrePalais des Nations1211 Geneva 10, Switzerland
Street addressInternational Trade Centre54-56 Rue de Montbrillant1202 Geneva, Switzerland
The International Trade Centre (ITC) is the joint agency of the World Trade Organization and the United Nations.
technical paper
cOMMOnWealth traDe
prOSpectS FOr StrOnGer cOOperatiOn

COMMONWEALTH TRADE
PROSPECTS FOR STRONGER COOPERATION
COMMONWEALTH TRADE: PROSPECTS FOR STRONGER COOPERATION
ii MAR-13-229.E
Abstract for trade information services
ID=43019 2013 C-00 000 COM
International Trade Centre (ITC) Commonwealth Trade: Prospects for Stronger Cooperation Geneva: ITC, 2013. ix, 39 pages (Technical paper) Doc. No. MAR-13-229.E
Study providing an overview of recent trends in export performances among the Commonwealth states with the view to identifying opportunities for closer economic cooperation – analyses export performance of the Commonwealth member states, recognising their differences in terms of levels of development in the context of the global financial crisis and during the subsequent recovery; reviews trade agreements and market access conditions among the Commonwealth members; seeks to identify opportunities to engage in closer intra-Commonwealth cooperation to enhance trade amongst members.
Descriptors: Commonwealth, Trade Agreements, Intraregional Trade, Market Access, Tariffs, Exports
For further information on this technical paper, contact Ms. Julia Spies.
English
The International Trade Centre (ITC) is the joint agency of the World Trade Organization and the United Nations.
ITC, Palais des Nations, 1211 Geneva 10, Switzerland (www.intracen.org)
Views expressed in this paper are those of consultants and do not necessarily coincide with those of ITC, UN or WTO. The designations employed and the presentation of material in this paper do not imply the expression of any opinion whatsoever on the part of the International Trade Centre concerning the legal status of any country, territory, city or area or of its authorities, or concerning the delimitation of its frontiers or boundaries.
Mention of firms, products and product brands does not imply the endorsement of ITC.
This technical paper has not been formally edited by the International Trade Centre.
Digital images on the cover: © iStockphoto
© International Trade Centre 2013
ITC encourages the reprinting and translation of its publications to achieve wider dissemination. Short extracts of this technical paper may be freely reproduced, with due acknowledgement of the source. Permission should be requested for more extensive reproduction or translation. A copy of the reprinted or translated material should be sent to ITC.
COMMONWEALTH TRADE: PROSPECTS FOR STRONGER COOPERATION
MAR-13-229.E iii
Acknowledgements
This report was written by Mariem Nouar and Julia Spies in the Market Analysis and Research section of the International Trade Centre (ITC). The work was supervised by Yvan Decreux, Senior Market Analyst and Mondher Mimouni, Chief of the section.
The report is an update of a study which was initially produced in 2011 by the ITC in cooperation with the Commonwealth Secretariat. The purpose is to provide an overview on trade trends of Commonwealth member states with the aim of supporting an informed decision about possibilities for closer economic cooperation.
The authors would like to thank Xavier Pichot for the analysis of tariffs and Takako Ikezuki for an earlier draft which built the base for this report.
The ITC Communications and Events team has helped in finalizing this publication.
COMMONWEALTH TRADE: PROSPECTS FOR STRONGER COOPERATION
iv MAR-13-229.E
COMMONWEALTH TRADE: PROSPECTS FOR STRONGER COOPERATION
MAR-13-229.E v
Contents
Acknowledgements iii Acronyms vii Executive summary ix
Introduction 1
Chapter 1 Diversity within the Commonwealth 2
1. Economic background 2
2. Global financial crisis recovery 3
Chapter 2 Export performance 7
1. Merchandise goods 7
2. Direction of exports 8
3. Composition of exports 9
4. Intra-Commonwealth trade 12
5. Product and market diversification 14
6. Trade in services 15
Chapter 3 Market access and trade agreements 19
1. Scope for Commonwealth economic cooperation 19
2. Preferential trade agreements 19
3. Intra- and extra-Commonwealth tariffs 24
Conclusions 26
Appendix Additional tables and figures 27
Table 1. Overview of Commonwealth development and business climate indicators, 2011 2
Table 2. Overview of economic indicators, 2011 3
Table 3. Export performance during the crisis and the recovery 4
Table 4. Export declines and rises of selected countries within each group 5
Table 5. Export declines and rises of major products within each group 6
Table 6. Evolution of export performance for Commonwealth states and the world 7
Table 7. Export destinations of Commonwealth members 8
Table 8. Composition of Commonwealth exports 10
Table 9. Composition of Commonwealth exports by processing stage, 2011 11
Table 10. Intra-Commonwealth exports by subgroup in US$ billion, 2011 12
Table 11. Top 3 exported products and markets per total exports by each group, 2011 14
Table 12. Market and exported product diversification, 2011 15
Table 13. Service exports of Commonwealth countries 16
Table 14. Applied tariffs faced by Commonwealth member states, 2012 24
COMMONWEALTH TRADE: PROSPECTS FOR STRONGER COOPERATION
vi MAR-13-229.E
Table 15. Applied tariffs by Commonwealth to Commonwealth states, 2012 25
Table 16. Applied tariffs by the rest of the world to Commonwealth states, 2012 25
Figure 1. Evolution of the export growth rate for Commonwealth states and the world 8 Figure 2. Intra-Commonwealth states’ exports as a share of total exports, 2011 13 Figure 3. Exports of services as a share of total exports of goods and services, 2011 17 Figure 4. Service exports to the Commonwealth as a share of total service exports, 2010 18 Figure 5. Number of preferential trade agreements by country, 2012 20 Figure 6. Trade agreements within the Commonwealth, 2012 22
COMMONWEALTH TRADE: PROSPECTS FOR STRONGER COOPERATION
MAR-13-229.E vii
Acronyms
Unless otherwise specified, all references to dollars ($) are to United States dollars, and all references to tons are to metric tons.
The following abbreviations are used:
ASEAN Association of Southeast Asian Nations BRIC Brazil, Russia, India and China COMESA Common Market for Eastern and Southern Africa DBI Doing Business Index EU European Union FDI Foreign direct investment FTA Free trade agreement GCI Global Competitiveness Index GDP Gross domestic product GSP Generalized System of Preferences HDI Human Development Index HS Harmonized System ITC International Trade Centre LDC Least developed country LPI Logistics Performance Index OECD Organisation for Economic Co-operation and Development RTA Regional Trade Agreement SAARC South Asian Association for Regional Cooperation SADC Southern Africa and Development Community SIDS Small island developing States UNCTAD United Nations Conference on Trade and Development UNDP United Nations Development Programme WEF World Economic Forum
COMMONWEALTH TRADE: PROSPECTS FOR STRONGER COOPERATION
viii MAR-13-229.E
COMMONWEALTH TRADE: PROSPECTS FOR STRONGER COOPERATION
MAR-13-229.E ix
Executive summary
With transport costs continuing to be one of the major obstacles to greater regional integration, trade and economic cooperation agreements are traditionally sought among countries in relative geographical proximity. The Commonwealth comprises countries from all continents that are furthermore at very different stages of economic development. What they share is, however, English as a common language.
This study takes stock of the present export performances of the member states of the Commonwealth, recognising their differences in terms of levels of development and the business climate. Based on an assessment of the prevailing market access conditions, the study suggests that intra-Commonwealth cooperation should focus on technical and financial assistance for trade facilitation measures amongst Commonwealth countries.
Despite partial scope agreements, tariffs are still high and intra-Commonwealth trade remains unimproved
Commonwealth countries have experienced different performances in terms of exports over the last years. While Least developed countries (LDCs) were least affected by the 2008/2009 economic crisis, they have also benefited from the strongest recovery. However, their performance remains fragile because of their high dependence on few products many of which are exported without any value addition. Furthermore, while developing countries inside and outside the Commonwealth become more and more important as export destinations, intra-Commonwealth trade has not stepped up in the past years.
Even though Commonwealth member states are engaged in bilateral and plurilateral agreements as for instance Malaysia, Singapore and Brunei Darussalam as members of the Association of Southeast Asian Nations (ASEAN) and Cyprus, Malta and the United Kingdom as members of the European Union (EU), there is still ample scope for improving market access. This is a particular concern for the Commonwealth’s LDCs that still face substantial tariffs when exporting to developing and least developed countries in the Commonwealth and for Commonwealth exporters of processed agricultural goods which are confronted with particularly high tariffs.
Enhanced intra-Commonwealth cooperation may be achieved through mutual assistance in trade facilitation
Current trade talks, if successful, could contribute to deepening trade integration within the Commonwealth. In particular, the EU, which comprises three Commonwealth countries, has been negotiating a trade agreement with Canada since October 2009. The EU is also negotiating trade agreements with India, Malaysia and Singapore. At the same time, a Trans-Pacific Partnership, if concluded among current negotiating parties, would involve a number of Commonwealth members, such as Canada, Malaysia, New Zealand and Singapore. Considering that Commonwealth countries are dispersed across the globe, the current strategy consisting in building partnerships with neighbours instead of seeking a specific trade liberalization within the Commonwealth is appropriate from a development perspective.
However, enhanced intra-Commonwealth cooperation may be achieved through the simultaneous implementation of various instruments and modalities. One instrument could be an economic cooperation agreement amongst selected developed and developing countries. The focus of such an agreement would be to ensure technical and financial assistance in the implementation of trade facilitation measures amongst Commonwealth countries. Some of the emerging economies among the Commonwealth countries, for example India, may contribute their trade facilitation expertise to be utilized under the agreement. Selected developed Commonwealth countries could make available technical and financial resources to a designated Commonwealth trade facilitation trust fund.

COMMONWEALTH TRADE: PROSPECTS FOR STRONGER COOPERATION
MAR-13-229.E 1
Introduction
With regional integration being back into vogue, all but a handful of countries have signed preferential trade agreements. The underlying trade potential implies opportunities for governments, firms, and the people, and may improve employment and eventually also welfare. Being spread across all continents and showing very different levels of economic development, the Commonwealth states are not the prime example of a promising trade bloc. Yet, there is room for enhancing market access and augmenting trade within the Commonwealth and therewith connecting countries and citizens of its member states. This study gives an overview over recent trends in export performances among Commonwealth states with a view towards identifying opportunities of closer economic cooperation.
Chapters 1 and 2 of this study take stock of the present export performance of Commonwealth member states, recognising their differences in terms of levels of development and the prevailing business climate. Commonwealth countries evidenced major differences in their economic and export performances in the context of the global financial crisis and during the subsequent recovery. While the Commonwealth’s least developed countries (LDCs) were on average less affected and recovered better from the crisis than the Commonwealth’s developing and developed countries, one of the major risks they face is the dependency on few markets and products. In addition, intra-Commonwealth exports as a share of total exports have basically been stagnant over the recent years.
Chapter 3 of this study also analyses the wide range of trade agreements which Commonwealth members have engaged in. Based on an assessment of the prevailing market access conditions, the study seeks to identify opportunities to engage in intra-Commonwealth agreements to enhance cooperation and trade amongst members. One approach could be trade-related cooperation within the Commonwealth, where countries can share their experience in overcoming difficulties that they face when engaging in international trade. Another approach could be trade initiatives involving some Commonwealth member states and external partners that could eventually also contribute to deepening trade integration within the Commonwealth.
COMMONWEALTH TRADE: PROSPECTS FOR STRONGER COOPERATION
2 MAR-13-229.E
Chapter 1 Diversity within the Commonwealth
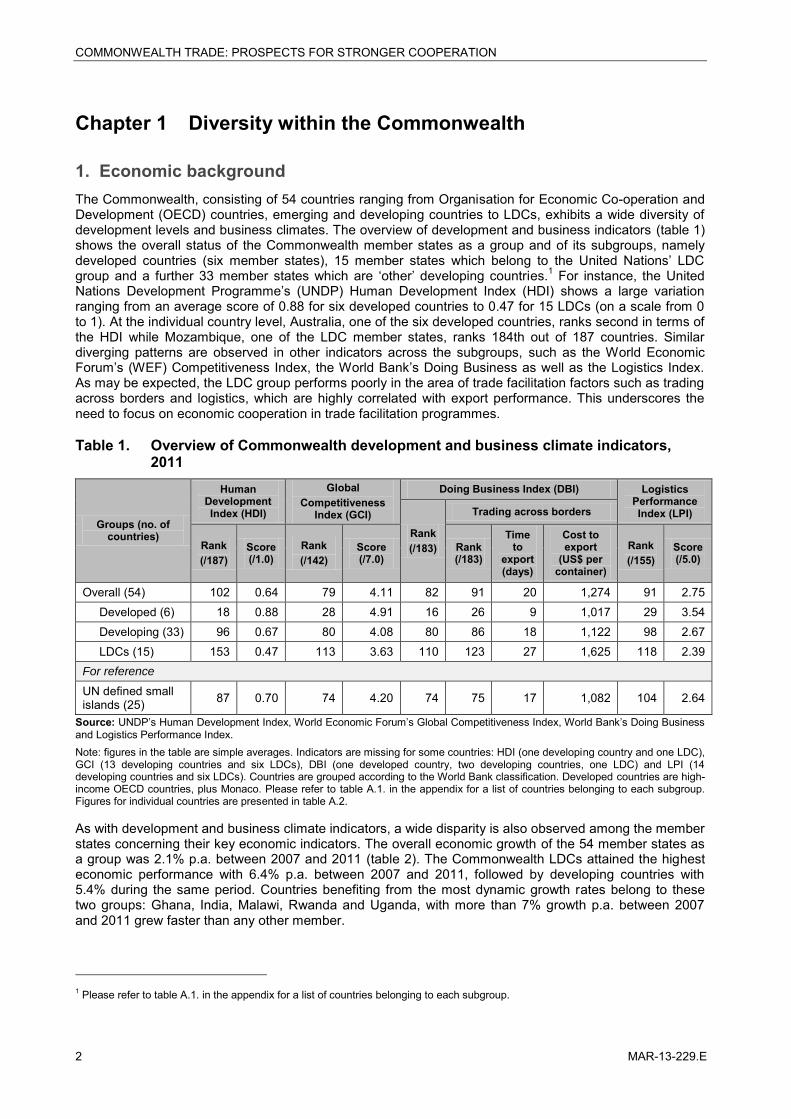
1. Economic background The Commonwealth, consisting of 54 countries ranging from Organisation for Economic Co-operation and Development (OECD) countries, emerging and developing countries to LDCs, exhibits a wide diversity of development levels and business climates. The overview of development and business indicators (table 1) shows the overall status of the Commonwealth member states as a group and of its subgroups, namely developed countries (six member states), 15 member states which belong to the United Nations’ LDC group and a further 33 member states which are ‘other’ developing countries.1 For instance, the United Nations Development Programme’s (UNDP) Human Development Index (HDI) shows a large variation ranging from an average score of 0.88 for six developed countries to 0.47 for 15 LDCs (on a scale from 0 to 1). At the individual country level, Australia, one of the six developed countries, ranks second in terms of the HDI while Mozambique, one of the LDC member states, ranks 184th out of 187 countries. Similar diverging patterns are observed in other indicators across the subgroups, such as the World Economic Forum’s (WEF) Competitiveness Index, the World Bank’s Doing Business as well as the Logistics Index. As may be expected, the LDC group performs poorly in the area of trade facilitation factors such as trading across borders and logistics, which are highly correlated with export performance. This underscores the need to focus on economic cooperation in trade facilitation programmes.
Table 1. Overview of Commonwealth development and business climate indicators, 2011
Groups (no. of countries)
Human Development Index (HDI)
Global Competitiveness
Index (GCI)
Doing Business Index (DBI) Logistics Performance Index (LPI)
Rank (/183)
Trading across borders
Rank (/187)
Score (/1.0)
Rank (/142)
Score (/7.0)
Rank (/183)
Time to
export (days)
Cost to export
(US$ per container)
Rank (/155)
Score (/5.0)
Overall (54) 102 0.64 79 4.11 82 91 20 1,274 91 2.75 Developed (6) 18 0.88 28 4.91 16 26 9 1,017 29 3.54 Developing (33) 96 0.67 80 4.08 80 86 18 1,122 98 2.67 LDCs (15) 153 0.47 113 3.63 110 123 27 1,625 118 2.39 For reference
UN defined small islands (25) 87 0.70 74 4.20 74 75 17 1,082 104 2.64
Source: UNDP’s Human Development Index, World Economic Forum’s Global Competitiveness Index, World Bank’s Doing Business and Logistics Performance Index. Note: figures in the table are simple averages. Indicators are missing for some countries: HDI (one developing country and one LDC), GCI (13 developing countries and six LDCs), DBI (one developed country, two developing countries, one LDC) and LPI (14 developing countries and six LDCs). Countries are grouped according to the World Bank classification. Developed countries are high-income OECD countries, plus Monaco. Please refer to table A.1. in the appendix for a list of countries belonging to each subgroup. Figures for individual countries are presented in table A.2.
As with development and business climate indicators, a wide disparity is also observed among the member states concerning their key economic indicators. The overall economic growth of the 54 member states as a group was 2.1% p.a. between 2007 and 2011 (table 2). The Commonwealth LDCs attained the highest economic performance with 6.4% p.a. between 2007 and 2011, followed by developing countries with 5.4% during the same period. Countries benefiting from the most dynamic growth rates belong to these two groups: Ghana, India, Malawi, Rwanda and Uganda, with more than 7% growth p.a. between 2007 and 2011 grew faster than any other member.
1 Please refer to table A.1. in the appendix for a list of countries belonging to each subgroup.
COMMONWEALTH TRADE: PROSPECTS FOR STRONGER COOPERATION
MAR-13-229.E 3
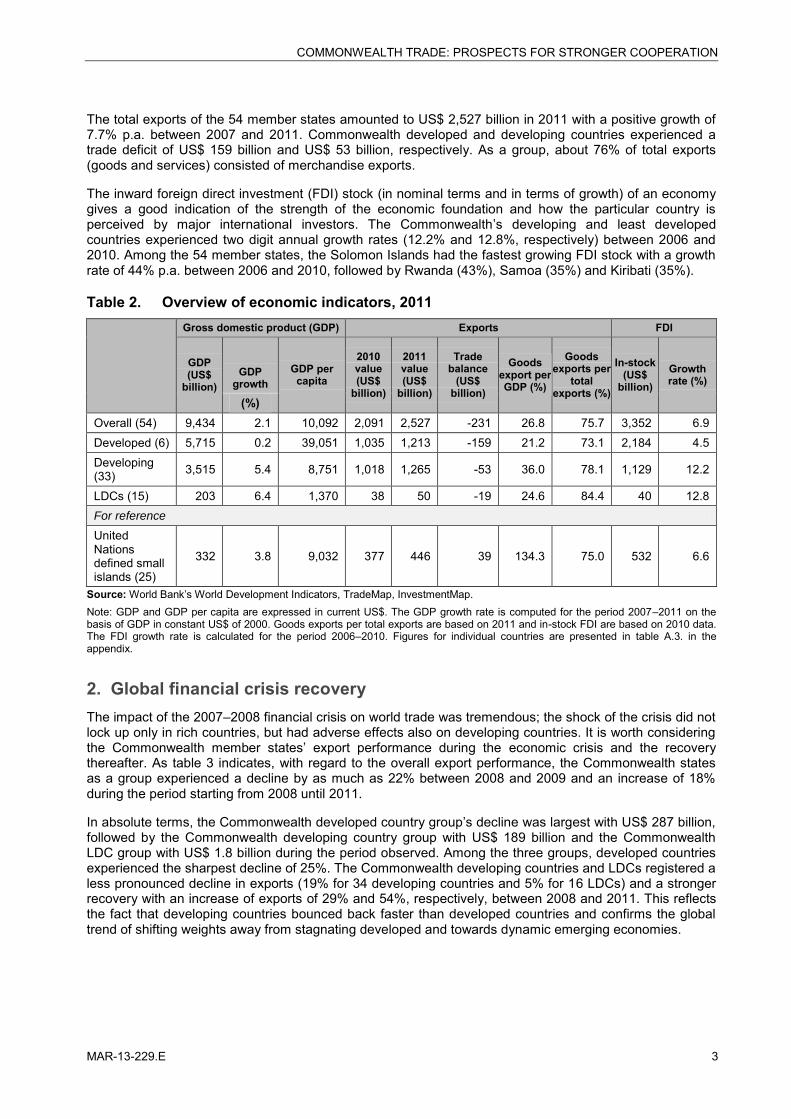
The total exports of the 54 member states amounted to US$ 2,527 billion in 2011 with a positive growth of 7.7% p.a. between 2007 and 2011. Commonwealth developed and developing countries experienced a trade deficit of US$ 159 billion and US$ 53 billion, respectively. As a group, about 76% of total exports (goods and services) consisted of merchandise exports.
The inward foreign direct investment (FDI) stock (in nominal terms and in terms of growth) of an economy gives a good indication of the strength of the economic foundation and how the particular country is perceived by major international investors. The Commonwealth’s developing and least developed countries experienced two digit annual growth rates (12.2% and 12.8%, respectively) between 2006 and 2010. Among the 54 member states, the Solomon Islands had the fastest growing FDI stock with a growth rate of 44% p.a. between 2006 and 2010, followed by Rwanda (43%), Samoa (35%) and Kiribati (35%).
Table 2. Overview of economic indicators, 2011
Gross domestic product (GDP) Exports FDI
GDP (US$
billion) GDP
growth GDP per capita
2010 value (US$
billion)
2011 value (US$
billion)
Trade balance
(US$ billion)
Goods export per GDP (%)
Goods exports per
total exports (%)
In-stock (US$
billion) Growth rate (%)
(%) Overall (54) 9,434 2.1 10,092 2,091 2,527 -231 26.8 75.7 3,352 6.9 Developed (6) 5,715 0.2 39,051 1,035 1,213 -159 21.2 73.1 2,184 4.5 Developing (33) 3,515 5.4 8,751 1,018 1,265 -53 36.0 78.1 1,129 12.2
LDCs (15) 203 6.4 1,370 38 50 -19 24.6 84.4 40 12.8 For reference United Nations defined small islands (25)
332 3.8 9,032 377 446 39 134.3 75.0 532 6.6
Source: World Bank’s World Development Indicators, TradeMap, InvestmentMap. Note: GDP and GDP per capita are expressed in current US$. The GDP growth rate is computed for the period 2007–2011 on the basis of GDP in constant US$ of 2000. Goods exports per total exports are based on 2011 and in-stock FDI are based on 2010 data. The FDI growth rate is calculated for the period 2006–2010. Figures for individual countries are presented in table A.3. in the appendix.
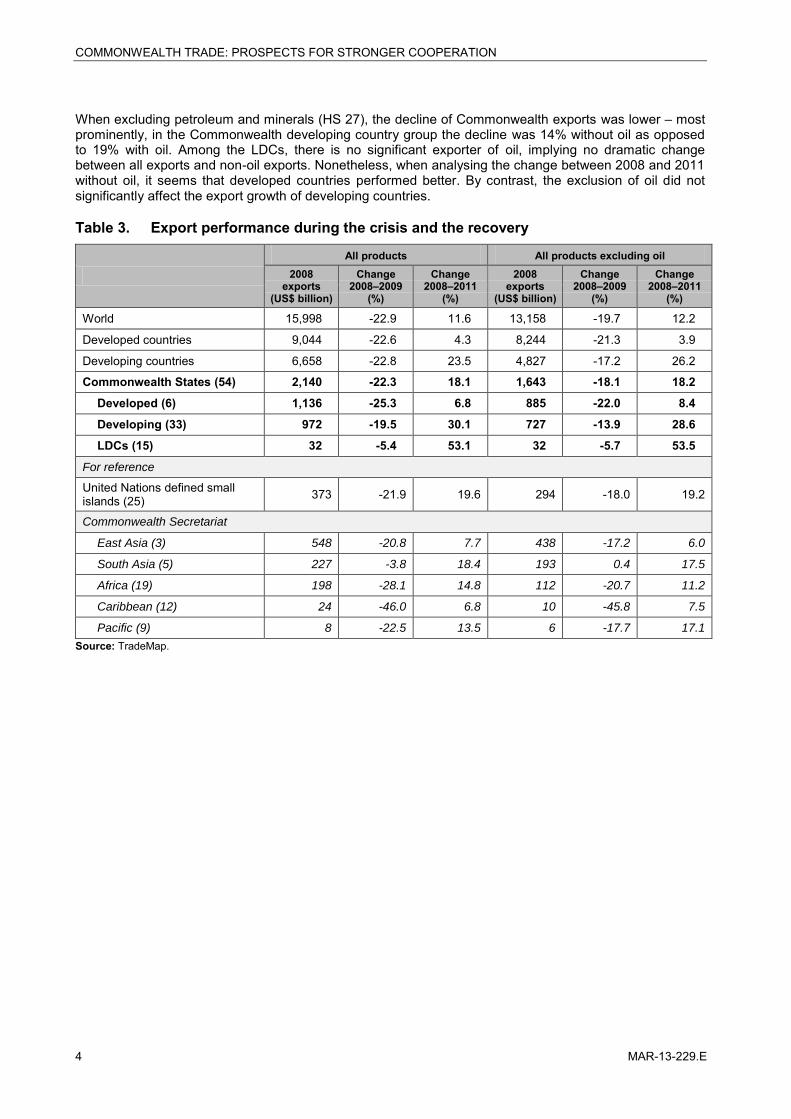
2. Global financial crisis recovery The impact of the 2007–2008 financial crisis on world trade was tremendous; the shock of the crisis did not lock up only in rich countries, but had adverse effects also on developing countries. It is worth considering the Commonwealth member states’ export performance during the economic crisis and the recovery thereafter. As table 3 indicates, with regard to the overall export performance, the Commonwealth states as a group experienced a decline by as much as 22% between 2008 and 2009 and an increase of 18% during the period starting from 2008 until 2011.
In absolute terms, the Commonwealth developed country group’s decline was largest with US$ 287 billion, followed by the Commonwealth developing country group with US$ 189 billion and the Commonwealth LDC group with US$ 1.8 billion during the period observed. Among the three groups, developed countries experienced the sharpest decline of 25%. The Commonwealth developing countries and LDCs registered a less pronounced decline in exports (19% for 34 developing countries and 5% for 16 LDCs) and a stronger recovery with an increase of exports of 29% and 54%, respectively, between 2008 and 2011. This reflects the fact that developing countries bounced back faster than developed countries and confirms the global trend of shifting weights away from stagnating developed and towards dynamic emerging economies.
COMMONWEALTH TRADE: PROSPECTS FOR STRONGER COOPERATION
4 MAR-13-229.E
When excluding petroleum and minerals (HS 27), the decline of Commonwealth exports was lower – most prominently, in the Commonwealth developing country group the decline was 14% without oil as opposed to 19% with oil. Among the LDCs, there is no significant exporter of oil, implying no dramatic change between all exports and non-oil exports. Nonetheless, when analysing the change between 2008 and 2011 without oil, it seems that developed countries performed better. By contrast, the exclusion of oil did not significantly affect the export growth of developing countries.
Table 3. Export performance during the crisis and the recovery
All products All products excluding oil
2008 exports
(US$ billion)
Change 2008–2009
(%)
Change 2008–2011
(%)
2008 exports
(US$ billion)
Change 2008–2009
(%)
Change 2008–2011
(%)
World 15,998 -22.9 11.6 13,158 -19.7 12.2
Developed countries 9,044 -22.6 4.3 8,244 -21.3 3.9
Developing countries 6,658 -22.8 23.5 4,827 -17.2 26.2
Commonwealth States (54) 2,140 -22.3 18.1 1,643 -18.1 18.2
Developed (6) 1,136 -25.3 6.8 885 -22.0 8.4
Developing (33) 972 -19.5 30.1 727 -13.9 28.6
LDCs (15) 32 -5.4 53.1 32 -5.7 53.5
For reference
United Nations defined small islands (25) 373 -21.9 19.6 294 -18.0 19.2
Commonwealth Secretariat
East Asia (3) 548 -20.8 7.7 438 -17.2 6.0
South Asia (5) 227 -3.8 18.4 193 0.4 17.5
Africa (19) 198 -28.1 14.8 112 -20.7 11.2
Caribbean (12) 24 -46.0 6.8 10 -45.8 7.5
Pacific (9) 8 -22.5 13.5 6 -17.7 17.1
Source: TradeMap.
COMMONWEALTH TRADE: PROSPECTS FOR STRONGER COOPERATION
MAR-13-229.E 5
Table 4. Export performance of selected countries during the crisis and the recovery
Selected countries
All products All products excluding oil 2008
exports (US$
million)
Change 2008–2009
(%)
Change 2008–2011
(%) 2008 exports (US$ million)
Change 2008–2009
(%)
Change 2008–2011
(%)
Developed country group Canada 455,632 -30.8 -1.1 329,773 -26.3 1.4 United Kingdom 457,743 -23.3 3.1 395,025 -21.2 3.0 Australia 186,853 -17.7 31.5 126.985 -14.6 39.4 Developing country group Singapore 338,176 -20.2 21.1 275,689 -17.0 19.2 Malaysia 198,702 -20.9 14.2 162,223 -17.4 15.1 India 181,861 -2.8 65.8 148,993 2.5 64.4 LDC group Bangladesh 16,467 2.1 57.2 16,307 2.1 58.2 Zambia 5,099 -15.4 76.5 5,063 -15.6 77.0 Tanzania, United Rep. of 3,121 -4.4 51.7 3,051 -3.0 54.0 United Nations defined small islands Trinidad and Tobago 18,650 -51.1 1.4 5,596 -60.9 31.8 Papua New Guinea 6,028 -15.6 37.6 4,553 -8.2 47.7 Mauritius 2,401 -26.5 -6.1 2,401 -26.5 -6.2
Source: TradeMap. Note: countries selected on the basis of largest absolute change between 2009 and 2011.
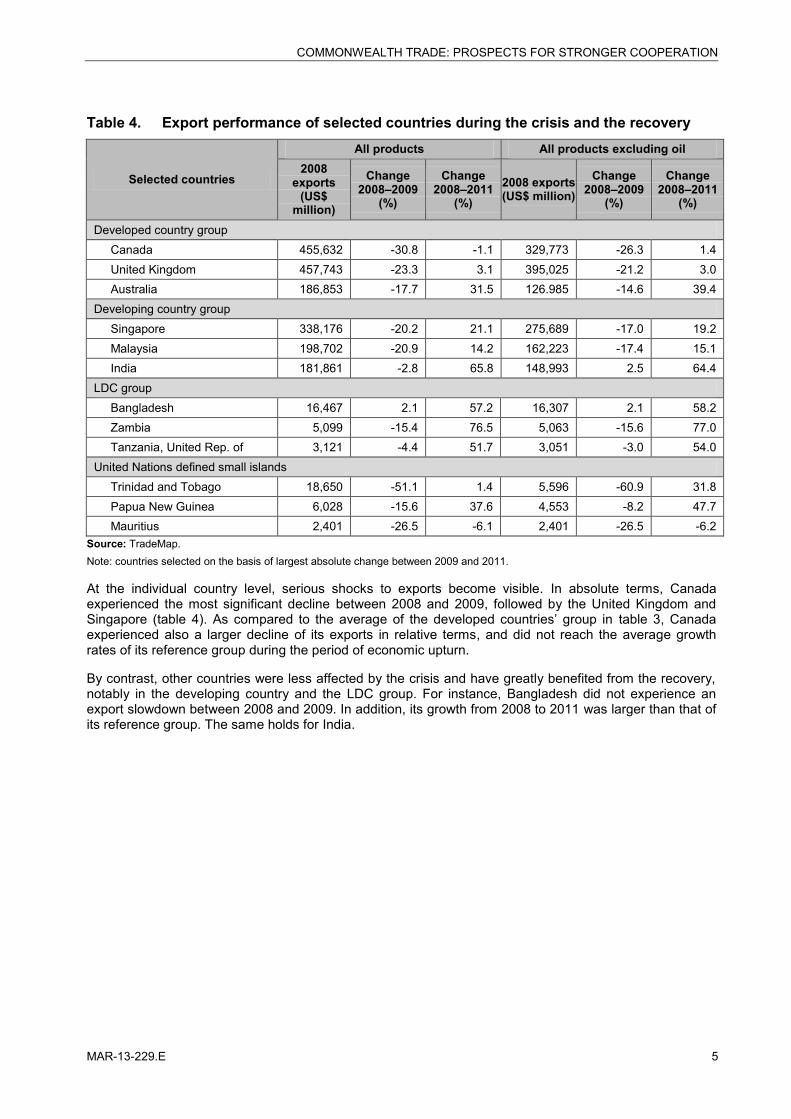
At the individual country level, serious shocks to exports become visible. In absolute terms, Canada experienced the most significant decline between 2008 and 2009, followed by the United Kingdom and Singapore (table 4). As compared to the average of the developed countries’ group in table 3, Canada experienced also a larger decline of its exports in relative terms, and did not reach the average growth rates of its reference group during the period of economic upturn.
By contrast, other countries were less affected by the crisis and have greatly benefited from the recovery, notably in the developing country and the LDC group. For instance, Bangladesh did not experience an export slowdown between 2008 and 2009. In addition, its growth from 2008 to 2011 was larger than that of its reference group. The same holds for India.
COMMONWEALTH TRADE: PROSPECTS FOR STRONGER COOPERATION
6 MAR-13-229.E
Table 5. Export performance of major products during the crisis and the recovery
Product groups (HS 2-digit level)
2008 exports (US$
million)
Change 2008–2009
(%)
Change 2008–2011
(%) 2011 share
(%)
Overall
Electrical, electronic equipment (HS 85) 228,593 -15.6 9.4 10.3 Machinery, nuclear reactors, boilers (HS 84) 215,621 -21.6 -4.1 8.5 Pearls, precious stones, metals, coins, etc. (HS 71) 96,092 -0.3 67.3 6.6 Vehicles other than railway, tramway (HS 87) 118,875 -32.1 6.2 5.2 Ores, slag and ash (HS 26) 60,519 -14.2 80.2 4.5
Developed
Machinery, nuclear reactors, boilers, etc. (HS 84) 109,831 -22.5 -3.1 8.7 Vehicles other than railway, tramway (HS 87) 99,054 -34.9 2.4 8.3 Ores, slag and ash (HS 26) 41,925 -13.1 101.5 6.9 Pearls, precious stones, metals, coins, etc. (HS 71) 46,565 -22.0 36.7 5.2 Electrical, electronic equipment (HS 85) 58,877 -19.3 -7.8 4.5
Developing
Electrical, electronic equipment (HS 85) 169,336 -14.4 15.3 16.8 Machinery, nuclear reactors, boilers (HS 84) 105,494 -20.7 -5.2 8.6 Pearls, precious stones, metals, coins, etc. (HS 71) 48,232 20.9 96.1 8.1 Organic chemicals (HS 29) 25,412 -10.7 60.9 3.5 Plastic and thereof (HS 39) 19,826 -19.0 44.7 2.5
LDCs
Articles of apparel, accessories, knit or crochet (HS 61) 7,539 2.5 57.2 24.7 Articles of apparel, accessories, not knit or crochet (HS 62) 6,065 6.1 63.7 20.7 Copper and articles thereof (HS 74) 3,321 -11.3 106.7 14.3 Pearls, precious stones, metals, coins, etc. (HS 71) 1,294 -9.9 93.6 5.2 Ores, slag and ash (HS 26) 1,391 -14.1 34.0 3.9
Source: TradeMap. Note: “HS” stands for Harmonized System.
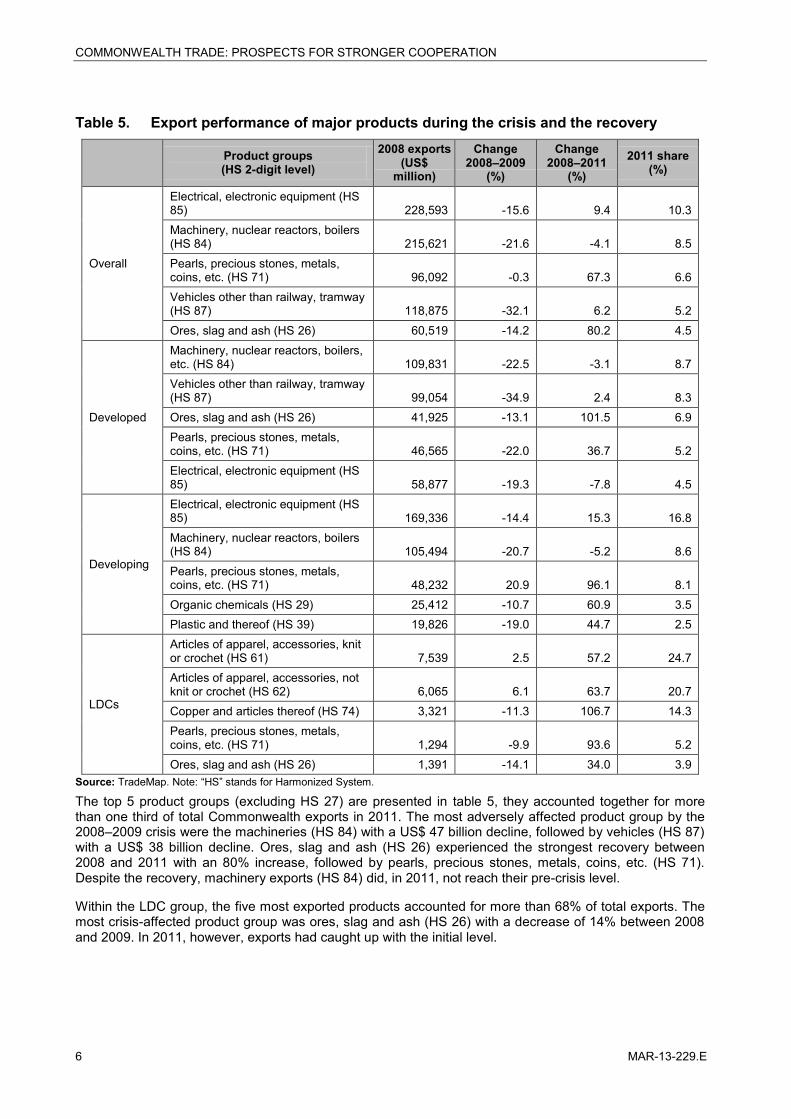
The top 5 product groups (excluding HS 27) are presented in table 5, they accounted together for more than one third of total Commonwealth exports in 2011. The most adversely affected product group by the 2008–2009 crisis were the machineries (HS 84) with a US$ 47 billion decline, followed by vehicles (HS 87) with a US$ 38 billion decline. Ores, slag and ash (HS 26) experienced the strongest recovery between 2008 and 2011 with an 80% increase, followed by pearls, precious stones, metals, coins, etc. (HS 71). Despite the recovery, machinery exports (HS 84) did, in 2011, not reach their pre-crisis level.
Within the LDC group, the five most exported products accounted for more than 68% of total exports. The most crisis-affected product group was ores, slag and ash (HS 26) with a decrease of 14% between 2008 and 2009. In 2011, however, exports had caught up with the initial level.
COMMONWEALTH TRADE: PROSPECTS FOR STRONGER COOPERATION
MAR-13-229.E 7
Chapter 2 Export performance
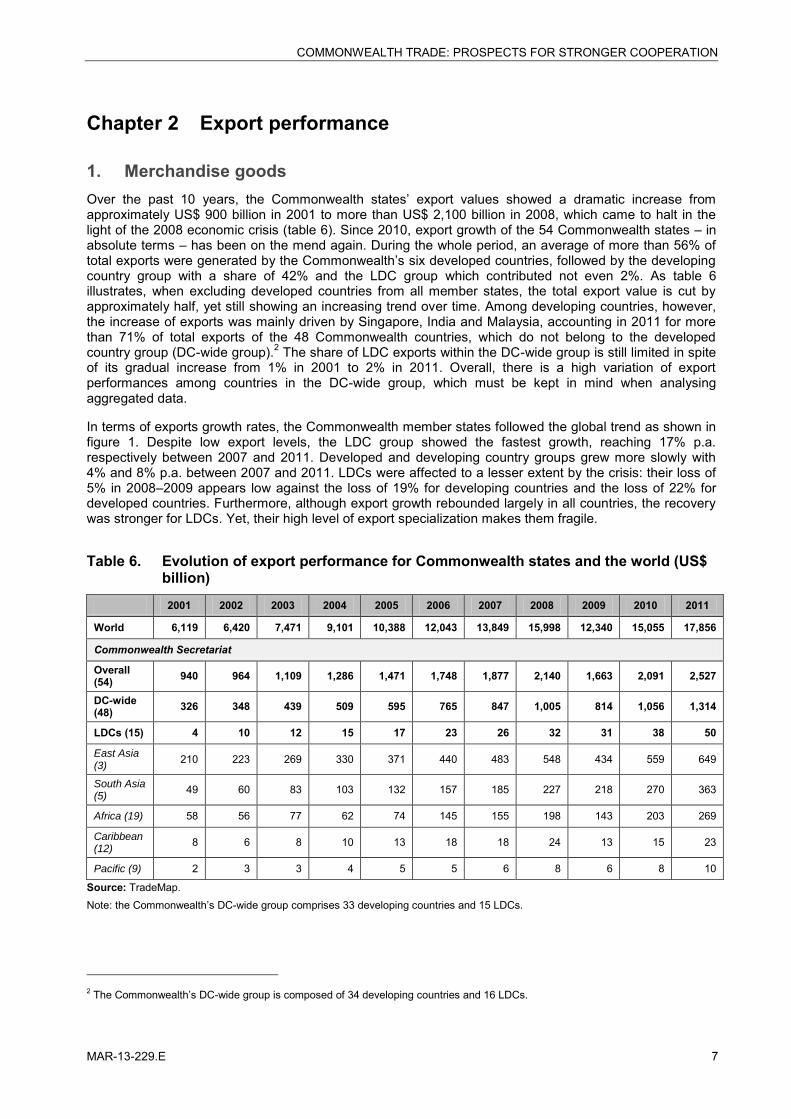
1. Merchandise goods Over the past 10 years, the Commonwealth states’ export values showed a dramatic increase from approximately US$ 900 billion in 2001 to more than US$ 2,100 billion in 2008, which came to halt in the light of the 2008 economic crisis (table 6). Since 2010, export growth of the 54 Commonwealth states – in absolute terms – has been on the mend again. During the whole period, an average of more than 56% of total exports were generated by the Commonwealth’s six developed countries, followed by the developing country group with a share of 42% and the LDC group which contributed not even 2%. As table 6 illustrates, when excluding developed countries from all member states, the total export value is cut by approximately half, yet still showing an increasing trend over time. Among developing countries, however, the increase of exports was mainly driven by Singapore, India and Malaysia, accounting in 2011 for more than 71% of total exports of the 48 Commonwealth countries, which do not belong to the developed country group (DC-wide group).2 The share of LDC exports within the DC-wide group is still limited in spite of its gradual increase from 1% in 2001 to 2% in 2011. Overall, there is a high variation of export performances among countries in the DC-wide group, which must be kept in mind when analysing aggregated data.
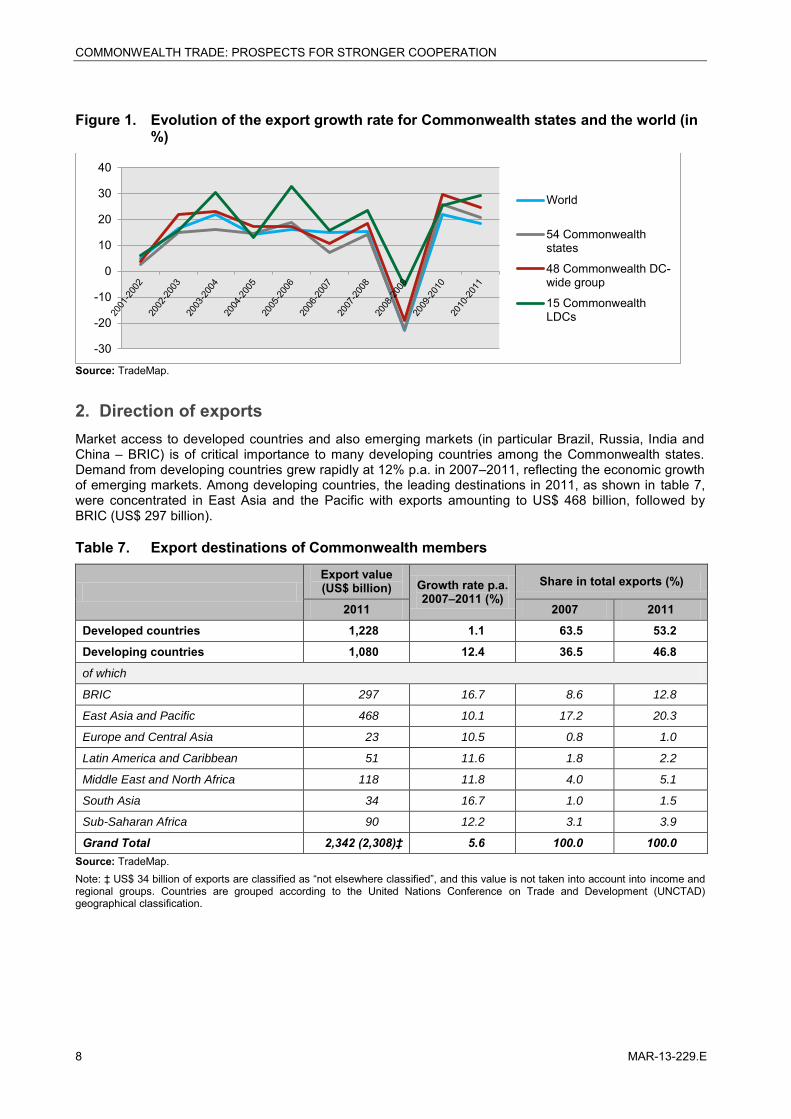
In terms of exports growth rates, the Commonwealth member states followed the global trend as shown in figure 1. Despite low export levels, the LDC group showed the fastest growth, reaching 17% p.a. respectively between 2007 and 2011. Developed and developing country groups grew more slowly with 4% and 8% p.a. between 2007 and 2011. LDCs were affected to a lesser extent by the crisis: their loss of 5% in 2008–2009 appears low against the loss of 19% for developing countries and the loss of 22% for developed countries. Furthermore, although export growth rebounded largely in all countries, the recovery was stronger for LDCs. Yet, their high level of export specialization makes them fragile.
Table 6. Evolution of export performance for Commonwealth states and the world (US$ billion)
2001 2002 2003 2004 2005 2006 2007 2008 2009 2010 2011
World 6,119 6,420 7,471 9,101 10,388 12,043 13,849 15,998 12,340 15,055 17,856
Commonwealth Secretariat
Overall (54) 940 964 1,109 1,286 1,471 1,748 1,877 2,140 1,663 2,091 2,527
DC-wide (48) 326 348 439 509 595 765 847 1,005 814 1,056 1,314
LDCs (15) 4 10 12 15 17 23 26 32 31 38 50
East Asia (3)
210 223 269 330 371 440 483 548 434 559 649
South Asia (5)
49 60 83 103 132 157 185 227 218 270 363
Africa (19) 58 56 77 62 74 145 155 198 143 203 269
Caribbean (12)
8 6 8 10 13 18 18 24 13 15 23
Pacific (9) 2 3 3 4 5 5 6 8 6 8 10
Source: TradeMap. Note: the Commonwealth’s DC-wide group comprises 33 developing countries and 15 LDCs.
2 The Commonwealth’s DC-wide group is composed of 34 developing countries and 16 LDCs.
COMMONWEALTH TRADE: PROSPECTS FOR STRONGER COOPERATION
8 MAR-13-229.E
Figure 1. Evolution of the export growth rate for Commonwealth states and the world (in %)
Source: TradeMap.
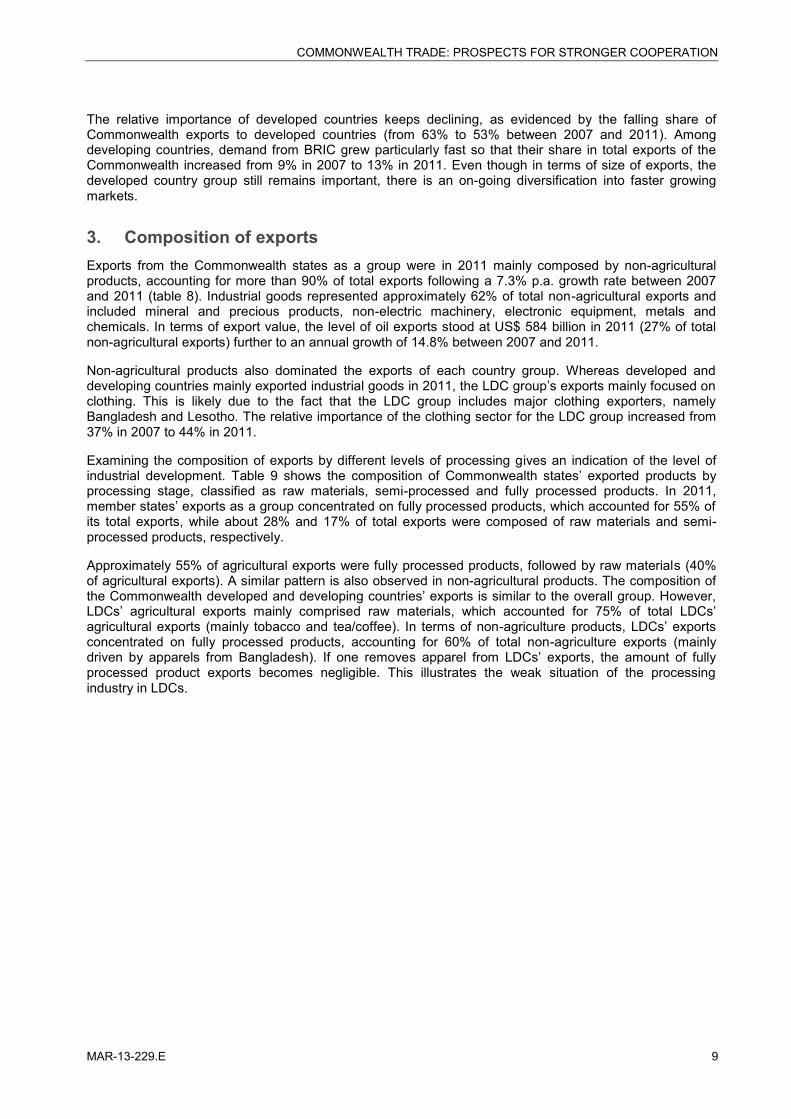
2. Direction of exports Market access to developed countries and also emerging markets (in particular Brazil, Russia, India and China – BRIC) is of critical importance to many developing countries among the Commonwealth states. Demand from developing countries grew rapidly at 12% p.a. in 2007–2011, reflecting the economic growth of emerging markets. Among developing countries, the leading destinations in 2011, as shown in table 7, were concentrated in East Asia and the Pacific with exports amounting to US$ 468 billion, followed by BRIC (US$ 297 billion).
Table 7. Export destinations of Commonwealth members
Export value (US$ billion) Growth rate p.a.
2007–2011 (%) Share in total exports (%)
2011 2007 2011
Developed countries 1,228 1.1 63.5 53.2
Developing countries 1,080 12.4 36.5 46.8
of which
BRIC 297 16.7 8.6 12.8
East Asia and Pacific 468 10.1 17.2 20.3
Europe and Central Asia 23 10.5 0.8 1.0
Latin America and Caribbean 51 11.6 1.8 2.2
Middle East and North Africa 118 11.8 4.0 5.1
South Asia 34 16.7 1.0 1.5
Sub-Saharan Africa 90 12.2 3.1 3.9
Grand Total 2,342 (2,308)‡ 5.6 100.0 100.0 Source: TradeMap. Note: ‡ US$ 34 billion of exports are classified as “not elsewhere classified”, and this value is not taken into account into income and regional groups. Countries are grouped according to the United Nations Conference on Trade and Development (UNCTAD) geographical classification.
-30
-20
-10
0
10
20
30
40
World
54 Commonwealthstates
48 Commonwealth DC-wide group
15 CommonwealthLDCs
COMMONWEALTH TRADE: PROSPECTS FOR STRONGER COOPERATION
MAR-13-229.E 9
The relative importance of developed countries keeps declining, as evidenced by the falling share of Commonwealth exports to developed countries (from 63% to 53% between 2007 and 2011). Among developing countries, demand from BRIC grew particularly fast so that their share in total exports of the Commonwealth increased from 9% in 2007 to 13% in 2011. Even though in terms of size of exports, the developed country group still remains important, there is an on-going diversification into faster growing markets.
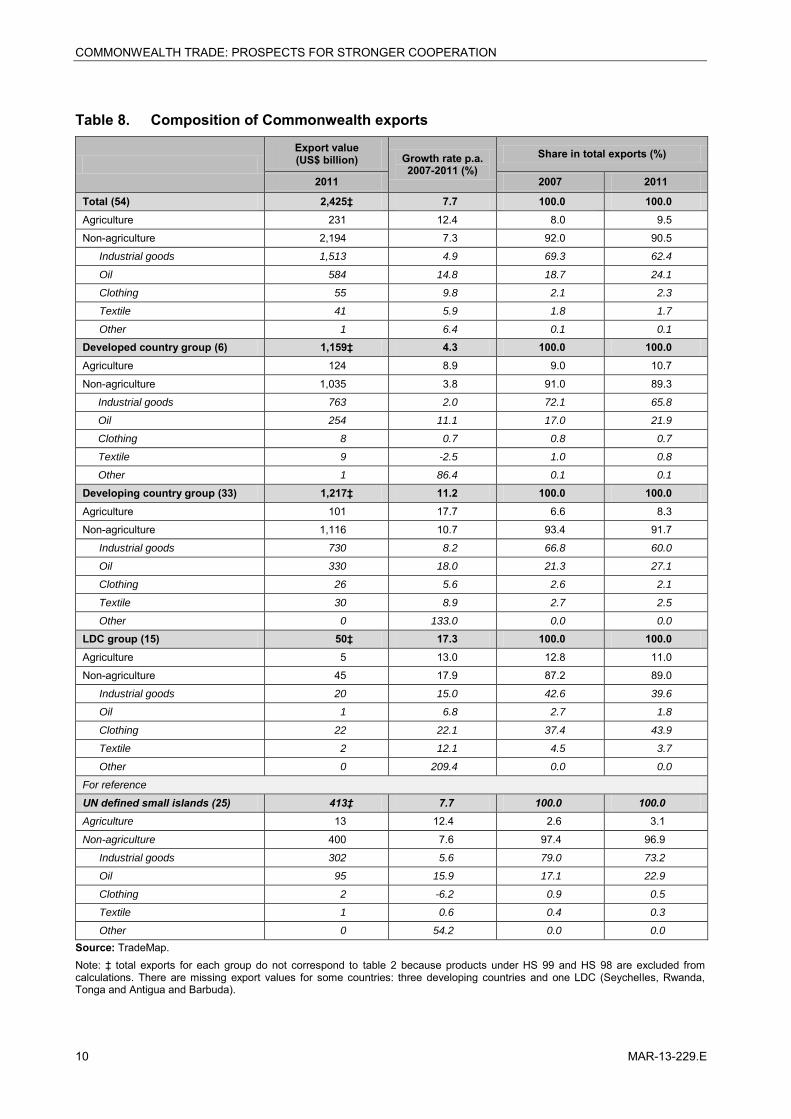
3. Composition of exports Exports from the Commonwealth states as a group were in 2011 mainly composed by non-agricultural products, accounting for more than 90% of total exports following a 7.3% p.a. growth rate between 2007 and 2011 (table 8). Industrial goods represented approximately 62% of total non-agricultural exports and included mineral and precious products, non-electric machinery, electronic equipment, metals and chemicals. In terms of export value, the level of oil exports stood at US$ 584 billion in 2011 (27% of total non-agricultural exports) further to an annual growth of 14.8% between 2007 and 2011.
Non-agricultural products also dominated the exports of each country group. Whereas developed and developing countries mainly exported industrial goods in 2011, the LDC group’s exports mainly focused on clothing. This is likely due to the fact that the LDC group includes major clothing exporters, namely Bangladesh and Lesotho. The relative importance of the clothing sector for the LDC group increased from 37% in 2007 to 44% in 2011.
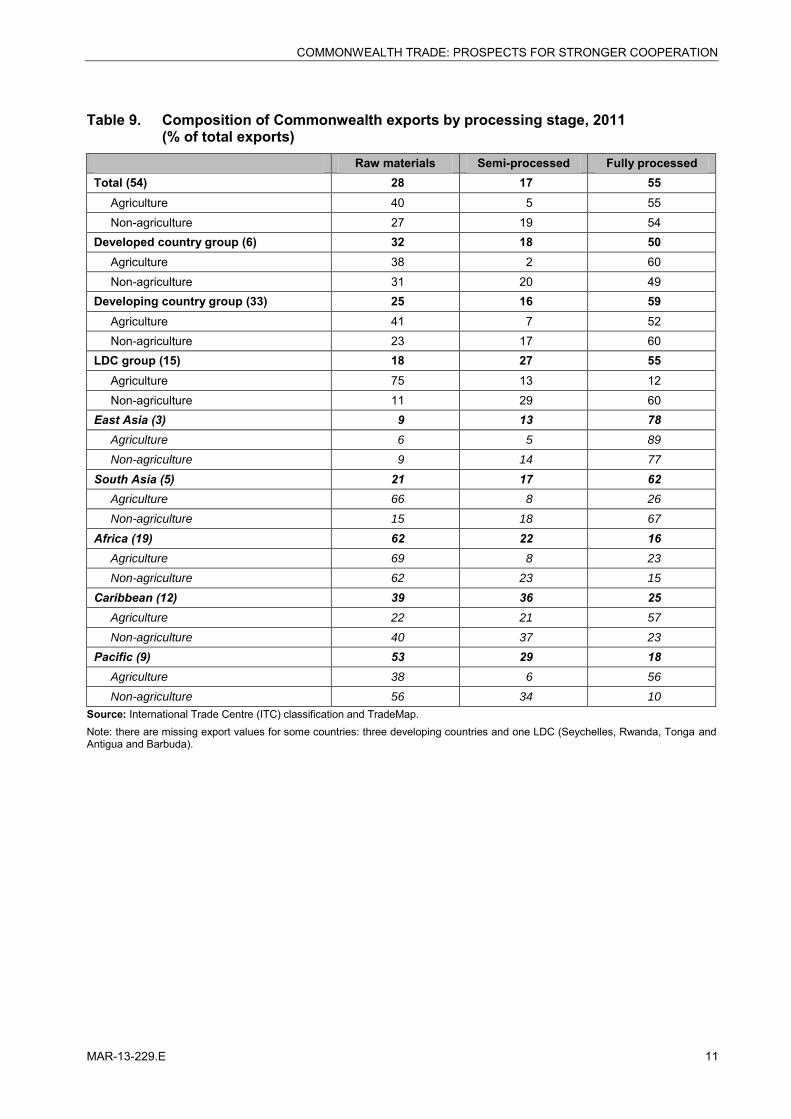
Examining the composition of exports by different levels of processing gives an indication of the level of industrial development. Table 9 shows the composition of Commonwealth states’ exported products by processing stage, classified as raw materials, semi-processed and fully processed products. In 2011, member states’ exports as a group concentrated on fully processed products, which accounted for 55% of its total exports, while about 28% and 17% of total exports were composed of raw materials and semi-processed products, respectively.
Approximately 55% of agricultural exports were fully processed products, followed by raw materials (40% of agricultural exports). A similar pattern is also observed in non-agricultural products. The composition of the Commonwealth developed and developing countries’ exports is similar to the overall group. However, LDCs’ agricultural exports mainly comprised raw materials, which accounted for 75% of total LDCs’ agricultural exports (mainly tobacco and tea/coffee). In terms of non-agriculture products, LDCs’ exports concentrated on fully processed products, accounting for 60% of total non-agriculture exports (mainly driven by apparels from Bangladesh). If one removes apparel from LDCs’ exports, the amount of fully processed product exports becomes negligible. This illustrates the weak situation of the processing industry in LDCs.
COMMONWEALTH TRADE: PROSPECTS FOR STRONGER COOPERATION
10 MAR-13-229.E
Table 8. Composition of Commonwealth exports
Export value (US$ billion) Growth rate p.a.
2007-2011 (%) Share in total exports (%)
2011 2007 2011
Total (54) 2,425‡ 7.7 100.0 100.0 Agriculture 231 12.4 8.0 9.5
Non-agriculture 2,194 7.3 92.0 90.5
Industrial goods 1,513 4.9 69.3 62.4
Oil 584 14.8 18.7 24.1
Clothing 55 9.8 2.1 2.3
Textile 41 5.9 1.8 1.7
Other 1 6.4 0.1 0.1
Developed country group (6) 1,159‡ 4.3 100.0 100.0 Agriculture 124 8.9 9.0 10.7
Non-agriculture 1,035 3.8 91.0 89.3
Industrial goods 763 2.0 72.1 65.8
Oil 254 11.1 17.0 21.9
Clothing 8 0.7 0.8 0.7
Textile 9 -2.5 1.0 0.8
Other 1 86.4 0.1 0.1
Developing country group (33) 1,217‡ 11.2 100.0 100.0 Agriculture 101 17.7 6.6 8.3
Non-agriculture 1,116 10.7 93.4 91.7
Industrial goods 730 8.2 66.8 60.0
Oil 330 18.0 21.3 27.1
Clothing 26 5.6 2.6 2.1
Textile 30 8.9 2.7 2.5
Other 0 133.0 0.0 0.0
LDC group (15) 50‡ 17.3 100.0 100.0 Agriculture 5 13.0 12.8 11.0
Non-agriculture 45 17.9 87.2 89.0
Industrial goods 20 15.0 42.6 39.6
Oil 1 6.8 2.7 1.8
Clothing 22 22.1 37.4 43.9
Textile 2 12.1 4.5 3.7
Other 0 209.4 0.0 0.0
For reference
UN defined small islands (25) 413‡ 7.7 100.0 100.0 Agriculture 13 12.4 2.6 3.1
Non-agriculture 400 7.6 97.4 96.9
Industrial goods 302 5.6 79.0 73.2
Oil 95 15.9 17.1 22.9
Clothing 2 -6.2 0.9 0.5
Textile 1 0.6 0.4 0.3
Other 0 54.2 0.0 0.0
Source: TradeMap. Note: ‡ total exports for each group do not correspond to table 2 because products under HS 99 and HS 98 are excluded from calculations. There are missing export values for some countries: three developing countries and one LDC (Seychelles, Rwanda, Tonga and Antigua and Barbuda).
COMMONWEALTH TRADE: PROSPECTS FOR STRONGER COOPERATION
MAR-13-229.E 11
Table 9. Composition of Commonwealth exports by processing stage, 2011 (% of total exports)
Raw materials Semi-processed Fully processed Total (54) 28 17 55 Agriculture 40 5 55 Non-agriculture 27 19 54 Developed country group (6) 32 18 50 Agriculture 38 2 60 Non-agriculture 31 20 49 Developing country group (33) 25 16 59 Agriculture 41 7 52 Non-agriculture 23 17 60 LDC group (15) 18 27 55 Agriculture 75 13 12 Non-agriculture 11 29 60 East Asia (3) 9 13 78 Agriculture 6 5 89
Non-agriculture 9 14 77
South Asia (5) 21 17 62 Agriculture 66 8 26
Non-agriculture 15 18 67
Africa (19) 62 22 16 Agriculture 69 8 23
Non-agriculture 62 23 15
Caribbean (12) 39 36 25 Agriculture 22 21 57
Non-agriculture 40 37 23
Pacific (9) 53 29 18 Agriculture 38 6 56
Non-agriculture 56 34 10
Source: International Trade Centre (ITC) classification and TradeMap. Note: there are missing export values for some countries: three developing countries and one LDC (Seychelles, Rwanda, Tonga and Antigua and Barbuda).
COMMONWEALTH TRADE: PROSPECTS FOR STRONGER COOPERATION
12 MAR-13-229.E
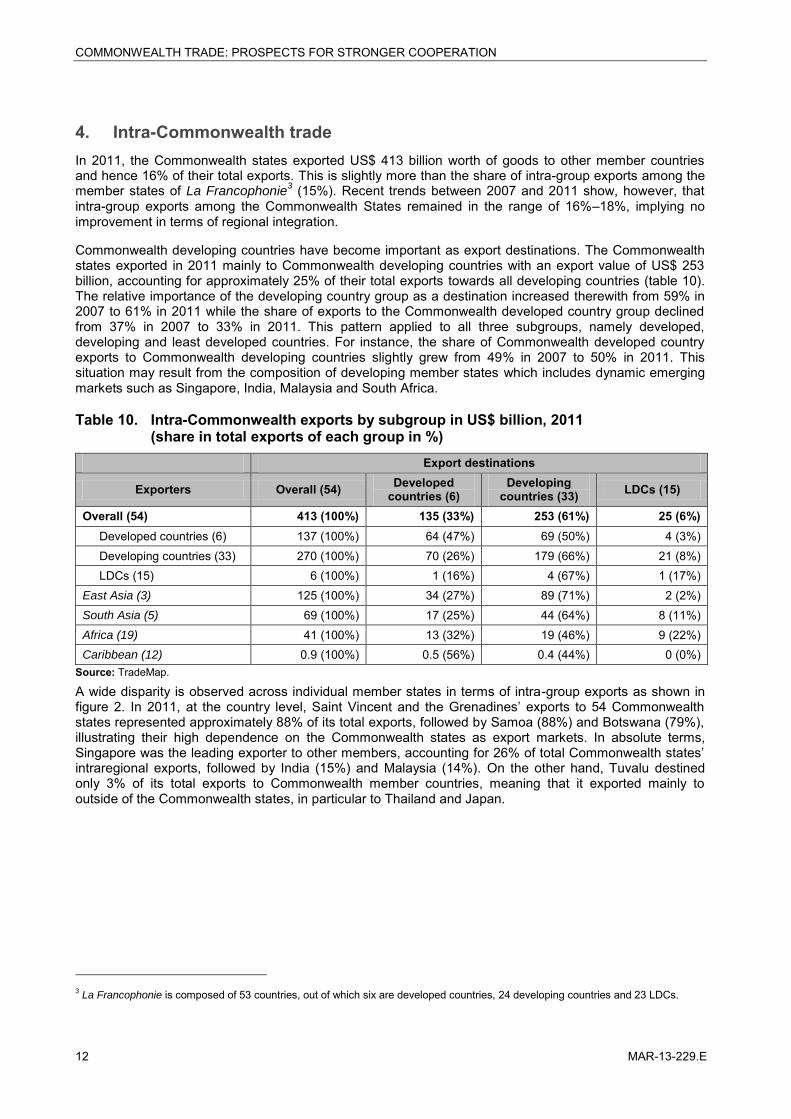
4. Intra-Commonwealth trade In 2011, the Commonwealth states exported US$ 413 billion worth of goods to other member countries and hence 16% of their total exports. This is slightly more than the share of intra-group exports among the member states of La Francophonie
3 (15%). Recent trends between 2007 and 2011 show, however, that intra-group exports among the Commonwealth States remained in the range of 16%–18%, implying no improvement in terms of regional integration.
Commonwealth developing countries have become important as export destinations. The Commonwealth states exported in 2011 mainly to Commonwealth developing countries with an export value of US$ 253 billion, accounting for approximately 25% of their total exports towards all developing countries (table 10). The relative importance of the developing country group as a destination increased therewith from 59% in 2007 to 61% in 2011 while the share of exports to the Commonwealth developed country group declined from 37% in 2007 to 33% in 2011. This pattern applied to all three subgroups, namely developed, developing and least developed countries. For instance, the share of Commonwealth developed country exports to Commonwealth developing countries slightly grew from 49% in 2007 to 50% in 2011. This situation may result from the composition of developing member states which includes dynamic emerging markets such as Singapore, India, Malaysia and South Africa.
Table 10. Intra-Commonwealth exports by subgroup in US$ billion, 2011 (share in total exports of each group in %)
Export destinations
Exporters Overall (54) Developed countries (6)
Developing countries (33) LDCs (15)
Overall (54) 413 (100%) 135 (33%) 253 (61%) 25 (6%) Developed countries (6) 137 (100%) 64 (47%) 69 (50%) 4 (3%) Developing countries (33) 270 (100%) 70 (26%) 179 (66%) 21 (8%) LDCs (15) 6 (100%) 1 (16%) 4 (67%) 1 (17%) East Asia (3) 125 (100%) 34 (27%) 89 (71%) 2 (2%) South Asia (5) 69 (100%) 17 (25%) 44 (64%) 8 (11%) Africa (19) 41 (100%) 13 (32%) 19 (46%) 9 (22%) Caribbean (12) 0.9 (100%) 0.5 (56%) 0.4 (44%) 0 (0%)
Source: TradeMap.
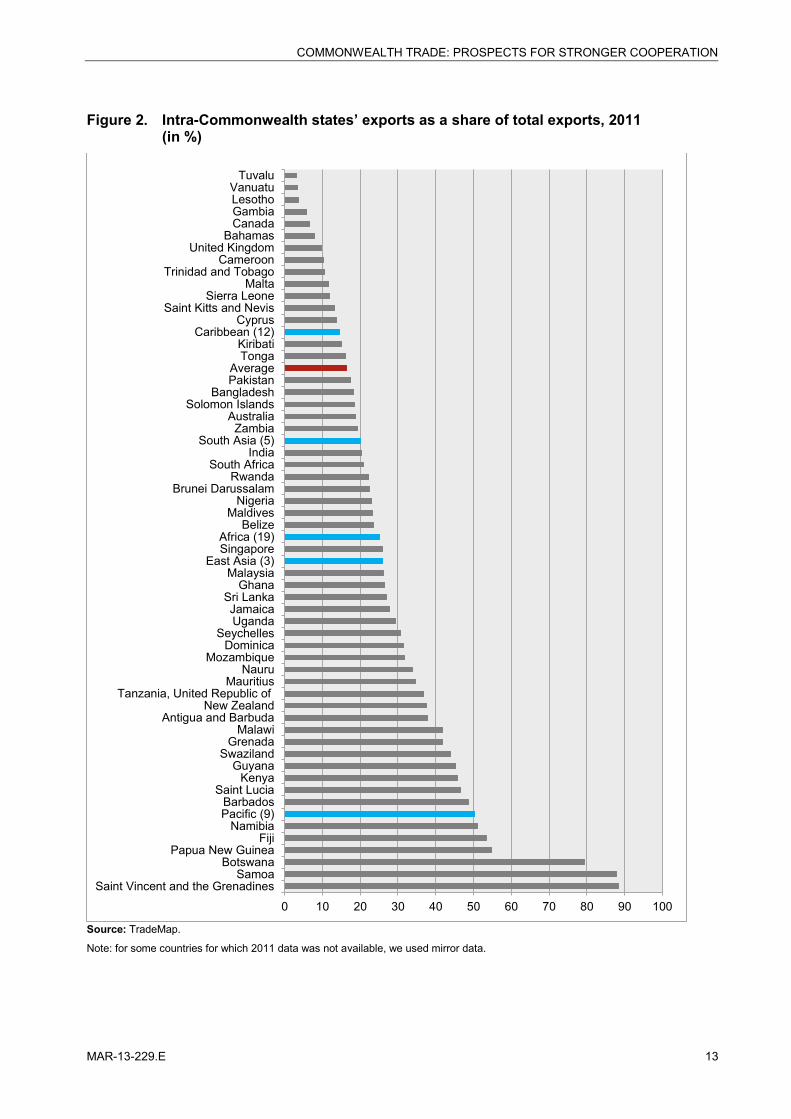
A wide disparity is observed across individual member states in terms of intra-group exports as shown in figure 2. In 2011, at the country level, Saint Vincent and the Grenadines’ exports to 54 Commonwealth states represented approximately 88% of its total exports, followed by Samoa (88%) and Botswana (79%), illustrating their high dependence on the Commonwealth states as export markets. In absolute terms, Singapore was the leading exporter to other members, accounting for 26% of total Commonwealth states’ intraregional exports, followed by India (15%) and Malaysia (14%). On the other hand, Tuvalu destined only 3% of its total exports to Commonwealth member countries, meaning that it exported mainly to outside of the Commonwealth states, in particular to Thailand and Japan.
3 La Francophonie is composed of 53 countries, out of which six are developed countries, 24 developing countries and 23 LDCs.
COMMONWEALTH TRADE: PROSPECTS FOR STRONGER COOPERATION
MAR-13-229.E 13
Figure 2. Intra-Commonwealth states’ exports as a share of total exports, 2011 (in %)
Source: TradeMap.
Note: for some countries for which 2011 data was not available, we used mirror data.
0 10 20 30 40 50 60 70 80 90 100
Saint Vincent and the GrenadinesSamoa
BotswanaPapua New Guinea
FijiNamibia
Pacific (9)Barbados
Saint LuciaKenya
GuyanaSwaziland
GrenadaMalawi
Antigua and BarbudaNew Zealand
Tanzania, United Republic ofMauritius
NauruMozambique
DominicaSeychelles
UgandaJamaica
Sri LankaGhana
MalaysiaEast Asia (3)
SingaporeAfrica (19)
BelizeMaldives
NigeriaBrunei Darussalam
RwandaSouth Africa
IndiaSouth Asia (5)
ZambiaAustralia
Solomon IslandsBangladesh
PakistanAverage
TongaKiribati
Caribbean (12)Cyprus
Saint Kitts and NevisSierra Leone
MaltaTrinidad and Tobago
CameroonUnited Kingdom
BahamasCanadaGambiaLesothoVanuatu
Tuvalu
COMMONWEALTH TRADE: PROSPECTS FOR STRONGER COOPERATION
14 MAR-13-229.E
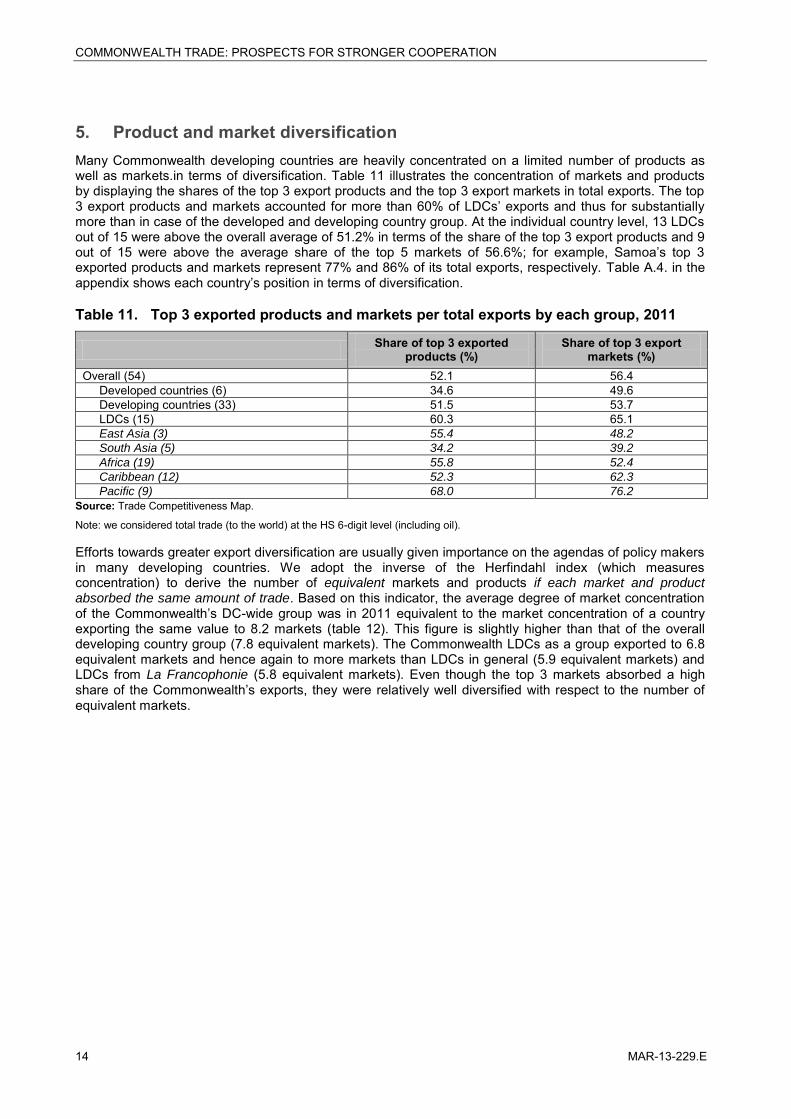
5. Product and market diversification Many Commonwealth developing countries are heavily concentrated on a limited number of products as well as markets.in terms of diversification. Table 11 illustrates the concentration of markets and products by displaying the shares of the top 3 export products and the top 3 export markets in total exports. The top 3 export products and markets accounted for more than 60% of LDCs’ exports and thus for substantially more than in case of the developed and developing country group. At the individual country level, 13 LDCs out of 15 were above the overall average of 51.2% in terms of the share of the top 3 export products and 9 out of 15 were above the average share of the top 5 markets of 56.6%; for example, Samoa’s top 3 exported products and markets represent 77% and 86% of its total exports, respectively. Table A.4. in the appendix shows each country’s position in terms of diversification.
Table 11. Top 3 exported products and markets per total exports by each group, 2011
Share of top 3 exported products (%)
Share of top 3 export markets (%)
Overall (54) 52.1 56.4 Developed countries (6) 34.6 49.6 Developing countries (33) 51.5 53.7 LDCs (15) 60.3 65.1 East Asia (3) 55.4 48.2
South Asia (5) 34.2 39.2
Africa (19) 55.8 52.4
Caribbean (12) 52.3 62.3
Pacific (9) 68.0 76.2
Source: Trade Competitiveness Map.
Note: we considered total trade (to the world) at the HS 6-digit level (including oil).
Efforts towards greater export diversification are usually given importance on the agendas of policy makers in many developing countries. We adopt the inverse of the Herfindahl index (which measures concentration) to derive the number of equivalent markets and products if each market and product absorbed the same amount of trade. Based on this indicator, the average degree of market concentration of the Commonwealth’s DC-wide group was in 2011 equivalent to the market concentration of a country exporting the same value to 8.2 markets (table 12). This figure is slightly higher than that of the overall developing country group (7.8 equivalent markets). The Commonwealth LDCs as a group exported to 6.8 equivalent markets and hence again to more markets than LDCs in general (5.9 equivalent markets) and LDCs from La Francophonie (5.8 equivalent markets). Even though the top 3 markets absorbed a high share of the Commonwealth’s exports, they were relatively well diversified with respect to the number of equivalent markets.
COMMONWEALTH TRADE: PROSPECTS FOR STRONGER COOPERATION
MAR-13-229.E 15
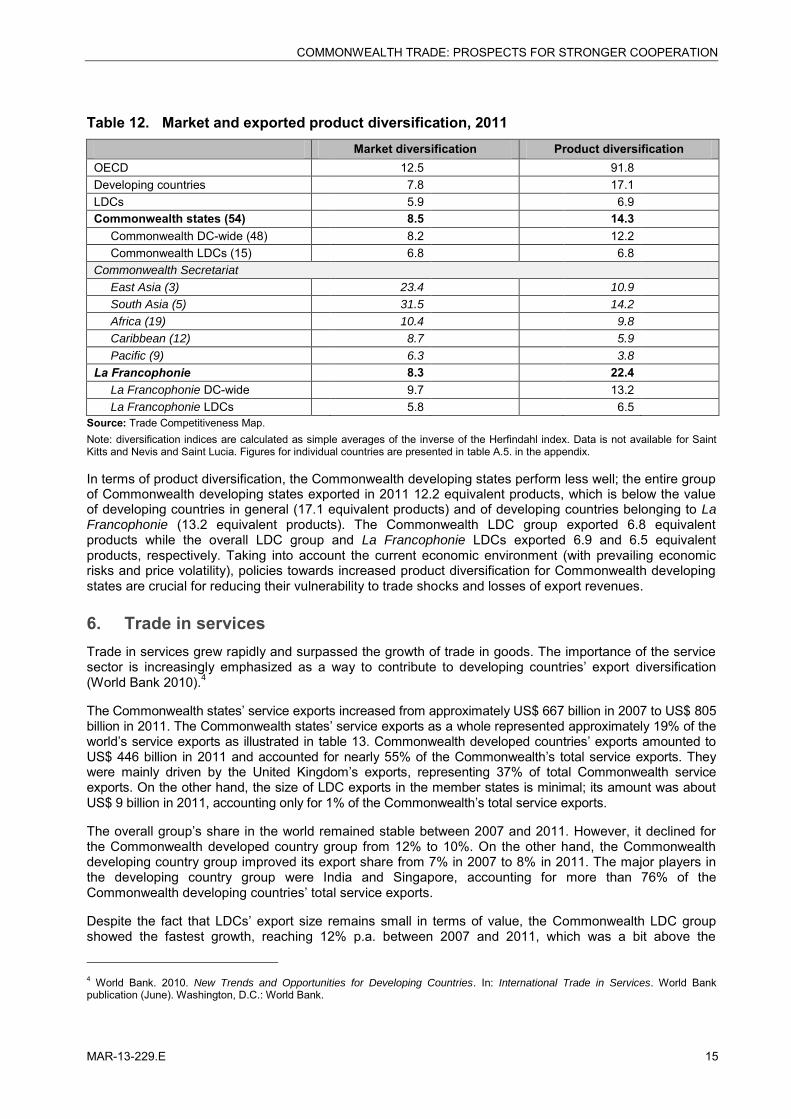
Table 12. Market and exported product diversification, 2011 Market diversification Product diversification
OECD 12.5 91.8 Developing countries 7.8 17.1 LDCs 5.9 6.9 Commonwealth states (54) 8.5 14.3 Commonwealth DC-wide (48) 8.2 12.2 Commonwealth LDCs (15) 6.8 6.8 Commonwealth Secretariat
East Asia (3) 23.4 10.9
South Asia (5) 31.5 14.2
Africa (19) 10.4 9.8
Caribbean (12) 8.7 5.9
Pacific (9) 6.3 3.8
La Francophonie 8.3 22.4 La Francophonie DC-wide 9.7 13.2 La Francophonie LDCs 5.8 6.5
Source: Trade Competitiveness Map. Note: diversification indices are calculated as simple averages of the inverse of the Herfindahl index. Data is not available for Saint Kitts and Nevis and Saint Lucia. Figures for individual countries are presented in table A.5. in the appendix.
In terms of product diversification, the Commonwealth developing states perform less well; the entire group of Commonwealth developing states exported in 2011 12.2 equivalent products, which is below the value of developing countries in general (17.1 equivalent products) and of developing countries belonging to La Francophonie (13.2 equivalent products). The Commonwealth LDC group exported 6.8 equivalent products while the overall LDC group and La Francophonie LDCs exported 6.9 and 6.5 equivalent products, respectively. Taking into account the current economic environment (with prevailing economic risks and price volatility), policies towards increased product diversification for Commonwealth developing states are crucial for reducing their vulnerability to trade shocks and losses of export revenues.
6. Trade in services Trade in services grew rapidly and surpassed the growth of trade in goods. The importance of the service sector is increasingly emphasized as a way to contribute to developing countries’ export diversification (World Bank 2010).4
The Commonwealth states’ service exports increased from approximately US$ 667 billion in 2007 to US$ 805 billion in 2011. The Commonwealth states’ service exports as a whole represented approximately 19% of the world’s service exports as illustrated in table 13. Commonwealth developed countries’ exports amounted to US$ 446 billion in 2011 and accounted for nearly 55% of the Commonwealth’s total service exports. They were mainly driven by the United Kingdom’s exports, representing 37% of total Commonwealth service exports. On the other hand, the size of LDC exports in the member states is minimal; its amount was about US$ 9 billion in 2011, accounting only for 1% of the Commonwealth’s total service exports.
The overall group’s share in the world remained stable between 2007 and 2011. However, it declined for the Commonwealth developed country group from 12% to 10%. On the other hand, the Commonwealth developing country group improved its export share from 7% in 2007 to 8% in 2011. The major players in the developing country group were India and Singapore, accounting for more than 76% of the Commonwealth developing countries’ total service exports.
Despite the fact that LDCs’ export size remains small in terms of value, the Commonwealth LDC group showed the fastest growth, reaching 12% p.a. between 2007 and 2011, which was a bit above the
4 World Bank. 2010. New Trends and Opportunities for Developing Countries. In: International Trade in Services. World Bank publication (June). Washington, D.C.: World Bank.
COMMONWEALTH TRADE: PROSPECTS FOR STRONGER COOPERATION
16 MAR-13-229.E
developing country group’s growth rate and significantly higher than the Commonwealth developed country group with a 2% p.a. growth rate over the same period.
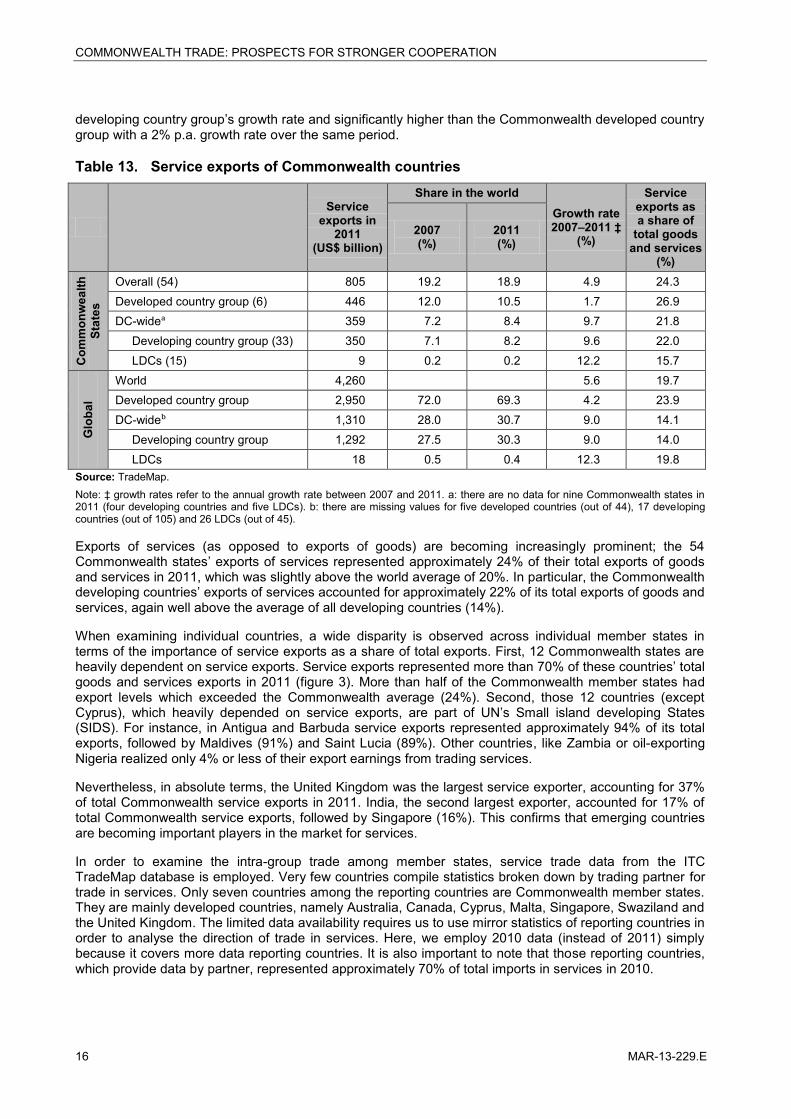
Table 13. Service exports of Commonwealth countries
Service exports in
2011 (US$ billion)
Share in the world Growth rate 2007–2011 ‡
(%)
Service exports as a share of
total goods and services
(%)
2007 (%)
2011 (%)
Com
mon
wea
lth
Stat
es
Overall (54) 805 19.2 18.9 4.9 24.3 Developed country group (6) 446 12.0 10.5 1.7 26.9 DC-wideᵃ 359 7.2 8.4 9.7 21.8 Developing country group (33) 350 7.1 8.2 9.6 22.0 LDCs (15) 9 0.2 0.2 12.2 15.7
Glo
bal
World 4,260
5.6 19.7
Developed country group 2,950 72.0 69.3 4.2 23.9 DC-wideᵇ 1,310 28.0 30.7 9.0 14.1 Developing country group 1,292 27.5 30.3 9.0 14.0 LDCs 18 0.5 0.4 12.3 19.8
Source: TradeMap. Note: ‡ growth rates refer to the annual growth rate between 2007 and 2011. a: there are no data for nine Commonwealth states in 2011 (four developing countries and five LDCs). b: there are missing values for five developed countries (out of 44), 17 developing countries (out of 105) and 26 LDCs (out of 45).
Exports of services (as opposed to exports of goods) are becoming increasingly prominent; the 54 Commonwealth states’ exports of services represented approximately 24% of their total exports of goods and services in 2011, which was slightly above the world average of 20%. In particular, the Commonwealth developing countries’ exports of services accounted for approximately 22% of its total exports of goods and services, again well above the average of all developing countries (14%).
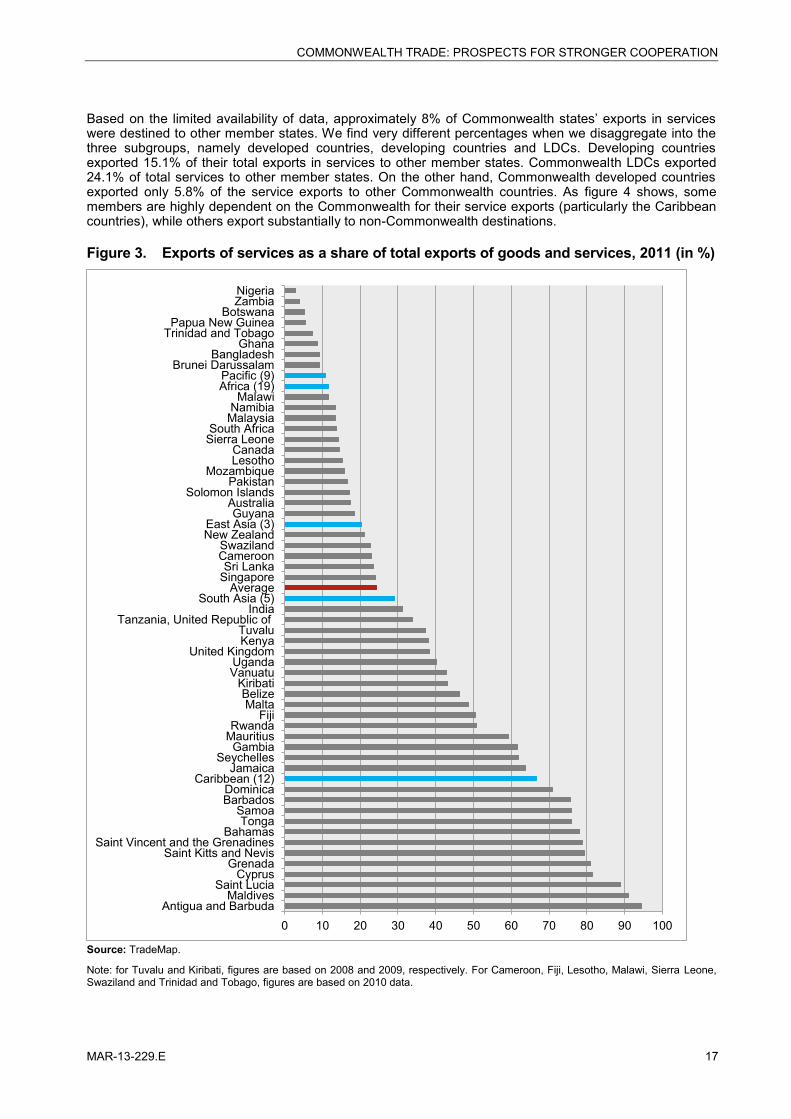
When examining individual countries, a wide disparity is observed across individual member states in terms of the importance of service exports as a share of total exports. First, 12 Commonwealth states are heavily dependent on service exports. Service exports represented more than 70% of these countries’ total goods and services exports in 2011 (figure 3). More than half of the Commonwealth member states had export levels which exceeded the Commonwealth average (24%). Second, those 12 countries (except Cyprus), which heavily depended on service exports, are part of UN’s Small island developing States (SIDS). For instance, in Antigua and Barbuda service exports represented approximately 94% of its total exports, followed by Maldives (91%) and Saint Lucia (89%). Other countries, like Zambia or oil-exporting Nigeria realized only 4% or less of their export earnings from trading services.
Nevertheless, in absolute terms, the United Kingdom was the largest service exporter, accounting for 37% of total Commonwealth service exports in 2011. India, the second largest exporter, accounted for 17% of total Commonwealth service exports, followed by Singapore (16%). This confirms that emerging countries are becoming important players in the market for services.
In order to examine the intra-group trade among member states, service trade data from the ITC TradeMap database is employed. Very few countries compile statistics broken down by trading partner for trade in services. Only seven countries among the reporting countries are Commonwealth member states. They are mainly developed countries, namely Australia, Canada, Cyprus, Malta, Singapore, Swaziland and the United Kingdom. The limited data availability requires us to use mirror statistics of reporting countries in order to analyse the direction of trade in services. Here, we employ 2010 data (instead of 2011) simply because it covers more data reporting countries. It is also important to note that those reporting countries, which provide data by partner, represented approximately 70% of total imports in services in 2010.
COMMONWEALTH TRADE: PROSPECTS FOR STRONGER COOPERATION
MAR-13-229.E 17
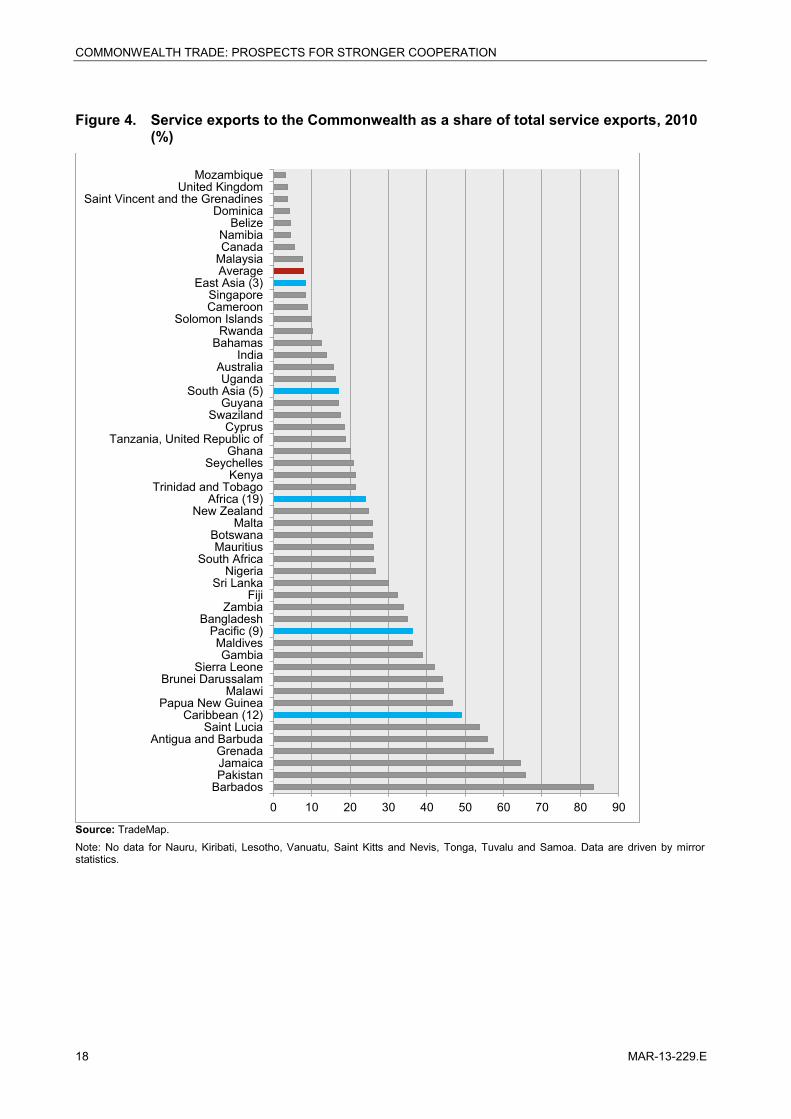
Based on the limited availability of data, approximately 8% of Commonwealth states’ exports in services were destined to other member states. We find very different percentages when we disaggregate into the three subgroups, namely developed countries, developing countries and LDCs. Developing countries exported 15.1% of their total exports in services to other member states. Commonwealth LDCs exported 24.1% of total services to other member states. On the other hand, Commonwealth developed countries exported only 5.8% of the service exports to other Commonwealth countries. As figure 4 shows, some members are highly dependent on the Commonwealth for their service exports (particularly the Caribbean countries), while others export substantially to non-Commonwealth destinations.
Figure 3. Exports of services as a share of total exports of goods and services, 2011 (in %)
Source: TradeMap.
Note: for Tuvalu and Kiribati, figures are based on 2008 and 2009, respectively. For Cameroon, Fiji, Lesotho, Malawi, Sierra Leone, Swaziland and Trinidad and Tobago, figures are based on 2010 data.
0 10 20 30 40 50 60 70 80 90 100Antigua and Barbuda
MaldivesSaint Lucia
CyprusGrenada
Saint Kitts and NevisSaint Vincent and the Grenadines
BahamasTonga
SamoaBarbadosDominica
Caribbean (12)Jamaica
SeychellesGambia
MauritiusRwanda
FijiMalta
BelizeKiribati
VanuatuUganda
United KingdomKenyaTuvalu
Tanzania, United Republic ofIndia
South Asia (5)Average
SingaporeSri Lanka
CameroonSwaziland
New ZealandEast Asia (3)
GuyanaAustralia
Solomon IslandsPakistan
MozambiqueLesothoCanada
Sierra LeoneSouth Africa
MalaysiaNamibia
MalawiAfrica (19)Pacific (9)
Brunei DarussalamBangladesh
GhanaTrinidad and TobagoPapua New Guinea
BotswanaZambiaNigeria
COMMONWEALTH TRADE: PROSPECTS FOR STRONGER COOPERATION
18 MAR-13-229.E
Figure 4. Service exports to the Commonwealth as a share of total service exports, 2010 (%)
Source: TradeMap. Note: No data for Nauru, Kiribati, Lesotho, Vanuatu, Saint Kitts and Nevis, Tonga, Tuvalu and Samoa. Data are driven by mirror statistics.
0 10 20 30 40 50 60 70 80 90
BarbadosPakistanJamaicaGrenada
Antigua and BarbudaSaint Lucia
Caribbean (12)Papua New Guinea
MalawiBrunei Darussalam
Sierra LeoneGambia
MaldivesPacific (9)
BangladeshZambia
FijiSri Lanka
NigeriaSouth Africa
MauritiusBotswana
MaltaNew Zealand
Africa (19)Trinidad and Tobago
KenyaSeychelles
GhanaTanzania, United Republic of
CyprusSwaziland
GuyanaSouth Asia (5)
UgandaAustralia
IndiaBahamas
RwandaSolomon Islands
CameroonSingapore
East Asia (3)AverageMalaysiaCanadaNamibia
BelizeDominica
Saint Vincent and the GrenadinesUnited Kingdom
Mozambique
COMMONWEALTH TRADE: PROSPECTS FOR STRONGER COOPERATION
MAR-13-229.E 19
Chapter 3 Market access and trade agreements
1. Scope for Commonwealth economic cooperation Conventional thinking among trade policy experts and policy makers suggests that a free trade area of the Commonwealth would be an utter impossibility for legal and political reasons.
From a legal point of view, it is frequently observed that several of the developed Commonwealth countries have entered into deep regional integration, most notably the United Kingdom as a member of the European Union (EU). Any member of the EU has taken on obligations in accordance with the “Acquis Communautaire”. One particularly important aspect is that the EU represents the United Kingdom and its other members on issues of international trade at the multilateral level, because international trade is the competence of the EU, not of the individual member state. Therefore, it is often argued that the United Kingdom cannot enter into any kind of trade agreement. This is not entirely correct. While trade is the competence of the EU, economic cooperation remains within the competence and responsibility of the individual member states. Hence, there is ample scope for the United Kingdom and other EU members to enter into specific international economic cooperation agreements, provided that these are fully compatible with the other international obligations of the United Kingdom.
From a political perspective, it is often argued that any agreement between countries at different stages of development and with different standards in terms of public policy formulation and political and administrative governance is not feasible. Although there is ample evidence of difficulties in the political and economic relations between divergent countries, the specific advantage of the Commonwealth is precisely that its members have an underlying homogeneity. This is most directly reflected through the use of the same language – English – and similarity of their administrative and judicial systems.
In summary, it should be emphasized that this study is not advocating any free trade agreement (FTA) for the Commonwealth. Nevertheless, ‘partial scope agreements’ aiming at an enhanced and facilitated economic cooperation between some (or all) of the member countries of the Commonwealth could be an instrument to improve trade relations. Such partial scope agreement may even be bilateral or trilateral, involving merely two or three countries. They could also be partial in the sense that they would deal with trade facilitation issues in the broad sense, not with trade in the narrow sense.
The scope and desirability of economic cooperation agreements and programmes keeps being brought to the fore by the ComSec. A background paper of the 2011 meeting of Commonwealth Senior Finance Official concluded:5
Regional collaboration also provides opportunities to strengthen economic, trade and investment links and it can be more cost effective than administering cooperation programmes on other continents. […] The Commonwealth
Secretariat provides a forum for both intraregional and interregional cooperation of its member states.
The potential for strengthening economic cooperation has been pursued in certain elements of the Commonwealth work programme, e.g. the ComSec / Asian Development Bank Pacific Plan.6
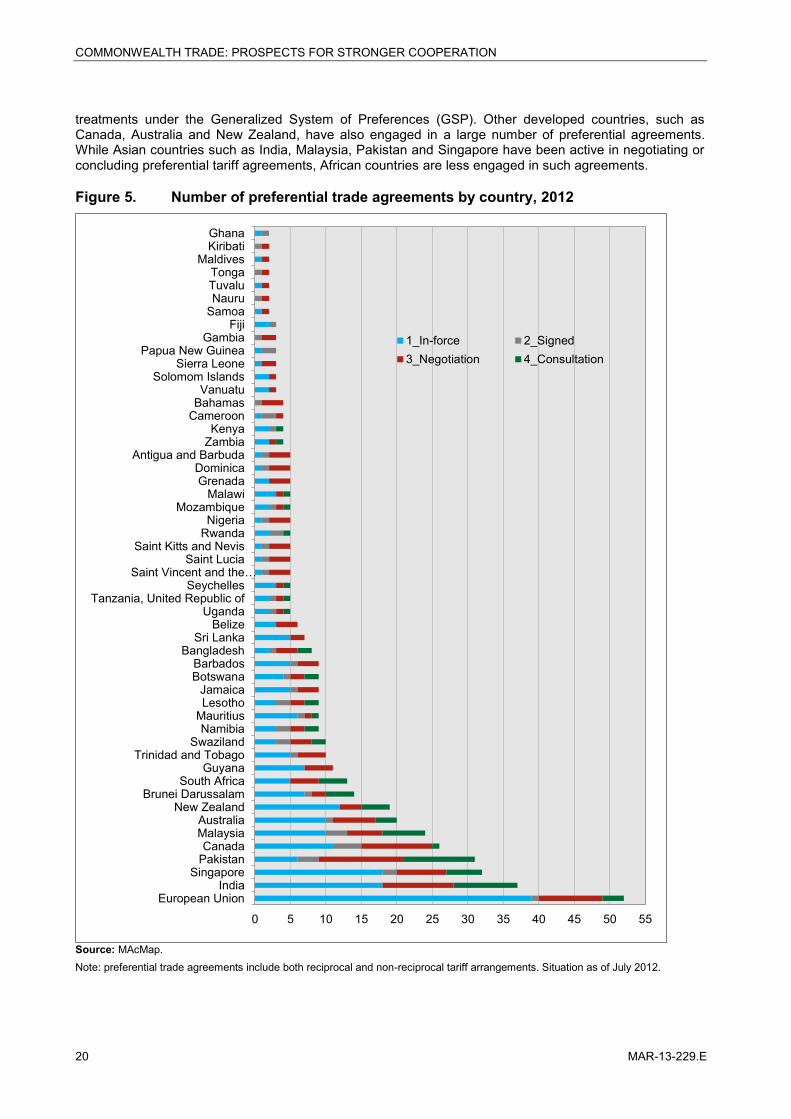
2. Preferential trade agreements Preferential tariff agreements become an increasingly prominent feature of the global trade system and this is not exceptional for the Commonwealth state members. As illustrated in figure 5 almost all member states have engaged in one or several preferential tariff agreements. Out of 487 preferential tariff agreements that were identified by the ITC as of July 2012, 276 agreements are already in force or have been signed. The most active Commonwealth countries are the EU members, namely Cyprus, Malta and the United Kingdom. The EU has 39 agreements in-force with its trading partners including non-reciprocal tariff 5 Johnson. 2011. Strengthening South-South Cooperation within the Commonwealth. 6 Further work is envisaged drawing from the ASEAN economic cooperation model.
COMMONWEALTH TRADE: PROSPECTS FOR STRONGER COOPERATION
20 MAR-13-229.E
treatments under the Generalized System of Preferences (GSP). Other developed countries, such as Canada, Australia and New Zealand, have also engaged in a large number of preferential agreements. While Asian countries such as India, Malaysia, Pakistan and Singapore have been active in negotiating or concluding preferential tariff agreements, African countries are less engaged in such agreements.
Figure 5. Number of preferential trade agreements by country, 2012
Source: MAcMap. Note: preferential trade agreements include both reciprocal and non-reciprocal tariff arrangements. Situation as of July 2012.
0 5 10 15 20 25 30 35 40 45 50 55
GhanaKiribati
MaldivesTongaTuvaluNauru
SamoaFiji
GambiaPapua New Guinea
Sierra LeoneSolomom Islands
VanuatuBahamas
CameroonKenya
ZambiaAntigua and Barbuda
DominicaGrenada
MalawiMozambique
NigeriaRwanda
Saint Kitts and NevisSaint Lucia
Saint Vincent and the…Seychelles
Tanzania, United Republic ofUganda
BelizeSri Lanka
BangladeshBarbadosBotswana
JamaicaLesotho
MauritiusNamibia
SwazilandTrinidad and Tobago
GuyanaSouth Africa
Brunei DarussalamNew Zealand
AustraliaMalaysiaCanada
PakistanSingapore
IndiaEuropean Union
1_In-force 2_Signed3_Negotiation 4_Consultation
COMMONWEALTH TRADE: PROSPECTS FOR STRONGER COOPERATION
MAR-13-229.E 21
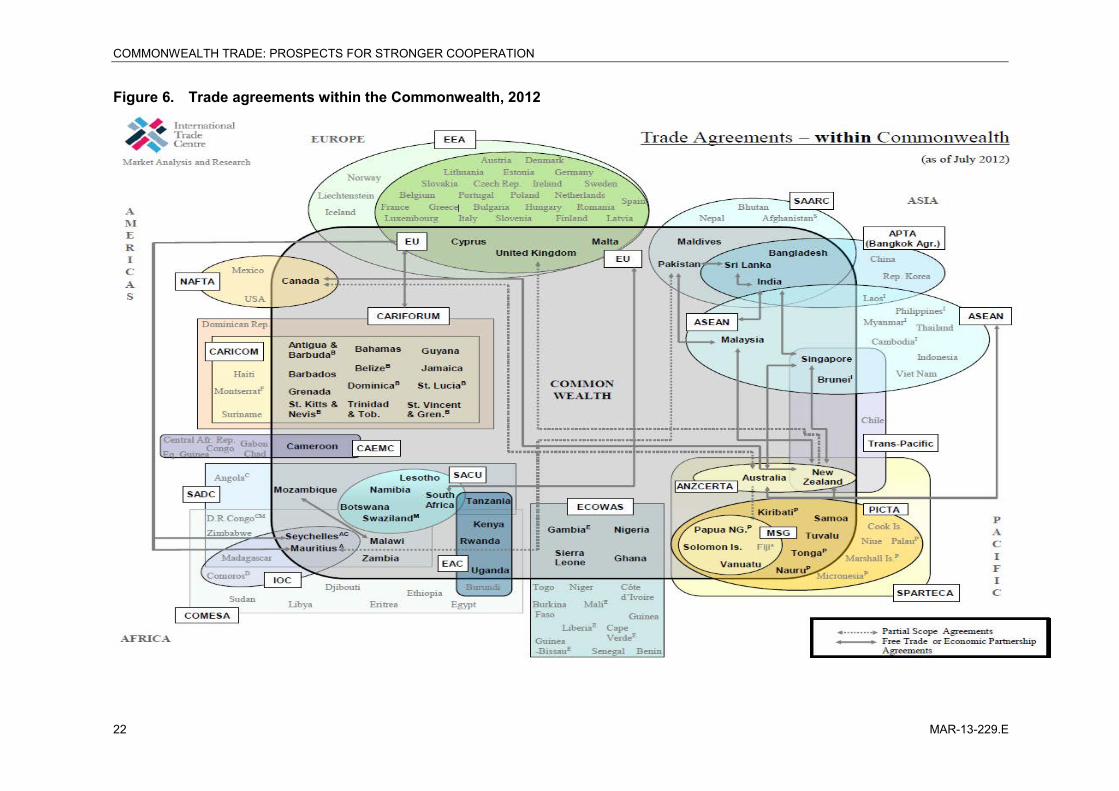
The diagram on trade agreements within the Commonwealth (figure 6) shows the inter-connectedness of the member states through their participation in FTAs and Regional Trade Agreements (RTAs). Commonwealth developed member states offer non-reciprocal tariff treatments such as the GSP to products from beneficiary developing countries. For instance, the EU member states offer duty-free and quota-free status to all products from LDCs. Canada also provides free access to all products from LDCs, with the exception of over-quota access for supply-managed products in the dairy, poultry and eggs sectors.
Despite the existence of quite a number of preferential trade agreements involving Commonwealth states, there are some member states, which have not engaged in many agreements of either form (i.e. non-reciprocal or reciprocal). For example, South Africa receives non-reciprocal preferential market access from Canada, and it has established an FTA with the EU. At the regional level, South Africa actively participates in RTAs with its neighbouring countries – namely with the Common Market for Eastern and Southern Africa (COMESA) and the Southern Africa and Development Community (SADC). Yet, South Africa does not have any kind of preferential trade agreement with Australia, New Zealand, nor with the Association of South East Asian Nations (ASEAN) or the South Asian Association for Regional Cooperation (SAARC). South Africa could consider expanding preferential trade agreements beyond its neighbouring countries. Given South Africa’s established logistics, supply capacity and economic size, South Africa could play a key role in facilitating trade within the Commonwealth.
Current trade talks, if successful, could also contribute to deepening trade integration within the Commonwealth. In particular, the EU, which comprises three Commonwealth countries, has been negotiating a trade agreement with Canada since October 2009. The EU is furthermore negotiating trade agreements with India, Malaysia and Singapore. At the same time, a Trans-Pacific Partnership, if concluded among current negotiating parties, would involve a number of Commonwealth members, such as Canada, Malaysia, New Zealand and Singapore.
Considering that Commonwealth countries are dispersed across the globe, the current strategy consisting in building partnerships with neighbours and strategic partners instead of seeking a specific trade liberalization within the Commonwealth is appropriate from a development perspective. However, there is still room for trade-related cooperation within the Commonwealth, as countries can share their experience in overcoming difficulties that they face when engaging in international trade.
COMMONWEALTH TRADE: PROSPECTS FOR STRONGER COOPERATION
22 MAR-13-229.E
Figure 6. Trade agreements within the Commonwealth, 2012
COMMONWEALTH TRADE: PROSPECTS FOR STRONGER COOPERATION
MAR-13-229.E 23
COMMONWEALTH TRADE: PROSPECTS FOR STRONGER COOPERATION
24 MAR-13-229.E
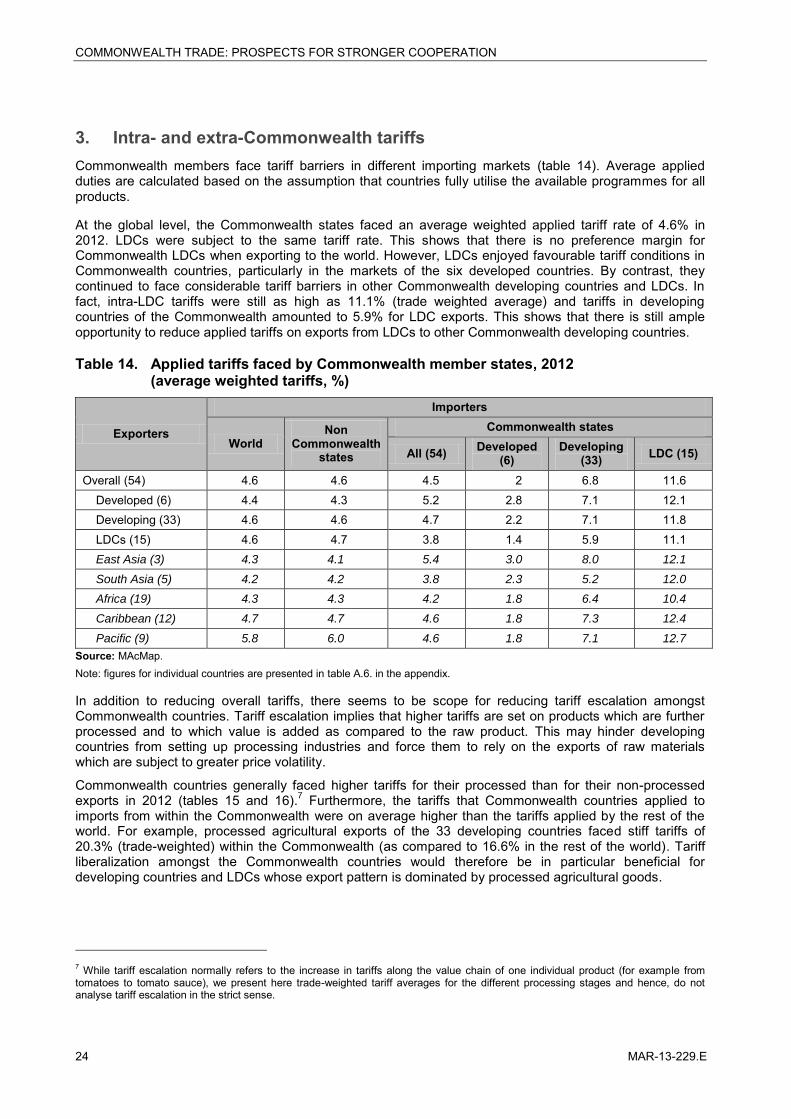
3. Intra- and extra-Commonwealth tariffs Commonwealth members face tariff barriers in different importing markets (table 14). Average applied duties are calculated based on the assumption that countries fully utilise the available programmes for all products.
At the global level, the Commonwealth states faced an average weighted applied tariff rate of 4.6% in 2012. LDCs were subject to the same tariff rate. This shows that there is no preference margin for Commonwealth LDCs when exporting to the world. However, LDCs enjoyed favourable tariff conditions in Commonwealth countries, particularly in the markets of the six developed countries. By contrast, they continued to face considerable tariff barriers in other Commonwealth developing countries and LDCs. In fact, intra-LDC tariffs were still as high as 11.1% (trade weighted average) and tariffs in developing countries of the Commonwealth amounted to 5.9% for LDC exports. This shows that there is still ample opportunity to reduce applied tariffs on exports from LDCs to other Commonwealth developing countries.
Table 14. Applied tariffs faced by Commonwealth member states, 2012 (average weighted tariffs, %)
Exporters
Importers
World Non
Commonwealth states
Commonwealth states
All (54) Developed (6)
Developing (33) LDC (15)
Overall (54) 4.6 4.6 4.5 2 6.8 11.6 Developed (6) 4.4 4.3 5.2 2.8 7.1 12.1 Developing (33) 4.6 4.6 4.7 2.2 7.1 11.8 LDCs (15) 4.6 4.7 3.8 1.4 5.9 11.1 East Asia (3) 4.3 4.1 5.4 3.0 8.0 12.1
South Asia (5) 4.2 4.2 3.8 2.3 5.2 12.0
Africa (19) 4.3 4.3 4.2 1.8 6.4 10.4
Caribbean (12) 4.7 4.7 4.6 1.8 7.3 12.4
Pacific (9) 5.8 6.0 4.6 1.8 7.1 12.7
Source: MAcMap. Note: figures for individual countries are presented in table A.6. in the appendix.
In addition to reducing overall tariffs, there seems to be scope for reducing tariff escalation amongst Commonwealth countries. Tariff escalation implies that higher tariffs are set on products which are further processed and to which value is added as compared to the raw product. This may hinder developing countries from setting up processing industries and force them to rely on the exports of raw materials which are subject to greater price volatility.
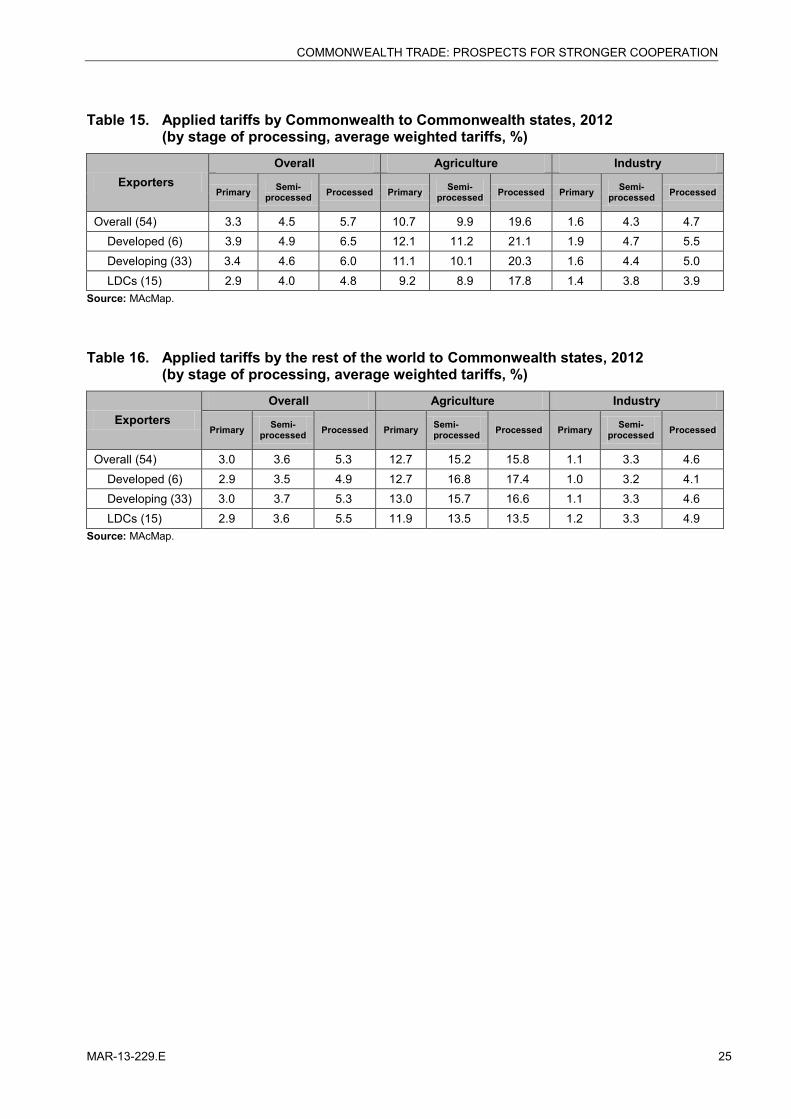
Commonwealth countries generally faced higher tariffs for their processed than for their non-processed exports in 2012 (tables 15 and 16).7 Furthermore, the tariffs that Commonwealth countries applied to imports from within the Commonwealth were on average higher than the tariffs applied by the rest of the world. For example, processed agricultural exports of the 33 developing countries faced stiff tariffs of 20.3% (trade-weighted) within the Commonwealth (as compared to 16.6% in the rest of the world). Tariff liberalization amongst the Commonwealth countries would therefore be in particular beneficial for developing countries and LDCs whose export pattern is dominated by processed agricultural goods.
7 While tariff escalation normally refers to the increase in tariffs along the value chain of one individual product (for example from tomatoes to tomato sauce), we present here trade-weighted tariff averages for the different processing stages and hence, do not analyse tariff escalation in the strict sense.
COMMONWEALTH TRADE: PROSPECTS FOR STRONGER COOPERATION
MAR-13-229.E 25
Table 15. Applied tariffs by Commonwealth to Commonwealth states, 2012 (by stage of processing, average weighted tariffs, %)
Exporters Overall Agriculture Industry
Primary Semi-processed Processed Primary Semi-
processed Processed Primary Semi-processed Processed
Overall (54) 3.3 4.5 5.7 10.7 9.9 19.6 1.6 4.3 4.7 Developed (6) 3.9 4.9 6.5 12.1 11.2 21.1 1.9 4.7 5.5 Developing (33) 3.4 4.6 6.0 11.1 10.1 20.3 1.6 4.4 5.0 LDCs (15) 2.9 4.0 4.8 9.2 8.9 17.8 1.4 3.8 3.9
Source: MAcMap.
Table 16. Applied tariffs by the rest of the world to Commonwealth states, 2012 (by stage of processing, average weighted tariffs, %)
Exporters Overall Agriculture Industry
Primary Semi-processed Processed Primary Semi-
processed Processed Primary Semi-processed Processed
Overall (54) 3.0 3.6 5.3 12.7 15.2 15.8 1.1 3.3 4.6 Developed (6) 2.9 3.5 4.9 12.7 16.8 17.4 1.0 3.2 4.1 Developing (33) 3.0 3.7 5.3 13.0 15.7 16.6 1.1 3.3 4.6 LDCs (15) 2.9 3.6 5.5 11.9 13.5 13.5 1.2 3.3 4.9
Source: MAcMap.
COMMONWEALTH TRADE: PROSPECTS FOR STRONGER COOPERATION
26 MAR-13-229.E
Conclusions
This paper has observed that considerable scope exists for intensifying and enhancing trade amongst Commonwealth countries. Commonwealth countries have experienced different performances in terms of exports these last years. While LDCs were the least affected country group of the 2008–2009 economic crisis, they have also benefited from the strongest recovery over recent years. However, their performance remains fragile because of their high dependence on few products, many of which are exported without any value addition.
Regarding the level of intra-Commonwealth trade, there was very little change between 2007 and 2011. The major recent trend is the greater attractiveness of developing countries in trade with all three subgroups. On the contrary, Commonwealth developed countries’ exports towards LDCs are still low and their overall importance as a destination for other Commonwealth countries’ exports is rather declining.
Prevailing tariffs suggest that there is still room for improving market access among Commonwealth states. Considering that Commonwealth countries are dispersed across the globe, the current strategy consisting in building partnerships with neighbours and strategic partners instead of seeking specific trade liberalization within the Commonwealth seems appropriate. However, there is still room for trade-related cooperation within the Commonwealth, as countries can share their experience in overcoming difficulties that they face when engaging in international trade.
One instrument could be an economic cooperation agreement that ensures technical and financial assistance in trade facilitation among Commonwealth countries. Measures should aim at improving transparency regarding the implementation of non-tariff measures. Some of the emerging economies amongst the Commonwealth countries, for example India, may contribute trade facilitation expertise to be utilized under the agreement. Selected developed Commonwealth countries could make available technical and financial resources.
COMMONWEALTH TRADE: PROSPECTS FOR STRONGER COOPERATION
MAR-13-229.E 27
Appendix Additional tables and figures
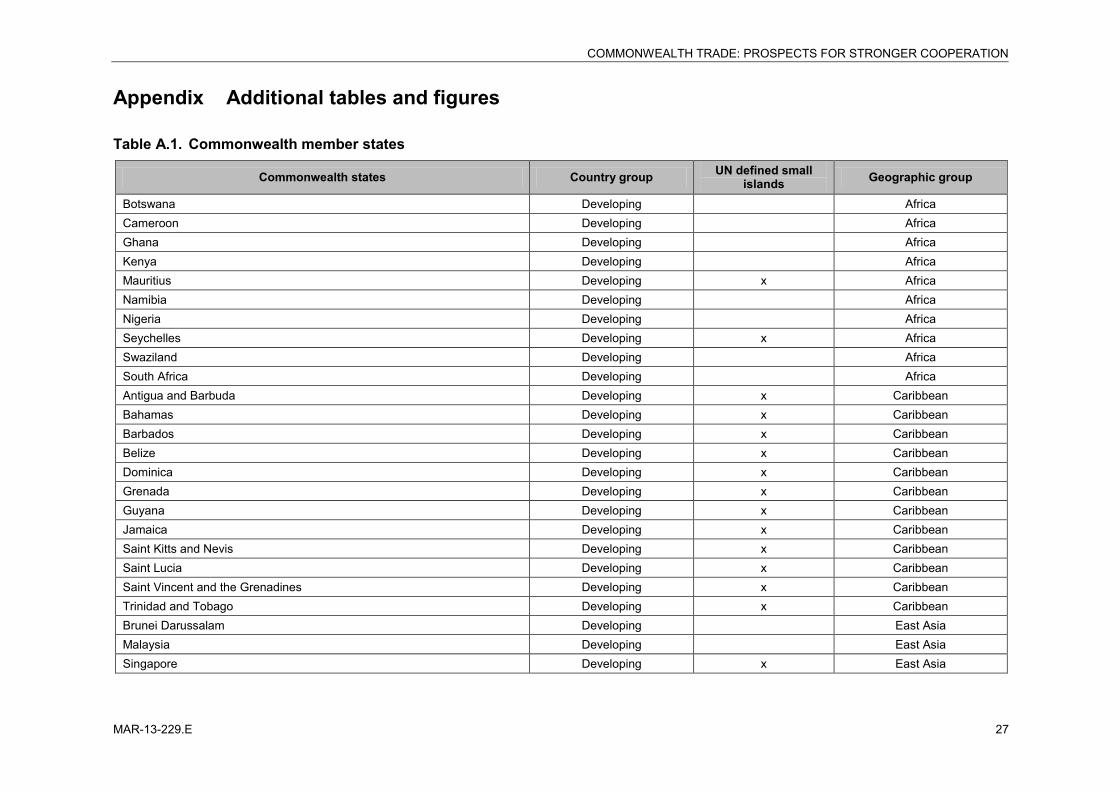
Table A.1. Commonwealth member states
Commonwealth states Country group UN defined small islands Geographic group
Botswana Developing Africa Cameroon Developing Africa Ghana Developing Africa Kenya Developing Africa Mauritius Developing x Africa Namibia Developing Africa Nigeria Developing Africa Seychelles Developing x Africa Swaziland Developing Africa South Africa Developing Africa Antigua and Barbuda Developing x Caribbean Bahamas Developing x Caribbean Barbados Developing x Caribbean Belize Developing x Caribbean Dominica Developing x Caribbean Grenada Developing x Caribbean Guyana Developing x Caribbean Jamaica Developing x Caribbean Saint Kitts and Nevis Developing x Caribbean Saint Lucia Developing x Caribbean Saint Vincent and the Grenadines Developing x Caribbean Trinidad and Tobago Developing x Caribbean Brunei Darussalam Developing East Asia Malaysia Developing East Asia Singapore Developing x East Asia
COMMONWEALTH TRADE: PROSPECTS FOR STRONGER COOPERATION
28 MAR-13-229.E
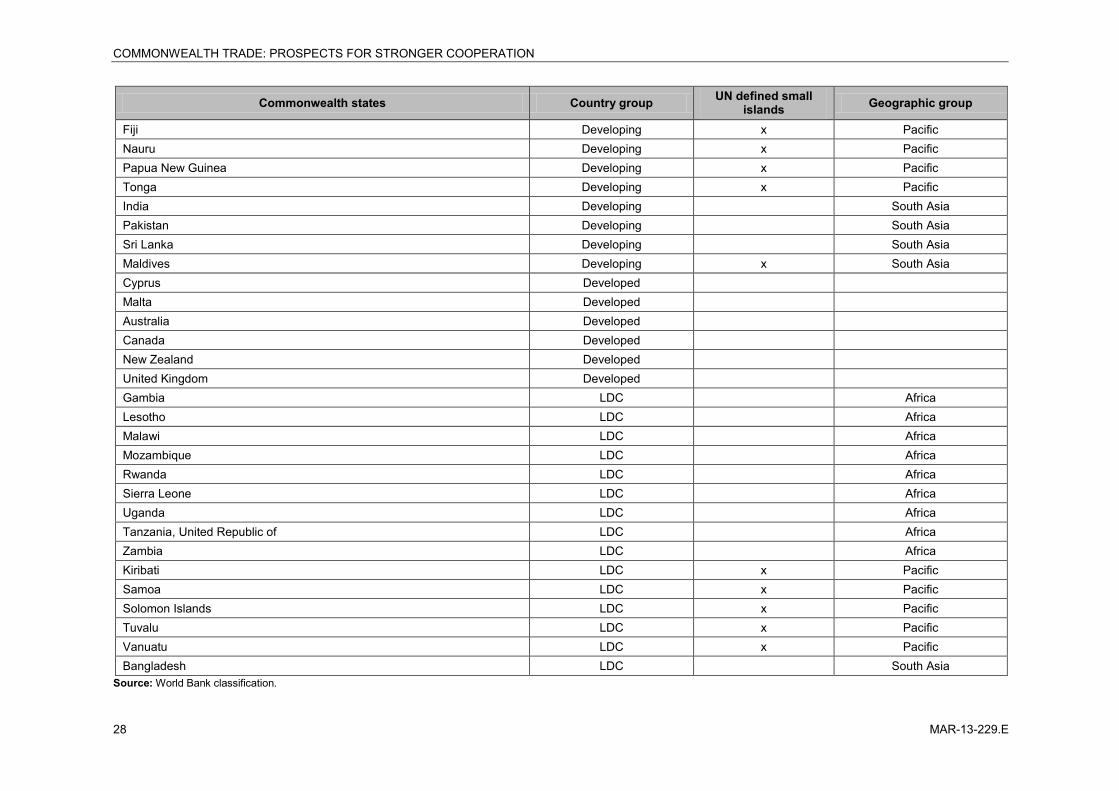
Commonwealth states Country group UN defined small islands Geographic group
Fiji Developing x Pacific Nauru Developing x Pacific Papua New Guinea Developing x Pacific Tonga Developing x Pacific India Developing South Asia Pakistan Developing South Asia Sri Lanka Developing South Asia Maldives Developing x South Asia Cyprus Developed Malta Developed Australia Developed Canada Developed New Zealand Developed United Kingdom Developed Gambia LDC Africa Lesotho LDC Africa Malawi LDC Africa Mozambique LDC Africa Rwanda LDC Africa Sierra Leone LDC Africa Uganda LDC Africa Tanzania, United Republic of LDC Africa Zambia LDC Africa Kiribati LDC x Pacific Samoa LDC x Pacific Solomon Islands LDC x Pacific Tuvalu LDC x Pacific Vanuatu LDC x Pacific Bangladesh LDC South Asia
Source: World Bank classification.
COMMONWEALTH TRADE: PROSPECTS FOR STRONGER COOPERATION
MAR-13-229.E 29
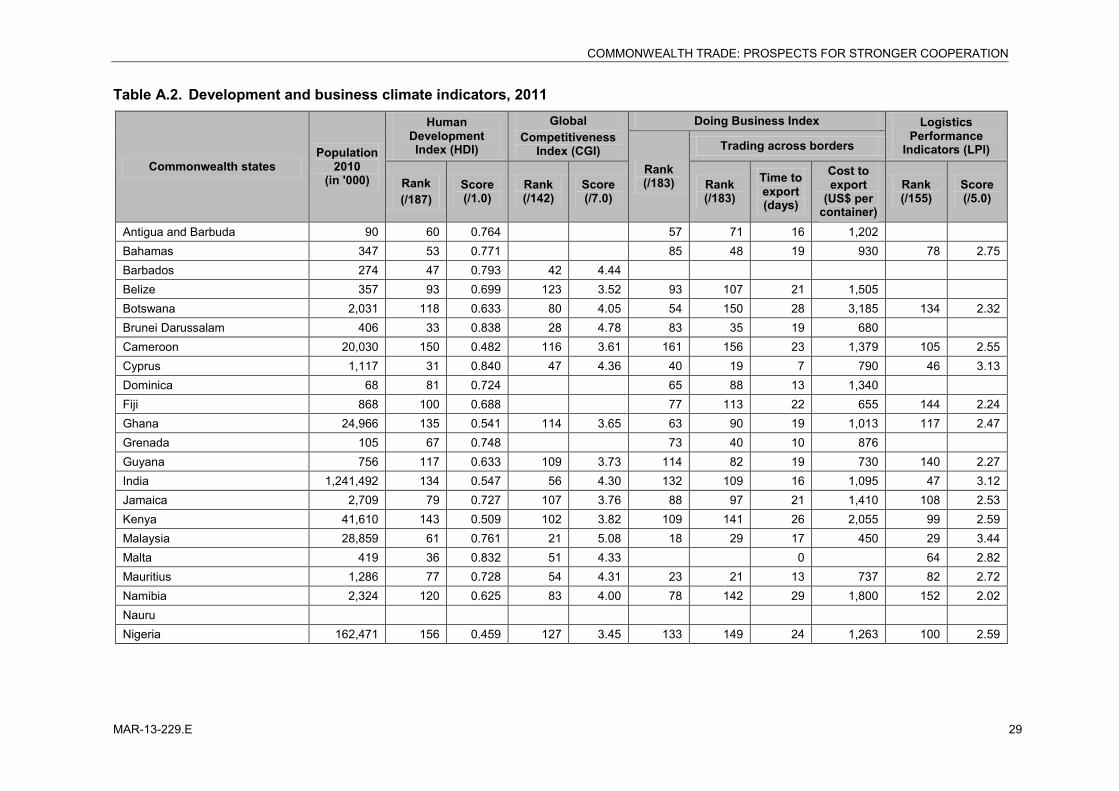
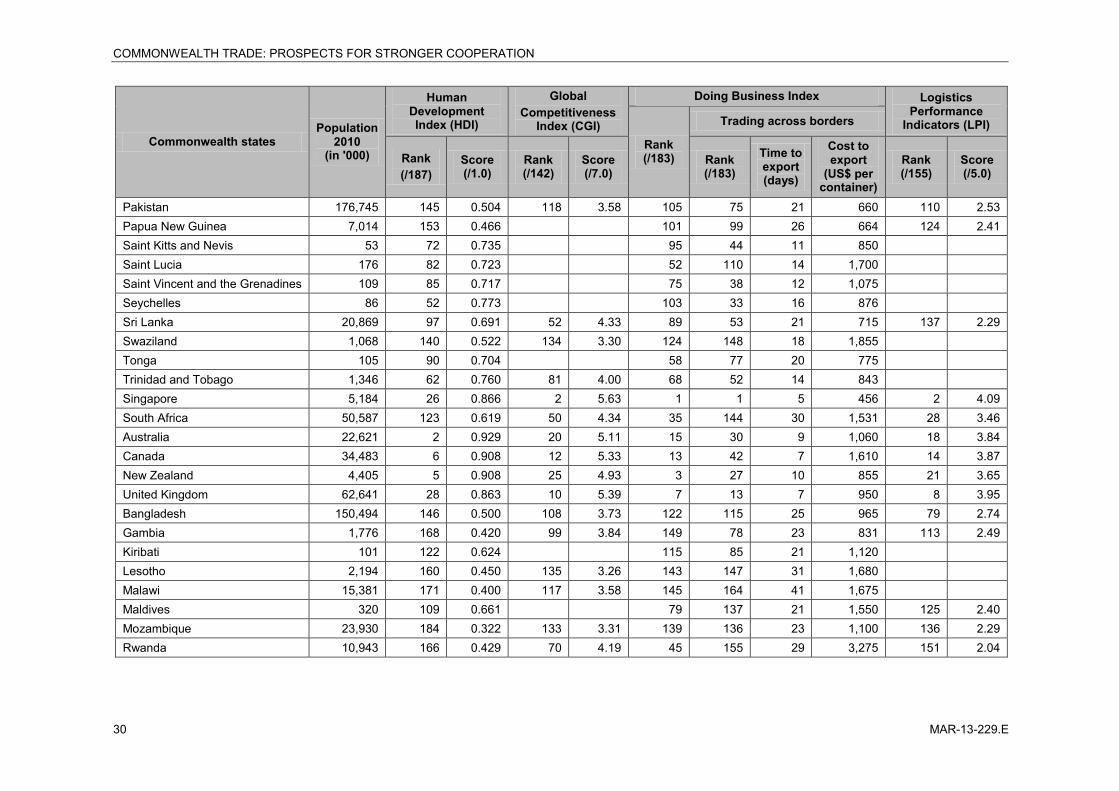
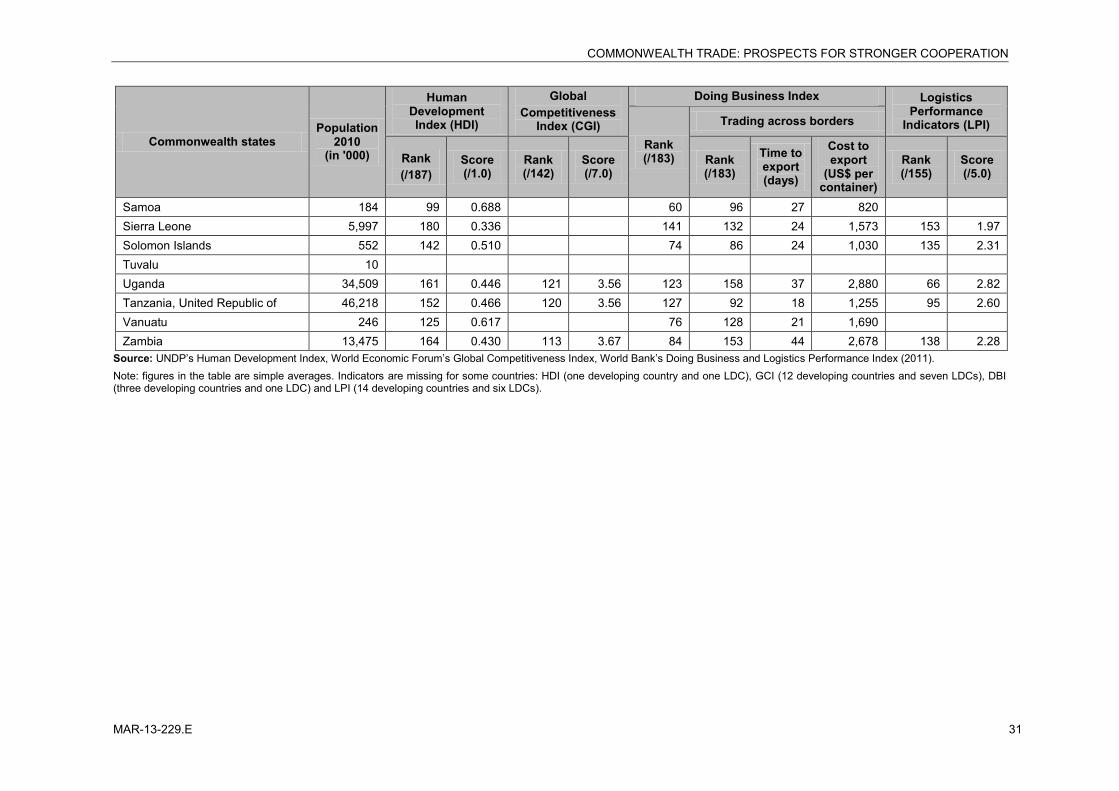
Table A.2. Development and business climate indicators, 2011
Commonwealth states Population
2010 (in '000)
Human Development Index (HDI)
Global Competitiveness
Index (CGI)
Doing Business Index Logistics Performance
Indicators (LPI) Rank (/183)
Trading across borders
Rank (/187)
Score (/1.0)
Rank (/142)
Score (/7.0)
Rank (/183)
Time to export (days)
Cost to export
(US$ per container)
Rank (/155)
Score (/5.0)
Antigua and Barbuda 90 60 0.764 57 71 16 1,202 Bahamas 347 53 0.771 85 48 19 930 78 2.75 Barbados 274 47 0.793 42 4.44 Belize 357 93 0.699 123 3.52 93 107 21 1,505 Botswana 2,031 118 0.633 80 4.05 54 150 28 3,185 134 2.32 Brunei Darussalam 406 33 0.838 28 4.78 83 35 19 680 Cameroon 20,030 150 0.482 116 3.61 161 156 23 1,379 105 2.55 Cyprus 1,117 31 0.840 47 4.36 40 19 7 790 46 3.13 Dominica 68 81 0.724 65 88 13 1,340 Fiji 868 100 0.688 77 113 22 655 144 2.24 Ghana 24,966 135 0.541 114 3.65 63 90 19 1,013 117 2.47 Grenada 105 67 0.748 73 40 10 876 Guyana 756 117 0.633 109 3.73 114 82 19 730 140 2.27 India 1,241,492 134 0.547 56 4.30 132 109 16 1,095 47 3.12 Jamaica 2,709 79 0.727 107 3.76 88 97 21 1,410 108 2.53 Kenya 41,610 143 0.509 102 3.82 109 141 26 2,055 99 2.59 Malaysia 28,859 61 0.761 21 5.08 18 29 17 450 29 3.44 Malta 419 36 0.832 51 4.33 0 64 2.82 Mauritius 1,286 77 0.728 54 4.31 23 21 13 737 82 2.72 Namibia 2,324 120 0.625 83 4.00 78 142 29 1,800 152 2.02 Nauru Nigeria 162,471 156 0.459 127 3.45 133 149 24 1,263 100 2.59
COMMONWEALTH TRADE: PROSPECTS FOR STRONGER COOPERATION
30 MAR-13-229.E
Commonwealth states Population
2010 (in '000)
Human Development Index (HDI)
Global Competitiveness
Index (CGI)
Doing Business Index Logistics Performance
Indicators (LPI) Rank (/183)
Trading across borders
Rank (/187)
Score (/1.0)
Rank (/142)
Score (/7.0)
Rank (/183)
Time to export (days)
Cost to export
(US$ per container)
Rank (/155)
Score (/5.0)
Pakistan 176,745 145 0.504 118 3.58 105 75 21 660 110 2.53 Papua New Guinea 7,014 153 0.466 101 99 26 664 124 2.41 Saint Kitts and Nevis 53 72 0.735 95 44 11 850 Saint Lucia 176 82 0.723 52 110 14 1,700 Saint Vincent and the Grenadines 109 85 0.717 75 38 12 1,075 Seychelles 86 52 0.773 103 33 16 876 Sri Lanka 20,869 97 0.691 52 4.33 89 53 21 715 137 2.29 Swaziland 1,068 140 0.522 134 3.30 124 148 18 1,855 Tonga 105 90 0.704 58 77 20 775 Trinidad and Tobago 1,346 62 0.760 81 4.00 68 52 14 843 Singapore 5,184 26 0.866 2 5.63 1 1 5 456 2 4.09 South Africa 50,587 123 0.619 50 4.34 35 144 30 1,531 28 3.46 Australia 22,621 2 0.929 20 5.11 15 30 9 1,060 18 3.84 Canada 34,483 6 0.908 12 5.33 13 42 7 1,610 14 3.87 New Zealand 4,405 5 0.908 25 4.93 3 27 10 855 21 3.65 United Kingdom 62,641 28 0.863 10 5.39 7 13 7 950 8 3.95 Bangladesh 150,494 146 0.500 108 3.73 122 115 25 965 79 2.74 Gambia 1,776 168 0.420 99 3.84 149 78 23 831 113 2.49 Kiribati 101 122 0.624 115 85 21 1,120 Lesotho 2,194 160 0.450 135 3.26 143 147 31 1,680 Malawi 15,381 171 0.400 117 3.58 145 164 41 1,675 Maldives 320 109 0.661 79 137 21 1,550 125 2.40 Mozambique 23,930 184 0.322 133 3.31 139 136 23 1,100 136 2.29 Rwanda 10,943 166 0.429 70 4.19 45 155 29 3,275 151 2.04
COMMONWEALTH TRADE: PROSPECTS FOR STRONGER COOPERATION
MAR-13-229.E 31
Commonwealth states Population
2010 (in '000)
Human Development Index (HDI)
Global Competitiveness
Index (CGI)
Doing Business Index Logistics Performance
Indicators (LPI) Rank (/183)
Trading across borders
Rank (/187)
Score (/1.0)
Rank (/142)
Score (/7.0)
Rank (/183)
Time to export (days)
Cost to export
(US$ per container)
Rank (/155)
Score (/5.0)
Samoa 184 99 0.688 60 96 27 820 Sierra Leone 5,997 180 0.336 141 132 24 1,573 153 1.97 Solomon Islands 552 142 0.510 74 86 24 1,030 135 2.31 Tuvalu 10 Uganda 34,509 161 0.446 121 3.56 123 158 37 2,880 66 2.82 Tanzania, United Republic of 46,218 152 0.466 120 3.56 127 92 18 1,255 95 2.60 Vanuatu 246 125 0.617 76 128 21 1,690 Zambia 13,475 164 0.430 113 3.67 84 153 44 2,678 138 2.28
Source: UNDP’s Human Development Index, World Economic Forum’s Global Competitiveness Index, World Bank’s Doing Business and Logistics Performance Index (2011). Note: figures in the table are simple averages. Indicators are missing for some countries: HDI (one developing country and one LDC), GCI (12 developing countries and seven LDCs), DBI (three developing countries and one LDC) and LPI (14 developing countries and six LDCs).
COMMONWEALTH TRADE: PROSPECTS FOR STRONGER COOPERATION
32 MAR-13-229.E
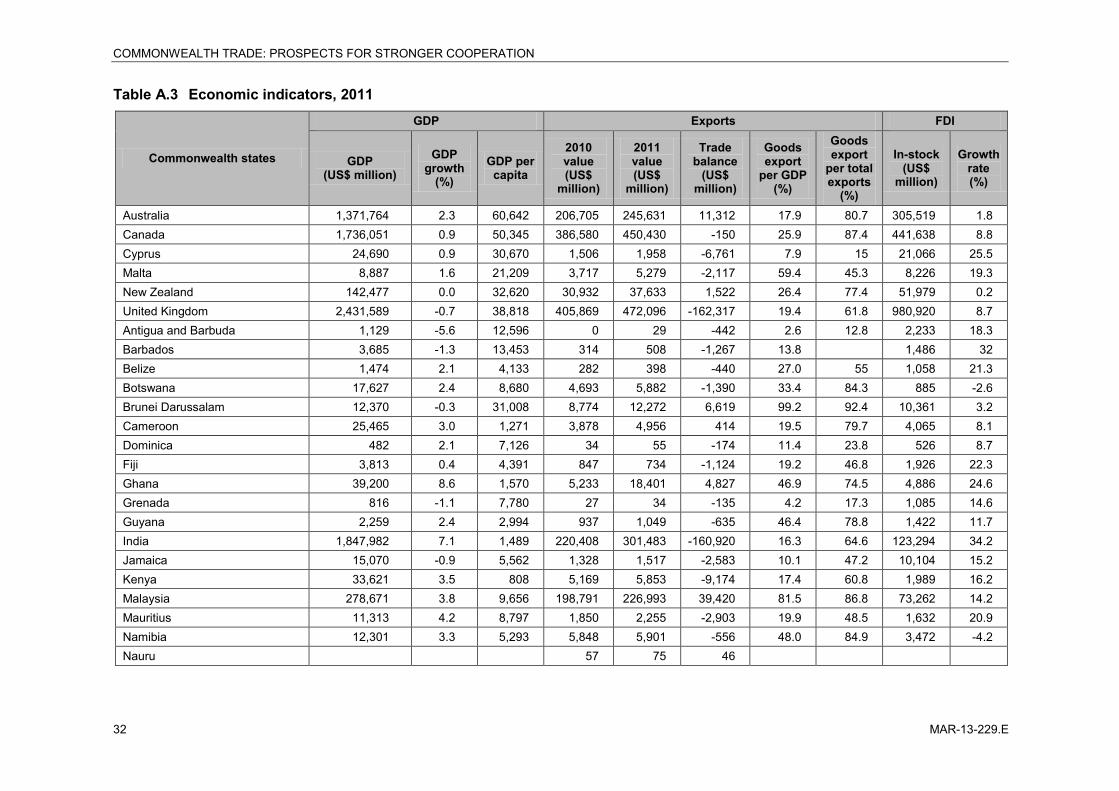
Table A.3 Economic indicators, 2011
Commonwealth states
GDP Exports FDI
GDP (US$ million)
GDP growth
(%) GDP per
capita
2010 value (US$
million)
2011 value (US$
million)
Trade balance
(US$ million)
Goods export
per GDP (%)
Goods export
per total exports
(%)
In-stock (US$
million)
Growth rate (%)
Australia 1,371,764 2.3 60,642 206,705 245,631 11,312 17.9 80.7 305,519 1.8 Canada 1,736,051 0.9 50,345 386,580 450,430 -150 25.9 87.4 441,638 8.8 Cyprus 24,690 0.9 30,670 1,506 1,958 -6,761 7.9 15 21,066 25.5 Malta 8,887 1.6 21,209 3,717 5,279 -2,117 59.4 45.3 8,226 19.3 New Zealand 142,477 0.0 32,620 30,932 37,633 1,522 26.4 77.4 51,979 0.2 United Kingdom 2,431,589 -0.7 38,818 405,869 472,096 -162,317 19.4 61.8 980,920 8.7 Antigua and Barbuda 1,129 -5.6 12,596 0 29 -442 2.6 12.8 2,233 18.3 Barbados 3,685 -1.3 13,453 314 508 -1,267 13.8 1,486 32 Belize 1,474 2.1 4,133 282 398 -440 27.0 55 1,058 21.3 Botswana 17,627 2.4 8,680 4,693 5,882 -1,390 33.4 84.3 885 -2.6 Brunei Darussalam 12,370 -0.3 31,008 8,774 12,272 6,619 99.2 92.4 10,361 3.2 Cameroon 25,465 3.0 1,271 3,878 4,956 414 19.5 79.7 4,065 8.1 Dominica 482 2.1 7,126 34 55 -174 11.4 23.8 526 8.7 Fiji 3,813 0.4 4,391 847 734 -1,124 19.2 46.8 1,926 22.3 Ghana 39,200 8.6 1,570 5,233 18,401 4,827 46.9 74.5 4,886 24.6 Grenada 816 -1.1 7,780 27 34 -135 4.2 17.3 1,085 14.6 Guyana 2,259 2.4 2,994 937 1,049 -635 46.4 78.8 1,422 11.7 India 1,847,982 7.1 1,489 220,408 301,483 -160,920 16.3 64.6 123,294 34.2 Jamaica 15,070 -0.9 5,562 1,328 1,517 -2,583 10.1 47.2 10,104 15.2 Kenya 33,621 3.5 808 5,169 5,853 -9,174 17.4 60.8 1,989 16.2 Malaysia 278,671 3.8 9,656 198,791 226,993 39,420 81.5 86.8 73,262 14.2 Mauritius 11,313 4.2 8,797 1,850 2,255 -2,903 19.9 48.5 1,632 20.9 Namibia 12,301 3.3 5,293 5,848 5,901 -556 48.0 84.9 3,472 -4.2 Nauru 57 75 46
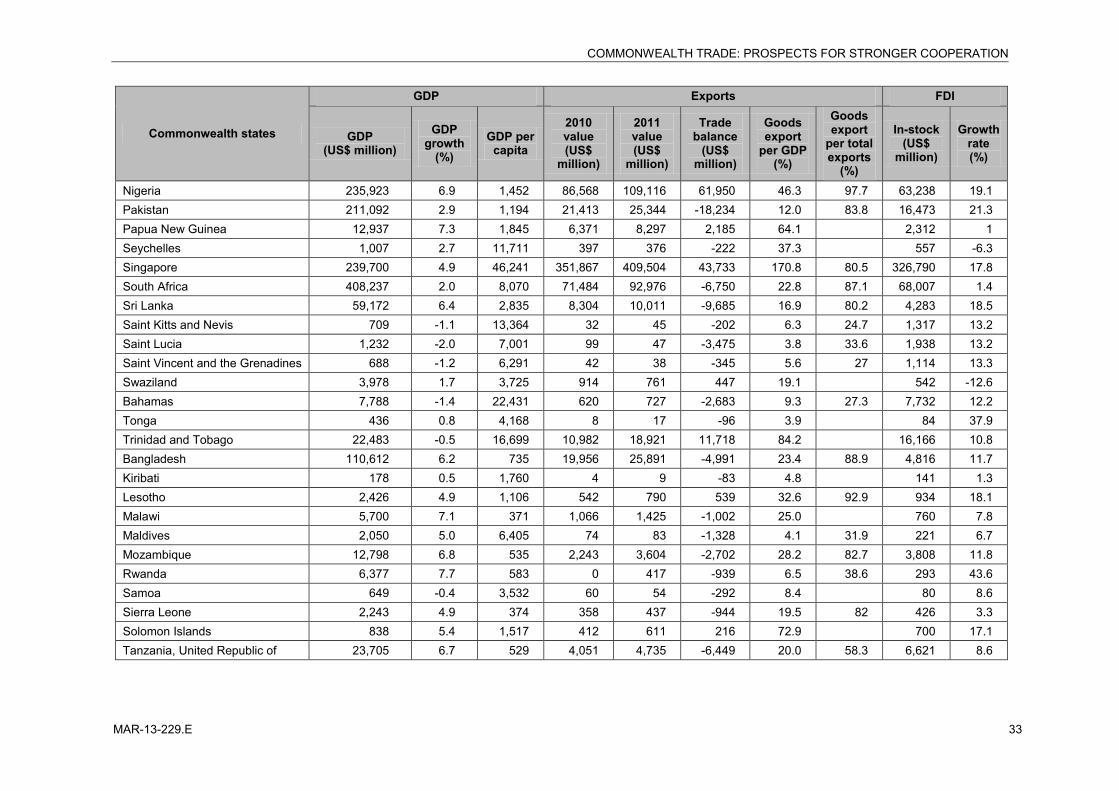
COMMONWEALTH TRADE: PROSPECTS FOR STRONGER COOPERATION
MAR-13-229.E 33
Commonwealth states
GDP Exports FDI
GDP (US$ million)
GDP growth
(%) GDP per
capita
2010 value (US$
million)
2011 value (US$
million)
Trade balance
(US$ million)
Goods export
per GDP (%)
Goods export
per total exports
(%)
In-stock (US$
million)
Growth rate (%)
Nigeria 235,923 6.9 1,452 86,568 109,116 61,950 46.3 97.7 63,238 19.1 Pakistan 211,092 2.9 1,194 21,413 25,344 -18,234 12.0 83.8 16,473 21.3 Papua New Guinea 12,937 7.3 1,845 6,371 8,297 2,185 64.1 2,312 1 Seychelles 1,007 2.7 11,711 397 376 -222 37.3 557 -6.3 Singapore 239,700 4.9 46,241 351,867 409,504 43,733 170.8 80.5 326,790 17.8 South Africa 408,237 2.0 8,070 71,484 92,976 -6,750 22.8 87.1 68,007 1.4 Sri Lanka 59,172 6.4 2,835 8,304 10,011 -9,685 16.9 80.2 4,283 18.5 Saint Kitts and Nevis 709 -1.1 13,364 32 45 -202 6.3 24.7 1,317 13.2 Saint Lucia 1,232 -2.0 7,001 99 47 -3,475 3.8 33.6 1,938 13.2 Saint Vincent and the Grenadines 688 -1.2 6,291 42 38 -345 5.6 27 1,114 13.3 Swaziland 3,978 1.7 3,725 914 761 447 19.1 542 -12.6 Bahamas 7,788 -1.4 22,431 620 727 -2,683 9.3 27.3 7,732 12.2 Tonga 436 0.8 4,168 8 17 -96 3.9 84 37.9 Trinidad and Tobago 22,483 -0.5 16,699 10,982 18,921 11,718 84.2 16,166 10.8 Bangladesh 110,612 6.2 735 19,956 25,891 -4,991 23.4 88.9 4,816 11.7 Kiribati 178 0.5 1,760 4 9 -83 4.8 141 1.3 Lesotho 2,426 4.9 1,106 542 790 539 32.6 92.9 934 18.1 Malawi 5,700 7.1 371 1,066 1,425 -1,002 25.0 760 7.8 Maldives 2,050 5.0 6,405 74 83 -1,328 4.1 31.9 221 6.7 Mozambique 12,798 6.8 535 2,243 3,604 -2,702 28.2 82.7 3,808 11.8 Rwanda 6,377 7.7 583 0 417 -939 6.5 38.6 293 43.6 Samoa 649 -0.4 3,532 60 54 -292 8.4 80 8.6 Sierra Leone 2,243 4.9 374 358 437 -944 19.5 82 426 3.3 Solomon Islands 838 5.4 1,517 412 611 216 72.9 700 17.1 Tanzania, United Republic of 23,705 6.7 529 4,051 4,735 -6,449 20.0 58.3 6,621 8.6
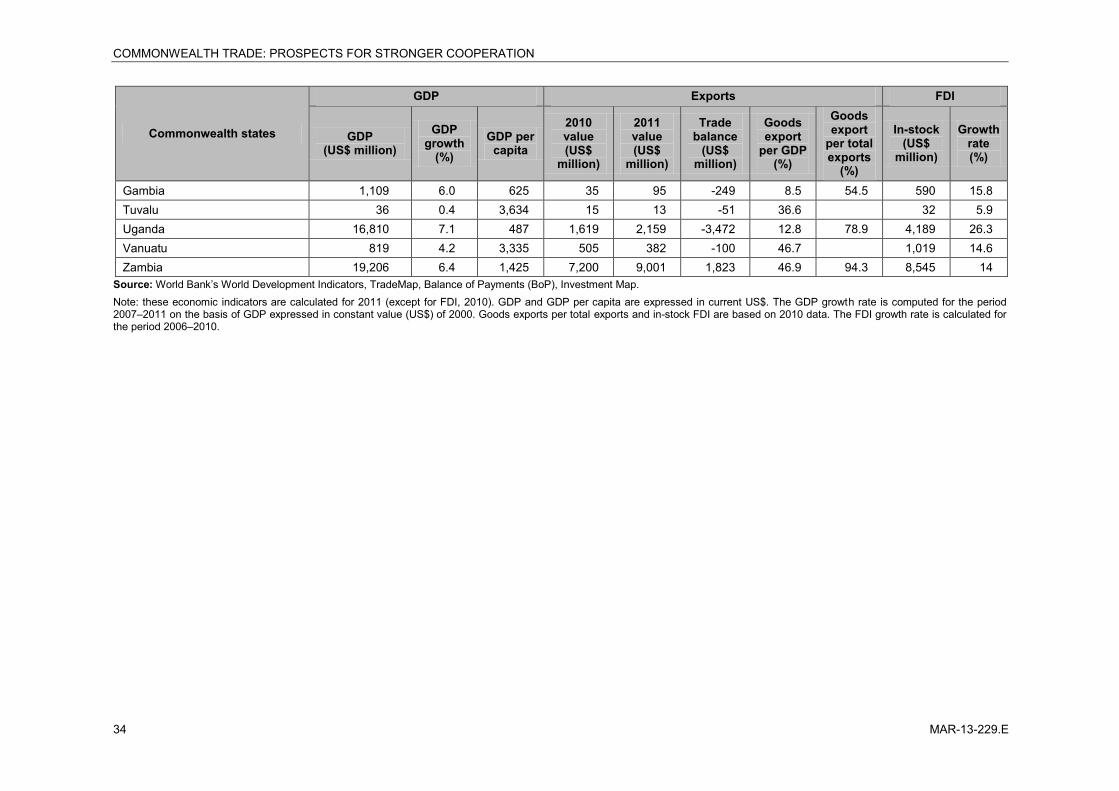
COMMONWEALTH TRADE: PROSPECTS FOR STRONGER COOPERATION
34 MAR-13-229.E
Commonwealth states
GDP Exports FDI
GDP (US$ million)
GDP growth
(%) GDP per
capita
2010 value (US$
million)
2011 value (US$
million)
Trade balance
(US$ million)
Goods export
per GDP (%)
Goods export
per total exports
(%)
In-stock (US$
million)
Growth rate (%)
Gambia 1,109 6.0 625 35 95 -249 8.5 54.5 590 15.8 Tuvalu 36 0.4 3,634 15 13 -51 36.6 32 5.9 Uganda 16,810 7.1 487 1,619 2,159 -3,472 12.8 78.9 4,189 26.3 Vanuatu 819 4.2 3,335 505 382 -100 46.7 1,019 14.6 Zambia 19,206 6.4 1,425 7,200 9,001 1,823 46.9 94.3 8,545 14
Source: World Bank’s World Development Indicators, TradeMap, Balance of Payments (BoP), Investment Map. Note: these economic indicators are calculated for 2011 (except for FDI, 2010). GDP and GDP per capita are expressed in current US$. The GDP growth rate is computed for the period 2007–2011 on the basis of GDP expressed in constant value (US$) of 2000. Goods exports per total exports and in-stock FDI are based on 2010 data. The FDI growth rate is calculated for the period 2006–2010.
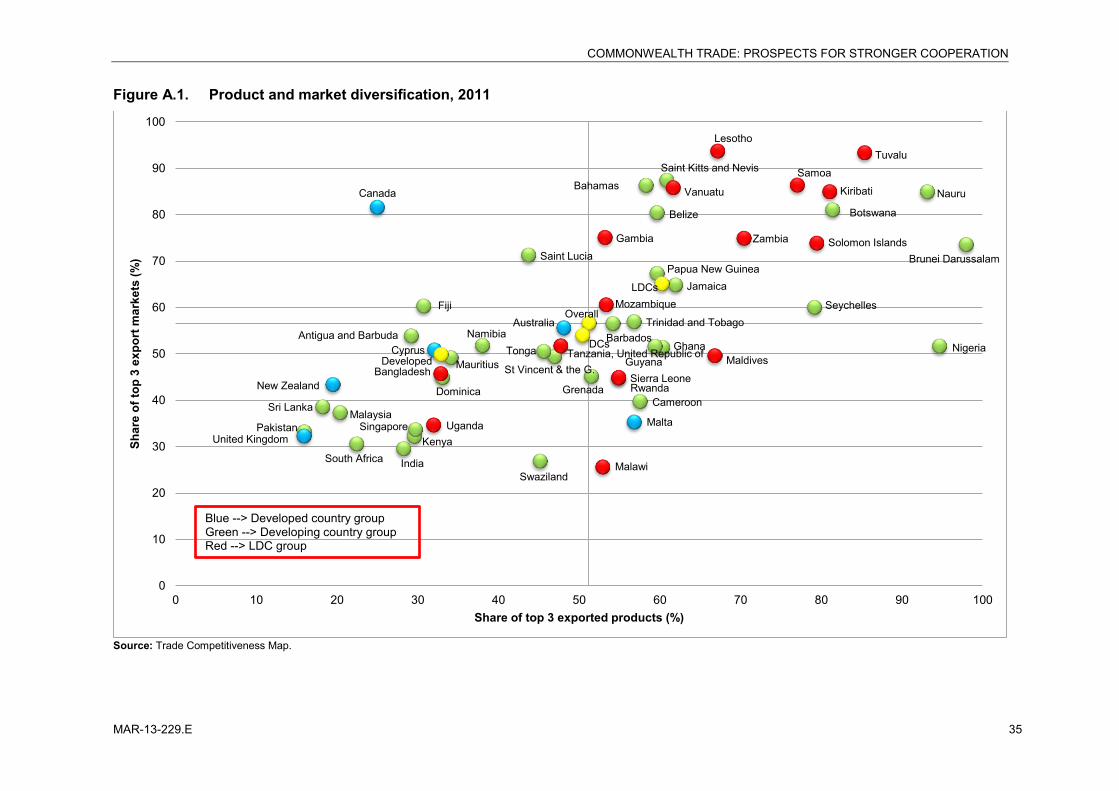
COMMONWEALTH TRADE: PROSPECTS FOR STRONGER COOPERATION
MAR-13-229.E 35
Figure A.1. Product and market diversification, 2011
Source: Trade Competitiveness Map.
LDCs
DCs
Belize Botswana
Brunei Darussalam
Cameroon
Cyprus
Dominica
Fiji
Ghana
Grenada
Guyana
India
Jamaica
Kenya
Malaysia Malta
Mauritius
Namibia
Nauru
Nigeria
Pakistan
Papua New Guinea
Saint Kitts and Nevis
Saint Lucia
St Vincent & the G.
Seychelles
Sri Lanka
Swaziland
Tonga
Trinidad and Tobago Australia
Canada
New Zealand
Singapore
South Africa
United Kingdom
Bangladesh
Gambia
Kiribati
Lesotho
Malawi
Maldives
Mozambique
Rwanda
Samoa
Sierra Leone
Solomon Islands
Tuvalu
Uganda
Tanzania, United Republic of
Vanuatu
Zambia
Overall
Developed
0
10
20
30
40
50
60
70
80
90
100
0 10 20 30 40 50 60 70 80 90 100
Shar
e of
top
3 ex
port
mar
kets
(%)
Share of top 3 exported products (%)
Blue --> Developed country group Green --> Developing country group Red --> LDC group
Antigua and Barbuda
Bahamas
Barbados
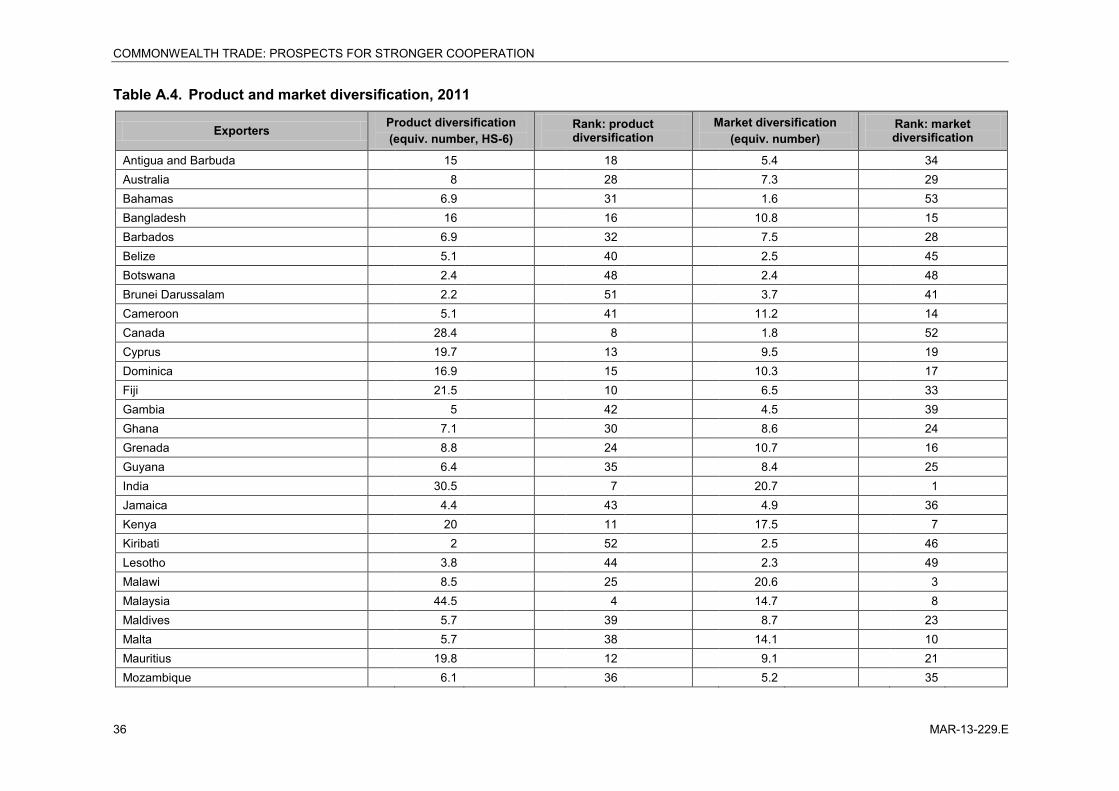
COMMONWEALTH TRADE: PROSPECTS FOR STRONGER COOPERATION
36 MAR-13-229.E
Table A.4. Product and market diversification, 2011
Exporters Product diversification (equiv. number, HS-6)
Rank: product diversification
Market diversification (equiv. number)
Rank: market diversification
Antigua and Barbuda 15 18 5.4 34 Australia 8 28 7.3 29 Bahamas 6.9 31 1.6 53 Bangladesh 16 16 10.8 15 Barbados 6.9 32 7.5 28 Belize 5.1 40 2.5 45 Botswana 2.4 48 2.4 48 Brunei Darussalam 2.2 51 3.7 41 Cameroon 5.1 41 11.2 14 Canada 28.4 8 1.8 52 Cyprus 19.7 13 9.5 19 Dominica 16.9 15 10.3 17 Fiji 21.5 10 6.5 33 Gambia 5 42 4.5 39 Ghana 7.1 30 8.6 24 Grenada 8.8 24 10.7 16 Guyana 6.4 35 8.4 25 India 30.5 7 20.7 1 Jamaica 4.4 43 4.9 36 Kenya 20 11 17.5 7 Kiribati 2 52 2.5 46 Lesotho 3.8 44 2.3 49 Malawi 8.5 25 20.6 3 Malaysia 44.5 4 14.7 8 Maldives 5.7 39 8.7 23 Malta 5.7 38 14.1 10 Mauritius 19.8 12 9.1 21 Mozambique 6.1 36 5.2 35
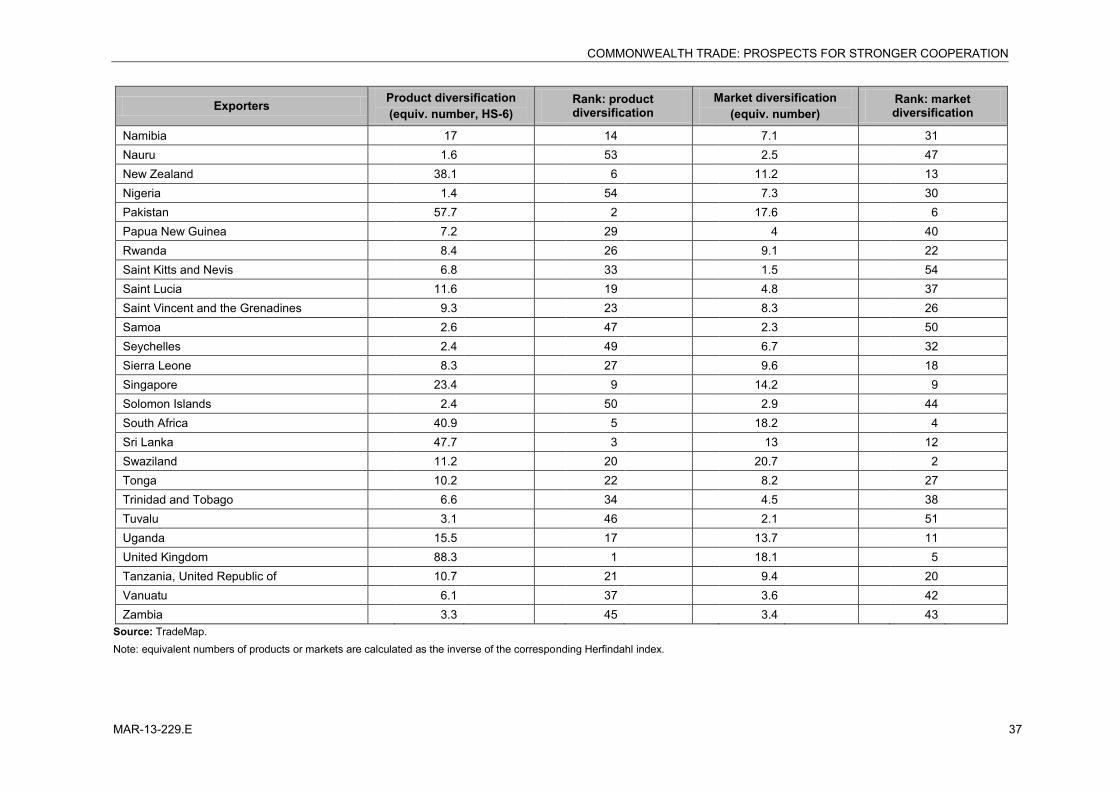
COMMONWEALTH TRADE: PROSPECTS FOR STRONGER COOPERATION
MAR-13-229.E 37
Exporters Product diversification (equiv. number, HS-6)
Rank: product diversification
Market diversification (equiv. number)
Rank: market diversification
Namibia 17 14 7.1 31 Nauru 1.6 53 2.5 47 New Zealand 38.1 6 11.2 13 Nigeria 1.4 54 7.3 30 Pakistan 57.7 2 17.6 6 Papua New Guinea 7.2 29 4 40 Rwanda 8.4 26 9.1 22 Saint Kitts and Nevis 6.8 33 1.5 54 Saint Lucia 11.6 19 4.8 37 Saint Vincent and the Grenadines 9.3 23 8.3 26 Samoa 2.6 47 2.3 50 Seychelles 2.4 49 6.7 32 Sierra Leone 8.3 27 9.6 18 Singapore 23.4 9 14.2 9 Solomon Islands 2.4 50 2.9 44 South Africa 40.9 5 18.2 4 Sri Lanka 47.7 3 13 12 Swaziland 11.2 20 20.7 2 Tonga 10.2 22 8.2 27 Trinidad and Tobago 6.6 34 4.5 38 Tuvalu 3.1 46 2.1 51 Uganda 15.5 17 13.7 11 United Kingdom 88.3 1 18.1 5 Tanzania, United Republic of 10.7 21 9.4 20 Vanuatu 6.1 37 3.6 42 Zambia 3.3 45 3.4 43
Source: TradeMap. Note: equivalent numbers of products or markets are calculated as the inverse of the corresponding Herfindahl index.
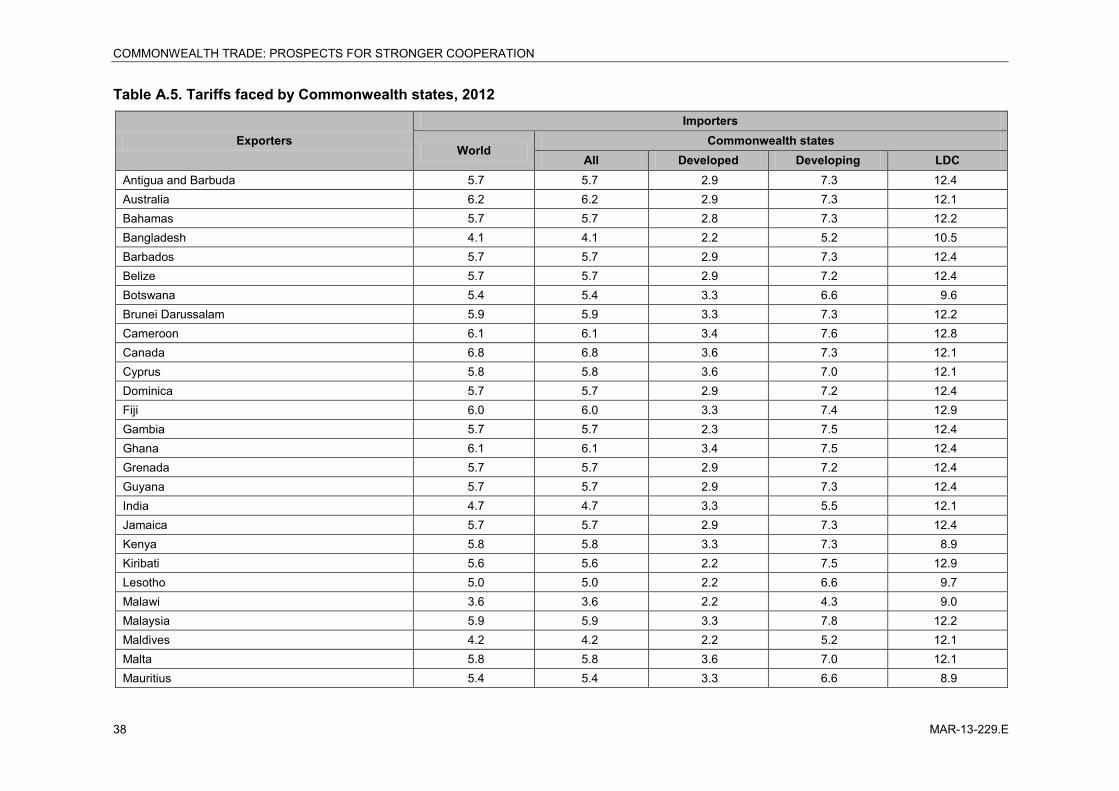
COMMONWEALTH TRADE: PROSPECTS FOR STRONGER COOPERATION
38 MAR-13-229.E
Table A.5. Tariffs faced by Commonwealth states, 2012
Exporters Importers
World Commonwealth states
All Developed Developing LDC Antigua and Barbuda 5.7 5.7 2.9 7.3 12.4 Australia 6.2 6.2 2.9 7.3 12.1 Bahamas 5.7 5.7 2.8 7.3 12.2 Bangladesh 4.1 4.1 2.2 5.2 10.5 Barbados 5.7 5.7 2.9 7.3 12.4 Belize 5.7 5.7 2.9 7.2 12.4 Botswana 5.4 5.4 3.3 6.6 9.6 Brunei Darussalam 5.9 5.9 3.3 7.3 12.2 Cameroon 6.1 6.1 3.4 7.6 12.8 Canada 6.8 6.8 3.6 7.3 12.1 Cyprus 5.8 5.8 3.6 7.0 12.1 Dominica 5.7 5.7 2.9 7.2 12.4 Fiji 6.0 6.0 3.3 7.4 12.9 Gambia 5.7 5.7 2.3 7.5 12.4 Ghana 6.1 6.1 3.4 7.5 12.4 Grenada 5.7 5.7 2.9 7.2 12.4 Guyana 5.7 5.7 2.9 7.3 12.4 India 4.7 4.7 3.3 5.5 12.1 Jamaica 5.7 5.7 2.9 7.3 12.4 Kenya 5.8 5.8 3.3 7.3 8.9 Kiribati 5.6 5.6 2.2 7.5 12.9 Lesotho 5.0 5.0 2.2 6.6 9.7 Malawi 3.6 3.6 2.2 4.3 9.0 Malaysia 5.9 5.9 3.3 7.8 12.2 Maldives 4.2 4.2 2.2 5.2 12.1 Malta 5.8 5.8 3.6 7.0 12.1 Mauritius 5.4 5.4 3.3 6.6 8.9
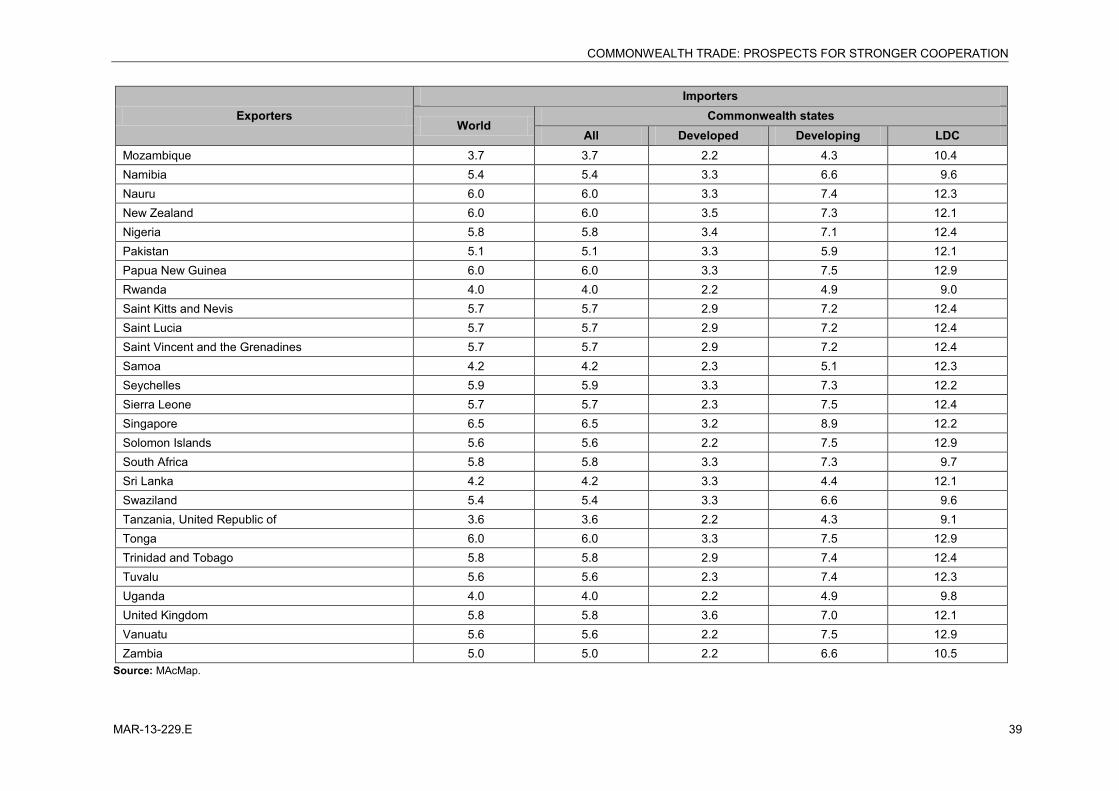
COMMONWEALTH TRADE: PROSPECTS FOR STRONGER COOPERATION
MAR-13-229.E 39
Exporters Importers
World Commonwealth states
All Developed Developing LDC Mozambique 3.7 3.7 2.2 4.3 10.4 Namibia 5.4 5.4 3.3 6.6 9.6 Nauru 6.0 6.0 3.3 7.4 12.3 New Zealand 6.0 6.0 3.5 7.3 12.1 Nigeria 5.8 5.8 3.4 7.1 12.4 Pakistan 5.1 5.1 3.3 5.9 12.1 Papua New Guinea 6.0 6.0 3.3 7.5 12.9 Rwanda 4.0 4.0 2.2 4.9 9.0 Saint Kitts and Nevis 5.7 5.7 2.9 7.2 12.4 Saint Lucia 5.7 5.7 2.9 7.2 12.4 Saint Vincent and the Grenadines 5.7 5.7 2.9 7.2 12.4 Samoa 4.2 4.2 2.3 5.1 12.3 Seychelles 5.9 5.9 3.3 7.3 12.2 Sierra Leone 5.7 5.7 2.3 7.5 12.4 Singapore 6.5 6.5 3.2 8.9 12.2 Solomon Islands 5.6 5.6 2.2 7.5 12.9 South Africa 5.8 5.8 3.3 7.3 9.7 Sri Lanka 4.2 4.2 3.3 4.4 12.1 Swaziland 5.4 5.4 3.3 6.6 9.6 Tanzania, United Republic of 3.6 3.6 2.2 4.3 9.1 Tonga 6.0 6.0 3.3 7.5 12.9 Trinidad and Tobago 5.8 5.8 2.9 7.4 12.4 Tuvalu 5.6 5.6 2.3 7.4 12.3 Uganda 4.0 4.0 2.2 4.9 9.8 United Kingdom 5.8 5.8 3.6 7.0 12.1 Vanuatu 5.6 5.6 2.2 7.5 12.9 Zambia 5.0 5.0 2.2 6.6 10.5
Source: MAcMap.

P: +41 22 730 0111F: +41 22 733 4439E: [email protected]
Postal addressInternational Trade CentrePalais des Nations1211 Geneva 10, Switzerland
Street addressInternational Trade Centre54-56 Rue de Montbrillant1202 Geneva, Switzerland
P: +41 22 730 0111F: +41 22 733 4439E: [email protected]
Postal addressInternational Trade CentrePalais des Nations1211 Geneva 10, Switzerland
Street addressInternational Trade Centre54-56 Rue de Montbrillant1202 Geneva, Switzerland
P: +41 22 730 0111F: +41 22 733 4439E: [email protected]
Postal addressInternational Trade CentrePalais des Nations1211 Geneva 10, Switzerland
Street addressInternational Trade Centre54-56 Rue de Montbrillant1202 Geneva, Switzerland
The International Trade Centre (ITC) is the joint agency of the World Trade Organization and the United Nations.
technical paper
cOMMOnWealth traDe
prOSpectS FOr StrOnGer cOOperatiOn